Cognitive Similarity-Based Collaborative Filtering Recommendation System


1
Department of Computer Engineering, Chung-Ang University, 84 Heukseok, Seoul 156-756, Korea
2
Big Data Research Group, Western Norway Research Institute, Box 163, NO-6851 Sogndal, Norway
*
Author to whom correspondence should be addressed.
Appl. Sci. 2020, 10(12), 4183; https://doi.org/10.3390/app10124183
Submission received: 20 May 2020
/
Revised: 16 June 2020
/
Accepted: 16 June 2020
/
Published: 18 June 2020
(This article belongs to the Special Issue Recommender Systems and Collaborative Filtering)
Abstract
:This paper provides a new approach that improves collaborative filtering results in recommendation systems. In particular, we aim to ensure the reliability of the data set collected which is to collect the cognition about the item similarity from the users. Hence, in this work, we collect the cognitive similarity of the user about similar movies. Besides, we introduce a three-layered architecture that consists of the network between the items (item layer), the network between the cognitive similarity of users (cognition layer) and the network between users occurring in their cognitive similarity (user layer). For instance, the similarity in the cognitive network can be extracted from a similarity measure on the item network. In order to evaluate our method, we conducted experiments in the movie domain. In addition, for better performance evaluation, we use the F-measure that is a combination of two criteria and . Compared with the Pearson Correlation, our method more accurate and achieves improvement over the baseline 11.1% in the best case. The result shows that our method achieved consistent improvement of 1.8% to 3.2% for various neighborhood sizes in MAE calculation, and from 2.0% to 4.1% in RMSE calculation. This indicates that our method improves recommendation performance.
1. Introduction
The information overload problem on the Internet is popular today so that the recommendation system is powerful methods to handle these problems. The recommendation system covers a wide range of recommendation targets such as travels, movies, restaurants, fashion, news, and so on [1,2]. Clearly, one of the highly effective technologies applied to the recommendation system is Collaborative Filtering (CF) [3,4,5,6]. Basically, the operation of the CF system is described as a following. First, CF collects user feedback, and such responses reside within a certain domain and allow users to rate items within that domain. Second, CF exploits the similarities between ranking behaviors of users. Finally, it is possible to determine how to recommend an item. CF accumulates user-item ratings, identifies users with common ratings to items and offers recommendations based on the inter-user comparison. In other words, recommendations for a specific user are based on the behavior and evaluation of other users. The motivation for CF comes from the idea that people often get the best recommendations from someones (i.e., neighbors) who have similar preferences. The main problem of collaborative filtering is how to incorporate and weigh the preference of neighbors.
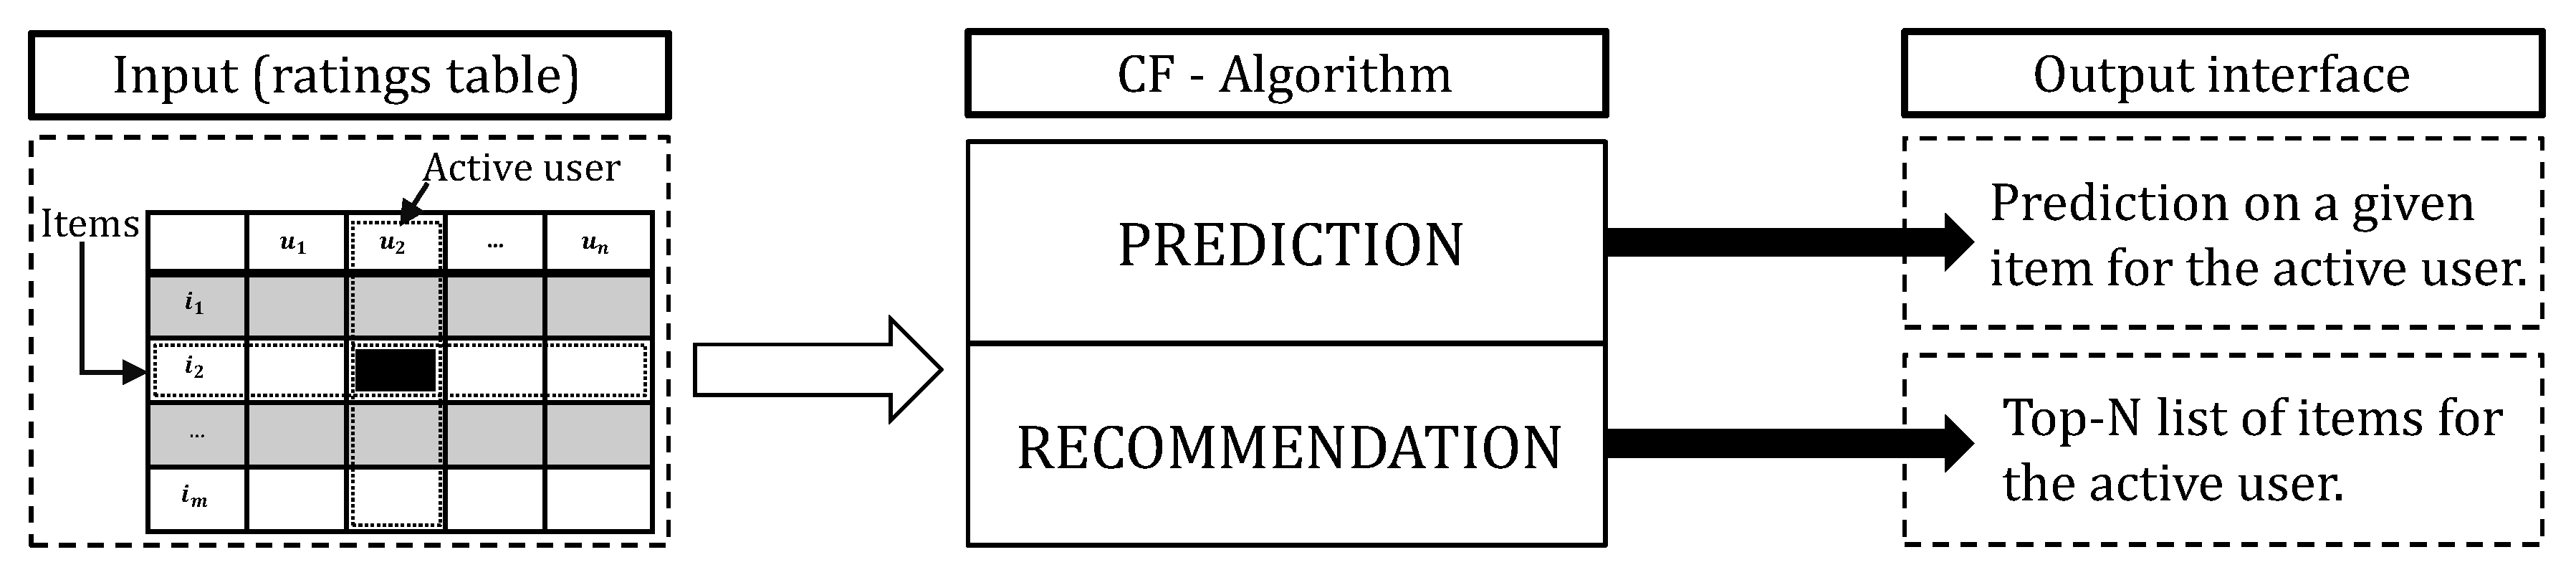
The purpose of collaborative filtering algorithms is to suggest new items or predict the utility of a given item for a particular user based on the feedback from the user and the other users who like and leave ratings for the item. Let’s assume that, there is a list of n users and a list of m items . Each user has a list of item , in which the user has created their feedback. The feedback can be given by the user as a rating score, usually a certain numerical scale, or can be implicitly derived from historical records, by analyzing timing logs, mining web hyperlinks and so on [6,7]. Because, and it is possible for to be a -. Therefore, there exists a distinguished user called the active user for whom the task of a collaborative filtering algorithm is to find an item similarity that can be in the two forms, prediction and recommendation. Figure 1 shows the schematic diagram of the collaborative filtering process. In addition, CF algorithms represent the entire matrix user-item data with each entry in the matrix represents the preference score (ratings) of the user on the item . Each rating get a numerical scale and when the user has not rated yet, it will be 0.
Generally, collaborative filtering algorithms can be divided into two main categories: memory-based and model-based algorithms [8]. Memory-based Collaborative Filtering algorithm uses all or a sample of the user-item database to do the predictions. Each user is part of a group with similar preferences. The prediction about preferences for the items for users can be created by identifying the neighbors of a new user (or active user). On the other hand, Model-based Collaborative Filtering algorithms allow the system to learn the given model so that the algorithms recognize complex patterns based on training data. Then, based on learned models, the system makes the intelligent predictions for collaborative filtering tasks for the test or real-world data.
Besides the outstanding advantages as mentioned, the user-based collaborative filtering still has a lot of successes. However, their widespread use has revealed challenges, such as:
- Scalability: With large systems, such as Netflix (https://www.netflix.com) and Amazon (https://www.amazon.com/), the number of users and items increases a lot every day. The traditional CF algorithm will face serious scalability issues, with computational resources exceeding actual or acceptable levels. For example, if we have millions of users and millions of distinct items, the complexity of the CF algorithm is already too large. Besides, the system needs to respond immediately to online requests and make recommendations to all users regardless of their purchase and rating history, thus requiring high scalability.
- Sparsity: In fact, many commercial recommendation systems are used to evaluate very large sets of products. Therefore, the user-item matrix used for collaborative filtering will be very sparse, and the performance or predictions of CF systems are challenged. In several situations, specifically, the cold start problem occurs when having a new user/item in the system. It may not find the similar user/item because there is not enough information (it is also called the new user problem or new item problem [9,10] ). Besides, neighbor transitivity is another problem with sparse databases. The users with similar preferences may not be identified if they have not rated any of the same items. So, it will reduce the effectiveness of a recommendation system based on comparing users in pairs to make predictions.
This paper has three primary research contributions: (i) propose a cognitive similarity approach and collect the real cognitive similarity data based on a crowdsourcing system (called OurMovieSimilarity) [11]. (ii) formulation of a pre-computed model (the three-layered architecture) of cognitive similarity to extract the cognitive similarity from users. (iii) proposed the cognitive similarity-based collaborative filtering recommendation system. In particular, we create a crowdsourcing system [11,12,13,14] to collect the cognitive data from the user. Then, we propose the three-layered architecture [15] to extract the cognitive information from the user. Our architecture is bottom-up and structure made of three superposed networks that are strongly linked:
- User network relating users on the basis of explicit from the cognitive network.
- Cognition network relating cognitive similarity between users based on selecting items similarity.
- Item network relating items based on the basis comparing features extracted from them.
The remainder of this paper is organized as follows. In the next section, we present some of the research related to user-based collaborative filtering. In Section 3, we present a definition of cognitive similarity and propose the three-layered architecture to extract the cognitive similarity. We present the recommendation system based on cognitive similarity in Section 4. The details of our experiment, data set, evaluation, and result will be provided in Section 5. In the final section, we provide concluding remarks and directions for future works.
2. Related Work
GroupLens [3,6] has implemented the MovieLens (https://movielens.org) [16] as one of the large systems that allow new users to sign up and rate their favorite movies. GroupLens researchers have also released a data set that they collected over the years with more than 25 million movie ratings. They provide a pseudonymous collaborative filtering solution for movies based on their data set in order to improve and solve the disadvantages of collaborative filtering, especially to improve user-based collaborative filtering in a recommender system. Other technologies have also been applied such as Bayesian networks and clustering. A Bayesian Network (BN) [17,18,19] is a compact representation of a multivariate statistical distribution function. BN encodes the probability density function governing a set of random variables by specifying a set of conditional independence statements together with a set of conditional probability functions. In particular, a BN consists of a qualitative part, a directed acyclic graph where the nodes mirror the random variables and a quantitative part, the set of conditional probability functions. In general, BN creates a model based on a - with a decision tree at each node and edges representing user information. The model can be built off-line over a matter of hours a day. The resulting model is very small, fast, and essentially as accurate as the nearest neighbor method.
Recently, a lot of improvements for user-based CF have been proposed to mitigate the effects of the data sparseness [20,21]. For example, a singular vector decomposition was used to condense the original user-item matrix [22] for dimensional reduction, and latent semantic models [23] was used to cluster the users and items. However, these approaches have a disadvantage that the decomposition must be renewed every time another user or rating is added to the matrix. Another, more recent contribution is based on an analysis of prediction errors to improve the accuracy of user-based CF. This approach has the limitation that the cost for the calculation of errors [24] of all ratings during training is quite an expensive. Alternative approaches, using recursive prediction strategies, have been proposed to exploit not only the neighbors but also the neighbors of the neighbors [25]. Because the similarity calculation of neighbors of all neighbors is required, such strategies incur high computational costs and grow exponentially with the depth of the recursion. Besides, these strategies must be enrich the information of the user-item matrix to improve the performance of user-based CF [8,26].
In addition, in [27,28], the two item-based similarity measures have been designed to overcome the cold-start problem by incorporating genre data of items. They use popular datasets such as MovieLens and MovieTweets in their experiments. According to their approach, an item be uniform to other items because they have more than one common genre. Therefore, by considering the association of common genres, they exploit one of the similarity measures that is determining the degree of direct asymmetric correlation between items.
The proposed method in this paper was inspired by [29] that proposes the Rated-Item Pools (called RIP-based) approach to improve user-based CF. This approach aims to eliminate extra calculations that increase computational complexity and thereby avoid the need to add external knowledge resources resulting in potential cost. In order to formulate the approach, the author used a related method [3] that applied Equation (1) to predicting the rating value for an active user u and item i
where represents a subset of the neighbors v of the active user u who explicitly rated item i. In addition, the user similarity is normalized by the sum among all similarities computed between both the active user and the neighbors from . The classic user-based CF approach calculates as a global similarity. To calculate , either the cosine similarity metric (also referred to as vector spatial similarity) or, more frequently, the Pearson correlation coefficient are generally used. The Pearson correlation coefficient is defined as following:
where represents the user u rating on the item i; represents the intersection of the item rated by the users u and v; represents the average rating of user u on all the co-rated items. In Equation (2), similarity is not only used to contribute to Equation (1), but also to find the neighbors () of the active user u. Normally, we have two methods that can select the nearest neighbors. However, the more popular is to choose the K users most similar to the active user [3]. In this method, we estimated a similarity threshold, and then alternately, all chosen users have distances to the active user which not exceeded a similarity threshold [4]. We decided this classical method which described above as User-based Pearson Correlation Similarity (UBPS) and adopts it as the baseline for the comparative analysis presented in this paper.
3. Cognitive Similarity
Our work explores the cognitive similarity between users, then we can define the most similar user for the active user. For example, consider the relation between users such as , , and . Typically, the process of a CF system first detects the preference of based on his rating items. In the second step, the system comparing the ’s ratings against and to find the most "similar" tastes. The final step is to recommend items that similar users have rated highly but not yet been rated by Jason. However, how do we combine and weigh the preferences of user neighbors to define the -N recommendations for ? We recognized the behavior of users when using a service is crucial to making accurate predictions [30]. Our work aims to understand the cognitive similarity of the user. Therefore, according to our approach, we can define the most similar user of is so that the suitable recommendations to almost depend on and a little from . As shown in Table 1, with the traditional CF method the user has the same relation with and , while our proposed method showed that and have the stronger relation than and . In the remainder of this part, we describe the details of our approach to extract the cognitive similarity between users
Suppose n is the number of items and k is the number of features extracted from each item. Therefore, each item will be represented as a vector . When users u selects a pair of items similar, the cognitive similarity of user u will be represented as , where is a cosine similarity between features of each items . The cognitive similarity between users will be enriched by each of their selection. Generally, we have a definition of cognitive similarity as a following:
Definition 1.
The cognitive similarity () between user u and v is their priority of these F features extracted from each item i in the selecting process a pair of an item similar and can be formulated as:
where is the similarity of features F which extracted from the pair of items i and j in the selection of user u and user v. Otherwise, represents the similarity of the priority between user u and user v in order to select pairs of item similarity.
3.1. Measuring Cognitive Similarity
The most important step in memory-based collaborative filtering algorithms is calculating the similarity between items or users. The basic idea of calculating the similarity between two items and is to first isolate the user who evaluated both of these items and then apply the same calculation technique to determine the similarity . In this study, we using soft cosine similarity is the metric for measure the similarity. The cosine similarity is defined to equal the cosine of the angle between two non-zero vectors of an inner product space. Given the vector I and vector J, the cosine similarity is represented as follows:
where and are components of vector I and vector J respectively. For example, given movie which users have seen and all movies remained in the database, we measure similarity by using Vector Cosine-Based Similarity. Movie m represented as a vector , in which and P represent the feature of title; genre; director; actors; plot. In this regard, the formula for scoring described as follows:
where , and represent the features which measure similarity between movie and movie such as titles, genres, directors, actors and plots. In particular, consider the title feature, by apply Equation (4), the similarity between the title of movie and movie describe as follows:
Respectively, we measured the remainder similarity between features such as genre (), director (), actors (), and plot (). Finally, we repeat that calculation for all the remaining movies in the system and obtain a set . Besides, we add an element that is the priority of users while they select a similar movie. Hence, the Equation (5) is re-written as follows.
where denote the priority of user in selecting a pair of movies similar; k denote the number of features extracted from movie m respectively is the title, genre, director, actor, and plot; is a similarity measuring between movie and movie as described in Equation (5). The priority of users in selecting a pair of movies similarity dynamic re-calculated and updated by the OMS system when users have a new activity (a new pair of movies similarity). Based on the history of the users (their activities), we collected all the pair of movies similarity so that we can represent the user by using the feature extracted from the all of the pair of movies similarity which user recognized. By using Equation (3), we formulate an equation that measure the cognitive similarity between user and or . It’s described as follows:
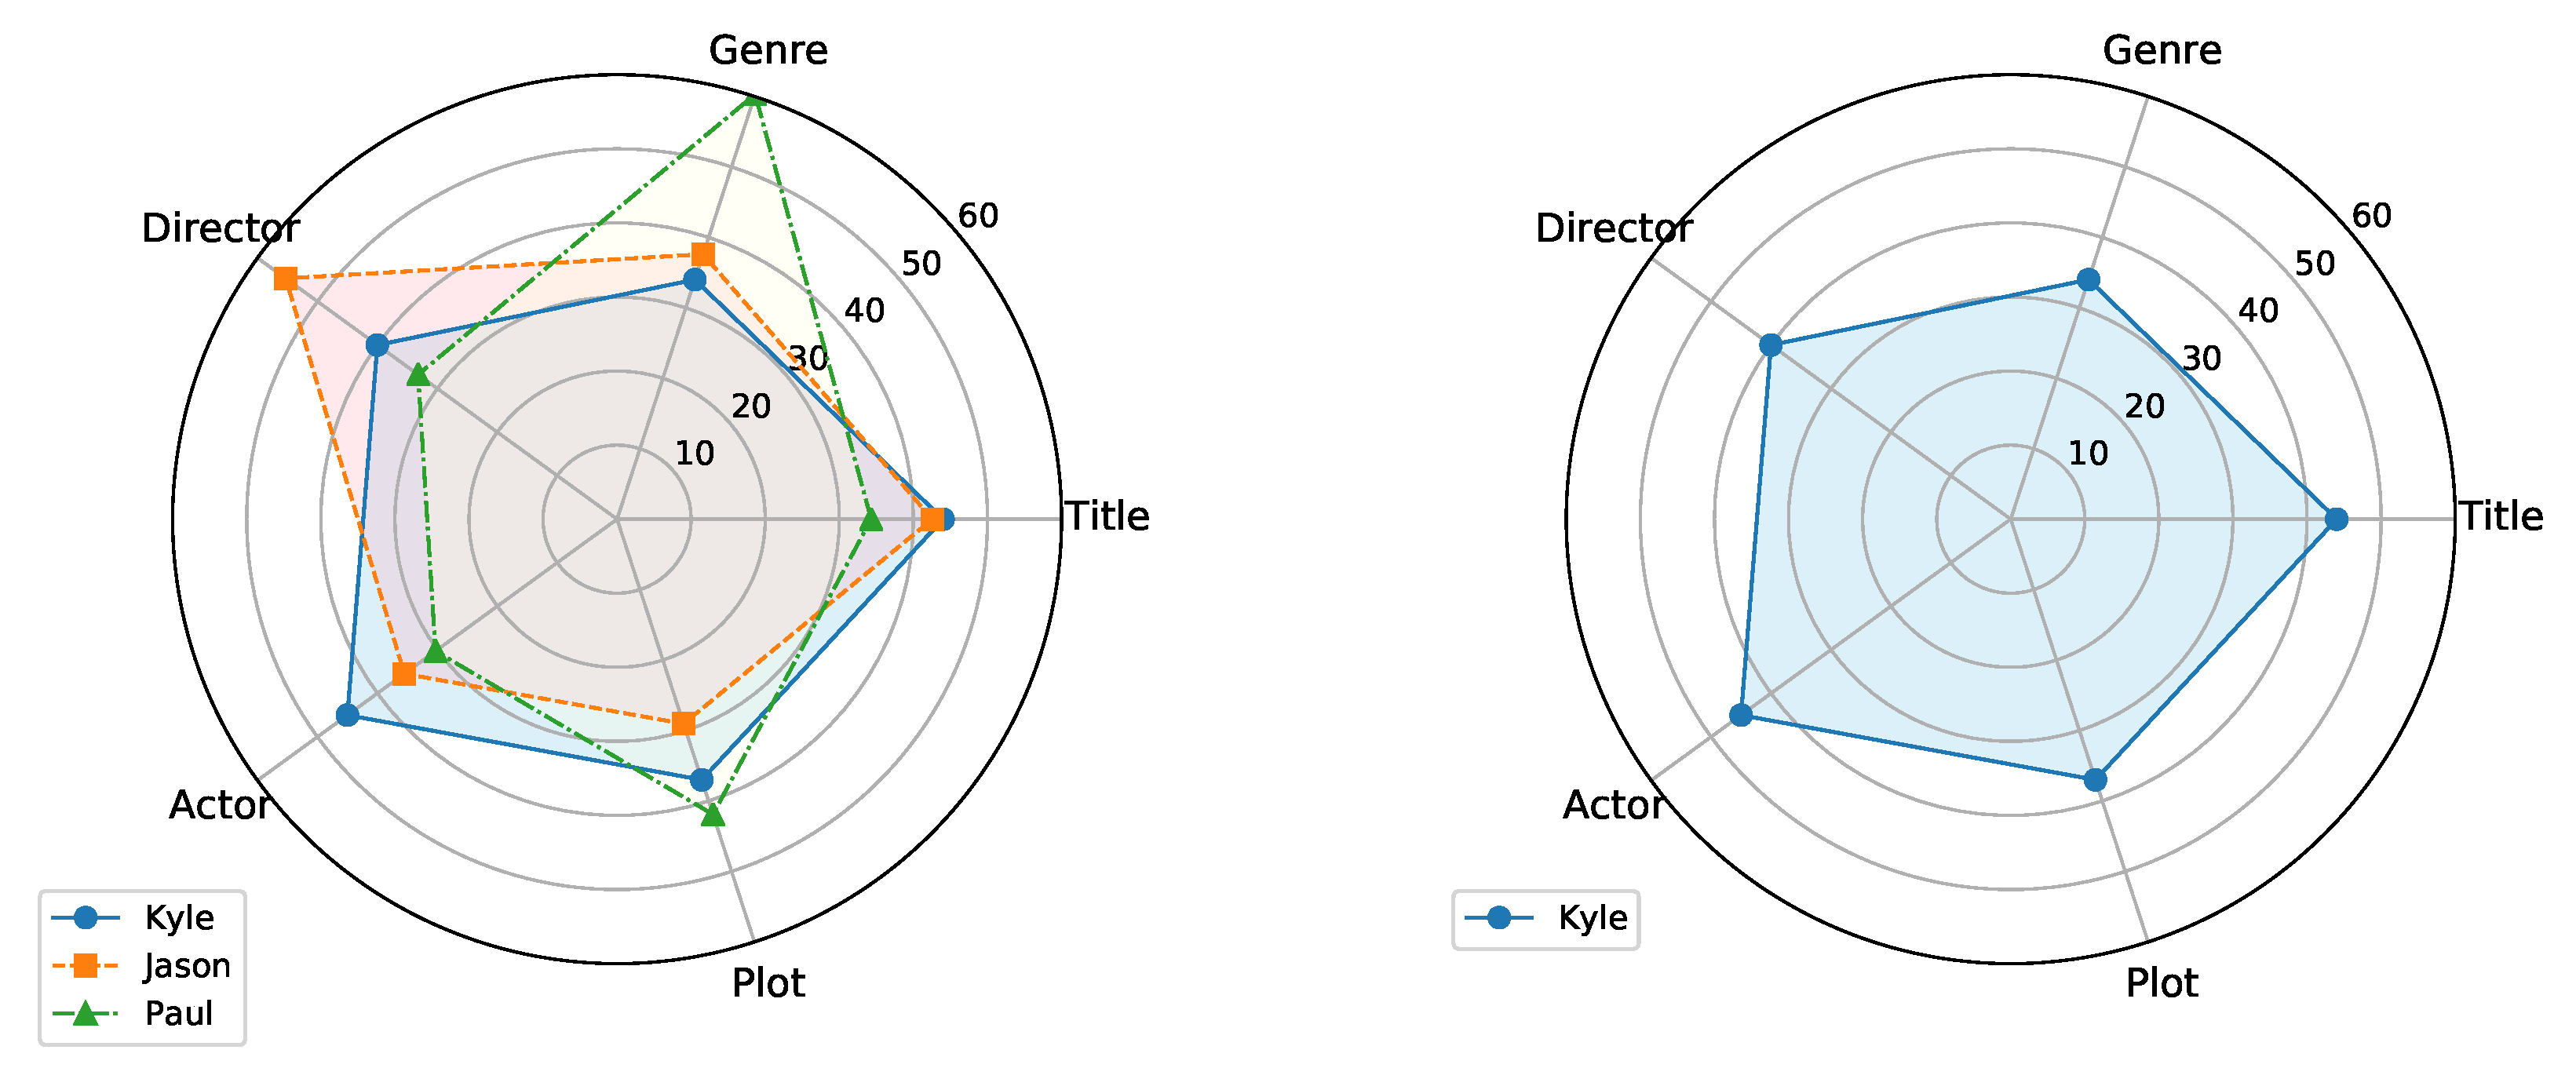
where is the features extracted from each item similarity according to the activities of and ; is the similarity of each feature and is the similarity of their priority in select pairs of the similar movie. For example, in Figure 2, the priority of in selecting pairs of movies similarity was illustrated in the right diagram and in the left diagram we can see that the priorities of users and are clearly related each other.
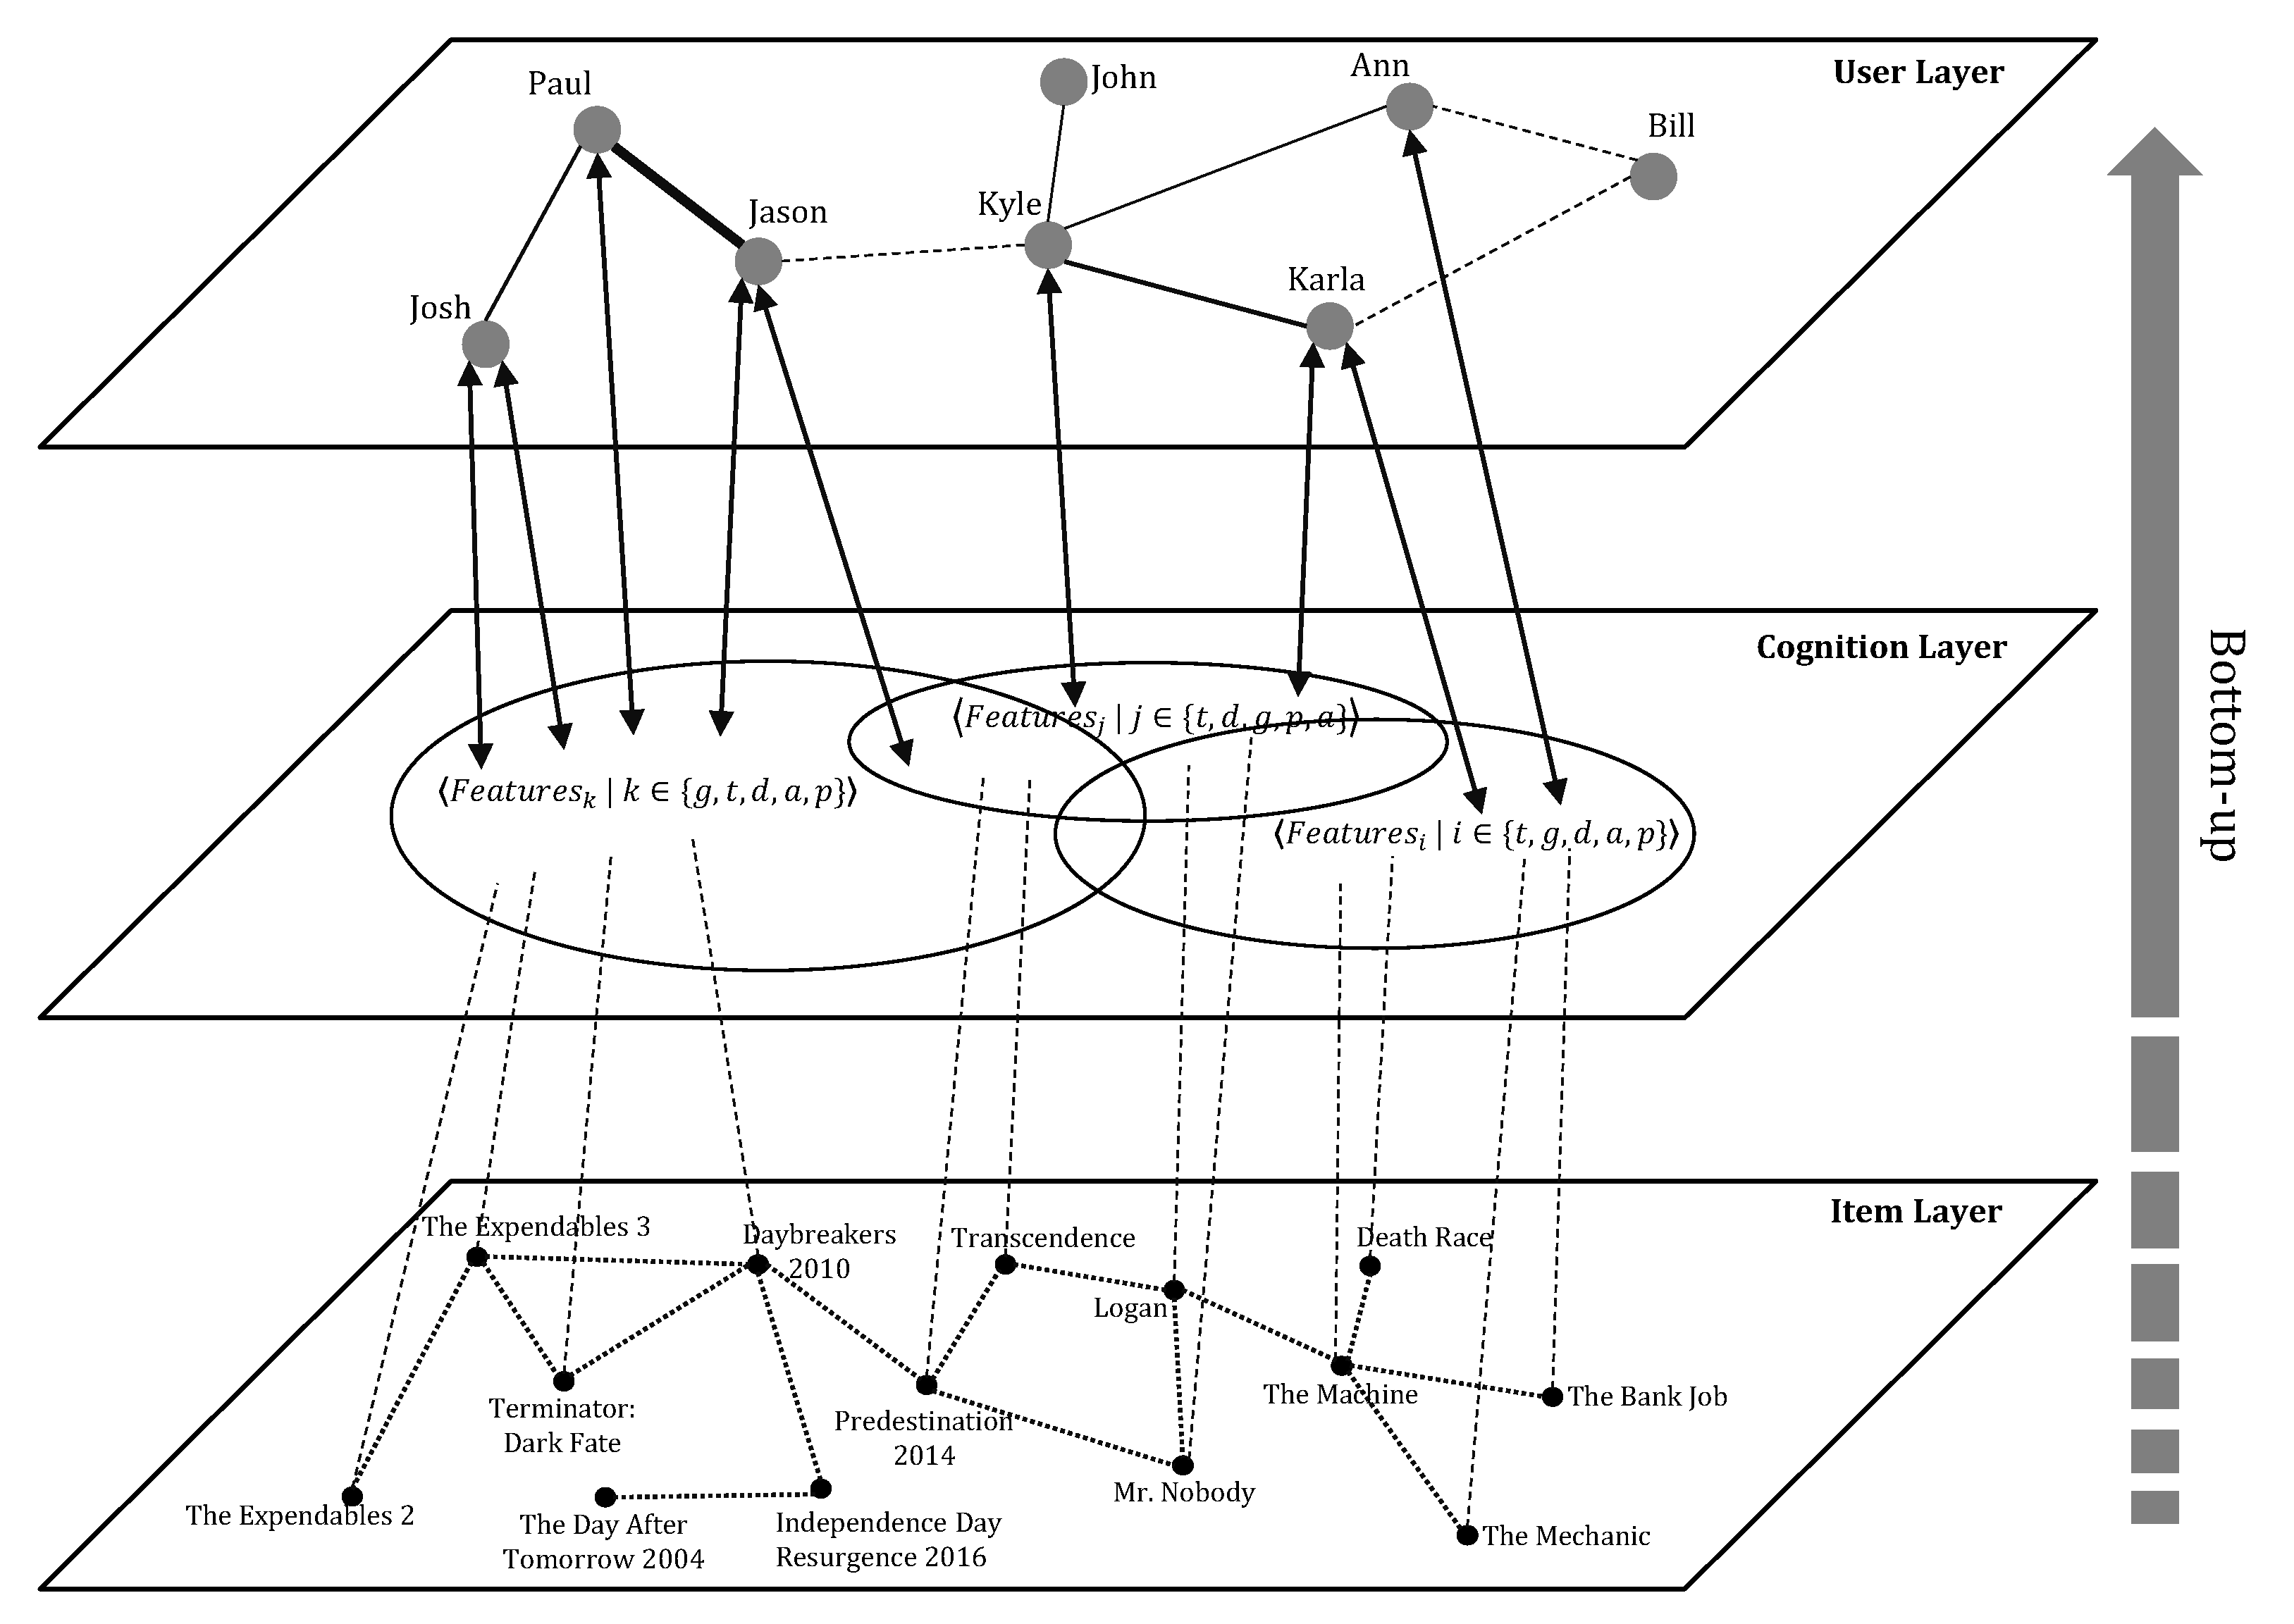
3.2. Three-Layered Architecture for Cognitive Similarity
Our purpose is to extract the similarity between users based on their cognitive similarity in finding the pair of similar items. Then we can use the cognitive similarity to find the k-nearest neighbor of active users. Hence, we introduce a three-layered architecture as shown in Figure 3, including (i) an item network , (ii) a cognition network , and (iii) a user network . The networks are considered with several different relations between individuals. Hence, each network is characterized as a set of relations and a set of objects (nodes). The characteristics of each layer and the relationships between layers in the three-layered architecture are described below.
- Item LayerIn the item network , nodes are representing items, and relations (i.e., edges) are the similarity between items. A item network is a directed graph , where is the set of item and is the set of relations between these items. From the item network in the Figure 3, the dot edges represent the relationship between the nodes while these nodes represent the items (the movies). In this study, the relation between items is measured by using cosine vector similarity as mentioned above.
- Cognition LayerThe cognition network is a network , in which is a set of cognitive similarity from groups of user and is the relationship between these groups. The objective relationship from the to the is through the selecting pairs of items similarity by users which can be expressed by a relation: . We can easily interpret the hubs as being the user’s groups that combine a large number of other users with cognitive similarity. These would be an exciting starting point for any new users willing to annotate a similar set of objects as his friend. For example, from the cognition network in Figure 3, the new user has cognitive similarity in groups so that will start related with the groups . These will be enriched during the cognitive of and dynamically changed in this network. The relation of these groups is represented by the overlap from sets of features that collect implicit from the activities of users. In particular, feature sets extracted from movies are , in which, t denotes title, g denotes genre, d denotes director, a denotes actor, and p denotes plot. Likewise, cognitive similarity between users will be extended and imported based on many histories of users’ activities (i.e., the item’s similarity). Clearly, there is a difference between cognition networks and item networks though: in item networks, based on several connected items, cognition will be extracted from there. The connection in cognition network extends to include the relation between cognitive similarity of the user and between user groups. Thus, it would be useful to recognize those hubs that connect users on the same groups, these are likely to be the expression of alignment between the two groups.
- User LayerIn the user layer , nodes are users, and relations are the numerous kinds of relationships that can be found in cognitive similarity. The user network is a network , in which is a set of entity of a user and the relationship between these entities. The relation was extracted based on the objective relationship from the to the that is through the extraction of relation users’ group in a cognition similarity and can be expressed by a relation: . From Figure 3, in the user network, the edges represent the relationship between users. By considering the relations between user , , and , the movie which they have seen and recognized as similar movies, such as The Expendables 2 (A), The Expendables 3 (B), Terminator: Dark Fate (C), Daybreakers 2010 (D), The Machine (E), and Mr. Nobody (F). User recognized pairs and are pairs of similar movies while the user suppose all pairs , and are pairs of similar movies. By combining with the cognitive similarity extracted from the cognition layer of each user, the nearest neighbors of is in a fixed-size neighborhood. Otherwise, in a threshold-based neighborhood, the neighbors of are and .
4. Recommendation System Based on Cognitive Similarity
CF-based recommendation systems usually use similarity method for finding k-nearest neighbor users to target a user. Then, the system utilize the past ratings of neighbor users to predict or recommend new content to the active user who will like that content. The content recommendation can be also made by using different methods based on the similarity of information from the past rating (buying, browse, and so on) of the users. In this paper, we use cognitive similarity among users to find k-nearest neighbor users. Obviously, by using a rating score, we can identify the user preferences, but a key problem is how to combine and weight the preferences of user neighbors. We consider another side, that is finding the cognitive similarity between users and combine with the user preferences. It is worth mentioning that, users cognitive similarity must be constructed based on their cognition about the items instead of rating score. All activities of the user can be collected and saved in the database. The features extracted from items that a user uses to recognize similarity can be used to develop the initial of user cognitive similarity. In this case, these features collected implicitly from the users through their movie similar selection. The system then analyzes and updates each cognitive similarity of users individually based on the collected features. The system continues to recommend pairs of similar movies of the k-nearest neighbors to collect feedback from the active user. Finally, the feedback from users on the results of recommendations can be used to adjust their cognitive similarity.
In order to develop the cognitive similarity, items similarity needs to be elaborated in the preprocessing. After that, the cognitive similarity between users will be occurred based on the similar items previously browsed and selected. The recommendation processes can be divided into three steps as follows:
- The representation of the user information. The cognitive similarity by user is analyzed and modeled.
- The generation of neighbor users. The similarity of users can be extracted from the three-layer architecture according to the data collected and the collaborative filtering algorithm presented in Section 3.
- The generation of recommendations. Top-N items will be recommended to the users according to the cognitive similarity of the neighbors.
Following to the above steps, each user activity in the database can be used to calculate the user list of neighbors which are recorded in the corresponding record in the user database. When users log into the system, the recommendations can be presented based on the cognitive similarity of the neighbors. Then, after each activity of the user can be used to enrich their cognitive similarity and store to database. The process of recommendation is shown in Figure 4.
Most recommendation systems based on user feedback to provide high-quality recommendations. Explicit feedback is sometimes considered as more reliable, implicit feedback requires less intervention to users, captures short-term interest, and continuously updates user preference [21]. Modern approaches make the quality of recommendation based on implicit feedback comparable to those based on explicit feedback. That is the reason, we consider the dynamic update cognitive similarity based on understanding implicit feedback from the user. By allowing the user to update their selection or suggest a new items’ similarity for collecting feedback from the user, we can make the measuring of cognitive similarity more efficiency. In addition, recommendations are computed by the cognitive similarity of neighbors. According to the cognitive similarity extracted, we know that the neighbors of each user, so we can list all the items similarity as to summary the most popular ones. For example, from the three-layered architecture described in Figure 3, consider these users , and , we can recognize that the neighbors of are and in the threshold neighborhood. Hence, the pair of similar items , and which recognized similar by and should be presented to the user . Then, when makes the selection (feedback from ), his cognitive similarity will increasingly, dynamic re-calculated, and updated to the database.
5. Experimental Results
5.1. Overview of the OMS System
We propose the OurMovieSimilarity (http://recsys.cau.ac.kr:8084/ourmoviesimilarity) (OMS) is the crowdsourcing system which can be collecting the cognitive similarity of users. Our system was built based on Java and MySQL database [31]. Because our system contains services are web-service and background service, the security and handle multiple access are one of the most important. Therefore we designed the system based on the Model-View-Controller (MVC) [32] model. Besides, we implement Apache Tomcat for the web services side and MySQL database was used because it has rock-solid reliability, scalability, and security.
OMS system is a web-based crowdsourcing platform, therefore we identify that the lowest latency should be considered carefully. Besides, the main challenge in the web-based system that it has enough instructions for the users during the entire system. In order to solve this problem, we using the concept of progressive disclosure, which is “show users what they need when they need, and where they want” in the whole all function of OMS.
In addition, in order to improve the user experience, we focus on the simplest interact and fast response to design our system. In particular, we use one template for the system to maintain consistency. Therefore, users can easier to recognize the interface function (e.g., buttons, functions) when they interact with OMS. All of the features we mentioned above based on three gold rules of user interface design [33].
Generally, interacting with the user is the most important in our purpose so that we made the process of selecting a similar movie from a user as simple as possible, whereby the user, in turn, selects the movies that they have seen and continues to choose which movie is the similar movie from the suggestion of the OMS system. In case the user does not find any of the proposed movies, it is possible to search for movies from IMDB and add to the OMS system.
5.2. Data Set
When the OMS was designed, we need the initial movie database to conduct the process of collecting the cognitive similarity of users. Therefore, we implement the movie crawling function in the OMS system, which is automatic collects movie information from sources provided online. We identify an IMDB (https://www.imdb.com/) is an extensive highly scalable movie database. In order to implement the crawling functions to collect movie information from IMDB, we used the open API provided by OMDb (http://www.omdbapi.com/). Up to now, we collected over 14,000 popular movies from 1990 to 2019 with nine genres, 3439 directors, and 8057 actors.
The OMS system still continues collecting data online. At this time, we have about 150 active users and more than five thousand activities of users. The number of data collected from users has the format: inside is the id of the user; and are a pair of the movie similar; is a vector represented the cognitive similarity of user ; and is the number of times user change suggested movies in select a pair of movies similar.
5.3. Evaluation
To evaluate the recommender system, firstly, the pair of item similarity (in this evaluation, it will be called item) of each user was divided into two sets. These datasets were selected randomly and called the - (the first set) and the - (the second set). The proposed algorithms were first implemented on the - in order to filter N items to be recommended to the active user that is called -N. Then, the items in -N were compared with the items in the -. The common items in the - and -N were called -. Finally, after obtaining the -, -, and -, we can calculate the accuracy percentage of the algorithm using evaluation criteria. Here, we used two criteria evaluation that are and .
Measuring the will returns the proportion of relevant recommendations according to the total recommendations (denotes as N), where the relevant recommendations are the ratings equal to or greater than a threshold. The is the proportion of relevant recommendations regarding the total relevant items (from the total number of items selected by the user). However, note that whereas N is a constant, the number of relevant items is not. Hence, the is a "relative" measure because extract relevant recommendations from a few relevant items are more difficult than a large of relevant items. Generally, for better performance, we use the that is a combination of two above criteria and can be formulated as follows:
where is the size of the -; is the size of the -; and is the size of -N set. was computed for each user and the average obtained from all users was considered as the criterion for determining the algorithm accuracy. To compare the proposed methods with the previous methods, we compared with the recommendation system that has been designed based on association rules. The following diagram shows the results of these algorithms. In the following evaluations, the various values of -N were considered from 10 to 250. Experimental results show that the accuracy of collaborative filtering based on cognitive similarity (CF-Cognitive Similarity) is higher than collaborative filtering based on Pearson correlation similarity (CF-Pearson Correlation Similarity) approach. The proposed method achieves improvement over the baseline in the best case is 11.1%. Consider various values of -N in a set , we have the comparison between the proposed method and the baseline as shown in Table 2.
In addition, to improve the evaluation, we continue to enable a comparative analysis by using MAE and RMSE as the evaluation metric and the measurement is defined as follows:
where n denotes the number of cognitive similarity values in the -, denotes the actual cognitive similarity values, and denotes predicted cognitive similarity values. In general MAE can range from 0 to infinity, where infinity is the maximum error according to the cognitive similarity values scale of the measured. The main reason following this approach is because the predicted cognitive similarity values can create the ordering of items in which the predictive accuracy can be used to measure the ability of a recommendation system to rank items according to user cognitive [34].
In order to create the -, we divide the items of each user following the k number of section/folds (k-fold cross-validation) where each fold is used as the - at some point. According to [35], we decided k is set as 5 because yield test error rate estimates that suffer neither from excessively high bias nor very high variance. Specifically, the data set was split into five folds. The first fold used as the - and the remainder used as - at the first interaction. In the next interaction, the second fold will be a - and the remainder is -. This process will repeat until each fold of the five folds has been used as the -. As mentioned above, we used Pearson Correlation Similarity which uses the similarity and recommendation models (1) and (2) as a baseline. Because the baseline is reported to perform best if around 50 neighbors of the active user, we decided 5, 10, 20, 30, and 50 as the neighborhood sizes in our experiments. The comparison between our proposed method and the baseline shown in Table 3 and Table 4.
6. Conclusions
In this paper, we proposed the three-layered architecture which can extract the cognitive similarity so that it can exactly identify the k-nearest neighbors. In order to apply the architecture, we aim to create a web-service crowdsourcing platform (called OurMovieSimilarity) to collect the cognitive feedback from the users. Our crowdsourcing system has deployed online and continues to collect feedback from the user. Our data set includes over 150 users and more than 5000 feedback stored in our database. In the evaluate how accurate the proposed method work in the recommendation system, we designate the collaborative filtering Pearson correlation similarity as the baseline to comparing with our methods. Clearly, the results demonstrate that the accuracy of cognitive similarity-based collaborative filtering higher than the baseline. Specifically, compared with the Pearson Correlation, our method more accurate and achieves improvement over the baseline 11.1% in the best case. The result shows that our method achieved a consistent improvement of 1.8% to 3.2% for various neighborhood sizes in MAE calculation, and from 2.0% to 4.1% in RMSE calculation.
Author Contributions
Conceptualization, L.V.N. and J.J.J.; methodology, L.V.N. and J.J.J.; software, L.V.N. and B.-S.S.; validation, J.J.J., M.-S.H. and B.-S.S.; formal analysis, L.V.N. and J.J.J.; investigation, J.J.J.; resources, L.V.N.; data curation, B.-S.S.; writing–original draft preparation, L.V.N.; writing–review and editing, L.V.N., M.-S.H. and B.-S.S.; visualization, L.V.N.; supervision, J.J.J.; project administration, J.J.J.; funding acquisition, J.J.J. All authors have read and agreed to the published version of the manuscript.
Funding
This work was supported by the National Research Foundation of Korea (NRF) grant funded by the Korea government (MSIP) (NRF-2018K1A3A1A09078981, NRF-2020R1A2B5B01002207).
Acknowledgments
This research was supported by Chung-Ang University Young Scientist Scholarship (CAYSS) Program 2018.
Conflicts of Interest
The authors declare no conflict of interest.
References
- Yang, C.; Bai, L.; Zhang, C.; Yuan, Q.; Han, J. Bridging collaborative filtering and semi-supervised learning: A neural approach for poi recommendation. In Proceedings of the 23rd ACM SIGKDD International Conference on Knowledge Discovery and Data Mining; Association for Computing Machinery: New York, NY, USA, 2017; pp. 1245–1254. [Google Scholar]
- Chu, W.T.; Tsai, Y.L. A hybrid recommendation system considering visual information for predicting favorite restaurants. World Wide Web 2017, 20, 1313–1331. [Google Scholar] [CrossRef]
- Resnick, P.; Iacovou, N.; Suchak, M.; Bergstrom, P.; Riedl, J. GroupLens: An open architecture for collaborative filtering of netnews. In Proceedings of the 1994 ACM Conference on Computer Supported Cooperative Work; Association for Computing Machinery: New York, NY, USA, 1994; pp. 175–186. [Google Scholar]
- Shardanand, U.; Maes, P. Social information filtering: Algorithms for automating “word of mouth”. In Proceedings of the SIGCHI Conference on Human Factors in Computing Systems; Association for Computing Machinery: New York, NY, USA, 1995; pp. 210–217. [Google Scholar]
- Herlocker, J.L.; Konstan, J.A.; Riedl, J. Explaining collaborative filtering recommendations. In Proceedings of the 2000 ACM Conference on Computer Supported Cooperative Work; Association for Computing Machinery: New York, NY, USA, 2000; pp. 241–250. [Google Scholar]
- Konstan, J.A.; Miller, B.N.; Maltz, D.; Herlocker, J.L.; Gordon, L.R.; Riedl, J. GroupLens: Applying collaborative filtering to Usenet news. Commun. ACM 1997, 40, 77–87. [Google Scholar] [CrossRef]
- Terveen, L.; Hill, W.; Amento, B.; McDonald, D.; Creter, J. PHOAKS: A system for sharing recommendations. Commun. ACM 1997, 40, 59–62. [Google Scholar] [CrossRef]
- Breese, J.S.; Heckerman, D.; Kadie, C. Empirical analysis of predictive algorithms for collaborative filtering. arXiv 2013, arXiv:1301.7363. [Google Scholar]
- Yu, K.; Schwaighofer, A.; Tresp, V.; Xu, X.; Kriegel, H.P. Probabilistic memory-based collaborative filtering. IEEE Trans. Knowl. Data Eng. 2004, 16, 56–69. [Google Scholar]
- Adomavicius, G.; Tuzhilin, A. Toward the next generation of recommender systems: A survey of the state-of-the-art and possible extensions. IEEE Trans. Knowl. Data Eng. 2005, 17, 734–749. [Google Scholar] [CrossRef]
- Nguyen, L.V.; Jung, J.J. Crowdsourcing Platform for Collecting Cognitive Feedbacks from Users: A Case Study on Movie Recommender System. In Reliability and Statistical Computing; Springer: Cham, Switzerland, 2020; p. 139. [Google Scholar]
- Zheng, H.; Li, D.; Hou, W. Task design, motivation, and participation in crowdsourcing contests. Int. J. Electron. Commer. 2011, 15, 57–88. [Google Scholar] [CrossRef]
- Howe, J. The rise of crowdsourcing. Wired Mag. 2006, 14, 1–4. [Google Scholar]
- Schenk, E.; Guittard, C. Crowdsourcing: What can be Outsourced to the Crowd, and Why. In Workshop on Open Source Innovation; HAL: Strasbourg, France, 2009; Volume 72, p. 3. [Google Scholar]
- Jung, J.J.; Euzenat, J. Towards semantic social networks. In European Semantic Web Conference; Springer: Berlin/Heidelberg, Germany, 2007; pp. 267–280. [Google Scholar]
- Harper, F.M.; Konstan, J.A. The movielens datasets: History and context. Acm Trans. Interact. Intell. Syst. 2015, 5, 1–19. [Google Scholar] [CrossRef]
- Cowell, R.G.; Dawid, P.; Lauritzen, S.L.; Spiegelhalter, D.J. Probabilistic Networks and Expert Systems: Exact Computational Methods for Bayesian Networks; Springer Science & Business Media: Berlin/Heidelberg, Germany, 2006. [Google Scholar]
- Nielsen, T.D.; Jensen, F.V. Bayesian Networks and Decision Graphs; Springer Science & Business Media: Berlin/Heidelberg, Germany, 2009. [Google Scholar]
- Pearl, J. Probabilistic Reasoning in Intelligent Systems: Networks of Plausible Inference; Elsevier: Amsterdam, The Netherlands, 2014. [Google Scholar]
- Pirasteh, P.; Jung, J.J.; Hwang, D. Item-based collaborative filtering with attribute correlation: A case study on movie recommendation. In Asian Conference on Intelligent Information and Database Systems; Springer: Berlin/Heidelberg, Germany, 2014; pp. 245–252. [Google Scholar]
- Lee, O.J.; Hong, M.S.; Jung, J.J.; Shin, J.; Kim, P. Adaptive collaborative filtering based on scalable clustering for big recommender systems. Acta Polytech. Hung. 2016, 13, 179–194. [Google Scholar]
- Sarwar, B.; Karypis, G.; Konstan, J.; Riedl, J. Application of Dimensionality Reduction in Recommender System-a Case Study; Technical Report; Minnesota University Minneapolis Department of Computer Science: Minneapolis, MN, USA, 2000. [Google Scholar]
- Hofmann, T. Latent semantic models for collaborative filtering. ACM Trans. Inf. Syst. (TOIS) 2004, 22, 89–115. [Google Scholar] [CrossRef]
- Melville, P.; Mooney, R.J.; Nagarajan, R. Content-boosted collaborative filtering for improved recommendations. Aaai/Iaai 2002, 23, 187–192. [Google Scholar]
- Zhang, J.; Pu, P. A recursive prediction algorithm for collaborative filtering recommender systems. In Proceedings of the 2007 ACM Conference on Recommender Systems, Minneapolis, MN, USA, 19–20 October 2007; pp. 57–64. [Google Scholar]
- Wang, J.; De Vries, A.P.; Reinders, M.J. Unified relevance models for rating prediction in collaborative filtering. ACM Trans. Inf. Syst. (TOIS) 2008, 26, 1–42. [Google Scholar] [CrossRef]
- Barman, S.D.; Hasan, M.; Roy, F. A Genre-Based Item-Item Collaborative Filtering: Facing the Cold-Start Problem. In Proceedings of the 2019 8th International Conference on Software and Computer Applications; Association for Computing Machinery: New York, NY, USA, 2019; pp. 258–262. [Google Scholar]
- Hasan, M.; Roy, F. An Item–Item Collaborative Filtering Recommender System Using Trust and Genre to Address the Cold-Start Problem. Big Data Cogn. Comput. 2019, 3, 39. [Google Scholar] [CrossRef] [Green Version]
- Shi, Y.; Larson, M.; Hanjalic, A. Exploiting user similarity based on rated-item pools for improved user-based collaborative filtering. In Proceedings of the Third ACM Conference on Recommender Systems; Association for Computing Machinery: New York, NY, USA, 2009; pp. 125–132. [Google Scholar]
- Lashkari, Y.; Metral, M.; Maes, P. Collaborative interface agents. In Proceedings of the 12th National Conference on Artificial Intelligence, AAAI, Seattle, WA, USA, 31 July–4 August 1994; pp. 111–116. [Google Scholar]
- Schwartz, B.; Zaitsev, P.; Tkachenko, V. High Performance MySQL: Optimization, Backups, and Replication; O’Reilly Media, Inc.: Sebastopol, CA, USA, 2012. [Google Scholar]
- Pop, D.P.; Altar, A. Designing an MVC model for rapid web application development. Procedia Eng. 2014, 69, 1172–1179. [Google Scholar] [CrossRef] [Green Version]
- Mandel, T. The Elements of User Interface Design; Wiley: New York, NY, USA, 1997; Volume 20. [Google Scholar]
- Liu, X.; Liu, Y.; Aberer, K.; Miao, C. Personalized point-of-interest recommendation by mining users’ preference transition. In Proceedings of the 22nd ACM International Conference on Information & Knowledge Management; ACM: New York, NY, USA, 2013; pp. 733–738. [Google Scholar]
- Kuhn, M.; Johnson, K. Applied Predictive Modeling; Springer: Berlin/Heidelberg, Germany, 2013; Volume 26. [Google Scholar]
Figure 1.
The Collaborative Filtering process.

Figure 2.
Representing the diagram of priority: In the right diagram, the priority of user illustrated by a grey area in ordering five features extracted from the movies (title, genre, director, actor, and plot). Combination with other users, in the left diagram, we can see the related of their priority.

Figure 3.
A three-layered architecture for cognitive similarity.

Figure 4.
The process of recommendation system.


Table 1.
Comparison between tradition CF with the user-based approach and our proposed method in considering the relation of users , and .
Table 1.
Comparison between tradition CF with the user-based approach and our proposed method in considering the relation of users , and .
| User-Based CF Approach | Cognitive Similarity Approach | |||
|---|---|---|---|---|
| User Similarity | Extracted Features | User Similarity | ||
| Jason | ≈0.689 | 0.41, 0.60, 0.48, 0.44, 0.46 | <G, D, P, A, T> | |
| Kyle | ≈0.579 | 0.39, 0.58, 0.49, 0.41, 0.47 | <G, D, P, A, T> | |
| Paul | ≈0.468 | 0.43, 0.64, 0.45, 0.49, 0.38 | <G, A, D, T, P> | |
Table 2.
metric comparison between the CF-Pearson Correlation Similarity and the CF-Cognitive Similarity.
Table 2.
metric comparison between the CF-Pearson Correlation Similarity and the CF-Cognitive Similarity.
| Number of Top-N | Pearson Correlation Similarity | Cognitive Similarity |
|---|---|---|
| 10 | 80.1 | 83.1 (+3.0) |
| 50 | 83.2 | 86.3 (+3.1) |
| 100 | 72.3 | 83.4 (+11.1) |
| 150 | 78.2 | 79.9 (+1.7) |
| 200 | 80.1 | 88.0 (+7.9) |
| 250 | 79.8 | 86.1 (+6.3) |
Table 3.
Comparison between CF-Pearson Correlation Similarity and the CF-Cognitive Similarity with varying neighborhood sizes (MAE metric).
Table 3.
Comparison between CF-Pearson Correlation Similarity and the CF-Cognitive Similarity with varying neighborhood sizes (MAE metric).
| Number of Neighbors | Pearson Correlation Similarity | Cognitive Similarity |
|---|---|---|
| 5 | 0.861 | 0.829 (+3.2%) |
| 10 | 0.783 | 0.758 (+2.5%) |
| 20 | 0.764 | 0.740 (+2.4%) |
| 30 | 0.722 | 0.702 (+2.0%) |
| 50 | 0.658 | 0.640 (+1.8%) |
Table 4.
Comparison between CF-Pearson Correlation Similarity and the CF-Cognitive Similarity with varying neighborhood sizes (RMSE metric).
Table 4.
Comparison between CF-Pearson Correlation Similarity and the CF-Cognitive Similarity with varying neighborhood sizes (RMSE metric).
| Number of Neighbors | Pearson Correlation Similarity | Cognitive Similarity |
|---|---|---|
| 5 | 1.203 | 1.162 (+4.1%) |
| 10 | 1.143 | 1.108 (+3.5%) |
| 20 | 0.997 | 0.967 (+3.0%) |
| 30 | 0.852 | 0.823 (+2.9%) |
| 50 | 0.791 | 0.771 (+2.0%) |
© 2020 by the authors. Licensee MDPI, Basel, Switzerland. This article is an open access article distributed under the terms and conditions of the Creative Commons Attribution (CC BY) license (http://creativecommons.org/licenses/by/4.0/).
Share and Cite
MDPI and ACS Style
Nguyen, L.V.; Hong, M.-S.; Jung, J.J.; Sohn, B.-S. Cognitive Similarity-Based Collaborative Filtering Recommendation System. Appl. Sci. 2020, 10, 4183. https://doi.org/10.3390/app10124183
AMA Style
Nguyen LV, Hong M-S, Jung JJ, Sohn B-S. Cognitive Similarity-Based Collaborative Filtering Recommendation System. Applied Sciences. 2020; 10(12):4183. https://doi.org/10.3390/app10124183
Chicago/Turabian StyleNguyen, Luong Vuong, Min-Sung Hong, Jason J. Jung, and Bong-Soo Sohn. 2020. "Cognitive Similarity-Based Collaborative Filtering Recommendation System" Applied Sciences 10, no. 12: 4183. https://doi.org/10.3390/app10124183
Note that from the first issue of 2016, this journal uses article numbers instead of page numbers. See further details here.