Reliability, Availability, and Maintainability (RAM) Study of an Ice Cream Industry

Department of Supply Chain Management (Logistics), International Hellenic University, 60100 Katerini, Greece
Appl. Sci. 2020, 10(12), 4265; https://doi.org/10.3390/app10124265
Submission received: 19 May 2020
/
Revised: 10 June 2020
/
Accepted: 19 June 2020
/
Published: 22 June 2020
(This article belongs to the Section Applied Industrial Technologies)
Abstract
:Featured Application
Reliability, availability, and maintainability (RAM) analysis which could benefit all manufacturing plantssuch as food, automotive, oil, and gasetc., with immediate results to the quality of the products and to improve the design and operation of the production lines.
Abstract
The purpose of this paper is to provide findings for a thorough review of reliability, availability, and maintainability (RAM) analysis utilizing failure data from an ice cream industry. The case study shows how RAM analysis is very helpful in assessing maintenance intervals and in planning and organizing an effective maintenance strategy. RAM study was computed based on historical data gathered over a twelve-month period. Pareto analysis, descriptive statistics, trend, and serial correlation test of the data were conducted. The parameters for failure and repair data were computed for each machine and the complete ice cream manufacturing system. The RAM analysis assesses the current operations management and improves the quality, productivity, and performance of the line. It was found that: (a) preventive maintenance intervals for each machine and completed system for different reliability periods were calculated. (b) Two machines with the lowest reliabilities are the packaging machine and then on the freezer tunnel. The significance of these machines is vital and their maintenance must be thorough to avoid losses pertaining to quality and productivity, and (c) the worst maintainabilities occur at the exogenous machine, and on the ice cream machine, together with the complete production system. Moreover, as the RAM indices have been calculated to quantify and increase machines’ performance, production managers and engineers can easily evaluate the next moves and decisions made with respect to the function of the system.
1. Introduction
Global competition requires automatic production systems that can be operated seamlessly, efficiently, and qualitatively. In an automatic system with multi-stage and quick manufacturing processes, sudden production machine failures can be expensive. A standard cause for production machine breakdowns is the failure of equipment to operate as needed. This instantly contributes to production waste such as waiting for unplanned downtime or product rejects [1]. Therefore, the extensive knowledge of reliability is crucial in predicting the unplanned downtime cost and the spare parts as well as recommending the optimal maintenance intervals [2,3]. The use of an excellent reliability program will reassure the collection of vital information regarding the system’s reliability performance right through the operation stage and direct the use of this information in the employment of analytical and management processes [4]. For valid effective reliability programs and maintenance development, proper data collection and analysis arerequired, together with the development of reliability models to aid in the decision-making procedures [5].
The greater part of industrial systems contains a high level of intricacy; however, they can be repaired in many cases. In those circumstances, it is obvious that excellent reliability, availability, and maintainability (RAM) study could play a vital role in the design stage and in any necessary modification to achieve the optimized performance of these systems. Nevertheless, it is effortful to evaluate the RAM parameters of such systems reaching up to a wanted degree of accuracy, utilizing information available and uncertain data [6]. A complex measure of reliability, availability, and maintainability in the mode of RAM-index for measuring the system performance was introduced by Rajpal et al. [7].
RAM analysis is essential to increase the productivity, efficiency, and the quality of the products. In addition, the RAM methodology guides us to continuous improvement based on total quality management (TQM) principles. Reliability analysis is a crucial tool to determine how efficient a system is, and also to select a maintenance policy [8]. Hoseinie et al. [9] examined reliability of the shearer machine to identify urgent workstations. Subsequently, with a view to attaining a proper and practicable maintenance schedule, a task package for the drum shearer machine in the Tabas coal mine was recommended. Morad et al. [10] assessed the reliability of 10 lorries and the computed significance of each constituent was weighted by the importance measure method. The impact of critical items on the availability of machines was showed in this study. The dump truck is one of the major types of machineryin unenclosed pit mines and its downtime reduction has definite outcomes on the production plan. Qiu and Cui [11] have recently approved a system reliability performance based on a reliant two-stage failure process, inclusive of the defect initialization stage and the defect development stage with competing failures. The reliance connecting both these stages was modeled by a statistical approach, specifically the non-homogeneous Poisson process (NHPP) model. RAM analysis of the system’s vital performance metrics, such as mean-time-to-failure (MTTF), equipment down-time (EDT), and system availability values (Asys) can be determined. Development of a methodology by Rajiv and Poja [12] allows the system’s reliability analysts/managers/engineers/practitioners to administer RAM analysis of the system to model, examine and predict the behavior of industrial systems in a greater pragmatic and consistent manner. They demonstrated that using RAM analysis of the system’s vital performance metrics such as mean-time-between-failure (MTBF), mean-time-to-repair (MTTR), and system availability values are determined. Acquired information from analysis assists the management in assessment of the RAM needs of system [13]. Eti et al. [14] indicated a means for the integration of RAMS and risk analysis as a guide in maintenance policies for the recurrence of failures and maintenance costs to be reduced.
It is believed that RAM is one of the most crucial fields for profitability improvement [15]. Furthermore, RAM will be instrumental in an increased environmental performance and safety, a vital element in maintenance of function, by contributing real and up to date database which concerns the genuine condition of the system. The RAM analysis in any industrial system is different because of various factors, e.g., the operating conditions of the system, the training level of the employees (operators, technicians, and managers), from the existing maintenance policy, etc. As a result, the system is particular and requires special know-how to solve it. This study may, therefore, be a valuable tool for product manufacturers wishing to develop their design and operation production lines. Herder et al. [16] explained the possibility and prerequisites to execute RAM simulation in industrial practice, through developing, implementing, and employing a RAM simulation model for the GE Plastics Lexan factory in Bergen op Zoom, Netherlands. Saraswat and Yadava [17] highlighted the role of RAM features to enhance the performance of engineering plans. Regattieri et al. [18] submitted a general framework for reliability analysis not only for non-repairable but also repairable components, which is characterized by stationary or non-stationary failure times, and deemed censored data. A case study involving a light commercial vehicle manufacturing system is extended for framework validation purposes. Failure time modeling was noted by Ahmad et al. [19] for transmission belt failures at a pulp producing factory by examining external factors and multiple failure modes. A complete methodology of reliability analysis by examining stated factors has been presented. Operational reliability and evaluation-based maintenance planning for an automotive manufacturing system werestudied by Soltanali et al. [20]. Patil and Bewoor [21] purposed a new approach for reliability analysis of a steam boiler system by expert judgment method. Żurek et al. [22] defined reliability in relation to technical means of transport and to illustrate an original solution leading to the determination of the expected fitness time of the available vehicle fleet, using the example of a selected military unit.Zeng et al. [23] studied reliability analysis by considering common cause failure.
Historical reliability data (failure and repair data) are the primary inputs for a dependable design and efficient maintenance program [24]. The accumulation of failure and repair data is vital for the analysis of the reliability and availability of the system to acquire unfailing and precise results [25,26]. In addition, historical and or benchmarking data, pertained to failure systems and repair patterns, are challenging to procure and they are often enough unreliable due to varied practical restrictions [27]. However, in view of the uncommon event of components, human oversight, and economic restraints, it is challenging to acquirea large quantity of data from any specific factory for a lengthy period of time. Furthermore, companies are focused on the manufacturing procedure instead of the collection of failure database. In addition, various companies are withdrawn to issue their data owing to the competition [28]. Consequently, it is rather challenging to accumulate precise and reliable failure data. The insufficient amount of quantitative data is one of the critical concerns driving researchers to implement qualitative methods for reliability analysis [29].
The application of reliability engineering to oil and gas pipeline systems was investigated by Omoya et al. [30] to identify which reliability engineering can be used to improve the integrity of pipelines. Patil [31] identified critical human and organizational factors and their effects on the reliability and maintainability of computerized numerical control.Tsarouhas [32] investigated the implementation of six sigma (SS) strategy with RAM analysis in a bag sector under actual operating circumstances. Moreover, the time-dependent reliability of the harmonic drive was analyzed by Zhang et al. [33].Jakkula et al. [34] studied the reliability analysis of a load haul dumper in order to apply adequate maintenance management. In another study, Zhang et al. [35] develop a method for evaluating the reliability of the interconnected supply chains for construction.
Conversely, there have been limited studies conducted on operations management, particularly centered on estimating functional reliability based on historical reliability data in food industry production lines.RAM analyses are common in different sectors of the food industry i.e., croissant, wine, etc., but applying it to an ice cream industry is unique. This will help to use the research on other similar manufacturing plants of dairy products for deciding maintenance intervals, and for organizing and planning the effective maintenance policy. Percy et al. [36] published that direct evidence suggests that sets of failure times normally consist of ten or fewer observations, emphasizing the requirement to develop methods adequately pertaining to small data sets (the larger the data set, the more accurate the statistical analysis). RAM analysis in the food industry was reviewed and aimed by Tsarouhas [37] to acknowledge the critical points of the manufacturing systems that must be enhanced by the operational capacity and maintenance effectiveness. The study was carried out in different sectors of the food industry i.e., bakery and bread products, canning and bottling, and dairy goods. In addition, Liberopoulos and Tsarouhas [38] considered the statistical analysis of failure data of an automatic pizza production line throughout a period of four years, calculating the vital descriptive statistics of the failure data, and examined the existence of autocorrelations and cross-correlations within the failure data. Aggarwal et al. [39] proposed a method which computes RAM indices to monitor and enhance the performance of a skimmed milk powder manufacturing system of a dairy factory subject to an actual working environment. In another study, Tsarouhas [40] developed analytical probability models for an automatic serial manufacturing system, bufferless that is composed of n-machines in series with a usual transfer mechanism and a control system. Failure database coming from the genuine production environment has been used to calculate reliability and maintainability for every machine, workstation, and the complete line is based on analytical models. A study to conclude the buffer capacity in dairy filling and packing lines via transient analysis was submitted by Wang et al. [8]. In Nigeria, Adebiyi et al. [41] formulated a conservation practice factor and conservation practice contribution, quantitative measures to assess the conservation practice within food factories. Xiev and Li [42] established a case study at a meat processing industry to analyze and enhance the throughput of a meat shaving and packaging line. Recently, Tsarouhas et al. [43,44] introduced the reliability availability and maintainability study of wine packaging and cake manufacturing systems at machine and complete line level. In addition, descriptive statistics of both the failure and repair data were executed and the utmost fitness index parameters were established, and the reliability and hazard rate modes were calculated for all machines and manufacturing lines. Therefore, it is evident that RAM studies are common in different sectors in the industry (i.e., automotive, plastics, lubricants and petrol, food, etc.) but relating it to an ice cream factory is unparalleled.
The statistical methods of historical data based on RAM analysis for an ice cream industry are put forward in this study. The analysis incorporates the computation of the upmost critical descriptive statistics of the failure database, the identification of the most vital failures, and the computation of the parameters of the theoretical distributions which fit the failure database best. The reliability and maintainability of the plant were also calculated for various time periods at both for the complete manufacturing system and each machine. The analysis should be a beneficial tool for production managers together with maintenance staff to evaluate the ongoing conditions and to perceive RAM for improving the operations administration (i.e., total productive maintenance, spare parts, inventory, etc.) of the system. The purpose of the study was to establish sound reliability and maintainability model to assist manufacturers of food machines, whose target is to optimize the design and function of their manufacturing systems at the top reliability, therefore advancing their performance, efficiency, and availability.
2. Methodology
The main stages of methodology executed in the behavioral assessment framework with RAM analysis are listed below [45,46,47,48,49,50]:
- The first stage performs with the collection of failure data. Covering a prolonged length of time, the failure database details have been recorded for an automated ice cream production line. In the current study, maintenance data from the plant’s maintenance logbook records arecollected over a 12-months period. During this interval, 468 recorded failures are categorized for analysis.
- The second stage detects the frequency of failure analysis of machines which has been executed with the assistance of the Pareto chart. Six failures are considered for every machine as the least amount of failures for the analysis.
- Within the third stage, the failure data should be computed. In other words, the confirmation of the acceptance of independent and identically distributed (iid) nature. There are two usual methods employed to confirm the iid assumption: the trend and the serial correlation tests. Once the failed equipment can be reverted to the original condition after the repair process, then the acceptance that the data are identical aresound. Therefore, the equipment (or system) follows the homogeneous Poisson process (HPP) which refers to a non-repairable system, where for every failure, the repair shall reinstate the system to the “as good as new” state. However, the non-homogeneous Poisson process (NHPP) should be selected for a repairable system. In NHPP, it is the premise that a minimal repair with trivial repair time will have as a result the system restoration of to the “as bad as old” condition.
- In the next stage, computation of the goodness-of-fit test for iid data (homogeneous Poisson process HPP)and their parameters are found with the use ofa statistics package MINITAB professional software, the Aderson and Darling test is employed for goodness-of-fit test of idd data sets. The least-square approach is employed to calculate the parameters for the best fitted statistical distributions. In addition, the goodness-of-fit test for non-idd database (non homogeneous Poisson process-NHPP) and the parameters were measured.
- RAM analysis for every machine, for various time periods and for the complete system were evaluated using the system configuration relations.
- Finally, with the target to improve reliability and the formulation of better maintenance strategy employing recognition of vital machines and faults.
3. Production Process of an Ice Cream Production Line
The establishment is one of greatest dairy goods producers in Europe, manufacturing ice cream using a total of eleven, similar specialized processing lines. With the aim of precision in our demonstration, we concentrate on a plant, which is typical of one used in the sector. The particular ice cream manufacturing system in focus is made up of a number of machines in series consolidated into one network by a standard transfer mechanism and a standard control system. Mechanical means are responsible for the automatic movement of material between stations. There are a total of six machines in making ice cream: pasteurization and homogenization, aging, freezing, freezer tunnel, and packaging. Each machine is found within a different part of the process line (Figure 1). Following is the procedure process flow of the line [51]:
Initially, the milk is transported to the ice cream factory in refrigerated lorries from nearby dairy farms. Then, the milk is poured into storage silos that are kept at a temperature of 2 °C. Tubes transport the milk in pre-measured quantities to blenders made of stainless steel. Premeasured quantities of additives, sugar, and eggs are combined with the milk for about ten minutes. For the purpose this mix is homogenized decreasing the milk fat globule capacity to produce a better emulsion and also to create velvety, smoother ice cream, this mix is homogenized. Moreover, homogenization is necessary for emulsifiers and stabilizers to be well mixed and uniformly distributed in the ice cream blend before being frozen (M1). Finally, the ice cream blend is pasteurized at 79.4 °C for 25 s. The requirements used to pasteurize the ice cream blend are more important than conditions needed for fluid milk due to raised viscosity of the increased content in fat, solids, and sweetener, plus the inclusion of egg yolks in custard produce.
In the following step, the ice cream mix is aged at a temperature of between 2–4 °C for a minimum of 4 hours or overnight. Maturing, allows the blend to cool ahead of freezing, therefore the milk fat partly crystallizes giving the protein stabilizers space to hydrate. In addition, the whipping characteristics of the blend (M2) are improved. Aging also improves the quality of the final product. Liquid colors and flavors are sometimes included in the blend before freezing. Solely liquid ingredients should be included before freezing, to ensure the blend proceeds correctly along the freezing equipment. After the product has been pasteurized and cooled, it is deposited into a chilled tank for quick cooling (M3). It is this stage when the semi-finished product is transferred into the ice cream machine where the mixture is at −5 °C under intense stirring. The process involves both freezing the mixture and incorporating air, with an aim to achieve the lightness or denseness and increase the volume from 80% to 120% of ice cream. At this time, fruit essences, extracts, or ingredients (cookie and candy pieces, nuts, etc.) are included.
In the output of the freezing machine, the semi-finished product is fed into a special extruder to gain its final shape (stick figure), whereby the gripper is automatically placed onto the dosing device with a special mechanism. The extruder system, which is part of the cooling tunnel, is located at the entrance of the tunnel. Once the ice cream is in its final form, it is placed on a convector belt and moves through the cooling tunnel for the final curing phase (M4). The temperature of the ice cream entering this machine is −5 °C and exiting is −12 °C, while the tunnel space temperature stands at −40 °C. The products are then fed to the horizontal packaging machines (M5), and finally put into the cartons. The cartons are transported along the conveyer belt where they go through the X-ray foreign body detector and a production code and expiration date is spray-painted onto every carton by an ink jet. In general, all products are moved into long-term storage where the temperature is basically held around −25 °C, with the ability to keep the product for a maximum of nine months.
The sixth and final machine (M6) is theoretical and appertains to the supply of electrical power, water, and natural gas. Here, the production line is assisted by a number of auxiliary systems producing auxiliary means such as steam, cooling water, hot water, compressed air for moving parts, etc. These auxiliary systems are as follows: (a) the boiler room used for steam generation in the heat exchangers in the heating stages, (b) the chiller plant which is a water cooling unit as a refrigerant in the cooling chillers-refrigeration complex of ammonia as a refrigerant in the refrigeration exchangers incorporated in the ice cream machines, (c) airstrip which is where compressed air production drives mechanical parts of engines, i.e., air pistons to trigger automatic air valves; and (d) the hydrostation that is an assembly of tanks, pumps, and networks for the administration of drinking water and auxiliary water use of the plant, i.e., for equipment washing, etc.
4. Compilation of Failure Database and the Operations Administration of the Plant
The ice cream manufacturing system functions on an 8 h shift per day, during the weekdays and including the weekends. During this time period, the production system functioned for a sum of 351 working days. Data from a 12-month period was collected by the technical department. The database is records of failures per work period which are kept by the technical department within each shift. Included in the database are the failures which have occurred per work period, the immediate actions needed by the maintenance staff to repair a failure, the exact time that the system not operate, and the accurate time of failure. Consequently, the accurate time when the equipment fails (or repairs) i.e., the accurate time-between-failure (TBF), and the time-to-repair (TTR) a failure can be attained. Both the TBFs and TTRs were registered within minutes. On the report of the records, a sum of 468 failures was established for the complete system. TBF of a system (or machine) is marked as the time which elapses once the system is turned on and begins functioning after a failure, up to the time it goes down anew and stops function because of a new failure. TTR of an unsuccessful system (or machine) is outlined as the time that elapses from the instant the system goes down and ceases until the instant it goes up again and starts functioning.
The maintenance policy that is applied tothe ice cream production system is preventive, predictive, and corrective maintenance. Preventive maintenance is the scheduling of planned maintenance moves with the purpose of both the prevention of failures and breakdowns for the equipment. The main goal is the preservation and enhancement of the equipment’s reliability, in order to increase its lifetime and help it runs more efficiently. The preventive maintenance is supported on an application of specific preventive moves for example greasing, belt-tightening, oil changes, changing filters, etc. The preventive maintenance program should be performed on equipment as recommended by the manufacturer i.e., time periods (daily, weekly, monthly, quarterly, etc).
Predictive maintenance is considered as a technique that helps identify the condition of an in-service system (or machine) with an aim to determine when maintenance can be carried out. The objective of this maintenance is to minimize disruption of common system functions, however providing for scheduled repairs, budgeted. Predictive maintenance could be considered as the supplement of preventive maintenance. Using the utilization of numerous nondestructive testing and measuring methods (i.e., oil analysis, vibration analysis, infrared thermography, and visual inspections), predictive maintenance establishes the system (or machine) status prior to a failure occurring.
Corrective maintenance is unprogrammed and executed whenever a breakdown happens. The process needs instant action of the technicians (i.e., mechanics and electricians) so as to return it to primary functioning condition. The benefit of the adequate maintenance policy is to increase equipment life by reducing failures and breakdowns. Moreover, this reduces costs that relate to the downtimes and decreases the cost of replacement.
In Figure 2, the graphical summaries of TTRs and TBFs for the entire manufacturing system were shown. The graphical summaries include three graphs: (i) histogram of failure/repair database with an overlaid bell curve, (ii) boxplot, (iii) 95% confidence intervals for mean, median, and the standard deviation. The following observations were made: (a) Both TBFs and TTRs have the p-value ≤ 0.005, the failure database do not accompany a Gaussian distribution. (b) With a confidence interval of 95%, the meanTBF measurement is between 310.80 and 357.52 min. Whereas the meanTTR measurement is between 23.148 to 27.095 min. (c) The boxplots show the variability, shape, and central tendency of the failure database. Both TBFs and TTRs present right-skewed, meaning that almost all of the failure data are comparatively short, and only some data are long. (d) For the TBFs of the line, the Q1 (1st quartile) is the 25th percentile and suggests that 25% of the database are slighter or equivalent to 113.50 min, the median (Q2, second quartile) is exactly 315 min, and the Q3 (third quartile) suggests that 75% of the database are slighter or equivalent to 478 min. The minimum value observed for the TBF is 1 min. Whereas, the Q1 of the TTRs is 10 min, the Q2 stand for 17.50 min, and the Q3 is 32 min. 156 min is the maximum time to restore a failure. (e) The kurtosis at line level for both TBFs and TTRs are positives with 0.5448 and 8.449 respectively. Positive value of kurtosis suggests that distribution holds heavier tails than the Gaussian distribution (leptokurtic).
In Figure 3, we exhibit Pareto’s diagrams for the total failures raised in an ice cream manufacturing system at every machine. The Pareto chart is to emphasize the significant machines in relation to the failure number. The following observations were made: (a) the pasteurization/homogenization machine (M1) has the upmost number of failures, 25.9%, (b) the additional importance is the packaging machine (M5) which has 21.5% of breakdowns, and (c) the pasteurization/homogenization machine (M1), packaging machine (M5), and age machine (M2) in the chart represents 65.8% of all the malfunctions of the ice cream manufacturing system.
5. Descriptive Statistics of Failure andRepair Database
Descriptive statistics of the failure database (TBFs and TTRs) for each machine and for the complete ice cream manufacturing system were illustrated in Table 1, in order to measure the central tendency and the dispersion of the data. It was pointed out that: (a) the average TBF of the system is 334.2 min or approximately 5.5 h, hence about 1.5 failures per shift on the ice cream system is shown, while the average TTR a failure is 25.12 min. (b) The maximum value of TTR is 156 min (replacement of motor inverter) at the aging machine (M2). There are also time-consuming repairs at an ice cream machine (M3, failure of screw pump) with 146 min, and at the pasteurization/homogenization machine (M1, failure of heat exchanger) with 137 min. (c) The highest values of SD are observed at the machine with the least number of failures. For instance, the exogenous (M6, 7 failures), the ice cream machine (M3, 70 failures), and the aging machine (M2, 82 failures) have SDs 34553, 2242, and 1532 min respectively. Whereas, the lowest values of SD are shown at the workstation with the most number of failures, i.e., the pasteurization/homogenization machine (M1, 123 failures) has 1376 min and the packaging machine (M5, 102 failures) stand for 1443 min. (d) The CVs of TBF and TTR for the manufacturing system are slighter than one (with 0.7704 and 0.8648 respectively) and are considered low-variance, i.e.,Erlang distribution. (e) All the breakdowns for all machines and the complete manufacturing system for TBF and TTR (except TTR M6) are positively skewed, then it is valid: mode < median < mean. (f) The lowest mean TBFs are at the pasteurization/homogenization machine (M1), packaging machine (M5), and aging machine (M2) with 1343, 1643, and 1914 min respectively, and (g) the highest mean TTRs are at exogenous (M6), ice cream machine (M3), and pasteurization/homogenization machine (M1) with 59.50, 31.71 and 27.22 min respectively.
Figure 4 shows the box plots of the failure and repair database for all machines and the complete ice cream system. The box plot shows the median, the quartiles (Q1, Q2, and Q3), and the minimum and maximum data points to reveal the spread and the symmetry of distribution of database values. Moreover, the graph depicts the central tendency, variability, and shape of the failure database.
6. Trend Test and Serial Correlation Test for an Ice Cream Manufacturing System
Statistical tests that could permit to quantitatively define whether or not a failure database of an ice cream manufacturing system show a significant trend have to be computed. For this reason, the confirmation of the presumption of the iid nature of TBF/TTR database for every individual machine, together with the complete system were identified. Trend test and serial correlation test are two frequent approaches that are commonly used to confirm the iid assumption. With the possibility that this assumption is not validated, then the conventional statistical methods for reliability/maintainability study could not be suitable. Consequently, a non-stationary model such asanon-homogeneous Poisson process (NHPP) has to be adapted.
The null hypothesis (H0): there is no trend in database (i.e., HPP), together with the alternative hypothesis (HA): there is trend in database (i.e., NHPP) were defined. Furthermore, the test-statistic U is distributed in accordance with the chi-squared function for degrees of freedom (df) [52]. The df are the quantity of facts that supply the failure database and can be used to calculate the principles of uncertain population parameters, and estimate the variability of these calculations. This value is defined by the amount of inspections within the model and the amount of parameters in the sample. The U statistic is determined by the experimental failure database whereby the x2a,df could be calculated by the chi-squared distribution having a 2(n−1) of df.
Provided the statistic U > x2a,df then the H0 is possible, contrarily the H0 is excluded and the HA is plausible. The trend test outcomes are contrasted against the statistical parameter U as follows [53]:
The confirmation of trends for TBF values belonging to the ice cream production system are listed in Table 2. Having a = 5% level of significance one can observe that: (a) for TBF in the majority of machines the is not excluded, and solely for the pasteurization/homogenization machine (M1) and exogenous (M6) the is rejected. Therefore, for these machines, we can proceed with the NHPP. (b) The of the TTR is not excluded for the entire system and for all the machines.
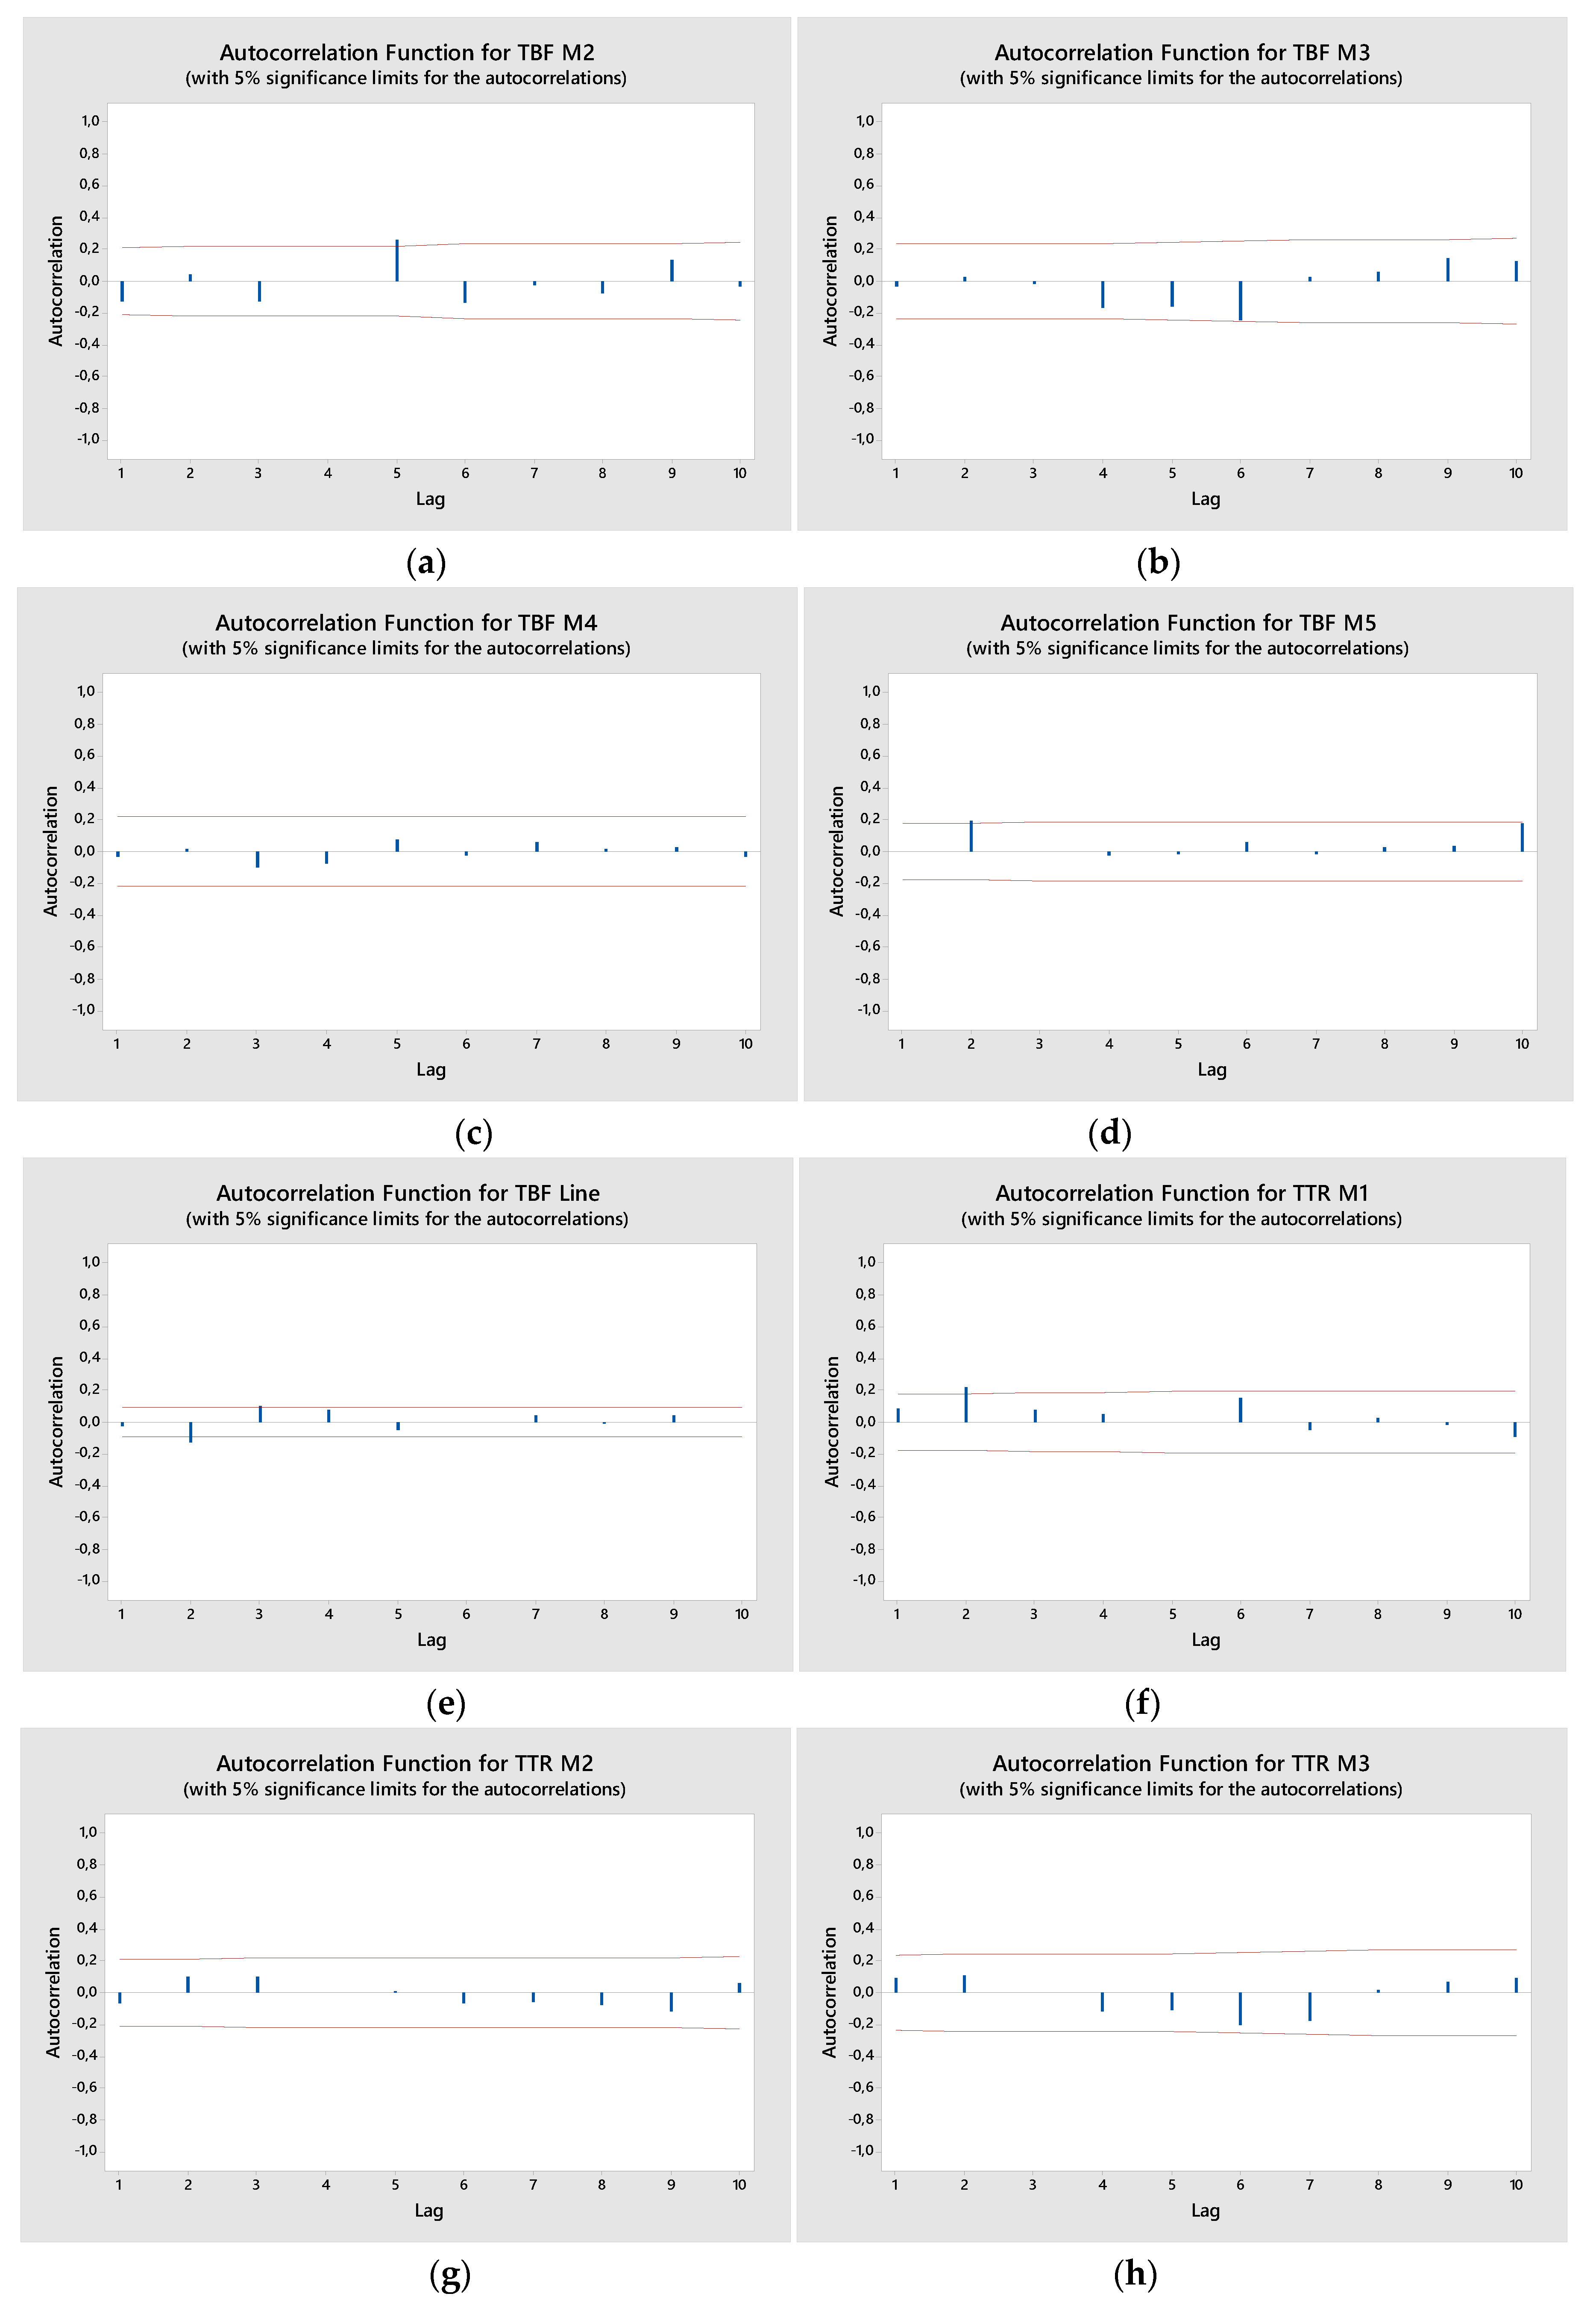
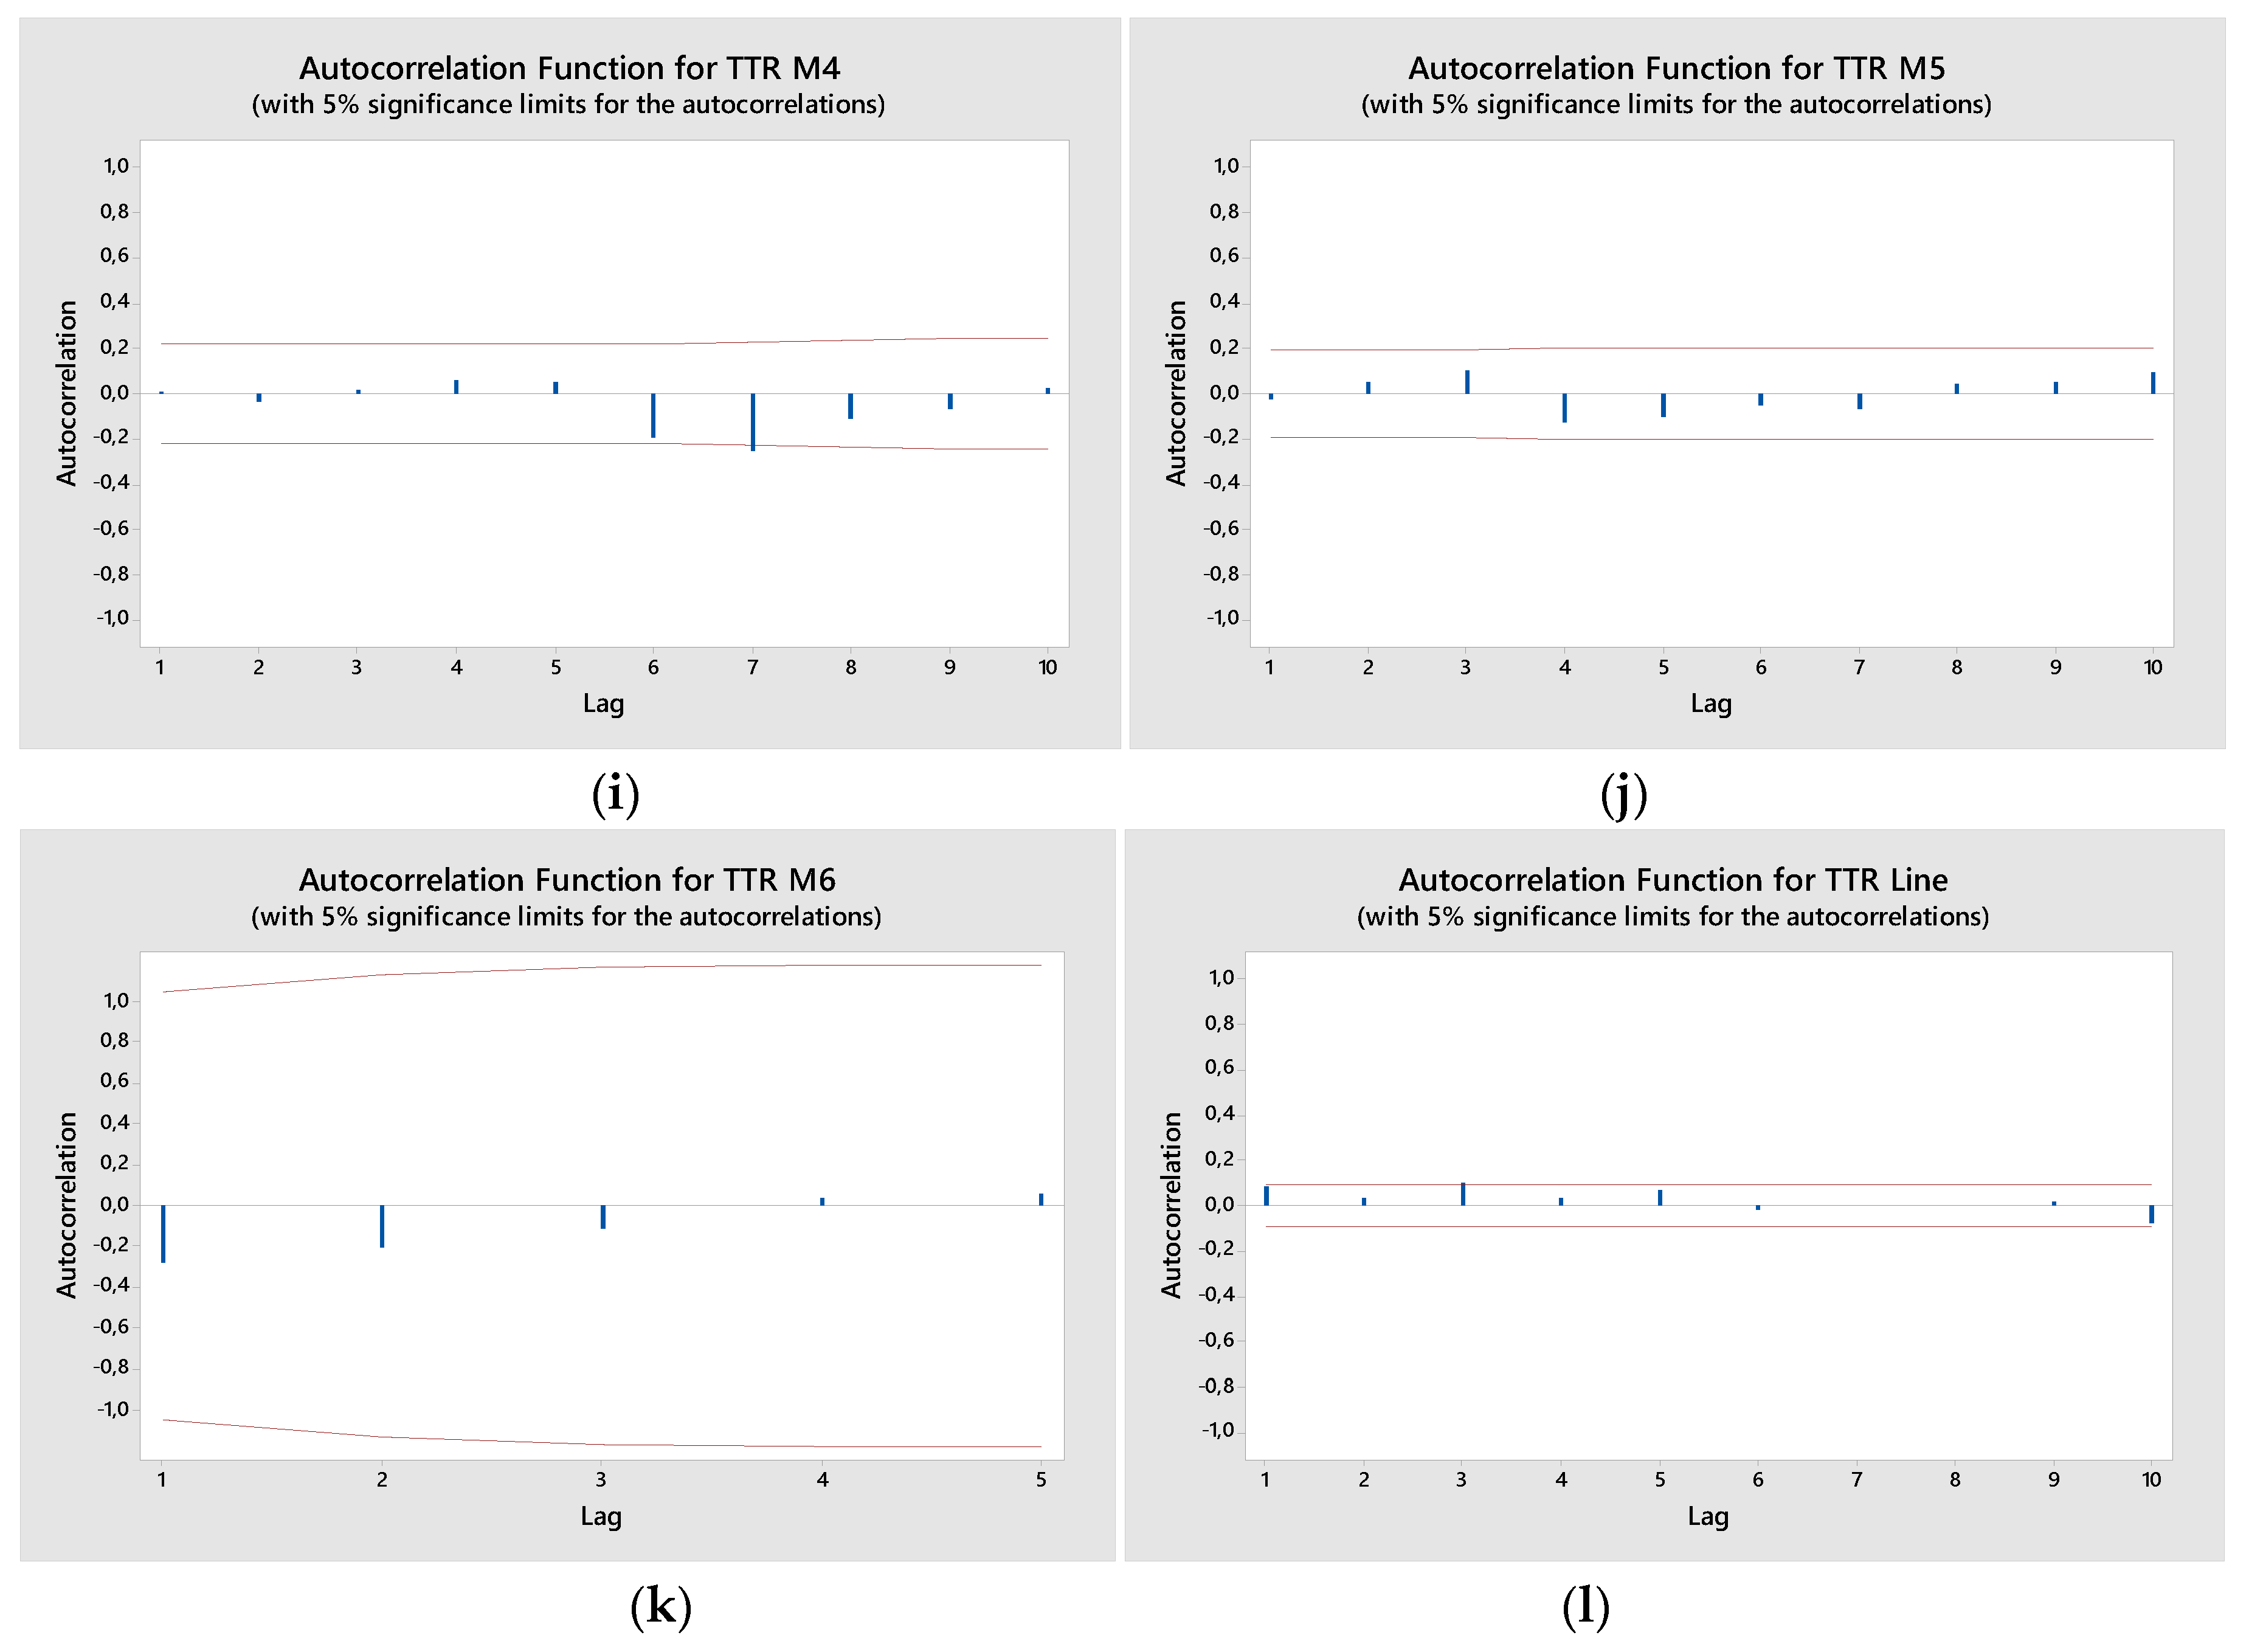
The serial correlation for the TBF and TTR that represent no-trend on failure database (that is not excluded) for the manufacturing system wascalculated. The correlation coefficients are computed for lags which vary from 1 to 10. In Figure 5, the serial correlation test for TBF and TTR of all machines and the entire system were shown.
Thus, it is clear from the trend test and serial correlation test that the database for each machine and the manufacturing system (excluding the M1 and M6 for TBF) of the ice cream production system are free of the presence of trends and serial correlation. Therefore, for the M1 and M6 of TBF the NHPP, the power law process (PLP) is the suitable distribution.
7. Reliability andMaintainability Study
The reliability of a system is determined as reaching an outstanding performance under given conditions ata given time [54]. Similarly, reliability is the possibility that a system adequately operates without failure, during a specified time period, when it is exposed to standard working conditions [55]. Likewise, reliability is the possibility of non-breakdown in a particular period. For machines that have been detected not to be iid and are therefore defined with the NHPP (i.e., PLP). The machines where no serial correlation or trend was detected in the interpreted database and the suitable statistical distribution that suit the database were established. The Anderson Darling with goodness-of-fit test was executed to validate the fit of various theoretical distributions (i.e., normal, lognormal, Weibull, loglogistic distribution, and so on) by applying the maximum likelihood estimation approach. The test statistics of various theoretical distributions for TBF and TTR based on failure database coming from the complete system and each machine are outlined in Table 3. The slightest statistic value demonstrates the distribution that fits the database. At line level, it is discerned that the TBFs accompany the 3-parameter Weibull distribution, whereby the TTRs are 3-parameter lognormal distribution.
The parameters for both TBF and TTR for the complete ice cream manufacturing system and each machine are summarized in Table 4. This could be a tool for the reliability and maintainability of the equipment with the aim of predicting them in short term time periods.
The survival functions, probability density functions, probability plot, and repair/hazard functions of TBFs and TTRs and their statistics throughout the entire ice cream manufacturing system are shown in Figure 6. It was pointed out that: (a) initially the TBF has an expanding failure rate reaching 95 min following a lessening failure rate, proving that solely during the first 95 min of function, subsequent to a stoppage (due to a malfunction), the system has a real possibility of failure, then once time progresses this likelihood is decreased. (b) The TTR has an expanding repair rate reaching 10.5 min. Provided the repair process has not been concluded in the initial 10.5 min, in that case, the possibility to repair the failure lessens with time.
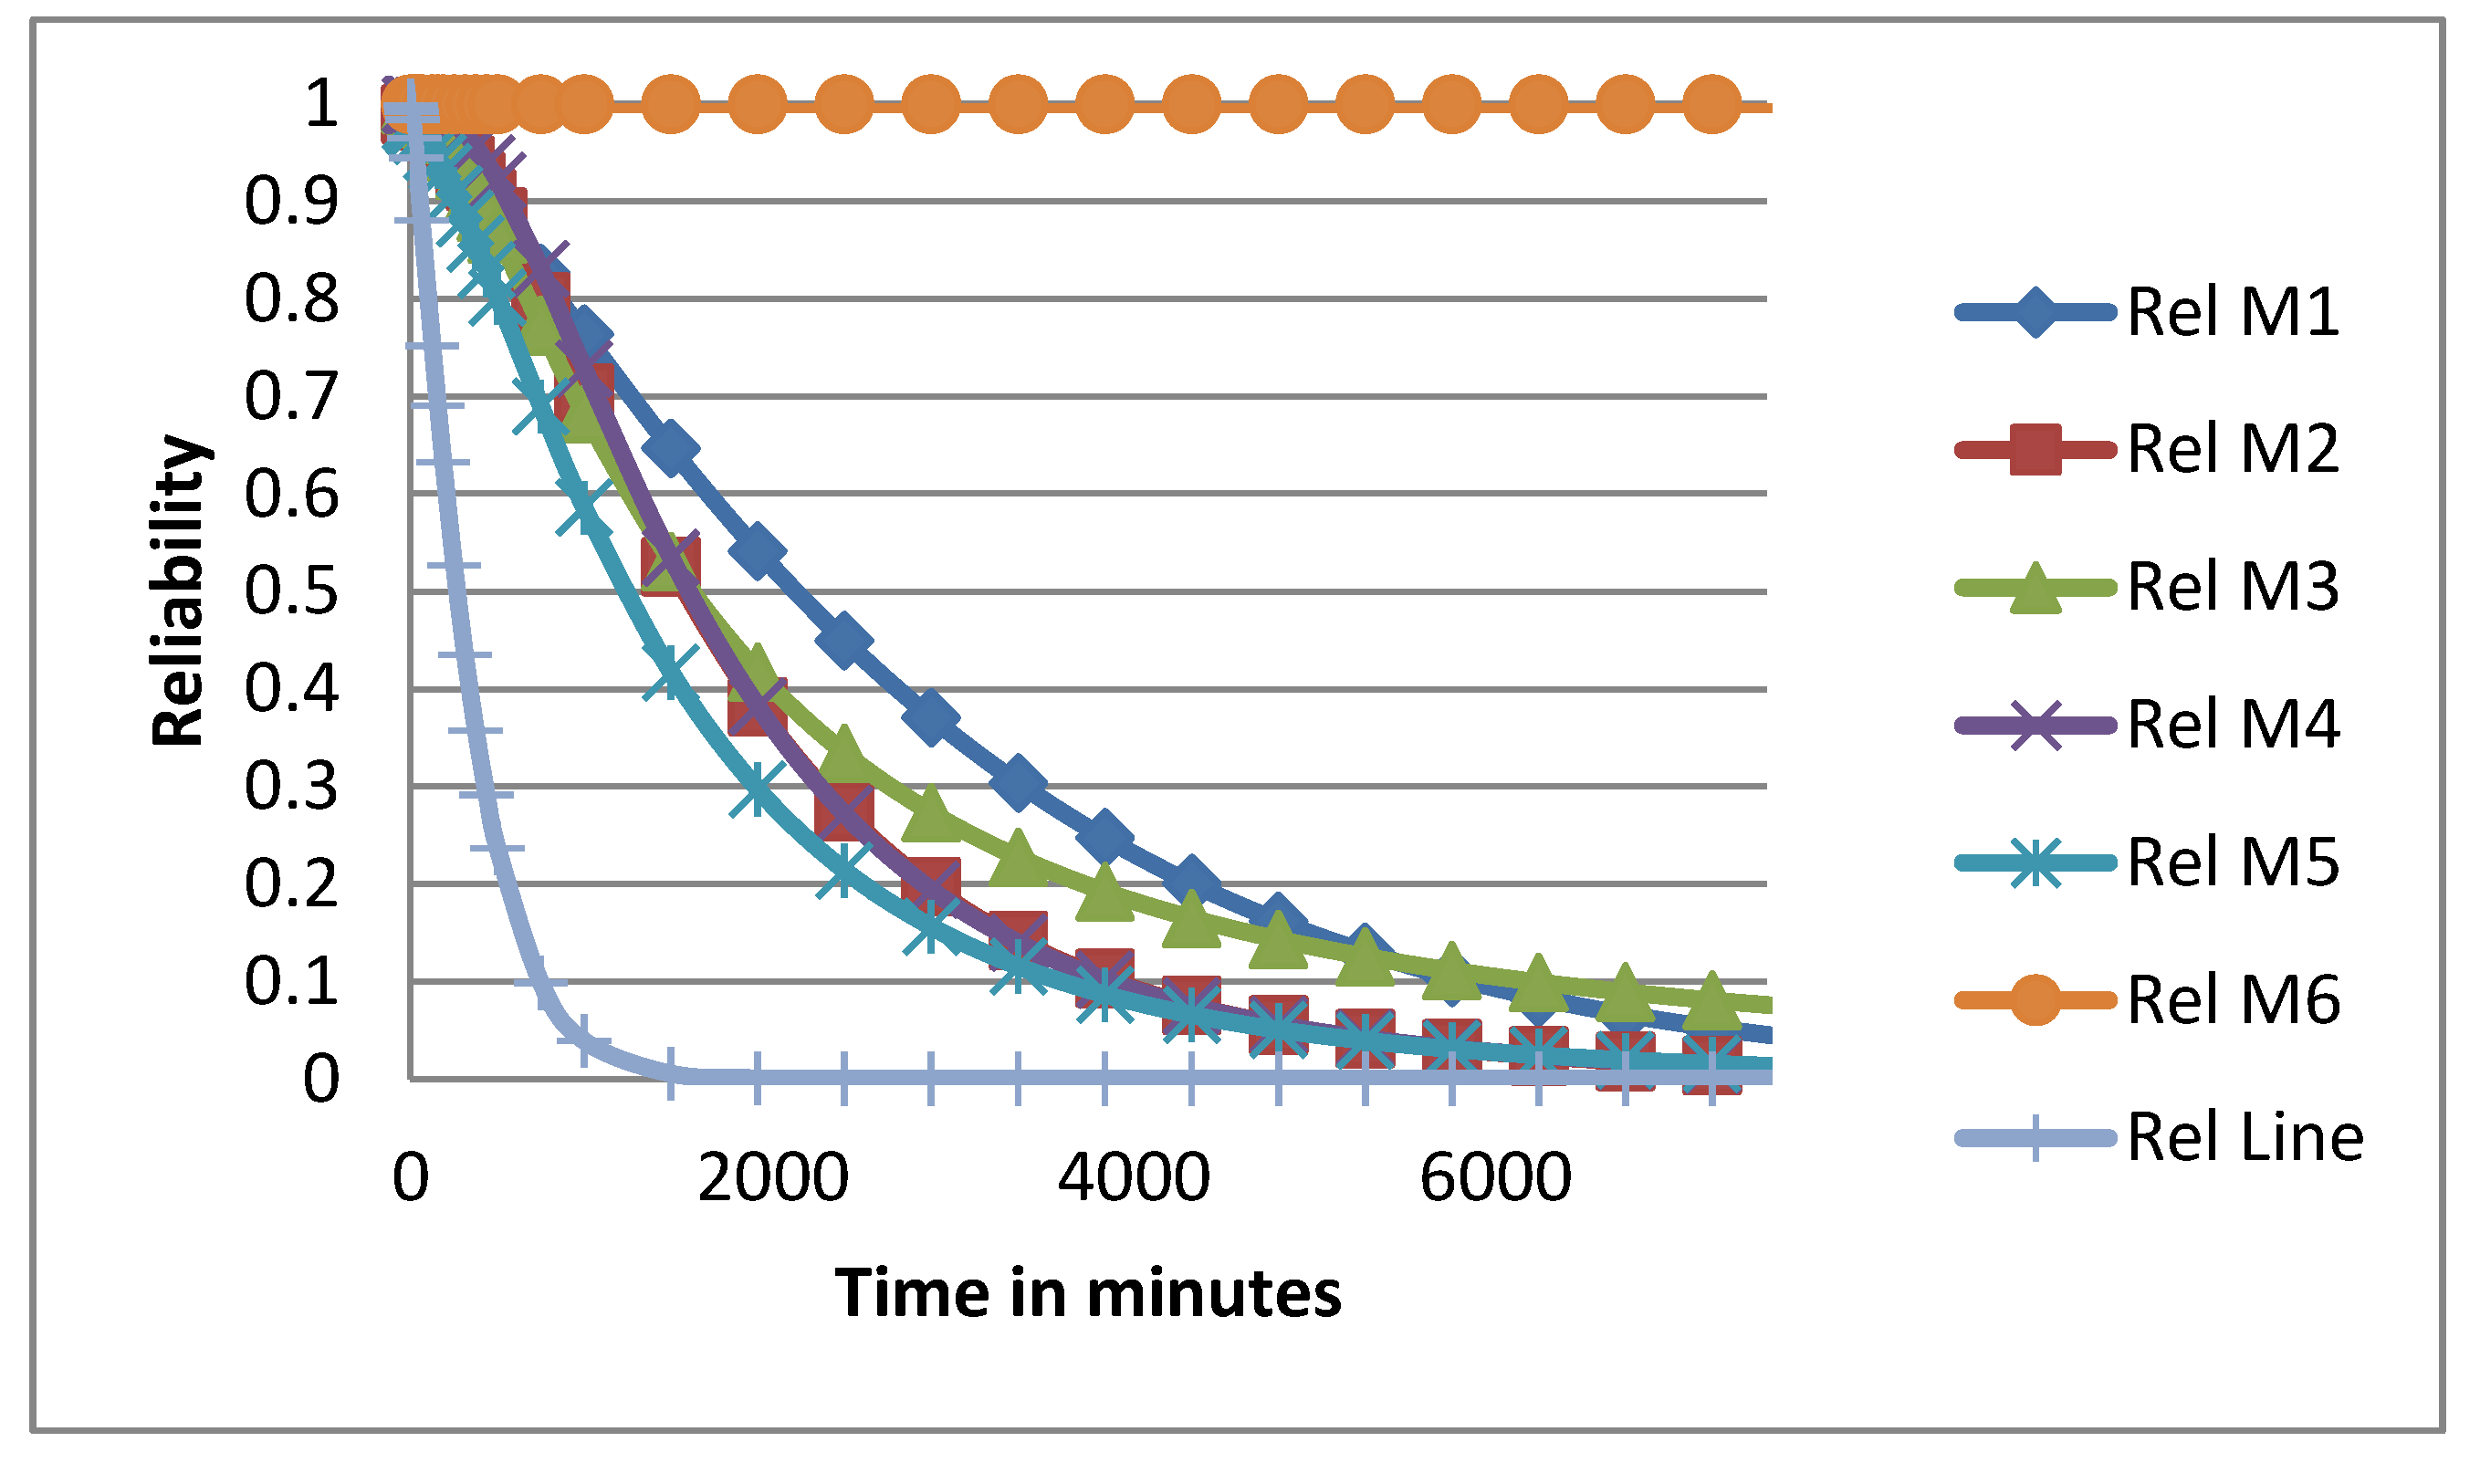
Table 5 depicts the reliability of the complete system and each machine for various time periods, and the subsequent observations can be formulated: (a) the reliability of the manufacturing system, during the function of one hour is 88.06%, in 8 h (work period) or 480 min of function it is 23.65%, (b) the longest reliabilities are formulated at the pasteurization/homogenization machine (M1), and exogenous machine (M6), and (c) the shortest reliabilities are noted at the machine’s packaging machine (M5), and freezer tunnel (M4).
The reliability diagram of the complete manufacturing system and each machine is depicted in Figure 7. The subsequent observations can be formulated: (a) to accomplish a 75% reliability standard for the pasteurization/homogenization machine (M1), the maintenance has to be executed before 960 min or 16 hours or 2 shifts. In other words, for a 75% success in the reliability level of the M1, the maintenance staff should plan preventive maintenance immediately after two working days of operation. (b) For Rsyst (240) = 0.5270 meaning that the line shall not fail for 240 min of function with solely a 52.70% probability.
Maintainability is the possibility that a failed machine/component or complete manufacturing system will be reinstated to functional effectiveness during a time period when the restoration is carried out in accordance with the specified procedures [56], hence, it is the likelihood of restoration in a particular time period. In other words, maintainability is marked as a measurement of how readily a product can be maintained or repaired. Therefore, excellent maintainability of a product is going to expand the product’s serviceability and reparability, lessen the expense of maintenance, and guarantee that the product would meet requirements for its determined usage [57].
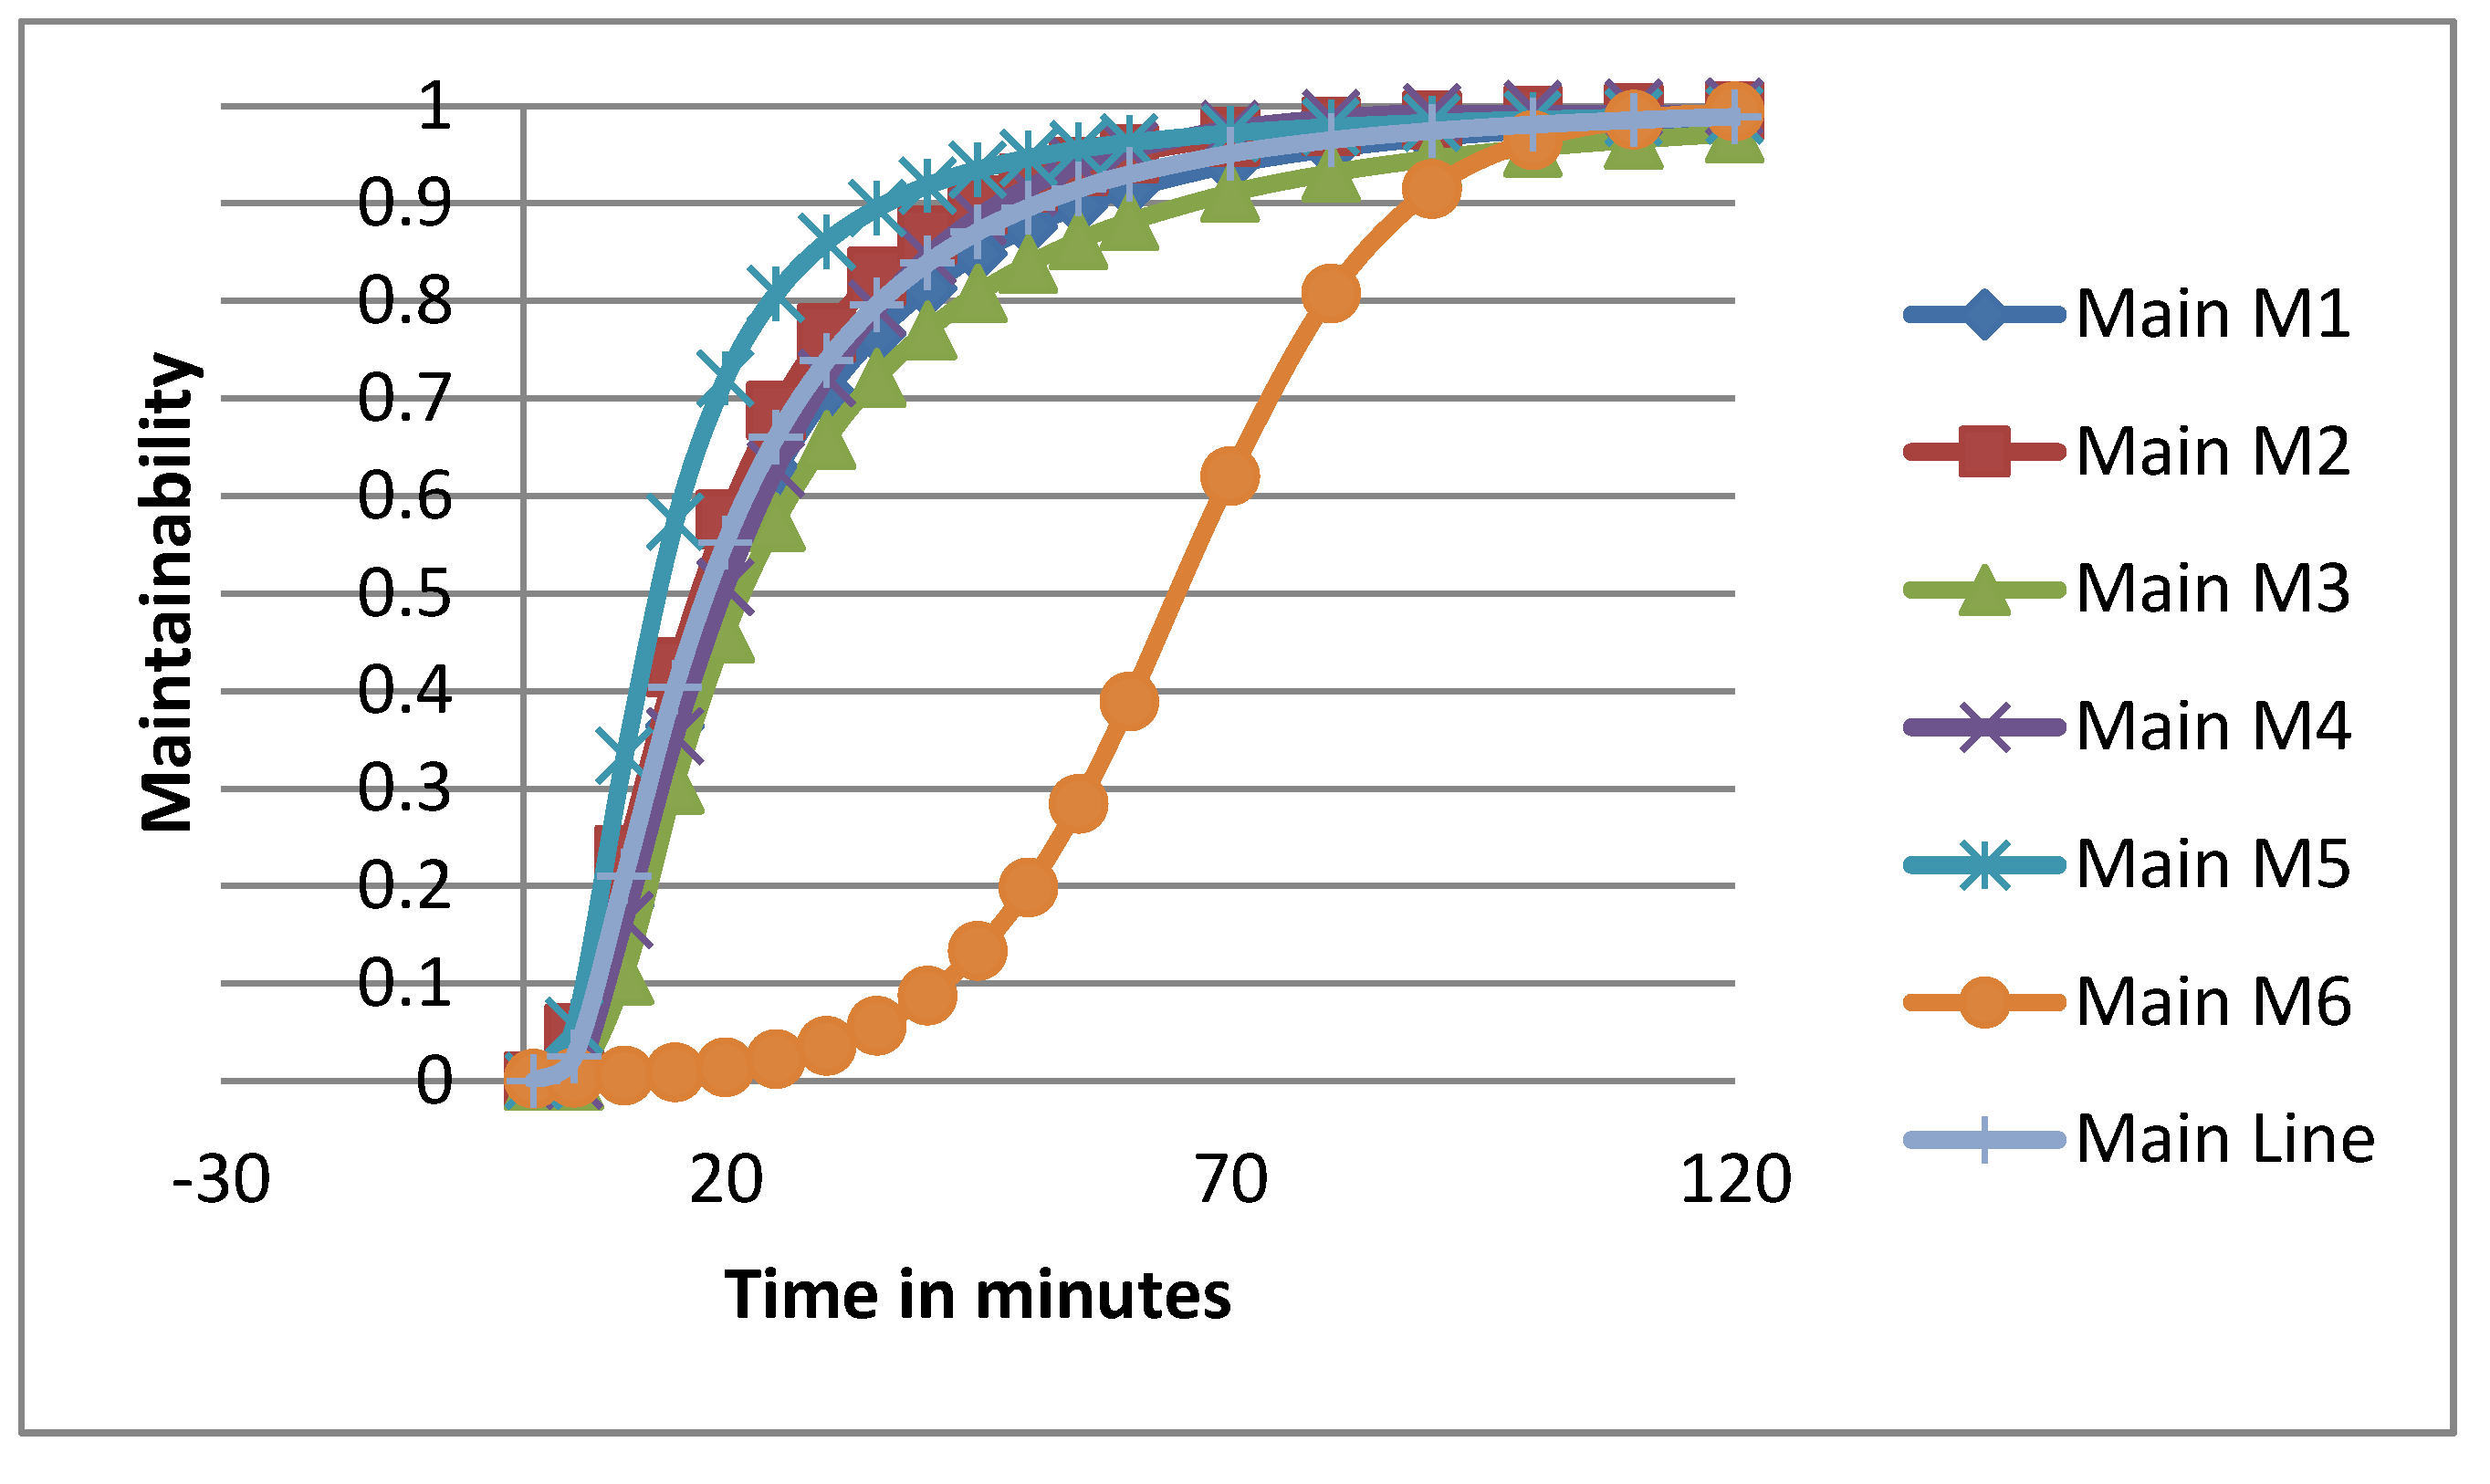
In Table 6, maintainability of the complete manufacturing system and each machine is estimated for various time periods, the subsequent observations can be made: (a) for Msyst (60) = 0.9298, meaning there is a 92.98% possibility that any malfunction in the ice cream system is going to be repaired in 60 min. (b) The shortest maintainabilities are noted at the exogenous machine (M6), and the ice cream machine (M3). The maintainability should be upgraded chiefly on those machines along with the complete manufacturing system. (c) A 100% possibility exists that any collapse in the ice cream production system shall be repaired in t > 150 min.
The maintainability of the ice cream manufacturing system and each machine is shown within the graph in Figure 8. Thus, the highest restoration with the anticipated maintainability can be estimated, that is to accomplish a 90% maintainability level throughout the packaging (M5), the restoration has to be executed in 35 min.
8. Conclusions
The chief research conclusions can be summed up below:
- The 3-parameter Weibull distribution supplied the utmost fit for the ice cream manufacturing system to present the TBFs, whereas the TTRs are 3-parameter lognormal distribution.
- The parameters for TBFs and TTRs of the ice cream manufacturing system and each machine were computed. Thus, the reliability and maintainability of the system can be predicted in short term time periods.
- The average TBF for the ice cream manufacturing system was 334.2 min, whereas the average TTR was 25.12 min.
- To enhance the reliability of the system, awareness must first be placed on the packaging (M5) and then on the freezer tunnel (M4). These machines’ significance is vital and their maintenance has to be thorough to prevent losses regarding efficiency, productivity, and quality.
- The maintainability has to be enhanced on the exogenous (M6), and also on the ice cream (M3), together with the complete ice cream manufacturing system.
- The reliability and maintainability for various time periods and the parameters of TBFs/TTRs of the ice cream manufacturing system and each machine are calculated.
- The TTR has an expanding repair rate reaching 10.5 min and then a lessening repair rate, signifying that if a repair procedure is not completed during the initial 10.5 min and continues for an extended time period, this suggests the existence critical trouble on the system, i.e., insufficient skill of technicians, inadequate management, restricted amount of maintenance personnel, limited spare part availability, and so on.
The outcome of the reliability and maintainability interpretation must be essential criticism for the design engineers and managers for the input to be incorporated for further improvement of the performance management and the maintenance policy of the ice cream manufacturing system i.e., spare parts management, maintenance strategy, lessening the delivery time to customers, etc. Moreover, the study provides genuine RAM modeling to assist manufacturers of ice cream machines, whose target is to optimize both the design as well as the function of their manufacturing systems at the highest reliability, therefore extending their performance, efficiency, and availability.
There are many implications for this case study: (a) in deciding the maintenance periods both in scheduling and managing the correct maintenance policy, we showed how the study of RAM is especially beneficial. (b) In order to allow production managers to proceed safely from the next steps and decisions in respect to machines’ operation, RAM characteristics have been computed to evaluate and optimize system performance. (c) The participation and cooperation for all levels of employees (operators, technicians, managers, etc.) in the RAM procedures was ensured. Moreover, this study offered encouragement for innovative thought of employees in order to meet the strategic goals of the organization.
Funding
This research received no external funding.
Acknowledgments
The author wishes to acknowledge financial support provided by the Research Committee of the Technological Education Institute of Central Macedonia Greece, under Grant No. SMF/LG/280319-126/010.
Conflicts of Interest
The authors declare no conflict of interest.
References
- Ahmad, R. Reliability analysis comparison on punching tool sets due to different maintenance decisions: A case study from the pulp manufacturing industry. Int. J. Adv. Manuf. Technol. 2018, 94, 1969–1979. [Google Scholar] [CrossRef]
- Darghouth, M.N.; Chelbi, A.; Ait-Kadi, D. Investigating reliability improvement of second-hand production equipment considering warranty and preventive maintenance strategies. Int. J. Prod. Res. 2017, 55, 4643–4661. [Google Scholar] [CrossRef]
- Mokhtari, H.; Mozdgir, A.; Abadi, I.N.K. A reliability/availability approach to joint production and maintenance scheduling with multiple preventive maintenance services. Int. J. Prod. Res. 2012, 50, 5906–5925. [Google Scholar] [CrossRef]
- Block, J.; Ahmadi, A.; Kumar, U. Fleet-level reliability of multiple repairable units: A parametric approach using the power law process. Int. J. Perform. Eng. 2014, 10, 239–250. [Google Scholar]
- Garmabaki, A.H.S.; Ahmadi, A.; Block, J.; Pham, H.; Kumar, U. A reliability decision framework for multiple repairable units. Reliab. Eng. Syst. Saf. 2016, 150, 78–88. [Google Scholar] [CrossRef]
- Komal, S.P.; Kumar, S.D. RAM analysis of repairable industrial systems utilizing uncertain data. Appl. Soft Comput. 2010, 10, 1208–1221. [Google Scholar] [CrossRef]
- Rajpal, P.S.; Shishodia, K.S.; Sekhon, G.S. An artificial neural network for modeling reliability, availability and maintainability of a repairable system. Reliab. Eng. Syst. Saf. 2006, 91, 809–819. [Google Scholar] [CrossRef]
- Wang, J.; Hu, Y.; Li, J. Transient analysis to design buffer capacity in dairy filling and packing production lines. J. Food Eng. 2010, 98. [Google Scholar] [CrossRef]
- Hoseinie, S.H.; Ataei, M.; Khalokakaie, R.; Ghodrati, B.; Kumar, U. Reliability analysis of drum Shearer machine at mechanized longwall mines. J. Qual. Maint. Eng. 2012, 18, 98–119. [Google Scholar] [CrossRef]
- Morad, A.M.; Pourgol-Mohammad, M.; Sattarvand, J. Application of reliability-centered maintenance for productivity improvement of open pit mining equipment: Case study of Sungun Copper mine. J. Cent. South Univ. 2014, 21, 2372–2382. [Google Scholar] [CrossRef]
- Qiu, Q.; Cui, L. Reliability evaluation based on a dependent two-stage failure process with competing failures. Appl. Math. Model. 2018, 64, 699–712. [Google Scholar] [CrossRef]
- Rajiv, S.K.; Poja, S. Computing ram indices for reliable operation of production systems. Adv. Prod. Eng. Manag. 2012, 7, 245–254. [Google Scholar]
- Sharma, R.K.; Kumar, S. Performance modelling in critical engineering systems using RAM analysis. Reliab. Eng. Syst. Saf. 2008, 93, 891–897. [Google Scholar] [CrossRef]
- Eti, M.C.; Ogaji, S.O.T.; Probert, S.D. Reducing the cost of preventive maintenance (PM) through adopting a proactive reliability-focused culture. Appl. Energy 2006, 83, 1235–1248. [Google Scholar] [CrossRef] [Green Version]
- Williams, J.P. Predicting process systems. Hydrocarb. Eng. 2001, 6, 29–33. [Google Scholar]
- Herder, P.M.; van Luijk, J.A.; Bruijnooge, J. Industrial application of RAM modeling. Reliab. Eng. Syst. Saf. 2008, 93, 501–508. [Google Scholar] [CrossRef]
- Saraswat, S.; Yadava, G.S. An overview on reliability, availability, maintainability and supportability (RAMS) engineering. Int. J. Qual. Reliab. Manag. 2008, 25, 330–440. [Google Scholar] [CrossRef]
- Regattieri, A.; Manzini, R.; Battini, D. Estimating reliability characteristics in the presence of censored data: A case study in a light commercial vehicle manufacturing system. Reliab. Eng. Sys. Saf. 2010, 95, 1093–1102. [Google Scholar] [CrossRef]
- Ahmad, R.; Kamaruddin, S.; Azid, I.A.; Almanar, I.P. Failure analysis of machinery component by considering external factors and multiple failure modes—A case study in the processing industry. Eng. Fail. Anal. 2012, 25, 182–192. [Google Scholar] [CrossRef]
- Soltanali, H.; Rohani, A.; Tabasizadeh, M.; Mohammad HosseinAbbaspour-Fard, M.; Parida, A. Operational reliability evaluation-based maintenance planning for automotive production line. Qual. Technol. Quant. Manag. 2020, 17, 186–202. [Google Scholar] [CrossRef] [Green Version]
- Patil, S.S.; Bewoor, A.K. Reliability analysis of a steam boiler system by expert judgment method and best-fit failure model method: A new approach. Int. J. Qual. Reliab. Manag. 2020. [Google Scholar] [CrossRef]
- Żurek, J.; Małachowski, J.; Ziółkowski, J.; Szkutnik-Rogoz, J. Reliability analysis of technical means of transport. Appl. Sci. 2020, 10. [Google Scholar] [CrossRef]
- Zeng, Y.; Duan, R.; Huang, S.; Feng, T. Reliability analysis for complex systems based on generalized stochastic petri nets and EDA approach considering common cause failure. Eng. Comput. 2020, 37, 1513–1530. [Google Scholar] [CrossRef]
- Heredia-Zavoni, E.; Campos, D.; Ramırez, G. Reliability based assessment of deck elevations for offshore jacket platforms. J. Offshore Mech. Arct. Eng. 2004, 126, 331–336. [Google Scholar] [CrossRef]
- Bendell, T. An overview of collection, analysis, and application of reliability data in the process industries. IEEE Trans. Reliab. 1988, 37, 132–137. [Google Scholar] [CrossRef]
- Blischke, W.R.; Murthy, D.N.P. Case Studies in Reliability and Maintenance; John Wiley & Sons, Inc.: Hoboken, NJ, USA, 2003. [Google Scholar]
- Corvaro, F.; Giacchetta, G.; Marchetti, B.; Recanati, M. Reliability, Availability, Maintainability (RAM) study, on reciprocating compressors API 618. Petroleum 2017, 3, 266–272. [Google Scholar] [CrossRef]
- Tsarouhas, P. Improving operation of the croissant production line through overall equipment effectiveness (OEE): A case study. Int. J. Product. Perform. Manag. 2019, 68, 88–108. [Google Scholar] [CrossRef]
- Yazdi, M.; Soltanali, H. Knowledge acquisition development in failure diagnosis analysis as an interactive approach. Int. J. Interact. Des. Manuf. 2019, 13, 193–210. [Google Scholar] [CrossRef] [Green Version]
- Omoya, O.A.; Papadopoulou, K.A.; Lou, E. Reliability engineering application to pipeline design. Int. J. Qual. Reliab. Manag. 2019, 36, 1644–1662. [Google Scholar] [CrossRef]
- Patil, R.B. Integrated reliability and maintainability analysis of Computerized Numerical Control Turning Center considering the effects of human and organizational factors. J. Qual. Maint. Eng. 2020, 26, 87–103. [Google Scholar] [CrossRef]
- Tsarouhas, P. Reliability, availability and maintainability analysis of a bag production industry based on the Six Sigma DMAIC approach. Int. J. Lean Six Sigma 2020. [Google Scholar] [CrossRef]
- Zhang, X.; Jiang, G.; Zhang, H.; Yun, X.; Mei, X. Time-dependent reliability analysis of harmonic drive based on transient FEA and accelerated life test. Eng. Comput. 2020. [Google Scholar] [CrossRef]
- Jakkula, B.; Raj, M.G.; Murthy, C.S.N. Maintenance management of load haul dumper using reliability analysis. J. Qual. Maint. Eng. 2020, 26, 290–310. [Google Scholar] [CrossRef]
- Zhang, J.; Li, H.; Golizadeh, H.; Zhao, C.; Lyu, S.; Jin, R. Reliability evaluation index for the integrated supply chain utilising BIM and lean approaches. Eng. Constr. Archit. Manag. 2020, 27, 997–1038. [Google Scholar] [CrossRef]
- Percy, D.F.; Kobbacy, K.A.H.; Fawzi, B.B. Setting preventive maintenance schedules when data are sparse. Int. J. Prod. Econ. 1997, 51, 223–234. [Google Scholar] [CrossRef]
- Tsarouhas, P.H. Reliability, Availability, and Maintainability (RAM) analysis in food production lines: A review. Int. J. Food Sci. Technol. 2012, 47, 2243–2251. [Google Scholar] [CrossRef]
- Liberopoulos, G.; Tsarouhas, P. Reliability analysis of an automated pizza processing line. J. Food Eng. 2005, 69, 79–96. [Google Scholar] [CrossRef]
- Aggarwal, A.; Kumar, S.; Singh, V. Performance modeling of the skim milk powder production system of a dairy plant using RAMD analysis. Int. J. Qual. Reliab. Manag. 2015, 32, 167–181. [Google Scholar] [CrossRef]
- Tsarouhas, P.H. Performance evaluation of the croissant production line with reparable machines: A case study. J. Ind. Eng. Int. 2015, 11, 101–110. [Google Scholar] [CrossRef] [Green Version]
- Adebiyi, K.A.; Ojediran, J.O.; Oyenuga, O.A. An appraisal of maintenance practice in food industries in Nigeria. J. Food Eng. 2004, 62, 131–133. [Google Scholar] [CrossRef]
- Xie, X.; Li, J. Modeling, analysis and continuous improvement of food production systems: A case study at a meat shaving and packaging line. J. Food Eng. 2012, 113, 344–350. [Google Scholar] [CrossRef]
- Tsarouhas, P. Reliability, availability and maintainability (RAM) analysis for wine packaging production line. Int. J. Qual. Reliab. Manag. 2018, 35, 821–842. [Google Scholar] [CrossRef]
- Tsarouhas, P. Reliability, Availability and Maintainability-RAM analysis of Cake production lines: A case study. Int. J. Data Anal. Tech. Strateg. 2018, 10, 381–405. [Google Scholar] [CrossRef]
- Louit, D.M.; Pascual, R.; Jardine, A.K.S. A practical procedure for the selection of time-to-failure models based on the assessment of trends in maintenance data. Reliab. Eng. Syst. Saf. 2009, 94, 1618–1628. [Google Scholar] [CrossRef]
- Tsarouhas, P. Application of statistical approaches for analyzing the reliability and maintainability of food production lines: A case study of mozzarella cheese. In Mathematical and Statistical Methods in Food Science and Technology; Granato, D., Ares, G., Eds.; John Wiley & Sons, Inc.: Hoboken, NJ, USA, 2014; pp. 491–510. [Google Scholar]
- Barabady, J.; Kumar, U. Reliability analysis of mining equipment: A case study of a crushing plant at Jajarm Bauxite Mine in Iran. Reliab. Eng. Syst. Saf. 2008, 93, 647–653. [Google Scholar] [CrossRef]
- Patil, R.B.; Kothavale, B.S.; LaxmanYaduWaghmode, L.Y.; Joshi, S.G. Reliability analysis of CNC turning center based on the assessment of trends in maintenance data: A case study. Int. J. Qual. Reliab. Manag. 2017, 34, 1616–1638. [Google Scholar] [CrossRef]
- Vaurio, J.K. Identification of process and distribution c by testing monotonic and non-monotonic trends in failure intensities and hazard rates. Reliab. Eng. Syst. Saf. 1999, 64, 345–357. [Google Scholar] [CrossRef]
- Choudhary, D.; Tripathi, M.; Shankar, R. Reliability, availability and maintainability analysis of a cement plant: A case study. Int. J. Qual. Reliab. Manag. 2019, 36, 298–313. [Google Scholar] [CrossRef]
- Mohan, M.S.; Hopkinson, J.; Harte, F. Milk and ice cream processing. In Food processing: Principles and Applications, 2nd ed.; Clark, S., Jung, S., Lamsal, B., Eds.; Wiley Blackwell: Hoboken, NJ, USA, 2014; pp. 383–404. [Google Scholar]
- MIL-HDBK-189. Reliability Growth Management; ATTN: DRDCO-PT; Headquartes, US Army Communication Research and Development Command: Fort Monmouth, NJ, USA, 1981; pp. 87–89. [Google Scholar]
- Najafi, P.; Asoodar, M.A.; Marzban, A.; Hormozi, M.A. Reliability analysis of agricultural machinery: A case study of sugarcane chopper harvester. Agric. Eng. Int. CIGR J. 2015, 17, 158–165. [Google Scholar]
- Tortorella, M. Service reliability theory and engineering, II: Models and examples. Qual. Technol. Quant. Manag. 2005, 2, 17–37. [Google Scholar] [CrossRef]
- Cui, L.; Chen, Z.; Gao, H. Reliability for systems with self-healing effect under shock models. Qual. Technol. Quant. Manag. 2018, 15, 551–567. [Google Scholar] [CrossRef]
- Dhillon, B.S. Mining Equipment Reliability, Maintainability, and Safety; Springer Science & Business Media: Berlin/Heidelberg, Germany, 2008; pp. 164–168. [Google Scholar]
- Coulibaly, A.; Houssin, R.; Mutel, B. Maintainability and safety indicators at design stage for mechanical products. Comput. Ind. 2008, 59, 438–449. [Google Scholar] [CrossRef]
Figure 1.
Diagram of the production process for ice cream manufacturing system.

Figure 2.
Summary Report for time between failure-TBFand time to repaire-TTR (both recorded in minutes) for the ice cream manufacturing system, where (a) is the summery report for TBF, and (b) is the summery report for TTR.
Figure 2.
Summary Report for time between failure-TBFand time to repaire-TTR (both recorded in minutes) for the ice cream manufacturing system, where (a) is the summery report for TBF, and (b) is the summery report for TTR.

Figure 3.
Diagram of the failure data for the ice cream manufacturing system.

Figure 4.
Box plots for TBF and TTR of the machines and the ice creammanufacturing system, where (a) is the boxplot for TBF, and (b) is thethe boxplot for TTR. (*) indicate the smallest statistic value.
Figure 4.
Box plots for TBF and TTR of the machines and the ice creammanufacturing system, where (a) is the boxplot for TBF, and (b) is thethe boxplot for TTR. (*) indicate the smallest statistic value.

Figure 5.
The TBFs and TTRs for the ice creammanufacturing system, i.e. (a) is the autocorrelation function for TBF for M2, (b) is the autocorrelation function for TBF for M3, (c) is the autocorrelation function for TBF for M4, (d) is the autocorrelation function for TBF for M5, (e) is the autocorrelation function for TBF at line level, (f) is the autocorrelation function for TTR for M1, (g) is the autocorrelation function for TTR for M2, (h) is the autocorrelation function for TTR for M3, (i) is the autocorrelation function for TTR for M4, (j) is the autocorrelation function for TTR for M5, (k) is the autocorrelation function for TTR for M6, and (l) is the autocorrelation function for TTR at line level.


Figure 6.
Probability density function, survival function, and hazard function TBF (a) and TTR (b) of the entire line are shown graphically in conjunction with the appropriate distributions andtheir statistics.
Figure 6.
Probability density function, survival function, and hazard function TBF (a) and TTR (b) of the entire line are shown graphically in conjunction with the appropriate distributions andtheir statistics.

Figure 7.
Diagram at machine and the entire ice cream manufacturing system level.

Figure 8.
Maintainability diagram at machine and the entire ice cream manufacturing system level.


Table 1.
Descriptive statistics for the machines and the entire line level of the ice cream manufacturing system.
Table 1.
Descriptive statistics for the machines and the entire line level of the ice cream manufacturing system.
| Variable | Total Count | Mean | SD | CV | Minimum | Maximum | Skewness | Kurtosis |
|---|---|---|---|---|---|---|---|---|
| TBF M1 | 123 | 1343 | 1376 | 1.0246 | 10 | 8332 | 2.29 | 7.03 |
| TBF M2 | 87 | 1914 | 1532 | 0.8006 | 57 | 8948 | 1.75 | 4.66 |
| TBF M3 | 70 | 2376 | 2242 | 0.9437 | 2 | 9460 | 1.49 | 1.65 |
| TBF M4 | 85 | 1958 | 1531 | 0.7818 | 70 | 8150 | 1.70 | 3.28 |
| TBF M5 | 102 | 1634 | 1443 | 0.8831 | 1 | 7410 | 1.57 | 3.37 |
| TBF M6 | 7 | 24,018 | 34,553 | 1.4386 | 2360 | 98,480 | 2.18 | 4.86 |
| TBF Line | 469 | 334.2 | 257.5 | 0.7704 | 1.0 | 1350.0 | 0.88 | 0.54 |
| TTR M1 | 122 | 27.22 | 23.62 | 0.8678 | 4.00 | 137.00 | 2.43 | 7.81 |
| TTR M2 | 86 | 22.95 | 20.16 | 0.8783 | 5.00 | 156.00 | 3.59 | 21.41 |
| TTR M3 | 69 | 31.71 | 27.46 | 0.8658 | 7.00 | 146.00 | 2.03 | 4.61 |
| TTR M4 | 84 | 24.57 | 16.00 | 0.6512 | 6.00 | 80.00 | 1.19 | 1.34 |
| TTR M5 | 101 | 18.35 | 16.49 | 0.8988 | 3.00 | 87.00 | 2.58 | 7.47 |
| TTR M6 | 6 | 59.50 | 24.31 | 0.4086 | 11.00 | 76.00 | −2.22 | 5.06 |
| TTR Line | 468 | 25.12 | 21.73 | 0.8648 | 3.00 | 156.00 | 2.44 | 8.45 |
Table 2.
TBFs and TTRs of the ice cream manufacturing system.
| T | B | F | T | T | R | |||
|---|---|---|---|---|---|---|---|---|
| Variable | Degree of freedom | Calculated Statistic U | χ2 with 2(n − 1) | Rejection of H0 at 5% level of significance | Degree of freedom | Calculated Statistic U | χ2 with 2(n − 1) | Rejection of H0 at 5% level of significance |
| M1 | 244 | 205.35 | 208.84 | Rejected (Not-iid) | 242 | 245.96 | 206.99 | Not rejected (iid) |
| M2 | 172 | 156.64 | 142.67 | Not rejected (iid) | 170 | 196.58 | 140.85 | Not rejected (iid) |
| M3 | 138 | 143.09 | 111.86 | Not rejected (iid) | 136 | 146.72 | 110.06 | Not rejected (iid) |
| M4 | 168 | 186.75 | 139.07 | Not rejected (iid) | 166 | 168.96 | 137.21 | Not rejected (iid) |
| M5 | 202 | 287.08 | 170.11 | Not rejected (iid) | 200 | 214.88 | 168.28 | Not rejected (iid) |
| M6 | 12 | 3.11 | 6.23 | Rejected (Not-iid) | 10 | 7.97 | 3.94 | Not rejected (iid) |
| LINE | 936 | 977.63 | 865.99 | Not rejected (iid) | 934 | 1038.51 | 864.06 | Not rejected (iid) |
Table 3.
The Anderson–Darling statistics for TBF and TTR at machine and line level. The smaller the statistic value. the better the model fitting (i.e., in column of M2 for TBF the lowest value is 0.399 which belongs to the 3-parameter lognormal distribution).
Table 3.
The Anderson–Darling statistics for TBF and TTR at machine and line level. The smaller the statistic value. the better the model fitting (i.e., in column of M2 for TBF the lowest value is 0.399 which belongs to the 3-parameter lognormal distribution).
| T | B | F | |||||
| Distribution | M1 | M2 | M3 | M4 | M5 | M6 | Line |
| Weibull | - | 0.425 | 0.682 | 0.881 | 0.624 | - | 4.347 |
| Lognormal | - | 1.771 | 1.217 | 0.429 | 3.839 | - | 16.91 |
| Exponential | - | 2.338 | 0.802 | 3.644 | 0.873 | - | 7.217 |
| Loglogistic | - | 0.907 | 0.486 * | 0.345 | 1.531 | - | 11.44 |
| 3-Parameter Weibull | - | 0.525 | 0.682 | 0.77 | 0.599 | - | 4.239 * |
| 3-Parameter Lognormal | - | 0.399 * | 0.487 | 0.335 * | 0.542 * | - | 4.7 |
| 2-Parameter Exponential | - | 2.017 | 0.930 | 3.116 | 0.904 | - | 7.203 |
| 3-Parameter Loglogistic | - | 0.422 | 0.513 | 0.349 | 0.627 | - | 5.642 |
| Smallest Extreme Value | - | 7.627 | 6.412 | 7.909 | 7.969 | - | 20.43 |
| Normal | - | 2.739 | 4.146 | 3.974 | 3.425 | - | 7.085 |
| Logistic | - | 1.719 | 3.292 | 2.62 | 2.746 | - | 5.66 |
| T | T | R | |||||
| Distribution | M1 | M2 | M3 | M4 | M5 | M6 | Line |
| Weibull | 2.07 | 1.212 | 2.084 | 1.33 | 2.998 | 3.086 | 7.088 |
| Lognormal | 0.938 | 1.015 * | 1.053 | 1.005 | 0.801 | 3.105 | 1.729 |
| Exponential | 5.202 | 3.776 | 3.526 | 5.943 | 5.819 | 3.329 | 18.81 |
| Loglogistic | 1.185 | 1.121 | 1.138 | 1.149 | 0.776 | 2.698 | 2.501 |
| 3-Parameter Weibull | 0.936 | 1.513 | 0.755 | 0.618 * | 1.472 | 2.695 | 3.058 |
| 3-Parameter Lognormal | 0.832 * | 1.262 | 0.622 * | 0.884 | 0.591 | 2.839 | 1.119 * |
| 2-Parameter Exponential | 1.317 | 1.281 | 0.832 | 0.895 | 1.913 | 3.318 | 5.683 |
| 3-Parameter Loglogistic | 0.985 | 1.436 | 0.630 | 0.932 | 0.585 * | 2.436 * | 1.692 |
| Smallest Extreme Value | 15.281 | 13.35 | 8.133 | 5.161 | 14.75 | 2.697 | 58.28 |
| Normal | 6.904 | 4.02 | 5.093 | 2.85 | 8.442 | 2.839 | 26.02 |
| Logistic | 4.195 | 2.553 | 3.844 | 2.635 | 4.713 | 2.437 | 16.4 |
There are no values for the Μ1 and M6 of TBF due to they are follows the PLP. (*) indicate the smallest statistic value.
Table 4.
Estimation of parameters for TBF and TTR at machine and line level.
| T | B | F | ||
| Distribution | Shape Parameter | Scale Parameter | Threshold Parameter | |
| M1 | PLP | 1.188240 | 2,897.780 | |
| M2 | 3-Parameter Lognormal | 7.605470 | 0.608045 | −492.123 |
| M3 | Loglogistic | 7.349810 | 0.629060 | - |
| M4 | 3-Parameter Lognormal | 7.461030 | 0.662900 | −202.097 |
| M5 | 3-Parameter Lognormal | 7.316650 | 0.745964 | −319.530 |
| M6 | PLP | 3.854810 | 105,624.00 | - |
| Line | 3-Parameter Weibull | 1.172200 | 351.7110 | −0.504266 |
| T | T | R | ||
| Distribution | Shape Parameter | Scale Parameter | Threshold Parameter | |
| M1 | 3-Parameter Lognormal | 2.845020 | 0.881735 | 2.326200 |
| M2 | Lognormal | 2.851880 | 0.751212 | - |
| M3 | 3-Parameter Lognormal | 2.783340 | 1.027960 | 5.460160 |
| M4 | 3-Parameter Weibull | 1.099800 | 19.270200 | 5.942560 |
| M5 | 3-Parameter Loglogistic | 2.371370 | 0.517507 | 2.513060 |
| M6 | 3-Parameter Loglogistic | 8.940480 | 0.001388 | −7570.100 |
| Line | 3-Parameter Lognormal | 2.768580 | 0.874643 | 2.122030 |
Table 5.
Reliability at machine and the entire ice cream level for different time intervals.
| Time | Rel M1 | Rel M2 | Rel M3 | Rel M4 | Rel M5 | Rel M6 | Rel Line |
|---|---|---|---|---|---|---|---|
| 1 | 0.999923 | 0.989562 | 0.999992 | 0.999401 | 0.980932 | 1 | 0.998329 |
| 5 | 0.999479 | 0.989189 | 0.999891 | 0.999336 | 0.980146 | 1 | 0.992380 |
| 10 | 0.998814 | 0.988710 | 0.999672 | 0.999248 | 0.979138 | 1 | 0.983816 |
| 20 | 0.997299 | 0.987713 | 0.999015 | 0.999047 | 0.977044 | 1 | 0.964895 |
| 30 | 0.995630 | 0.986662 | 0.998125 | 0.998809 | 0.974843 | 1 | 0.944661 |
| 60 | 0.990070 | 0.983180 | 0.994376 | 0.997845 | 0.967619 | 1 | 0.880690 |
| 120 | 0.977516 | 0.974690 | 0.983263 | 0.994515 | 0.950543 | 1 | 0.752079 |
| 150 | 0.970790 | 0.969672 | 0.976305 | 0.992008 | 0.940813 | 1 | 0.690921 |
| 180 | 0.963853 | 0.964141 | 0.968589 | 0.988871 | 0.930377 | 1 | 0.632847 |
| 240 | 0.949500 | 0.951571 | 0.951264 | 0.980582 | 0.907671 | 1 | 0.527033 |
| 300 | 0.934677 | 0.937083 | 0.931925 | 0.969531 | 0.882975 | 1 | 0.435366 |
| 360 | 0.919528 | 0.920827 | 0.911074 | 0.955778 | 0.856805 | 1 | 0.357232 |
| 420 | 0.904151 | 0.902985 | 0.889119 | 0.939509 | 0.829615 | 1 | 0.291433 |
| 480 | 0.888621 | 0.883756 | 0.866400 | 0.920991 | 0.801800 | 1 | 0.236548 |
| 720 | 0.825988 | 0.797040 | 0.772932 | 0.830711 | 0.690115 | 1 | 0.098487 |
| 960 | 0.764079 | 0.703326 | 0.683006 | 0.728410 | 0.586173 | 1 | 0.038902 |
| 1440 | 0.646851 | 0.525635 | 0.530727 | 0.534443 | 0.417098 | 1 | 0.005401 |
| 1920 | 0.541628 | 0.381853 | 0.417205 | 0.381940 | 0.297124 | 1 | 0.000666 |
| 2400 | 0.449621 | 0.274557 | 0.334259 | 0.271595 | 0.213885 | 1 | 7.48 × 10⁻⁵ |
| 2880 | 0.370570 | 0.197212 | 0.273127 | 0.193965 | 0.156029 | 0.999999 | 7.78 × 10⁻⁶ |
| 3360 | 0.303533 | 0.142199 | 0.227257 | 0.139689 | 0.115401 | 0.999998 | 7.58 × 10⁻⁷ |
| 3840 | 0.247271 | 0.103183 | 0.192145 | 0.101612 | 0.086493 | 0.999997 | 6.96 × 10⁻⁸ |
| 4320 | 0.200454 | 0.075438 | 0.164740 | 0.074694 | 0.065640 | 0.999996 | 6.07 × 10⁻⁹ |
| 4800 | 0.161780 | 0.055601 | 0.142967 | 0.055482 | 0.050394 | 0.999993 | 5.05 × 10⁻¹⁰ |
| 5280 | 0.130036 | 0.041317 | 0.125388 | 0.041628 | 0.039103 | 0.999990 | 4.02 × 10⁻¹¹ |
| 5760 | 0.104127 | 0.030953 | 0.110988 | 0.031534 | 0.030642 | 0.999987 | 3.08 × 10⁻¹² |
| 6240 | 0.083088 | 0.023371 | 0.099040 | 0.024104 | 0.024230 | 0.999982 | 2.27 × 10⁻¹³ |
| 6720 | 0.066081 | 0.017781 | 0.089013 | 0.018583 | 0.019321 | 0.999976 | 1.61 × 10⁻¹⁴ |
| 7200 | 0.052393 | 0.013627 | 0.080512 | 0.014442 | 0.015526 | 0.999968 | 1.11 × 10⁻¹⁵ |
| 7680 | 0.041419 | 0.010516 | 0.073236 | 0.011308 | 0.012566 | 0.999959 | 1.11 × 10⁻¹⁶ |
Table 6.
Maintainability at machine and the entire ice cream level for different time intervals.
| Time | Main M1 | Main M2 | Main M3 | Main M4 | Main M5 | Main M6 | Main Line |
|---|---|---|---|---|---|---|---|
| 1 | 0 | 7.34168 × 10⁻⁵ | 0 | 0 | 0 | 0.002366 | 0 |
| 5 | 0.017378 | 0.049072825 | 0 | 0 | 0.056156 | 0.003458 | 0.025186 |
| 10 | 0.17997 | 0.232326638 | 0.10825 | 0.164926 | 0.333547 | 0.005551 | 0.21027 |
| 15 | 0.364499 | 0.424083202 | 0.303798 | 0.353324 | 0.573526 | 0.008897 | 0.403769 |
| 20 | 0.512242 | 0.575932489 | 0.458761 | 0.506822 | 0.720513 | 0.014226 | 0.552297 |
| 25 | 0.622948 | 0.687417395 | 0.57298 | 0.627628 | 0.807361 | 0.022666 | 0.660349 |
| 30 | 0.705138 | 0.767685595 | 0.657486 | 0.720954 | 0.860676 | 0.035921 | 0.738721 |
| 35 | 0.766571 | 0.825478888 | 0.721065 | 0.792159 | 0.895094 | 0.056463 | 0.796169 |
| 40 | 0.813023 | 0.867403986 | 0.769782 | 0.845987 | 0.918376 | 0.08766 | 0.838882 |
| 45 | 0.848595 | 0.898134568 | 0.807753 | 0.886379 | 0.934773 | 0.133614 | 0.871105 |
| 50 | 0.876177 | 0.92091421 | 0.837806 | 0.916506 | 0.946719 | 0.198371 | 0.895757 |
| 55 | 0.897815 | 0.937990713 | 0.861919 | 0.93886 | 0.955675 | 0.284154 | 0.91486 |
| 60 | 0.914975 | 0.950931245 | 0.8815 | 0.955372 | 0.962554 | 0.388957 | 0.929841 |
| 70 | 0.939835 | 0.968497295 | 0.910895 | 0.976424 | 0.972256 | 0.620547 | 0.951222 |
| 80 | 0.956339 | 0.97917036 | 0.931416 | 0.98767 | 0.978618 | 0.807556 | 0.965157 |
| 90 | 0.967629 | 0.985871451 | 0.946179 | 0.993608 | 0.983012 | 0.914925 | 0.974535 |
| 100 | 0.975554 | 0.990200892 | 0.957069 | 0.996713 | 0.986174 | 0.964946 | 0.98102 |
| 110 | 0.981241 | 0.993069151 | 0.965273 | 0.998321 | 0.988524 | 0.985989 | 0.985611 |
| 120 | 0.985401 | 0.995011933 | 0.971566 | 0.999148 | 0.990319 | 0.994466 | 0.988927 |
| 150 | 0.992623 | 0.997971529 | 0.98344 | 0.999892 | 0.99374 | 0.999663 | 0.994569 |
| 180 | 0.995953 | 0.999084641 | 0.989669 | 0.999987 | 0.995615 | 0.999979 | 0.997095 |
| 210 | 0.997636 | 0.999552494 | 0.993214 | 0.999998 | 0.996753 | 0.999999 | 0.99834 |
| 240 | 0.99855 | 0.999766812 | 0.99536 | 1 | 0.997497 | 1 | 0.999001 |
© 2020 by the author. Licensee MDPI, Basel, Switzerland. This article is an open access article distributed under the terms and conditions of the Creative Commons Attribution (CC BY) license (http://creativecommons.org/licenses/by/4.0/).
Share and Cite
MDPI and ACS Style
Tsarouhas, P. Reliability, Availability, and Maintainability (RAM) Study of an Ice Cream Industry. Appl. Sci. 2020, 10, 4265. https://doi.org/10.3390/app10124265
AMA Style
Tsarouhas P. Reliability, Availability, and Maintainability (RAM) Study of an Ice Cream Industry. Applied Sciences. 2020; 10(12):4265. https://doi.org/10.3390/app10124265
Chicago/Turabian StyleTsarouhas, Panagiotis. 2020. "Reliability, Availability, and Maintainability (RAM) Study of an Ice Cream Industry" Applied Sciences 10, no. 12: 4265. https://doi.org/10.3390/app10124265
Note that from the first issue of 2016, this journal uses article numbers instead of page numbers. See further details here.