Article

The Hemodynamics of Aneurysms Treated with Flow-Diverting Stents Considering both Stent and Aneurysm/Artery Geometries

1
Department of Engineering, Public University of Navarra, Campus Arrosadía s/n, E-31006 Pamplona, Spain
2
Department of Mechanical Engineering, College of Engineering, University of Saskatchewan, Engineering Building 57, Campus Drive, Saskatoon, SK S7N 5A9, Canada
3
Division of Neurosurgery, Department of Surgery, College of Medicine, University of Saskatchewan, Royal University Hospital 107 Wiggins Road, Suite B419 Health Science Building, Saskatoon, SK S7N 5E5, Canada
4
Division of Biomedical Engineering, College of Engineering, University of Saskatchewan, Engineering Building 57, Campus Drive, Saskatoon, SK S7N 5A9, Canada
5
CIBER-BBN, Research Networking in Bioengineering, Biomaterials & Nanomedicine, C/Mariano Esquillor s/n, E-50018 Zaragoza, Spain
*
Author to whom correspondence should be addressed.
Appl. Sci. 2020, 10(15), 5239; https://doi.org/10.3390/app10155239
Submission received: 15 June 2020 / Revised: 21 July 2020 / Accepted: 22 July 2020 / Published: 29 July 2020
(This article belongs to the Special Issue Dynamic Models of Biology and Medicine, Volume II)

Abstract

:
Flow diverting stents are deployed to reduce the blood flow into the aneurysm, which would thereby induce thrombosis in the aneurysm sac; the stents prevent its rupture. The present study aimed to examine and quantify the impacts of different flow stents on idealized configurations of the cerebral artery. In our study, we considered a spherical sidewall aneurysm located on curved and tortuous idealized artery vessels and three stents with different porosities (70, 80 and 90%) for deployment. Using computational fluid dynamics, the local hemodynamics in the presence and absence of the stents were simulated, respectively, under the assumption that the blood flow was unsteady and non-Newtonian. The hemodynamic parameters, such as the intra-aneurysmal flow, velocity field and wall shear stress and its related indices, were examined and compared among the 12 cases simulated. The results illustrated that with the stent deployment, the intra-aneurysmal flow and the wall shear stress and its related indices were considerably modified depending on both stent and aneurysm/artery geometries, and that the intra-aneurysmal relative residence time increased rapidly with decreasing stent porosity in all the vessel configurations. These results also inform the rationale for selecting stents for treating aneurysms of different configurations.

Graphical Abstract

1. Introduction

The cerebral aneurysm is a potentially deadly degenerative vascular disease that can initially be asymptomatic. The physical processes that cause its formation are still being investigated, but many studies in this field have highlighted the importance of the local hemodynamics on the development of the aneurysm once it is present in a cerebral vessel [1,2,3,4]. Due to local blood recirculation, the aneurysmatic sac may rupture, leading to high rates of morbidity and mortality [5]. It is estimated that 8 % of all strokes are caused by ruptured aneurysms [6].
So-called flow diverting stents (FDSs) can be placed inside a cerebral artery for the prevention of aneurysm rupture using a minimally invasive procedure. They are currently considered a promising alternative to traditional methods, such as coiling and clipping [6]. The FDS induces a flow reduction within the aneurysmatic sac, promoting a progressive aneurysm thrombosis in most patients. Slow blood flow recirculating inside the sac may lead to aneurysm occlusion if the necessary changes to the hemodynamics occur. Knowledge of the hemodynamics is crucial to planing an effective treatment and improving the designs of FDSs [7,8,9,10], but unfortunately, they are still not fully understood. For that reason, this topic has been attracting significant interest from the scientific community and it is generally accepted that the success of a FDS procedure depends mainly on the induced hemodynamics [11,12]. In particular, the porosity of the device is recognized to have a significant role in the flow reduction and in the rigidity of the stent. A lower porosity promotes flow reduction within the aneurysmatic sac but it also leads to a high rigidity of the stent structure. In contrast, a device with a higher porosity is less effective at limiting flow into the aneurysm, but it is more flexible and can better adapt to the tortuous cerebral vessels [13]. In general, the evolution of new FDS technology has largely extended the usefulness of endovascular therapy. Innovative devices with better combinations of porosity and flexibility have been introduced with variable degrees of success [14,15]. Moreover, the role of the design of a FDS in determining the effectiveness of the endovascular therapy is now well established [16].
Computational fluid dynamics (CFD) have been used to study the reduction of flow within the aneurysmatic sac, analyze a number of hemodynamics indices as functions of different stent designs and determine the influences of the strut shape and size [2,13,17,18]. The design of the stent has been analyzed within patient-specific cerebral vessel models by several authors [11,19,20,21,22,23,24,25]. On the contrary, idealized models have also been frequently used for assessing the influences of the vessel geometry, aneurysm size and location on the effectiveness of the treatment [6,13,26,27,28,29]. Notwithstanding the extensive work that has been performed over previous decades, [19,25,30] the real relationship between the indices local hemodynamics and clinical outcomes is still unclear. Treatment with FDS has been reported to be capable of promoting complete aneurysm occlusion in the majority of cases, but long term patency and delayed ruptures have also been reported as consequences [31]. The results summarized by Lieber and coworkers [16] from about 20 flow studies on idealized, in vivo, and patient-specific geometries suggest a spectrum of flow diversion responses. Flow diversion reduces the intraneurysmal flow activity in idealized/simplified sidewall-type geometries by about 75–95%, by about 20–40% in bifurcation-type geometries and by around 60% in in vivo aneurysms. Reduction in the intraneurysmal flow activity in clinical cases is 20–30% in bifurcation geometries and around 80–90% in sidewall geometries.
The specific geometric configuration of the cerebral arteries influences the blood flow after stent placement [6], and the intra-aneurysmal hemodynamics also vary due to the vascular deformation induced by the presence of such a device [32,33]. Consequently, the hemodynamics properties used to describe the flow within the artery also change [33]. Since these indices are very important for predicting aneurysm rupture and stent performance [34], their evaluation is critical for assessing the effectiveness of the treatment.
In the literature, a considerable number of studies using idealized and patient-specific models have been published in recent years. However, how the geometry of the artery affects the stent efficiency is still unclear and it is investigated in this study. The aim of the present work is the systematic analysis of the effects of different stent designs on the hemodynamic environment within a sidewall aneurysm considering different idealized geometries. In order to quantify the influence of implants on the hemodynamics, the present numerical study considers an idealized sidewall aneurysm with three different arterial configurations, two curved and one tortuous, resulting in a total number of 12 different models. The impacts of three different stents with different porosities are investigated to obtain a quantitative understanding of the aneurysmal flow in these different models. For evaluating the stent-induced flow modifications, we consider a number of hemodynamic parameters that are recognized to play a central role, such as the intra-aneurysmal flow reduction and the wall shear stress (WSS)-derived indices. In particular, the relative residence time relative residence time (RRT) has been computed and quantified, as it has been recognized as especially suitable to quantify the tendency towards thrombus formation [6,35,36,37], although it is rarely used for evaluating the stenting efficiency.

2. Materials and Methods

2.1. Idealized Aneurysm Model under Different Geometrical Configurations

The cerebral artery considered in this work is an idealized vessel in the presence of a balloon aneurysm. Since the blood flow within the aneurysm mainly depends on the geometry, we created a variety of geometrical configurations. In particular, three different configurations have been considered, as shown in Figure 1. The artery dimensions and the baseline straight configuration considered in this study are based on the geometry proposed by Kim et al. [13]. The geometrical features of this baseline model are depicted in Figure 1a).
All the geometries considered were created by means of the commercial package package SolidWorks ® (Dessault Systèmes, Vélizy-Villacoublay, France). In a similar way as performed in the literature [6,13], in order to simplify the model and eliminate patient variability but still remain close to physiological configurations of the aneurysmatic vessels, in the present work we built different geometries. They were geometrical modifications of the straight artery with a saccular aneurysm, as presented in [28]. Two bend configurations of the artery were obtained starting from the straight baseline configuration and then curving the vessel centerline in the vertical and lateral directions (V-bent and C-bent arteries, respectively), as can be seen in Figure 1. In both cases, the inner bend angle is approximately 70 [13]. Additionally, a complex bend (S-shaped) configuration of the artery was considered. The latter is composed of two bend configurations with an inner bend angle of 90 each (see Figure 1). The values of the selected angles have been chosen depending on the feasibility of the stented geometries. In fact, due to the presence of the stent, it is not necessarily possible to obtain certain degrees of bending.
Finally, note that the V-bent and C-bent configurations have the same artery and aneurysm geometries but different growth directions on the artery; the S-bent configuration has a different artery geometry from the V-bent and C-bent cases, but the same aneurysm geometry and the same growth direction on the artery.

2.2. FDS Geometries

The performances of three flow diverting stents with different designs and porosities were compared along with the different artery configurations. In particular, the typical T-screen and W-screen stents were compared with a recently designed stent of higher porosity [28] (X-screen). The three-dimensional geometries of the stents can be seen in Figure 1. The W-screen-based stent has rectangular cross-sectioned struts and is manufactured by laser-cutting of a thin-walled tube. It has a porosity of about 80 % . The T-screen-based stent is a round sectioned strut manufactured by double-helical woven wires, and has a porosity of about 70 % (see Figure 1). The newly designed stent has a zig-zag configuration (X-screen), manufactured with a strand diameter down to 0.4 mm; it was realized at the University of Saskatchewan [38]. It has porosity of about 90 % and was fabricated with the emerging dispensing-based rapid prototyping (DBRP) technique, which facilitates the fabrication of stents with excellent repeatability [38]. Hereafter, the three stents are named STENT 1 (X-screen), STENT 2 (W-screen) and STENT 3 (T-screen). Stent porosity was calculated by the percent ratio of the void surface to the total surface of the stent cylinder [13,28]. The three-dimensional geometries of the stents were created with the commercial package SolidWorks ® (see Figure 1). In a second stage, the stents were merged with the straight configuration of the artery that was finally curved and made tortuous using its centerline, as explained above. The three stents were generated to have the same length and external vessel diameter for the purposes of comparison. The main dimensions of the three stents are summarized in Table 1.
Finally, the geometries were exported as IGES files (Initial Graphics Exchange Specification) and imported into the commercial software package Ansys Inc., Version 16.0 (ANSYS Inc., Canonsburg, PA, USA) for creating the computational meshes and numerical models and performing the computations.

2.3. Summary of the Considered Cases

The simulations carried out in this work are summarized in Table 2. Each geometrical configuration included a simulation of the cerebral artery without a stent and with each of the three devices. As explained previously, the blood flow within the aneurysm mainly depends on the artery’s geometry [6]. As a consequence, it was crucial to consider a variety of geometrical configurations in order to generalize the findings. With this purpose, a total number of 12 simulations were systematically studied.

2.4. Numerical Discretization, Blood Rheology and Boundary Conditions

All geometries were imported into the commercial package IcemCFD, Version 16 (ANSYS Inc., Canonsburg, PA, USA) for the generation of body-conforming volumetric grids. The computational meshes were composed of tetrahedral elements.
IcemCFD creates computational grids utilizing user-specified parameters. In particular, the physical domain of each model was firstly reduced into a number of regions. Then, different mesh densities were used for each region: a finer mesh with smaller tetrahedral elements was used in the regions around the stent struts, due to their small dimensions. For ensuring a correct resolution of the velocity and hence a proper computation of the wall shear stress and its variables, the numerical mesh was refined near all walls. In addition, a grid independence study was carried out prior to performing the present simulations. Details can be found in a previous study [28] that was used as a basis for generating the numerical grids in the present work. The total number of mesh elements ranged from approximately 0.3 to 20 × 10 6 elements depending on the presence or not of the intravascular device and on the size of the stent. The final grids used in this study are summarized in the Table 3.
Unsteady CFD simulations for the 12 geometrical configurations considered were carried out using the commercial software Ansys CFX, Version 16.0 (Ansys Inc., Canonsburg, PA, USA). Blood flow was modeled as an incompressible and non-Newtonian fluid by means of the Carreau–Yasuda model. This model, among others, is largely used in the literature for the simulation of hemodynamic disorders [28,33]. The constitutive equation that represents this model is:
μ e f f = μ + ( μ 0 μ ) · 1 + λ γ ˙ a n a a
where μ 0 = 0.056 is the viscosity at zero shear rate expressed in Pa · s, μ = 0.00345 is the viscosity for an infinite shear rate expressed in Pa · s, λ = 3.313 is the relaxation time expressed in s, n = 2 is the power exponent and a = 0.64 the Yasuda exponent. The blood flow was set to 1060 kg/m 3 . The vessel wall was assumed to be rigid with a no-slip boundary condition. As in the previous study [28], a time-dependent flow waveform found in the literature [39] was imposed at the inlet and outlet of the model using uniform velocity profiles. For that reason, the inflow and outflow regions were extended sufficiently to provide fully developed flow in the region near the device and to reduce the influence of the boundary conditions on the computational domain. Cardiac cycles of 1 s were discretized in time steps of 0.001 s [28]. Finally, three cardiac cycles were computed for each simulation in order to damp the initial transients. The flow regime has been considered as laminar as the inflow Reynolds number based on the peak flow at systole was 604.

2.5. Numerical Modeling

The equations considered for describing the conservation of mass and of momentum for an incompressible fluid can be written as follows:
· v = 0
( d v d t + v · v ) μ · 2 v = 1 ρ p
where t is time, v is velocity of the fluid, ρ is the density of the fluid, μ is the dynamic viscosity of the fluid and p is the pressure. The governing equations were discretized for incompressible, laminar flow using the finite volume method and a fully implicit formulation. A SIMPLE-like algorithm was used to solve for the pressure and velocity fields. In particular, Ansys CFX uses a cascade of successively coarser grids which implies a fully implicit discretization of the equations at any given time step. The final set of coupled linear equations was solved using an Algebraic Multigrid method. This method adopts the so called factorization accelerated incomplete lower upper technique (ILU) for solving the discrete system of linearized equations written in linearized form as:
A x = b
The exact solution of the equations is reached during the course of several iterations by means of the ILU technique. The previous equation can be solved iteratively by starting with an approximate solution x n that is to be improved by a correction x obtaining a better solution x n + 1 :
x n + 1 = x n + x
where x is the solution of the linearized governing equations system A x = r n , with r n = b A x n . The iterative application of the presented algorithm yields the solution of the governing equations with the desired accuracy. The progress of the solver was monitored using the residuals of the discrete transport equations. In the present work, the solution was considered converged when the initial residual was less that 10 6 . Further details are given in the Ansys CFX user documentation. [40].

2.6. Hemodynamics Indices

As done in our previous study [28], WSS-related variables were evaluated to quantify the hemodynamic changes within the curved and tortuous arteries, in the presence of the sidewall aneurysm and the three different FDSs. Using the instantaneous WSS vector τ w obtained from each simulation during one cardiac cycle T = 1 s, the time-averaged wall shear stress (TAWSS), the oscillatory shear index (OSI) and the relative residence time (RRT) were computed and mapped on the surfaces of the models. The RRT is especially relevant for evaluating the slow motions within the aneurysmatic sac [6,41]. The equations defining the three indices, which are widely utilized in the literature, are [42,43]:
T A W S S = 1 T 0 T | τ w | d t
O S I = 0.5 1 | 0 T τ w d t | 0 T | τ w | d t
R R T = 1 ( 1 2 · O S I ) · T A W S S = 1 1 T | 0 T τ w d t |
In the literature, the TAWSS and the OSI are correlated with the risk of rupture of the aneurysm. On the other hand, the RRT is considered suitable for quantifying the tendency towards thrombus formation [6,44].

3. Results

In order to assess the changes induced by the stents, we performed a numerical simulation of each geometrical configuration, as summarized in Table 2. For each simulation, we analyzed the velocity field in the artery and in the aneurysmatic sac, the flow reduction within the sac and the WSS-related indices. In the literature, a number of indices have been assessed for the purposes of predicting aneurysm rupture. Unfortunately, less interest has been given to the evaluation of these indices for assessing the thrombosis induced by a stent [6]. By comparing the results of the numerical simulations, it is possible to independently investigate the influence of artery curvature or tortuosity on the performances of the stents.

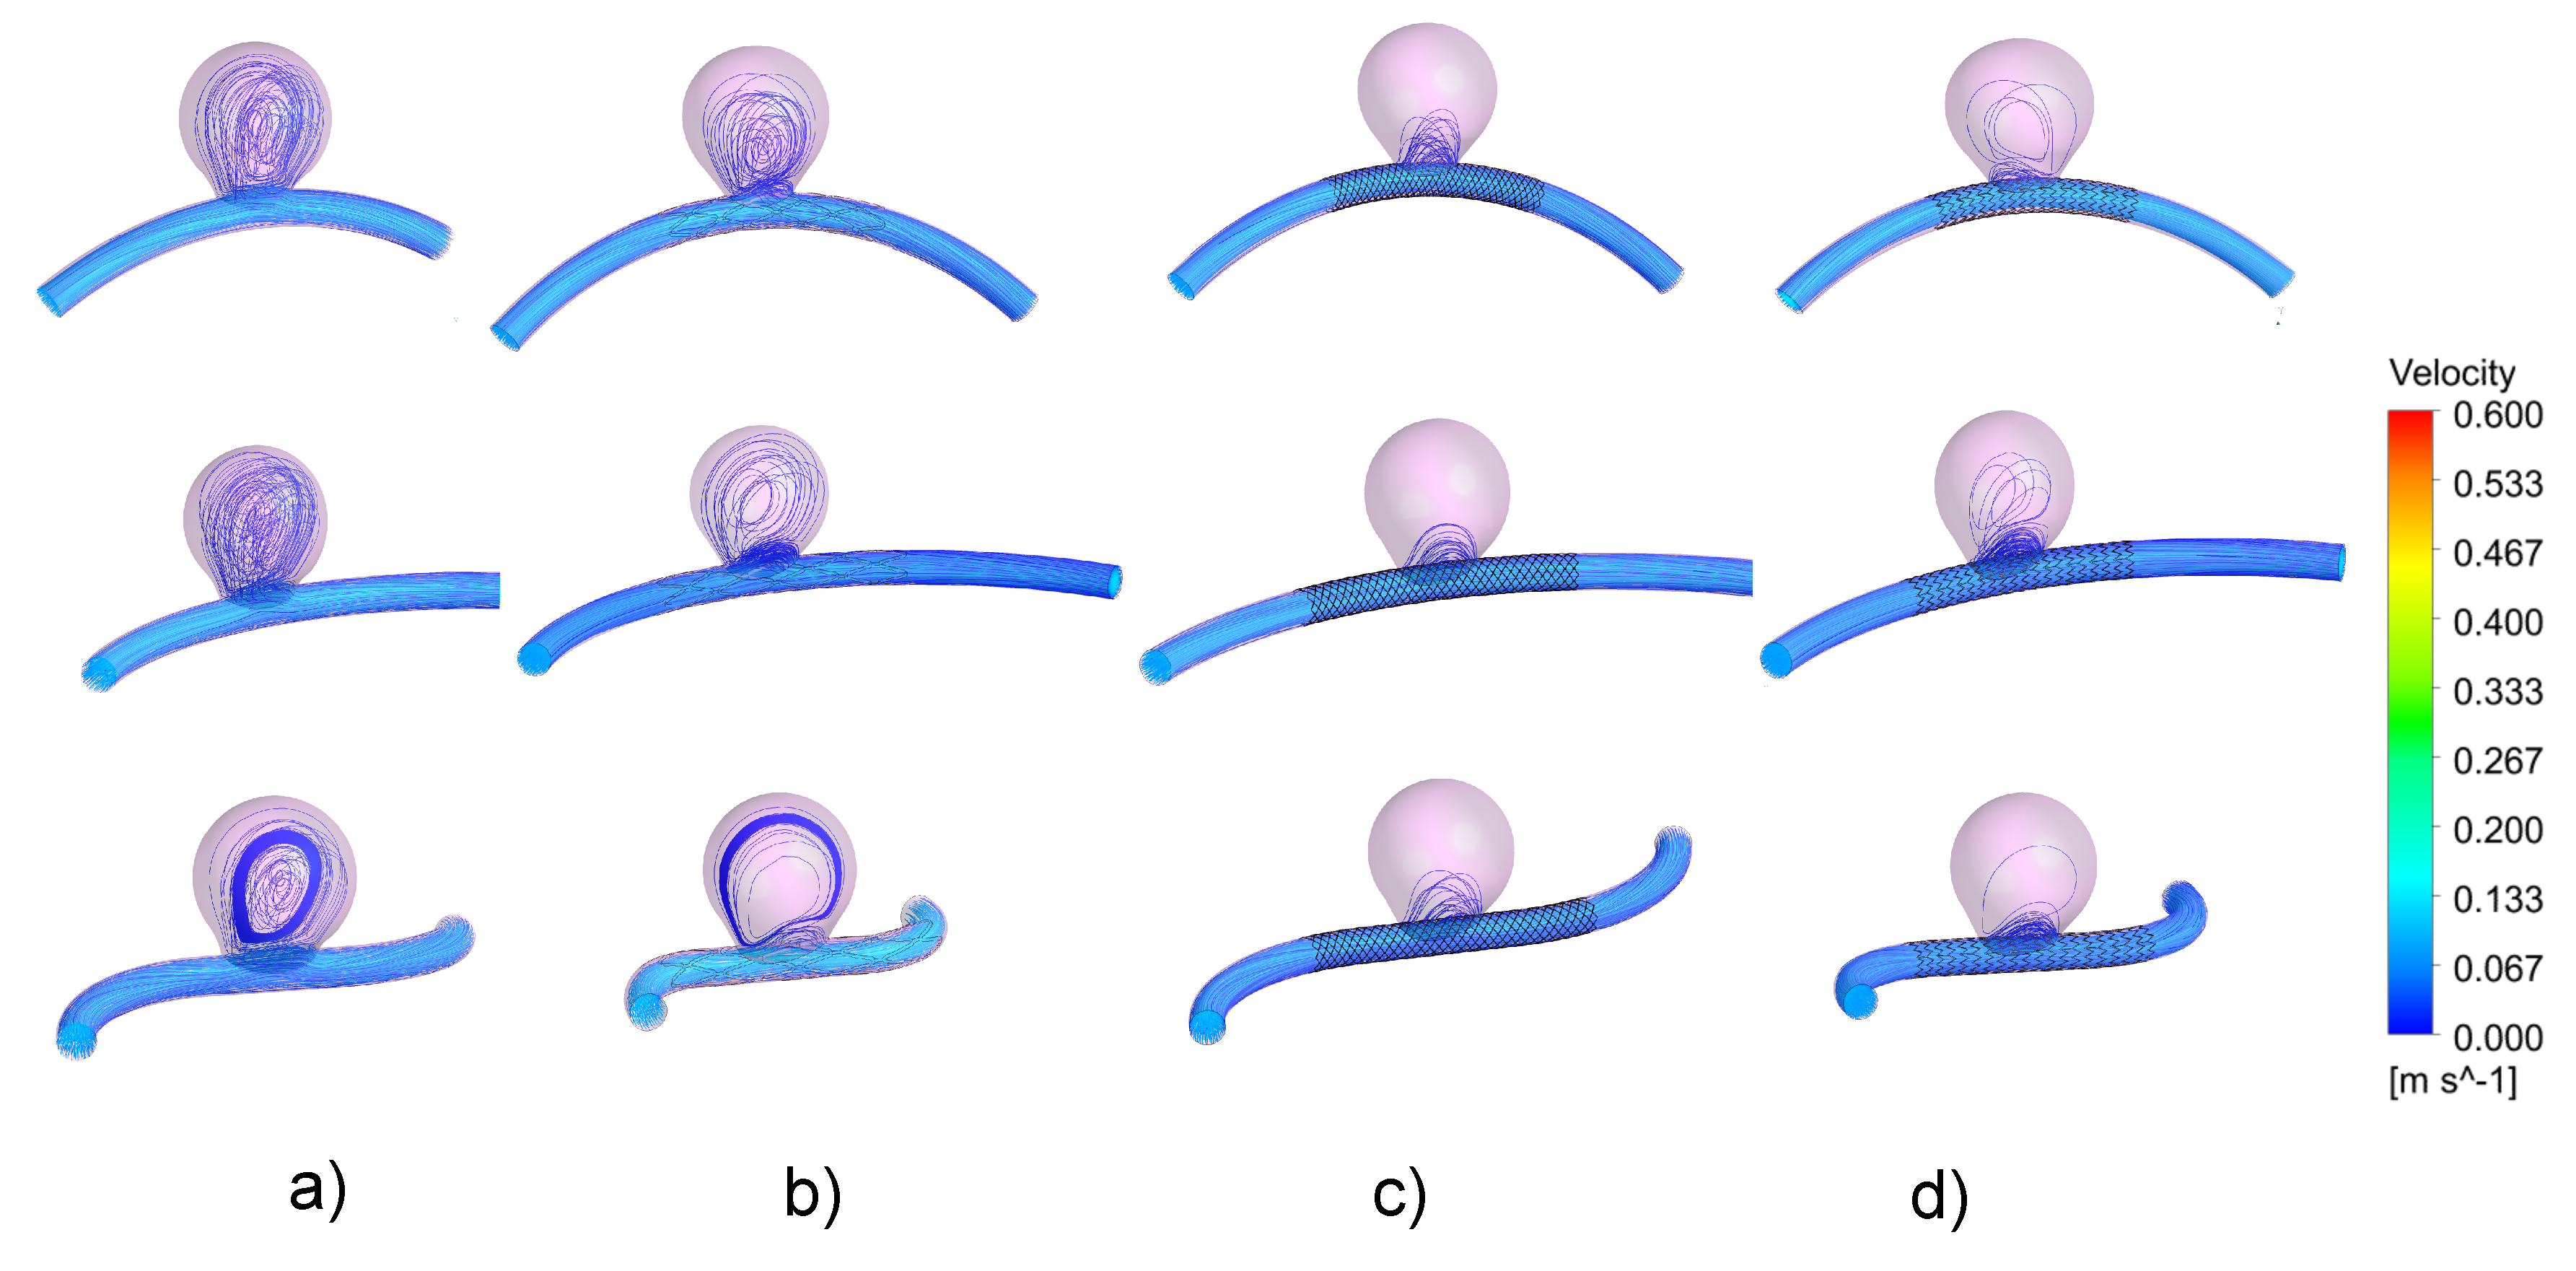
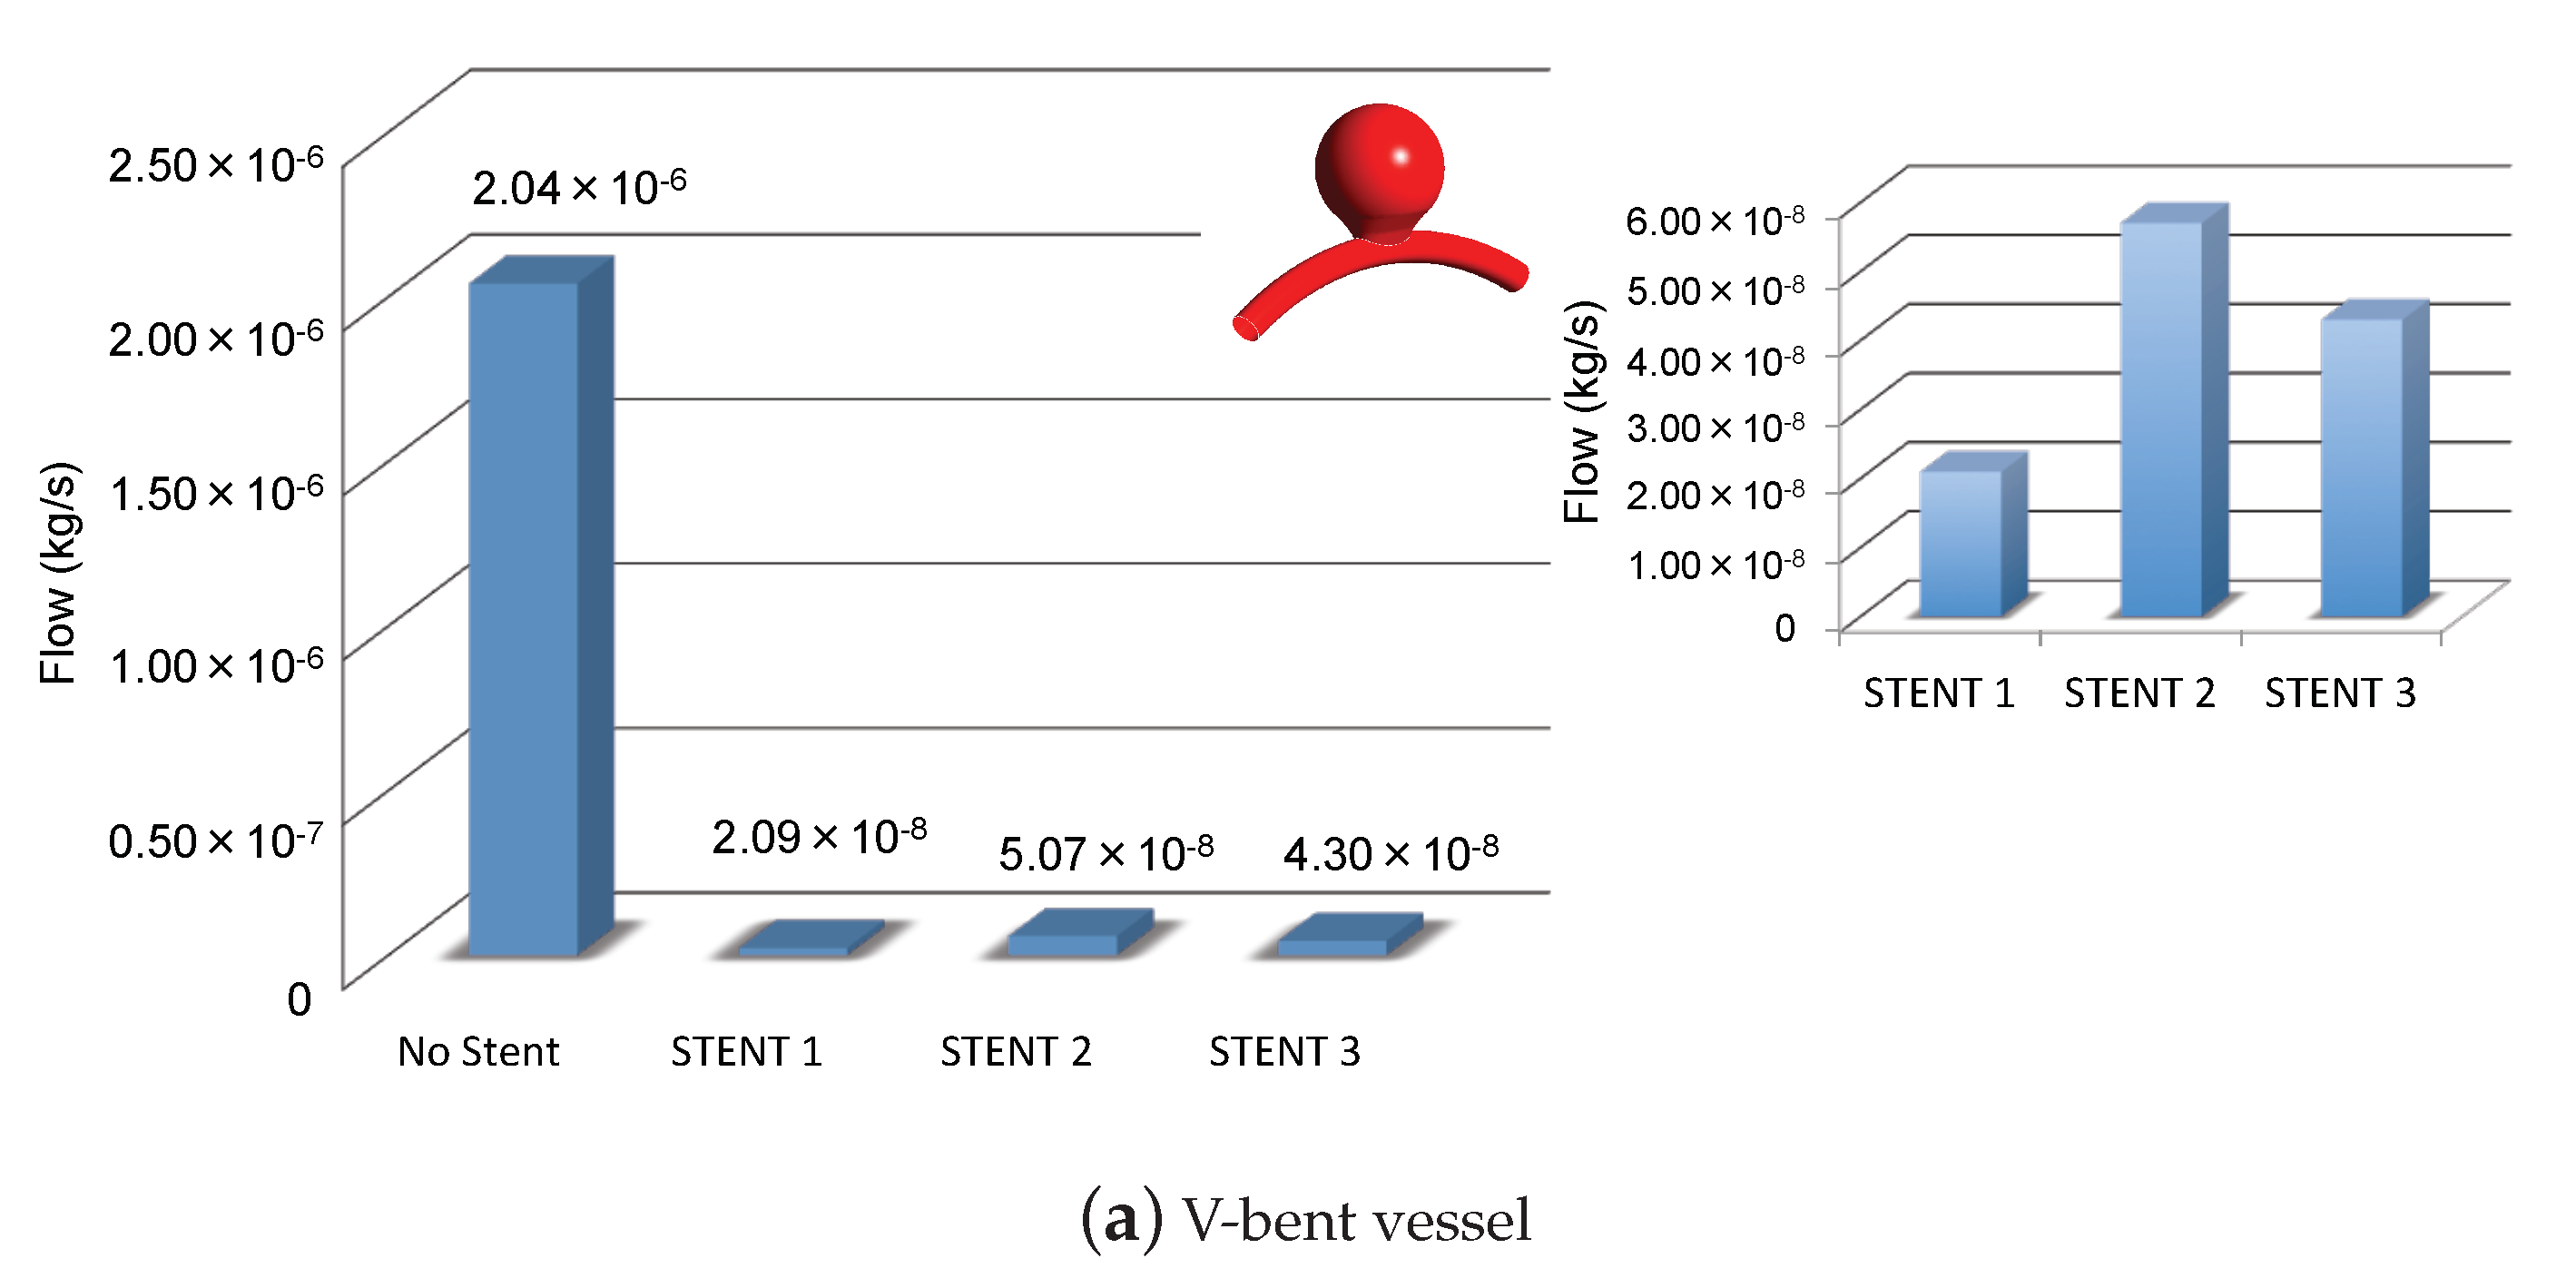
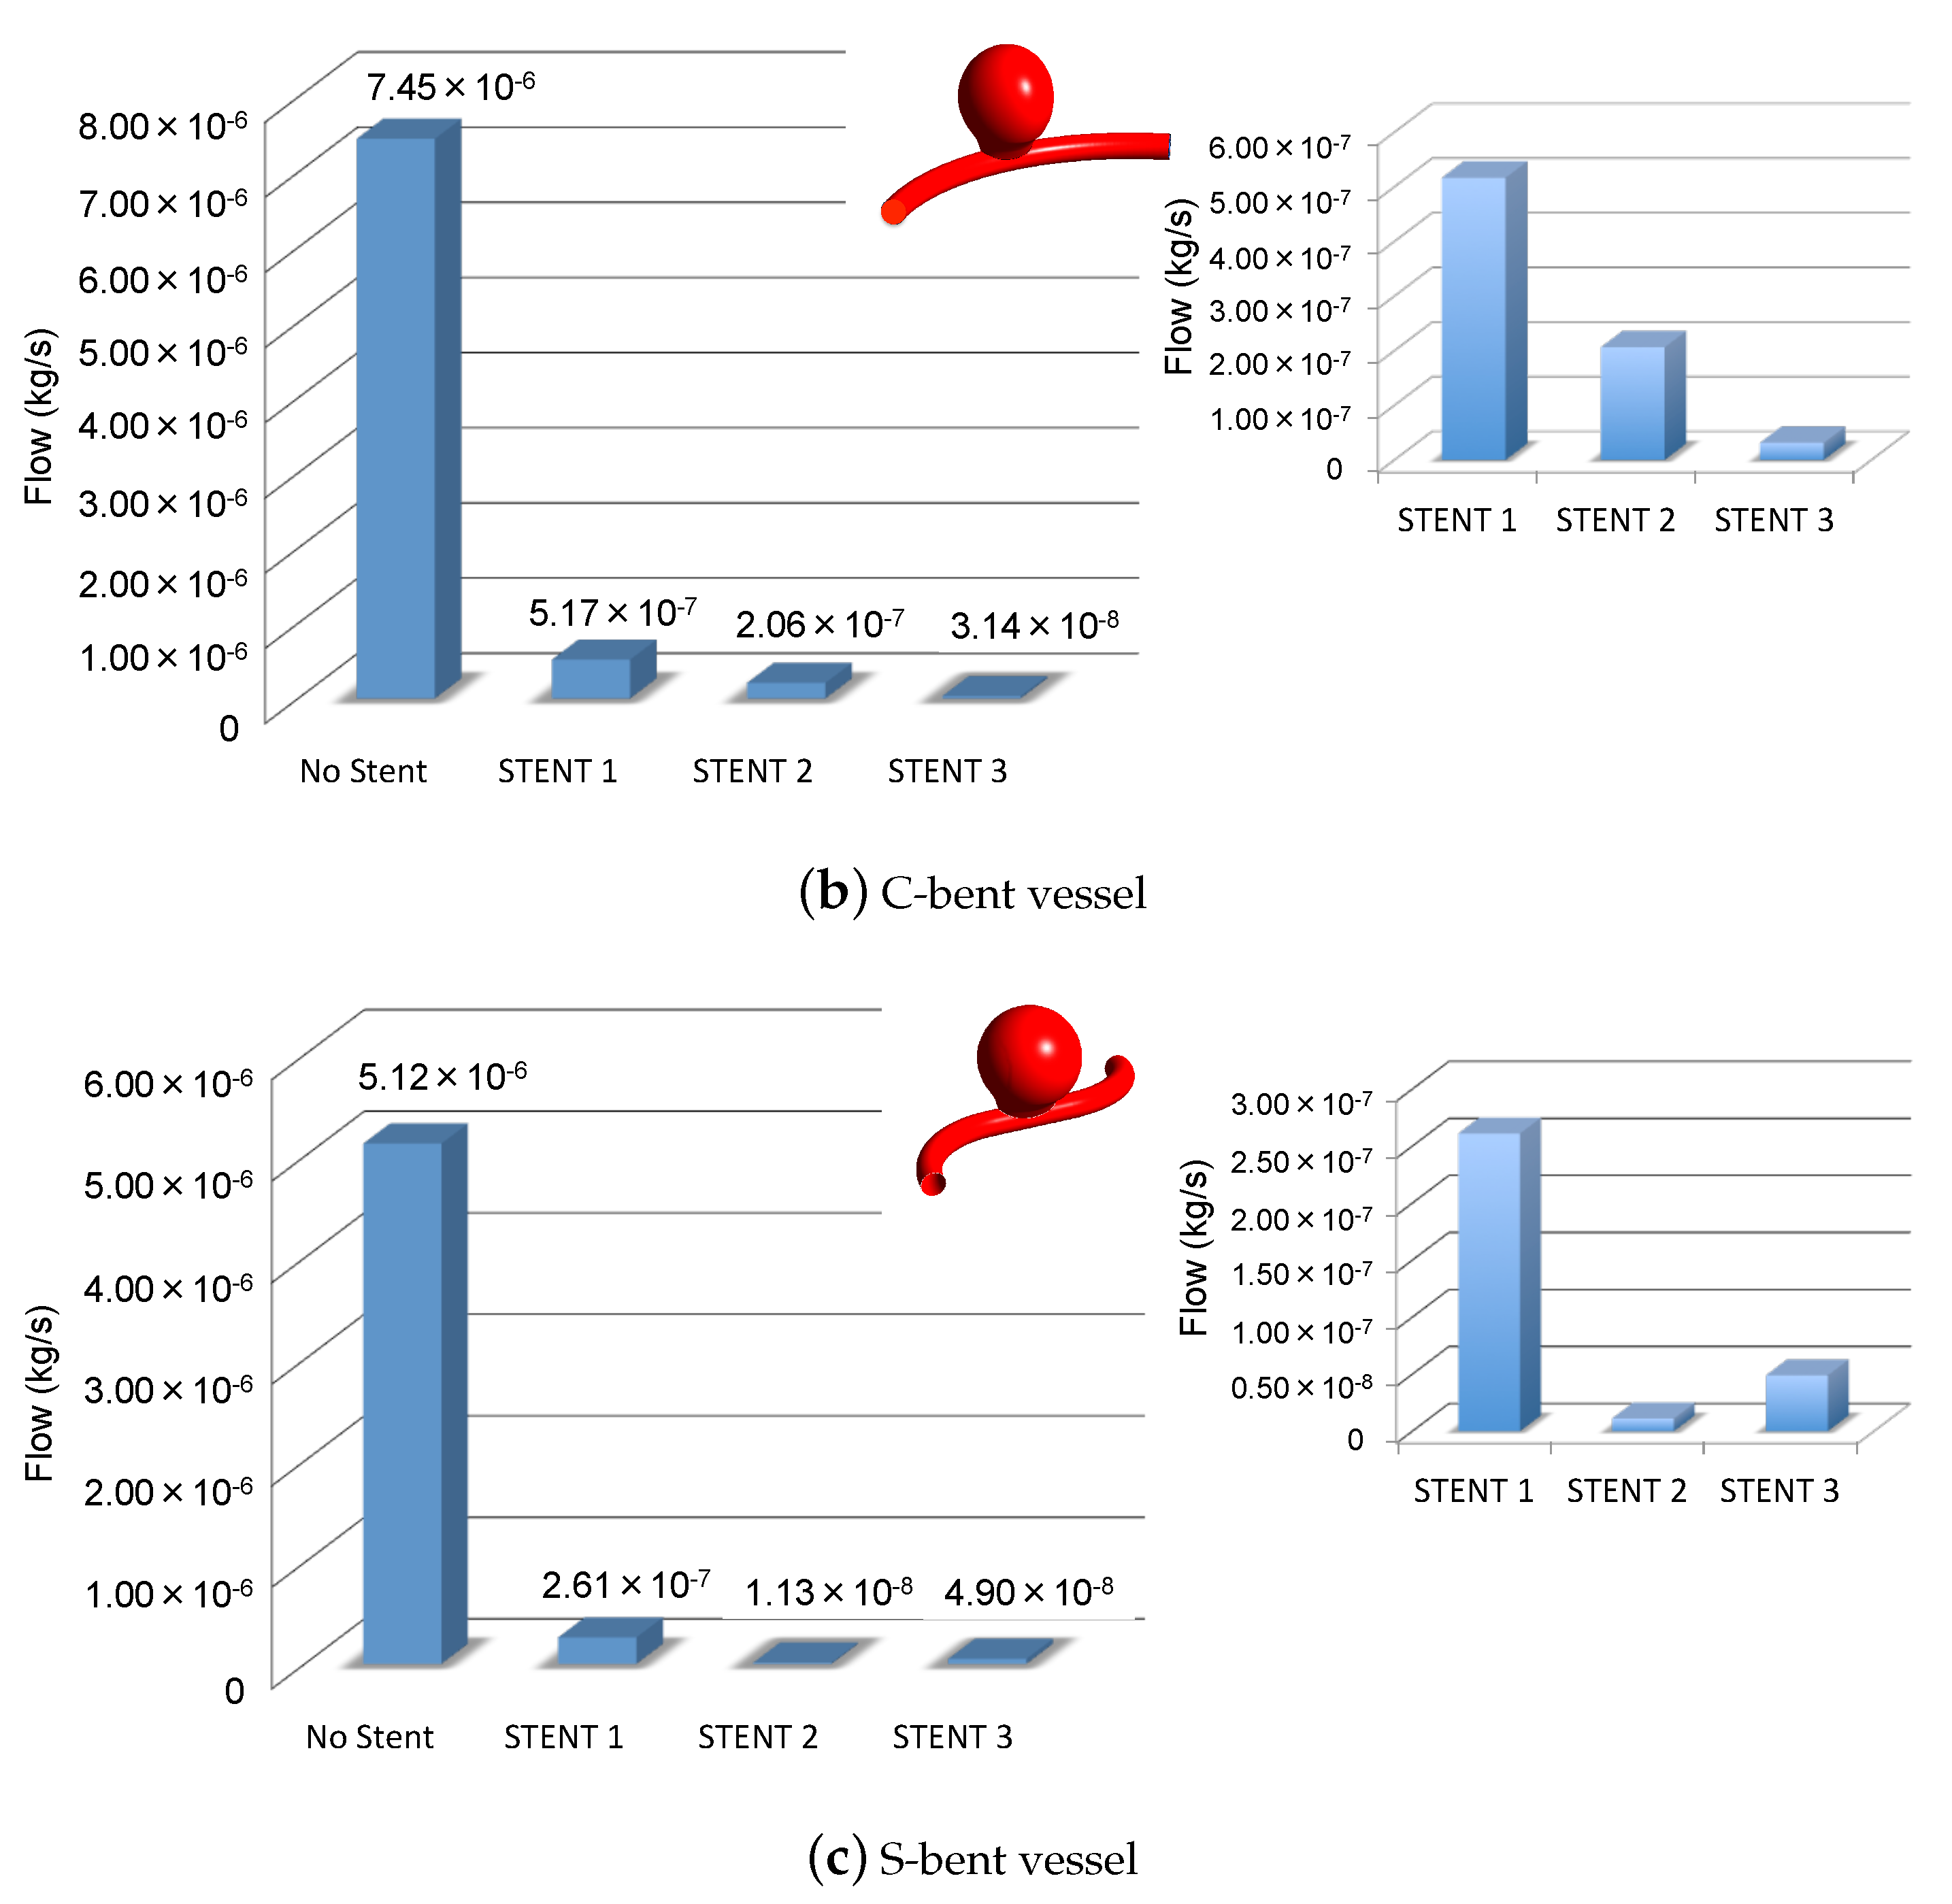
3.1. Impacts of the Stents on the Velocity Field and on Intra-Aneurysmal Flow

The velocity field was visualized using three-dimensional streamlines that depict the behavior of the blood flow within the sac at systole and diastole. As expected, stenting leads to considerable hemodynamic changes within the considered vessel configurations during both phases. The resulting flow structures are sketched in Figure 2 and Figure 3 for systole and diastole respectively. At systole, these are qualitatively similar for the different stent models, while a marked difference can be seen between the non-stented and stented cases for each respective configuration. In particular, all implants are capable of reducing the flow into the aneurysm. Additionally, it is apparent that the stent treatment is more effective for the S-shaped configuration in Figure 2. At diastole, the flow structures are again similar within the stented arteries. The three stents are effective, independent of the geometrical configurations of the artery. Of course their mission during diastole is facilitated by the reduced flow conditions. The more effective device here is STENT 2; the flow structure of STENT 1 looks similar to those of the unstented model. The behavior of STENT 3 is better than STENT 1 but slightly worse than that of STENT 2. There is a reduced tendency of the blood flow to circulate inside the aneurysmatic sac. It is clear that, in these conditions, the stent with low porosity is the most efficient.
In Figure 4 the different flow rates entering the aneurysm are summarized using bar graphs. In a close-up view, the performance of each stent is shown separately. Surprisingly, for each artery geometry, the most efficient flow reduction is provided by a different device. In particular, for the V-bent configuration, the highest flow reduction is given by STENT 1, for the C-bent configuration by STENT 3 and for the S-bent configuration by STENT 2. It is likely that the geometries of the artery change the initial undeformed straight configuration of the stent. Due to the curvature of the vessel in fact, the stent mesh could locally slightly enlarge and slightly close near the neck, between the artery and aneurysm. This could explain why the low porosity stent is not the one that offers the highest flow reduction in all cases. This is especially true in the V-bent configuration. Kim et al. [13] have highlighted similar findings. They report that when the curvature of the artery increases, the blockage effect of the stent diminishes and the flow into the aneurysm increases. In this sense, the high-porosity STENT 1 provides very similar performance for the different vessel configurations and seems to be less affected by geometry.
Finally, it is important to remark that, as stated in the literature, the degree of flow reduction and redistribution within the aneurysmatic sac also depends on the orientation of the stent struts [45]. The orientation can be especially important for STENT 1, which has the thicker struts.

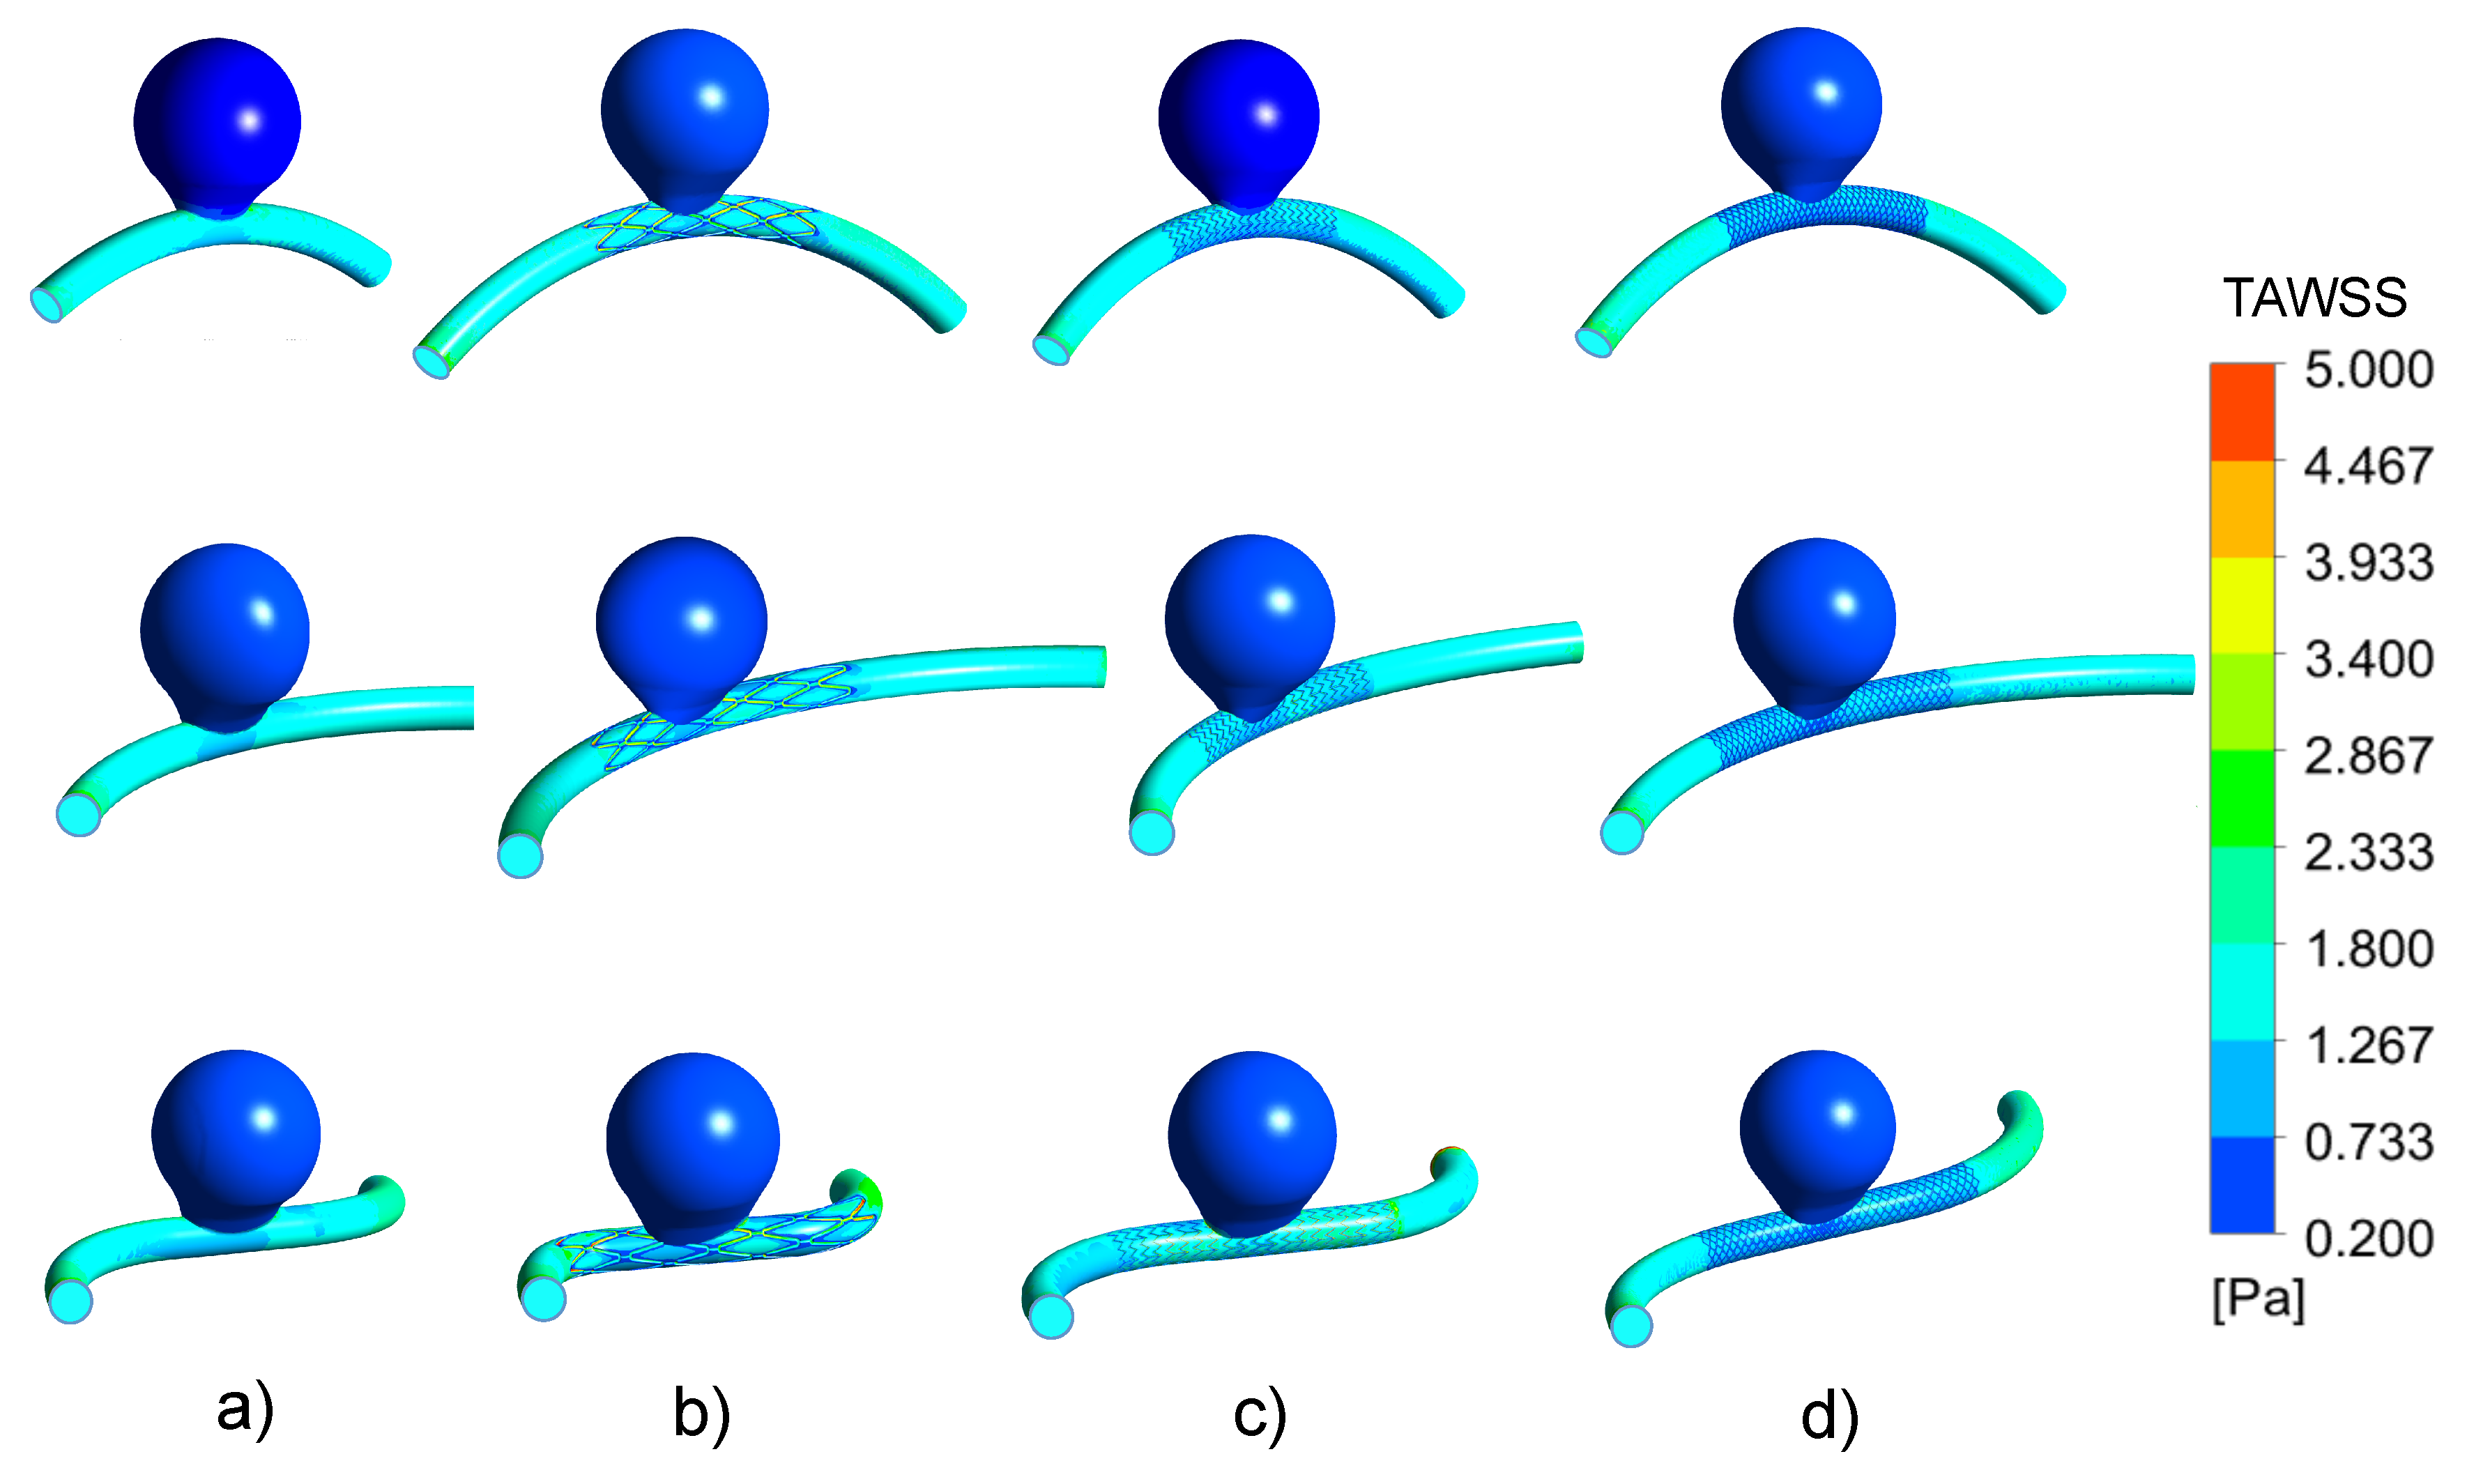
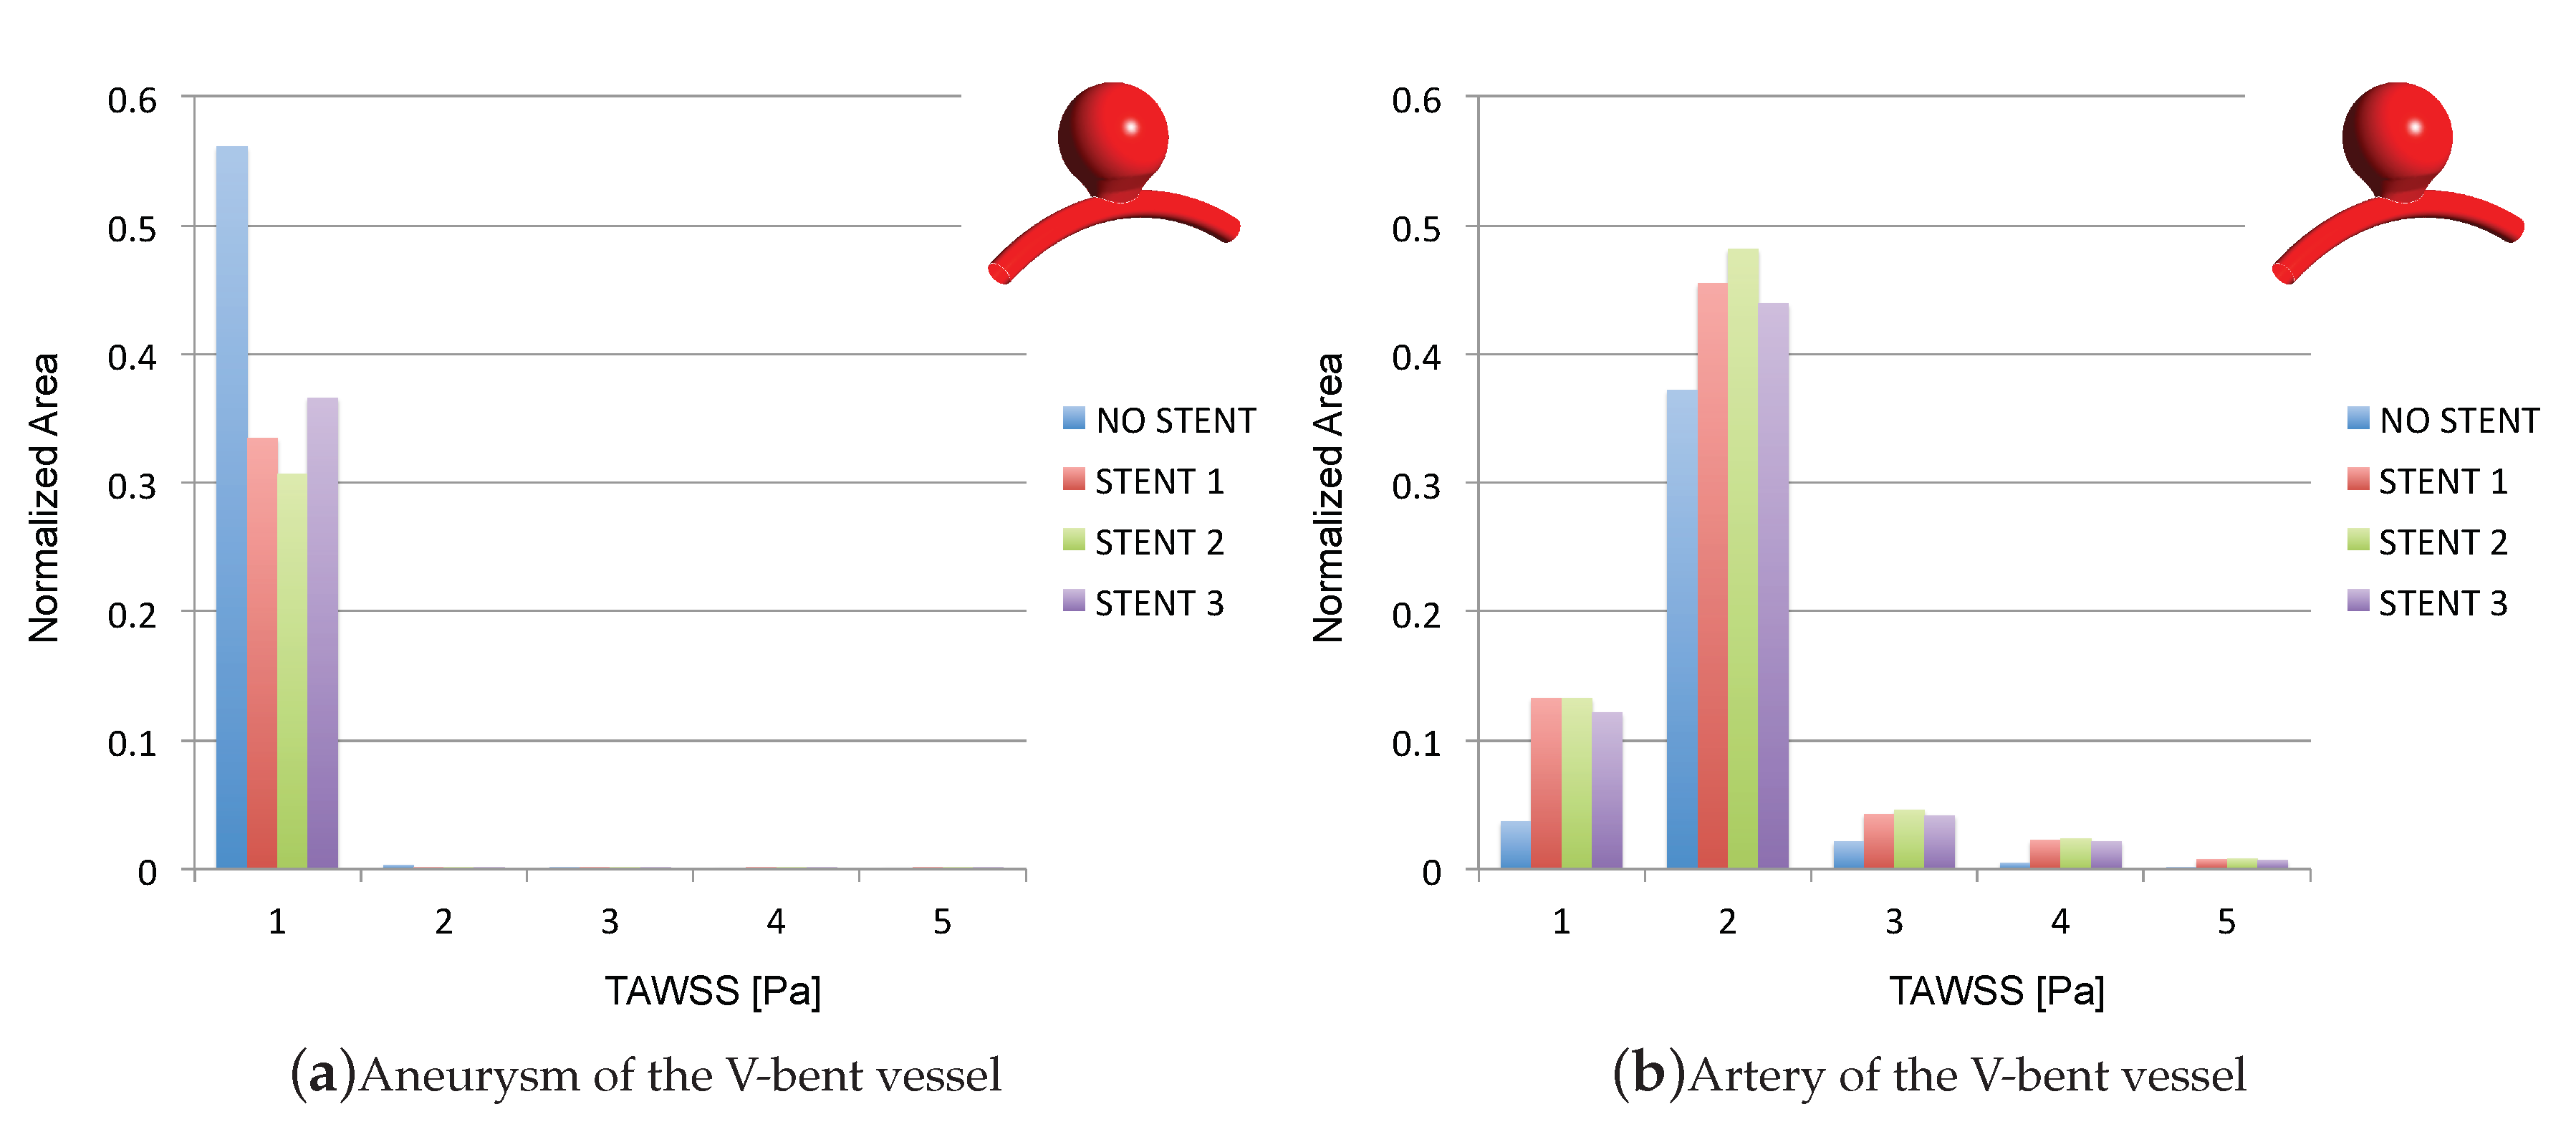
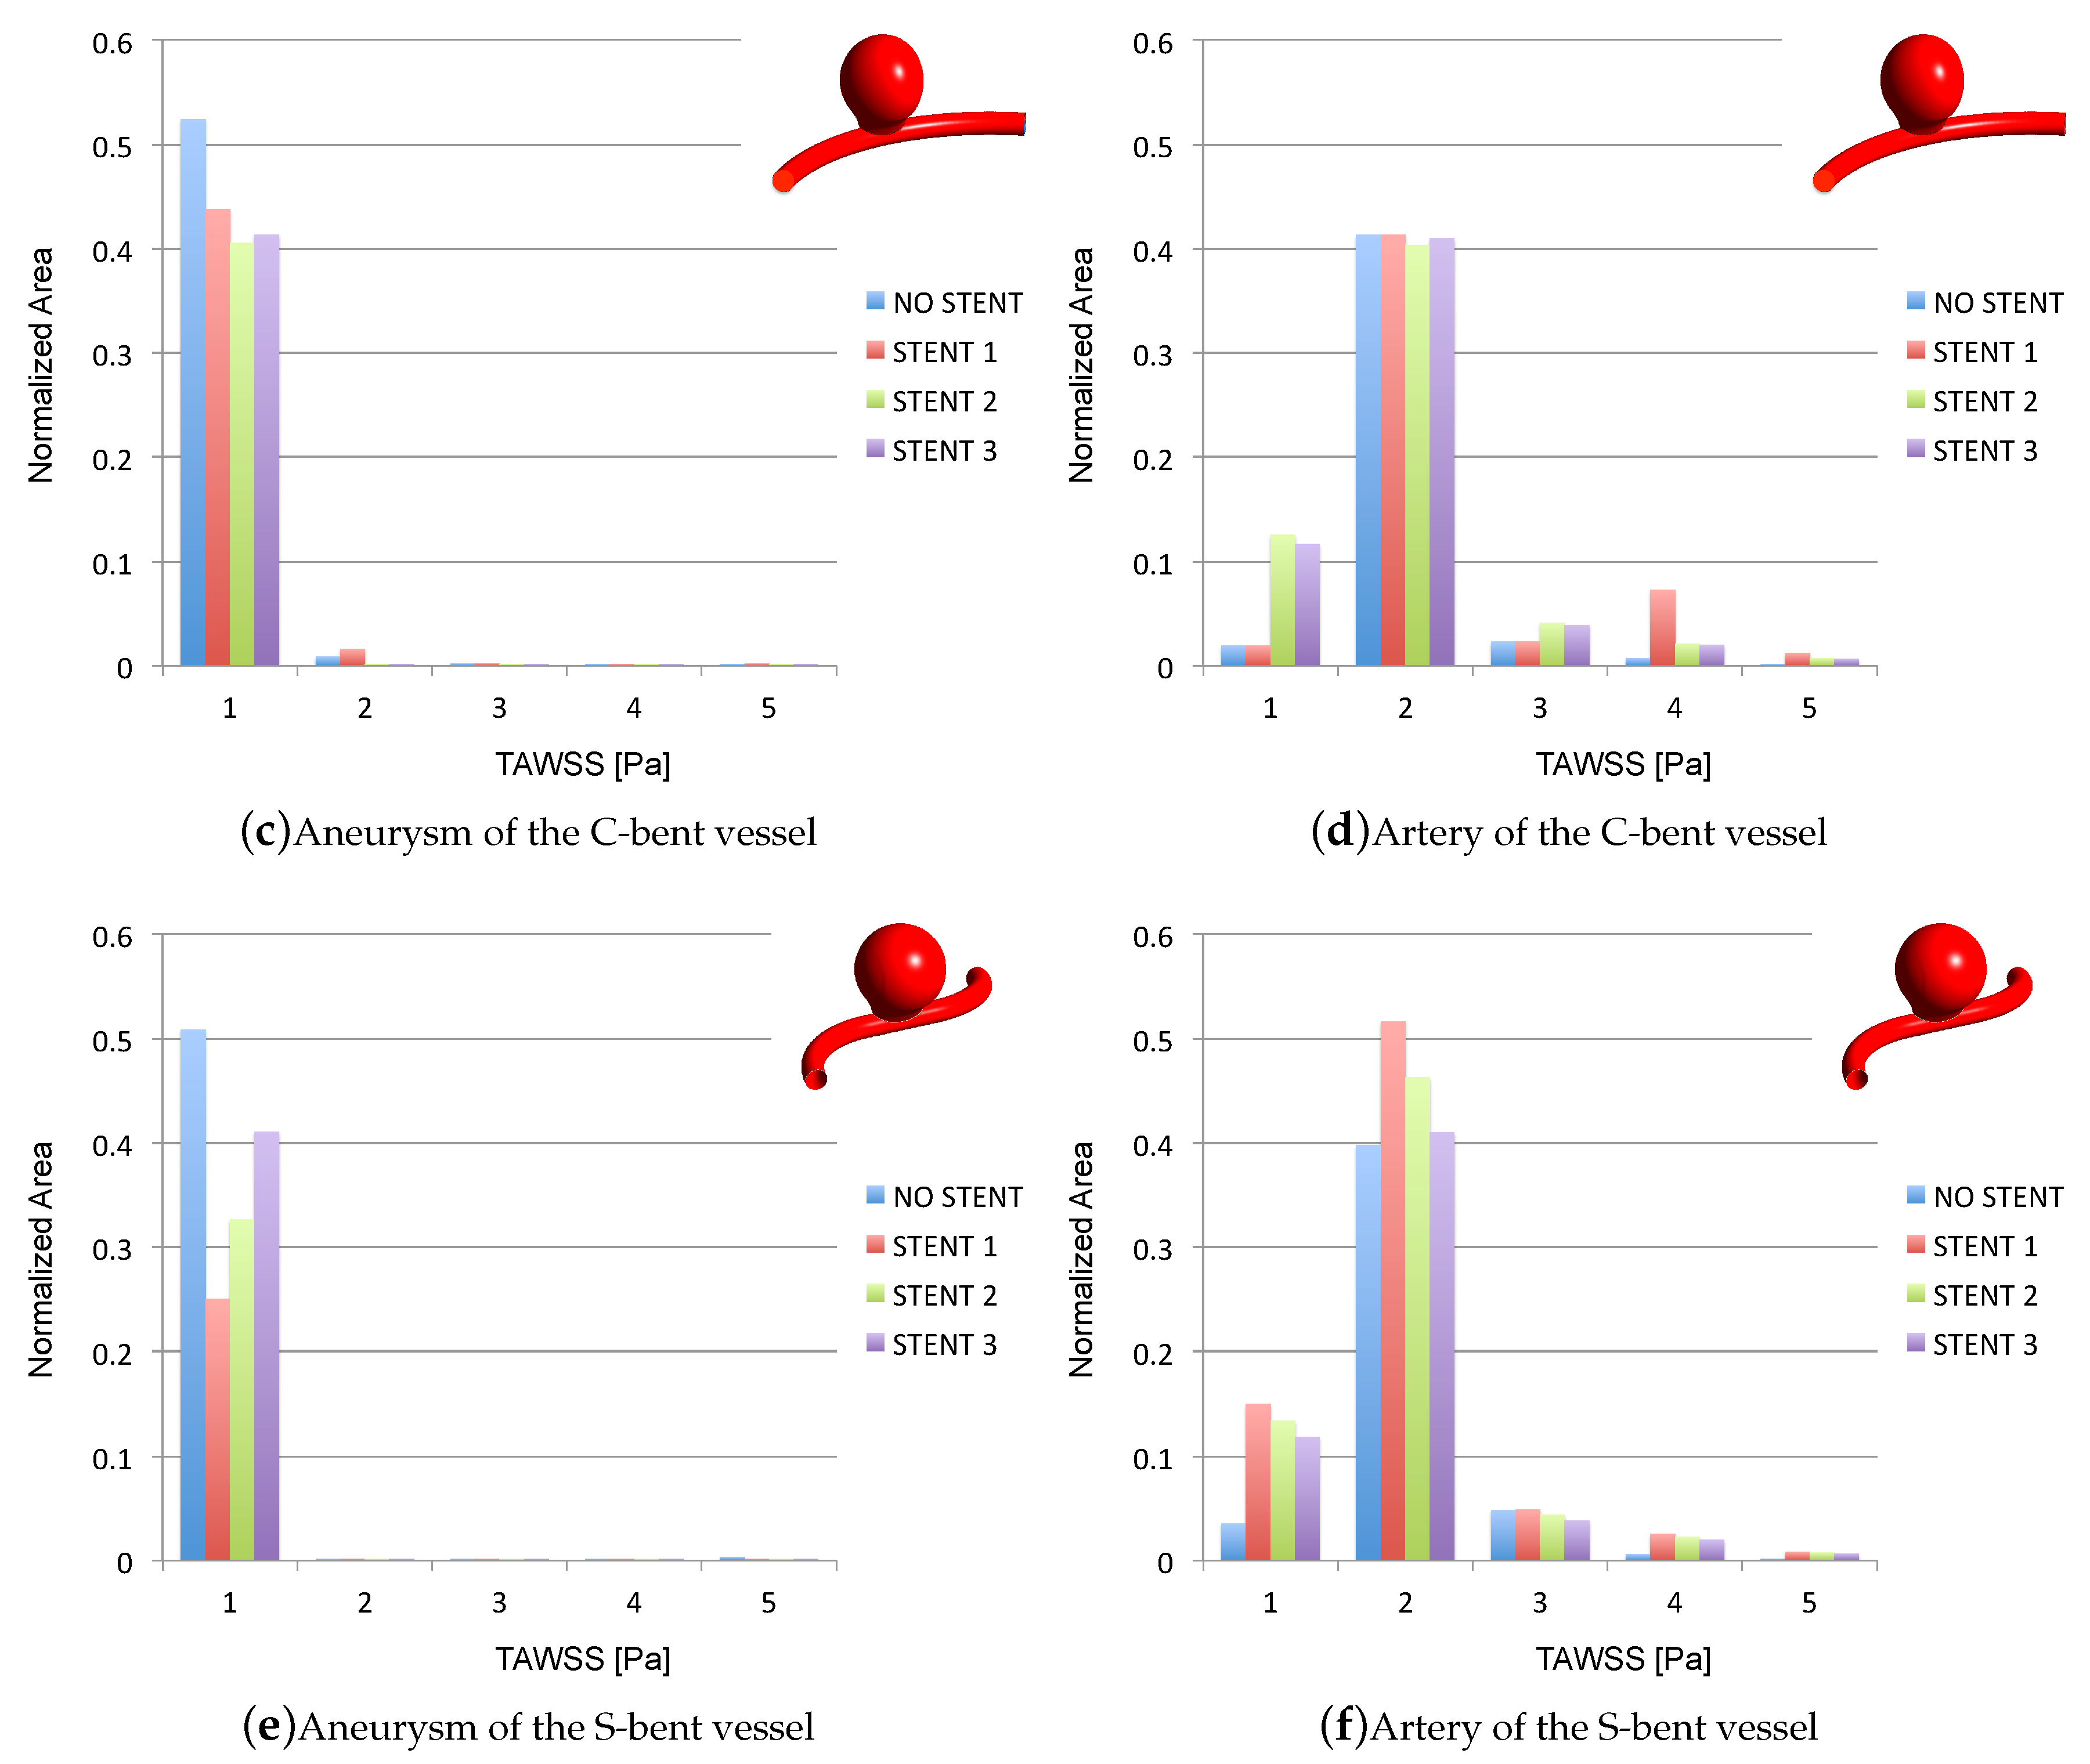
3.2. Impacts of the Stents on the WSS-Related Indices: TAWSS

The TAWSS was computed and is shown qualitatively on the vessel surface in Figure 5 and quantitatively by histograms in Figure 6a–f. The spatial field represented in Figure 5 highlights very similar distributions along the non-stented vessels and on each implant configuration. Comparing these spatial fields, it can be deduced that the TAWSS essentially does not vary once a device is introduced. Of course, as is widely known, in the region around the stent the TAWSS tends to decrease, and in particular, the reduction is focused on the regions very close to the struts [33].
Figure 6a–e represents for intervals of 1 Pa, the normalized area of the aneurysm and of the artery and artery and stent together, respectively, affected by each interval of TAWSS. This representation, as that presented below for OSI and RRT, allows quantifying the areas affected by the WSS-related indices of aneurysm and artery separately as functions of the total area of each model. In this way, it is possible to observe which part of the aneurysmatic vessel is affected by a specific value of TAWSS and which percentage of the total represented in Figure 6 can be associated to the aneurysm or to the artery within the different geometrical configurations. In can be observed, for example, that almost the entire area of the aneurysm is affected by TAWSS equal to 1–2 Pa, while the artery is affected by a non-uniform distribution, especially in the presence of the stent. This represents less than 40 % of the areas of the models ( 57 % for the unstinted model). The histograms clearly show that the distribution of the TAWSS within the artery is overall very similar before and after treatment, independent of the vessel curvature. However, the presence of the stent slightly modifies the absolute values of the TAWSS inside specific intervals and the occurrence of the peak value (region with TAWSS = 5 Pa) was increased in some cases. The aneurysm models are mainly affected by TAWSS of around 1 Pa while the arteries are affected by a TAWSS of 2 Pa (40–47% of the models). The arteries systematically show increased values of TAWSS when stented; however, these are quite limited (largely less than 10 % of the whole models, as is visible in Figure 6b,d,f).

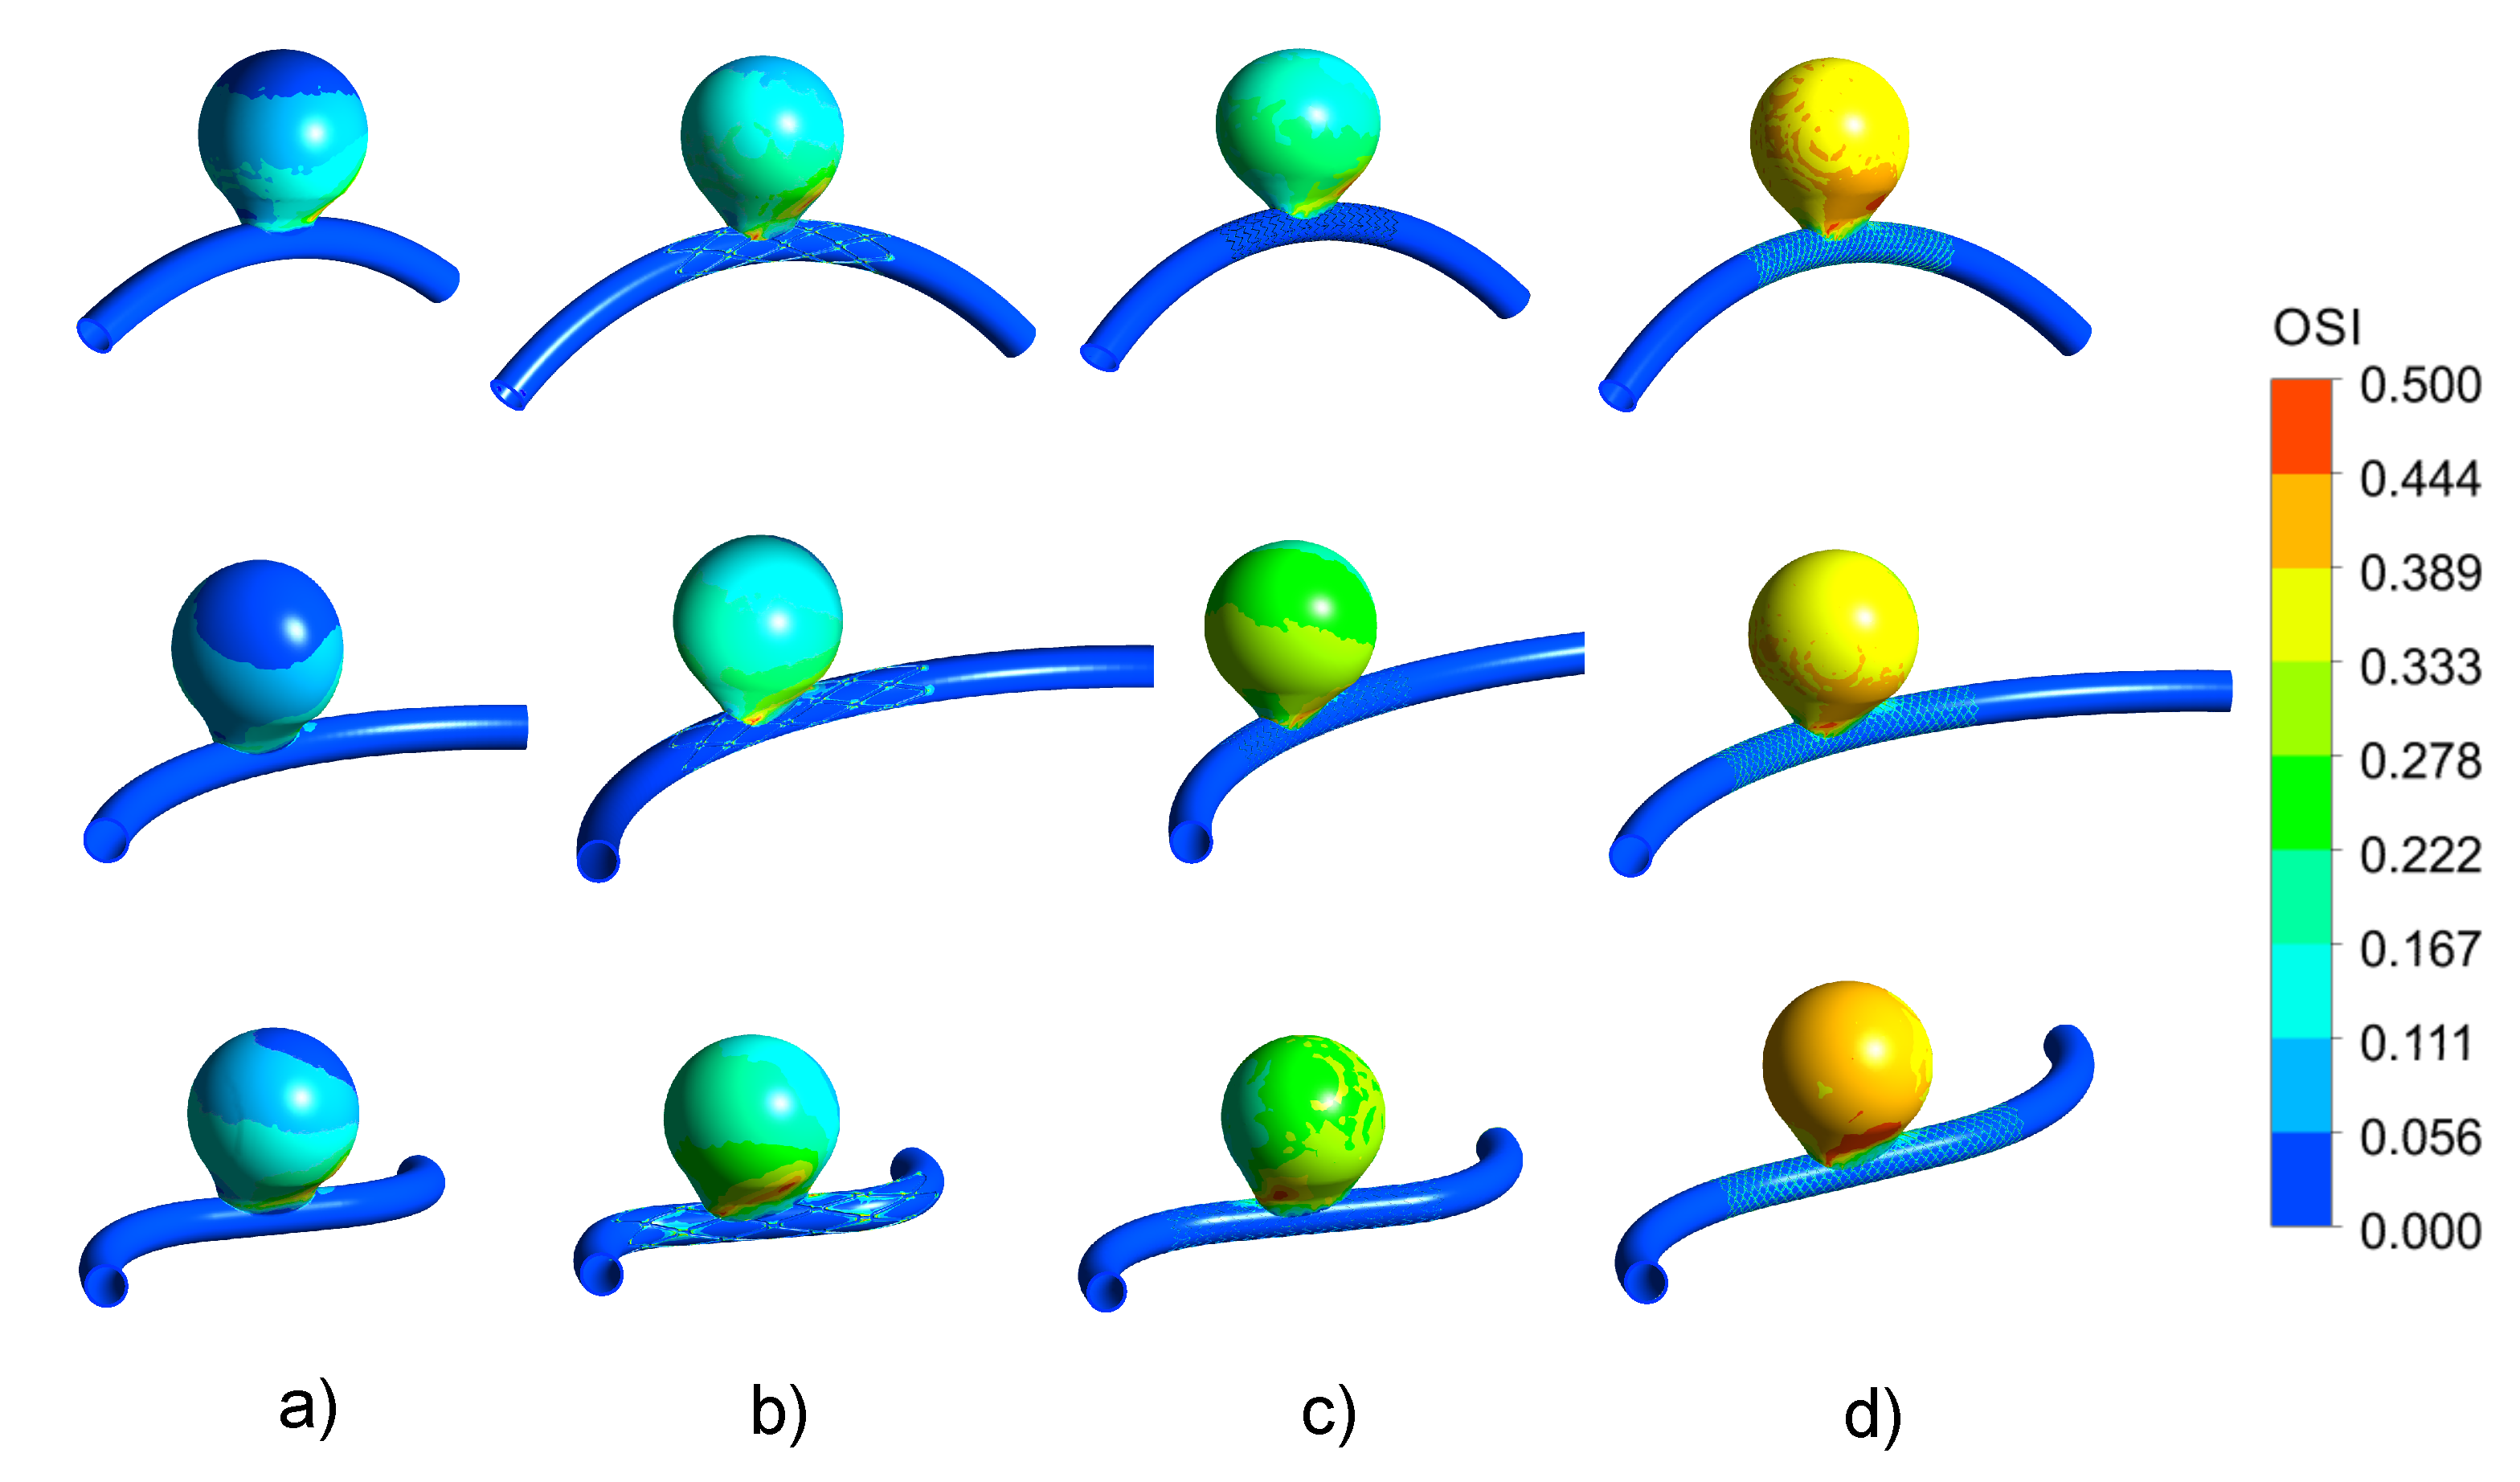
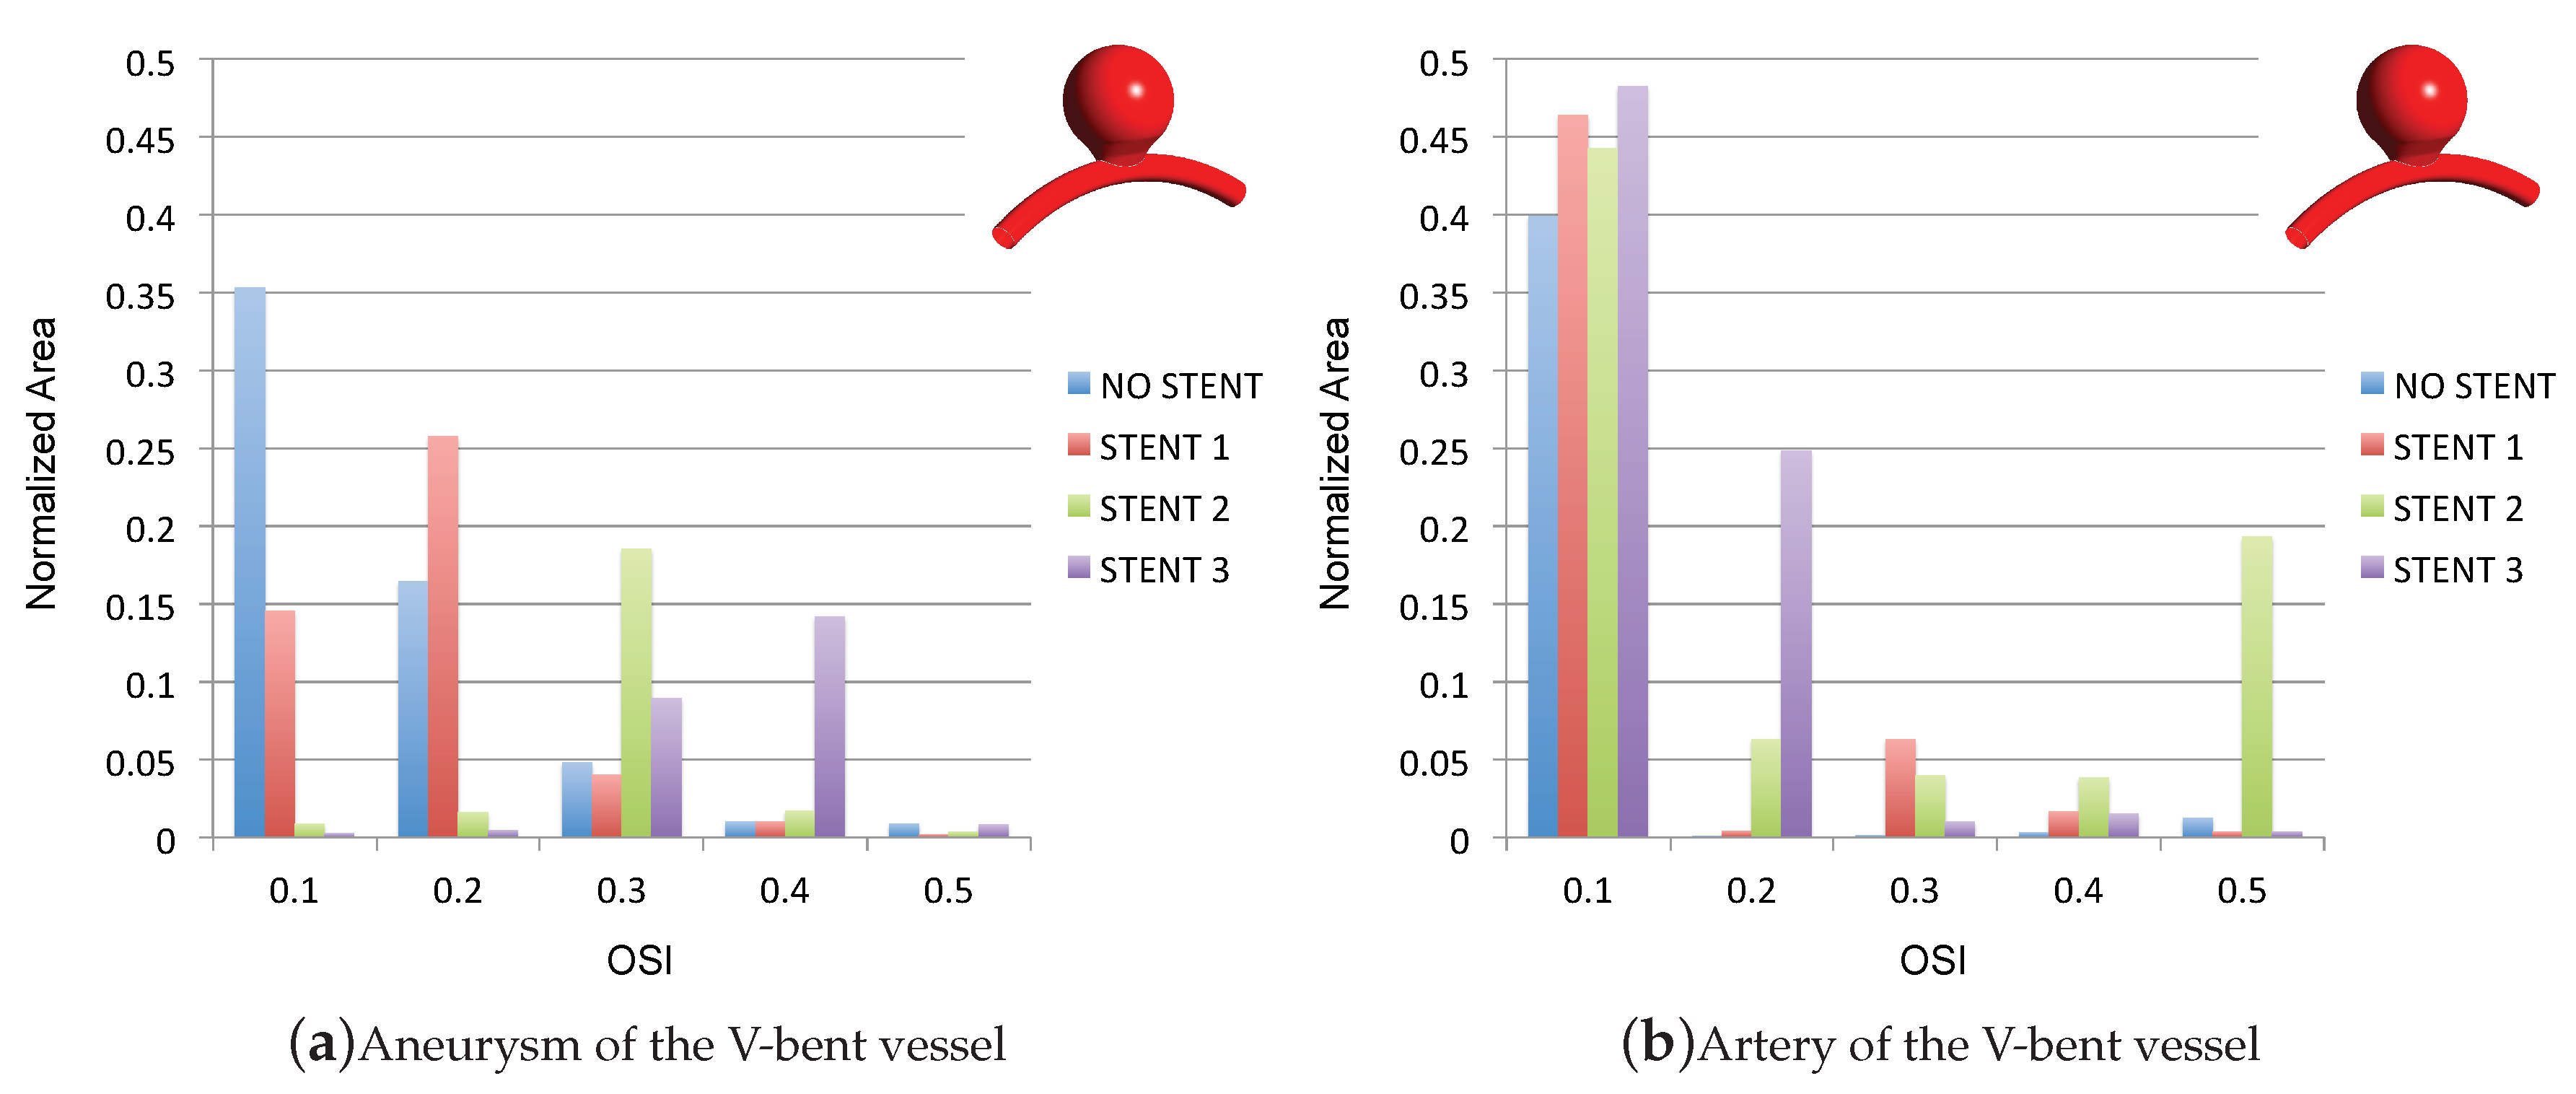
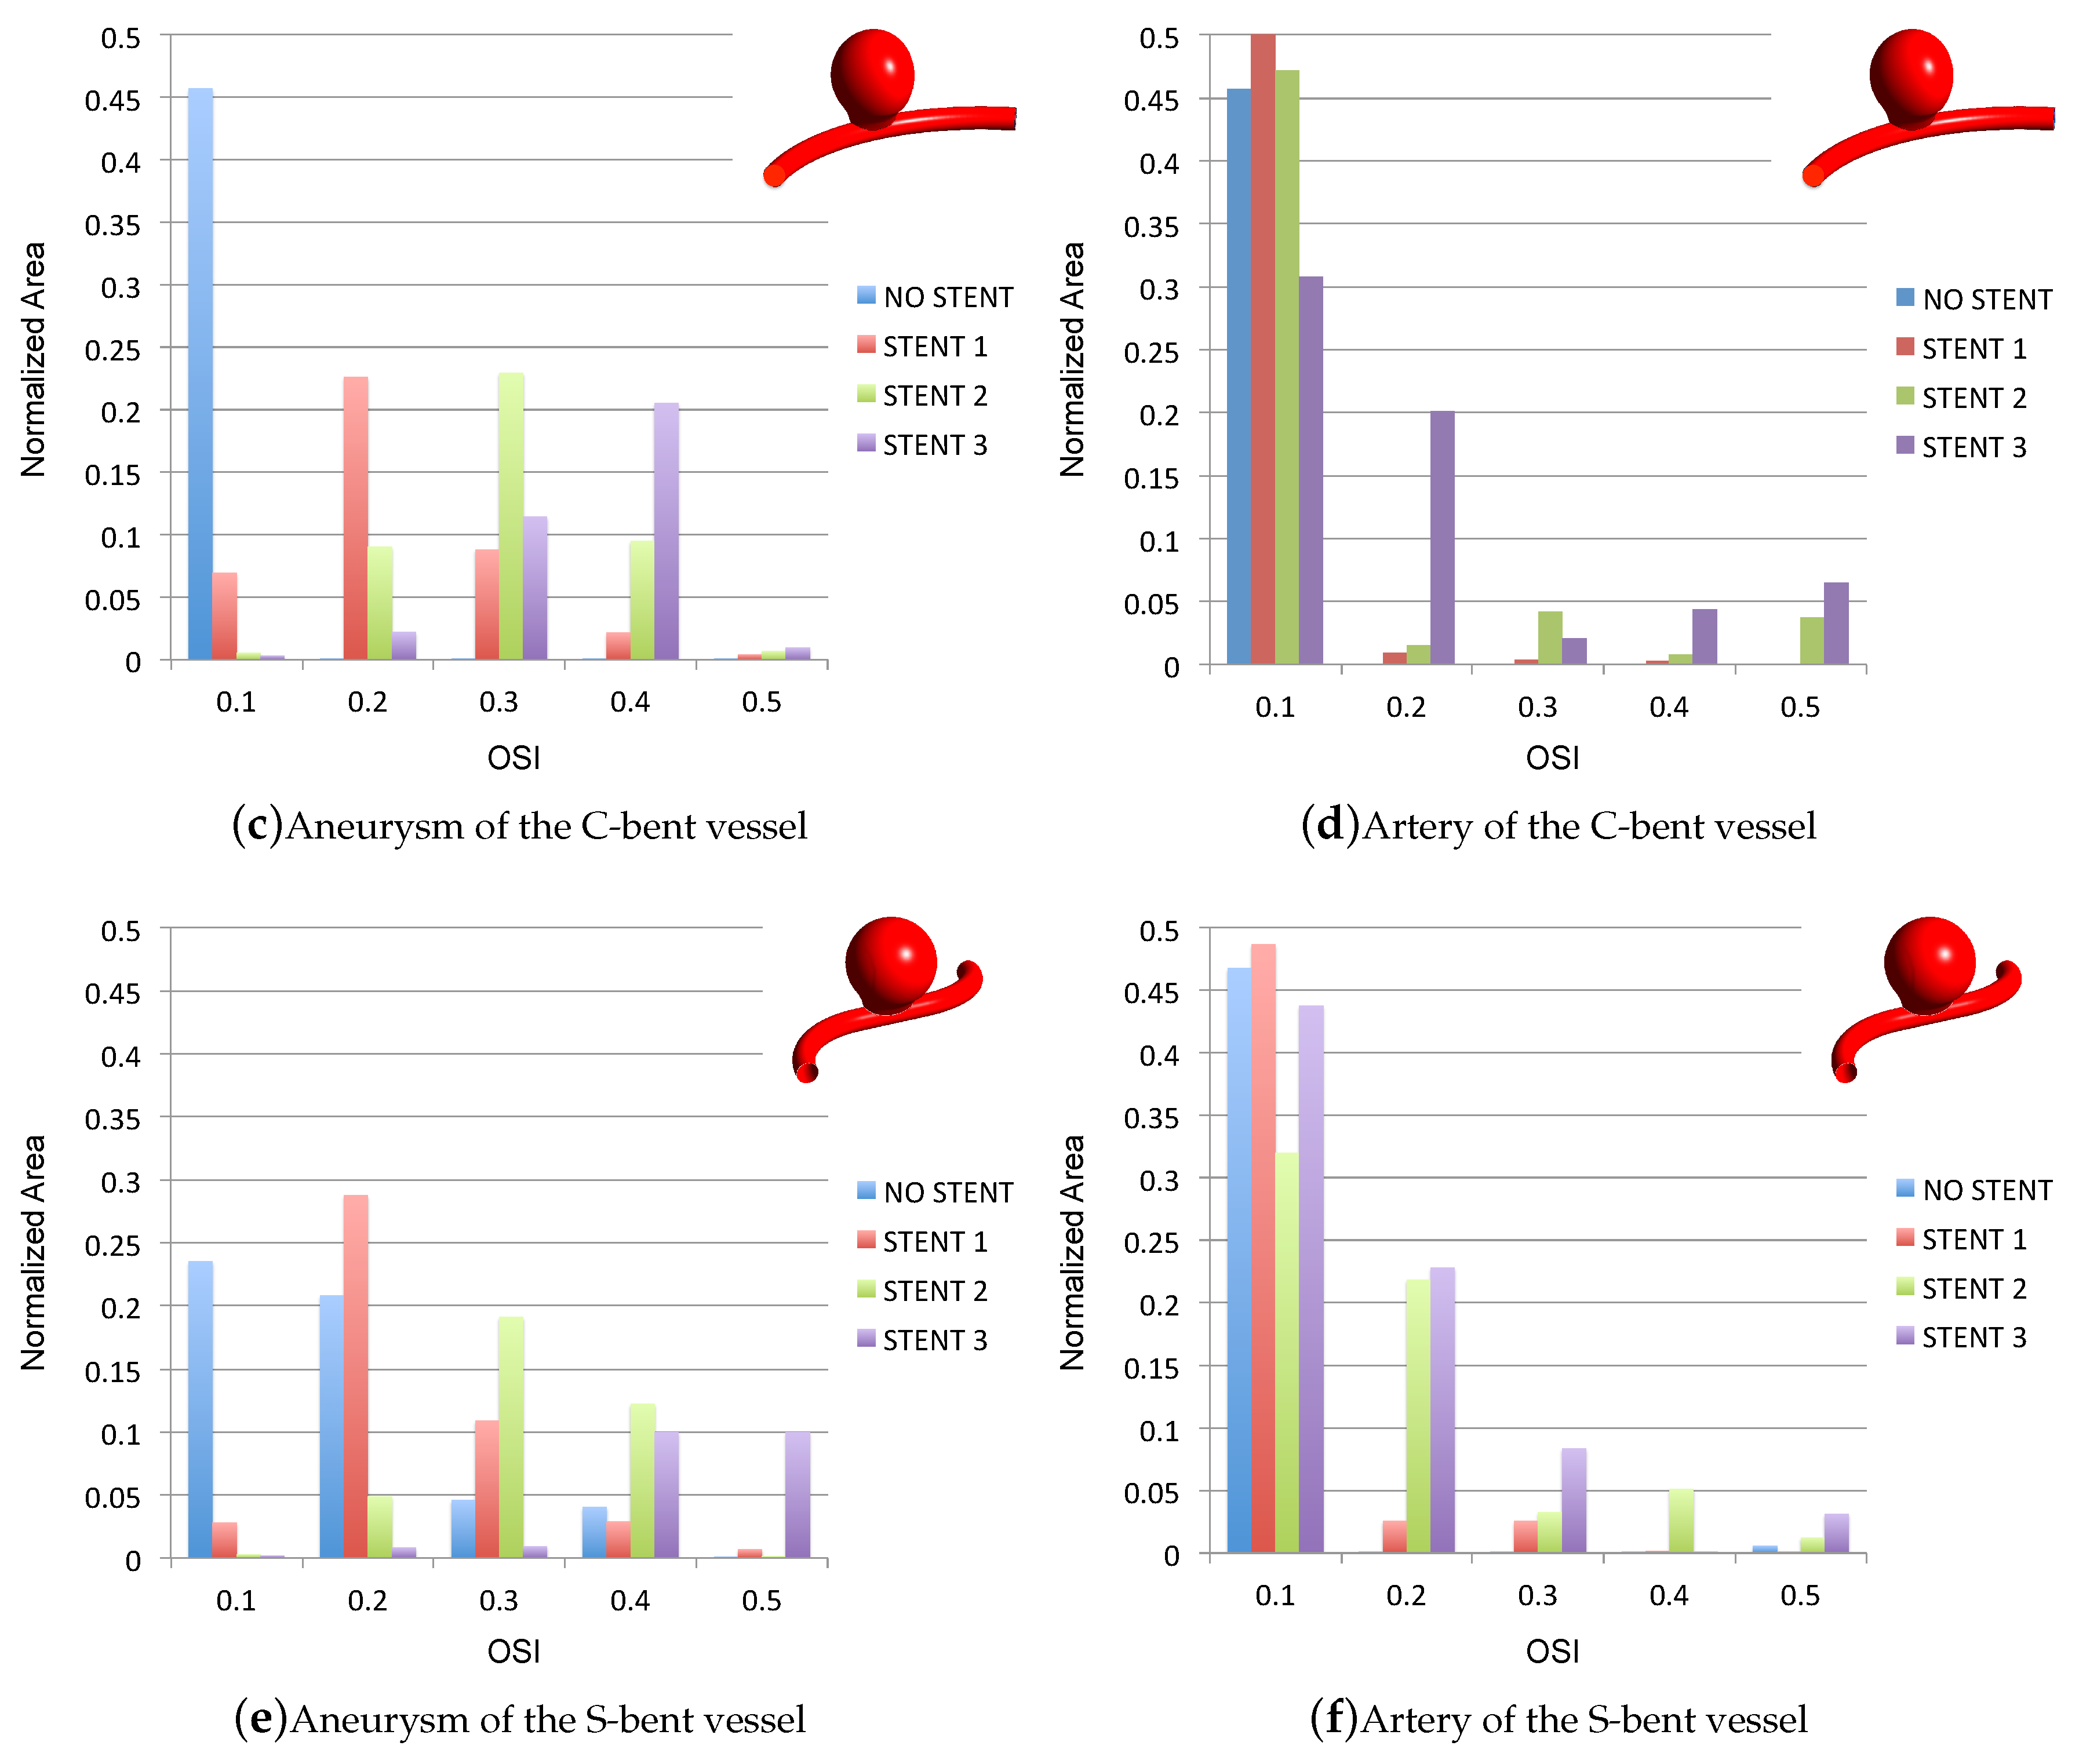
3.3. Impact of the Stents on the WSS-Related Indices: OSI

Contrarily to the TAWSS distribution, the OSI spatial distribution depicted in Figure 7 looks non-uniform and reveals a clear increase from left to right. The STENT 1, STENT 2 and STENT 3 promote a visible increase of the OSI that is progressively larger in the order STENT 3 ≫ STENT 2 ≫ STENT 1. The increasing OSI may be related to a large recirculation within the dome of the aneurysm. However, regions with local high OSI values have been also related to the rupture of the aneurysm [44]. In this sense, it is possible to see that all the implants promote local regions with high OSI values near the aneurysmatic neck. Qualitatively, from Figure 7 this result seems to be independent of the type of implant and the configuration.
In particular, it seems that the worst situation occurred in the in the S-bent vessel. The extent of the region with high OSI values seems to be reduced for the V-bent and C-bent configurations. The OSI generally increased for the configurations with the stents, and this could benefit the development of the desired thrombosis. In addition, it should be observed that the non-stented vessel does not result in high values for this variable. A local increase of the WSS-derived indices that could lead to an adverse modification of the flow activity inside the aneurysmal sac has been found by other authors [32]. These regions can be observed also in Figure 8a,c,e within the aneurysm and Figure 8b,d,f within the artery. OSI = 0.1 is present in around the 50 % of the artery (see Figure 8b,d,f). In the aneurysm, the effect of the stent is clearly visible as the OSI tends to increase when the stents are introduced. Increased maximal values of the OSI can be seen for each stented configuration. In addition, it is clearly visible that the stent that promotes the highest increase in the OSI values inside the aneurysmal sac is STENT 3 (OSI = 0.4–0.5 in 10 to around 20 % of the model depending on the configuration). As mentioned before, from a qualitative point of view, the increase of the region with OSI = 0.5 is considered extremely important for aneurysm rupture. However, also STENT 2 also promotes an increase of OSI that ranges from 0.3 to 0.4 in around 20 % of the whole models. Within the artery, all the stents promote moderate increases of the OSI, especially STENT 2 in the V-bent configuration (OSI = 0.5 on about the 20 % of the model; see Figure 8b) and STENT 3 (OSI = 0.3–0.5 on about 10–15% of the areas of the models depending on the configuration, as shown in Figure 8d,f).

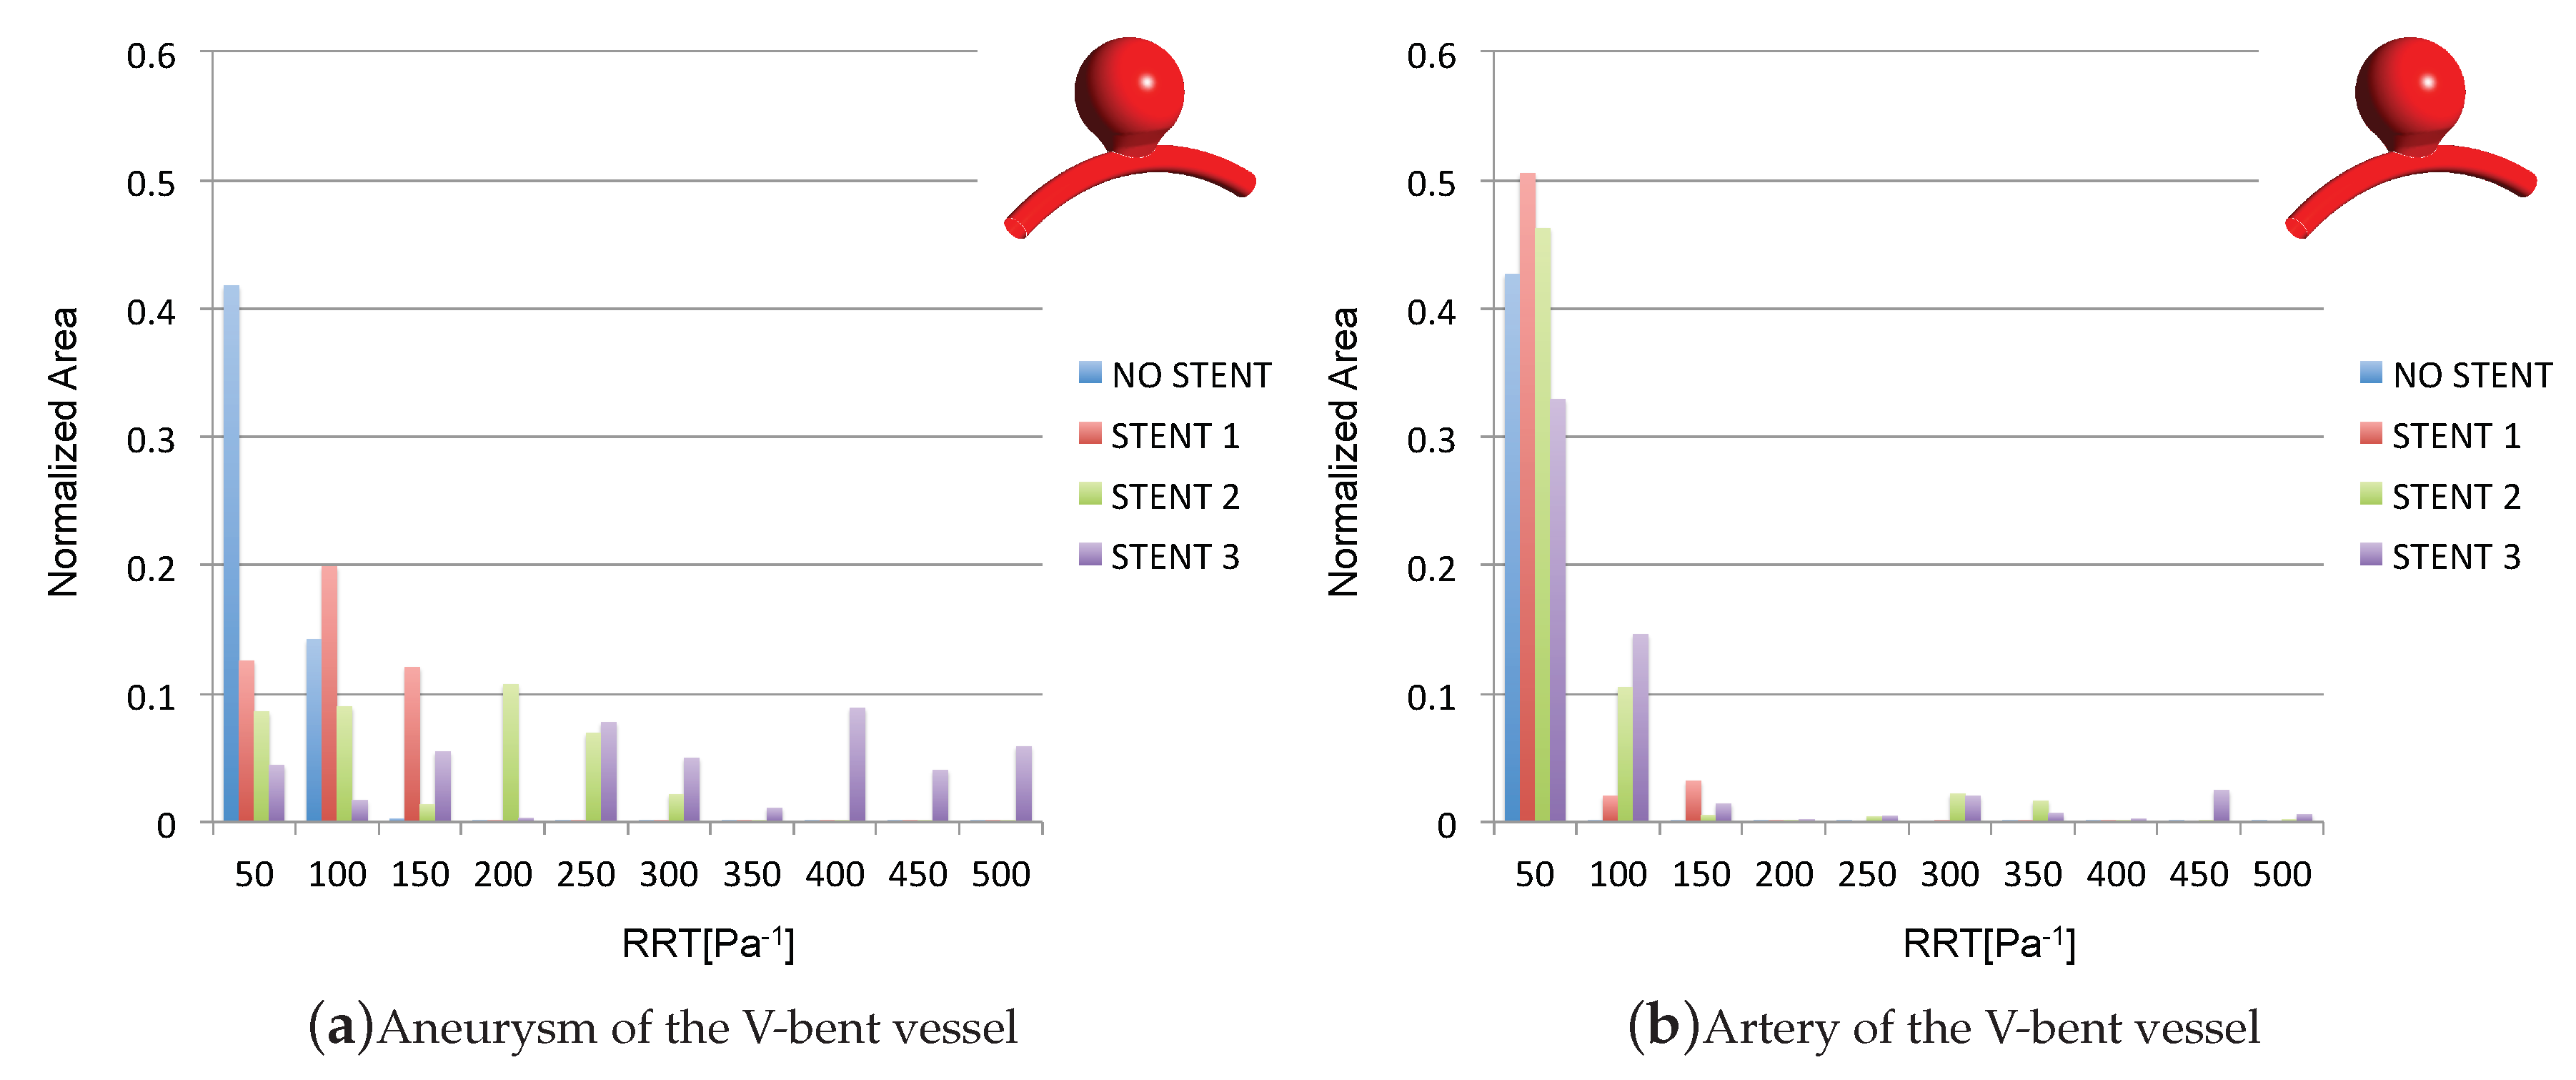
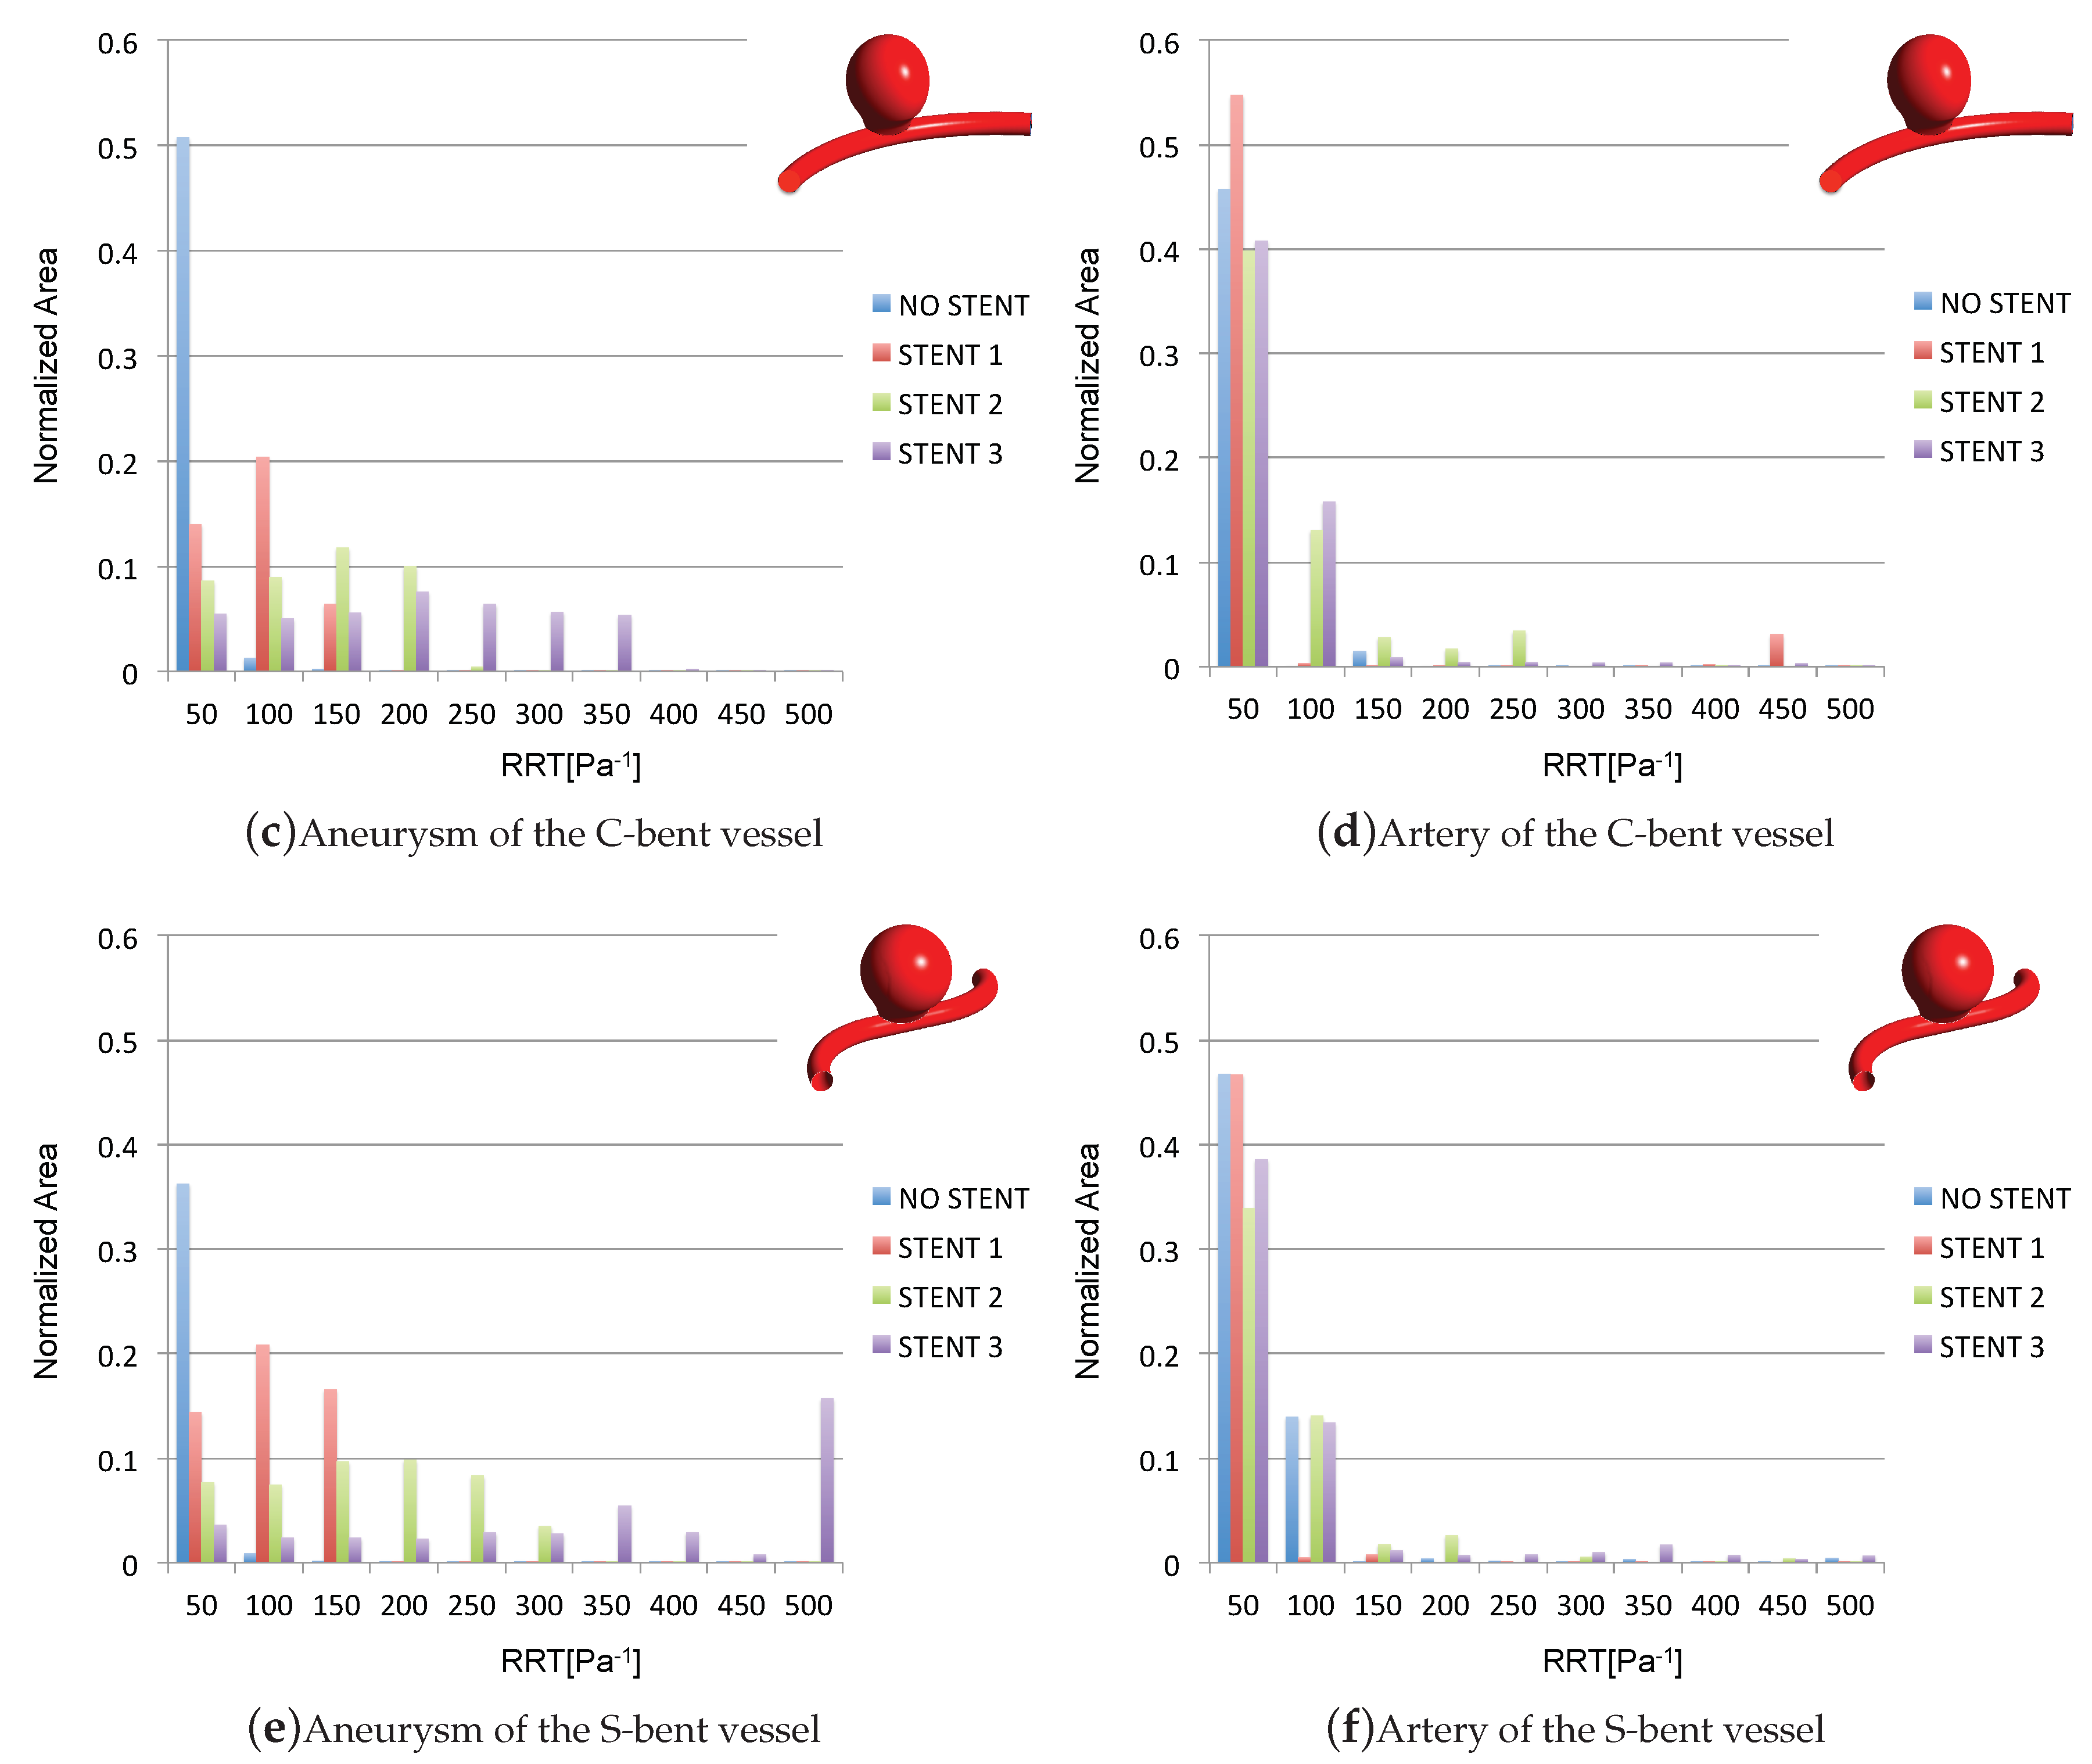
3.4. Impact of the Stents on the WSS-Related Indices: RRT

The RRT is a very interesting variable, as it provides a measure of the relative increase of blood residence time within the aneurysm sac. As discussed, in the literature it has been often related to the tendency of thrombus formation within the aneurysmal sac and hence to the efficiency of the stent. For this reason, it can be used as a parameter for the hemodynamic environment promoted by the placement of a flow diverting device and the consequent desired occlusion of the sac [6,28]. The obtained RRT spatial distributions seem different from those found in a previous study with a straight vessel configuration [28]. This confirms that the geometry of the artery is crucial for assessing the stent performances [10]. Due to the diverted flow and the induced change of the flow structure, the RRT within the aneurysm is higher for all the stented models compared to the non-stented cases, as visible from Figure 9. This increase can be explained by the large high-OSI regions on the aneurysmatic dome analyzed before. Large recirculations within the sac promote a higher residence time that should induce the required occlusion of the aneurysm. While all the stents promote an increase of RRT, it progressively increases in the order STENT 3 ≫ STENT 2 ≫ STENT 1. STENT 3 systematically promotes the highest RRT.
When looking at the distribution of the RRT over normalized areas depicted in Figure 10a–f, the results can be seen more clearly. In all aneurysms, STENT 3 promotes a more pronounced increase of regions with higher RRT, especially for RRT 200 Pa 1 (see Figure 10a,c,e). These regions are of about 5% to 15 % of the whole models. For this reason, STENT 3 seems to provide the most potential for aneurysm thrombosis. In contrast, for 200 Pa 1 RRT 100 Pa 1 , STENT 1 and STENT 2 induce a more noticeable increase compared to STENT 3. In general, within the artery, as expected the RRT looks quite small independent of the presence of the stents (around 50 Pa 1 ). This tends to affect a range of area of about 32% to 55 % of the entire models. The latter contributes to enhance the situation of the aneurysm where RRT is very small without stent (less than 50 Pa 1 in about 38–51% of the models) but tends to drastically increase once the stents are introduced (compare Figure 10a,c,e). As commented, the highest increase is promoted by STENT 3 (for RRT greater than 200 Pa 1 ).

4. Discussion

The use of flow diverting stents for treating cerebral aneurysms originated as a complementary technique to other endovascular treatments [6]. Successive clinical trials and experimental studies have shown that these devices are capable of reducing the intra-aneurysmal flow and of promoting the desired occlusion. Recent advances have produced the development of flexible, low porosity devices that have shown improved performances compared to the previous flexible, high porosity or rigid, low porosity stents. However, further study is still necessary for the development and the optimization of these devices as well as for the planning of the therapies. In this context, we have analyzed the performance of three flow diverting stents and the impact that these devices may have in different vessel geometrical configurations, which present variations of curvature and tortuosity in similar way as cerebral arteries. Notable curvature and high tortuosity characterize the geometries of these vessels. For this reason, high flexibility is desired for a FDS even if this aspect is not accompanied by the necessary porosity. High reported rates of successful FDS endovascular procedures generally indicate that the hemodynamic change induced by a FDS is responsible for the complete aneurysm occlusion. In the literature, it is assumed that a specific threshold should exist regarding the minimum necessary flow rate reduction that would promote thrombosis [10]. This threshold can be assessed by computational simulations that evaluate not only the reduction of flow but also the hemodynamical indices that could help to predict the recirculation of blood flow within the aneurysmatic sac (such as the RRT and the OSI) and the risk of rupture (such as the TAWSS and the OSI) [46]. In the literature it is also stated that the value of OSI for ruptured aneurysms is higher than that for unruptured aneurysms [44]. The presented results show that the flow diverting devices increase the OSI at the dome when reducing porosity. This means that even if they promote a considerable flow reduction, they may still increase the risk of rupture. On the contrary, the porosity reduction promotes an increase of the RRT, which is desirable for guaranteeing the necessary occlusion. Previous studies have suggested the velocity or flow reduction as variables for predicting the FDS-induced desired thrombosis [9,10,16]. The structure of the flow has also been considered for assessing the local hemodynamics within the stented aneurysm [13,16]. However, as demonstrated in the presented results and in those of other studies [6,44] it is clear that the hemodynamic indices should be evaluated for having the entire picture on stenting effectiveness.
The geometry of the artery in the presence of an aneurysm has been recognized to be crucial for assessing the flow characteristics and hence the effectiveness of the stent [13]. Higher vessel curvatures for example drastically reduces the capability of the stent to divert the flow [13]. The stent itself has also been found to strongly influence the arterial geometry [33]. Additionally, recent studies have shown that the vessel deformation induced by the flow diverting device may provide an unfavorable hemodynamic environment for thrombus formation [32]. For this reason, in this study we have analyzed and compared different geometrical configurations with and without the device. Even though the stented configuration shows a reduction of the flow within the aneurysm for the curved and the tortuous vessel, in comparison with the straight configuration analyzed in previous studies [28], its effectiveness is reduced. Kim et al. [2] found that higher curvature was associated with diminished ability of the stents to reduce the flow, with increased stasis, and with reduced maximal WSS. Seshadhri et al. [6] found a drastic increase of the velocity and of the WSS for curved vessels compared to the straight vessel. The stents that they have considered were however capable of reducing flow activity and related hemodynamic indicators in all situations. Our results provide similar conclusions, even they highlight that the high porosity stent is also capable of promoting a considerable flow reduction within the sac that may cause aneurysm occlusion. Surprisingly, we found that the stent porosity seems to have less influence on the flow reduction compared to the geometry of the vessel. The latter seems to drive the performance of the FDS. In this sense, the behavior of the three devices has been found to be very different when compared to each other. A previous study in the field has suggested the importance of considering a realistic geometry of the vascular system for quantifying the stenting efficiency [6]. On the contrary, the behavior of the three considered FDSs seems very similar regarding the increase of the OSI in the neck that is an important negative effect of the stent placement, as also stated in recent studies [32]. From the presented results, it seems that the geometrical configurations considerably modify the recirculation inside the aneurysmatic sac when compared to the straight artery considered in [28]. As a consequence, the stent is less effective in regards to the OSI compared to the findings presented in [28]. Nevertheless, the flow structure changes induced by STENT 2 suggest that the region with high OSI is larger than those induced by the other 2 devices, even though it produces the highest RRT within the sac. In this sense, the effectiveness of a device with low porosity in comparison to one with high porosity is still controversial. Nonetheless, we demonstrated that given the geometry of the vascular system the results provided by devices with varying porosity can be significantly different in terms of hemodynamics indicators, even though the fundamental mission of diverting flow is always achieved.

5. Limitations

The results presented in this work are affected by limitations that can be summarized as follows. The models and simulation results did not consider the interaction between blood flow and arterial walls, the real stent mechanical behavior and the arterial compliance. The rigid walls approximation could of course influence flow patterns and hence the WSS related indices. Furthermore, no information about the stent structural behavior and arterial stresses and strains can be given. However, in the literature it is stated that the vessel motion in cerebral aneurysm hemodynamics is limited [39]. Additionally, in the literature, the necessity of using FSI in stented artery is still debated as its influence on the WSS related variables is limited [47].
Additionally, the results are not validated with an appropriate experimental study or with a clinical follow up study. Finally, it has to be observed that the present study offers the possibility of more extended patient-specific analyses in which the real effect of the stent placement on the geometry of the cerebral artery can be more accurately studied. The latter include the straightening promoted by the FDS depending on its rigidity/porosity, etc. [24,33].
Lastly, there are common locations of the aneurysm which are very different from that considered, such as the cavernous portion of internal carotid artery and/or portions of the vertebral artery. In the former, the parental artery is more curved compared to that considered in the present study. In the latter, the aneurysm sacs have a lower dome/neck ratio, rather than a spherical shape. These aspects reinforce the necessity of patient-specific studies, as discussed in the literature [10,48].

6. Conclusions

This study explored the impacts of different geometrical configurations on the performances of three different stents. Our results show that the examined stents all accomplish the desired reduction of flow rate into the aneurysm, including the recently designed stent that features the highest porosity. Our results also illustrate that the reduced flow rate depends on the vessel’s geometrical configuration more than on the stent porosity. For each vessel configuration, the flow rate reduction varies, depending on the stent porosity. Based on the computed hemodynamic indices for stented models, we found a very similar behavior regarding the TAWSS and the OSI, while the low porosity stent seems to promote the highest RRT. While further studies are needed to find new hemodynamics thresholds that may improve vascular procedures, the obtained results might help address the definition of the necessary hemodynamic environment for the treatment of intracranial aneurysms.

Author Contributions

Study design, X.C., D.J.B., M.M., L.P. and M.E.K.; conceptualization, X.C., M.E.K. and M.M.; geometries, P.R.C.-V. and M.M.; numerical simulations, P.R.C.-V. and M.M.; data curation, L.P. and M.E.K.; writing—original draft preparation, M.M., X.C., R.D.L. and D.J.B.; writing—review and editing, M.M., R.D.L., X.C. and D.J.B.; supervision, X.C. and M.M.; funding acquisition, X.C. and M.M. All authors have read and agreed to the published version of the manuscript.

Funding

This research was funded by the Saskatchewan Health Research Foundation (SHRF grant reference # 2784 ). M. Malvè was supported by grant PRX17/00335 financed by the Spanish Ministry of Education within the National Program “Salvador de Madariaga.” The support of the Spanish Ministry of Economy, Industry and Competitiveness through research project DPI2017-83259-R (AEI/FEDER,UE) and of the Department of Economic Development of the Navarra Government through research project PC086-087-088 CONDE is highly appreciated. Finally, we gratefully acknowledge the Instituto de Salud Carlos III (ISCIII) through the CIBER-BBN initiative.

Conflicts of Interest

The authors declare no conflict of interest.

References

  1. Valencia, A.; Morales, H.; Rivera, R.; Bravo, E.; Galvez, M. Blood flow dynamics in patient-specific cerebral aneurysm models: The relationship between wall shear stress and aneurysm area index. Med. Eng. Phys. 2008, 30, 329–340. [Google Scholar] [CrossRef]
  2. Kim, Y.H.; Xu, X.; Lee, J.S. The Effect of Stent Porosity and Strut Shape on Saccular Aneurysm and its Numerical Analysis with Lattice Boltzmann Method. Ann. Biomed. Eng. 2010, 38, 2274–2292. [Google Scholar] [CrossRef]
  3. Roloff, C.; Bordás, R.; Nickl, R.; Mátrai, Z.; Szilárd, N.S.S.; Thévenin, D. Investigation of the velocity field in a full-scale model of a cerebral aneurysm. Int. J. Heat Fluid Flow 2013, 43, 212–219. [Google Scholar] [CrossRef]
  4. Csippa, B.; Závodszky, G.; Paál, G.; Szikora, I. A new hypothesis on the role of vessel topology in cerebral aneurysm initiation. Comput. Biol. Med. 2018, 103, 244–251. [Google Scholar] [CrossRef]
  5. Weibers, D.O.; Whisnant, J.P.; Houston, J., III; Meissner, I.; Brown, R.D., Jr.; Piepgras, D.G.; Forbes, G.S.; Thielen, K.; Nichols, D.; O’ Fallon, W.M.; et al. International Study of Unruptured Intracranial Aneurysms Investigators. Unruptured intracranial aneurysm: Natural history, clinical outcome, and risks of surgical and endovascular treatment. Lancet 2003, 362, 103–110. [Google Scholar]
  6. Seshadhri, S.; Janiga, G.; Beuing, O.; Skalej, M.; Thevenin, D. Impact of stents and flow diverters on hemodynamics in idealized aneurysm models. J. Biomech. Eng. 2011, 133, 071005. [Google Scholar] [CrossRef]
  7. Kulcsár, Z.; Augsburger, L.; Reymond, P.; Pereira, V.M.; Hirsch, S.; Mallik, A.S.; Millar, J.; Wetzel, S.G.; Wanke, I.; Rufenacht, D.A. Flow diversion treatment: Intra-aneurismal blood flow velocity and WSS reduction are parameters to predict aneurysm thrombosis. Acta Neurochir. (Wien) 2012, 154, 1827–1834. [Google Scholar] [CrossRef] [Green Version]
  8. Anzai, H.; Ohta, M.; Falcone, J.L.; Chopard, B. Optimization of flow diverters for cerebral aneurysms. J. Comput. Sci. 2012, 3, 1–7. [Google Scholar] [CrossRef] [Green Version]
  9. Mut, F.; Raschi, M.; Scrivano, E.; Bleise, C.; Chudyk, J.; Ceratto, R.; Lylyk, P.; Cebral, J.R. Association between hemodynamic conditions and occlusion times after flow diversion in cerebral aneurysms. J. Neurointerv. Surg. 2015, 7, 286–290. [Google Scholar] [CrossRef]
  10. Ouared, R.; Larrabide, I.; Brina, O.; Bouillot, P.; Erceg, G.; Yilmaz, H.; Lovblad, K.O.; Mendes Pereira, V. Computational fluid dynamics analysis of flow reduction induced by flow-diverting stents in intracranial aneurysms: A patient-unspecific hemodynamics change perspective. J. NeuroInterv. Surg. 2016, 8, 1–6. [Google Scholar] [CrossRef]
  11. Lylyk, P.; Miranda, C.; Ceratto, R.; Ferrario, A.; Scrivano, E.; Luna, H.R.; Berez, A.L.; Tran, Q.; Nelson, P.K.; Fiorella, D. Curative endovascular reconstruction of cerebral aneurysms with the pipeline embolization device: The Buenos Aires experience. Neurosurgery 2009, 64, 632–642. [Google Scholar] [CrossRef] [Green Version]
  12. Becske, T.; Kallmes, D.F.; Saatci, I.; McDougall, C.G.; Szikora, I.; Lanzino, G.; Moran, C.J.; Woo, H.H.; Lopes, D.K.; Berez, A.L.; et al. Pipeline for uncoilable or failed aneurysms: Results from a multicenter clinical trial. Radiology 2013, 267, 858–868. [Google Scholar] [CrossRef]
  13. Kim, M.; Taulbee, D.B.; Tremmel, M.; Meng, H. Comparison of Two Stents in Modifying Cerebral Aneurysm Hemodynamics. Ann. Biomed. Eng. 2008, 36, 726–741. [Google Scholar] [CrossRef] [PubMed]
  14. Wang, C.; Tian, Z.; Liu, J.; Jing, L.; Paliwal, N.; Wang, S.; Zhang, Y.; Xiang, J.; Siddiqui, A.H.; Meng, H.; et al. Flow diverter effect of LVIS stent on cerebral aneurysm hemodynamics: A comparison with Enterprise stents and the Pipeline device. J. Transl. Med. 2016, 14, 199. [Google Scholar] [CrossRef] [PubMed] [Green Version]
  15. Zhao, Y.; Wang, Y.; Kao, E.; Flórez-Valencia, L.; Courbebaisse, G. Towards optimal flow diverter porosity for the treatment of intracranial aneurysm. J. Biomech. 2016, 82, 20–27. [Google Scholar]
  16. Dholakia, R.; Sadasivan, C.; Fiorella, D.J.; Woo, H.H.; Lieber, B.B. Hemodynamics of Flow Diverters. J. Biomech. Eng. 2017, 139, 021002-10. [Google Scholar] [CrossRef] [PubMed] [Green Version]
  17. Lieber, B.B.; Stancampiano, A.P.; Wakhloo, A.K. Alteration of hemodynamics in aneurism models by stenting: Influence on stent porosity. Ann. Biomed. Eng. 1997, 25, 460–469. [Google Scholar] [CrossRef] [PubMed]
  18. Lieber, B.B.; Livescu, V.; Hopkins, L.N.; Wakhloo, A.K. Particle image velocimetry assessment of stent design influence on intra-aneurysmal flow. Ann. Biomed. Eng. 2002, 30, 768–777. [Google Scholar] [CrossRef] [PubMed]
  19. Cebral, J.R.; Mut, F.; Raschi, M.; Scrivano, E.; Ceratto, R.; Lylyk, P.; Putman, C.M. Aneurysm rupture following treatment with flow-diverting stents: Computational hemodynamics analysis of treatment. Am. J. Neuroradiol. 2011, 32, 27–33. [Google Scholar] [CrossRef] [PubMed] [Green Version]
  20. Mut, F.; Cebral, J.R. Effects of flow-diverting device oversizing on hemodynamics alteration in cerebral aneurysms. Am. J. Neuroradiol. 2012, 33, 2010–2016. [Google Scholar] [CrossRef] [PubMed] [Green Version]
  21. Zhang, Y.; Chong, W.; Qian, Y. Investigation of intracranial aneurysm hemodynamcs following flow diverter stent treatment. Med. Eng. Phys. 2013, 35, 608–615. [Google Scholar] [CrossRef]
  22. Larrabide, I.; Aguilar, M.L.; Morales, H.G.; Geers, A.J.; Kulcsár, Z.; Rufenacht, D.; Frangi, A.F. Intra-aneurysmal pressure and flow changes induced by flow diverters: Relation to aneurysm size and shape. Am. J. Neuroradiol. 2013, 34, 816–822. [Google Scholar] [CrossRef] [PubMed] [Green Version]
  23. Levitt, M.R.; McGah, P.M.; Aliseda, A.; Mourad, P.D.; Nerva, J.D.; Vaidya, S.S.; Morton, R.P.; Ghodke, B.V.; Kim, L.J. Cerebral aneurysms treated with flow-diverting stents: Computational models with intravascular blood flow measurements. Am. J. Neuroradiol. 2014, 35, 143–148. [Google Scholar] [CrossRef] [PubMed] [Green Version]
  24. Larrabide, I.; Geers, A.J.; Morales, H.G.; Aguilar, M.L.; Rufenacht, D.A. Effect of Aneurysm and ICA Morphology on Hemodynamics Before and After Flow Diverter Treatment. J. Neurointerv. Surg. 2015, 7, 272–280. [Google Scholar] [CrossRef] [PubMed]
  25. Larrabide, I.; Geers, A.J.; Morales, H.G.; Bijlenga, P.; Rufenacht, D.A. Change in aneurysmal flow pulsatility after flow diverter treatment. Comput. Med. Imaging Graph. 2016, 50, 2–8. [Google Scholar] [CrossRef] [PubMed]
  26. Wu, W.T.; Li, Y.; Aubry, N.; Massoudi, M.; Antaki, J.F. Numerical Simulation of Red Blood Cell-Induced Platelet Transport in Saccular Aneurysms. Appl. Sci. 2017, 7, 484. [Google Scholar] [CrossRef]
  27. Li, Y.; Zhang, M.; Verrelli, D.I.; Chong, W.; Ohta, M.; Qian, Y. Numerical simulation of aneurysmal haemodynamics with calibratedporous-medium models of flow-diverting stents. J. Biomech. 2018, 80, 88–94. [Google Scholar] [CrossRef]
  28. Catalán-Echeverría, B.; Kelly, M.E.; Peeling, L.; Bergstrom, D.; Chen, X.; Malvè, M. CFD-based Comparison Study of a New Flow Diverting Stent and Commercially-Available Ones for the Treatment of Cerebral Aneurysms. Appl. Sci. 2019, 9, 1341. [Google Scholar] [CrossRef] [Green Version]
  29. Sarrami-Foroushani, A.; Lassila, T.; Hejazi, S.M.; Nagaraja, S.; Bacon, A.; Frangi, A.F. A computational model for prediction of clot platelet content in flow-diverted intracranial aneurysm. J. Biomech. 2019, 91, 7–13. [Google Scholar] [CrossRef]
  30. Pereira, V.M.; Bonnefous, O.; Ouared, R.; Brina, O.; Stawiaski, J.H.; Aerts, H.; Ruijters, D.; Narata, A.P.; Bijlenga, P.; Schaller, K.; et al. A DSA-based method using contrast-motion estimation for the assessment of the intra-aneurysmal flow changes induced by flow-diverter stents. Am. J. Neuroradiol. 2013, 34, 808–815. [Google Scholar] [CrossRef] [Green Version]
  31. Seibert, B.; Tummala, R.P.; Chow, R.; Faridar, A.; Moudavi, S.A.; Divani, A.A. Intracranial aneurysm: Review of current treatment options and outcomes. Front. Neurol. 2011, 2, 1–11. [Google Scholar] [CrossRef] [PubMed] [Green Version]
  32. Jeong, W.; Han, M.H.; Rhee, K. The hemodynamic alterations induced by the vascular angular deformation in stent-assisted coiling of bifurcation aneurysms. Comput. Biol. Med. 2014, 53, 1–8. [Google Scholar] [CrossRef] [PubMed]
  33. Voss, S.; Beuing, O.; Janiga, G.; Berg, P. Stent-induced vessel deformation after intracranial aneurysm treatment—A hemodynamic pilot study. Comput. Biol. Med. 2019, 11, 103338. [Google Scholar] [CrossRef] [PubMed]
  34. Fukuda, S.; Shimogonya, Y.; Yonemoto, N. Differences in Cerebral Aneurysm Rupture Rate According to Anatomies Depend on the Hemodynamics Environment. Am. J. Neuroradiol. 2019, 40, 834–839. [Google Scholar] [CrossRef]
  35. Li, W.; Liu, J.; Zhang, Y.; Wang, K.; Wang, Y. Flow Diversion and Outcomes of Vertebral Fusiform Aneurysms After Stent-Only Treatment: A Hemodynamic Study. World Neurosurg. 2017, 107, 202–210. [Google Scholar] [CrossRef]
  36. Wang, S.; Zhang, Y.; Feng, J.; Huang, Y.; Tokgoz, A.; Gillard, J.; Lu, Q.; Teng, Z. Influence of overlapping pattern of multiple overlapping uncovered stents on the local mechanical environment: A patient-specific parameter study. J. Biomech. 2017, 188–196, 202–210. [Google Scholar]
  37. Wang, S.; Zhang, Y.; Feng, J.; Huang, Y.; Hui, P.; Gillard, J.H.; Lu, Q.; Teng, Z. The role of porosity and 3D cross-stent configuration of multiple overlapping uncovered stents in the management of complex aortic aneurysms—Insights from haemodynamics. Med. Nov. Technol. Devices 2019, 3, 100020. [Google Scholar] [CrossRef]
  38. Han, X.; Wu, X.; Kelly, M.; Chen, X.B. Fabrication and Optimal Design of Biodegradable Polymeric Stents for Aneurysms Treatments. J. Funct. Biomater. 2017, 8, 8. [Google Scholar] [CrossRef] [Green Version]
  39. Torii, R.; Oshima, M.; Kobayashi, T.; Takagi, K.; Tezduyar, T.E. Fluid-structure interaction modeling of blood flow and cerebral aneurysm: Significance of artery and aneurysm shapes. Comput. Methods Appl. Mech. Eng. 2009, 198, 3613–3621. [Google Scholar] [CrossRef]
  40. Ansys Inc. Ansys CFX Theory Manual v.16; Ansys Software: Canonsburg, PA, USA, 2016. [Google Scholar]
  41. Jou, L.D.; Lee, D.H.; Morsi, H.; Mawad, M.E. Wall shear stress on ruptured and unruptured intracranial aneurysms at the internal carotid artery. Am. J. Neuroradiol. 2008, 29, 1761–1767. [Google Scholar] [CrossRef] [Green Version]
  42. He, X.; Ku, D.N. Pulsatile flow in the human left coronary artery bifurcation: Average conditions. J. Biomech. Eng. 1996, 118, 74–82. [Google Scholar] [CrossRef] [PubMed]
  43. Himburg, H.A.; Grzybowski, D.M.; Hazel, A.L.; LaMack, J.A.; Li, X.M.; Friedman, M.H. Spatial comparison between wall shear stress measures and porcine arterial endothelial permeability. Am. J. Physiol. Heart Circ. Physiol. 2004, 286, H1916–H1922. [Google Scholar] [CrossRef] [PubMed] [Green Version]
  44. Xiang, J.; Natarajan, S.K.; Tremmel, M.; Ma, D.; Mocco, J.; Hopkins, L.N.; Siddiqui, A.H.; Levy, E.I.; Meng, H. Hemodynamic-Morphologic Discriminants for Intracranial Aneurysm Rupture. Stroke 2011, 42, 144–152. [Google Scholar] [CrossRef] [Green Version]
  45. Anzai, H.; Falcone, J.L.; Chopard, B.; Hayase, T.; Ohta, M. Optimization of Strut Placement in Flow Diverter Stents for Four Different Aneurysm Configurations. J. Biomech. Eng. 2014, 136, 061006. [Google Scholar] [CrossRef] [PubMed]
  46. Zhu, G.Y.; Wei, Y.; Su, Y.L.; Yuan, Q.; Yang, C.F. Impacts of Internal Carotid Artery Revascularization on Flow in Anterior Communicating Artery Aneurysm: A Preliminary Multiscale Numerical Investigation. Appl. Sci. 2019, 9, 4143. [Google Scholar] [CrossRef] [Green Version]
  47. Chiastra, C.; Migliavacca, F.; Martínez, M.A.; Malvè, M. On the necessity of modelling fluid-structure interaction for stented coronary arteries. J. Mech. Behav. Biomed. Mater. 2014, 34, 217–230. [Google Scholar] [CrossRef]
  48. Wu, Y.F.; Yang, P.F.; Shen, J.; Huang, Q.H.; Zhang, X.; Qian, Y.; Liu, J.M. A comparison of the hemodynamic effects of flow diverters on wide-necked and narrow- necked cerebral aneurysms. J. Clin. Neurosci. 2012, 19, 1520–1524. [Google Scholar] [CrossRef]
Figure 1. (a) Geometrical characteristics of the giant saccular aneurysm employed in this study [13] with the baseline straight artery [28] and the considered geometric configurations. Sidewall aneurysm model with (b) V-bent artery, (c) C-bent artery and (d) S-bent artery. Straight configuration of the FDSs: (e) STENT 1 ( 90 % porosity), (f) STENT 2 ( 80 % porosity) and (g) STENT 3 ( 70 % porosity).
Applsci 10 05239 g001
Figure 2. Streamlines introduced at the inlet of each model, colored with the local velocity magnitude, plotted at the peak flow during systole for the same vascular geometry and for the three flow diverter stents considered in this study: (a) no stent, (b) STENT 1, (c) STENT 2 and (d) STENT 3.
Applsci 10 05239 g002
Figure 3. Streamlines introduced at the inlet of each model, colored with the local velocity magnitude, plotted at diastole for the same vascular geometry and for the three flow diverter stents considered in this study: (a) no stent, (b) STENT 1, (c) STENT 2 and (d) STENT 3.
Applsci 10 05239 g003
Figure 4. Flow reduction promoted by the FDSs within the aneurysm sac.
Applsci 10 05239 g004aApplsci 10 05239 g004b
Figure 5. Spatial distribution of the time-averaged wall shear stress (TAWSS) for the three vessel configurations (top row, V-bent vessel; middle row, C-bent vessel; bottom row, S-bent vessel) and the three stents: (a) no stent, (b) STENT 1, (c) STENT 2 and (d) STENT 3.
Applsci 10 05239 g005
Figure 6. Histograms of the normalized area associated to the TAWSS of the aneurysm and of the artery (and stent) for V-bent, C-bent and S-bent vessel configurations. The depicted areas are normalized with respect to the area of whole geometry model.
Applsci 10 05239 g006aApplsci 10 05239 g006b
Figure 7. Spatial distribution of the shear index (OSI) for the three vessel configurations (top row, V-bent vessel; middle row, C-bent vessel; bottom row, S-bent vessel) and the three stents: (a) no stent, (b) STENT 1, (c) STENT 2 and (d) STENT 3.
Applsci 10 05239 g007
Figure 8. Histograms of the normalized area associated to the OSI of the aneurysm and of the artery (and stent) for V-bent, C-bent and S-bent vessel configurations. The depicted areas are normalized with respect to the area of whole geometry model.
Applsci 10 05239 g008aApplsci 10 05239 g008b
Figure 9. Spatial distribution of the relative residence time (RRT) for the three vessel configurations (top row, V-bent vessel; middle row, C-bent vessel; bottom row, S-bent vessel) and the three stents: (a) no stent, (b) STENT 1, (c) STENT 2 and (d) STENT 3.
Applsci 10 05239 g009
Figure 10. Histograms of the normalized area associated to the OSI of the aneurysm and of the artery (and stent) for V-bent, C-bent and S-bent vessel configurations. The depicted areas are normalized with respect to the area of whole geometry model.
Applsci 10 05239 g010aApplsci 10 05239 g010b
Table 1. Main dimensions of the flow-diverting stents considered.
Thickness [mm]Length [mm]Diameter [mm]Porosity
STENT 10.4404.75 90 %
STENT 20.1404.75 80 %
STENT 30.1404.75 70 %
Table 2. Summary of the geometrical cases analyzed.
VesselDiameter [mm]Aspect Ratio [mm]Stent
V-bent, C-bent, S-bent4.751.68No stent, STENT 1, 2, 3
Table 3. Summary of the computational meshes used in this study.
No StentSTENT 1STENT 2STENT 3
3D elements329,28610,949,53214,403,30618,358,866
2D elements94,8301,143,2571,040,4561,440,800

