Analysis of the Water Circulation Structure in the Paldang Reservoir, South Korea


1
Han-river Environment Research Center, National Institute of Environmental Research, Gyeonggi-do 12585, Korea
2
Research and Development Institute, GeoSystem Research Gorporation, Gyeonggi-do 15807, Korea
*
Author to whom correspondence should be addressed.
Appl. Sci. 2020, 10(19), 6822; https://doi.org/10.3390/app10196822
Submission received: 20 March 2020
/
Revised: 15 September 2020
/
Accepted: 19 September 2020
/
Published: 29 September 2020
Abstract
:In this study, results are presented for depth-specific hydraulic and water quality surveys, as well as meteorological observations, at key monitoring sites in the Paldang Reservoir, South Korea. These results were used to determine the water circulation characteristics that represent the main contributors to water quality changes. In the section before the confluence point of the two rivers, a different type of two-layer flow appeared for each. In the North Han River, backwater flowing backward in the upstream direction occurred in the surface layer, and was accompanied by two-layer flow, during the zero-discharge period of the Cheongpyeong Dam. On the other hand, in the South Han River, two-layer flow was observed in the upper layer in the downstream flow, and the thickness of upper and lower layers varied depending on the discharge rate of the Paldang Dam. Strong flow fluctuations were observed near the Paldang Dam (3 km upstream), and these were dependent on its instantaneous discharge rate. In particular, if the instantaneous discharge from the Paldang Dam remained below 400 m3/s for several days, the flow velocity in the lower layer decreased below 2 cm/s or no flow occurred. The comparison between flows during different periods associated with depth-specific water temperature variations showed that the average flow prevailed across all layers in the downstream direction at all monitoring sites during the vertical mixing period. In contrast, spatiotemporal variations in flow, such as two-layer flow and backwater, were observed during the stratification period in the South Han River and the North Han River. This led to increased residence times and vertical stability, thus creating favorable conditions for algal blooms.
1. Introduction
Reservoir water quality generally reflects various factors, such as the influence of seasonal rainfall types, tributary inflows, and the size and shape of a reservoir [1,2,3,4,5]. Reservoirs often experience spatial and temporal variations in water circulation and water quality issues, including the changes in water levels and flow rates mediated by dam structures, the formation of lentic waters, increased water residence times, stratification in water temperatures (WT) and dissolved oxygen (DO) concentrations, eutrophication processes, the occurrences of algal blooms, the generation of hypoxic layers, turbid water inflow, and the formation of density currents [6,7,8,9,10]. Water quality management practices aim to address these issues arising within reservoir environments, which requires an accurate diagnosis of the current water quality and identification of the causes of such problems [5].
In order to successfully and effectively address the issues associated with reservoir water quality, analyses of various monitoring data collected on the flows and mixing patterns of all interconnected water bodies, as well as their hydraulic relationships, with reservoir water circulation should be performed [9,10]; in particular, it would be desirable to develop strategies for improving water quality based on detailed quantification or prediction models of water quality issues. Furthermore, efficient water quality management strategies require continuing basic research that allows for all factors affecting water quality to be taken into account. Though many studies have been conducted by using statistical analyses, geographic information systems (GISs), artificial neural networks (ANNs), and numerical modeling for water resources management in South Korea and other countries [11,12,13,14,15,16,17,18,19,20,21,22,23,24,25], most of the ongoing studies currently suffer from an insufficient amount of high-quality monitoring data needed to ensure the reliability of outcomes.
The Paldang Reservoir, which is one of the major drinking water sources in South Korea, is a key component of the stream–reservoir interface in the Han River system. The South Han River, the North Han River, and the Kyeongancheon Stream, which are characterized by distinctive watershed characteristics, meet within the Paldang Reservoir. Therefore, the Paldang Reservoir exhibits complex mixing patterns and distinguishing spatiotemporal variations in hydraulics and water quality. Such complexities and peculiarities of the Paldang Reservoir warrant continuous, precise, three-dimensional monitoring surveys in the region. Several comprehensive investigations have been conducted on the hydraulic properties and water quality of the Paldang Reservoir. The National Institute of Environmental Research (NIER) [4] examined the water quality at key sites in 2007, including the boundary points of three streams flowing into the Paldang Reservoir, while performing longitudinal measurements on various parameters, such as the flow velocity and direction, by using an acoustic Doppler current profiler (ADCP). The results showed that the hydraulic and water quality characteristics of the Paldang Reservoir varied depending on the discharge conditions of upstream dams. The NIER [4] also conducted a rigorous investigation on the reservoir’s hydraulic properties and water quality, in which focus was placed on the confluence of the South Han River and the North Han River in 2008. In the same study, peak discharge from the Cheongpyeong Dam (CPD) on a periodic basis was presented as the primary cause governing the hydraulic properties and water quality at the Paldang Dam (PDD). Multiple studies have been conducted on the spatiotemporal variations in hydraulic mixing, thermal stratification, organic matter content, and nutrient salt concentrations in the Paldang Reservoir [4,7,26,27,28,29,30], as well as on applications of hydraulic and water quality analyses performed by using a numerical model for the Paldang Reservoir [11,31,32,33,34], but these studies have suffered from the insufficient availability of actual field monitoring data.
Currently, water quality monitoring in the Paldang Reservoir is being carried out by using samples or mixed samples collected at different water depths from key locations less than once per week. This dataset suffers from insufficient data points necessary to perform continuous assessments regarding the evolution of thermal stratification, temporary hypoxia in the lower layer, and mixing patterns of substances. Therefore, additional hydraulic and water quality analyses of the Paldang Reservoir can serve as an important basis for a variety of research projects on the transport and dispersion of water pollutants, the mechanisms of eutrophication, and the occurrence of algal blooms.
This study conducted velocity and water temperature surveys at different water depths for key locations in an attempt to provide a comprehensive view on the spatiotemporal characteristics of water circulation in the Paldang Reservoir. Based on the results, an examination was made of the impacts of spatiotemporal circulation variations within the Paldang Reservoir on water quality.
2. Materials and Methods
2.1. Study Area
The Han River, South Korea, is located in the central part of the Korean Peninsula within the area range of 36°30′–38°55′ N and 126°24′–129°02′ E. The river basin has an area of 34,674.0 km2, and it accounts for approximately 35% of the nation’s total land area of 99,313.5 km2. The river length is 459.3 km, and the mean basin width is 75.5 km [11]. The Han River ranks as the largest river in South Korea. The Paldang Reservoir in the Han River system plays a vital role as a primary water supply source, and this river-type lake is characterized by a short mean annual residence time of 11.5 days (2014), which means that rainfall and water pollutants flowing into the basin can readily affect the water quality [11]. Furthermore, the influent water in the upper reaches of the Paldang Reservoir, including at upstream dams and weirs, undergoes three-dimensional mixing based on the topographic features of the lake. The Paldang Reservoir is a water body where the hydraulic and water quality characteristics vary spatially and temporally depending on the variations in inflow rates and the physicochemical properties of influent water. In this study, field surveys and analyses were conducted on the Paldang Reservoir where the South Han River and the North Han River meet at Dumulmeori and are joined by another river, the KyeonganCheon, before reaching the PDD (Figure 1).
2.2. Field Surveys
For the continuous depth-specific hydraulic surveys, the ADCP (Model WH-600, RD Instruments) was deployed to measure the flow velocity and direction. The measurements were performed at a time interval of 10 min, and the lateral spacing of the ADCP measurements was set to 0.2–0.5 m, thus allowing for a blank range of less than 1 m above the riverbed (Figure 2). The upper 20% and 50% and the lower 20% in terms of depth were defined as the surface, middle, and lower layers, respectively. The flow velocity and direction information was extracted from the raw measurement data, and during this extraction, the outliers were removed and data were calibrated to true north. The flow velocity variation and the average flow of the Paldang Reservoir were determined by examining the time-series of flow velocity and direction, flow velocity rose diagrams, vertical distributions of residual current, and velocity vector diagrams at individual stations. The bottom sediment at survey sites was examined for granularity to ensure the stable installation of the measuring instruments, and the potential risk of sinking was also investigated for the measuring instruments. By attachment to a trawl-resistant bottom mount (TRBM), ADCPs were moored on the bottom surface in such a way as to avoid the loss of a device caused by fishery activities and vessel traffic and to ensure the stability of the data collection. The TRBM was fastened to the bottom surface by an anchor to prevent the measuring instruments from being swept away by high-velocity flow.
In this study, water temperature gauges for the moorings (Model TR-1050 and TR-1060, RBR Ltd.) were used to perform continuous surveys on the water temperature at different water depths. The measurement time was set to 10 s, and the water temperature gauge was attached to the mooring line with a vertical spacing of 1 m (Figure 2). The measured temperature data were inspected for quality control purposes, and the time-series and vertical distributions of water temperature, as well as preliminary analyses, were compared to each other in order to determine the spatiotemporal characteristics of the water temperature variation. Furthermore, water temperature data were averaged at 10 min intervals and interpolated by using the Kriging technique [35,36,37,38] in order to perform a comprehensive analysis that also covered the ADCP data. The parameters used in the Kriging interpolation are listed in Table 1. The measuring instruments were securely fastened to mooring chains and anchors to avoid being swept away by high-velocity flow. Furthermore, buoys were connected to the instruments and other markers, such as flags and night navigation lights, that were also installed to ensure navigation safety and to prevent damage to the instruments in the event of a ship collision.
For local meteorological observations, an integrated meteorological sensor (Model WXT520, VAISALA) was deployed to measure wind velocity, wind direction, relative humidity, temperature, pressure, and precipitation, with the measurement time being set to 1 min. For the installation of a bottom-mount meteorological sensor, the base stand for the observation system was placed in a fixed position on the rooftop of a building located at the confluence of the South Han River and the North Han River and at the point closest to the Paldang Reservoir while being unaffected by the surrounding terrain. The observed meteorological data, including hourly wind velocity and direction, temperature, humidity, pressure, and rainfall amount, were compared with the observational data obtained from the Yangpyeong and Cheongpyeong weather stations, which are both located within the Paldang Reservoir, in order to determine spatiotemporal meteorological characteristics.
A total of three locations (PC1, PC2, and PC3 in Figure 1) were selected as survey stations in order to determine the characteristics of the main stream and water temperature variations in the Paldang Reservoir. Additionally, survey sites were selected among key locations within the Paldang Reservoir by taking the inflow zone and mixing zone of the South Han River and the North Han River into account. Located approximately 3 km upstream from the PDD, the PC3 survey station is the point at which the mixing characteristics of tributary water, for example, from a tributary of the South Han River and the North Han River, can be observed. The PC2 and PC1 survey stations were situated 9.5 and 11 km upstream from the PDD, respectively, which are locations that correspond to the lower reaches of the South Han River and the North Han River, respectively. For the weather station (PA1 in Figure 1), a location adjacent to the Paldang Reservoir and midway between the three monitoring sites was selected, and meteorological instruments were installed accordingly.
Observations were conducted on hydraulics, water temperature, and weather conditions for a time period of 37 days from May 12 through June 17, 2016, in consideration of the periods of vertical mixing and thermal stratification. This period was selected by considering certain circumstances such as the flood and freezing seasons. In addition, it was chosen as an important time because it was the time when the algal bloom began to occur due to the increase in temperature. The data are discussed without reference to the downstream reservoir level, as it was maintained constant at 25.5 m during the monitoring temporal span.
2.3. Water Stability Analysis
This study examined multiple parameters, such as water temperature, water temperature gradient with depth (DT/DZ), flow velocity, the Richardson number (Ri), and stratification coefficient, to analyze the stability of the water mass. The Richardson number is the dimensionless ratio of the flow velocity gradient to the density gradient and is used as an indicator of vertical mixing in a stratified fluid; this number can be expressed as follows:
where g is the gravity acceleration (m/s2), ρ is the density (kg/m3), z is the vertical position (m), u is the flow velocity (m/s), and T is the water temperature (°C). Similar to flow velocity, water temperature was averaged at an interval of 10 min, and density was calculated based on these data. Flow velocity was measured at an interval of 0.2–0.5 m, while water temperature was measured at an interval of 1 m; accordingly, the calculation was performed based on the water layer in which the water temperature was measured. For the analysis of measured data, flow velocity data (1 m intervals) were used in the same position as the water temperature data. The density and flow velocity differences between the upper and lower layers were computed and defined at a point between layers. Therefore, the Richardson number was also defined at the midpoint of the water layers where the water temperature was measured.
For the analysis of water stratification, the stratification coefficient was calculated [39,40,41,42]. The stratification coefficient, defined as the work per unit volume required to fully mix a water layer, can be represented as the potential energy anomaly (PEA; J/m3) [40] due to differences between the potential energy currently present in the water layer and the potential energy present in the water layer when fully mixed in a vertical direction. If density inversion occurs vertically, then negative values are produced. Choi et al. [43], Kang et al. [44], Kim et al. [45], and Oh and Choi [46] defined a stratification coefficient, log(PEA), of less than 1 as a value indicative of vertical mixing or density inversion and a log(PEA) greater than 1 as a value indicative of stratification. Based on this, they analyzed the stratification characteristics of the reservoir in their study area.
where H is the total water depth (m) and is the depth-averaged density (kg/m3). Similar to the Richardson number calculation, the water temperature data averaged at 10 min intervals were used. The ADCP data observed at an interval of 10 min, from the same monitoring site, were used to examine the water depth. Moreover, density was computed in the same manner as the Richardson number calculation, and the results were employed for the PEA calculations.
3. Results
3.1. Analysis of Monitoring Data
3.1.1. Hydraulic Data
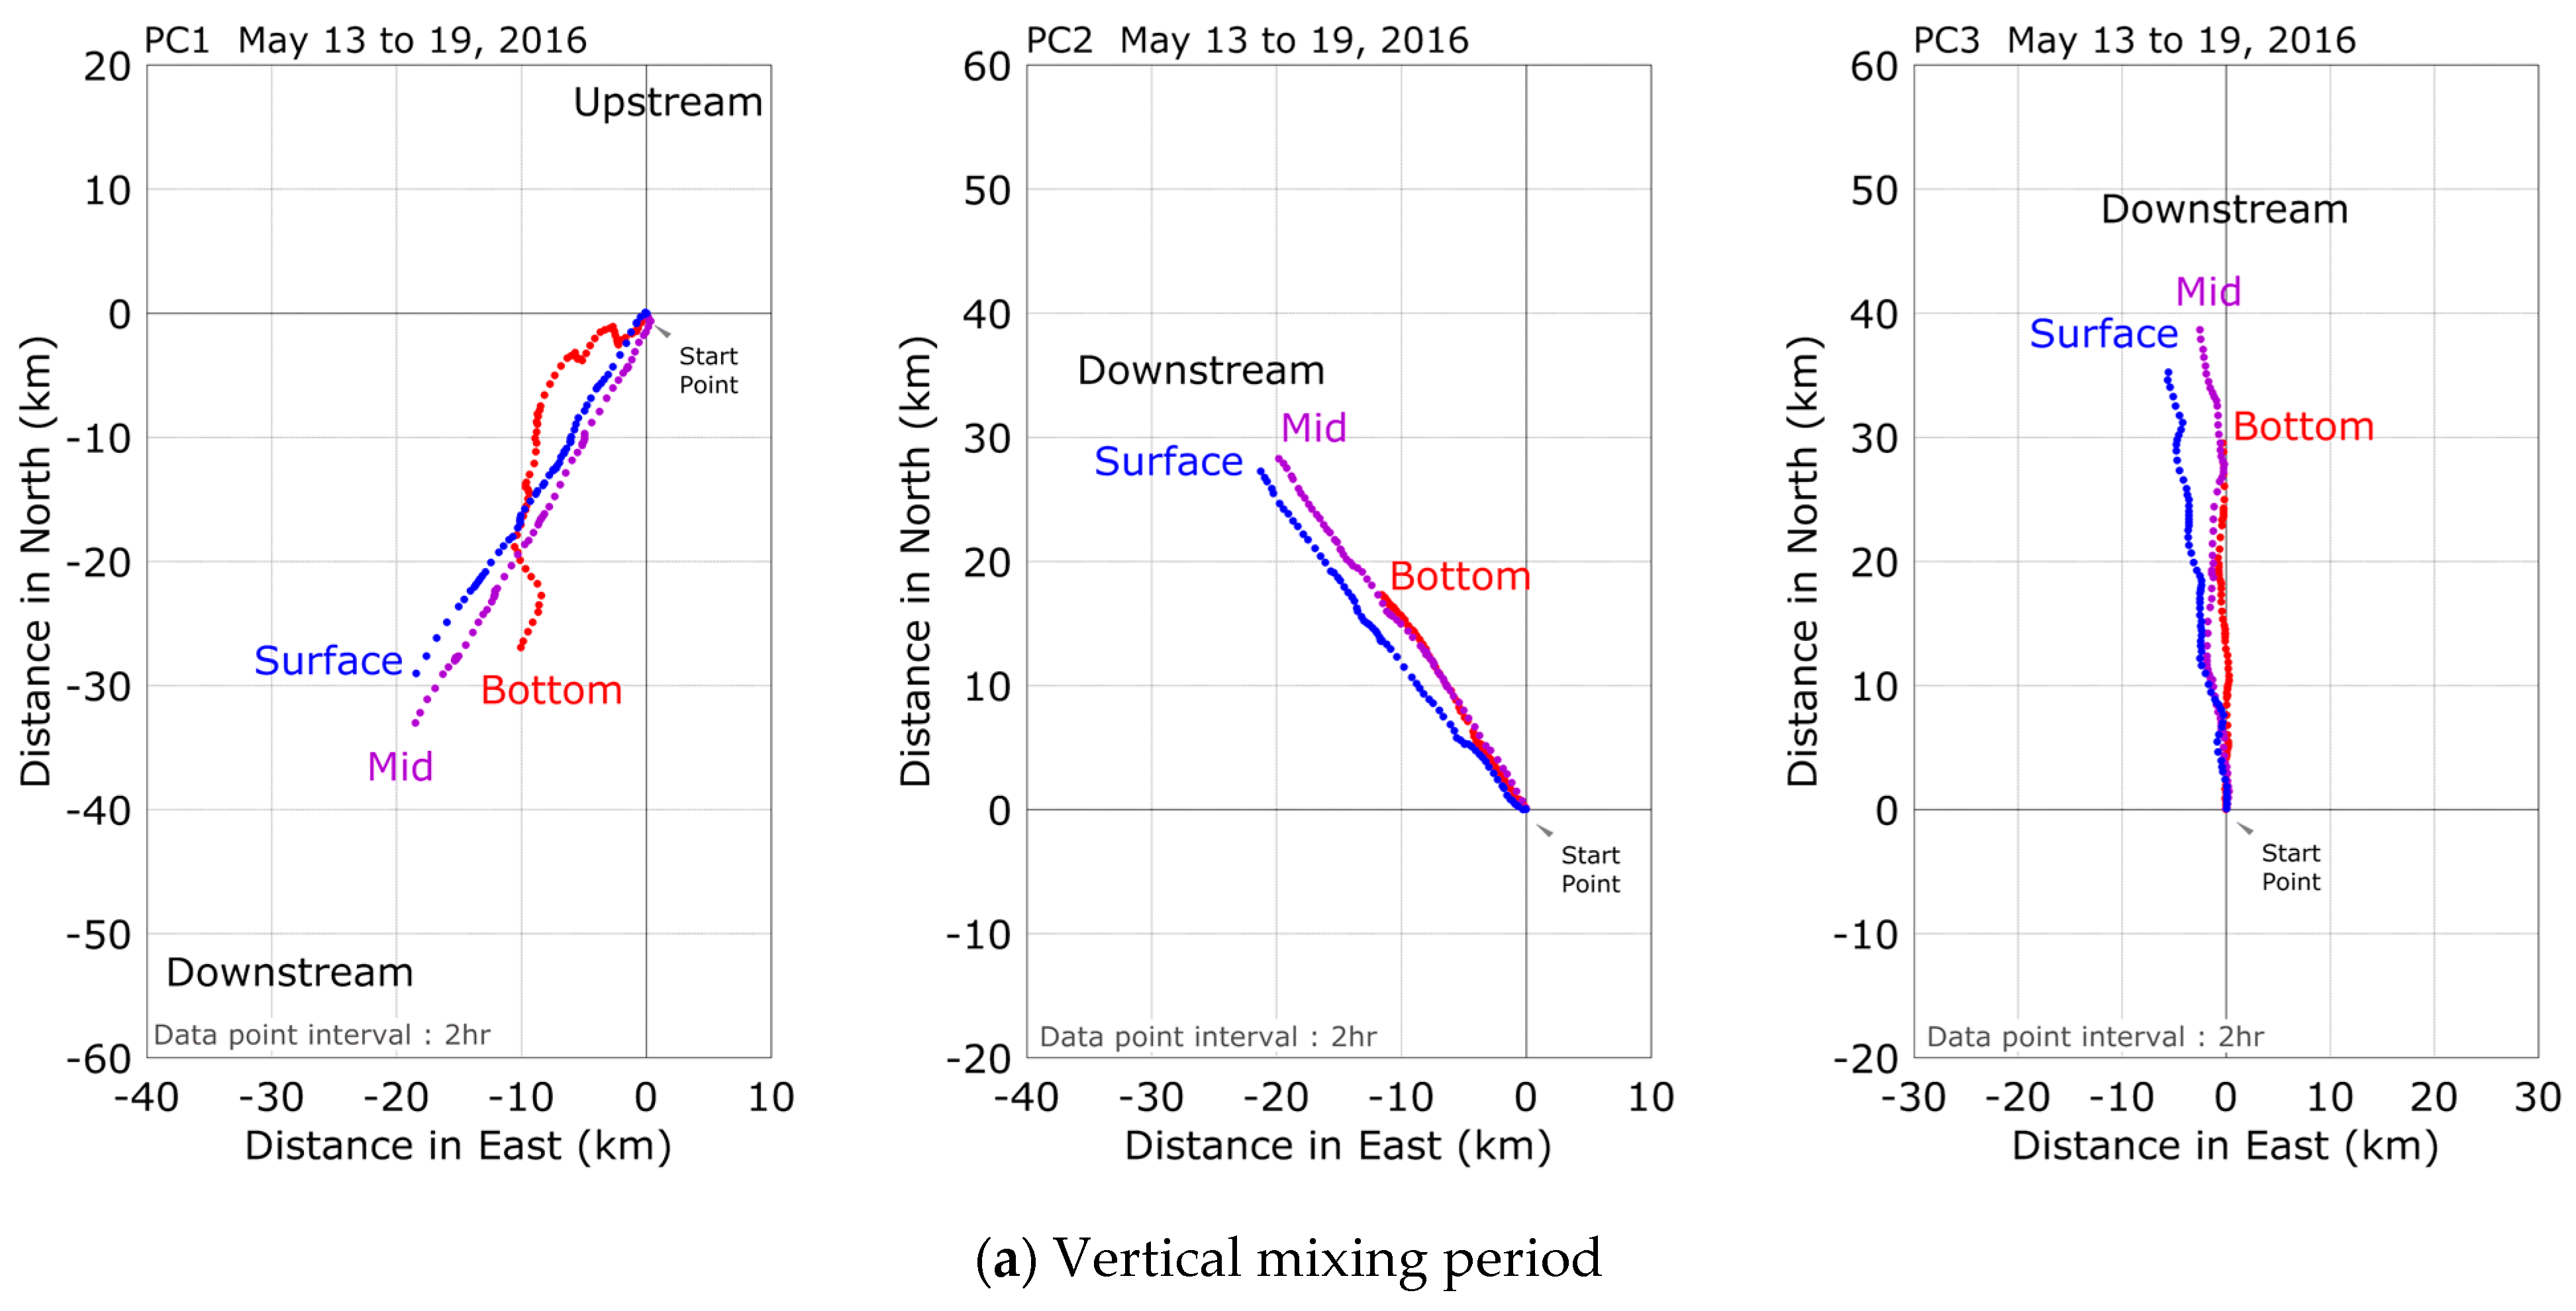
Figure 3 shows the time series of velocity (speed and direction) at different layers of the PC1 station. Additionally, in Figure 3, velocity (m/s) is in vector form and comes from the average value of 10 min intervals. The hydraulic properties of PC1, which was located in the lower reaches of the North Han River, changed according to the diurnal discharge characteristics of the CPD located upstream the station. The flow velocity at PC1 remained low, i.e., below 0.1 m/s, in most cases during the zero-discharge period of the CPD, and it exceeded 0.2 m/s during the discharge period. Downstream flow was observed at the initial stage of observations, but two-layer flow accompanied by countercurrent flow extending down to 2–4 m from the water surface was observed after 25 May. Upstream flow (countercurrent flow) occurred in the surface layer immediately after the completion of discharge from the CPD and lasted right until the initiation of the next discharge. Downstream flow was observed in the next layer down. Upstream flow occurred in the lower layer, 3–4 m above the bottom surface, from May 19 onward when the discharge from the CPD ended, and this lasted for about three days until the discharge was resumed. The characteristics of flow velocity variations depending on two-layer flow were examined in this study, and the results showed that in the presence of two-layer flow, the flow velocity appeared higher, i.e., exceeding 0.2 m/s, than that in the presence of downstream flow throughout all layers. Moreover, during the period of upstream flow occurring in the surface layer, a high flow velocity was observed 4–7 m above the bottom surface. In contrast, during the period of upstream flow in the lower layer, a high flow velocity was observed in the surface layer. Additionally, in this study, data were classified into the following two categories: the vertical mixing period and the stratification period.
At PC2, due to the continuous discharge from the Ipo Weir (IPW) and different from the discharge pattern of the CPD, no significant variations in the flow rate and velocity compared to PC1 were observed. Two-layer flow was present in the upstream direction at the lower layer and in the downstream direction at the upper layer, and the thickness of upper and lower layers varied depending on the discharge rate of the PDD. During the period of the lower discharge rate from the PDD, upstream flow prevailed in the lower layer. On June 8, when the discharge rate of the PDD was recorded to have been below 200 m3/s, the thickness of the lower layer in which upstream flow occurred was measured at approximately 6 m. The upstream flow in the lower layer exhibited weaker diurnal variations, which can be attributed to the periodic discharge pattern of the CPD. As a result, at PC2, located in the lower reaches of the South Han River, upstream flow occurred in the lower layer of the South Han River during the discharge period of the CPD.
At PC3, which was the location most affected by the discharge pattern of the PDD, downstream flow prevailed, and it exhibited periodicity when the instantaneous discharge rate from the PDD exceeded 400 m3/s. In particular, downstream flow with a velocity greater than 0.2 m/s was observed in all layers when the instantaneous discharge rate of the PDD exceeded 700 m3/s. The flow velocity in the lower layer decreased to below 0.2 m/s, or no flow occurred when the instantaneous discharge rate of the PDD remained below 400 m3/s for several days. To check the flow direction by layer, Figure 4 shows the velocity vectors for the different depth layers and periods. During the vertical mixing period, an average flow in the downstream direction was observed in all layers at all stations (Figure 4a and Figure 5a). At PC1, downstream flow with 86.8% prevailed over upstream flow in the surface layer. Similarly, downstream flow with 81.5%, which was even greater than downstream flow in the surface layer, prevailed over upstream flow in the lower layer at PC1. The average flow velocity was approximately 0.07 m/s near the point 6 m below the water surface, and it decreased closer to the water or bottom surface. In all layers at PC1, the average flow velocity exceeded 0.04 m/s. In the surface layer at PC2, downstream flow with 97.4% prevailed over upstream flow, and in the lower layer at PC2, downstream flow with 85.5% prevailed over upstream flow. The average flow velocity was approximately 0.07 m/s near the point 3 m below the water surface, and it decreased closer to the water or bottom surface. At PC2, the average flow velocity exceeded 0.03 m/s in all layers. At PC3, the highest average flow velocity, approximately 0.09 m/s, was observed near the point 6 m below the water surface, and it decreased closer to the water or bottom surface. At PC1, upstream and downstream flows occurred alternately in the lower layer during the initial stage of observations. This pattern can be attributed to the differences in water temperature, which were observed at the beginning of observations, between the South Han River (lower temperature) and the North Han River (higher temperature). At PC2 and PC3, in particular, downstream flow was observed in all layers.
At each station, distinct vertical distributions of residual current were observed for each layer during the stratification period (Figure 4b and Figure 5b). In the surface layer at PC1, upstream flow with 64.8% prevailed over downstream flow, but different from the pattern observed in the surface layer, downstream flow with 93.2% prevailed over upstream flow in the lower layer. Upstream and downstream flows were observed in the upper and lower areas, respectively, around the point 3 m below the water surface. The average flow velocity was close to 0 at a depth of 3 m below water surface, and it increased closer to the water surface. In contrast, below the 3 m point, the average flow velocity increased until near the point 6 m below water surface, and then it decreased until the bottom surface was reached. At PC2, downstream flow with 89.6% prevailed over upstream flow in the surface layer, whereas upstream flow with 60.2% prevailed over downstream flow in the lower layer. Furthermore, similar to PC1, two-layer flow occurred, but in the reversed direction; upstream flow was observed until near the point 4 m above the bottom surface, and downstream flow was observed above the 4 m point. At PC3, similar to the vertical mixing period, downstream flow was observed in all layers.
3.1.2. Water Temperature
Time-series of vertical water temperature distributions for different stations are illustrated in Figure 6, Figure 7 and Figure 8. The water temperature gradients (DT/DZ) were normally less than 1 °C at all sites in the early stage of observations, from May 12 through May 22, which corresponded to the vertical mixing period when the water temperatures in all layers continued to rise. In contrast, the water temperature gradients increased at a later stage, from May 28 to June 17, which corresponded to the stratification period when the water temperature gradients greater than 1 °C were commonly observed. Moreover, the water temperature in the middle and lower layers remained constant while the water temperature in the surface layer steadily increased. The discharge water temperatures were compared between the CPD located in the North Han River and the IPW in the South Han River, both of which flow into the Paldang Reservoir. The results showed that the influent water temperatures at both locations were similar to each other in the early stage of observations, but the influent water temperatures of the South Han River were more than 7 °C higher than those of the North Han River in the later stages. At PC1 (the lower reaches of the North Han River), the average water temperatures were 21.82 and 17.76 °C at 1 and 8 m below the water surface, respectively; see Figure 6. The highest and lowest water temperatures at 1 m below the water surface were 27.29 and 17.09 °C, respectively, thus indicating that a significant difference of 10 °C or more existed. The highest and lowest water temperatures decreased, and the range of water temperature variation also decreased with increasing depth towards the lower layer. A nearly homogeneous vertical distribution of the highest, average, and lowest temperatures was observed in the lower layers below the point at 6 m below the water surface. During the vertical mixing period, the water temperature above 20 °C was 1.69% at 1 m below the water surface, and no water temperatures below 17 °C were observed. In contrast, no water temperatures above 20 °C were observed at 8 m below the water surface, and the water temperature below 17 °C was 36.98%. During the stratification period, no water temperatures below 20 °C were observed at 1 m below the water surface, while the the water temperature above 25 °C was 15.56%. Moreover, at 8 m below the water surface, no water temperatures above 20 °C were observed, and all of the data were distributed across temperatures ranging from 17 to 19 °C, thus indicating that there was little variation in the water temperature.
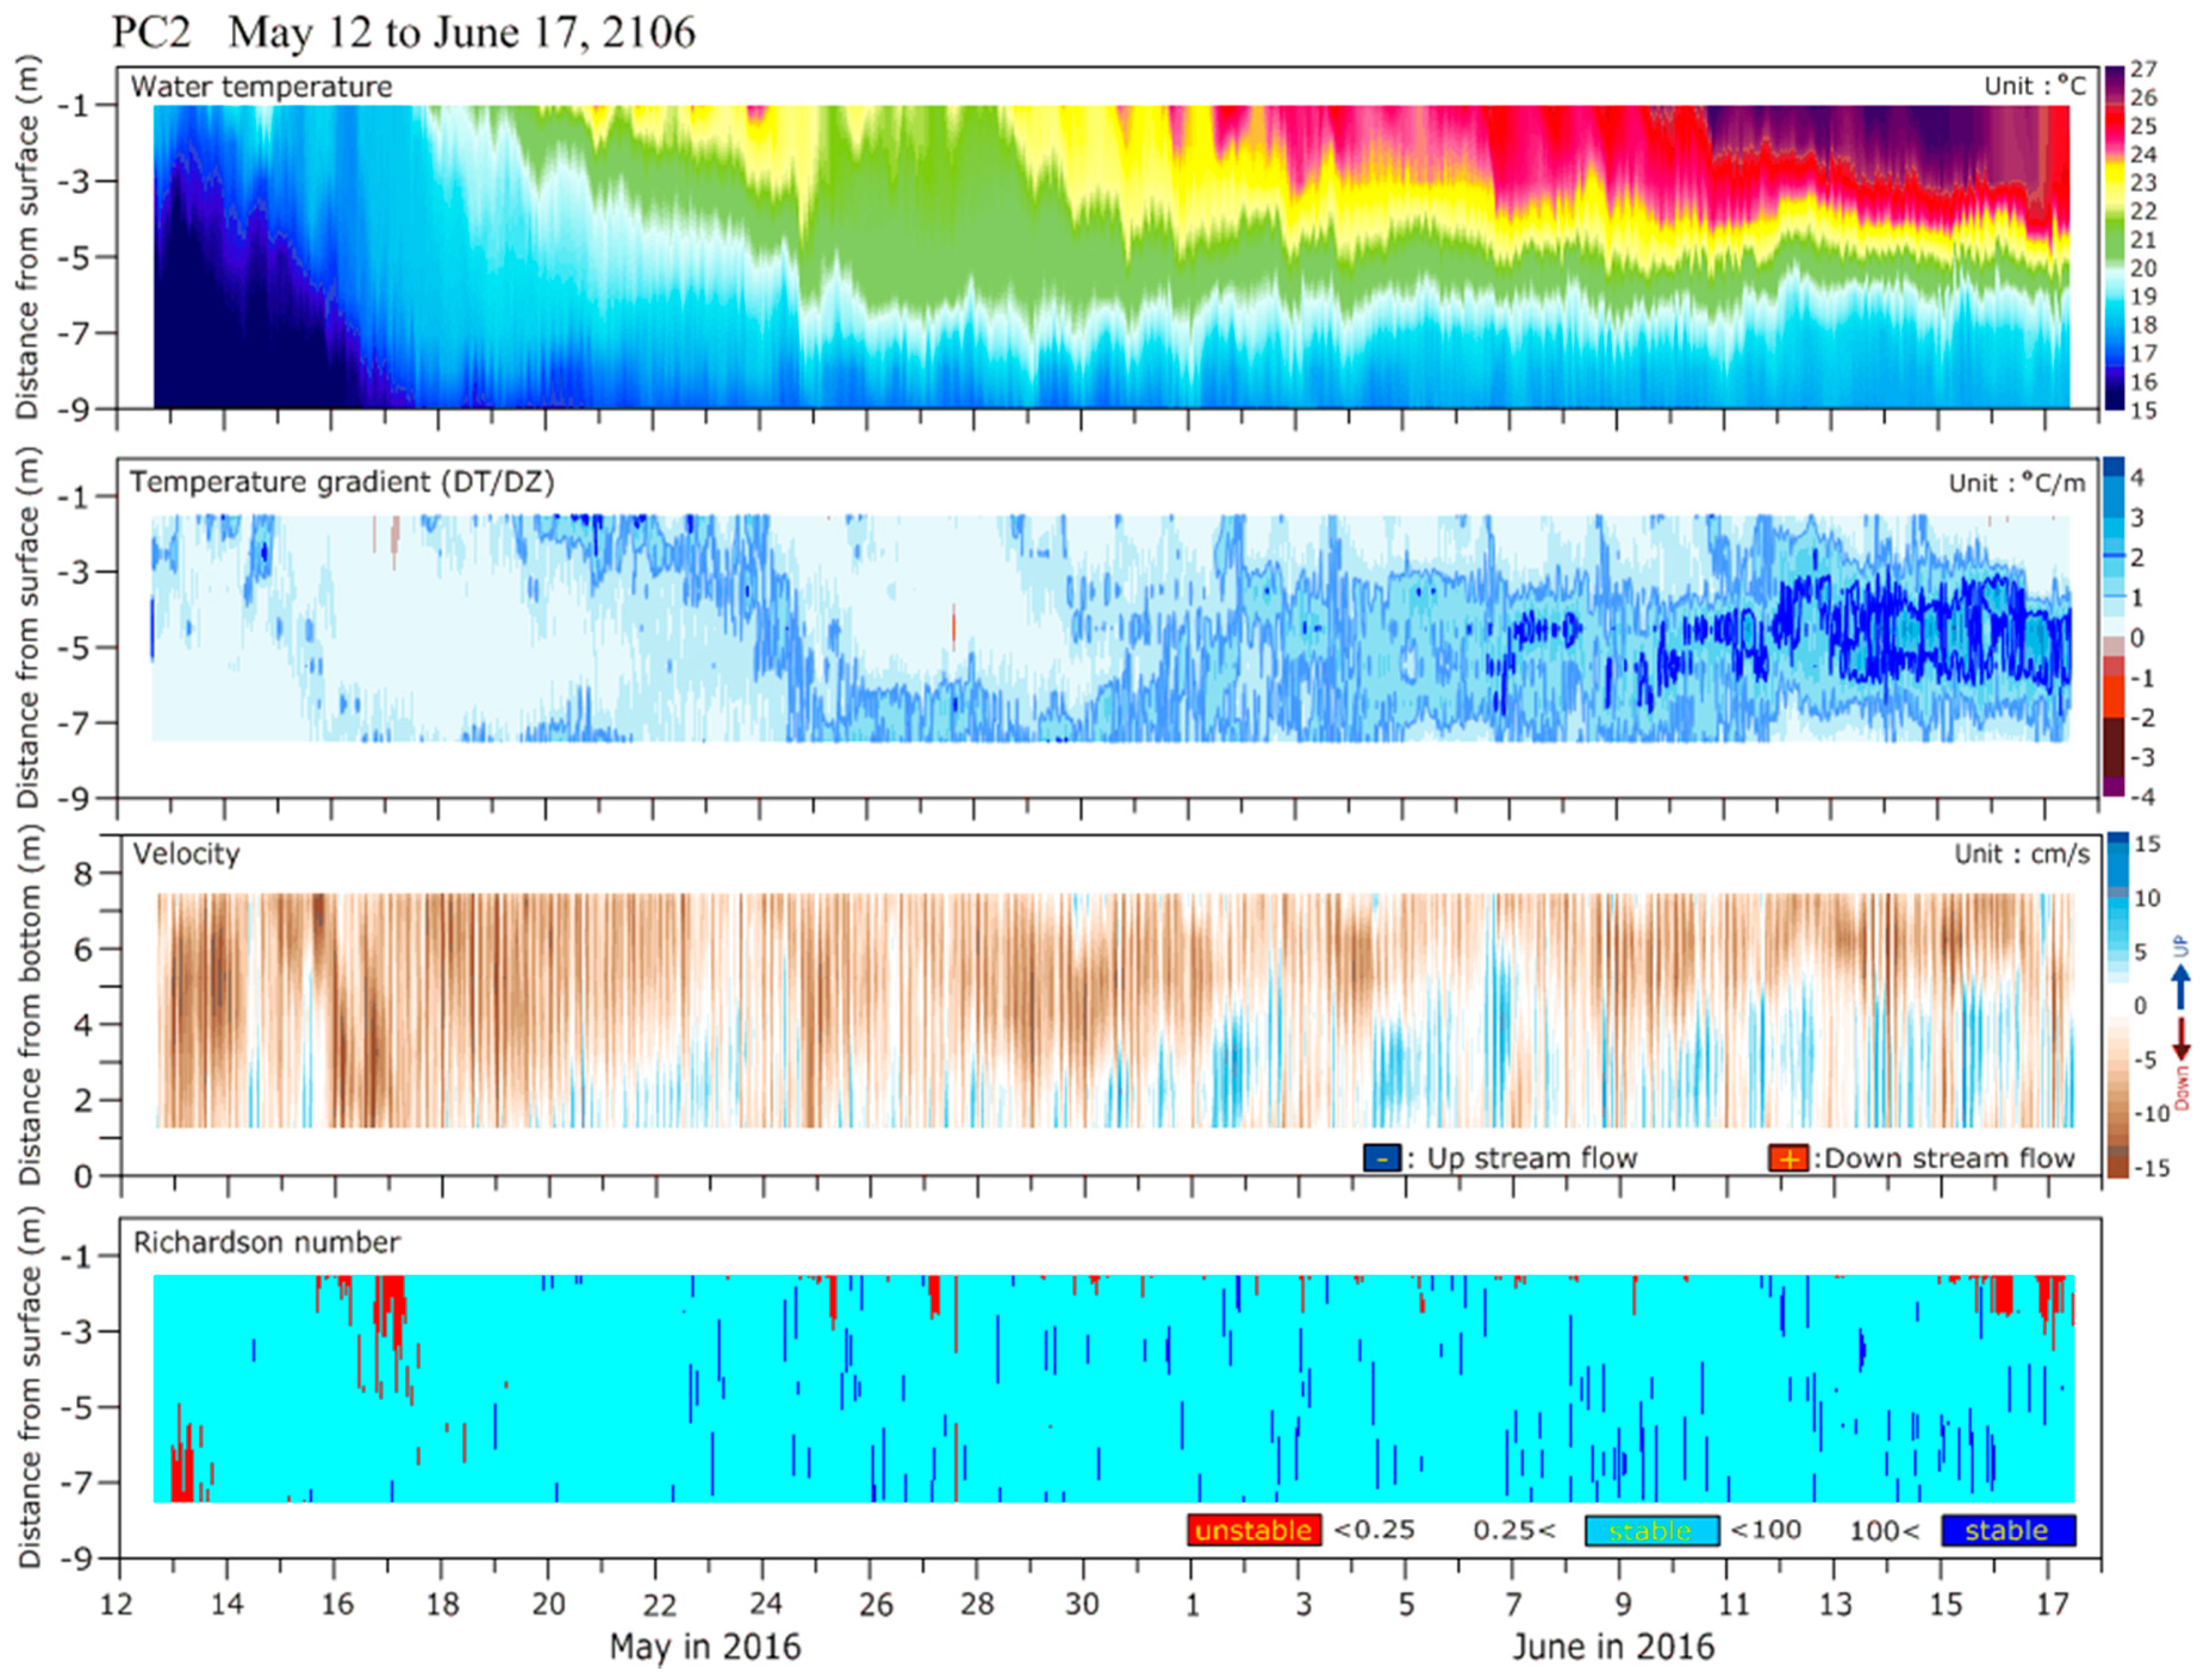
At PC2 (the lower reaches of the South Han River), in Figure 7, the average water temperature was 25.01 °C at 1 m below the water surface and 17.65 °C at 8 m below the water surface. The highest and lowest water temperatures were 28.47 and 21.46 °C at 1 m below the water surface, respectively, which amounted to a difference of 7.01 °C. Furthermore, the highest and lowest water temperatures were 18.59 and 16.91 °C, respectively, at 9 m below the water surface, which amounted to an insignificant difference of 1.68 °C. The highest and the average water temperatures of the surface layer at PC2 were greater than those at other stations, and the highest water temperature gradient was observed at PC2. During the vertical mixing period, the water temperatures above 20 °C was 26.02% at 1 m below the water surface, and the water temperatures below 17 °C was 0.54%. No water temperatures above 20 °C were observed at 8 m below the water surface, while the water temperatures below 17 °C was 67.98%. During the stratification period, no water temperatures below 20 °C were observed at 1 m below the water surface. The water temperatures above 25 °C was 46.14%. No water temperatures above 20 °C were observed at 9 m below the water surface, and all of the data were distributed across temperatures ranging from 17 to 19 °C, thus indicating that there was little variation in the water temperature.
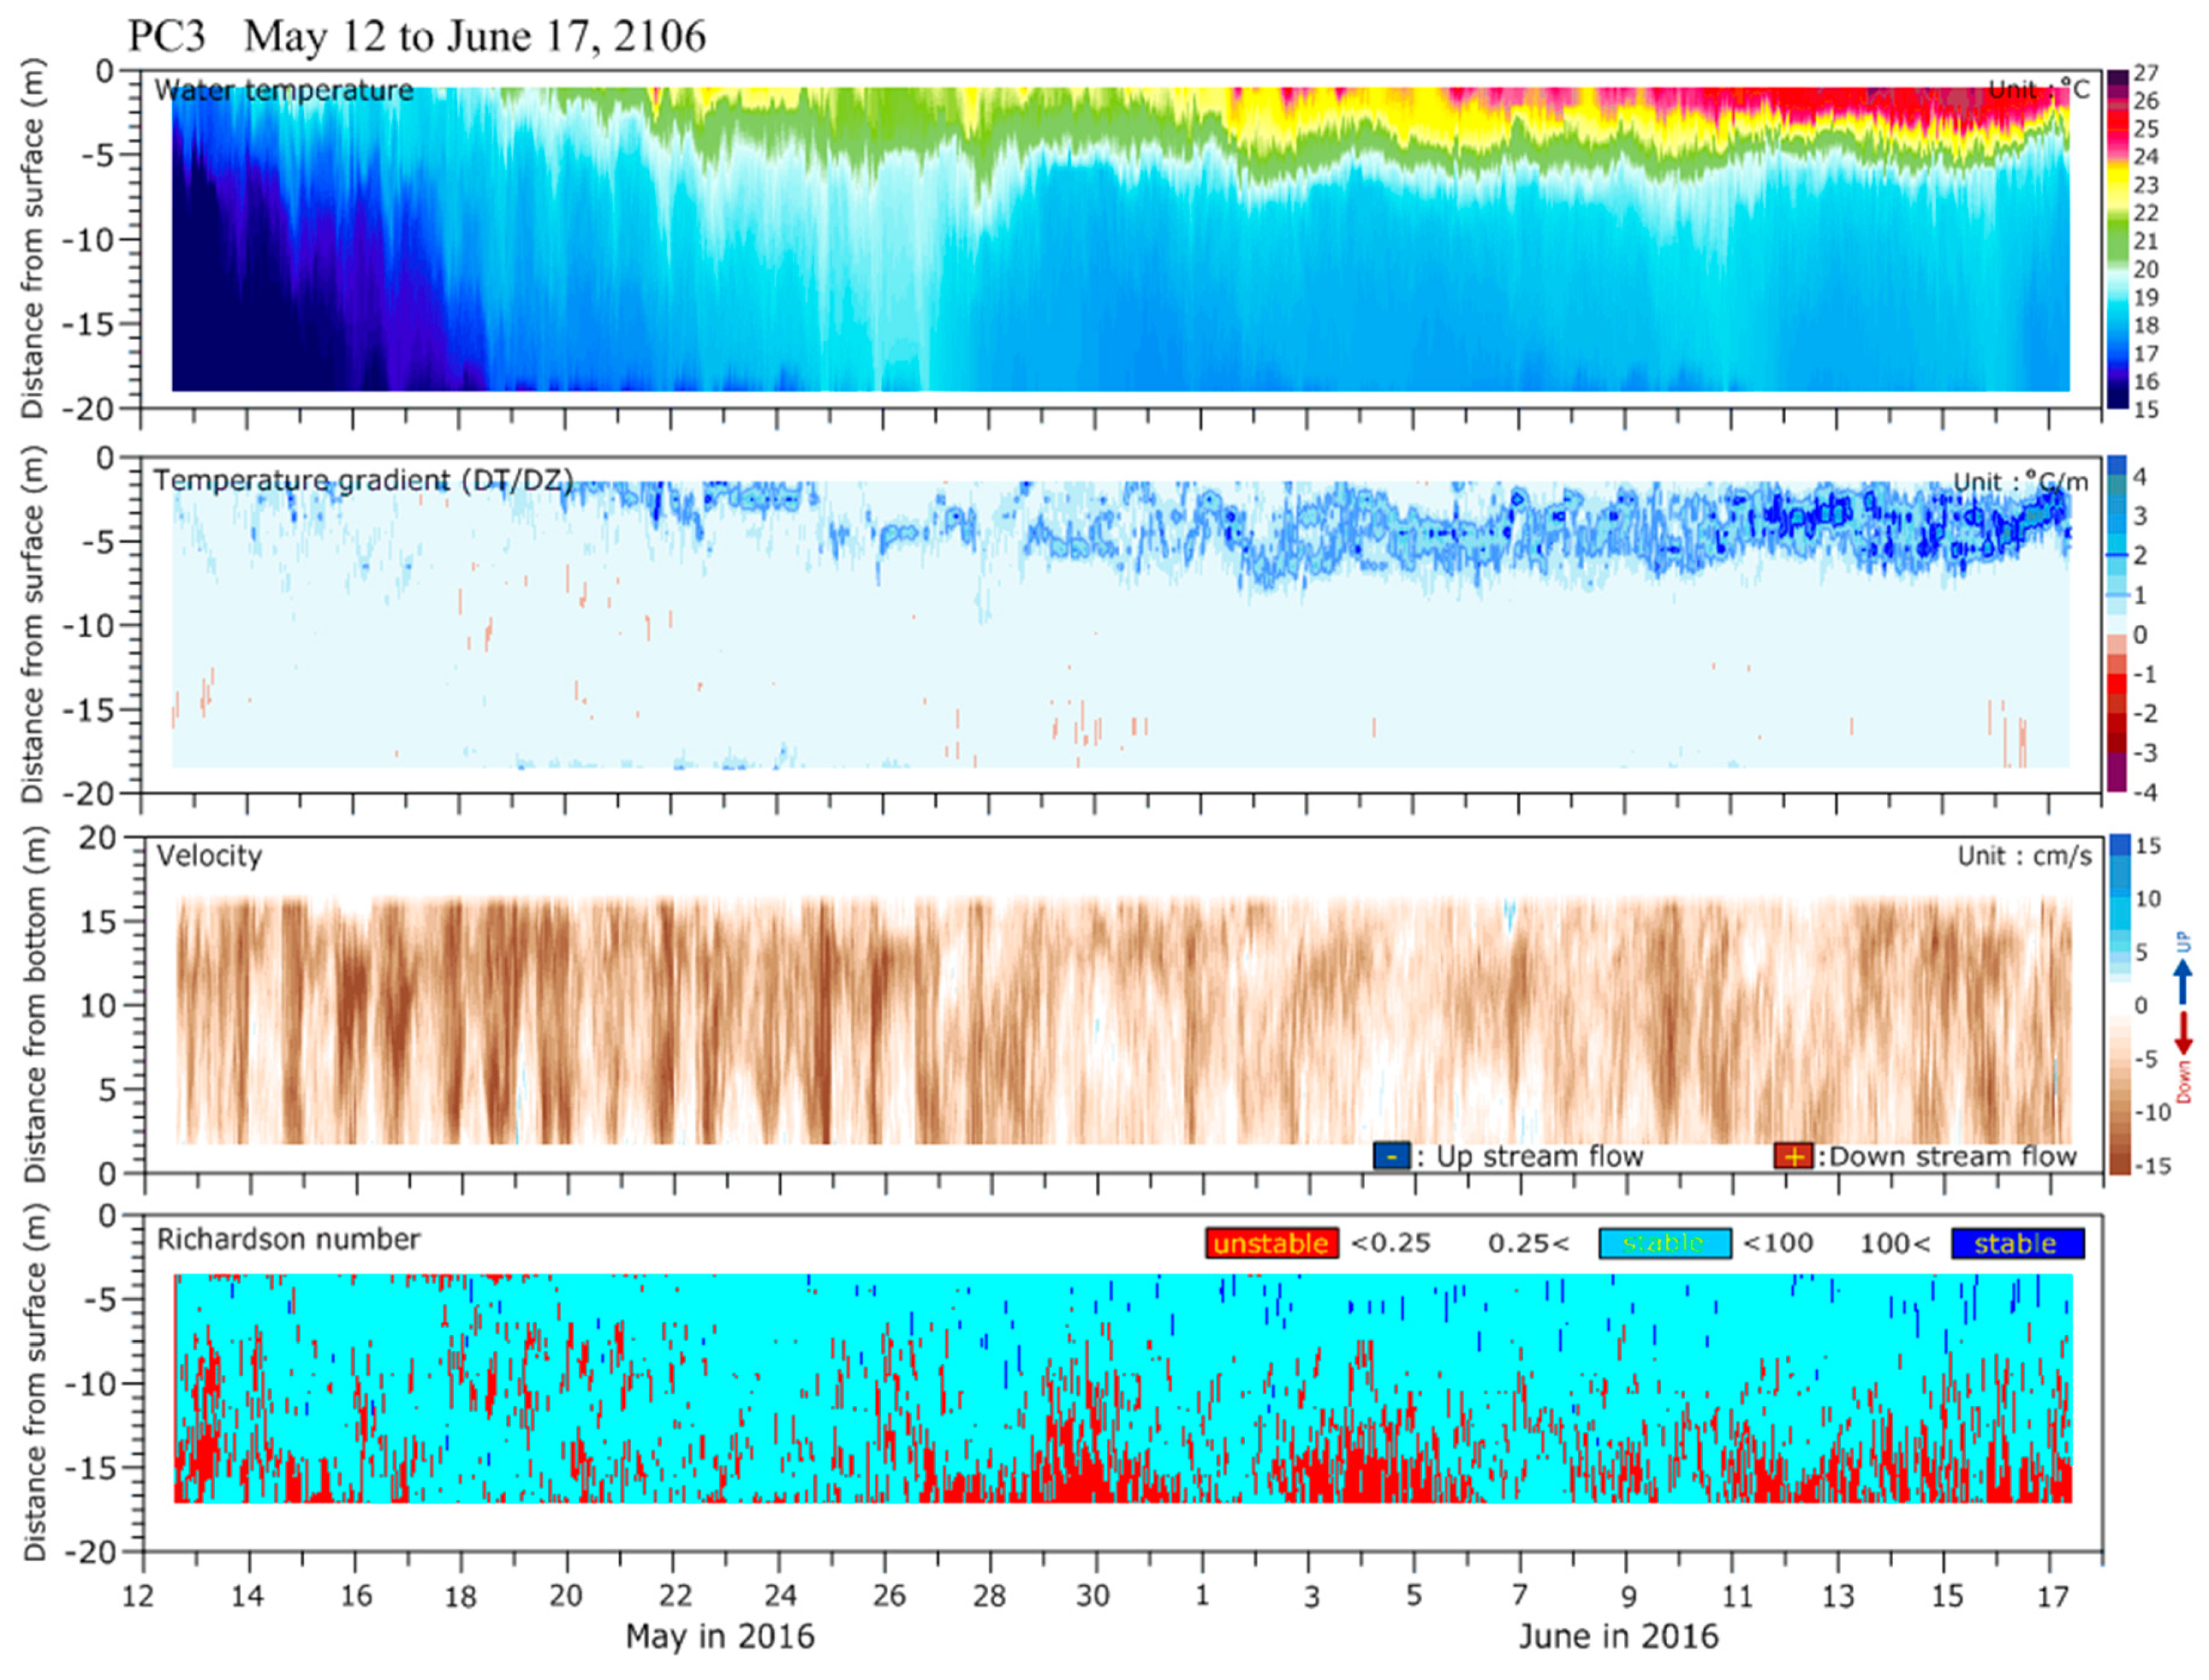
At PC3 (in the vicinity of the PDD), the average water temperature was 22.67 °C at 1 m below the water surface and 17.32 °C at 19 m below the water surface, while the highest and lowest water temperatures were 26.64 and 16.89 °C, respectively, at 1 m below the water surface, which amounted to a difference of 9.75 °C. The highest and lowest water temperatures at 9 m below the water surface were 18.96 and 15.02 °C, respectively, which amounted to a difference of 3.94 °C. At PC3, the rates at which the highest, average, and lowest water temperatures dropped with water depth decreased, to a great extent, to nearly 1 °C/10 m at 7 m below the water surface. During the vertical mixing period, the water temperatures above 20 °C was 18.50% at 1 m below the water surface, and the water temperatures below 17 °C was 1.38%. No water temperatures above 20 °C were observed at 19 m below the water surface, and the water temperatures below 17 °C was 93.74%. During the stratification period, no water temperatures below 20 °C were observed at 1 m below the water surface, and the water temperatures above 25 °C was 8.57%. No water temperatures above 20 °C were observed at 19 m below the water surface, and all of the data were distributed across temperatures ranging from 17 to 19 °C, thus indicating that there was little variation in the water temperature.
Analyses of lake hydraulics and stratification serve as important methods for identifying material transport–dispersion based on inflow rates and forecasting water quality changes, as well as their effects on algal blooms [47]. In particular, the degree of horizontal and vertical stratification in lakes or reservoirs is a key indicator for water quality changes caused by chemical reactions in a region where little water exchange or interaction occurs. The degree of thermal stratification also affects the vertical DO distribution. The DO concentrations in the lower layer decrease because little water exchange occurs with the upper layer, which contains oxygen-rich, re-aerated water. Strong stratification is often accompanied by three distinct layers. The epilimnion refers to the uppermost layer in which the water temperature remains unchanged with varying depth. This layer is well-mixed by wind action on the surface. In the thermocline (metalimnion), water temperatures plummet with increasing water depth. The deepest bottom layer near the riverbed is termed the hypolimnion.
3.1.3. Meteorological Data
In this study, local meteorological observations were performed to investigate the time series of 1-h average variations in wind velocity, wind direction, temperature, humidity, pressure, and rainfall amount. Wind roses were used to classify the wind direction and velocity data into 16 compass points at 2 m/s intervals, and these results are shown in Figure 9. In general, the meteorological conditions in reservoirs are the major contributors to energy transfers such as heat exchange occurring on the water surface due to solar radiation, sensible heat transfer and evaporation, and wind-induced heat transfer [3]. The comparison of the meteorological observations for wind velocity, wind direction, temperature, humidity, pressure, and rainfall amount produced the following results. Day–night periodic variations were observed in the wind velocity, wind direction, temperature, and humidity. With regard to wind, except for the periods of sporadic wind invasion, southwesterly winds were observed in the daytime, and north–northeasterly winds were observed in the nighttime. The wind velocities gradually increased until noon and then slowly decreased in most cases. In the initial stage of observations, on May 12, 15, and 16, the daily maximum velocities exceeded 10 m/s and the average daily wind velocities exceeded 2 m/s. The average temperature increased and the diurnal temperature range decreased with time towards the later stage of observations. The average daily temperatures increased from May 19 onward, where values exceeded 20 °C and remained around 21–24 °C afterwards.
3.2. Water Circulation of Paldang Reservoir
3.2.1. Water Stability
In this study, hydraulic, water temperature, and meteorological data were compared in an attempt to investigate the characteristics of water stability and circulation in the Paldang Reservoir (Figure 6, Figure 7 and Figure 8). At PC1, a small range in the water temperature gradient was observed as a result of vertical mixing until 22 May, but the range increased afterwards, which led to lower water temperatures and a thicker low-temperature layer than those in the South Han River basin. During the vertical mixing period, flow velocities increased across all layers due to the discharge from the CPD. During the stratification period, flow velocities escalated in the middle and lower layers as the cross-sectional area of downstream flow decreased with water temperature, and, as a result, two-layer flow was clearly observed. The Richardson number was deemed stable in the surface and middle layers and unstable in the lower layers during most of the observation period, and all layers became unstable and vertical mixing intensified with strong winds and increasing discharge rates. The stratification coefficient mostly remained below 1 J/m3 and was momentarily close to 1 J/m3 until 29 May, which was the period when the vertical water temperature gradient was not large and when the vertical mixing and vertical water temperature gradient repeatedly increased. After 29 May, the stratification coefficient remained constant above 1 J/m3, which corresponded to the intensifying stratification.
Overall, at PC2, the water temperature was relatively high and the low-temperature layer was relatively thin compared to the conditions in the North Han River basin. Flow occurred in the downstream direction at all depths during the vertical mixing period and was accelerated in the upstream direction at the middle and lower layers during the stratification period, thus showing a distinct two-layer flow. The Richardson number remained stable in all layers during most of the observation periods. The stratification coefficient varied while exhibiting similar characteristics to PC1, but, overall, the values were higher than those at PC1. This was because the vertical water temperature gradient at PC2 remained higher than that at PC1. The stratification threshold of 1 J/m3 remained constant after 19 May, which roughly corresponded to the time at which average daily temperatures became constant above 20 °C.
At PC3, the vertical water temperature gradient was small until around 19 May and increased afterwards. Flow velocity intensified in all layers due to dam discharges during the vertical mixing period, and the velocity decreased at times to less than 0.02 m/s in the lower layer, depending on water discharge from the PDD, during the stratification period. The Richardson number was stable in the surface and middle layers during most of the observation periods, but it was mostly unstable in the lower layer. The stratification coefficient log (PEA) remained above 1 J/m3 during the entire observation period. The coefficient gradually increased from the initial stage of observations until 2 June and remained constant at 3 J/m3 afterwards.
3.2.2. Relationship between the Flow Velocity and Discharge
In this study, a discharge analysis was performed to determine the relationship between site-specific flow velocity and discharge from the PDD, the CPD, and the IPW from 12 May to 17 June 2016. The results showed that the average discharges from the PDD and the CPD were 292.0 and 163.5 m3/s, respectively, which were values slightly lower than the values of 353.9 and 175.6 m3/s for the average discharges from these dams, respectively, during the same period for the previous decade. The average discharges obtained in the first survey period accounted for 80% and 93% of the previous 10-year average discharge for the PDD and the CPD, respectively. Furthermore, the average discharge of the IPW was 108.4 m3/s during the first survey period, which accounted for 77% of the previous four-year average discharge of 139.3 m3/s.
Figure 10 shows the relationship between the flow velocity observed at different sites and the water discharge from the CPD, the PDD, and the IPW. A comprehensive analysis was conducted for the entire period of data collected, and the results showed that no relationships existed between the flow velocity and discharge, which can be attributed to the complex three-dimensional water circulation of the Paldang Reservoir. The PC1, PC2, and PC3 monitoring sites were used to examine the relationships with the discharge from the CPD, the IPW, and the PDD, respectively.
At PC1, a linear relationship between the flow velocity in the downstream direction and the discharge was observed during the vertical mixing period, and a linear relationship between the flow velocity in the downstream direction and the discharge was observed during the stratification period as well. In the surface layer, furthermore, the flow velocity was relatively low compared to that in the middle and lower layers, and flow occurred in the upstream direction during the period of zero discharge from the CPD. At PC2, no significant discharge–velocity relationship was observed, but in the stratification period, flow occurred in the middle and lower layers in the upstream direction during the period of zero discharge from the CPD. At PC3, a linear relationship between the discharge and flow velocity in the downstream direction was observed during the vertical mixing period, and the flow velocity in the lower layer was relatively low compared to that in the surface and middle layers. Moreover, the discharge and flow velocity in the downstream direction had a linear relationship during the stratification period.
3.2.3. Three-Dimensional Water Circulation
The Paldang Reservoir exhibits a complex, three-dimensional water circulation structure as a consequence of various factors including its complex topography and tributary inflows, as well as the discharge patterns of weirs and dams. In the Paldang Reservoir, flow characteristics and water temperature variations were found to be drastically different for each station, and these were affected by the stratification due to the temperature differences in discharge water between the IPW in the South Han River and the CPD in the North Han River. During the vertical mixing period, flow occurred in the downstream direction across all layers in the North Han River and the South Han River, and flow velocity increased rapidly with discharge. During the stratification period, temperature differences in the discharge water between the IPW and the CPD led to changes in the flow structure.
The three-dimensional circulation structure of the Paldang Reservoir is illustrated in the cross-section diagram shown in Figure 11. The surface layer in the middle–lower reaches of the North Han River accommodates the IPW-originated high-temperature water flowing in the upstream direction. Meanwhile, the lower layer contains the CPD-originated low-temperature water, and flow occurs in the downstream direction. Moreover, a convergence zone forms near the middle reaches of the North Han River, which results in the stagnation of water. The vertical mixing of suspended materials hardly takes place on the surface layer in the middle–lower reaches of the North Han River because the surface layer remains mostly stable. The surface layer in the lower reaches of the South Han River accommodates the IPW-originated high-temperature water flowing in the downstream direction. The middle and lower layers contain the CPD-originated low-temperature water flowing in the upstream direction. The low-temperature, formerly-discharged old water from the CPD resides in the lower layer.
The complex three-dimensional water circulation structure has a major influence on the water quality of the Paldang Reservoir. To verify this, a time series of DO variation and data on the prevalence of annual hypoxia (below 2 mg/L) were collected from key locations in the Paldang Reservoir, such as at Paldangdam Sites 1–4 (PD1–PD4) of the water quality monitoring network of the Ministry of Environment, South Korea, at approximately eight-day intervals from 2012 to 2018. The resulting data are shown in Figure 12. In the North Han River (PD4), no hypoxic conditions (below 2 mg/L) were detected. In contrast, hypoxia was observed in the lower layer of the South Han River (PD1 and PD3) and in front of the Paldangdam (PD2) during summer from June through August, which is when the stratification mostly occurred. The hypoxic conditions prevailed in Paldang Dam 1 Site (PD1), which is located further upstream from Paldangdam 3 Site (PD3). This can be attributed to limited vertical mixing between the surface water with high DO concentrations and the bottom water below the thermocline with a high water mass stability and an increased water residence time caused by upstream flow occurring in the presence of stratification in the lower layer of the South Han River.
4. Discussions
This research concerned both the water circulation structure and water quality effects in the Paldang Reservoir. In the period from May 12 to June 17, 2016, research on hydraulic parameters, temperature, and meteorological parameters in the Paldang Reservoir was carried out. The results presented hydraulic data, water temperature data, and meteorological data. These parameters were compared by analyzing the characteristics of water stability and circulation in the Paldang Reservoir in order to study the relationship between water velocity and flow from the studied period and to develop a three-dimensional water circulation structure, which was verified with the use of DO data from the period of 2012–2018.
In order to identify the variability of water quality in the Paldang Reservoir, the survey period was considered to be an important period of the year because it was the time when algae began to grow due to rising temperatures. The survey period was short, so the results of this study cannot represent all phenomena in the reservoir for a year. However, they could be used as basic data to show the water circulation characteristics inside the reservoir.
Algal blooms occur frequently in the middle and lower reaches of the North Han River, where a convergence zone is formed by a countercurrent flow occurring on the surface layer (Figure 12). Such a convergence zone is considered responsible for algal blooms in the region. The upstream flow occurring in the surface layer in the middle and lower reaches increases the water residence time in the surface layer, thus leading to an extended residence time for the organic matter in the convergence zone and a higher vertical stability in the surface layer, both of which can create favorable conditions for algal blooms. Especially during the zero-discharge of the CPD, the flow velocity below 0.1 m/s at PC1 affected the growth of algal bloom. The change of hydrodynamic conditions and the decrease of flow velocity showed that the increase of the flow velocity would accelerate the growth of algae and the occurrence of bloom [48].
This study is expected to serve as a foundation for research aiming to determine the primary cause of algal blooms based on the complex circulation characteristics of the Paldang Reservoir. Moreover, further studies are needed to accomplish calibration and validation work for multidimensional numerical models through comparisons with field survey data, as well as to develop water quality management strategies for the Paldang Reservoir under a variety of hydrological conditions.
5. Conclusions
In this study, measurement data on the flow velocity, water temperature, and meteorological conditions were collected at key sites in the Paldang Reservoir, and analyses were conducted to determine the spatiotemporal characteristics of water circulation in the reservoir. The main results are as follows.
In the lower reaches of the North Han River, distinct diurnal flow variations were observed due to the diurnal discharge characteristics of the CPD. These were accompanied by backwater flowing backward in the upstream direction in the surface layer as well as two-layer flow during the period of zero discharge from the CPD.
In the lower reaches of the South Han River, two-layer flow occurred with upstream flow in the lower layer. Additionally, the thickness of upper and lower layers varied depending on the discharge rate of the PDD. Strong flow variations were observed in the vicinity of the PDD depending on its instantaneous discharge rate.
Flow variations, associated with depth-specific variations in water temperatures, were examined for different periods. During the vertical mixing period, the results showed that downstream flow prevailed in all layers of the North Han River and the South Han River. With regard to the North Han River, during the stratification period, the discharge water temperature of the IPW was higher than that of the CPD. This allowed for relatively high temperature water to flow in the surface layer in the upstream direction while a relatively low-temperature downstream flow occurred in the lower layer.
It can be concluded that the intermittent discharges from the CPD and the periodic discharges from the PDD and the IPW affect the formation of a convergence zone near the middle reaches of the North Han River. With regard to the South Han River, a relatively high-temperature downstream flow was observed in the surface layer. The low-temperature water residing in the lower layer allowed the water body to remain stable, thus leading to a water circulation structure that was resistant to vertical mixing between the lower layer and surface layer.
Author Contributions
I.R. and S.Y. designed the experiments; H.C., M.P., and Y.S. collected and analyzed the field data. H.C. and Y.S. wrote the manuscript. I.R., S.Y., and S.K. provided critical comments in planning this paper and edited the manuscript. All the authors discussed the results and edited the manuscript. All authors have read and agreed to the published version of the manuscript.
Funding
This study was supported by the Post-Doctoral Fellowships Program of the National Institute of Environmental Research (NIER), which is funded by the Ministry of Environment (MOE) of the Republic of Korea (NIER-RP2018-01-01-073).
Conflicts of Interest
The authors declare no conflict of interest.
References
- Carmack, E.C.; Gray, C.B.J.; Pharo, C.H.; Daley, R.J. Importance of lake-river interaction on seasonal patterns in the general circulation of Kamloops Lake, British Columbia. Limnol. Oceanogr. 1979, 24, 634–644. [Google Scholar] [CrossRef]
- Fischer, H.B.; List, J.E.; Koh, C.R.; Imberger, J.; Brooks, N.H. Mixing in Inland and Coastal Waters; Academic Press: San Diego, CA, USA, 1979. [Google Scholar]
- James, W.F.; Kennedy, R.H.; Montgomery, R.H.; Nix, J. Seasonal and longitudinal variations in apparent deposition rates within an Arkansas reservoir. Limnol. Oceanogr. 1987, 32, 1169–1176. [Google Scholar] [CrossRef]
- National Institute of Environmental Research. Multidimensional Analysis on Material Transport in Lake Paldang (II); National Institute of Environmental Research: Incheon, Korea, 2008. [Google Scholar]
- Kim, H.-S.; Kong, D.-S.; Jung, D.-I.; Hwang, S.-J. Management measures for the control of agricultural reservoirs in Han River Watershed. J. Korean Soc. Water Qual. 2009, 25, 386–393. [Google Scholar]
- Dyson, M.; Bergkamp, G.; Scanlon, J. Flow: The Essentials of Environmental Flows; IUCN: Gland, Switzerland; Cambridge, UK, 2003. [Google Scholar]
- Shin, J.; Hwang, S.; Kang, C.; Kim, H. Limnological characteristics of the river-type Paltang Reservoir, Korea: Hydrological and environmental factors. Korean J. Limnol. 2003, 36, 242–256. [Google Scholar]
- Tharme, R.E. A global perspective on environmental flow assessment: Emerging trend in the development and application of environmental flow methodologies for rivers. River Res. Appl. 2003, 19, 397–441. [Google Scholar] [CrossRef]
- Chung, S.W.; Lee, J.H.; Ryu, I.G. A coupled three-dimensional hydrological and water quality modeling of Yongdam Reservoir using ELCOM-CAEDYM. J. Korean Soc. Water Qual. 2011, 27, 413–424. [Google Scholar]
- Shin, J.-W.; Lee, B.-M.; Hur, J.; Park, J.-H. Changes in the concentrations and the characteristics of organic carbon after entrance into dam reservoirs. J. Korean Soc. Water Qual. 2013, 29, 81–87. [Google Scholar]
- National Institute of Environmental Research. A Spatially Distributed Modeling Study on the Algal Dynamics in the Middle-Upper Reaches of the North Han River, Korea (II); National Institute of Environmental Research: Incheon, Korea, 2014. [Google Scholar]
- Ambrose, R.B.; Wool, T.A.; Martin, J.L. The Water Quality Analysis Simulation Program, WASP5; U.S. EPA: Washington, DC, USA, 1993.
- Chapra, S.C. Surface Water-Quality Modeling; McGraw-Hill Inc.: New York, NY, USA, 1997. [Google Scholar]
- Lee, H.S.; Chung, S.W.; Shin, S.I.; Choi, J.K.; Kim, Y.K. Evaluation of SELECT model for the quality prediction of water released from stratified reservoir. J. Korean Soc. Water Qual. 2007, 23, 591–599. [Google Scholar]
- Coskun, H.G.; Tanik, A.; Alganci, U.; Cigizoglu, H.K. Determination of environmental quality of a drinking water reservoir by remote sensing, GIS and regression analysis. Water Air Soil Pollut. 2008, 1, 275–285. [Google Scholar] [CrossRef]
- Jung, Y.R.; Chung, S.W.; Yoon, S.W.; Oh, D.G.; Jeong, H.Y. Evaluation of the performance of water quality models for the simulation of reservoir flushing effect on downstream water quality. J. Korean Soc. Water Qual. 2009, 25, 48–57. [Google Scholar]
- Lindim, C.; Pinho, J.L.; Vieira, J.M.P. Analysis of spatial and temporal patterns in a large reservoir using water quality and hydrological modeling. Ecol. Model. 2011, 222, 2485–2494. [Google Scholar] [CrossRef]
- Munyati, C. A spatial analysis of eutrophication in dam reservoir water on the Molopo River at Mafikeng, South Africa. Sustain. Water Qual. Ecol. 2015, 6, 31–39. [Google Scholar] [CrossRef]
- Yazdi, J.; Moridi, A. Interactive reservoir-watershed modeling framework for integrated water quality management. Water Resour. Manag. 2017, 31, 2105–2125. [Google Scholar] [CrossRef]
- Kim, D.; Park, H.-S.; Chung, S.-W. Relationship of the thermal stratification and critical flow velocity near the Baekje Weir in Geum River. J. Korean Soc. Water Environ. 2017, 33, 449–459. [Google Scholar]
- Perello, M.M.; Kane, D.D.; Golnick, P.; Hughes, M.C.; Thomas, M.A.; Conroy, J.D. Effects of local weather variation on water-column stratification and hypoxia in the Western, Sandusky, and Central Basins of Lake Erie. Water 2017, 9, 279. [Google Scholar] [CrossRef]
- Koue, J.; Shimadera, H.; Matsuo, T.; Kondo, A. Evaluation of thermal stratification and flow filed reproduced by a three-demensional hydrodynamic model in Lake Biwa, Japan. Water 2018, 10, 47. [Google Scholar] [CrossRef] [Green Version]
- Chong, S.; Park, C.; Lee, K.R.; An, K.-G. Modeling summer hypoxia spatial distribution and fish habitat volume in artificial estuarine waterway. Water 2018, 10, 1695. [Google Scholar] [CrossRef] [Green Version]
- Torma, P.; Wu, C.H. Temperature and circulation dynamics in a small and shallow lake: Effects of weak stratification and littoral submerged macrophytes. Water 2019, 11, 128. [Google Scholar] [CrossRef] [Green Version]
- Wang, X.; Zhang, H.; Bertone, E.; Stewart, R.A.; O’Halloran, K. Analysis of the mixing processes in a shallow subtropical reservoir and their effects on dissolved organic matter. Water 2019, 11, 737. [Google Scholar] [CrossRef] [Green Version]
- Kim, D.; Kim, B.; Hwang, G.; Park, J. Trend of eutrophication in Lake Paldang (1998–1994). J. Korean Soc. Water Qual. 1995, 11, 295–302. [Google Scholar]
- National Institute of Environmental Research. Comparative Study on the Characteristics of Water Pollutants between Lake-Type and River-Type Lakes (II); National Institute of Environmental Research: Incheon, Korea, 2003. [Google Scholar]
- Kim, J.; Noh, H.; Heo, S.; Yang, H.; Park, J. A study on the water quality affected by the rainfall and influent rivers in Paldang Reservoir, Korea. J. Korean Soc. Water Qual. 2005, 21, 277–283. [Google Scholar]
- Kim, Y.K.; Choi, G.W.; Ham, M.S.; Kim, N.W. The analysis of potential discharge by dam in Han River Basin at dry season. J. Korean Water Resour. Assoc. 2008, 41, 1143–1152. [Google Scholar] [CrossRef]
- National Institute of Environmental Research. The Investigation of Organic Matter Distribution and Transportation in Lake Paldang (I); National Institute of Environmental Research: Incheon, Korea, 2018. [Google Scholar]
- Shin, D.S.; Ryu, J.K. Water quality simulation for Paldang Lake with RMA (I). J. Korean Soc. Water Qual. 1999, 15, 99–105. [Google Scholar]
- Na, E.; Park, S. A three-dimensional modeling study of Lake Paldang for spatial and temporal distributions of temperature, current, residence time, and spreading pattern of incoming flows. J. Korean Soc. Environ. Eng. 2005, 27, 901–910. [Google Scholar]
- Seo, I.W.; Choi, N.J.; Jun, I.O.; Song, C.G. Mixing characteristics of nonconservative pollutants in Paldang Lake. J. Civ. Eng. 2009, 29, 221–230. [Google Scholar]
- National Institute of Environmental Research. A Comprehensive Study on Water Quality Control of Paldang Watershed (III); National Institute of Environmental Research: Incheon, Korea, 2017. [Google Scholar]
- Rennie, C.D.; Church, M. ADCP shear stress and bedload transport in a large wandering gravel-bed river. In Proceedings of the 32nd IAHR Congress, Venice, Italy, 1–6 July 2007; p. 10. [Google Scholar]
- Rennie, C.D. Uncertainty of ADCP spatial velocity distribution. In Proceedings of the 6th International Symposium on Ultrasonic Doppler Methods for Fluid Mechanics and Fluid Engineering, Prague, Cezch Republic, 9–11 September 2008; pp. 147–150. [Google Scholar]
- RenniJamieson, E.; Rennie, C.; Jacobson, R.; Townsend, R. 3-d flow and scour near a submerged wing dike: ADCP measurements on the Missouri river. Water Resour. Res. 2011, 47, W07544. [Google Scholar] [CrossRef]
- Tsubaki, R.; Kawahara, Y.; Muto, Y.; Fujita, I. New 3-D flow interpolation method on moving ADCP data. Water Resour. Res. 2012, 48, W05539. [Google Scholar] [CrossRef] [Green Version]
- Simpson, J.H.; Bowers, D. Models of stratification and frontal movement in the shelf seas. Deep Sea Res. 1981, 28, 727–738. [Google Scholar] [CrossRef]
- Simpson, J.H.; Brown, J.; Matthews, J.P.; Allen, G. Tidal straining, density currents and strring in the control of estuaries stratification. Estuaries 1990, 13, 125–132. [Google Scholar] [CrossRef]
- Lee, B.G.; Cho, H.D. The spatial characteristics of stratification in Deukryang Bay, Korea. J. Korean Environ. Sci. Soc. 1998, 7, 223–231. [Google Scholar]
- Rippeth, T.P.; Fischer, N.R.; Simpson, J.H. The cycle of turbulent dissipation in the presence of tidal straining. J. Phys. Oceanogr. 2001, 31, 2458–2471. [Google Scholar] [CrossRef]
- Choi, J.H.; Kim, K.Y.; Hong, D.B. Impact of seawater inflow on the temperature and salinity in Shihwa Lake, Korea. J. Korean Earth Sci. Soc. 2000, 21, 541–552. [Google Scholar]
- Yamaguchi, R.; Suga, T.; Richards, K.J.; Qiu, B. Diagnosing the development of seasonal stratification using the potential energy anomaly in the North Pacific. Clim. Dyn. 2019, 53, 4667–4681. [Google Scholar] [CrossRef]
- Kang, Y.S.; Chae, Y.K.; Lee, H.R. Variation of density stratification due to fresh water discharge in the Kwangyang Bay and Jinju Bay. J. Korean Soc. Coast. Ocean Eng. 2011, 23, 126–137. [Google Scholar] [CrossRef]
- Kim, T.I.; Lee, R.L.; Chang, K.I. Seasonal variation of density stratification in the Saemangeum waters, Korea. Ocean Polar Res. 2006, 28, 339–352. [Google Scholar] [CrossRef] [Green Version]
- Oh, C.S.; Choi, J.H. Consideration on changes of density stratification in Saemangeum Reservoir. J. Korean Soc. Mar. Environ. Energy 2015, 18, 81–93. [Google Scholar] [CrossRef]
- Huang, Y.; Liu, D.; Chen, M. Simulation of algae bloom under different flow velocity. J. Appl. Ecol. 2008, 19, 2293–2298. [Google Scholar]
Figure 1.
Location of monitoring sites in the Paldang Reservoir.

Figure 2.
Installation of the water temperature gauge and acoustic Doppler current profiler (ADCP). The TRBM is the trawl-resistant bottom mount.
Figure 2.
Installation of the water temperature gauge and acoustic Doppler current profiler (ADCP). The TRBM is the trawl-resistant bottom mount.

Figure 3.
Discharge of the Ipo Weir (IPW), the Cheongpyeong Dam (CPD), and the Paldang Dam (PDD); wind speed and wind direction at PA1; and velocity by depth at PC1 from 12 May to 17 June 2016.
Figure 3.
Discharge of the Ipo Weir (IPW), the Cheongpyeong Dam (CPD), and the Paldang Dam (PDD); wind speed and wind direction at PA1; and velocity by depth at PC1 from 12 May to 17 June 2016.

Figure 4.
Velocity vectors for the different depth layers and periods.


Figure 5.
Profiles of the residual current for each station and period.

Figure 6.
Profiles and time series of the water temperature, flow velocity, and Richardson number at PC1.
Figure 6.
Profiles and time series of the water temperature, flow velocity, and Richardson number at PC1.

Figure 7.
Profiles and time series of the water temperature, flow velocity, and Richardson number at PC2.
Figure 7.
Profiles and time series of the water temperature, flow velocity, and Richardson number at PC2.

Figure 8.
Profiles and time series of the water temperature, flow velocity, and Richardson number at PC3.
Figure 8.
Profiles and time series of the water temperature, flow velocity, and Richardson number at PC3.

Figure 9.
Wind roses by meteorological station from 9 May to 17 June 2016.

Figure 10.
Relationships between velocity and discharge.


Figure 11.
Diagram of the water circulation structure in the Paldang Reservoir (stratification period).
Figure 11.
Diagram of the water circulation structure in the Paldang Reservoir (stratification period).

Figure 12.
Time series of dissolved oxygen (DO) by water depth for each monitoring station.


Table 1.
Parameters for gridding utilized in the Kriging interpolation.
| Parameter | Value |
|---|---|
| Kriging type | Point |
| Transformation method | Linear (use z values directly) |
| Break line filtering | Not in use |
| Polynomial drift order | 0 |
| Kriging standard deviation grid | 0 |
| Semi-variogram model: | |
| Component type | Linear |
| Anisotropy angle | 0 |
| Anisotropy ratio | 1 |
| Variogram slope | 1 |
© 2020 by the authors. Licensee MDPI, Basel, Switzerland. This article is an open access article distributed under the terms and conditions of the Creative Commons Attribution (CC BY) license (http://creativecommons.org/licenses/by/4.0/).
Share and Cite
MDPI and ACS Style
Choi, H.; Ryu, I.; Park, M.; Song, Y.; Yu, S.; Kim, S. Analysis of the Water Circulation Structure in the Paldang Reservoir, South Korea. Appl. Sci. 2020, 10, 6822. https://doi.org/10.3390/app10196822
AMA Style
Choi H, Ryu I, Park M, Song Y, Yu S, Kim S. Analysis of the Water Circulation Structure in the Paldang Reservoir, South Korea. Applied Sciences. 2020; 10(19):6822. https://doi.org/10.3390/app10196822
Chicago/Turabian StyleChoi, Hwangjeong, Ingu Ryu, Minji Park, Yongsik Song, Soonju Yu, and Sanghun Kim. 2020. "Analysis of the Water Circulation Structure in the Paldang Reservoir, South Korea" Applied Sciences 10, no. 19: 6822. https://doi.org/10.3390/app10196822
Note that from the first issue of 2016, this journal uses article numbers instead of page numbers. See further details here.