Feed Rate Variation Strategy for Semi-Conical Shell Workpiece in Ball Head End Milling Process

1
Beijing Key Laboratory of Advanced Manufacturing Technology, Beijing University of Technology, Beijing 100124, China
2
Beijing Key Laboratory of Electrical Discharge Machining Technology, Beijing 100124, China
*
Author to whom correspondence should be addressed.
Appl. Sci. 2020, 10(24), 9135; https://doi.org/10.3390/app10249135
Submission received: 26 November 2020
/
Revised: 15 December 2020
/
Accepted: 18 December 2020
/
Published: 21 December 2020
(This article belongs to the Special Issue Advanced Manufacturing of Metals)
Abstract
:Featured Application
The proposed method in this paper can be applied to the field of precision manufacturing of the end milling process.
Abstract
The semi-conical shell workpiece is a special kind of thin-wall part that is commonly used in aerospace and mold industries. Due to the special stiffness distribution and weak rigidity for the area with a large radius, the machining quality of the semi-conical shell is sensitive to both cutting force and vibration. Conventionally, constant conservative machining parameters are chosen to ensure the workpiece deformation and surface quality, which will reduce the machining efficiency. Based on the cutting force and vibration response simulation of the whole milling process. A feed rate variation strategy is proposed for the ball head end milling process of the semi-conical shell workpiece. The cutting force, dynamic performance and stability prediction are obtained considering the shape and boundary conditions of the workpiece and the contour tool path of the milling process. Variable feed rate is used in the milling simulation to find the harmony between machining quality and efficiency. User-defined vibration amplitude and another user-defined cutting force threshold are used to find the optimal feed rate for each simulation segment. Both continuous and discrete feed rate variation strategies are proposed, and the improved discrete feed rate variation is applied in the milling experiment. About 25% of the consumed time is saved with almost the same machining quality by the experimental results.
1. Introduction
The advanced machining technologies of thin-walled parts have generated considerable recent research interest. The semi-conical shell workpiece is a special kind of thin-wall part widely used in aerospace, die and mold industries. Considering the special geometry, stiffness distribution, and thin-wall property of the semi-conical workpiece, the selection of machining parameters like spindle speed and feed rate should be both reasonable and efficient. In general, constant conservative parameters are chosen to ensure the workpiece deformation and surface quality, which will reduce the machining efficiency. In order to achieve harmony between machining quality and efficiency, many researchers studied the influence of tool path strategy [1,2], spindle speed [3,4] and feed rate [5] on the machining process and proposed many machining technologies with variable machining parameters. Among them, the feed rate variation strategy is one of the most direct and efficient methods to improve machining efficiency. However, the selection of excessive feed rate will markedly aggravate the cutting force, tool deflections and increase the risk of tool wear, chipping and surface quality losses of the workpiece. Therefore, the proper selection of planning technology and control parameter are two key factors in the design of a feed rate variation strategy.
According to much research in recent years, three kinds of feed rate optimization methods have been proposed and reviewed by Kurt et al. [6]. The first is a traditional feed rate scheduling strategy based on the material removal rate (MRR) model, in which the feed rate is expected to be proportional to either average or instantaneous material removal rate [7]. In the optimization of the 5-axis milling cutting parameters, Zhang et al. [8] used the MRR assumption to adjust the feed rate iteratively. The optimized results were validated to be accurate experimentally, but the iteration process was found to be time-consuming. The MRR model is more suitable for the roughing process, and much commercial software has embedded the optimization module based on it, but the optimal feed rate can hardly be obtained due to the complexity of real machining force prediction. Consequently, the second method uses a mechanistic model as a basis. In this method, the cutting force is the most important control parameter because in addition to the tool deflections, the feed rate variation will affect the machining force directly, leading to surface form errors and tool wear. The more accurate the force calculation approach is, the better the feed rate strategy can be, but it is still difficult to integrate into the workshop. A user-defined threshold to keep the resultant cutting force constant has been used in the research of Salami et al. [9] and Benardos et al. [10]. Their strategies are quick but lack precision. As for end-milling on a 5-axis machining center, more complex features like concave corners, upward and downward cutting must be considered. Ferry et al. [11] proposed two methods of offline feed rate scheduling according to multiple feed-dependent constraints for 5-axis flank milling with serrated, tapered, helical, ball-end milling cutters with variable-pitch flutes. Nearly half of the cycle time could be saved in their experiment; the performance was discussed in detail. Erdim et al. [12] compared the MRR based and force-based feed rate scheduling strategies theoretically and experimentally for 3-axis ball-end milling of freeform surfaces. It was shown that MRR based feed rate strategy outputs higher feed rate values compared with a force-based feed rate strategy, and the high feed rate values of the MRR strategy increased the cutting forces extensively, which can damage the tool and violate the part’s dimensional accuracy. The last kind of optimization method is based on artificial intelligence techniques, including the artificial neural network [13] and the genetic-simulated annealing algorithm [14]. Layegh et al. [15] used a genetic algorithm that makes use of an artificial neural network model of the cutting force to optimize the feed rate and spindle speed in sculptured surface machining. Their results are very accurate and effective. However, their methods can hardly be separated from the corresponding milling condition and need much experimental data. Recently, Arruda et al. [16] even proposed a robust optimization in which the machining parameters are chosen based on a combination of methodologies instead of the mechanical mechanism. The influence of noise on the surface roughness can be reduced effectively, but a mass of experiments are needed to be conducted.
Various feed rate optimization strategies have different feed rate rescheduling control parameters such as reference cutting force [15,17], MRR, chip thickness, surface roughness [18,19], tool deflection [20], etc. Conventionally, the planning of the feed rate variation is to consider only one constraint at all machining segments, such as keeping constant MRR, keeping constant tool deflection value [21] or keeping constant resultant cutting force. Li et al. [22] compared the influence of different control parameters on the machining time and feed rate changes and proposed strategies combining various feed rate control parameters such as min (MRR, chip, force), max (MRR, chip, force), etc. Furthermore, Lacalle et al. [23] proposed a proper selection of tilt and feed sense angles to avoid tool deflection due to the cutting forces. Different feeds and cutting speeds were also determined based on different hardness levels of the whole zones of advanced high-strength steels workpiece. Altintas et al. [24] and Erkorkmaz et al. [25] proposed a feed rate optimization by considering the constraint from the feed drive system. In order to preserve drive component life, avoid actuator saturation, and limit the dynamic positioning errors and structural vibrations. The velocity, acceleration, and jerk magnitudes commanded to each actuator were considered, and these methods have been experimentally validated in rough machining of a sculptured surface.
It can be observed that most of the research about feed rate optimization is based on the cutting force and MRR. This can be appropriate for a rigid workpiece, and it will be different when the workpiece is flexible. Both static and dynamic analyses are needed to be considered because the flexibility of the workpiece would induce vibration or even instability. When the amplitude of vibration is large enough, the plastic deformation will be created instead of elastic deformation, which will aggravate the machining accuracy. Fei et al. [26] reviewed that the part deformation may be caused by the machining load, residual stress, temperature, cutting sequence, cutting path, fixture conditions or vibration variation, which will result in the dimensional error and affect the surface quality. The machining deformation errors caused by both flexible cutter [27,28] and flexible workpiece [29] have been studied in much research. With the use of the finite element method (FEM), Dong et al. [29] proposed a machined surface error estimation method by the static analysis and explicit dynamic analysis, the static deformation due to clamping force and the dynamic deformation due to milling forces are considered and calculated.
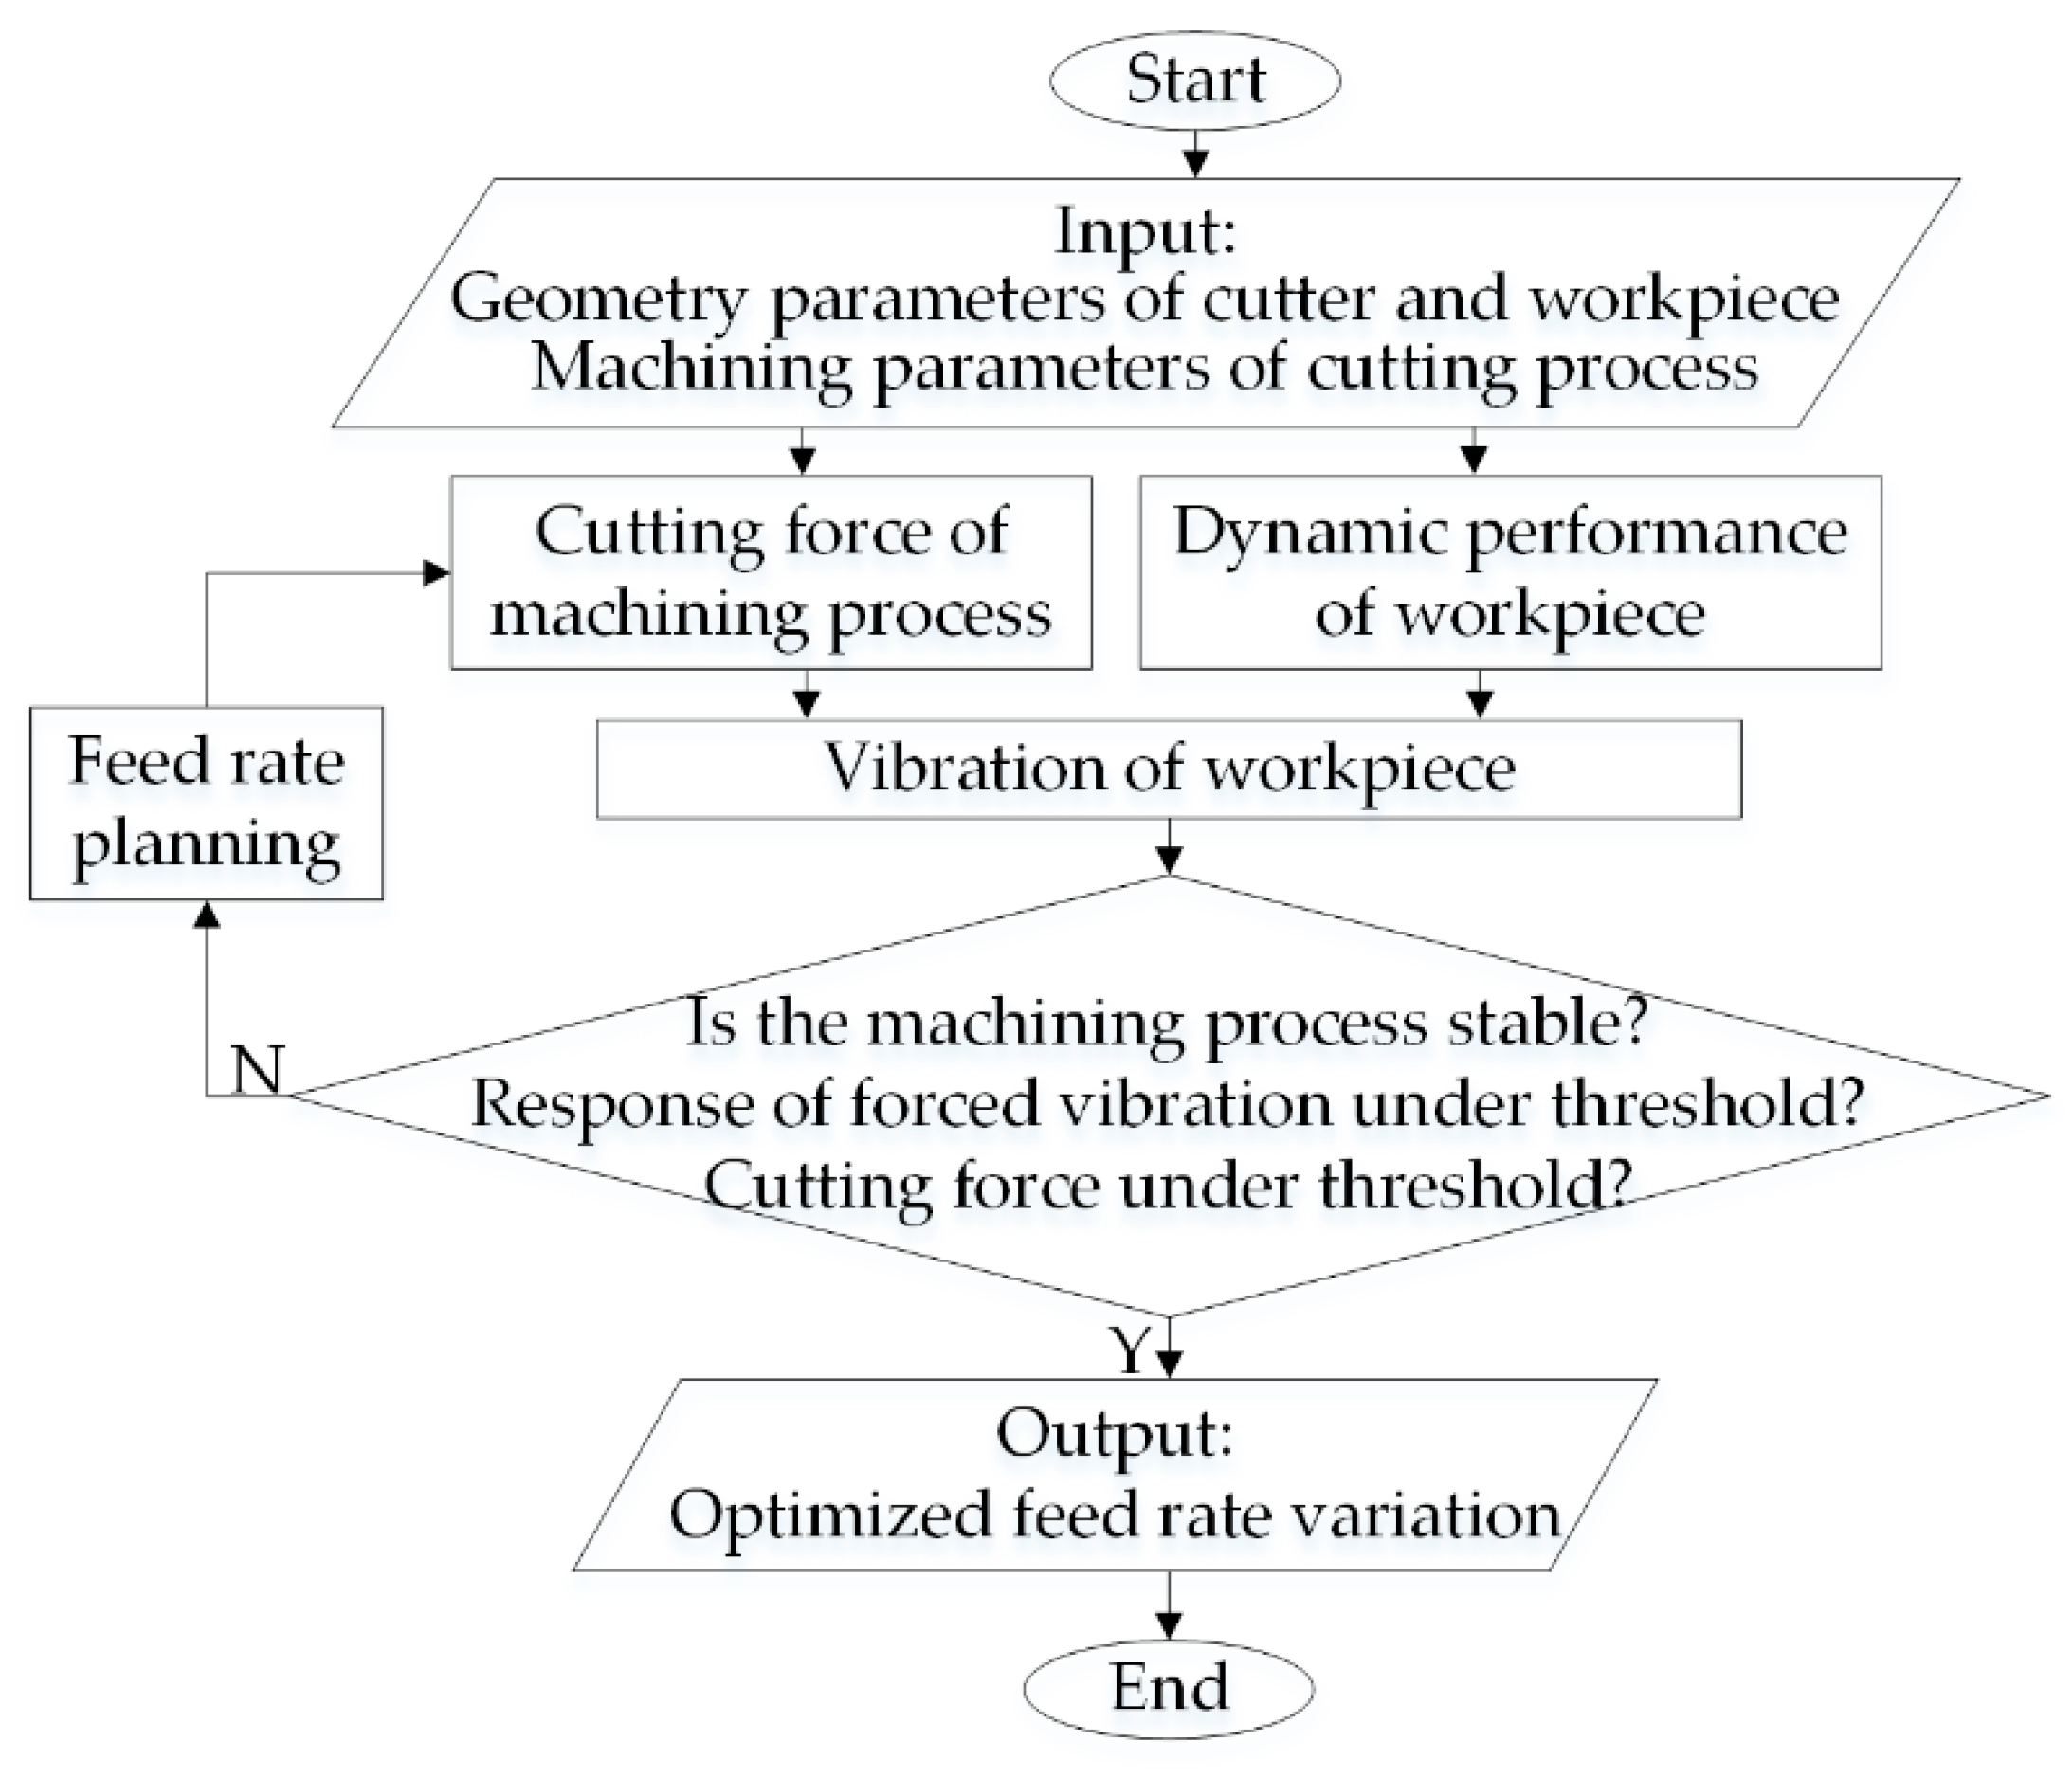
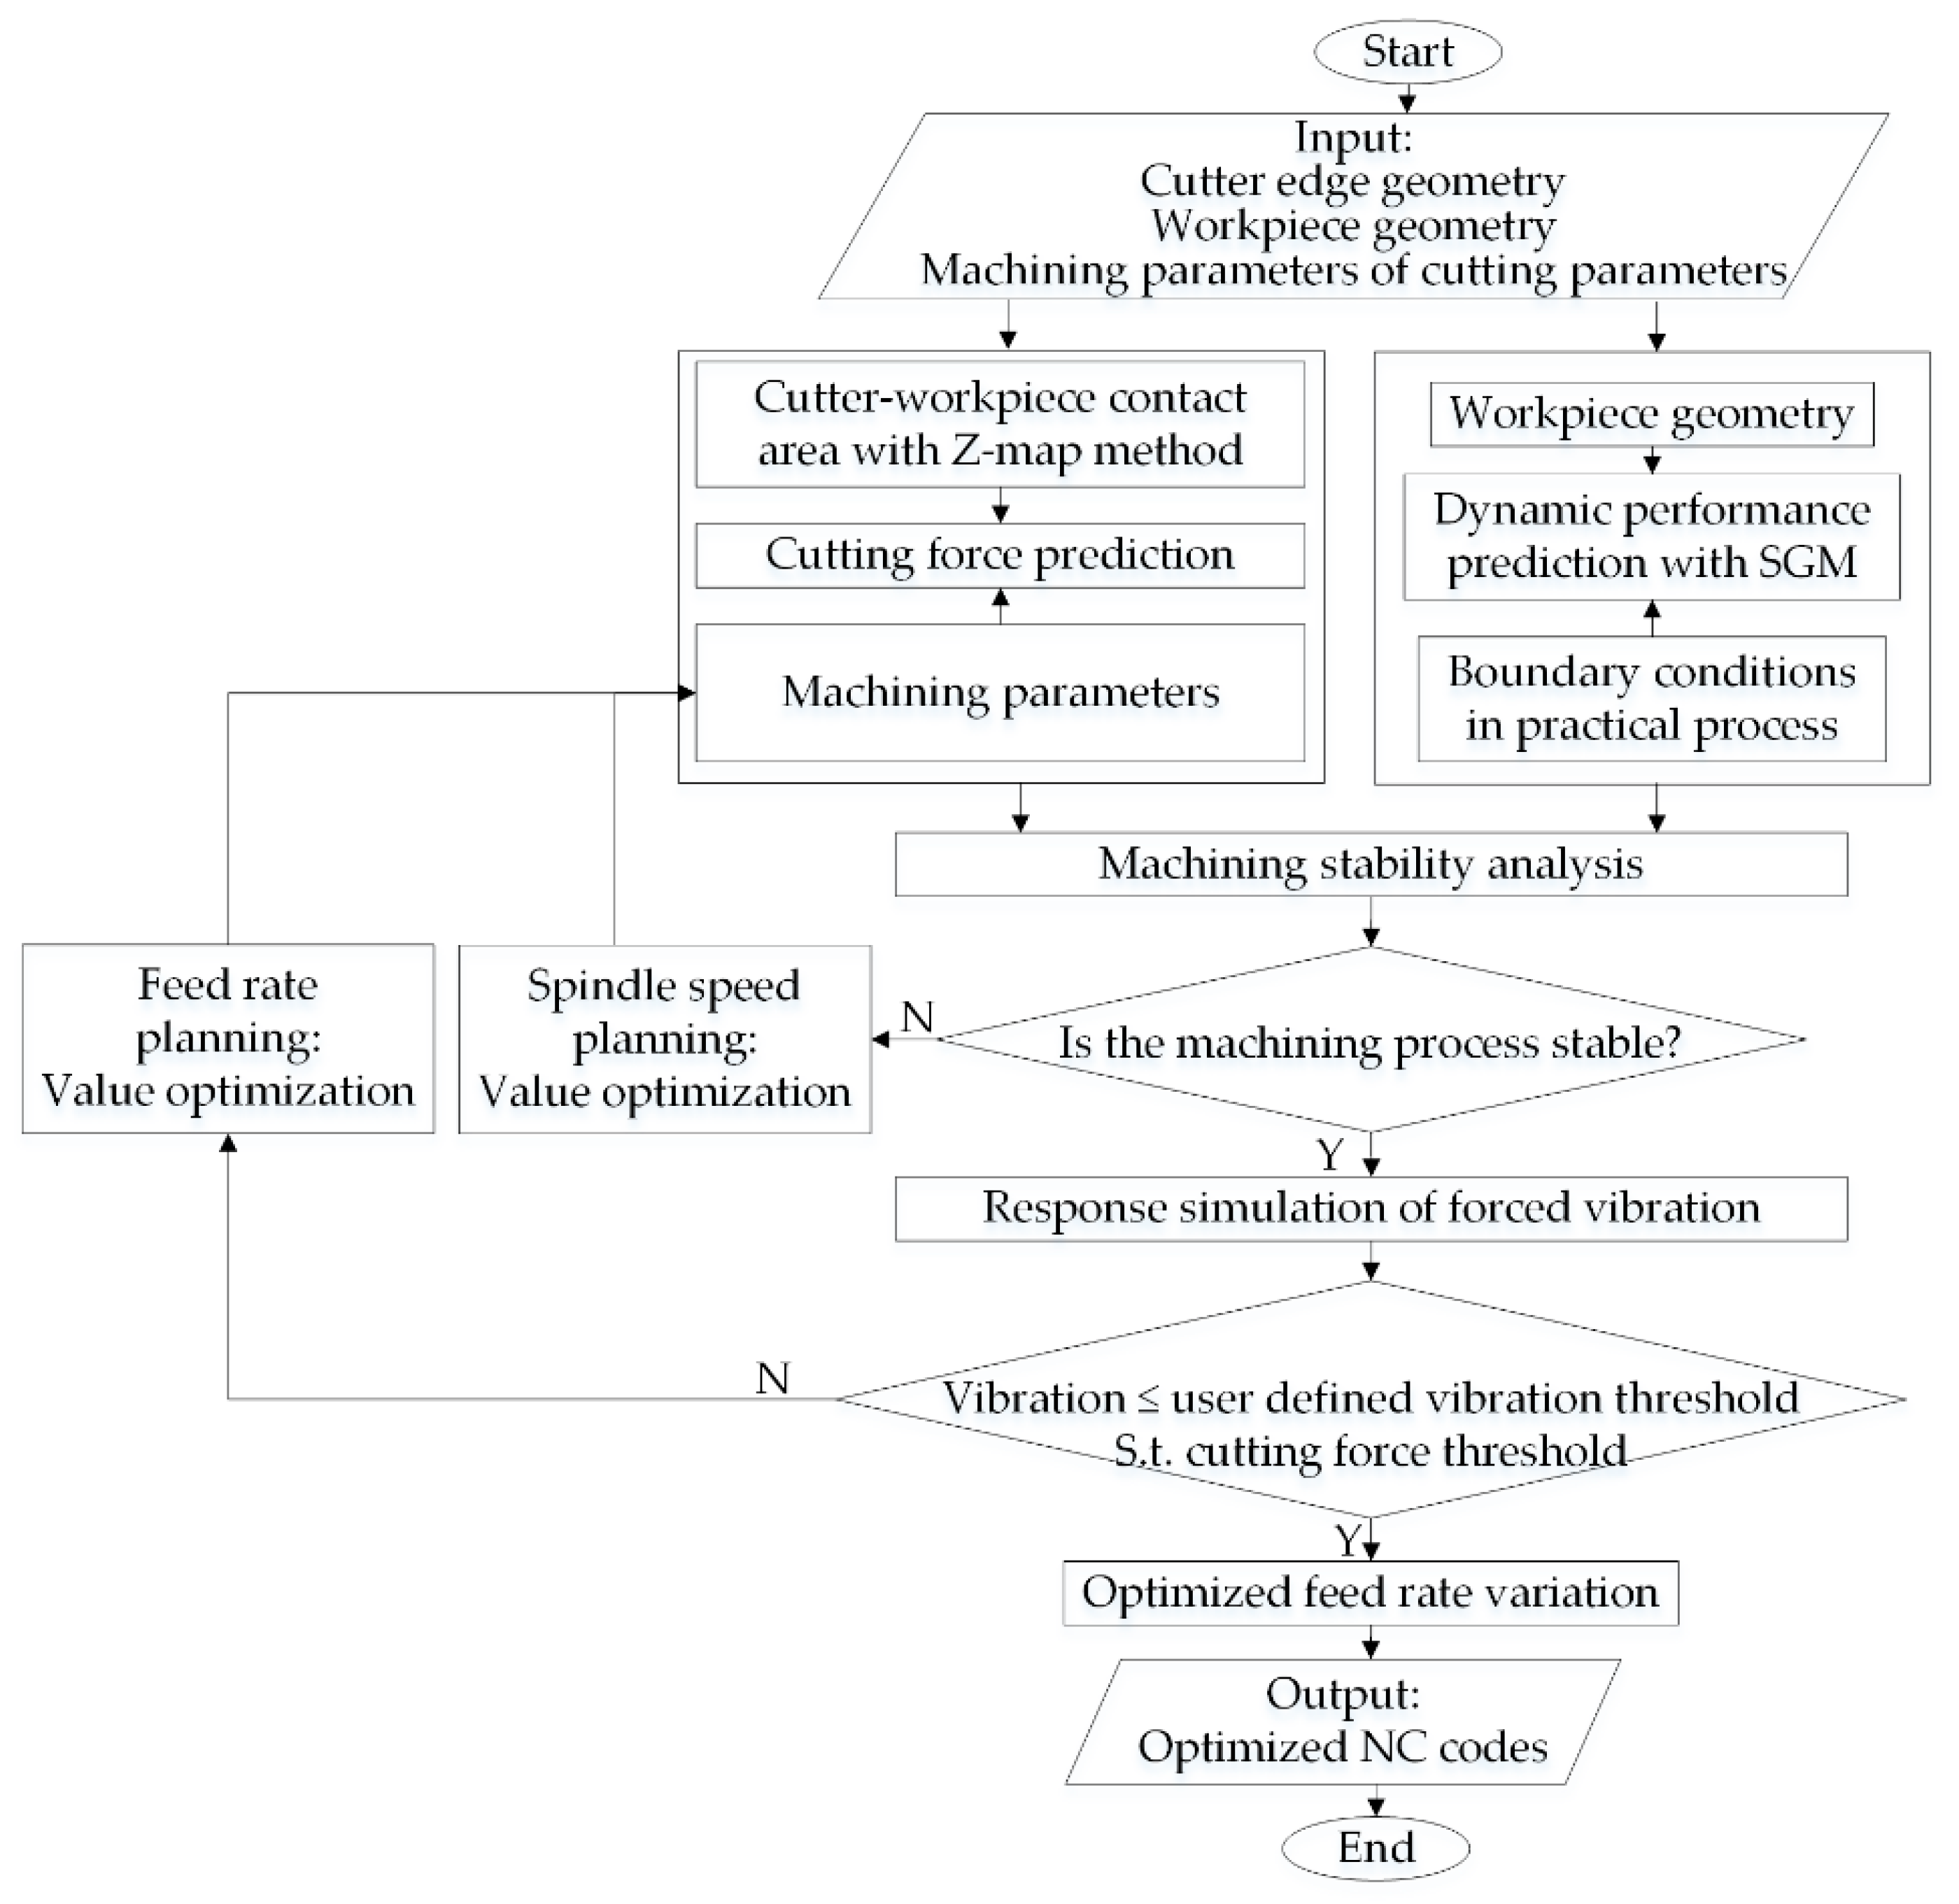
Based on the virtual machining technology withanalytical models, this paper studied and simulated the cutting force and vibration of the whole end milling process and proposed a feed rate variation strategy. A general flow diagram of the proposed feed rate variation strategy is shown in Figure 1. In the vibration analysis, the stability of the cutting process is estimated with the use of the stability lobe diagram (SLD) and the forced vibration response is obtained combining the cutting force simulation from Wei’s method [30] and dynamic performance simulation from the spectro–geometric–Ritz method (SGM) proposed by Shi et al. [31]. The feed rate is set to maintain the forced vibration response at a user-defined value, and its upper limit is subjected to a user-defined cutting force threshold. Consequently, the optimized feed rate variation is obtained and applied in the practical milling experiment. Considering the feed is the most influential cutting parameter concluded by Urbikain et al. [32], the surface roughness is also measured to verify the influence of the feed rate variation on the machining quality in the experiment.
The main contributions of this paper can be summarized as follows:
- (1)
- Comparing to the traditional feed rate variation strategy, both cutting force and vibration response are used to design the optimal feed rate variation. This can be more effective for the special thin-walled parts like semi-conical shell workpiece with special stiffness distribution.
- (2)
- Combining the cutting force and dynamic performance prediction, the forced vibration response of the semi-conical shell workpiece is obtained and used in the variable feed rate planning. The proposed feed rate variation strategy can be applied to the ball head end milling process with the contour tool path, and nearly a quarter of the consuming time can be saved.
This paper is organized as follows: Section 2 briefly introduces the basic calculation of the cutting force in the ball head end milling process, the dynamic performance of the semi-conical shell workpiece and the stability of the cutting system. The calculation results are used to determine the stability of the cutting system and calculate the vibration response with the use of the modal analysis. Section 3 proposes the design and simulation results of a continuous feed rate variation strategy and a discrete feed rate variation strategy. The milling experiments are conducted to verify the proposed improved discrete feed rate variation strategy in Section 4. Based on the used methods and obtained results, this paper is discussed in Section 5 and concluded in Section 6.
2. Vibration Simulation of the Milling Process
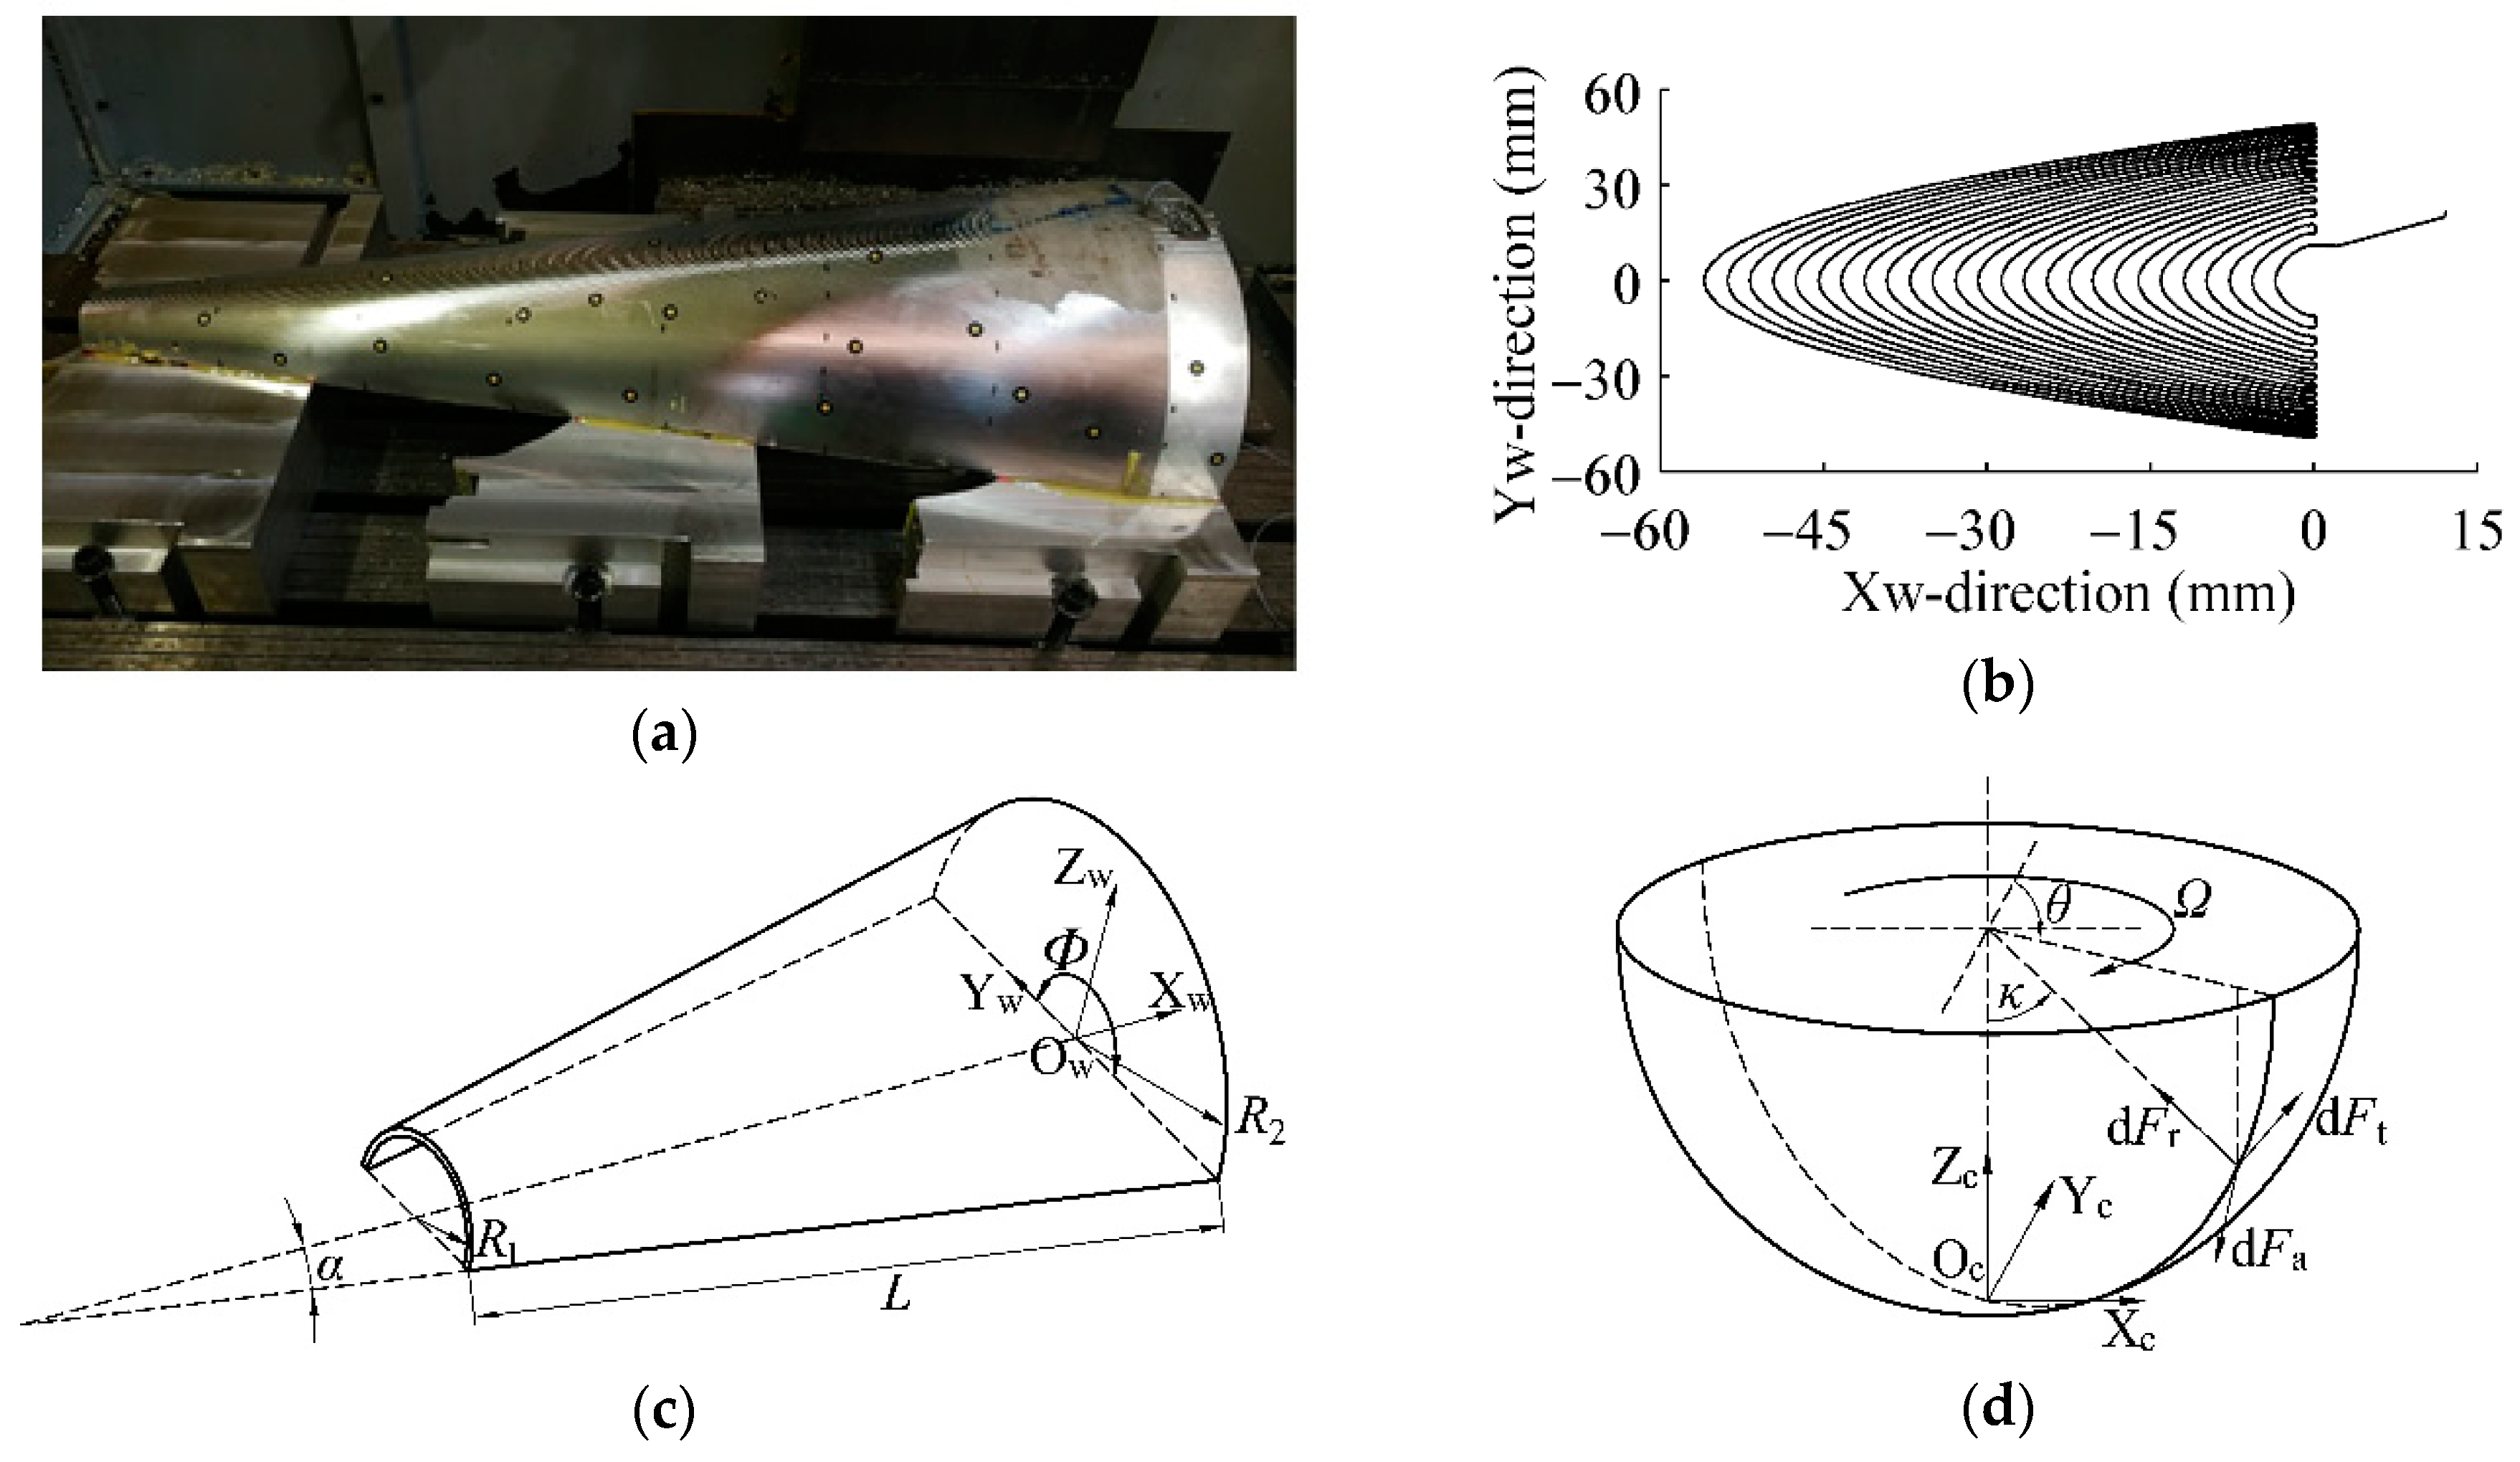
This paper focuses on a practical machining process in which the outer surface of the semi-conical shell workpiece is milled with a ball head endmill cutter in a 3-axis machining center, as shown in Figure 2a. The geometric parameters of the workpiece and cutter are shown in Table 1, where R1 and R2 represent the radius of the right and left end of the workpiece, respectively. h represents the thickness of the workpiece. The material of the workpiece is the Al-Cu cast aluminum alloy with alloy code ZL205A in GB/T1173 or 3522 in ISO. It is regarded as the strongest aluminum alloy, which possesses good plastic and corrosion resistance, excellent machining and welding performance. The partial schematic diagram of the contour tool path is shown in Figure 2b, and the height difference between adjacent contour lines is set as 0.3 mm. A stationary rectangular coordinate system Ow-XwYwZw of the workpiece is built to help describe the condition as shown in Figure 2c, and the geometric parameters of the workpiece are also shown in the same figure. The schematic diagram of the ball head endmill cutter is given in Figure 2d, and it should be noted that there is a difference between adjacent contour lines. When the cutter moves along the negative direction of the Yw-axis, it is an up milling process, which possesses a larger vibration and vice versa. In the machining process, the depth of cut is set as 0.2 mm constantly in the sphere radius direction of the ball head cutter, and the spindle speed is set as 3600 rpm. Because of the weak rigidity property of the area with a large radius, a conservative constant feed rate of 800 mm min−1 is chosen to avoid large workpiece vibration caused by the cutting force and flexibility.
In order to find the optimal feed rate variation, the vibration analyses containing machining stability and forced vibration response are calculated with the theory of mechanical vibration where the cutting force and dynamic performance are needed. The cutting force is obtained by Wei’s method [30], which takes the special geometry of the workpiece and cutter, variable cutter–workpiece interface and contour tool path into consideration. The SGM [31] is used to calculate the dynamic performance of the semi-conical shell workpiece, which is very feasible and accurate.
2.1. Cutting Force Prediction
Due to the special geometry of the semi-conical shell workpiece and the use of the ball head endmill cutter, the cutter–workpiece engagement frequently varies in the whole milling process. In order to handle this issue, two approaches, namely, the Z-map method [33,34] and the solid modeler method [35,36], are commonly used to determine the area of engagement. Based on the improved Z-map method, in which the logical array is used in the cutter–workpiece interface determination, Wei et al. [30] proposed a cutting force prediction method in 3-axis ball head end milling of a sculptured surface along an arbitrary tool path. The speed, accuracy, and performance of these two different approaches were compared and developed by Boz et al. [37]. In their research, the solid modeler method was proved to be faster and more applicable for complex 5-axis machining, while the Z-map method was more flexible and simpler for 3-axis machining. Besides the conventional calculation of static cutting force, the calculation of the dynamic cutting force considering the tool run-out effect [38], tool geometry, orientation tilt and lead angles, modal parameters and cutting conditions [39] have been proposed. With these accurate methods, the cutting force and vibration in the process can be predicted, which is very useful. However, the static cutting force prediction approach proposed by Wei et al. [30] is used in this paper because the cut segments of the dynamic cutting calculation need to be very small to guarantee the accuracy, which needs a large number of computations. More crucial is that the initial value plays a very important role in the calculation of the dynamic forces, which may lead to a big difference from the practical condition. Hence, the static cutting force modal is used in this paper, and each cut segment is set as feed per tooth with the maximum and minimum cutting force of each segmented cut are preserved. This can demonstrate the trend of force and possess high computational efficiency.
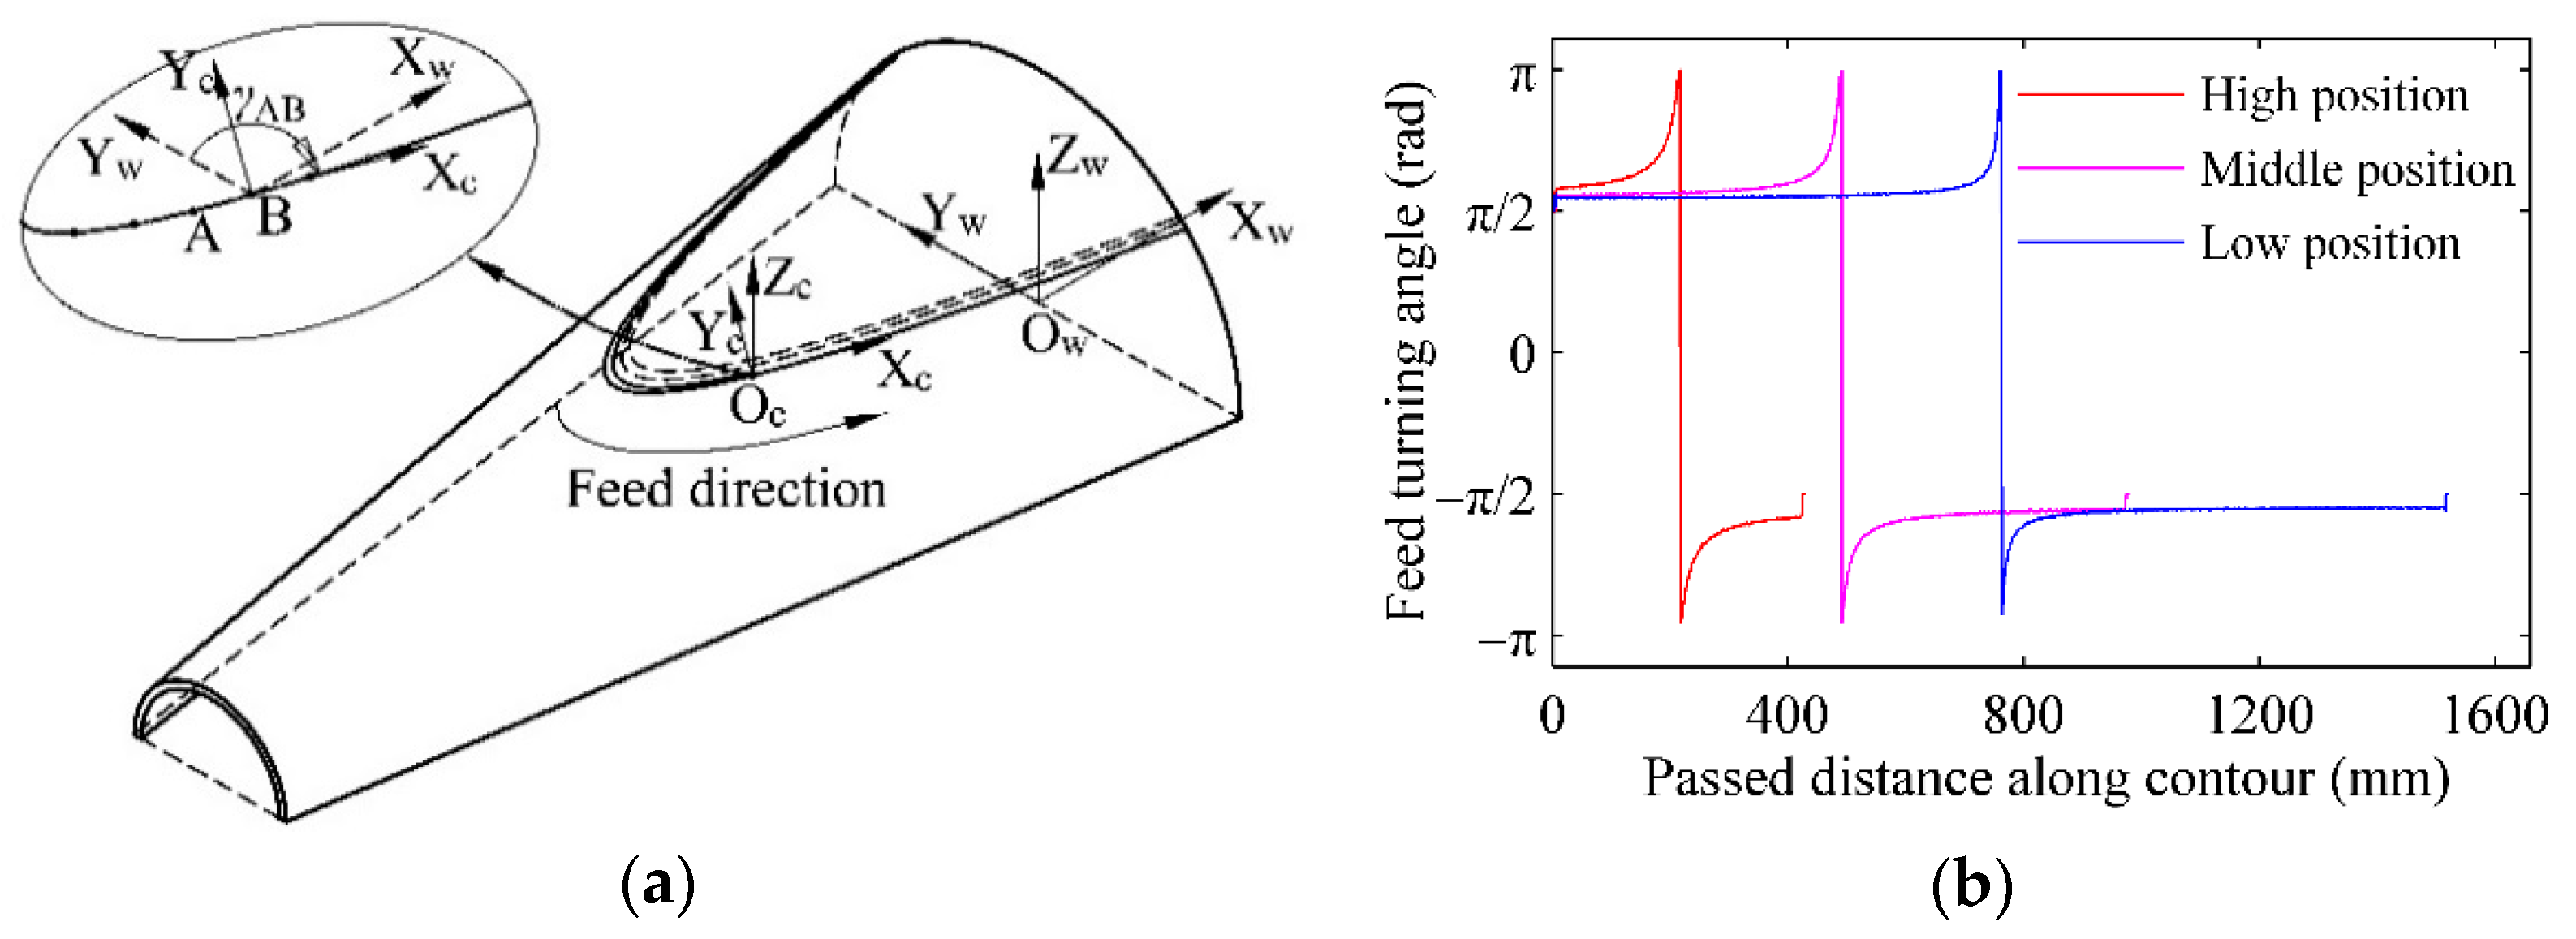
The cutting force prediction approach proposed by Wei et al. [30] is based on the traditional elemental mechanical cutting force model [40] and the chip thickness model for steady-state ball-end milling machining [41]. The key to this approach is the calculation of the feed turning angle and cutter–workpiece contact area of each segmented position along the tool path because they are frequently changing. In order to define the feed turning angle, a dynamic rectangular coordinate system Oc-XcYcZc of the cutter is established as depicted in Figure 2d and Figure 3a. The Xc-direction designates the projected feed direction within the perpendicular plane of the cutter axis, the Zc-direction points upward along the cutter axis, and the feed vector of this cutting process is expressed as fAB. The feed turning angle γAB can then be defined as the angle between the Xc-direction and the Yw-direction, which ranges from −π rad to π rad along each contour tool path. The sign of the γAB is determined by the sign of the first component of fAB, which means that it is negative when the cutter moves to the positive direction of the Xw-axis and vice versa. In this finish milling process, the heights of each contour are ranging from 146 mm to 26 mm. The endmill cutter with a flat head will then be used for the milling of the lower position instead of the ball head, which will not be discussed in this paper. Three contour paths from different heights are chosen to be studied in detail, which is situated at the heights of 120 mm, 80 mm, and 40 mm. They are abbreviated as HP (high position), MP (middle position) and LP (low position), respectively. The variations of the feed turning angle from different heights are shown in Figure 3b. It can be observed that the feed turning angle starts from π/2 at the beginning of the contour path, and it is increasing gradually until the cutter reaches the middle of each contour path. Near the left part of the workpiece, where the radius is small, the maximum feed turning angle π is reached and then its sign changes to negative. It continues to increase until the cutter reaches the end of the contour path, where it is −π/2. The length of each contour path can also be seen from Figure 3b, and a longer distance is passed for machining a whole contour path at the lower height.
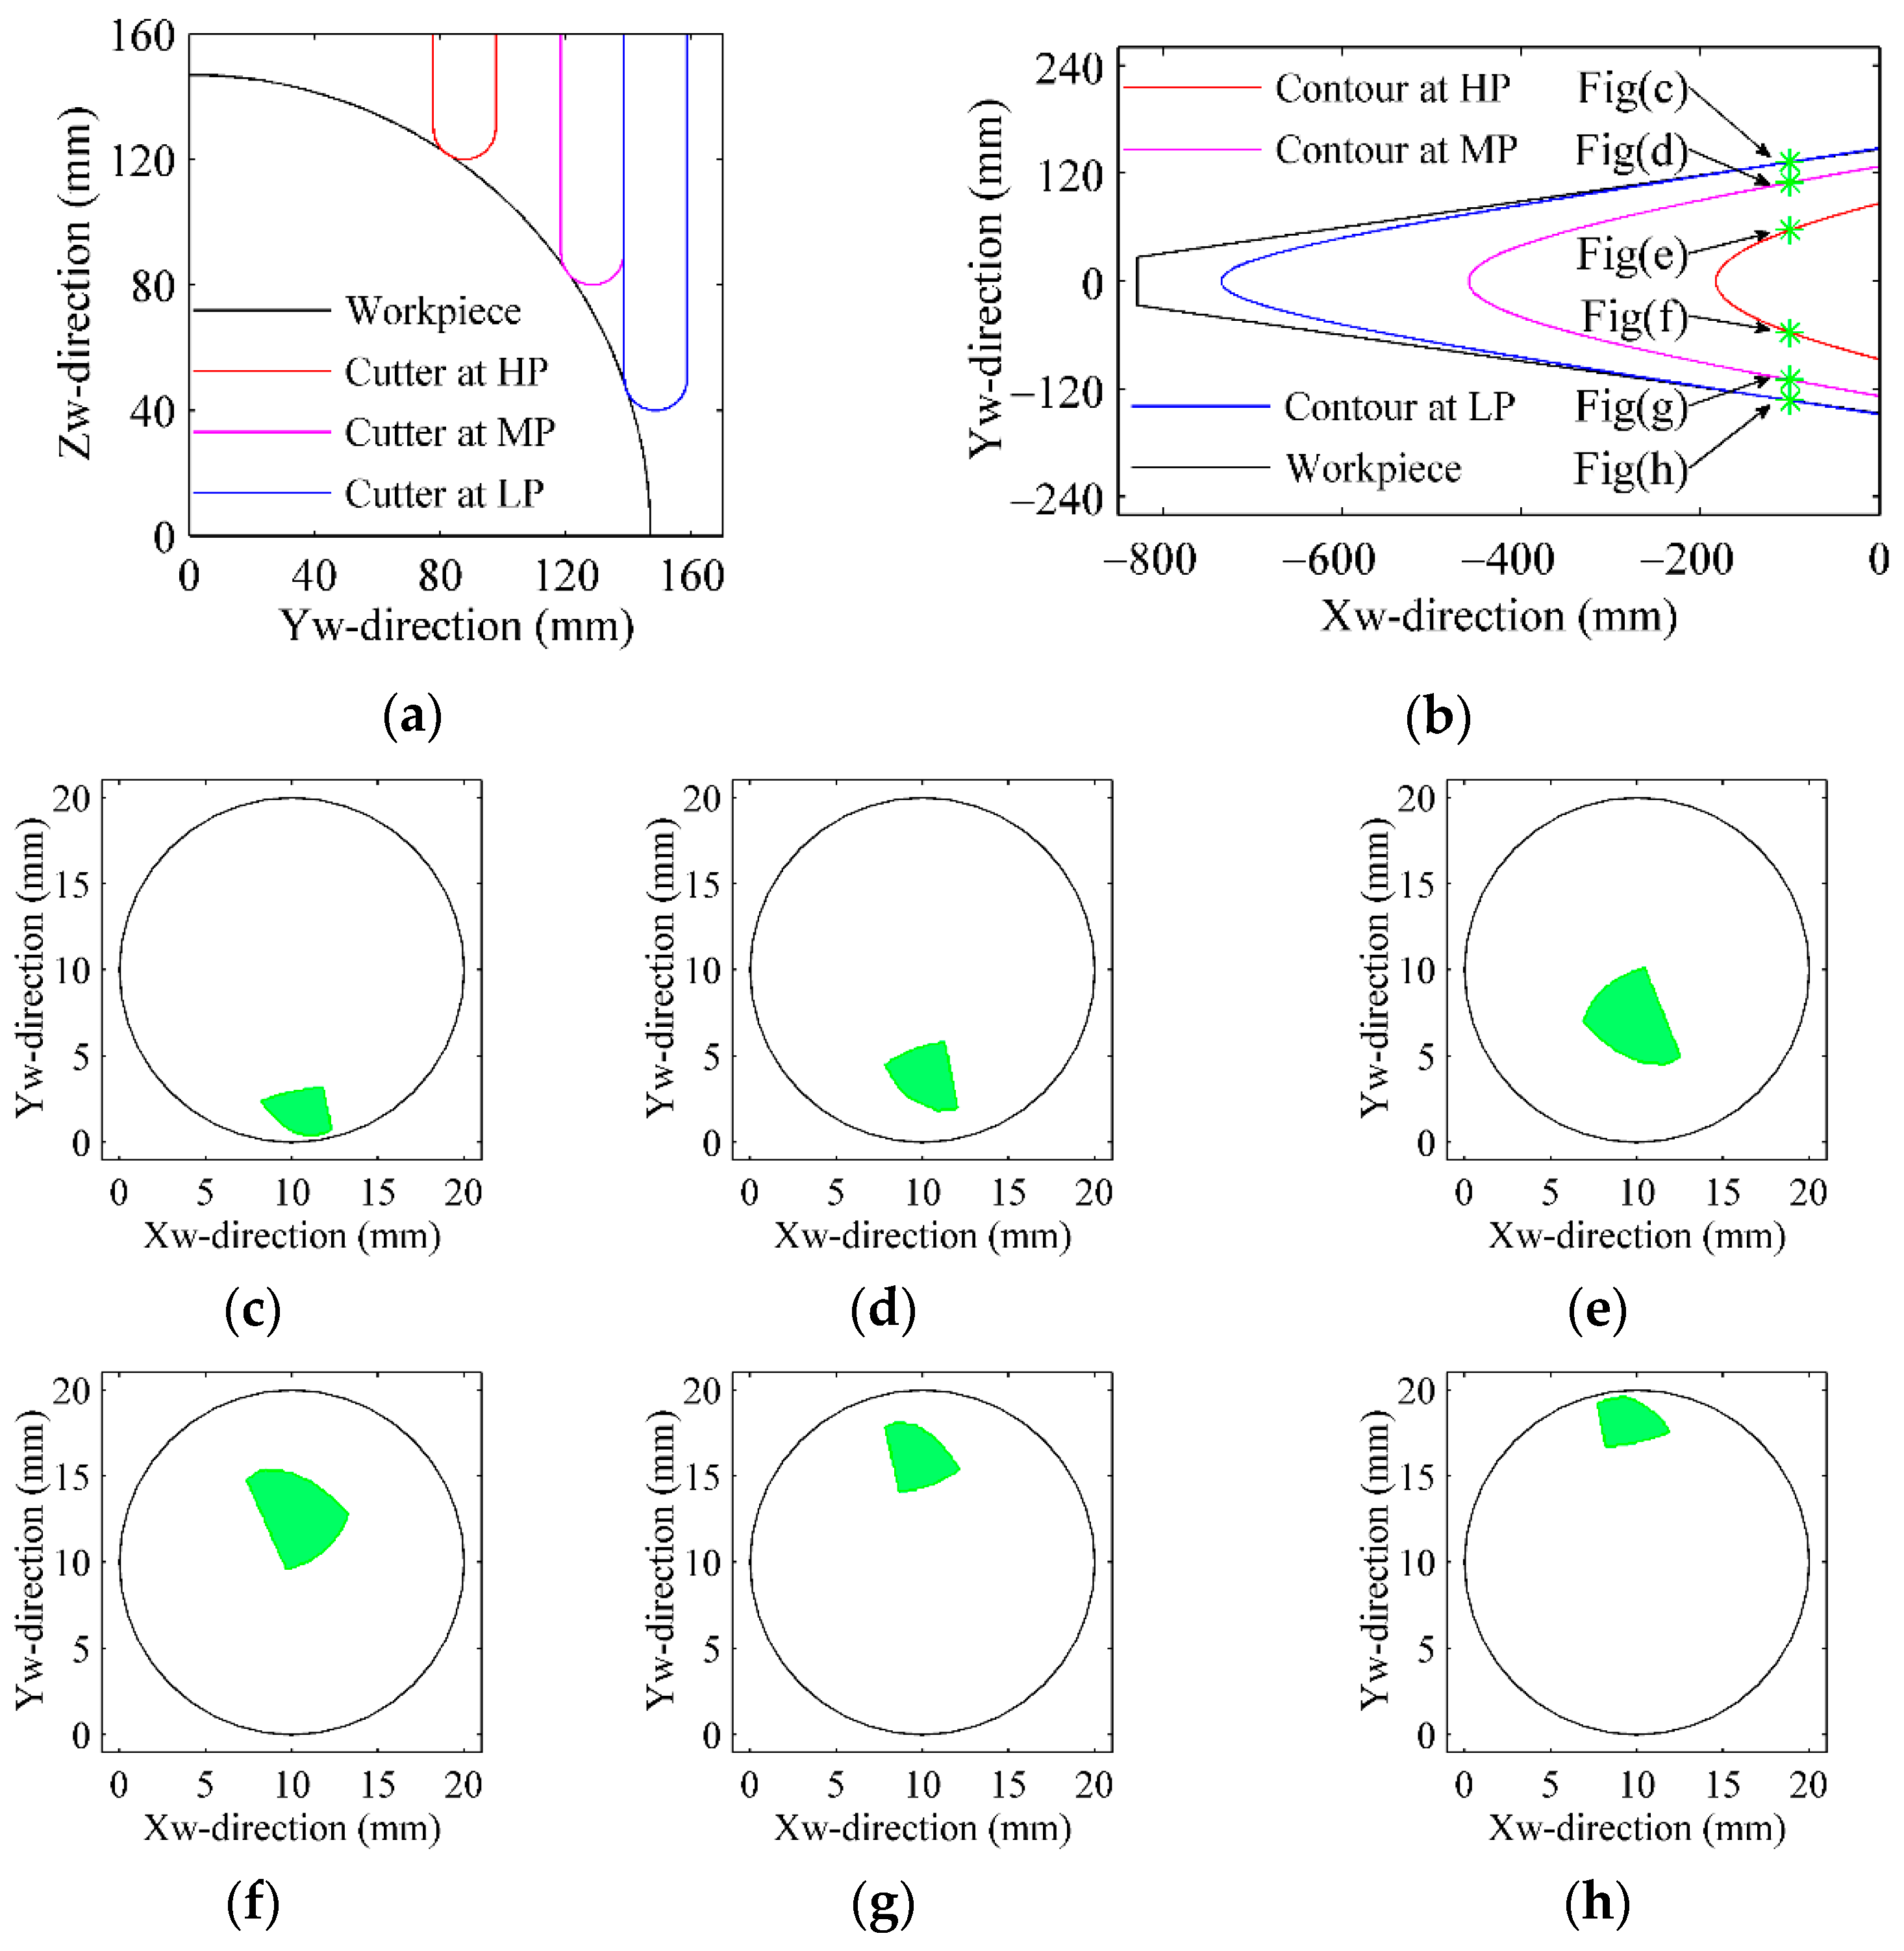
It must be pointed out that each contour tool path is established based on the principle that the depth of cut is 0.2 mm constantly in the sphere radius direction of the ball head cutter on the Yw-Zw plane of the cutter–workpiece contact point. On the Yw-Zw plane, the area of intersection between cutter and workpiece is constant no matter the height of the contour position, as shown in Figure 4a. This can be verified by a simple mathematical differential calculation. Furthermore, this can indicate that the resultant force from the contour at lower height should be larger than that at the high position because the actual cutting linear velocity is different due to the same spindle speed and different actual radius. However, it is not accurate to determine the cutting force within the two-dimensional (2D) cross-section, especially for a machining process with complex geometry contact areas between the cutter and workpiece. It is necessary to determine the contact area at each cut segment, and the distance between two adjacent segments is feed per tooth along the tool path in the calculation process. With the use of the improved Z-map method, the contact area is expressed by a 2D logical square array where the contacting elements are expressed as “1” and others are expressed as “0”. The logical calculation is used to simplify the calculation process and improve computational efficiency. Six different positions from the contour tool paths are chosen to show the simulated contact area, as shown in Figure 4b, and the results are shown in Figure 4c–h. For the sake of comparison, the obtained contact areas shown in Figure 4c–h are located at the same position −100 mm of the Xw-axis. The black circle is regarded as the projection of the cutter in the Zw-direction, and the green-filled area is the contact area between the cutter and workpiece. It can be observed that the area of the contact area is decreasing gradually with the height reduction of the contour position. It can also be observed that the contact area is situated close to the tool center at the beginning of the whole milling process, and it is moving away from the tool center with the height reduction of the contour position. The symmetry of the workpiece and contour tool path can also be reflected in the results of the contact areas.
With the obtained results of the feed turning angle and cutter–workpiece contact area, the cutting force can be calculated with the elemental mechanical cutting force model [40]. In that model, the cutting force is a linear function of the uncut chip thickness area, which can be represented with Equation (1).
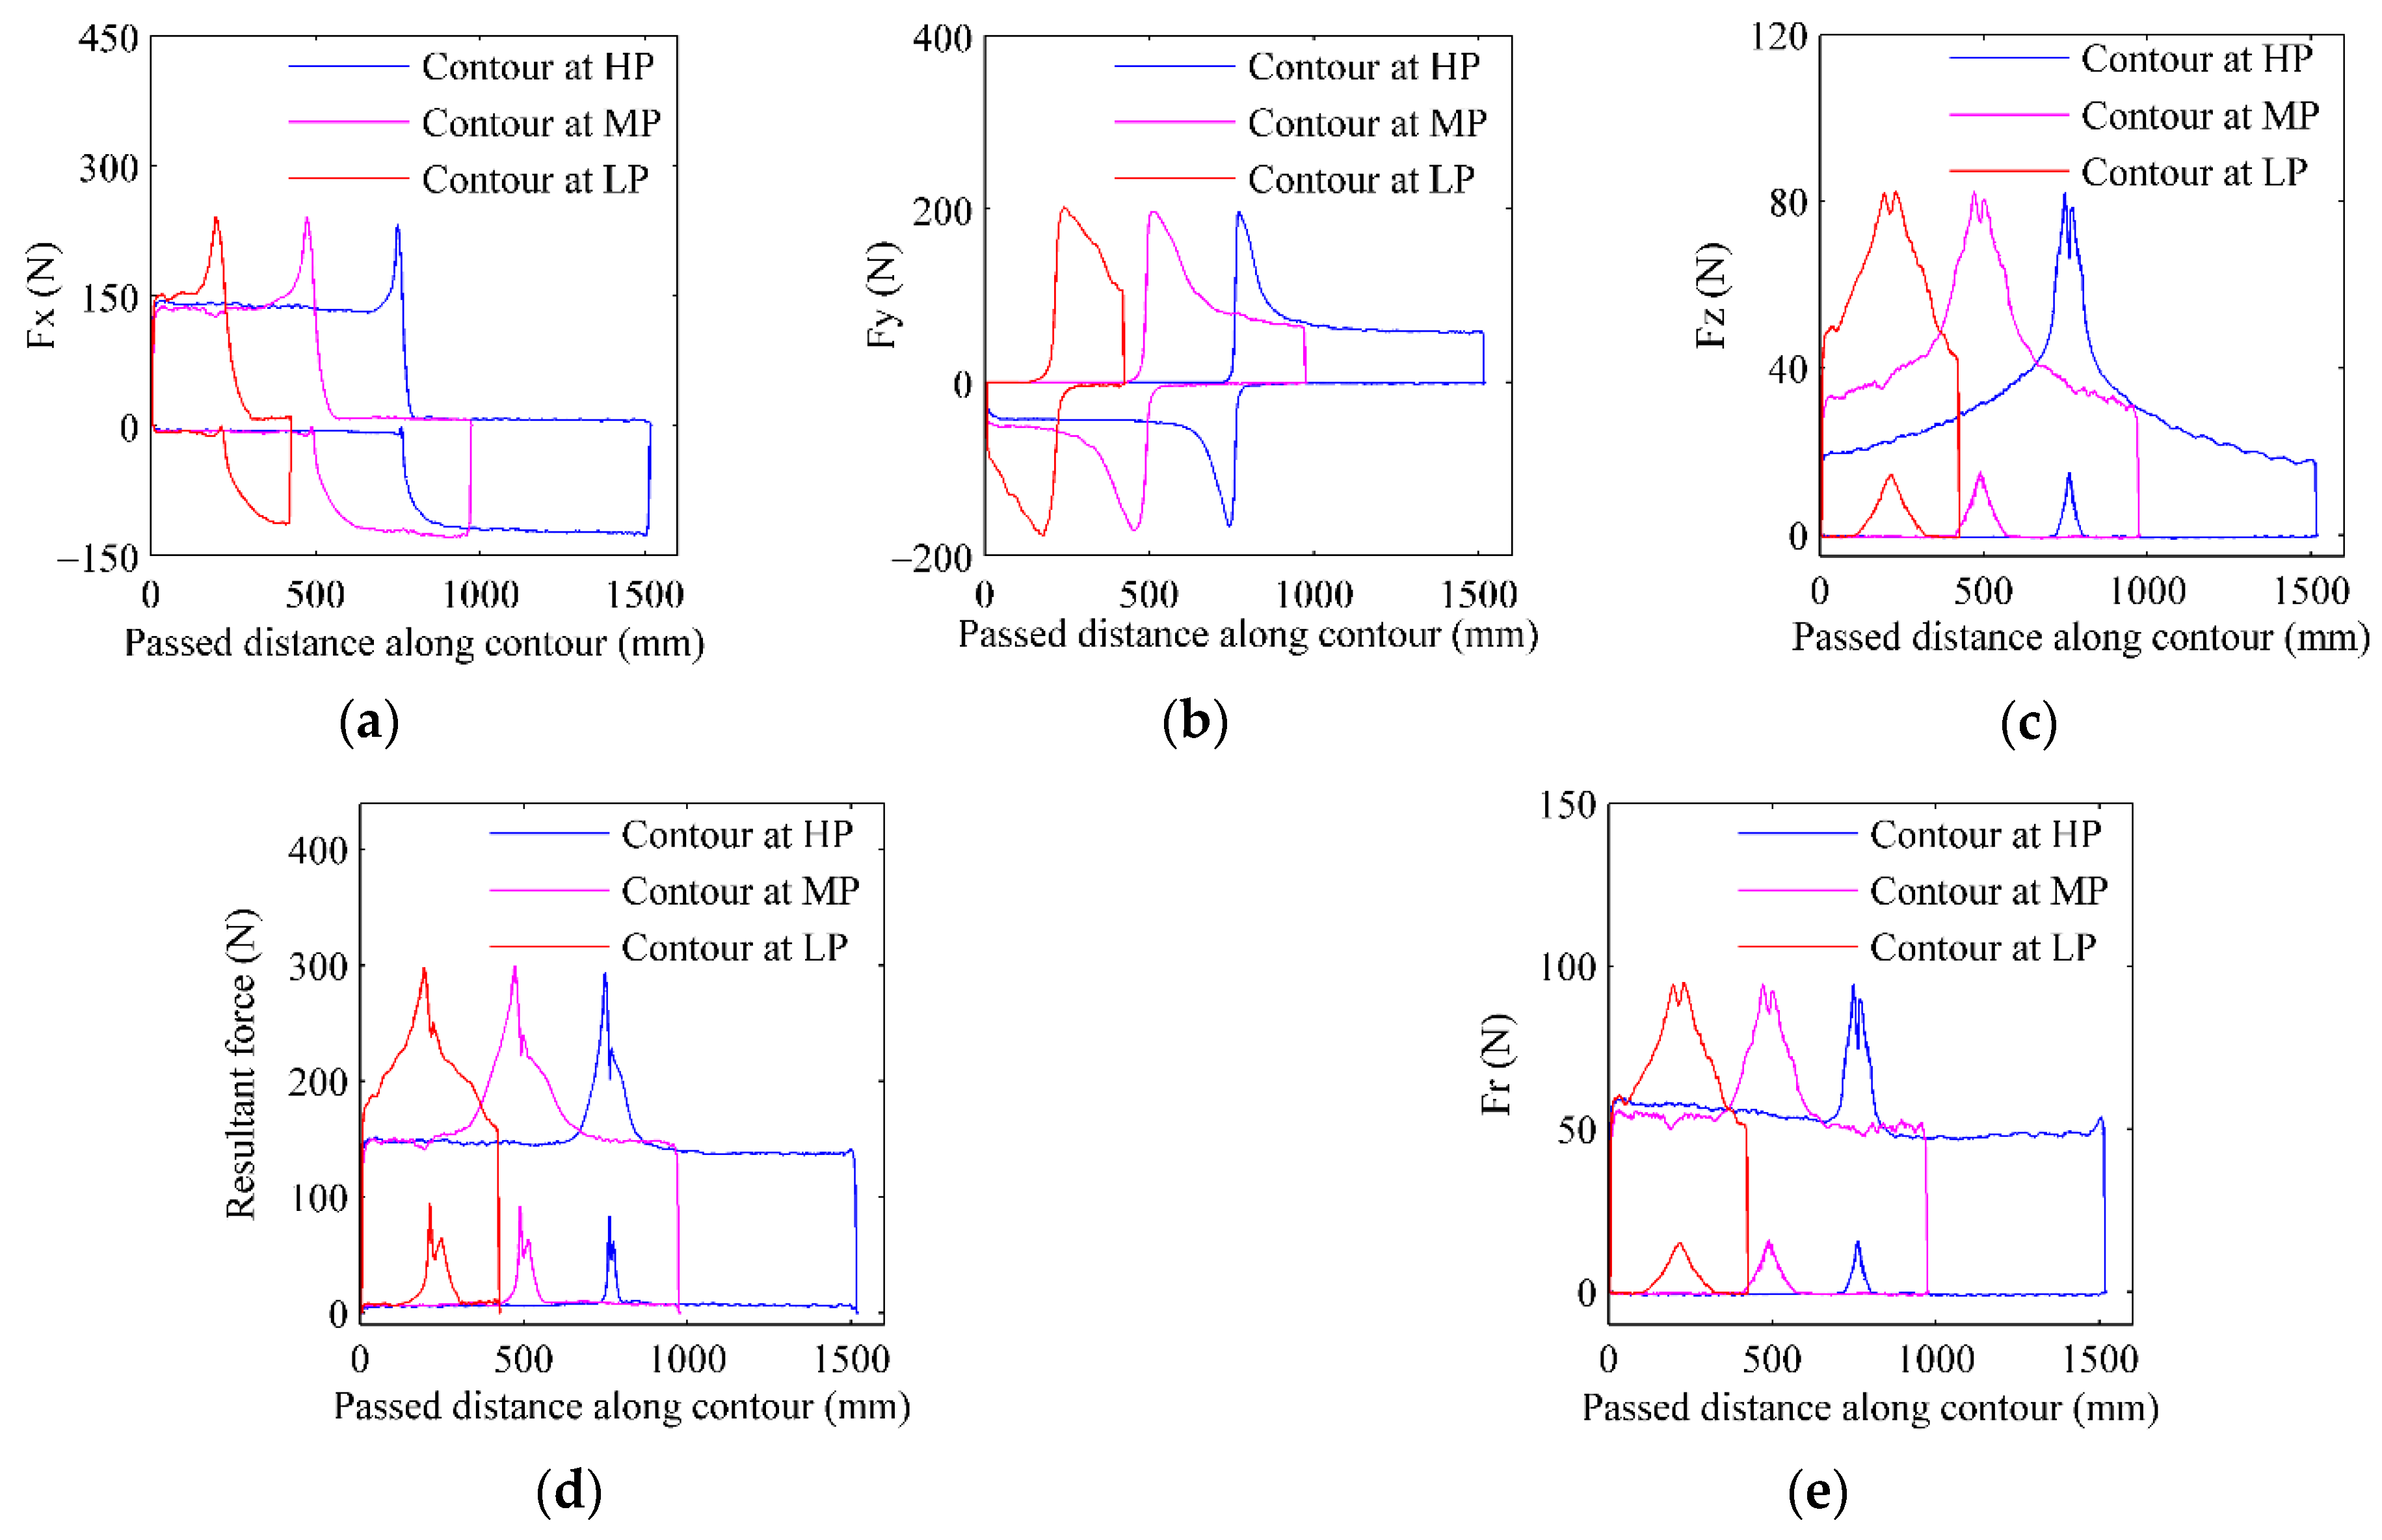
where dFi represents dFt, dFr and dFa that are instantaneous forces in tangential, radial and axial directions as shown in Figure 2d. Kic and Kie stand for Ktc, Krc, Kac, Kte, Kre and Kae that are cutting force components and components of edge effects in tangential, radial and axial directions, respectively. dAc and ds indicate instantaneous chip load and elemental length of the cutting edge in the axial direction. Different from the common flat head endmill cutter, the cutting coefficients are not constant along the cutting edge of the ball head endmill cutter because of the changes of local diameter and local helix angle in the spherical part of the cutter. In order to conduct this issue, Layegh et al. [42] proposed a new identification method for ball-end milling and compared the different results obtained from the proposed model, common model and experimental results. It can be observed that the results from three methods share the same force trend, whereas a larger force is obtained by the common model. Considering the force trend is the same, and a larger force can be limited by a larger force threshold, cutting coefficients shown in Table 2 are chosen from reference book [43], which are obtained from calibration experiments with the same material of the workpiece and cutter. In order to improve the computational efficiency, only the maximum and minimum cutting force of each segmented cuts are preserved and shown since only the most critical situations matter. The simulated component cutting force from different directions and the resultant cutting force from three different contour paths are shown in Figure 5. Furthermore, the thickness direction of the semi-conical shell workpiece is the most flexible direction corresponding to the sphere radius direction of the cutter, as shown in Figure 2d. Hence, the radial cutting force of the cutter is given in Figure 5e, which will be useful in the next section.
dFi = KicdAc + Kieds
From Figure 5, it can be observed that the cutting force is stable at the beginning and the end of the contour path, whereas the large value and complex variation of the cutting force occurred at the middle of each contour path. This can be explained by the relationship between the adjacent contour paths, which are distributed sparsely at the middle of the contour path, as shown in Figure 2b. There will be a slot milling phenomenon at the same position, which can be seen in Figure 4e–f. The maximums of the cutting force from different heights are almost the same, and the cutting force from the high position can be regarded as the middle part of the cutting force from the low position. Considering the maximum force that occurred at the middle of the contour path, the low feed rate should be used at the same position, and the high feed rate should be used at the rest of the contour path conventionally. However, an opposite strategy will be used considering the semi-conical shell workpiece, which will be discussed in the following sections.
2.2. Dynamic Performance of Workpiece and Stability Prediction of Cutting System
The dynamic performance of the workpiece is often obtained by the analytical method and FEM. FEM is very convenient and common, but its results are limited to the mesh resolution. The analytical method is often calculated with Newton’s theorem of motion and the Lagrange method. Considering the semi-conical shell workpiece is a kind of the thin-wall shell structure, the calculation of the dynamic performance based on the theory of shells can be adopted. The spectro-geometric-Ritz method (SGM) proposed by Shi et al. [31] is an effective method to conduct transverse vibration analysis of plates and shells with arbitrary elastic supports. With the trigonometric series expansion and Rayleigh–Ritz technique, their method could be generally applied to a wide scope of the boundary conditions, which can be used in this paper.
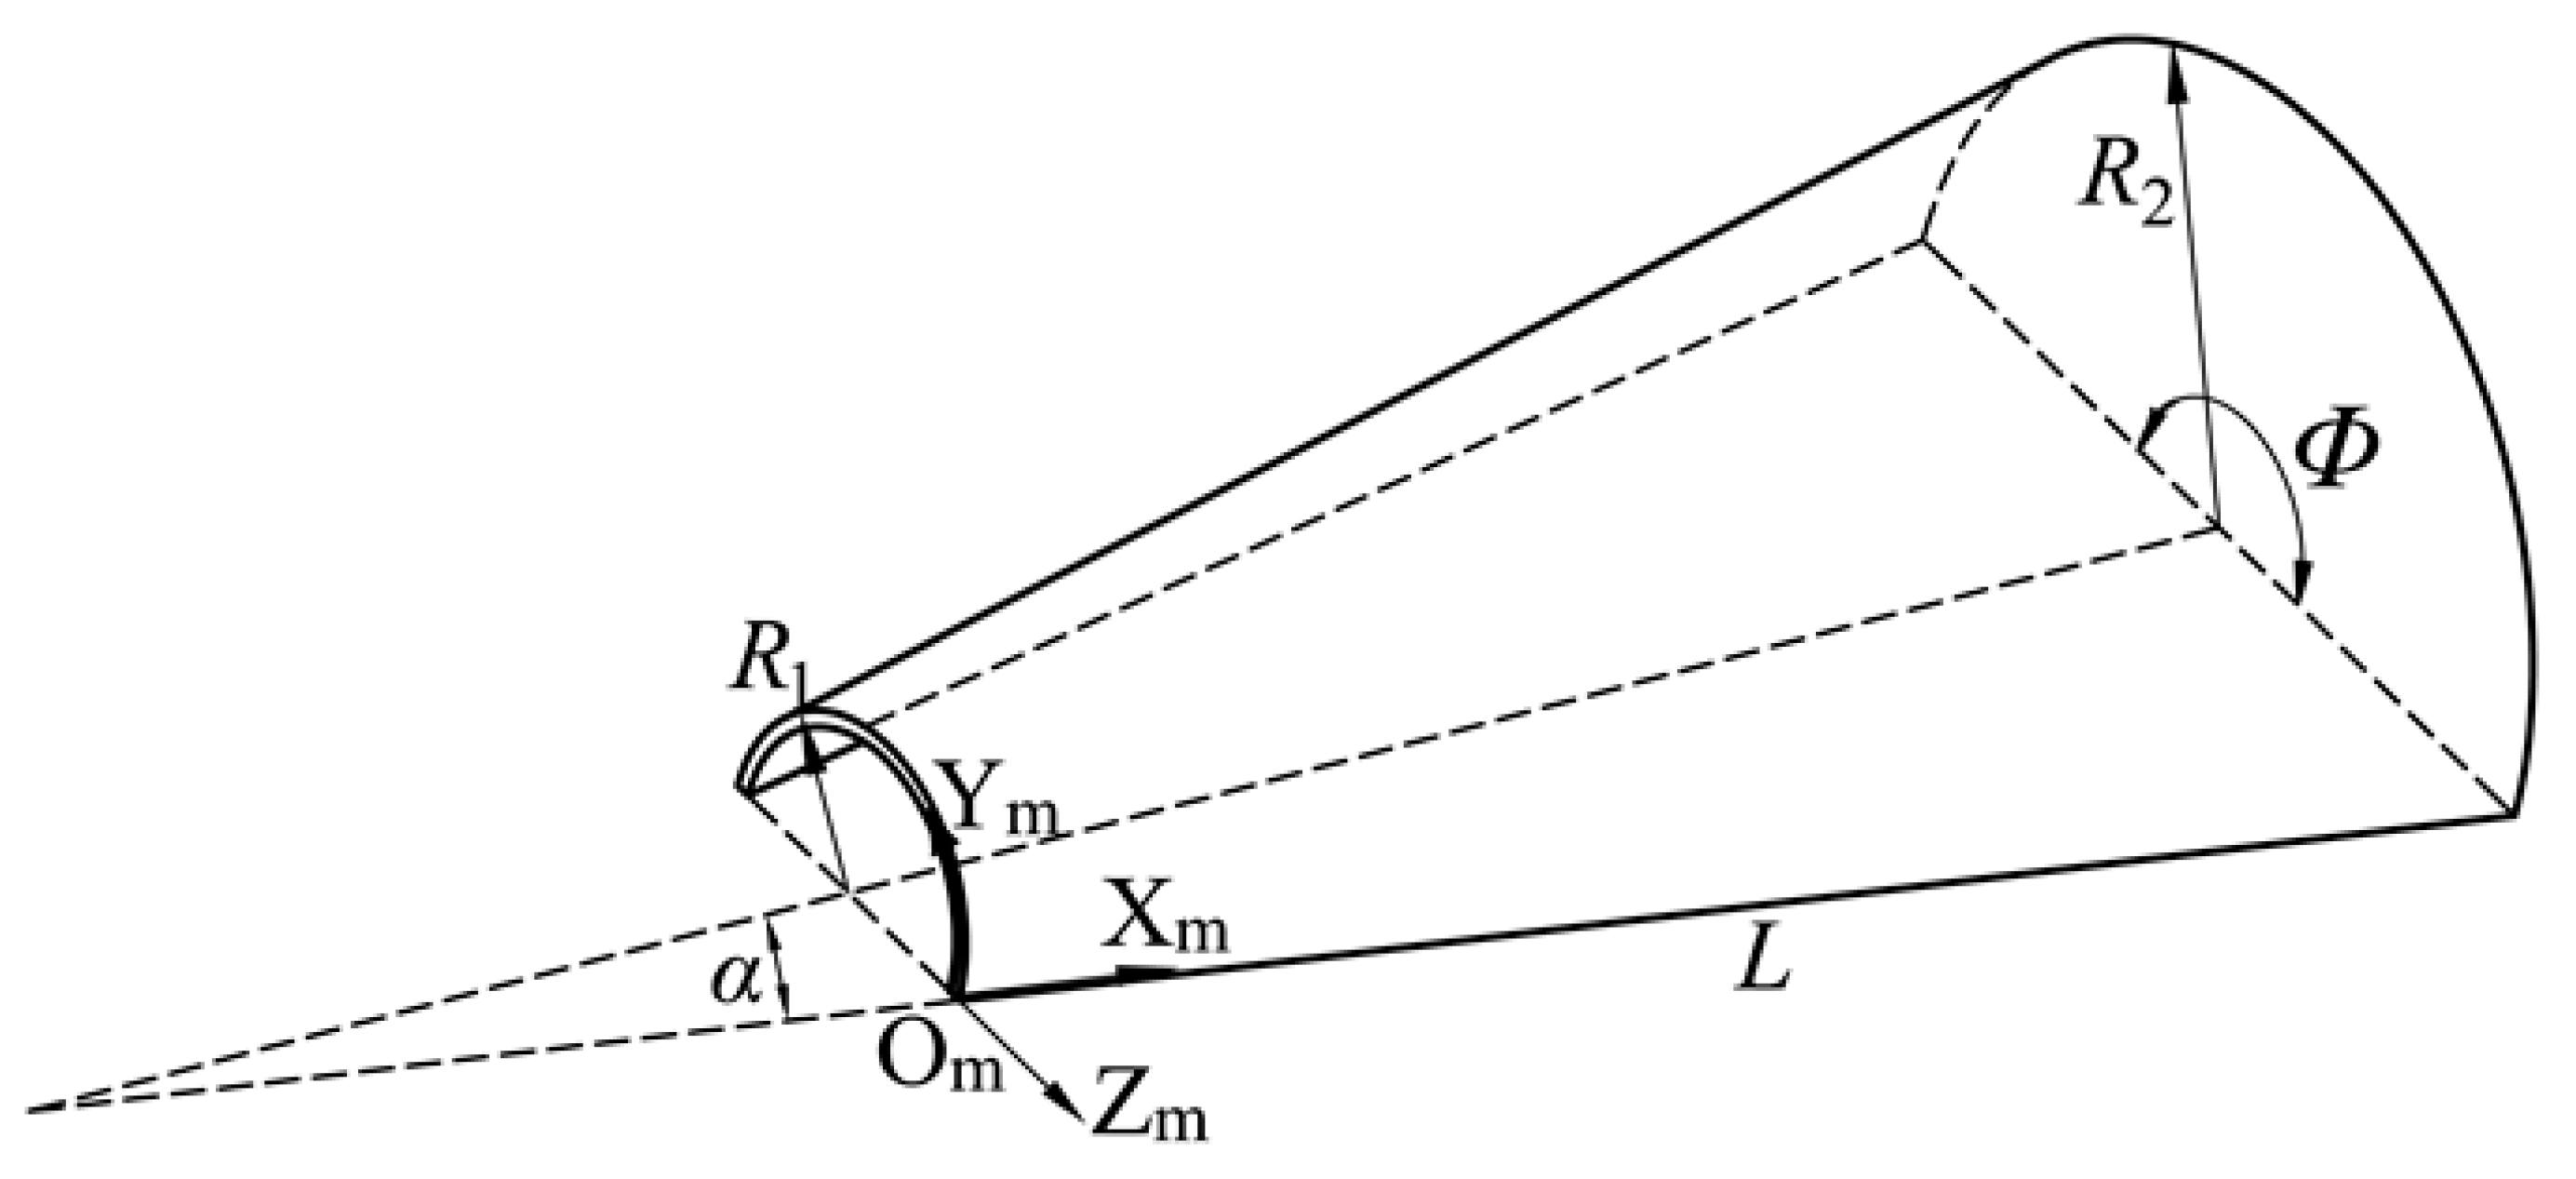
With the use of SGM, the semi-conical shell workpiece under consideration is regarded as a kind of rotating shell with longitude, latitude and uniform thickness, as shown in Figure 6. The middle plane of the shell where an orthogonal coordinate Om-XmYmZm is situated is taken as the reference plane. The Xm-direction represents the displacement in the longitude direction, which ranges from 0 to L, the Ym-direction represents the angle between the normal of a point on the latitude, and the rotation axis, which ranges from 0 to Φ and the Zm-direction represents the position in the thickness direction, which ranges from–h/2 to h/2. In the calculation process, the vibration displacement of the semi-conical shell in the Xm, Ym and Zm directions are represented by u, v and w, respectively and their corresponding admissible displacement functions are proposed in a trigonometric series form as shown in Equation (2).
where Um,n, Vm,n and Wm,n are the expansion coefficients for the semi-conical shell, and they can be solved by the Rayleigh–Ritz procedure. The coefficients m and n are limited by the truncated coefficients M and N, which are set as 15 to achieve a good balance between calculation efficiency and accuracy in the calculation process. xm and ym represent the position coordinates in the Xm and Ym directions of the Om-XmYmZm coordinate system. φm(xm) and φn(ym) are trigonometric functions which can be given as:
where λam = mπ/L and λbn = nπ/Φ.
The boundary conditions of the semi-conical workpiece are set based on the practical condition shown in Figure 2a. The workpiece is fixed on three separate fixtures with HY-194 epoxy adhesive, and all three fixtures are mounted on the worktable of the machine-center with T-shaped bolts, which will affect the stiffness distribution of the workpiece. In the calculation process, the spring stiffness of the clamped boundary is set as 1 × 10⁸ N m−1, and the free boundary is set as 0 N m−1. It should be pointed out that two straight boundaries located at ym = 0 and ym = Φ are clamped partially instead of totally, and two semicircle boundaries located at xm = 0 and xm = L are free. The potential energy of the boundary constraints can then be calculated based on the boundary conditions and the theory of shells.
The total energy function of the semi-conical shell is taken as the sum of energy contributions from the shell, which is composed of the strain energy U, kinetic energy T and potential energy of the boundary constraints Ub. Thus, the Lagrangian energy function of the semi-conical shell can be expressed as:
Substituting the admissible displacement functions from Equation (2) into Equation (5), with the use of Rayleigh–Ritz method, the Lagrangian expression can be minimized by taking its derivative with respect to these expansion coefficients
Considering the truncated coefficients are represented as M and N, a total of (M + 5) × (N + 5) + 2 × (M + 3) × (N + 3) equations are obtained.
By substituting Equation (5) into Equation (6), it can be summed up in a matrix form as follows:
where k and m denote the stiffness matrix and mass matrix, respectively. Based on the orthogonality of the modal vectors, the modal stiffness and mass of the i th modal shape can be obtained by:
where Ki and Mi denote the modal stiffness and mass of the i th modal shape, respectively. Ei denotes the i th column of the eigenmatrix E. By solving a standard matrix eigenvalue problem, the natural frequencies can be obtained, as shown in Table 3. The natural frequencies obtained with the use of FEM and experimental modal analysis (EMA) are also shown in Table 3 for better comparison. It can be observed that the results obtained by SGM are superior to FEM, and they are very close to the results of the EMA. Considering the vibration energy often distributes in the range of low frequency, and the frequency of the cutting force is 120 Hz, which is known as the tooth pass frequency, only the first three modes are considered in the following calculation.
For further calculation, the i th modal shape function in the thickness Zm-direction of the semi-conical workpiece is normalized as:
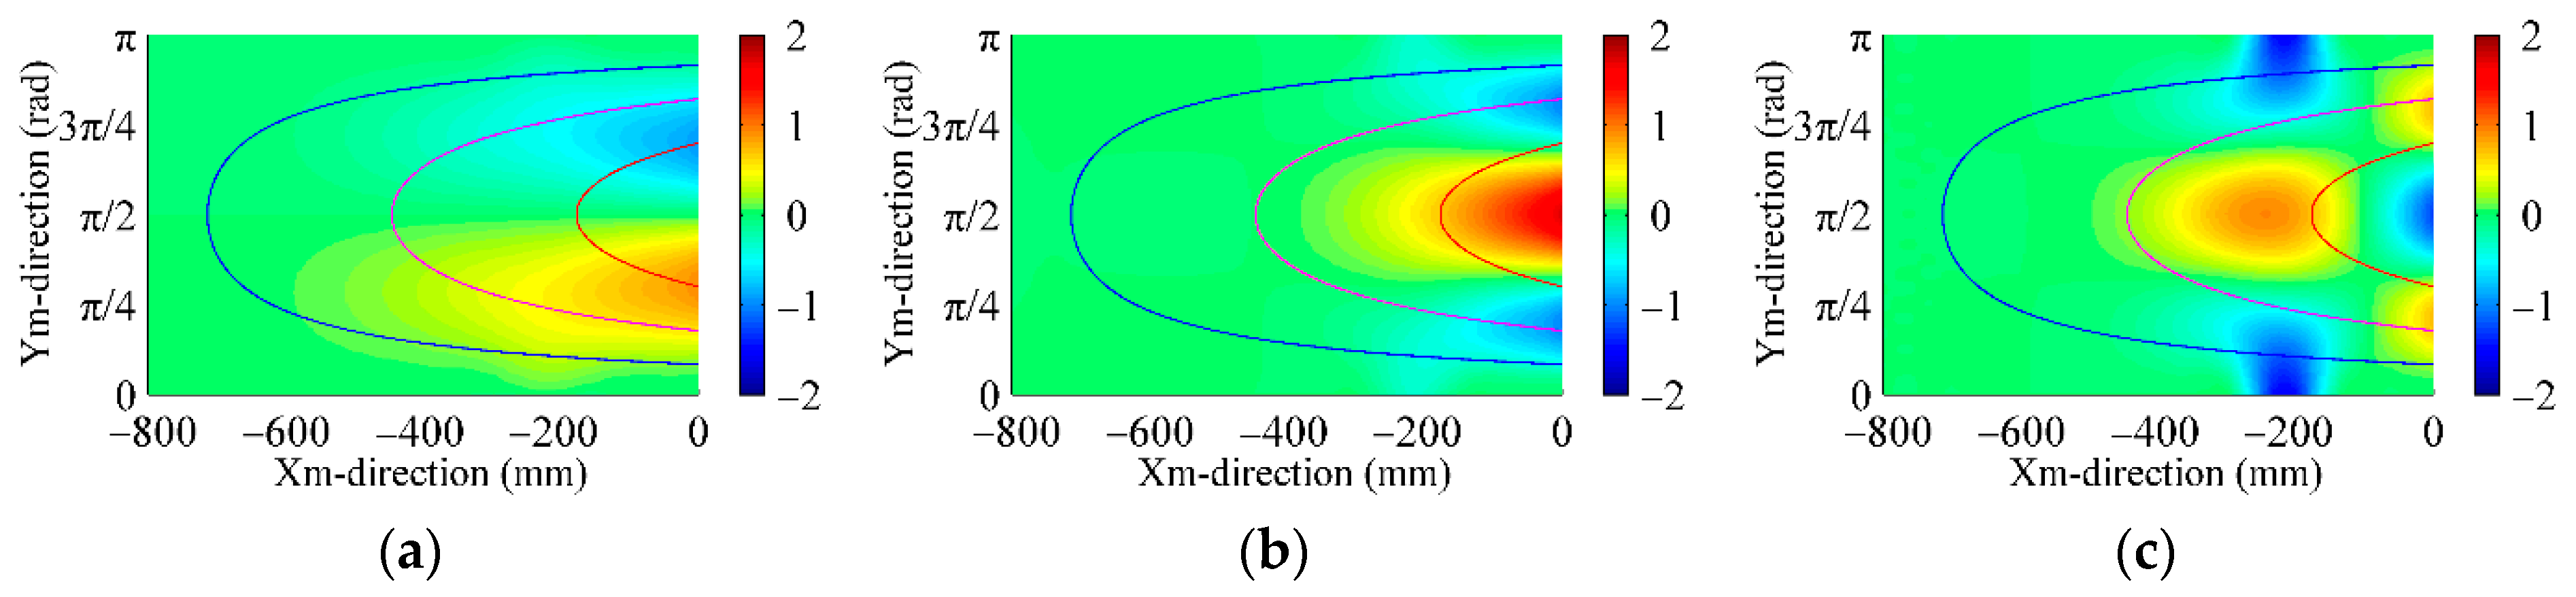
where wnor,i denotes the i th normalized modal shape displacement function in the thickness Zm-direction of the workpiece. Wm,n,i is the expansion coefficient of the i th modal shape. Ultimately, the first three modal shapes in the Zm-direction can be obtained, as shown in Figure 7.
From Figure 7, it can be found that with the increase of the modal sequence, the modal shapes are getting more complex. Since the radius on the right side of the workpiece is larger than the left side, the vibration on the right side is more intense and complicated. In the same figure, three chosen contour paths from different heights are plotted for easy understanding and comparison. It can be observed that the contour path at the HP is mainly affected by the first modal at the beginning and the end of the path. The contour path at the MP is mainly affected by the second and third modal at the beginning and the end of the path. The contour path at the LP is mainly affected by the third modal near the −200 mm of Xm-direction along the contour path.
With the use of the modeling method proposed by Wang et al. [44], the frequency response function (FRF) of the semi-conical workpiece at any point (x, y) in Zm-direction with the dynamic force-excited position (xF, yF) can be expressed as H(ω, x, y):
where mnum denotes the number of modals been considered, ξi and ωi are the i th modal damping ratio and natural frequency, respectively.
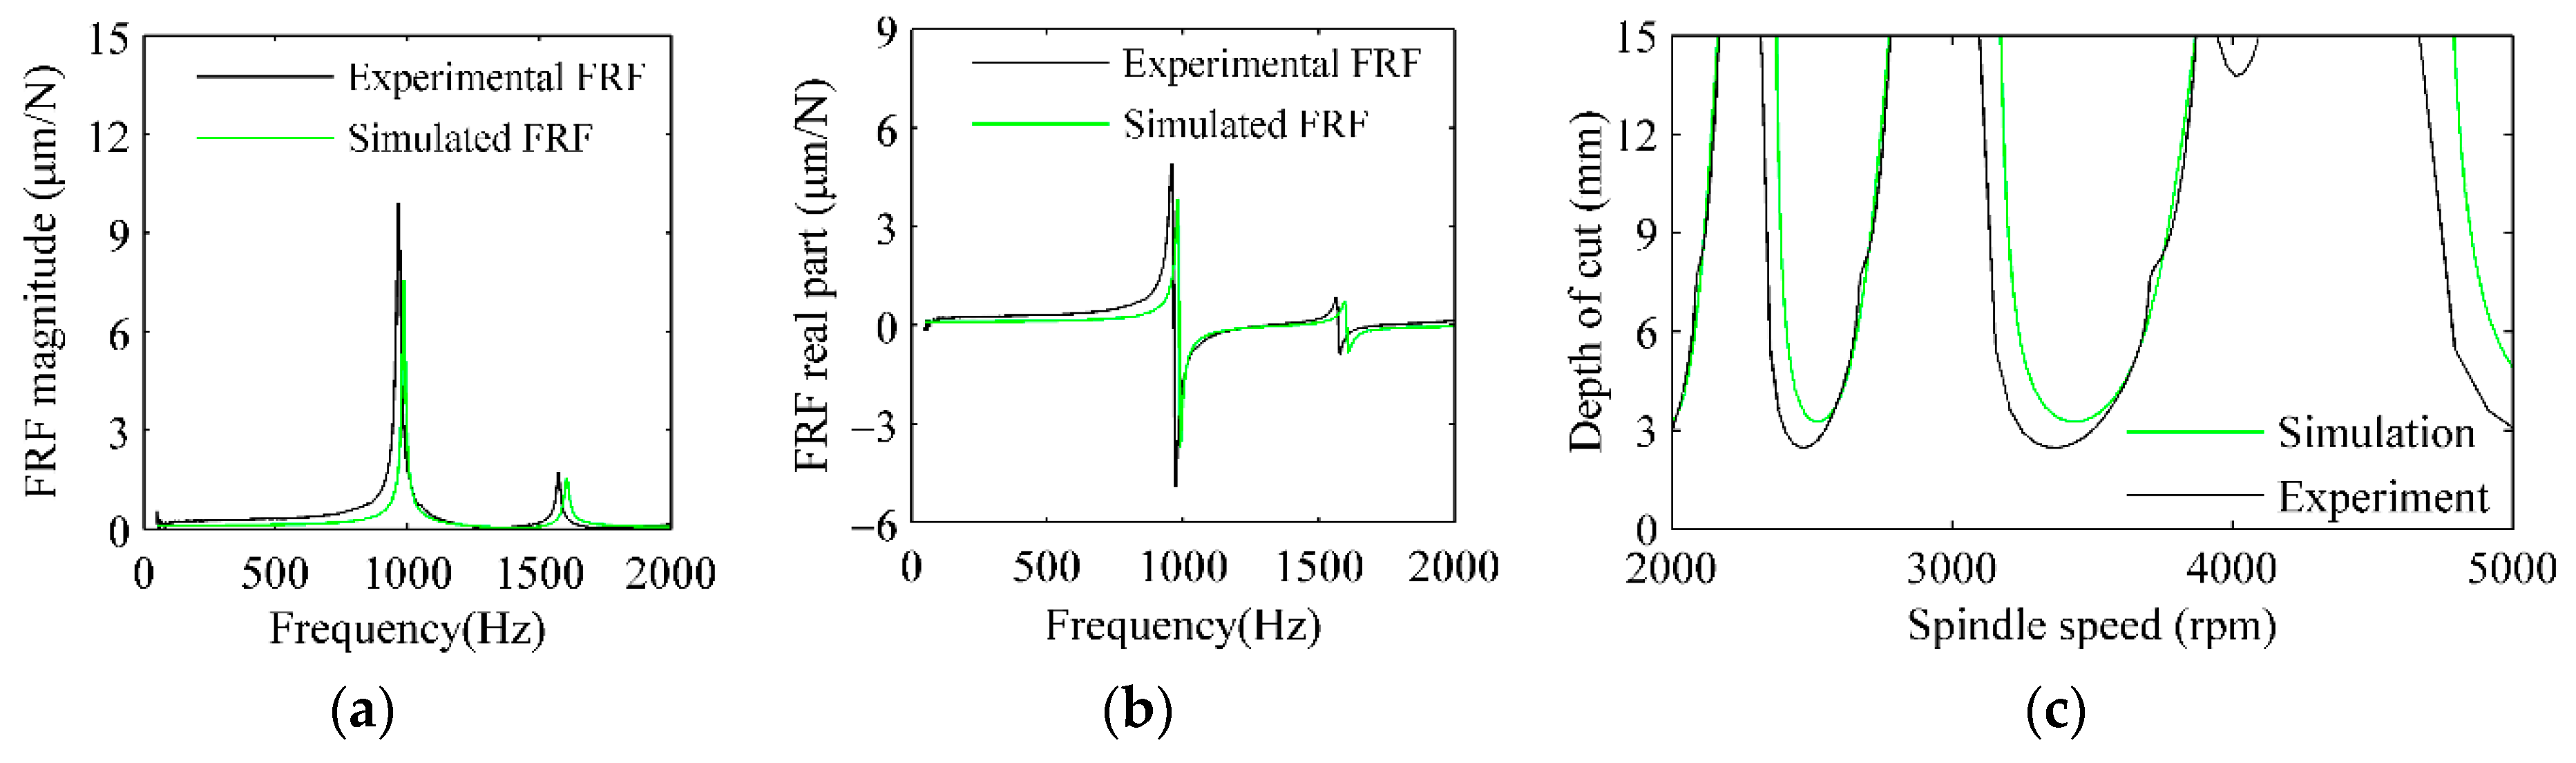
With the use of Equation (11), the magnitude and real part of the simulated FRF are shown in Figure 8, in which the force excited position and response position are at the same position (0, π/2). The first three modes are considered, and the modal damping ratio of each mode is set as 0.01. The results of the impact tests are also shown in the same figure, and they are very close to the results of the simulation. The experimental FRF possesses a higher magnitude and a lower natural frequency, but the difference is very small. The position (0, π/2) is the node of the first mode and only the second and third modes can be observed from the FRF.
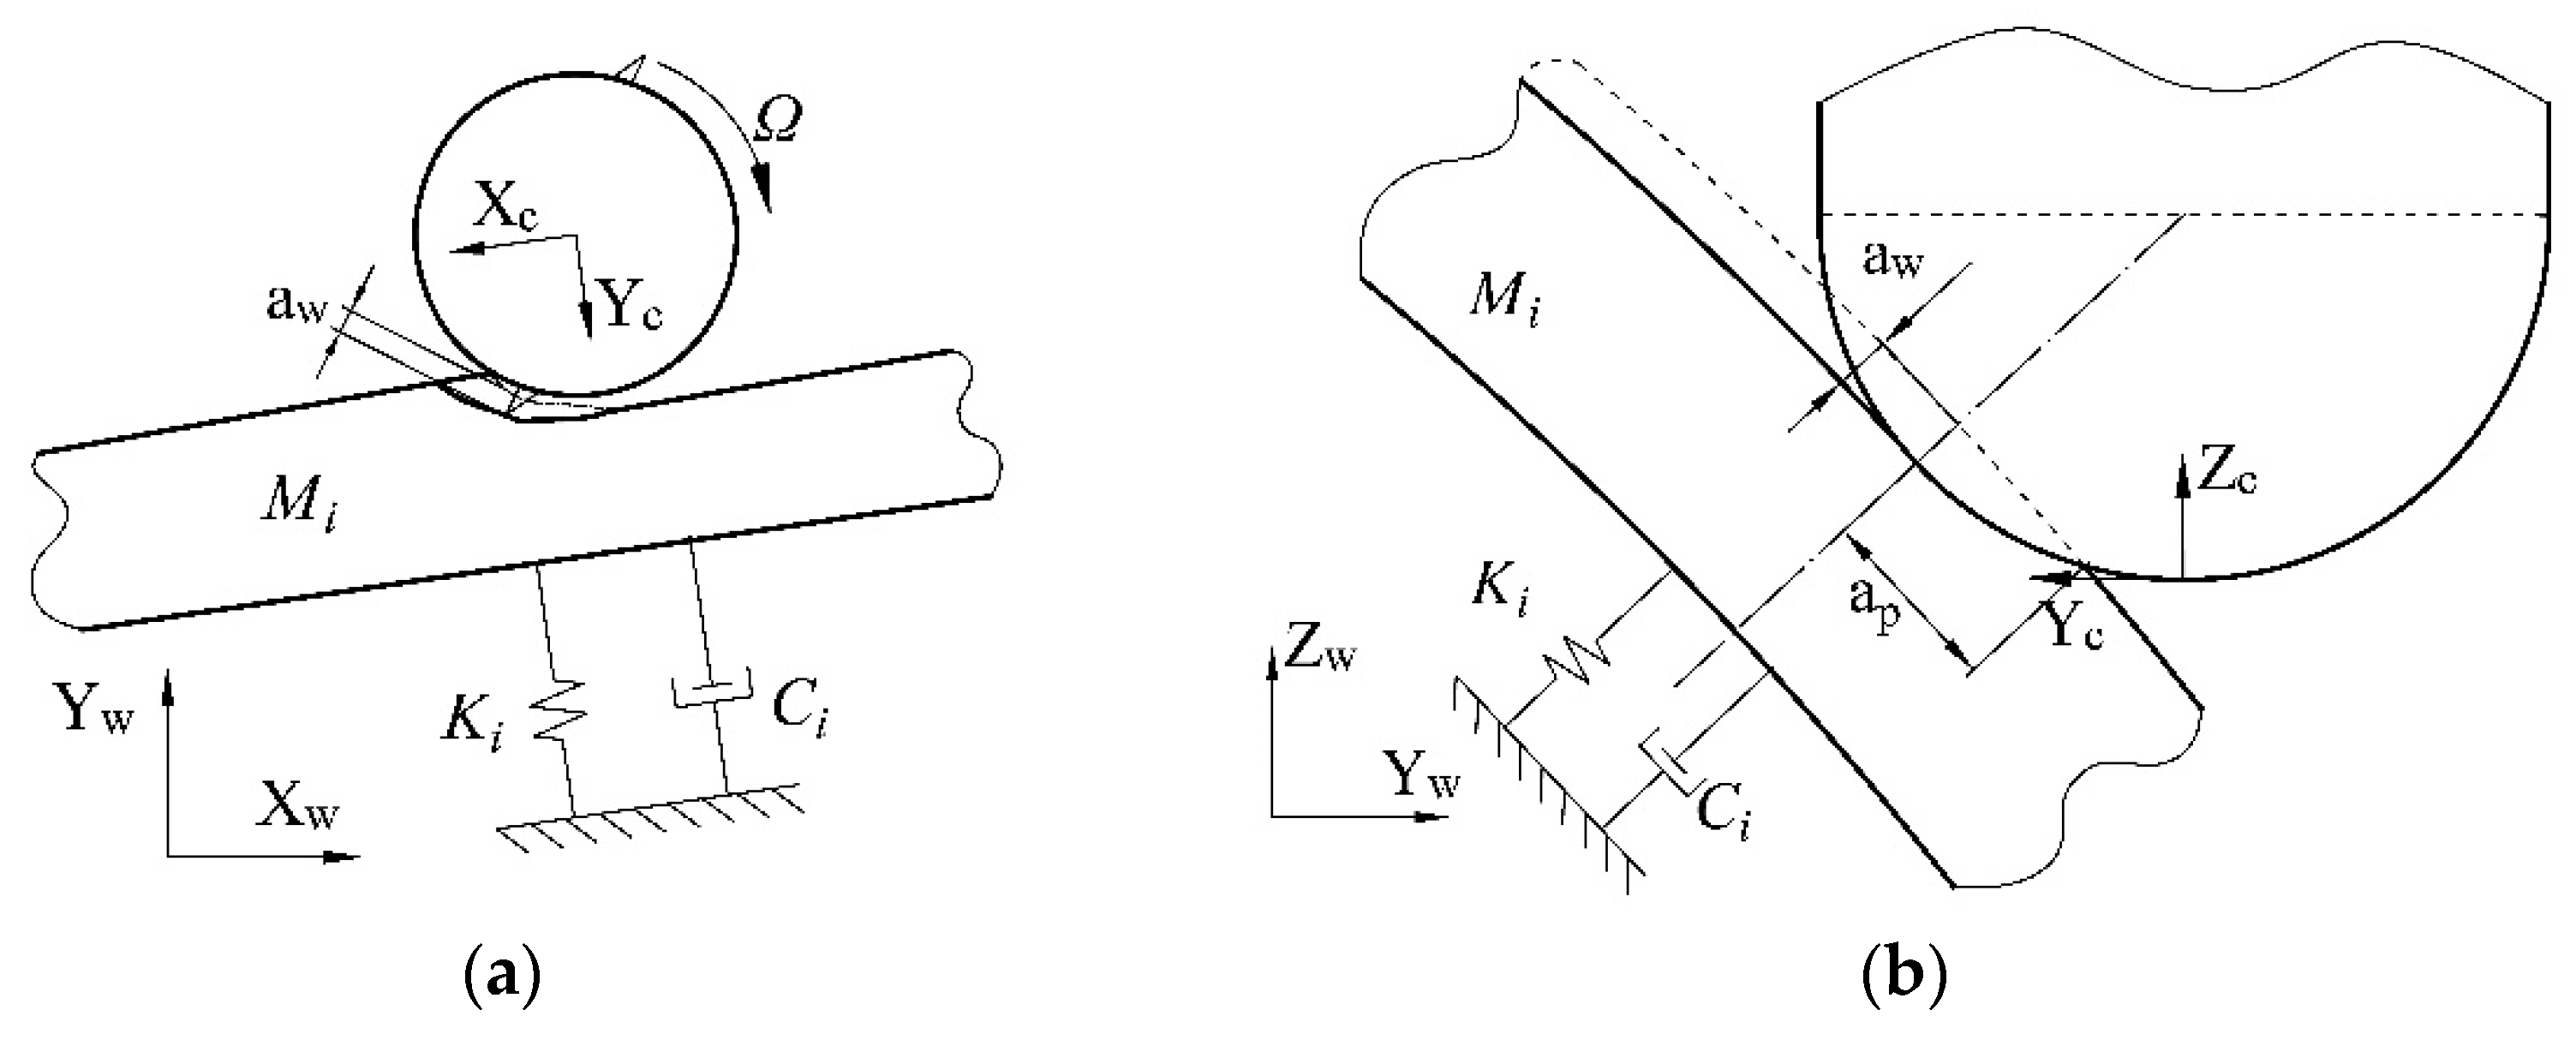
The machining instability is the severe vibration in the machining process due to the weak rigidity of the tool or workpiece, which is also known as the chatter phenomenon. The regenerative effect is the principal factor of the chatter, and the stability lobe diagram (SLD) is an important and effective tool to show the relationship between machining stability and machining parameters. Based on the Fourier series approach, the method proposed by Altintas [45,46] has been widely used in practical conditions and embedded into much commercial software. However, a more simple and convenient method based on the average tooth angle is used in this paper because only one direction of the workpiece is considered as weak rigidity, and the complex shapes of the cutting edge can be ignored. The instantaneous chip thickness aw and cutting depth ap are demonstrated in Figure 9, and the obtained SLD can guide the selection of the spindle speed Ω and cutting depth ap to achieve stable machining. In addition, the required equations to get the SLD are given as follows:
where aplim is the critical cutting depth to avoid chatter, fc is the chatter frequency, Ns is the integer number of waves of vibration imprinted on the workpiece surface in one revolution, ε is the phase between current and previous tool vibration, Ks is the cutting force coefficient in the direction of weak rigidity, which is Krc in this paper, Nt is the number of teeth on the cutter and Nt* is the average number of teeth in the cut which can be denoted as:
where ϕex and ϕst are the start and exit angle in the cut, which can be obtained from the results of the cutter–workpiece engagements.
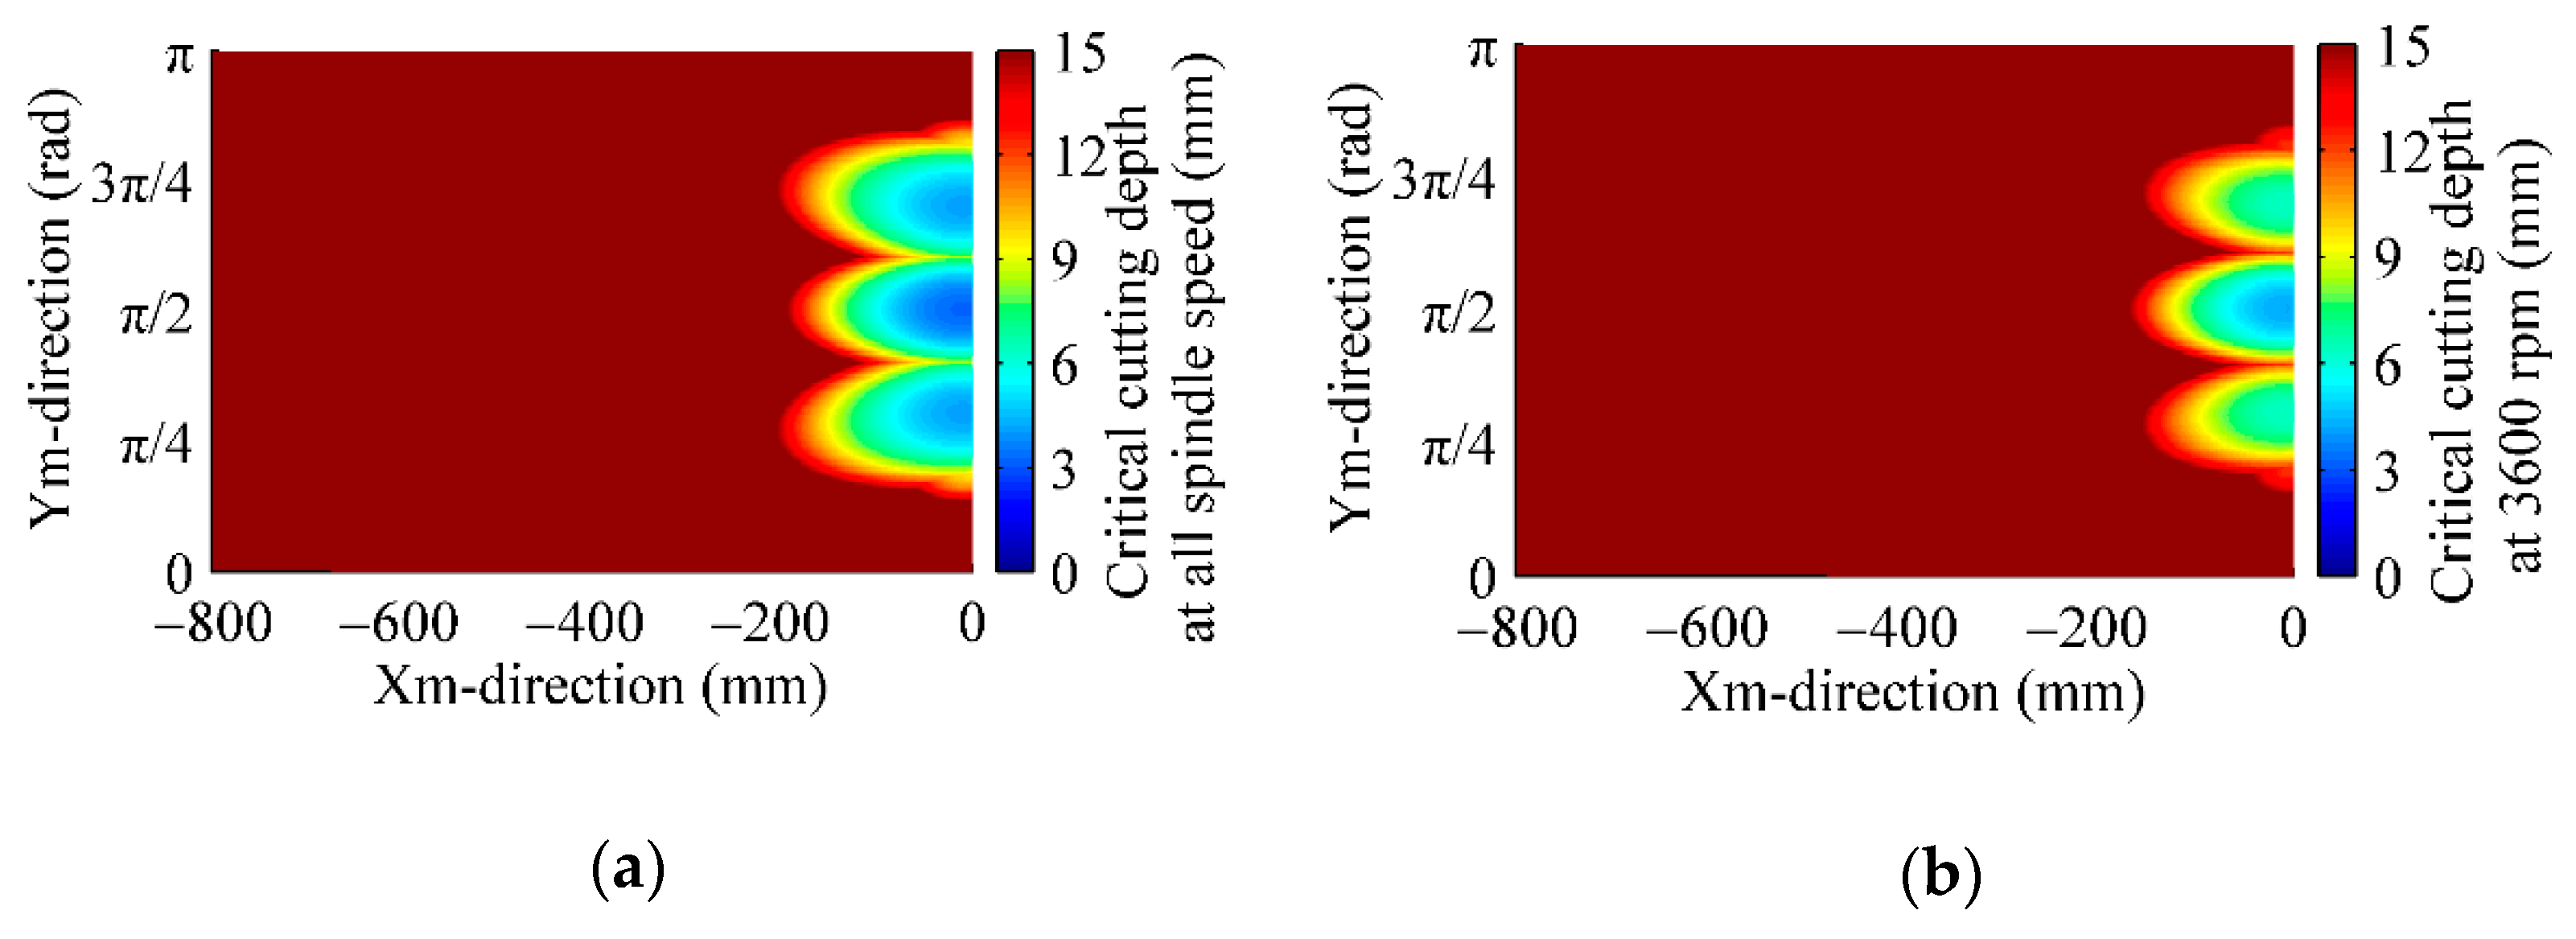
Combining the given equations and obtained FRF, the SLD from each position of the semi-conical workpiece can be obtained. As an example, the SLD for the position (0, π/2) is shown in Figure 7c. In the SLD, the curve stands for the critical depth of cut, and the area below this curve is the stable area, and it can be observed that the critical depth of cuts is different with the variation of the spindle speed. Therefore, in order to show the stability condition for each position of the workpiece, two three-dimensional (3D) SLDs are shown in Figure 10. The x-axis and y-axis of the figure are the positions in the Xm-direction and Ym-direction of the workpiece, and the different colors show the value of the critical cutting depth. The critical cutting depth can be divided into absolute critical cutting depth and relative critical cutting depth. The former means the maximum of the critical cutting depth of all spindle speeds, as shown in Figure 10a. The latter means the critical cutting depth of one certain spindle speed, and the critical cutting depth of 3600 rpm is shown in Figure 10b.
From Figure 10, it can be found that the distributions of the absolute critical cutting depth and relative critical cutting depth are almost the same, which are also in the same as stiffness distributions of the workpiece. The critical cutting depth of the area near the left and fixed boundary positions of the workpiece are very high. The minimum of the absolute critical cutting depth is 3.216 mm, which is obtained at the position (0, π/2). Therefore, the selection of the cutting depth for an area with a large radius should be more careful. The main difference between Figure 10a,b is that the distribution of area with lower critical cutting depth in Figure 10a is more than that in Figure 10b. With the same calculation as shown in Figure 4a, the maximum of the cutting depth ap used in the practical condition is 1.93 mm, which is lower than the minimum of the absolute critical cutting depth of all positions. Hence, the machining process will be stable with the current selection of the machining parameters for the whole milling process.
2.3. Vibration Response Analysis
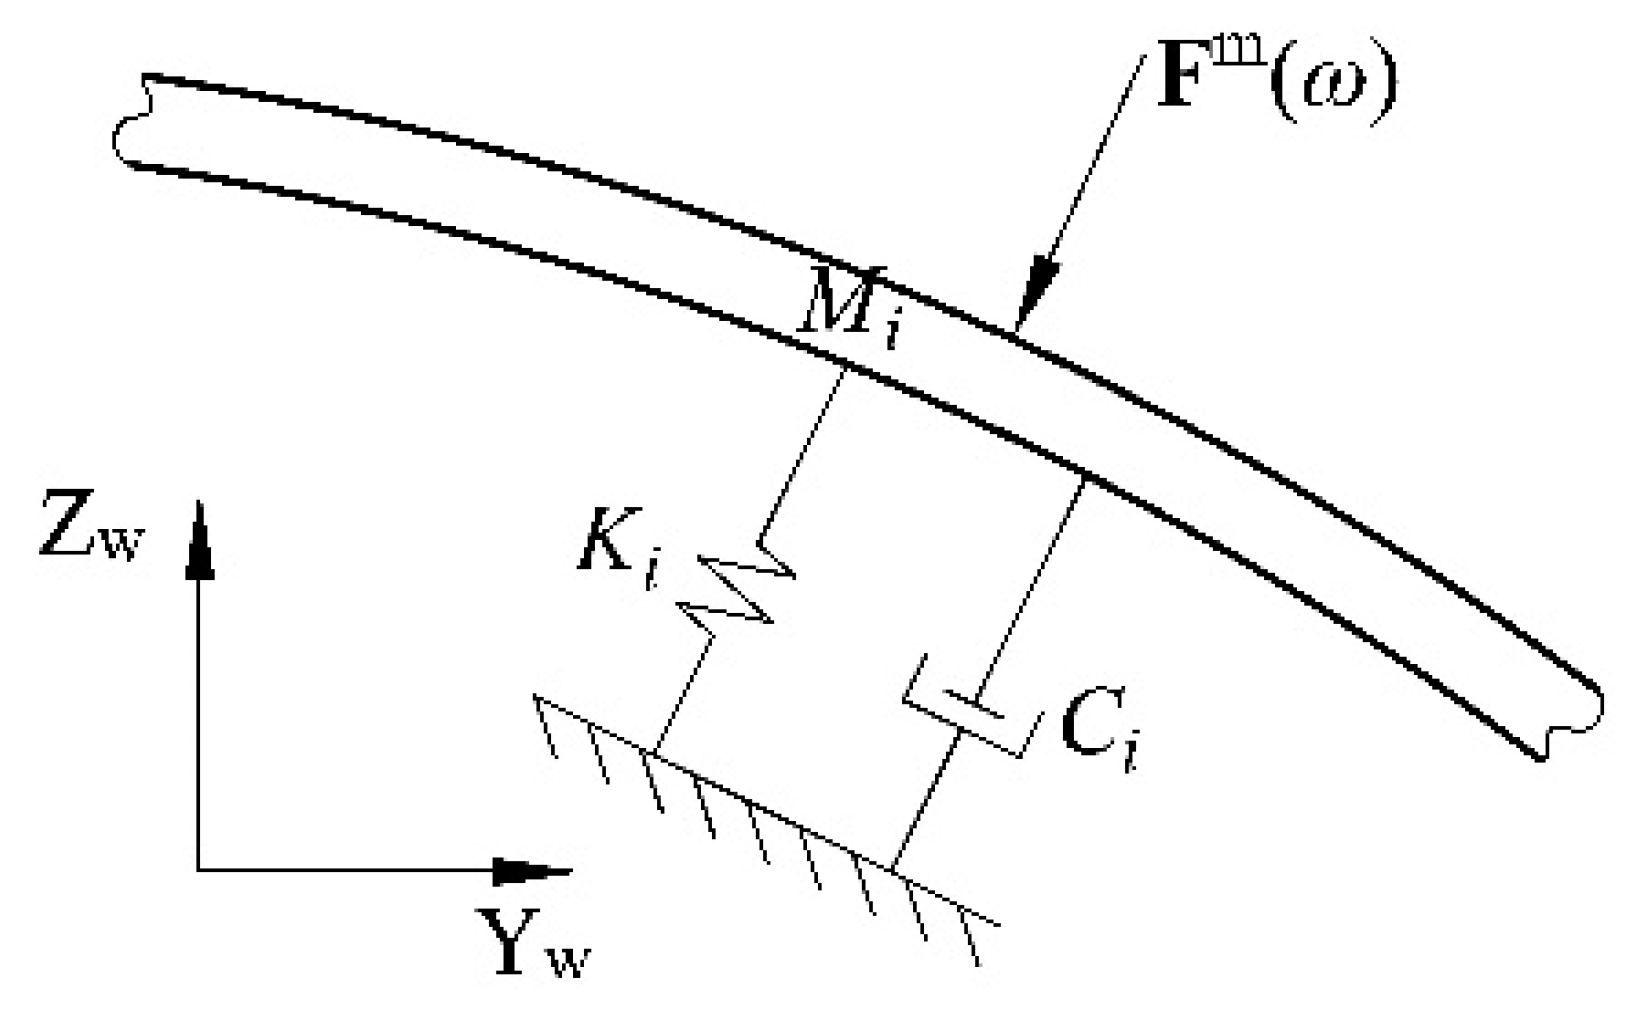
The machining vibration of the workpiece is often divided into free vibration, forced vibration and self-excited vibration. Free vibration can be ignored because it is easily dissipated with the oscillation, friction and damping of the workpiece. The self-excited vibration, also known as chatter, is the disgusting result of the dynamic instability of the whole machining system. It is necessary to conduct a stability estimation after the selection of the machining parameters, as mentioned above. The variation of the spindle speed can induce chatter, but the feed rate variation can hardly do that. Because the variation of the spindle speed is the variation of excitation frequency, the chatter will occur if the frequency is matched with a natural frequency of the workpiece, cutter or even machine tool [47]. However, the feed rate variation affects the value of the cutting force, which hardly conducts dynamic instability for a stable process. The forced vibration is mainly influenced by the amplitude and frequency of the cutting force, which will last for the whole milling process. Consequently, the vibration prediction is regarded as the calculation of forced vibration response using modal analysis. The i th modal milling vibration of the semi-conical shell workpiece in the thickness direction can be modeled as a continuous system as indicated partially in Figure 11. It should be pointed out that the Fm(ω) is the modal force which reflects the excitation component of each mode provided by the external force.
The equation of motion of the milling system can be expressed as:
where k and m denote the stiffness and mass matrix as mentioned above. Variables c and F denote the matrix of damping and the column vector of exciting force, respectively. It should be pointed out that the zm in Equation (16) is the vibration response vector in the thickness direction of the Om-XmYmZm coordinate. By assuming the cutting force and vibration response are harmonic motions, they can be expressed by {F} = {F(ω)}ejωt and {zm} = {zm(ω)}ejωt. Equation (16) can then be rewritten as:
Based on the theory of the modal analysis, the expansion theorem is used, and the displacements of the masses are expressed as a linear combination of the normal modes of the system, as shown in Equation (18). This linear transformation uncouples the equations of motion so that we obtain a set of n uncoupled differential equations of second–order.
where δ1(ω), δ2(ω) … δmnum(ω) are frequency-dependent generalized coordinates. When the exciting position of the cutting force and observation position of vibration response are the same point c. Equation (18) can be rewritten as:
where {Fc(ω)} is the cutting force at point c and wnor,i,c denotes the i th normalized modal shape displacement functions at point c in the thickness direction.
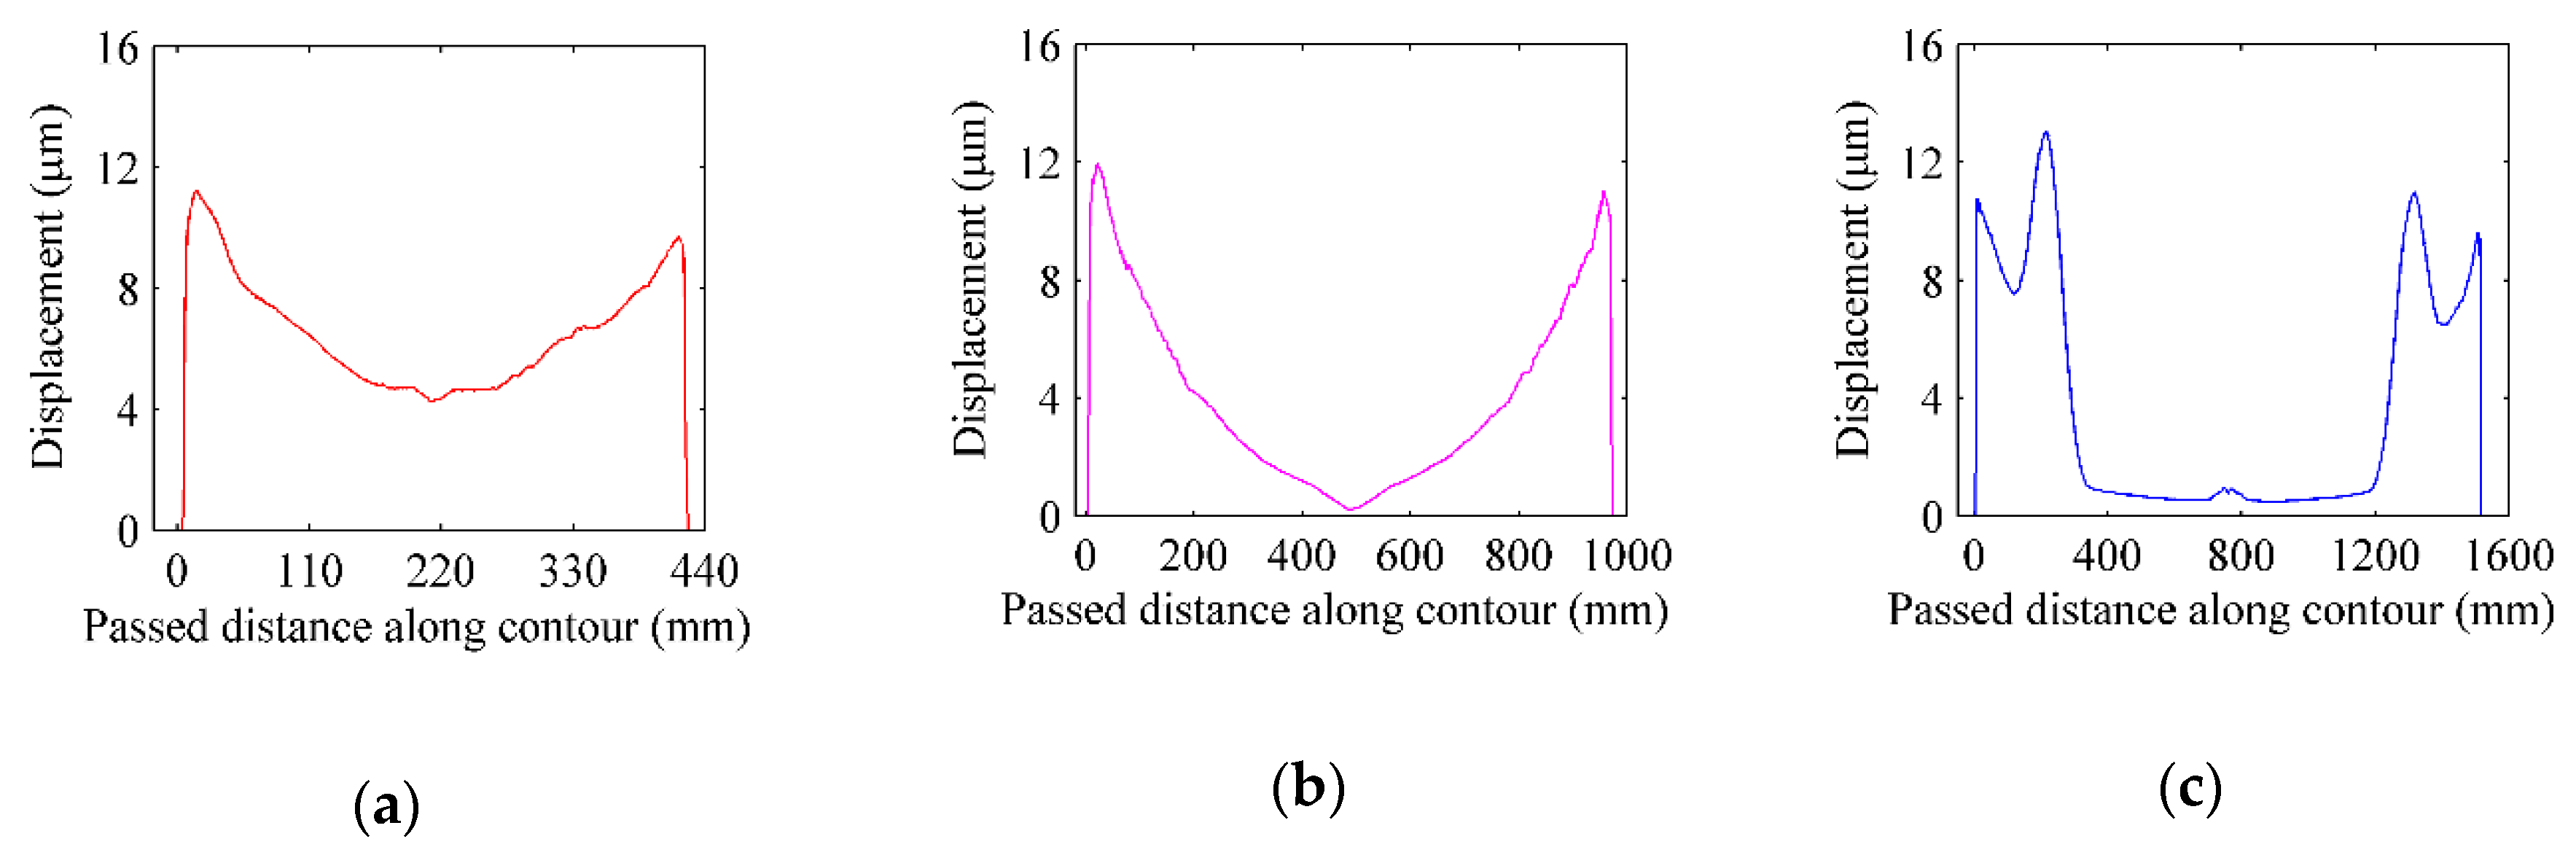
In the simulation procedure, the machining process is discretized into small segments like the calculation of the cutting force. The amplitude of the cutting force {Fc(ω)} is set as the maximum of the radial force from the corresponding contact area, and the frequency of {Fc(ω)} is set as 120 Hz constantly. The modal parameters and modal shape displacement from the same position obtained from SGM are used. With the use of Equation (19), the frequency spectrum of the response displacement can be obtained, and its maximum from each segment are collected and used to show the vibration in the machining process along the contour paths from different heights as shown in Figure 12.
From Figure 12, it can be observed that the vibration amplitude is relatively large at the beginning and the end of each contour path. The minimum value of vibration amplitude is obtained at the middle of each contour path, although the cutting force is relatively large at the same position. This demonstrates that the vibration of the semi-conical shell is influenced by both cutting force and dynamic stiffness. With the height decrease of the contour path, the maximum vibration amplitude slightly increases. It should be pointed out that the vibration amplitude for the contour path at the LP has a special raised area. This can be explained with Figure 7c that the contour path experiences a low stiffness area because of the fixture clamping method. As a result, the vibration amplitude can be a good reference to judge the machining quality and optimize the feed rate variation.
3. Design of Feed Rate Variation Strategy
It is known that the vibration in the machining process is susceptible to both instantaneous cutting force and local dynamic performance. These two factors can be adjusted to improve the influence of vibration on the machining quality of the semi-conical workpiece. Hence, an offline feed rate variation strategy is proposed in this paper, which essentially changes the instantaneous cutting force.
The design of the feed rate variation strategy is based on the vibration response amplitude of the workpiece and restrained by the cutting force in the whole machining process. In the design of continuous feed rate variation (CFV), a user-defined vibration amplitude is chosen to keep the maximum vibration constant, and another user-defined cutting force threshold is set as a limitation to avoid excessive cutting force. Considering the practical machining condition and complexity of NC programming, a discrete feed rate variation (DFV) is proposed based on the design of CFV. Furthermore, an improved discrete feed rate variation (IDFV) is proposed considering the constraint from the feed drive system, which is discussed in detail and verified in the milling experiment.
3.1. Design of Continuous Feed Rate Variation
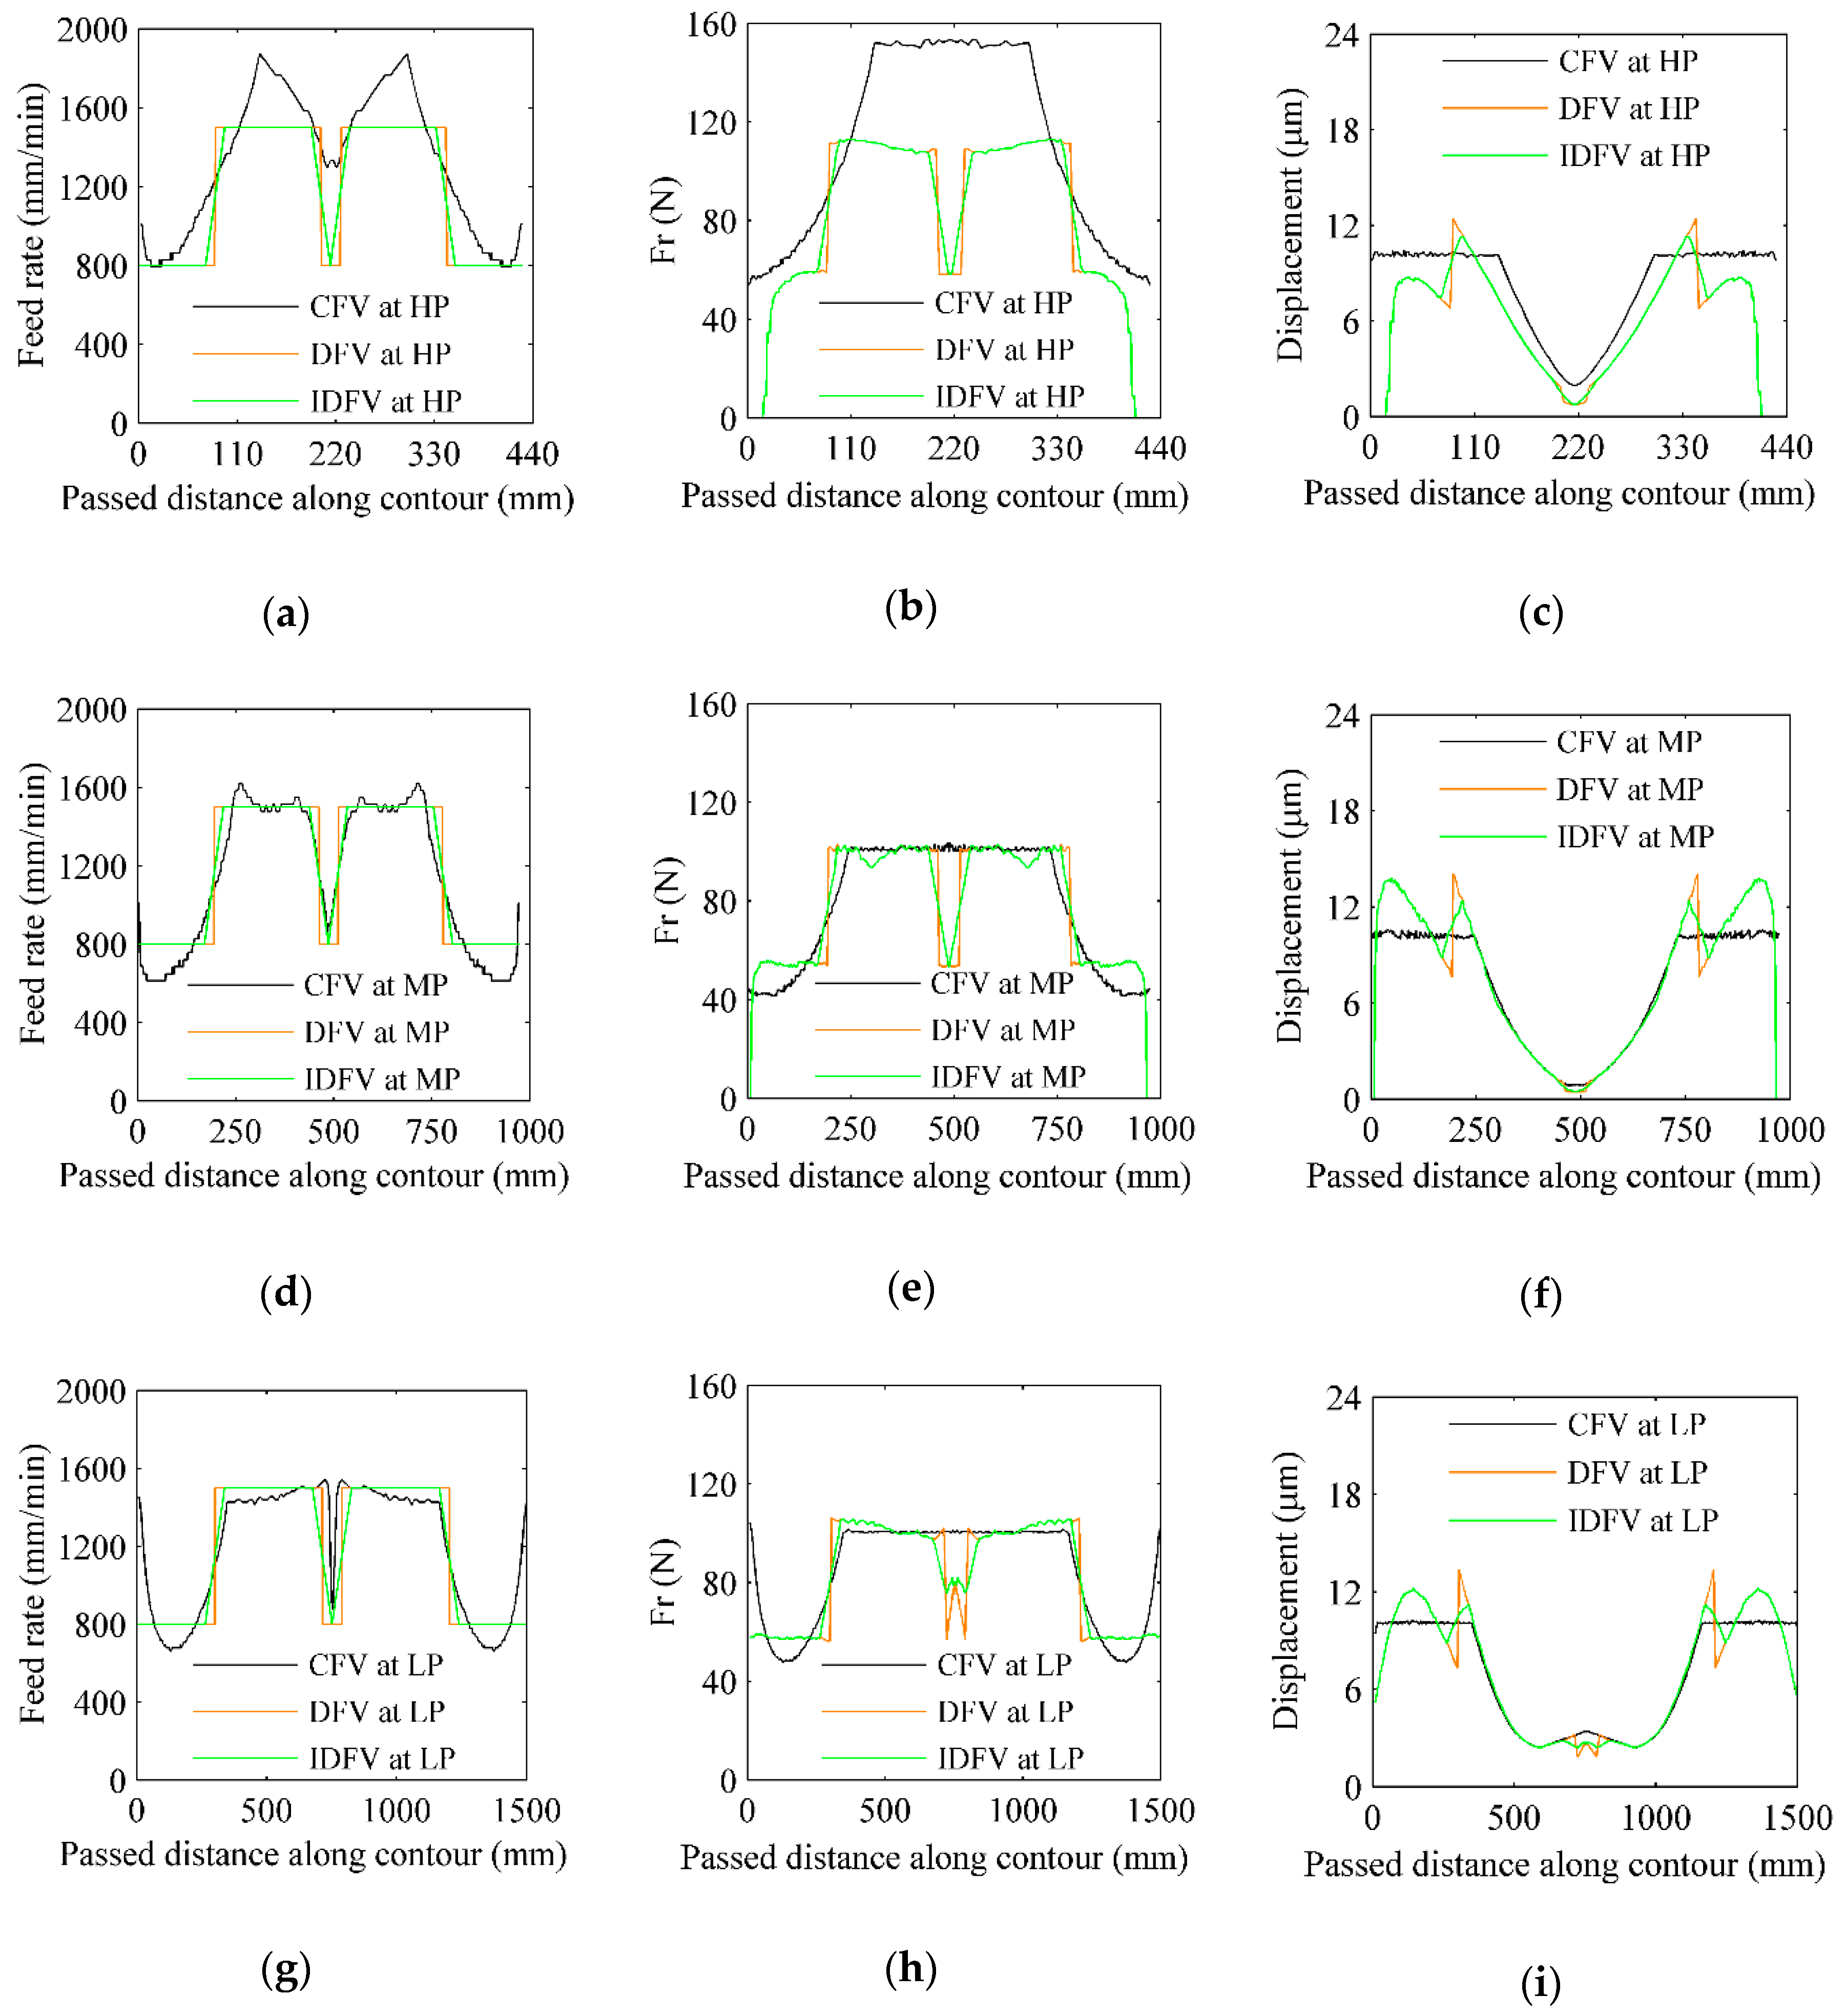
In the design of CFV, the selection of the feed rate is based on the vibration response amplitude of the workpiece and restrained by the cutting force in the whole machining process. The selection of the user-defined vibration amplitude is based on the demand of the machining quality, and the simulation results from Figure 12. Considering the end milling process in this paper is finish milling, and the maximum of the simulation displacement is 13.5 μm in Figure 12, the user-defined vibration amplitude is set as 10 μm. The selection of the user-defined cutting force threshold is based on the simulation results from Figure 5. The resultant force is ranging from 150 N to 300 N, and the radial cutting force is ranging from 50 N to 100 N. As discussed before, the radial cutting force is the main factor considering the special geometry of the semi-conical workpiece. The cutting force threshold is then set as 100 N according to the distribution of the radial cutting force. Based on the chosen user-defined vibration amplitude and cutting force threshold, the variable feed rate, radial cutting force and vibration response amplitude of contours from different heights are shown in Figure 13.
The results of CFV for contours from different heights are shown in Figure 13 with black lines. It can be observed that both cutting force and vibration displacement have an influence on the design of the feed rate. At the beginning of each contour, the feed rate is mainly restrained by the vibration response because the workpiece radius of this position is large, and the dynamic stiffness is weak, as shown in Figure 7. The length of this period is nearly a quarter of the total length of each contour. As the cutter moving along the contour tool path, it will experience a period where the vibration response is small, and the cutting force is stable. This is the period where a higher feed rate can be used. At the middle of the contour, the cutting force becomes the main factor, and the optimal feed rates decrease to a low level. Due to the symmetry of the workpiece and contour tool path, the results of CFV on the second half is similar to the first half, while the results are distributed symmetrically.
3.2. Design of Discrete Feed Rate Variation
Based on the results and discussions mentioned above, each contour tool path can be divided into five segments, no matter the height of the contour located. The segments located at the beginning and the end of each contour are the low feed rate segments due to the vibration response. The segment located at the middle of each contour is another low feed rate segment due to the cutting force. Two rest segments located between adjacent low feed rate segments are two high feed rate segments. Consequently, a discrete feed rate variation (DFV) is proposed based on the design and result of CFV.
As shown in Figure 13 with orange lines, the piecewise DFV is proposed based on the five segments. The length of the first and last segments are set as 20% of the total length of each contour. The length of the middle segment is set as 5% of the total length of each contour, and the rest parts are set as high feed rate segments. Comparing with the use of CFV, the time loss with the use of DFV is less than 15% and the lower the contour located; the less time is lost. The maximum cutting force occurs from the contour at LP; near 5% over the threshold is acceptable. The maximum vibration response also occurs from the contour at LP with about 30% over the threshold. This can be explained by the additional modal sensitive positions located a little far from the end of the workpiece, as shown in Figure 7. In general, the performance of DFV is acceptable, but the double increase or decrease of the feed rate in the switch position may be hardly achieved by the servo drive motor and control system of the machine tool. Considering the machine capability, an improved discrete feed rate variation (IDFV) is obtained by replacing the sudden step switch in the DFV as the linear switch. The period of each linear switch last 5% of the total length of each contour, as shown in Figure 13 with green lines. It can be observed that the maximum of the cutting force and vibration from IDFV are lower than that from DFV and the consuming time stay the same. Hence, the machining process with IDFV is more stable, and it is chosen to be used in the practical milling experiment.
4. Experiment Results and Validation
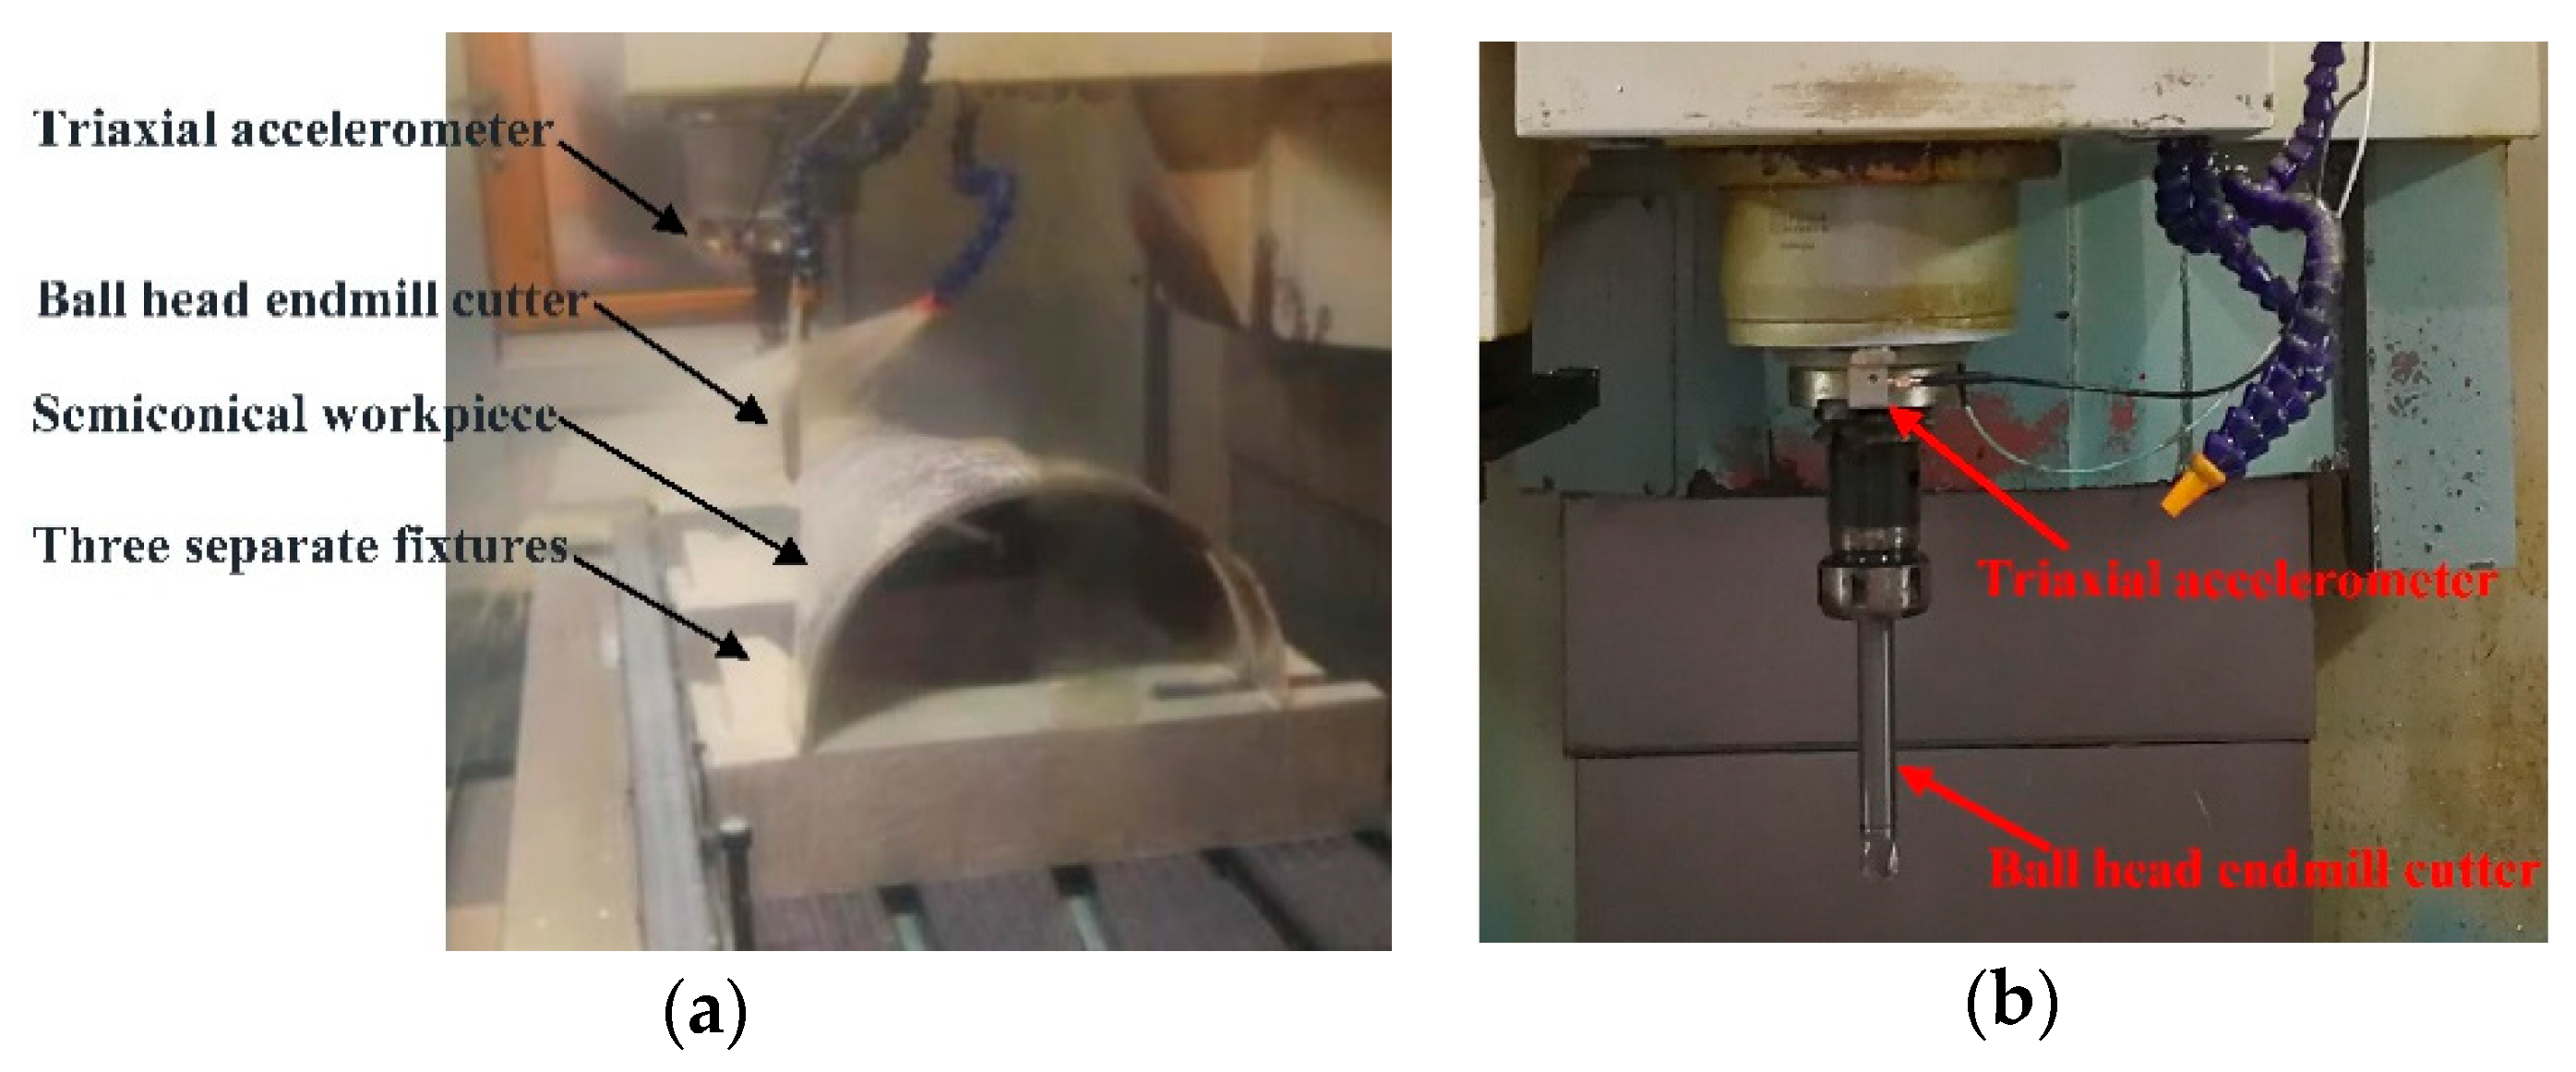
The milling experiment is conducted under the condition where the semi-conical shell workpiece is milled in a practical finish milling process with the cutting fluid condition and milling tool path based on the contour mentioned above, as shown in Figure 14a. Two workpieces of the same size are used, and the DHF ball nose endmill cutter is used, whose geometric parameters are given in Table 1. The milling parameters are described at the beginning of Section 2. Since the cutting fluid is used and the whole outer surface of the workpiece is milled, a triaxial accelerometer is mounted on the front end of the machine center spindle to collect and illustrate the vibration of the workpiece as shown in Figure 14b.
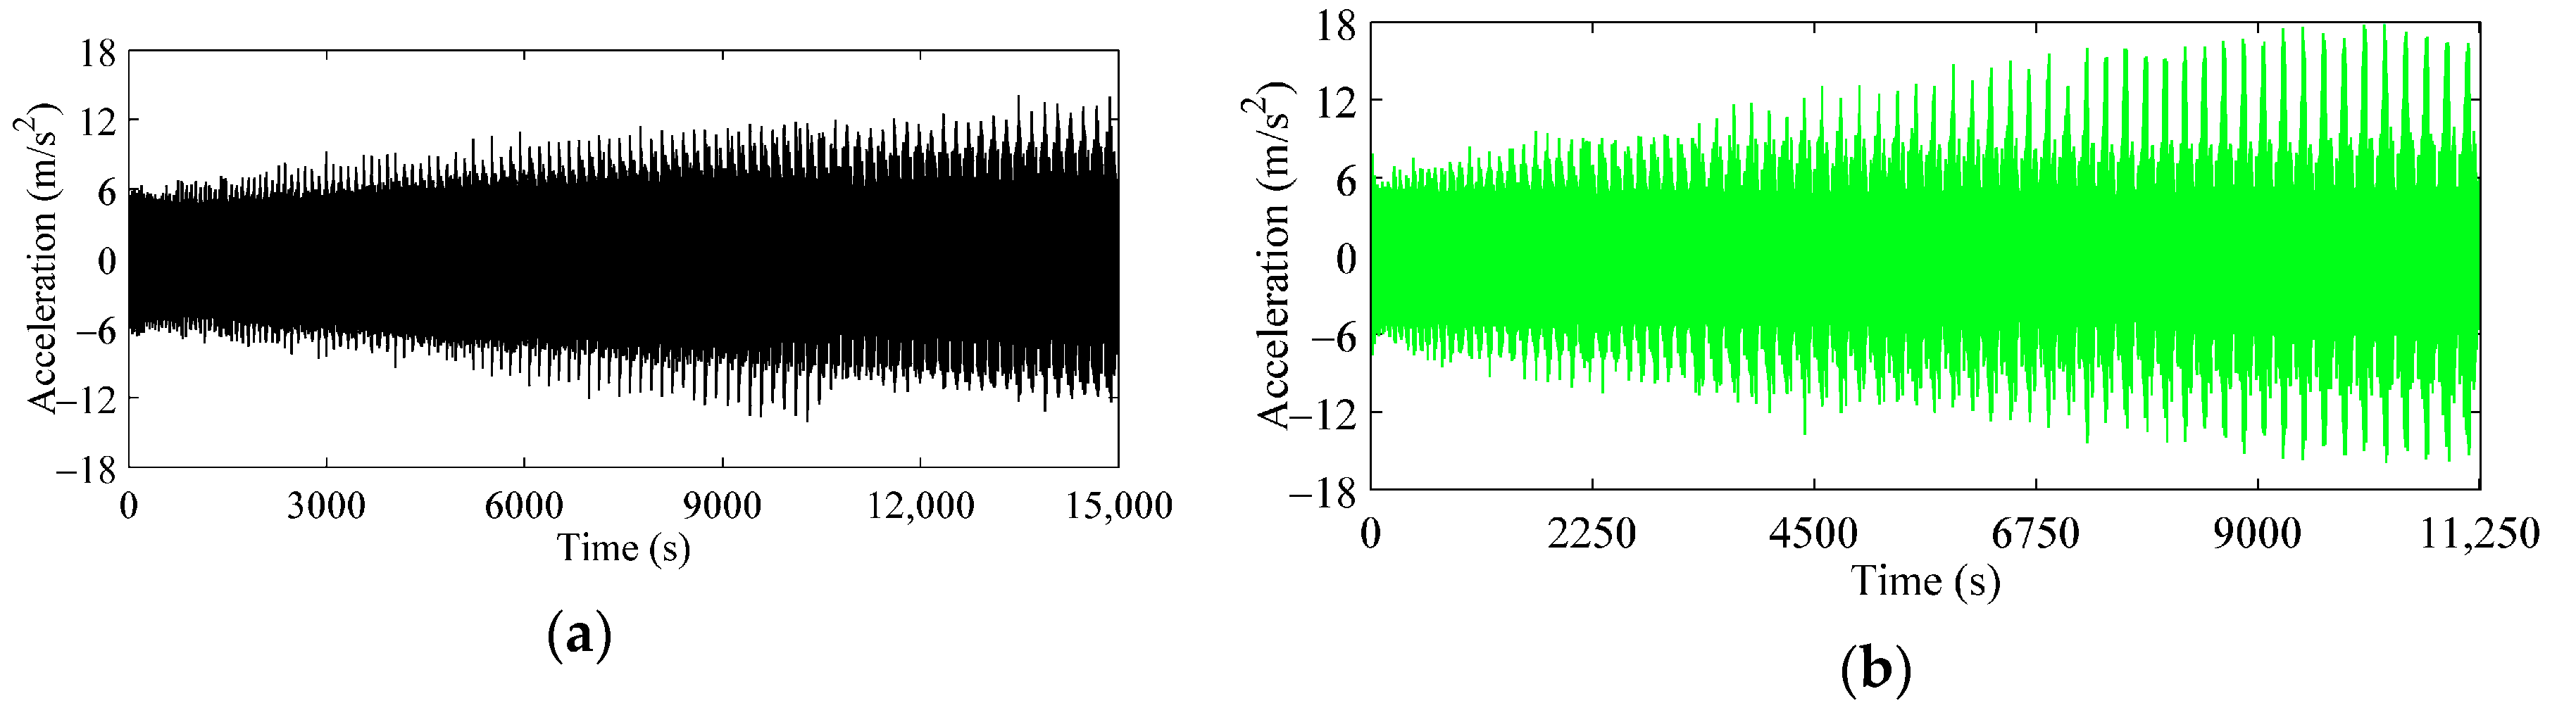
The measured time-domain vibration signals with and without feed rate variation for the whole milling process can be seen in Figure 15. It can be seen that the consuming time of the whole milling process is reduced by 25% with the use of the proposed feed rate variation strategy. Since the finishing process is employed, the machining quality and precision are the priority of consideration while the time saving is not too large. The vibration amplitude will increase gradually for the first half period, and the increase rate will slow down at a high level when there is no feed rate variation. In contrast, the vibration amplitude will continue to increase for the whole milling process with the use of the variable feed rate.
To verify the performance comprehensively and reasonably, time-domain vibration signals for a single contour line are extracted and compared, as shown in Figure 16. Three contour paths are selected as mentioned in Section 2.1, which are situated at the height of 120 mm (HP), 80 mm (MP) and 40 mm (LP). Since the consuming time is different between machining with and without IDFV, the vibration figures for the same contour are arranged in an adjacent position. From Figure 16, a common phenomenon can be observed that the vibration amplitude is large at the right end of the workpiece where the radius is large, and it will decrease at the left end where the radius is small, which are in accordance with the simulation results from Figure 12. With the use of DFV, there will be two sudden increases, which are in accordance with the simulation results from Figure 13.
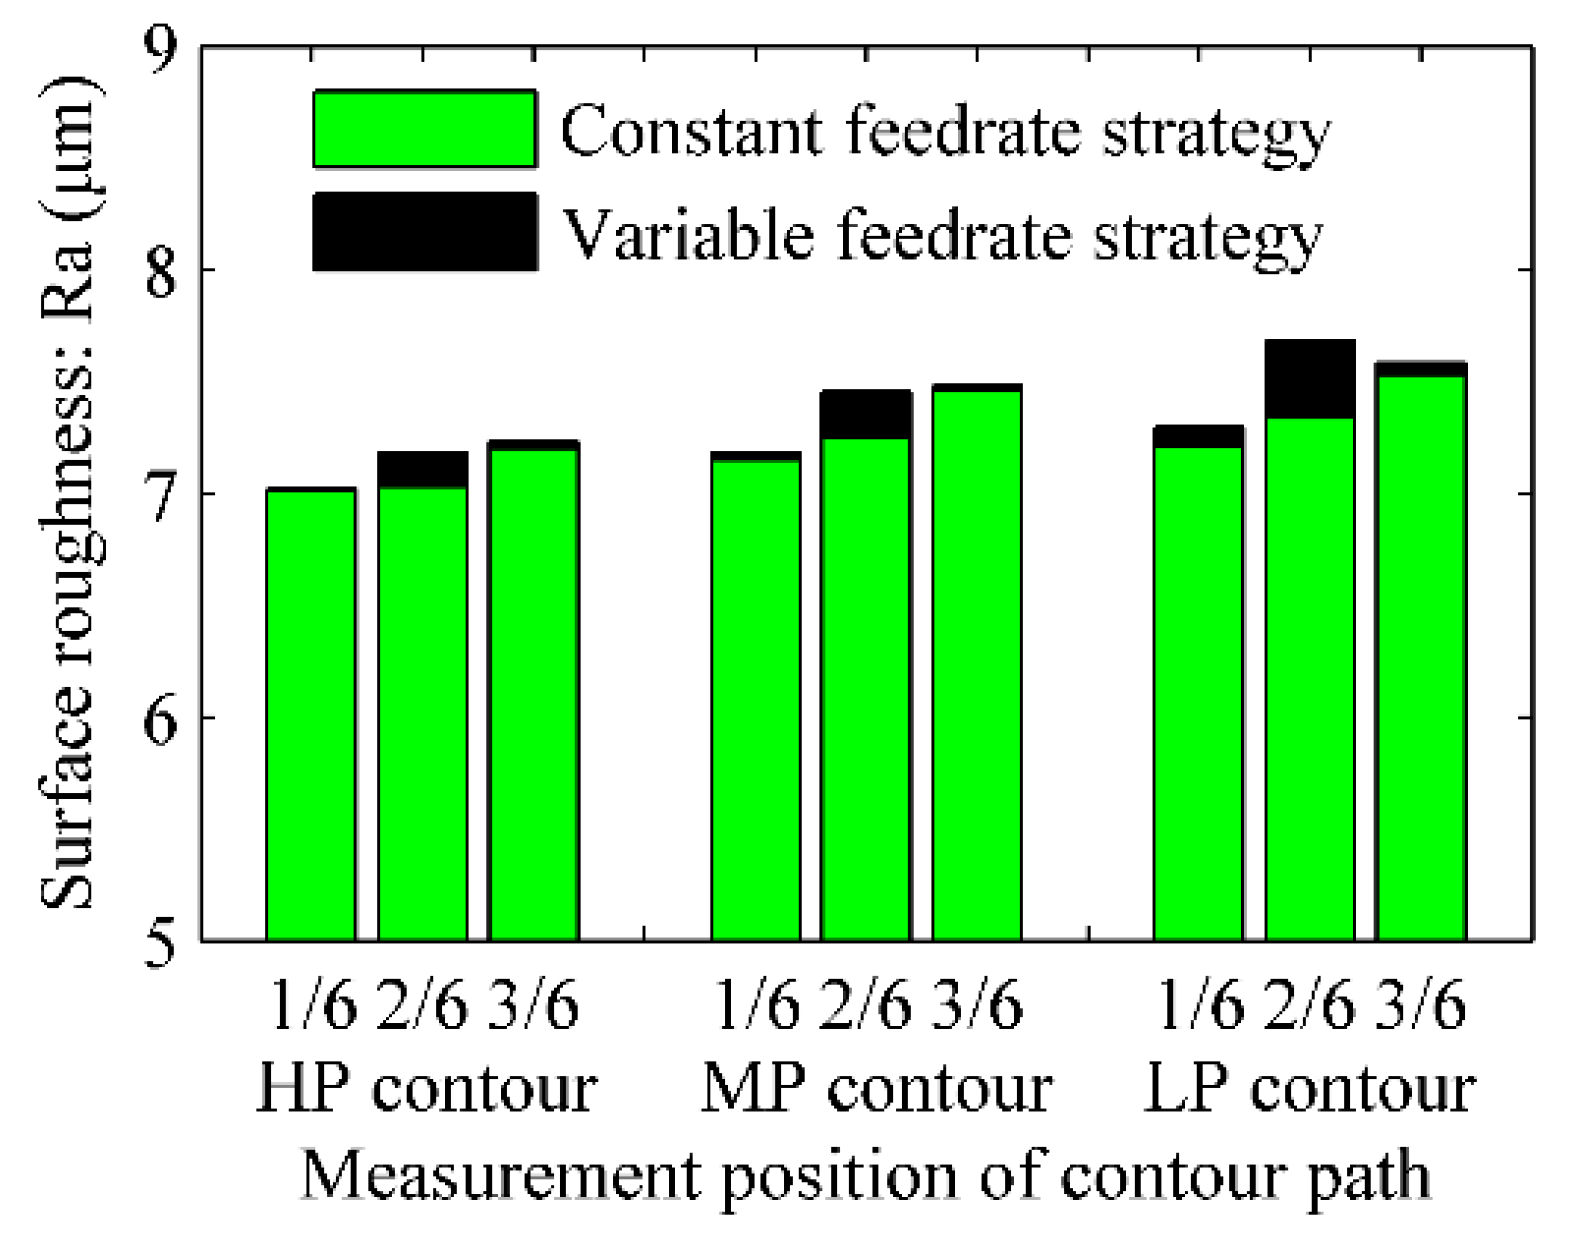
After the milling process, some outer surface positions of the workpiece are selected, and their surface roughness is measured by the Tesa Rugosurf 20. The selected measurement positions are distributed uniformly at 1/6, 2/6 and 3/6 of the total length of each contour tool path and three times are measured at each selected position. The measured average surface roughness Ra is shown in Figure 17, and the results are ranging between Ra 7 μm and Ra 8 μm. It should be pointed out that the practical milling studied in this paper is the finish milling. The workpiece will then be machined by turning and obtained the roughness requirement of Ra 6.3 μm eventually. From Figure 17, the surface roughness from each measurement position are all increased at different levels with the use of DFV. The largest increase of the surface roughness occurred at the 2/6 position, where a higher feed rate is used. However, the rate of the increase is near 5%, which is acceptable. The surface roughness at the middle of each contour are large because the adjacent contour paths are distributed sparsely. However, they almost stay the same with the use of DFV since the feed rate here is still small.
Combining the results from Figure 16 and Figure 17, the influence of the feed rate variation on the contours from different heights is discussed in detail. It should be pointed out that the reductions of consuming time from each position are all by 25% no matter the heights the contour is located. Because the piecewise method of DFV is based on the ratio of the total length of each contour, this is very convenient for practical conditions. As for the contour path at the HP, the maximum vibration acceleration is increased by 30%, while the largest increase of the surface roughness is 2.2%. The maximum vibration acceleration of the contour at MP is increased by 15%, while the largest increase of the surface roughness is 2.81%. The vibration amplitudes of the contour at LP also have two sudden increases, and consuming time is reduced by 25%. There is an increase by 4.65% of the surface roughness at the 2/6 position of the contour where the feed rate is high, and the surface roughness increases of the contour at the 1/6 and the latter half are less than 1%, as shown in Figure 17. Considering the cutting force is large at the middle of the contour, and the vibration amplitude is large at the beginning, and the end of the contour, both cutting force and vibration amplitude can affect the surface roughness, and both of them should be considered in the feed rate planning for the special thin-walled parts like the semi-conical shell workpiece in this paper.
5. Discussion
In order to improve the machining efficiency and reduce the machining quality losses in the end milling process of a semi-conical workpiece, a feed rate variation strategy is proposed considering the special stiffness distribution, geometry parameters, boundary conditions and practical machining condition of the workpiece. For better understanding, a specific flow diagram of the proposed feed rate variation strategy is given in Figure 18. Before the feed rate planning procedure, the geometry parameters of the cutter and workpiece and the machining parameters of the cutting process should be definite. The cutter–workpiece contact area obtained by the Z-map method and machining parameters is used to simulate the cutting force at each cut segment. Considering the geometry and boundary conditions of the workpiece, the dynamic performance of the workpiece is calculated, and the stability analysis of the machining system is further conducted. The stability of the machining system must be guaranteed; otherwise, the spindle speed needs to be replaced. For each tooth pass segment, the feed rate is set to maintain the vibration response at a user-defined value, and its upper limit is subjected to a user-defined cutting force threshold. Considering the performance of the servo motor and practical condition, an improved discrete feed rate variation is used, and the numerical control (NC) codes are programmed and applied in the practical milling experiment. By analyzing the surface roughness from milling experiments with and without IDFV, the surface roughness variation is so small that it can be ignored.
As for the obtained improved discrete feed rate variation, the low feed rate area at the start and the end of each contour path can be selected empirically according to the stiffness distribution of the workpiece. However, the low feed rate area in the middle of each contour path can hardly be noticed until the cutting force simulation. Hence, both cutting force and vibration are needed to be considered in the feed rate planning with virtual machining technology.
It can also be observed that only 25% of the consuming time is saved, which is not impressive. This is because the machining of the workpiece in the aerospace or mold industry needs to be extremely precise, and time-saving is not the main goal. However, considering the almost same surface roughness, and there is a turning process behind, it can save almost 3750 s, which is still meaningful.
6. Conclusions
The end milling process of the semi-conical shell workpiece is studied considering the ball head endmill cutter and the contour tool path. It is pointed out that the machining quality of special thin-walled parts with special stiffness distribution like semi-conical shell workpiece depends on both cutting force and vibration. A feed rate variation strategy is proposed, which will reduce the consuming time but increase the cutting force partially. In order to find the optimal feed rate variation, the cutting force simulation of each contour path is calculated considering the variable contact area between the cutting tool and workpiece. The dynamic performance of the workpiece is obtained with the use of SGM, the stability analysis and the forced vibration modal analysis of each contour path is conducted.
The feed rate planning strategies with continuous variation and discrete variation are proposed and studied based on the simulation results of the cutting force and vibration response. The improved discrete feed rate variation strategy is obtained and applied to the practical condition. The milling experiments are conducted, and the performance with the use of the conservative feed rate and the proposed feed rate variation strategy are compared. The results show that the consuming time can be reduced, and the influence on the machining quality can be ignored with the optimal feed rate variation strategy.
Author Contributions
Conceptualization, P.Q. and M.W.; methodology, P.Q.; software, P.Q.; validation, P.Q., M.W. and L.S.; formal analysis, P.Q.; investigation, P.Q. and L.S.; resources, P.Q. and M.W.; data curation, P.Q. and M.W.; writing—original draft preparation, P.Q.; writing—review and editing, P.Q. and L.S.; visualization, P.Q.; supervision, P.Q., M.W. and L.S.; project administration, M.W.; funding acquisition, M.W. All authors have read and agreed to the published version of the manuscript.
Funding
This research was funded by the National Natural Foundation of China, Grant numbers 51975020 and 51575014; the Advance Research Program Foundation of Equipment, Grant number E0001011201801; the National Science and Technology Major Project, Grant number 2019ZX04032001-004 and the National Defense Scientific Research Project, Grant number JCKY2014204B003.
Acknowledgments
This study was supported by the College of Mechanical Engineering and Applied Electronics Technology.
Conflicts of Interest
The authors declare no conflict of interest.
References
- De Souza, A.F.; Berkenbrock, E.; Diniz, A.E.; Rodrigues, A.R. Influences of the tool path strategy on the machining force when milling free form geometries with a ball-end cutting tool. J. Braz. Soc. Mech. Sci. Eng. 2014, 37, 675–687. [Google Scholar] [CrossRef]
- Tounsi, N.; Elbestawi, M. Optimized feed scheduling in three axes machining. Part I: Fundamentals of the optimized feed scheduling strategy. Int. J. Mach. Tools Manuf. 2003, 43, 253–267. [Google Scholar] [CrossRef]
- Vavruska, P.; Zeman, P.; Stejskal, M. Reducing Machining Time by Pre-Process Control of Spindle Speed and Feed-Rate in Milling Strategies. Procedia CIRP 2018, 77, 578–581. [Google Scholar] [CrossRef]
- Bediaga, I.; Munoa, J.; Hernandez, J.; De Lacalle, L.N.L. An automatic spindle speed selection strategy to obtain stability in high-speed milling. Int. J. Mach. Tools Manuf. 2009, 49, 384–394. [Google Scholar] [CrossRef]
- Wibowo, Y.T.; Baskoro, S.Y.; Manurung, V.A.T. Toolpath Strategy and Optimum Combination of Machining Parameter during Pocket Mill Process of Plastic Mold Steels Material. IOP Conf. Series Mater. Sci. Eng. 2018, 306, 012137. [Google Scholar] [CrossRef]
- Kurt, M.; Bagci, E. Feedrate optimisation/scheduling on sculptured surface machining: A comprehensive review, applications and future directions. Int. J. Adv. Manuf. Technol. 2011, 55, 1037–1067. [Google Scholar] [CrossRef]
- Wang, W. Solid modeling for optimizing metal removal of three-dimensional NC end milling. J. Manuf. Syst. 1988, 7, 57–65. [Google Scholar] [CrossRef]
- Zhang, X.; Yu, T.; Wang, W. Modeling, simulation, and optimization of five-axis milling processes. Int. J. Adv. Manuf. Technol. 2014, 74, 1611–1624. [Google Scholar] [CrossRef]
- Salami, R.; Sadeghi, M.; Motakef, B. Feed rate optimization for 3-axis ball-end milling of sculptured surfaces. Int. J. Mach. Tools Manuf. 2007, 47, 760–767. [Google Scholar] [CrossRef]
- Benardos, P.; Vosniakos, G.-C. Offline flexible optimisation of feed and speed in computer numerical control machining of sculptured surfaces exploiting dedicated cutting force metamodels. Proc. Inst. Mech. Eng. Part B-J. Eng. Manuf. 2005, 228, 878–892. [Google Scholar] [CrossRef]
- Ferry, W.B.; Altintas, Y. Virtual Five-Axis Flank Milling of Jet Engine Impellers—Part II: Feed Rate Optimization of Five-Axis Flank Milling. J. Manuf. Sci. Eng. 2008, 130, 011013. [Google Scholar] [CrossRef]
- Erdim, H.; Lazoglu, I.; Ozturk, B. Feedrate scheduling strategies for free-form surfaces. Int. J. Mach. Tools Manuf. 2006, 46, 747–757. [Google Scholar] [CrossRef]
- Wang, Z.; Wong, Y.; Rahman, M. Optimisation of multi-pass milling using genetic algorithm and genetic simulated annealing. Int. J. Adv. Manuf. Technol. 2004, 24, 727–732. [Google Scholar] [CrossRef]
- Xu, P.; Lee, R.-S. Feedrate optimization based on hybrid forward-reverse mappings of artificial neural networks for five-axis milling. Int. J. Adv. Manuf. Technol. 2016, 87, 3033–3049. [Google Scholar] [CrossRef]
- Layegh, S.E.; Erdim, H.; Lazoglu, I. Offline Force Control and Feedrate Scheduling for Complex Free Form Surfaces in 5-Axis Milling. Procedia CIRP 2012, 1, 96–101. [Google Scholar] [CrossRef]
- Arruda, T.M.; De Paiva, A.P.; Brandão, L.C.; Ferreira, J.R. Robust optimisation of surface roughness of AISI H13 hardened steel in the finishing milling using ball nose end mills. Precis. Eng. 2019, 60, 194–214. [Google Scholar] [CrossRef]
- Lacalle, L.N.; Lamikiz, A.; Sánchez, J.A.; Salgado, M.A. Toolpath selection based on the minimum deflection cutting forces in the programming of complex surfaces milling. Int. J. Mach. Tools Manuf. 2007, 47, 388–400. [Google Scholar] [CrossRef]
- Lamikiz, A.; Muñoa, J.; Sánchez, J.A. The CAM as the centre of gravity of the five-axis high speed milling of complex parts. Int. J. Prod. Res. 2005, 43, 1983–1999. [Google Scholar] [CrossRef]
- Bustillo, A.; Díez-Pastor, J.-F.; Quintana, G.; García-Osorio, C. Avoiding neural network fine tuning by using ensemble learning: Application to ball-end milling operations. Int. J. Adv. Manuf. Technol. 2011, 57, 521–532. [Google Scholar] [CrossRef]
- Arnaiz-González, Á.; Fernández-Valdivielso, A.; Bustillo, A.; De Lacalle, L.N.L. Using artificial neural networks for the prediction of dimensional error on inclined surfaces manufactured by ball-end milling. Int. J. Adv. Manuf. Technol. 2016, 83, 847–859. [Google Scholar] [CrossRef]
- Yang, J.; Aslan, D.; Altintas, Y. A feedrate scheduling algorithm to constrain tool tip position and tool orientation errors of five-axis CNC machining under cutting load disturbances. CIRP J. Manuf. Sci. Technol. 2018, 23, 78–90. [Google Scholar] [CrossRef]
- Qian, L.; Yang, B.; Lei, S. Comparing and combining off-line feedrate rescheduling strategies in free-form surface machining with feedrate acceleration and deceleration. Robot. Comput. Manuf. 2008, 24, 796–803. [Google Scholar] [CrossRef]
- De Lacalle, L.N.L.; Lamikiz, A.; Muñoa, J.; Salgado, M.; Sánchez, J. Improving the high-speed finishing of forming tools for advanced high-strength steels (AHSS). Int. J. Adv. Manuf. Technol. 2006, 29, 49–63. [Google Scholar] [CrossRef]
- Altintas, Y.; Erkorkmaz, K. Feedrate Optimization for Spline Interpolation in High Speed Machine Tools. CIRP Ann. 2003, 52, 297–302. [Google Scholar] [CrossRef]
- Erkorkmaz, K.; Layegh, S.E.; Lazoglu, I.; Erdim, H. Feedrate optimization for freeform milling considering constraints from the feed drive system and process mechanics. CIRP Ann. 2013, 62, 395–398. [Google Scholar] [CrossRef]
- Fei, J.; Xu, F.; Lin, B.; Huang, T. State of the art in milling process of the flexible workpiece. Int. J. Adv. Manuf. Technol. 2020, 109, 1695–1725. [Google Scholar] [CrossRef]
- Wei, Z.C.; Wang, M.J.; Cai, Y.J.; Zhu, J.N.; Wang, L. Form error estimation in ball-end milling of sculptured surface with z-level contouring tool path. Int. J. Adv. Manuf. Technol. 2012, 65, 363–369. [Google Scholar] [CrossRef]
- Schmitz, T.L.; Mann, B.P. Closed-form solutions for surface location error in milling. Int. J. Mach. Tools Manuf. 2006, 46, 1369–1377. [Google Scholar] [CrossRef]
- Dong, Z.; Jiao, L.; Wang, X.; Liang, Z.; Liu, Z.; Yi, J. FEA-based prediction of machined surface errors for dynamic fixture-workpiece system during milling process. Int. J. Adv. Manuf. Technol. 2015, 85, 299–315. [Google Scholar] [CrossRef]
- Wei, Z.C.; Wang, M.J.; Cai, Y.J.; Wang, S.F. Prediction of cutting force in ball-end milling of sculptured surface using improved Z-map. Int. J. Adv. Manuf. Technol. 2013, 68, 1167–1177. [Google Scholar] [CrossRef]
- Shi, D.; Shi, X.; Li, W.L.; Wang, Q. Free transverse vibrations of orthotropic thin rectangular plates with arbitrary elastic edge supports. J. Vibroengineering 2014, 16, 389–398. [Google Scholar]
- Pelayo, G.U.; Olvera-Trejo, D.; Luo, M.; De Lacalle, L.L.; Elías-Zuñiga, A. Surface roughness prediction with new barrel-shape mills considering runout: Modelling and validation. Measurement 2020. [Google Scholar] [CrossRef]
- Lazoglu, I.; Boz, Y.; Erdim, H. Five-axis milling mechanics for complex free form surfaces. CIRP Ann. 2011, 60, 117–120. [Google Scholar] [CrossRef]
- Wei, Z.; Wang, M.; Zhu, J.; Gu, L. Cutting force prediction in ball end milling of sculptured surface with Z-level contouring tool path. Int. J. Mach. Tools Manuf. 2011, 51, 428–432. [Google Scholar] [CrossRef]
- Imani, B.M.; Sadeghi, M.; Elbestawi, M. An improved process simulation system for ball-end milling of sculptured surfaces. Int. J. Mach. Tools Manuf. 1998, 38, 1089–1107. [Google Scholar] [CrossRef]
- Yigit, I.; Layegh K., S.E.L.; Lazoglu, I. A Solid Modeler Based Engagement Model for 5-axis Ball End Milling. Procedia CIRP 2015, 31, 179–184. [Google Scholar] [CrossRef] [Green Version]
- Boz, Y.; Erdim, H.; Lazoglu, I. A comparison of solid model and three-orthogonal dexelfield methods for cutter-workpiece engagement calculations in three- and five-axis virtual milling. Int. J. Adv. Manuf. Technol. 2015, 81, 811–823. [Google Scholar] [CrossRef]
- Zeng, L.; Zhang, Y.; Kunpeng, Z.; Yu, Z. Modeling of the instantaneous milling force per tooth with tool run-out effect in high speed ball-end milling. Int. J. Mach. Tools Manuf. 2017, 119, 37–48. [Google Scholar] [CrossRef]
- Urbikain, G.P. Modelling of static and dynamic milling forces in inclined operations with circle-segment end mills. Precis. Eng. 2018, 56, 123–135. [Google Scholar] [CrossRef]
- Lamikiz, A.; De Lacalle, L.L.; Sánchez, J.A.; Salgado, M.; Lamikiz, A.; De Lacalle, L.N.L. Cutting force estimation in sculptured surface milling. Int. J. Mach. Tools Manuf. 2004, 44, 1511–1526. [Google Scholar] [CrossRef]
- Lamikiz, A.; De Lacalle, L.N.L.; Sánchez, J.A.; Salgado, M.A. Cutting force integration at the CAM stage in the high-speed milling of complex surfaces. Int. J. Comput. Integr. Manuf. 2005, 18, 586–600. [Google Scholar] [CrossRef]
- Layegh, S.E.; Lazoglu, I. A New Identification Method of Specific Cutting Coefficients for Ball End Milling. Procedia CIRP 2014, 14, 182–187. [Google Scholar] [CrossRef] [Green Version]
- Liu, Q.; Li, Z.Q. Simulation and Optimization of CNC Milling Process: Modeling, Algorithms, and Applications; Aviation Industry Press: Beijing, China, 2011. [Google Scholar]
- Wang, M.; Zan, T.; Gao, X.; Li, S. Suppression of the time-varying vibration of ball screws induced from the continuous movement of the nut using multiple tuned mass dampers. Int. J. Mach. Tools Manuf. 2016, 107, 41–49. [Google Scholar] [CrossRef]
- Altintaş, Y.; Budak, E. Analytical Prediction of Stability Lobes in Milling. CIRP Ann. 1995, 44, 357–362. [Google Scholar] [CrossRef]
- Altıntas, Y.; Shamoto, E.; Lee, P.; Budak, E. Analytical Prediction of Stability Lobes in Ball End Milling. J. Manuf. Sci. Eng. 1999, 121, 586–592. [Google Scholar] [CrossRef]
- Bolsunovskiy, S.; Vermel, V.; Gubanov, G.; Kacharava, I.; Kudryashov, A.B. Thin-Walled Part Machining Process Parameters Optimization based on Finite-Element Modeling of Workpiece Vibrations. Procedia CIRP 2013, 8, 276–280. [Google Scholar] [CrossRef] [Green Version]
Figure 1.
General flow diagram of the proposed feed rate variation strategy.

Figure 2.
(a) Experimental setup of the semi-conical shell workpiece; (b) partial schematic of the contour line tool path; (c) schematic diagram of the workpiece and coordinate system Ow-XwYwZw; (d) schematic diagram of the ball-endmill cutter and coordinate system Oc-XcYcZc.
Figure 2.
(a) Experimental setup of the semi-conical shell workpiece; (b) partial schematic of the contour line tool path; (c) schematic diagram of the workpiece and coordinate system Ow-XwYwZw; (d) schematic diagram of the ball-endmill cutter and coordinate system Oc-XcYcZc.

Figure 3.
(a) Schematic diagram of the workpiece, contour tool path and coordinate system Oc-XcYcZc; (b) simulation results of the feed turning angle along the contours from different heights.
Figure 3.
(a) Schematic diagram of the workpiece, contour tool path and coordinate system Oc-XcYcZc; (b) simulation results of the feed turning angle along the contours from different heights.

Figure 4.
Schematic diagrams: (a) cutter–workpiece engagements in the view of the Xw-direction; (b) different contour tool paths in the view of the Zw-direction and distribution of the chosen positions; (c–h) simulation results of the cutter–workpiece engagements from the chosen positions.
Figure 4.
Schematic diagrams: (a) cutter–workpiece engagements in the view of the Xw-direction; (b) different contour tool paths in the view of the Zw-direction and distribution of the chosen positions; (c–h) simulation results of the cutter–workpiece engagements from the chosen positions.

Figure 5.
Simulated cutting force along the contour from different heights: (a) cutting force in the Xw-direction; (b) cutting force in the Yw-direction; (c) cutting force in the Zw-direction; (d) resultant cutting force; (e) radial cutting force of the ball head endmill cutter.
Figure 5.
Simulated cutting force along the contour from different heights: (a) cutting force in the Xw-direction; (b) cutting force in the Yw-direction; (c) cutting force in the Zw-direction; (d) resultant cutting force; (e) radial cutting force of the ball head endmill cutter.

Figure 6.
Schematic diagram of the semi-conical shell workpiece and coordinate system Om-XmYmZm.

Figure 7.
First three modal shapes of the semi-conical shell workpiece with three chosen contour tool paths: (a) first modal shape; (b) second modal shape; (c) third modal shape.
Figure 7.
First three modal shapes of the semi-conical shell workpiece with three chosen contour tool paths: (a) first modal shape; (b) second modal shape; (c) third modal shape.

Figure 8.
(a) Magnitude of the frequency response function (FRF) from the simulation and experiment; (b) real part of the FRF from the simulation and experiment; (c) stability lobe diagram obtained with the FRF from the simulation and experiment.
Figure 8.
(a) Magnitude of the frequency response function (FRF) from the simulation and experiment; (b) real part of the FRF from the simulation and experiment; (c) stability lobe diagram obtained with the FRF from the simulation and experiment.

Figure 9.
Geometries diagram of the cutting and vibration in the milling process (a) in the view of the Zw-direction; (b) in the view of the Xw-direction.
Figure 9.
Geometries diagram of the cutting and vibration in the milling process (a) in the view of the Zw-direction; (b) in the view of the Xw-direction.

Figure 10.
3D stability lobe diagrams (SLDs) of the semi-conical workpiece considering the first three modes in the Zm-direction: (a) absolute critical cutting depth for each position of the workpiece at all spindle speed; (b) relative critical cutting depth for each position of the workpiece with the spindle speed at 3600 rpm.

Figure 11.
Schematic diagram of vibration response in the milling process in the thickness direction.
Figure 11.
Schematic diagram of vibration response in the milling process in the thickness direction.

Figure 12.
Predicted vibration response in the milling process along contour paths from at the height of (a) 120 mm (HP); (b) 80 mm (MP); (c) 40 mm (LP).
Figure 12.
Predicted vibration response in the milling process along contour paths from at the height of (a) 120 mm (HP); (b) 80 mm (MP); (c) 40 mm (LP).

Figure 13.
Results of continuous feed rate variation (CFV), discrete feed rate variation (DFV) and improved discrete feed rate variation (IDFV) for each single contour: (a,d,g) feed rate; (b,e,h) radial cutting force; (c,f,i) vibration response; (a–c) contour at HP; (d–f) contour at MP; (g–i) contour at LP.

Figure 14.
Photos of experimental setup (a) milling experiment; (b) ball head endmill cutter and accelerometer.
Figure 14.
Photos of experimental setup (a) milling experiment; (b) ball head endmill cutter and accelerometer.

Figure 15.
Time-domain vibration signals for the whole milling process: (a) without and (b)with the feed rate variation.
Figure 15.
Time-domain vibration signals for the whole milling process: (a) without and (b)with the feed rate variation.

Figure 16.
Time-domain vibration signals for a single contour line: (a,b) contour at HP; (c,d) contour at MP; (e,f) contour at LP; (a,c,e) contour without feed rate variation; (b,d,f) contour with the feed rate variation.
Figure 16.
Time-domain vibration signals for a single contour line: (a,b) contour at HP; (c,d) contour at MP; (e,f) contour at LP; (a,c,e) contour without feed rate variation; (b,d,f) contour with the feed rate variation.


Figure 17.
Surface roughness for each contour tool path with and without feed rate variation.

Figure 18.
Specific flow diagram of the proposed feed rate variation strategy.


Table 1.
Geometric parameters of the workpiece and cutter.
| Parameter Name | Parameter Value | |
|---|---|---|
| Workpiece | R1 (mm) | 26 |
| R2 (mm) | 147 | |
| L (mm) | 842 | |
| h (mm) | 10 | |
| Φ (rad) | π | |
| Material | Al-Cu cast aluminum alloy | |
| Endmill cutter | Number of teeth | 2 |
| Helix angle (deg) | 25 | |
| Diameter (mm) | 20 | |
| Manufacturer and model | X-BTC2002 of DHF | |
| Material | tungsten steel |
Table 2.
Cutting force coefficients.
| Cutting Force Coefficients | Value |
|---|---|
| Cutting force component in the tangential direction, Ktc (N mm−2) | 895.5 |
| Cutting force component in the radial direction, Krc (N mm−2) | 327.5 |
| Cutting force component in the axial direction, Kac (N mm−2) | 64.2 |
| Component of edge effects in the tangential direction, Kte (N mm−1) | 22.5 |
| Component of edge effects in the radial direction, Kre (N mm−1) | 21.2 |
| Component of edge effects in the axial direction, Kae (N mm−1) | 3.7 |
Table 3.
Comparison of the first five natural frequencies for a semi-conical shell with different methods.
Table 3.
Comparison of the first five natural frequencies for a semi-conical shell with different methods.
| Methods | First Five Natural Frequencies (Hz) | ||||
|---|---|---|---|---|---|
| 1 | 2 | 3 | 4 | 5 | |
| SGM with M = N = 15 | 600.54 | 985.30 | 1602.4 | 1913.6 | 2147.0 |
| FEM | 583.94 | 957.09 | 1533.1 | 1722.5 | 1995.5 |
| EMA | 586.44 | 966.23 | 1572.4 | 1703.2 | 1989.3 |
Publisher’s Note: MDPI stays neutral with regard to jurisdictional claims in published maps and institutional affiliations. |
© 2020 by the authors. Licensee MDPI, Basel, Switzerland. This article is an open access article distributed under the terms and conditions of the Creative Commons Attribution (CC BY) license (http://creativecommons.org/licenses/by/4.0/).
Share and Cite
MDPI and ACS Style
Qin, P.; Wang, M.; Sun, L. Feed Rate Variation Strategy for Semi-Conical Shell Workpiece in Ball Head End Milling Process. Appl. Sci. 2020, 10, 9135. https://doi.org/10.3390/app10249135
AMA Style
Qin P, Wang M, Sun L. Feed Rate Variation Strategy for Semi-Conical Shell Workpiece in Ball Head End Milling Process. Applied Sciences. 2020; 10(24):9135. https://doi.org/10.3390/app10249135
Chicago/Turabian StyleQin, Peng, Min Wang, and Lele Sun. 2020. "Feed Rate Variation Strategy for Semi-Conical Shell Workpiece in Ball Head End Milling Process" Applied Sciences 10, no. 24: 9135. https://doi.org/10.3390/app10249135
Note that from the first issue of 2016, this journal uses article numbers instead of page numbers. See further details here.