Continuous-Wave THz Imaging for Biomedical Samples
by
 , and
, and
Yaya Zhang
1,†, 
Chuting Wang
2,†,
Bingxin Huai
3,
Shiyu Wang
1,
Yating Zhang
3,
Dayong Wang
1,4,*,
Lu Rong
1,4,* and
Yongchang Zheng
5,* 1
Faculty of Science, College of Physics and Optoelectronics, Beijing University of Technology, Beijing 100124, China
2
Department of Liver Surgery, Peking Union Medical College Hospital, Chinese Academy of Medical Sciences and Peking Union Medical College, Beijing 100730, China
3
Department of Electronic Engineering, Tsinghua University, Haidian District, Beijing 100084, China
4
Beijing Engineering Research Center of Precision Measurement Technology and Instruments, Beijing 100124, China
5
Academy of Medical Science, Peking Union Medical College, Beijing 100730, China
*
Authors to whom correspondence should be addressed.
†
These authors contributed equally to this work.
Appl. Sci. 2021, 11(1), 71; https://doi.org/10.3390/app11010071
Submission received: 3 November 2020
/
Revised: 12 December 2020
/
Accepted: 16 December 2020
/
Published: 23 December 2020
(This article belongs to the Special Issue Terahertz Sensors for Biomedical Application)
Abstract
:In the past few decades, the applications of terahertz (THz) spectroscopy and imaging technology have seen significant developments in the fields of biology, medical diagnosis, food safety, and nondestructive testing. Label-free diagnosis of malignant tumours has been obtained and also achieved significant development in THz biomedical imaging. This review mainly presents the research status and prospects of several common continuous-wave (CW) THz medical imaging systems and applications of THz medical imaging in biological tissues. Here, we first introduce the properties of THz waves and how these properties play a role in biomedical imaging. Then, we analyse both the advantages and disadvantages of the CW THz imaging methods and the progress of these methods in THz biomedical imaging in recent ten years. Finally, we summarise the obstacles in the way of the application of THz bio-imaging application technology in clinical detection, which need to be investigated and overcome in the future.
1. Introduction
Terahertz (THz) occupies a frequency range from 0.1 to 10 THz in the electromagnetic spectrum between millimeter and infrared waves, and the corresponding wavelength range is between 30 µm and 3 mm. Due to their properties, THz waves have far-reaching research value and broad application prospects in the field of biomedical imaging [1,2]. Researchers have conducted a number of studies on THz imaging of in vivo biological tissues, including brain tumours, teeth, bone density testing, liver cancer, and burnt skin tissues [3]. The rapid development of THz imaging technology in biomedical applications is mainly due to four excellent properties. Firstly, THz waves have stronger penetrating ability than visible and infrared radiation, so that they can achieve perspective imaging for many opaque non-polar substances [4], such as ceramics, paper, wood, plastics, and non-polar liquids. THz imaging and detection technology is mostly used for the epidermis of tissues and some organs. It can also penetrate the epidermis of animals to the depth of hundreds of microns to image superficial tissues in vivo. THz imaging can serve as a novel technique that complements conventional medical imaging modalities, such as magnetic resonance imaging and X-ray imaging. Secondly, THz radiation has nondestructive properties [5] because their energy is one millionth of the X-ray wave energy, making them suitable for the live detection of human and other organisms without ionising their component elements and breaking their structure. Thirdly, the vibrational and rotational energy levels of most biological macromolecules are located at the bandgap of THz, and every molecule has its own unique signature and fingerprint spectrum [6], allowing researchers to identify molecular structures and analyse substance components. Lastly, THz radiation have a strong absorption effect with water [7], which can be used to distinguish cancer tissues from normal tissues based on the difference of their water content.
According to different detection and signal processing methods, THz detection technology can be divided into spectral detection technology and imaging technology. The principle of THz spectrum detection technology is that the spectrum of most low-frequency biomolecule motion (such as hydrogen bonds, molecular vibration and rotation, and van der Waals force) and the biomolecules have their own unique THz fingerprint spectrum characteristics so that researchers can identify biomolecular samples by analysing the difference of the absorption coefficient or reflection coefficient [6]. The THz Time Domain Spectroscopy (THz-TDS) system can distinguish diseased and normal tissues by analysing the peaks, troughs, absorption spectra, and specific principal component information of the time domain signal. THz-TDS has been widely studied with macromolecules, cells, cancer tissues and other biological structures [8,9,10,11]. However, the THz-TDS detection area is associated with the size of the radiation spot, and the tissues are not completely uniform, which often affects the accuracy of the detection outcomes in clinical medicine. In contrast, CW THz imaging technology can be more accurate and visualised to identify the difference between lesions and normal tissues. Therefore, THz imaging for biological tissues samples detection has more advantages.
Increased attention has been paid by researchers to THz biomedical imaging in recent years. The key application of THz imaging technology in the field of biomedicine is to extract information such as the absorption or refractive index distribution and morphological characteristics of biological samples from the THz intensity and phase images. In 1995, Hu and Nuss demonstrated the first THz imaging system and successfully imaged a chip and leaf by transmission single-point scanning imaging [12]. According to the difference of the working mode of the THz sources, the THz imaging technology is divided into terahertz pulsed imaging (TPI) and continuous-wave (CW THz) THz imaging. The photoconductive method and the optical rectification method are commonly used to generate THz pulses in the THz-TDS systems. The photoconductive method uses high-speed photoconductor materials as the transient current source to generate THz radiation by a self-mode-locked Ti sapphire laser. The optical rectification method utilises the reverse process of the electro-optic effect of ZeTe or LiTaO3 to generate THz pulses, and the power of the radiation is related to the incident radiation power and energy conversion efficiency. The measurement of the TPI is a coherent measurement method, which can obtain both the amplitude and phase information. To detect THz waveforms with the time-domain pulse THz systems, both the electro-optic sampling method and the photoconductive antenna technology are commonly adopted. The electro-optical sampling method has a wide detected bandwidth, so it is suitable for full-field imaging [13,14]. The photoconductive receiver, by using the coherent delay scanning detection method, can obtain the real-time power of the THz waveform. This method can improve the signal-to-noise ratio (SNR) of the system, but the structures of the TPI systems are complex.
The CW THz imaging systems work in a narrow frequency band and utilise the scattering effect of the THz wave on the edge of the internal defect of the samples by detecting the distribution of the intensity of the scattering effect. The average output power of CW THz is higher than that of the THz pulse sources, although the peak output of the pulse sources can be higher than 14 mW [8]. Furthermore, the geometry of the CW THz imaging systems is compact and real time without additional pump optical detection elements. Due to the above advantages, the CW THz imaging technology is more suitable for biomedical detection. The CW THz sources include optically pumped THz gas lasers [15], backward-wave oscillators [16], quantum cascade lasers (QCL) [17], and Gunn diodes. The detector can be divided into point scanning and area array detection according to the working principle. The former includes the Schottky diode [18] and Golay cell [19], and the latter includes microbolometer arrays and pyroelectric cameras [20,21]. Correspondingly, the CW THz imaging technology mainly includes CW THz single-point scanning imaging, full-field imaging, and CW THz three-dimensional imaging. Each has its different imaging system and advantages that are suitable for specific application conditions. The following sections will introduce the characteristics of these methods and their developments in the biomedical field.
This paper gives an overview of the current state of CW imaging methods and applications with biomedical samples. The principle and application conditions of the CW THz point-by-point scanning imaging methods are presented in Section 2. The features and application situations of the CW THz full-field imaging methods are detailed in Section 3. The characteristics of the CW THz three-dimensional imaging methods and its biomedical applications are outlined in Section 4. In Section 5, recent research on CW THz imaging technology for various biological tissues applications is discussed. Finally, we summarise the current research status and challenge of CW imaging technology in the field of biomedical applications and offer an outlook on future development.
2. CW THz Single-Point Scanning Imaging
The modern CW THz single-point scanning imaging system has become one of the main measurement methods due to the advantage of high SNR, high spatial resolution, and the simple principle of detection in the proposed CW THz imaging methods. CW THz single-point scanning imaging geometry can be divided into transmission and reflection mode measurement.
2.1. CW-THz Transmission Single-Point Scanning Imaging
The transmission single-point scanning imaging method requires the sample to be thin with weak absorption of the THz radiation; the sample is placed at the focal position of the incident beam and then scanned pixel-by-pixel by moving it along the X-Y direction using a two-dimensional translation stage. An example of the imaging arrangement is shown in Figure 1. Since the THz beam has normal incidence on a sample, the intensity information of the other side of the sample is obtained by single-point scanning detection [22]. The spatial resolution of this scanning imaging system is defined by the size of the focal beam-spot on the sample plane. Since a leaf can be approximated as a two-dimensional thin sample, it is suitable for verifying the effectiveness of the CW THz transmission-mode single-point scanning imaging system [23,24,25,26,27,28,29,30,31].
In 2017, Qin et al. used the DET-900 GHz THz emission with a frequency of 900 GHz to scan a dry leaf point by point, and the leaf veins could also be seen clearly [28]. The transmission single-point scanning imaging system can be used to distinguish the different components in the tissues, with a beam diameter less than 6 mm. In 2017, Shi et al. used the CW THz transmission imaging system to image a fresh rat brain tissue with a thickness of 40 μm by raster scanning [31]; the THz source was a CW THz gas laser (FIRL100, Edinburgh Instruments, Edinburgh, UK) with the output frequency of 2.52 THz. The THz image size was 100 × 60 pixels with the scanning step of 250 μm. The lateral resolution of this imaging system is 260 μm. Mathematical morphology was proposed for CW THz imaging to improve the peak signal-to-noise ratio (PSNR) and suppress the complex background of the reconstructed image. The edges of the rat’s brain tissue could be clearly identified from the reconstructed image. In 2018, Yang et al. directly distinguished the bacterial colonies of four bacterial species by using the transmission single-point scanning imaging system [32]. The source was an optically pumped CW THz gas laser (FIRL100, Edinburgh Instruments Ltd., Livingston, UK). The THz frequency was fixed at 2.52 THz with an output power of 40 mW. Golay cells (GC-1P, Tydex Ltd., St. Petersburg, Russia) were used as the detectors. The difference of THz absorption could be observed in the THz image, and each colony of the four bacteria could be directly distinguished.
Confocal CW THz microscope imaging is extensively studied in order to improve the resolution and SNR of the system. The principle of the optical confocal microscope is that the positions of the pinholes in front of both the sample and the detector are mutually conjugated. The first pinhole filters out scattered light emerging from the laser. The second pinhole in front of the sample under investigation, and the last pinhole in front of the detector, filter out the central region of the image, eliminating the corrupted light scattered by the sample. Stray light can be filtered out by the confocal pinhole in front of the detector, and submillimeter resolution can be obtained, while the resolution of the imaging system is determined by the size of the scanning spot at the front of the sample [33].
In 2010, Salhi et al. designed the first confocal CW THz microscope scanning imaging system based on a far far-infrared gas laser at a frequency of 2.52 THz and a Golay cell detector [23]. The THz radiation passed through a pinhole with a diameter of 1 mm and imaged a single point of the sample onto the focus plane. The size of the pinhole located in front of the detector was 0.5 mm, and it was used to produce additional spatial filtering, which might lead to a better resolution of 0.46 mm, while the resolution along the optical axis of the imaging system was 0.4 mm. A fresh leaf was selected to test the spatial resolution. The veins in the leaf had low transmissivity to the THz radiation and were represented as dark regions in the THz image. The results revealed minute details of the leaf vein structure with a submillimeter resolution.
In 2012, Cumis et al. designed a confocal microscopic imaging system based on a 2.9 THz QCL [25]. The size of the first pinhole was 200 μm as a spatial filter to obtain the point source, and the size of the pinhole was 300 μm in front of the detector. Lateral and axial resolutions of 70 μm and 400 μm were detected. The size of the focus beam spot was 132 μm by using the scanning knife-edge method. A fresh leaf was imaged at a step of 50 μm within the selected local detection area of 200 × 200 pixels. In 2014, Zhang et al. performed transmission single-point confocal imaging with dried spiders and ants at 2.52 THz [34], the CW THz experiment setup used the SIFIR 50 THz laser and emitted 2.52 THz with average output power was above 50 mW. The scanning step was 0.1 mm, and the spatial resolution was 145 μm. In 2012, Kim et al. used a horn antenna to replace the pinhole in front of the sample [35] and improved the resolution by increasing the transmission power. CW radiation at 0.2 THz was generated by the Gunn oscillator, and a Schottky diode as detector was used to scan red ginseng point by point, obtaining a THz image with a resolution of 500 μm.
Although the transmission mode imaging system has high resolution and good contrast, it is more restricted with fresh biological samples of moderate absorption, which is caused by the THz radiation being strongly absorbed by water. Unfortunately, the preparation of thin specimens with exact thicknesses is difficult. So, the reflection mode imaging is more common for biological tissues of strongly absorbing or scattering samples.
2.2. CW THz Reflection Single-Point Scanning Imaging
The high sensitivity of THz waves to water content in fresh tissues often makes reflection mode imaging more suitable. The CW THz reflection single-point scanning imaging optical geometries are generally set into two types [36,37,38,39,40,41,42]. The incident beam and the reflected beam are set with a certain angle of the first type as shown in Figure 2a. The sample is illuminated by THz radiation through normal incidence and detected by the Golay cell detector of the second type, as shown in Figure 2b. For the oblique imaging system in Figure 2a, the shape of the focal spot was elliptic. The two off-axis parabolic mirrors would be binding effects mutually due to the intersection angle between the optic axis of the illumination and the optic axis of the collection, which evidently decreased the focal spot on the surface of the sample than the normal incidence reflector imaging device. Thus, the oblique illumination imaging system will acquire higher spatial and axial resolution than the normal incidence system. When the THz beams under the same output power irradiated the thicker samples, the penetration depth of the sample under the oblique incidence mode was less than that under the normal incidence mode. For the normal incidence mode in Figure 2b, the intensity of the beam was attenuated about 50% after the incident beam passed through the beam splitter, and the one part that continued along its path was illuminated on the surface of the sample and aborted by the sample; then, the reflected beam carrying the information of the sample was received by the detector after passing through the same beam splitter again. The intensity would be lost about 50% again, so the efficiency for the intensity of the beam utilisation ratio for the normal incidence reflector imaging setup was very low. The sample is placed on a quartz slide to increase the intensity of the reflected beam, and it could more effectively avoid the interference of other experimental conditions except for the sample in the detection plane. Another slide of the same type is placed on top of the sample to put pressure on the sample and keep its surface flat [22]. The sample is located at the focal plane. In order to avoid errors of non-uniformity caused by the reflection window, the image without the sample as the background image is recorded first.
In 2014, Gyeongsik et al. design a CW THz reflective high-speed point by point scanning imaging system with the frequency of 0.21 THz and a Schottky diode detector [36]. The high scan speed was 15 s/frame and was improved by an aspheric f-theta scanning lens, the scan area was 100 × 150 mm, and the spatial resolution was nearly 4 mm. Peanut shells were used as samples to demonstrate this THz imaging system for food quality inspection. The THz images showed that all the peanuts in their shells could be clearly identified. In 2015, Sung et al. obtained the reflectivity maps of the central corneal thickness of rabbits in vivo based on the amplifier–multiplier chain (Virginia Diodes, Charlottesville, VA, USA) at 650 GHz [37]. The curved surface of the cornea was scanned at normal incidence. The intensity image could measure the change of water content in the corneal tissue, thus predicting many pathologies. In 2020, Wang et al. performed the THz reflection imaging of an ex vivo rat brain tissue sliced into frozen sections of 10 µm [39]. The THz source was a CW THz laser (Edinburgh Instruments, FIRL100). The scanning area of the sample was 51 × 59 pixels, the scanning speed was 13 pixels/s, and the scanning step was 250 μm. The reflected information was collected by the Golay cell detector (TYDEX, GC-1P). The THz images showed that a tumour could be accurately distinguished from normal tissue and background.
The biggest advantage of the reflection imaging method is that it is more suitable for the actual preparation of biological samples, but the SNR and imaging contrast are lower than the transmission measurement. Therefore, both transmission and reflection measurement possess their own advantages and are complementary with each other. The appropriate imaging method should be chosen according to the characteristics of the tested sample and experimental conditions.
2.3. CW-THz Polarisation Single-Point Scanning Imaging
Similar to the amplitude detection, high-performance and active polarisation detection can be realised with the polarisers. The polarisation of the beam will affect the imaging results of the detected samples. When the line polarised beam is incident on the sample, the two images can be obtained by co- and cross-polarised detection, and the scattering information of the surface of the tissue can be obtained by subtraction. Since the Fresnel signal comes from the interface plane between the glass and air with ordinary reflective single-point scanning imaging geometry, the cross-polarised detection can avoid the above situation.
In 2013, Doradla et al. proposed a reflective CW-THz single-point scanning imaging system to acquire images of ex vivo fresh human colonic with a spatial resolution of 0.6 mm and 5 mm thick colorectal tissues sections, the schematic of which is depicted in Figure 3. A CO2 optically pumped far-infrared gas laser operating at 584 GHz (513 μm) was used as the THz laser, and a liquid helium-cooled silicon bolometer was used as the detector. The reflectivity of the cancerous region of colon tissue was significantly different from that of the normal tissue shown in the THz images [41]. The cross-polarised (CRP) reflective THz imaging system was able to show a good contrast between normal and cancerous colon tissue and eliminate the interference caused by specular reflections. In 2014, Joseph et al. promoted reflective polarised single-point scanning imaging geometry based on the same THz laser and the detector [40]. Rotating the polariser located before the sample by 90° could obtain CRP images. The results correctly showed the CRP THz intensity images of the location of the non-melanoma skin cancer tissues. The CRP and co-polarised (COP) images could be subtracted to show the morphological characteristics of the tissue. The full width at half max was 0.67 mm at the sample surface.
They further modified a CW THz circular polarisation-sensitive detection technique for the edge of a tumour in 2016, adding a quarter-wave plate (QWP) to the original linear polarisation-sensitive detection system before the sample at 584 GHz [42]. Fresh ex vivo human non-melanoma skin cancer sections with 5 μm thickness were imaged to demonstrate the ability of the system. The scanning speed was 100 ms/point. The sample was illuminated respectively with linearly or circularly polarised THz radiation and collected by the system in the cross- and co-polarisation states. The schematic is shown in Figure 4. The beam waist of the sample surface was 0.42 mm and 0.45 mm in the incident linearly polarised (LP) and circularly polarised (CP) cases, respectively. Both the CRP LP and COP CP THz reflection images contained no Fresnel reflections from the glass–air interface; the information mainly came from the sample. The intensity of the CRP LP images was higher than in the COP CP images for the reason that the CRP CP THz radiation penetrated the tissue more deeply than the CRP LP THz radiation, and the attenuation of the reflected signal obtained after CRP CP THz radiation illuminated the sample was greater than that used by CRP LP THz radiation.
2.4. CW THz Attenuated Total Reflection Imaging
CW THz reflection imaging systems often use a quartz plate or poly acrylic window to eliminate the inhomogeneity of the sample, which is inevitable for the sample surface. By contrast, CW THz attenuation total reflection (CW THz-ATR) imaging geometry is adjusted to the image for liquid, powder, or thin film samples without further preparation. Additionally, it can obtain the exact absorption distribution of the sample [43]. The samples are directly deposited on top of a prism. If the incident THz beam on the top surface of the prism has a higher refractive index n1 and the surface of the sample has a lower refractive index n2, then the refraction angle will exceed the incident angle θc (θc = arcsin (n2/n1)). When the incident angle increases to a certain degree, the refraction angle becomes 90°, and ATR occurs [44]. At this time, not all of the THz beam returns from the surface of the prism, but it transmits into a depth of wavelength magnitude and is absorbed by the sample along the interface, and then shot out from the prism along the direction of the reflected beam. ATR mode of biological samples is working close to the critical condition when transmitted mode can take place since the angle of incidence is usually 45 degrees. If refractive index of the sample is larger than 1.5 (very probable), ATR is not working [43]. This method can be used to rapidly and sensitively detect highly absorbable solid or liquid samples on the top of the ATR prism, and especially the surface information of the samples can be acquired without complex preparation.
In 2017, Liu et al. achieved CW THz-ATR imaging with an FIRL 100 laser with an output frequency of 2.52 THz and a Golay cell detector [45], where the sample was a porcine tissue on top of the fixed prism. The scanning step was 200 µm, and the resolution of this system was 578 µm. Figure 5 shows the CW THz-ATR imaging setup. The results showed that lean and adipose tissues could be clearly distinguished. The intensity attenuation of the lean portion was more than twice that of the adipose parts, which demonstrated that different parts of the tissue can be accurately identified by this proposed THz-ATR imaging method for biological tissues.
2.5. CW-THz Near-Field Microscopy Imaging
The THz far-field lateral resolution is limited by the wavelength, but the near-field microscopy system can achieve more detailed information at a small distance (<lambda), which allows it to overcome the Abbe diffraction limit. In general, near-field microscopy imaging achieves sub-wavelength resolution at 10−2λ–10−3λ, such that CW-THz near-field microscopy imaging will be a potentially useful tool for contactless biological tissue testing [46,47].
In 2013, Chen et al. completed a THz fiber-scanning near-field imaging system based on a Gunn oscillator at the frequency at 300 GHz as the source and a Schottky diode as the detector [48]. The THz beam was focused into a polyethylene fibre with a diameter of 240 µm. A bull’s-eye metallic spatial filter was integrated behind the fibre to improve the spatial resolution of 240 µm (<λ/4) [49]. The scanning area was 10 × 10 mm with a scanning speed of 100 pixel/min, and the time consumed was 30 min. According to the absorption distribution from the THz images, human liver cancer tissue and normal tissue were clearly identified and matched the investigation by pathological H&E staining inspection. At the same time, the group found that not all the THz images of the tissues could be matched with the pathological micrographs through the features of size and shape. This was because the fatty tissue was easily washed out by acetone during the H&E staining process, which caused the sample to be deformed or even lost.
In order to break through the diffraction limit and achieve super-resolution imaging, it is necessary to record the evanescent signal within the sample surface (<λ). Therefore, the working distance between the sample and the detector should be very close to satisfy the requirements for near-field detection. THz waveguides are a good choice for near-field imaging, not only improving the resolution of the reconstructed image but also providing low dispersion and low propagation loss in the THz message transmitting process.
In 2015, Tseng et al. imaged the in vivo vessel inside the ears of mice by adopting wave-guided illumination and near-field scanning measurement based on a 340 GHz Gunn oscillator and a Schottky diode detector [50], the setup of which is shown in Figure 6. A rectangular metal waveguide with an aperture of 0.7 mm and length of 10 mm was used [51,52]. The scanning step was 0.1 mm, and it took about 8 min to scan the 8 × 8 mm image. The distance between the detector and skin surface was less than 0.2 mm (<λ/4). The blood vessels could be clearly distinguished from the THz images with a lateral resolution of 0.5 mm (<2/3λ). This system could monitor the quantitative changes of the absorption coefficient of blood and then detect the long-term changes of the physiological characteristics of blood in the body.
The geometry of the CW THz near-field imaging system is complex. The transmission power through the sub-wavelength aperture suffers greatly from attenuation, so it needs a high sensitivity detector with single-point scanning measurement. One of the disadvantages of this system is the transmission power attenuation.
Another way to improve the resolution is the CW THz solid immersion (SI) microscopy imaging method. In 2018, Chernomyrdin et al. developed CW-THz solid immersion (SI) microscopy reflection imaging with a spatial resolution of 0.15 λ [53,54]. It is based on a 0.5 THz BWO source and a Golay cell detector. The system is composed of a large numerical aperture through an aspheric lens consisting of a high-density polyethylene (nHDPE ≃ 1.54) and a truncated sphere made of high-resistivity float-zone silicon (nHRFZ-Si ≃ 3.415). The THz images areas was 4 mm × 4 mm of a leaf. The resolution depended on the size of the focused THz beam spot, and it broke the Abbe diffraction limit. The sub-wavelength structural information in the tissues was clearly viewed from the THz images, such as veins. The THz intensity of the leaf veins was greater than the surrounding area, which may be related to the difference in water content, density, and tissue structure.
2.6. CW-THz Single-Point Phase Contrast Imaging
The amplitude images can distinguish the area of the diseased tissue from the normal tissue, but it cannot obtain the information of the thickness and refractive index of the diseased tissue. This information can be interpreted through phase contrast imaging. CW THz single-point phase contrast imaging includes self-mixing detection and heterodyne detection [24,55]. The electro-optic modulator generates the THz beam and detects the THz signal reflected from the sample surface, the THz detector uses a self-mixer on the receiver side and then transmits signals along the opposite direction of the external cavity module of the laser to the output port of the THz laser, where the self-mixing effect occurs in the cavity of the laser.
In 2014, Lim et al. reported a CW-THz coherent imaging system based on the 2.59 THz QCL and self-coherent detector as shown in Figure 6. Using this system to image pork tissues consisting of muscle, fat, and skin, the amplitude and phase of the reflected signals can be obtained at the same time [56]. The penetration depth of this system exceeding 100 µm is suitable for the detection of sub-surface features of skin tissues. In 2017, Song et al. developed a self-mixing detection technology at 323 GHz to achieve CW THz single-point phase contrast imaging, which they performed on a slice of bacon [55], and the schematic diagram of the self-mixing coherent imaging is shown in Figure 7. The phase contrast image showed the fatty and lean portions in the bacon slice. The different parts were observed clearly from the phase image due to their different reflectivity to THz waves. This phase contrast imaging system can also avoid instability of the geometric structure through the interference of two beams.
Another single-point phase contrast imaging method is based on THz heterodyne detection. By mixing the radiofrequency signals with the low-noise local oscillator signals, the measured signal can be converted into an intermediate frequency signal of microwave radio frequency and can then be detected by a heterodyne detector. In 2011, Lisauskas et al. studied a CW THz single-point scanning phase contrast imaging system based on the frequency of 0.6 THz and a CMOS THz raster scanning heterodyne mixer detector instead of a Schottky diode. The THz beam diameter was 30 mm [24]. The system scanned 1000 points on a freshly cut leaf, each point required 30 ms, and the scanning speed was 30 frames/s.
CW THz single-point scanning imaging can obtain high-quality THz images, but the temporal and spatial resolution of the imaging system are limited by the size of the scanning step and scanning speed. In addition, the mechanical errors caused by the translation platform in the scanning process will indirectly affect the imaging quality. With the increasing sensitivity of focal-plane array detectors, the full-field detection technology not only realises real-time imaging but also improves the imaging spatial resolution.
3. CW THz Full-Field Imaging
Since the CW THz full-field imaging approaches require fewer optical components compared to THz scanning ones, image acquisition will be faster, and it has been developed into another coherent imaging technique of choice in biology. Employing array detectors to realise a higher speed of data collection, CW THz digital holography (CW TDH) and CW THz ptychography are being developed.
3.1. CW THz Full-Field Amplitude Imaging
In 2017, Wen et al. achieved full-field THz imaging based on a self-developed uncooled supramolecular array detector (128 × 128 pixels) for fresh spiders and dehydrated mint leaves [57]. The main and branch vein of the leaf could be clearly identified from the THz images. The fresh spider sample had a higher water content, so the THz radiation could not penetrate it completely, but the image showed some detailed features clearly, including its eight legs and tail. In 2019, Zhang et al. presented a THz transmission amplitude imaging setup based on a microresonator frequency comb (microcomb) with a frequency of 331 GHz and a THz focus-plane array camera (32 × 32 pixels) [58]. Two peanuts were placed ≈135 mm away from the detector with a spatial resolution of 1.5 mm. The two peanuts had different structures, one shell containing two nuts and the other containing one nut. The THz images showed that the intensity distribution was lower, which was caused by the fresh nuts having strong absorption of THz radiation.
3.2. CW THz Digital Holography
Continuous-wave THz digital holography (CW TDH) is an essential full-field, real-time two-dimensional quantitative phase contrast imaging approach, which has the advantage of high spatial resolution. It can obtain the distributions of amplitude and phase without scanning. By recording the diffraction field information of the object or the interferometric pattern formed by the object and the reference beam, the amplitude and phase information of the wavefront of the object are then reconstructed by the digital numerical calculation [59]. The TDH scheme can be divided into in-line and off-axis TDH according to the angle between the reference and object beam in the detecting plane [60,61].
In 2014, Rong et al. investigated an in-line CW TDH based on a 2.52 THz FIRL 100 and pyroelectric (PY-III) array detector, as shown in Figure 8 [62], which eliminated the twin images through the iterative phase retrieval and reconstructed the amplitude and phase images of a dragonfly’s rear wing by recording a single hologram. In addition, the high-frequency information was obtained by the extrapolation of holograms, and the cross veins of width 35 μm could be observed in the reconstructed THz image. In 2016, Huang et al. used a QCL source and a microcalorimeter detector to form an in-line CW TDH arrangement [63]. The synthetic aperture method was adopted to expand the size of the hologram from 320 × 240 pixels to 660 × 580 pixels, corresponding to improving the resolution from ≈253 to 125 μm, and the recording distance and the wavelength respectively were 14.75 mm and 97 μm. The subpixel image registration algorithms could reduce the subpixel displacement error of the sub-holograms before the synthetic process. Finally, the phase retrieval method was used to reconstruct the distribution of the amplitude and phase of the sample. The basic outline of the dehydrated mosquito could be observed in the reconstructed images. In 2019, Li et al. further modified the in-line CW THD system based on a 4.3 THz QCL and a microbolometer detector [64,65]. Both the synthetic aperture algorithm and shortening the distance together can improve the resolution. The autofocus algorithm was used to find the most accurate recording distance, and a sparsity-based phase retrieval algorithm could solve the twin-imaging problem. The lateral resolution of the reconstructed intensity image was up to 70 μm at the shortest recording distance of ≈13.5 mm. The phase contrast images of a cicada’s wing, a beetle’s leg, and a spider were all high-quality reconstructions.
Although the geometry of the in-line CW TDH is simple, shortening the recording distance can enhance the resolution, but the problem of twin-image caused by the propagation of the object and reference beams in the common path can be eliminated only by a phase retrieval algorithm or the phase-shifting method [66], which waste more time during the numerical reconstruction. The size of the object must be smaller than the incident beam to adopt such a scheme, or it should present a weak absorption distribution of THz. To overcome the above problems, an independent reference beam is introduced by the THz beam splitter, where the interference between it and the object beam form an off-axis hologram. The off-axis TDH allows relatively easy reconstruction of a complex amplitude wavefront distribution of the sample in real time. The off-axis scheme not only has no limitation on the size of the tested object, but it can also carry out reflection mode imaging and obtain the complex amplitude wavefront distribution. In 2015, Locatelli et al. determined an off-axis CW TDH imaging device based on a Mach-Zender interferometer [67]. The imaging system is shown in Figure 9. The system adopted a 2.8 THz QCL (power: 4 mW, operating temperature: ≈ 20 K), and recorded holograms by micro-bolometer focal plane arrays of 640 × 480 pixels. The laser beam was divided into two beams of comparable intensities: the so-called object beam, which was directed toward the sample, and the reference beam, which was directed toward the camera. The system enabled real-time imaging with human healthy skin tissue sections. The resolution of the imaging system was 0.2 mm at the distance of 20 mm. The epidermis and dermis skin tissues could be distinguished from the amplitude image, and the difference of the optical path length at different positions of the tissue could be obtained from the phase information. In 2018, Huang et al. presented and investigated the off-axis CW TDH based on the 2.52 THz FIRL 100 and a Pyrocam III (240 × 240 pixels) detector to image an asparagus fern [68]. The autofocus algorithm was used to find the amplitude reconstruction distance of 51.52 mm, and the phase reconstruction distance was 52.29 mm. The outline of the plant and the water content distribution could be clearly seen from the amplitude images. The profile characteristics and relative optical thickness distribution of the asparagus fern were obtained by unwrapped phase images.
Gabor in-line CW TDH suffers from the inherent twin-image superposition, and the off-axis holographic schemes are easily affected by the surrounding mechanical vibration and air flow, which are usually based on the Mach–Zehnder interferometer. Therefore, compared with this traditional configuration, the common-path CW TDH has the advantages of simple and compact configuration as well as high stability. The common-path interferometric geometry offers two interfering beams generated after passing through the object, both of which then follow nearly the same optical path. In 2020, Wang et al. realised a CW THz self-referencing full-field phase imaging approach based on Fresnel’s mirrors showed in Figure 10 [69]. The wavefront downstream from the object was split by the Fresnel’s mirrors, which were composed of two independently tip-tilt controlled square mirrors. An off-axis hologram was recorded by interference between the wave scattered by the object and the unscattered reference beam. Cicada wings were measured to demonstrate its capability. The complex amplitude distribution was reconstructed through a spectrum filtering, angular spectrum integral, and phase unwrapping algorithm successively. The fifth meridian’s R5 optical thickness of 9.2 μm was calculated through the relationship formula between the phase and the optical path difference.
3.3. CW THz Ptychography Imaging
Although the advantages of the digital holographic imaging are full-field and real time while the field-of-view (FOV) is limited by the size of the illumination beam. CW THz ptychography is a lensless coherent diffraction large field-of-view phase contrast imaging method, which can retrieve the complex amplitude distribution of the sample robustly from a set of diffraction patterns originating from overlapping sample illumination areas. Both the probe function and the complex transmittance function of the sample can be retrieved respectively by the extended ptychographical iterative engine (ePIE) algorithm without a reference beam. However, the long acquisition time of the ptychography imaging method limits its wide use.
In 2019, Rong et al. applied a CW THz ptychography imaging system consisting of an FIRL 295 at 2.52 THz and a pyrocam III detector to image the forewing of cicadas, as shown in Figure 11 [70]. The reconstruction quality was seriously affected by the incorrect probe position during the process of recording the diffraction information. The translation error was minimised to 0.01 pixel by a probe position correction method based on cross-correlation registration on overlapped regions of the object wavefront. It was easy to distinguish between the subcostal and the first radius vein by correction. The optical thickness of the fourth meridian R4 measured was 9.30 μm, which was in good agreement with the results measured by the self-referencing common-path CW TDH method in the previous section.
4. CW THz Tomography Imaging
The idea of CW THz tomography imaging comes from the X-ray computed tomography (CT). CW THz computed tomography (THz-CT) is another interesting approach for three-dimensional (3D) THz imaging. The penetrability in THz radiation is poorer than X-ray, which provides a better contrast for biological soft tissue imaging. The internal structure of samples can be reflected more accurately, giving comprehensive three-dimensional information of biological tissues. THz-CT is a non-destructive detection method [71]. It detects the one-dimensional Fourier transform of the incident beam or scattering field at different projection angles and then calculates the one-dimensional Fourier transform of the projection of each angle. Finally, these data are combined to construct the two-dimensional Fourier transform of the cross-sectional image of the object. The commonly used data processing method is the filter back projection (FBP) algorithm.
In 2014, Kashiwagi et al. described a THz-CT imaging system based on an IJJ-THz emitter at 440 GHz and a bolometer detector as shown in Figure 12 [72]. The emitted beam was converted to the parallel beam by the first off-axis parabolic mirror, PM1; then, it is focused on the object plane by the second off-axis parabolic mirror, PM2. The sample was a dried pea containing three seeds. The object was placed on the turntable and rotated 360° with a rotating speed of 10 mm/s. The scanning time was 10 min. The typical heart of a pea was seen to be made up of three ventricles, each of them with a thin-wall compose of triangular endothelium, and all of them pressed together. Three round seeds in the different ventricles were also visible at the bottom of the pea.
5. The Application of CW Imaging with Biological Tissues
Cancer is one of the most common fatal diseases in both developed and developing countries. The incidence and mortality of cancer are still rising all over the world [73]. Most cancers have no specific clinical manifestations in the early stages, but the difference between cancer tissues and normal tissues can be observed through various imaging methods. THz radiation is non-ionising, which is safe for biomedical samples. Recently, THz imaging technology has made some progress in identifying the intrinsic characteristics of cancer tissue samples. As a result of the abundant blood vessels or tissues oedema, tumour tissues usually contain much more water than normal tissues do. Since THz is more sensitive to the absorption of water, it can distinguish cancer and normal tissues according to their water content. Furthermore, the intensity of the THz images will vary according to the changes in tissue composition, such as structural changes in the cirrhotic cells [74]. The main applications of CW imaging technology focus on animal tissues in and ex vivo, and only a small amount of research has so far focused on superficial human tissues such as skin and ex vivo breast tissues.
5.1. Tumour Tissues
When the THz beam passes through the network structure of the water molecules, the hydrogen bonds of water oscillate and excite resonance, and the dipole direction of the water molecules rotates and relaxes to form a new network structure of water molecules. Many interactions are formed between water molecules in picosecond time, so the absorption of THz radiation by water molecules is very strong [75]. Most biological tissues have high water content and strong absorption characteristics for THz radiation, depending on the tissues type and THz frequency. THz detection technology is limited to the surface features of the tissues because the depth of THz radiation penetrating tissues is limited to hundreds or even tens of microns, and the reflective measurement is more suitable for measuring hydrated ex vivo tissues compared with transmissive detection. Many in and ex vivo tissues can be THz imaged by utilising the strong interaction between THz radiation and water, such as fibrous connective tissues of the breast with about 60–75% water content [76], which have a high refractive index and absorption coefficient in the THz frequency range. Oh et al. imaged a fresh mouse brain tumour and the same tissue completely dehydrated, and they found that the refractive index and absorption coefficient of the dehydrated brain tumour diminished [77]. In recent years, many optimised methods such as paraffin embedding [78], tissue freezing [79], and glycerol [80] have been proposed to enhance the penetration depth of THz radiation with biological samples.
5.1.1. Non-Melanoma Skin Cancers
Non-melanoma skin cancers (NMSC) mainly include basal cell carcinoma (BCC, 74%), skin squamous cell carcinoma (CSCC, 23%), and other cancers, and their incidence has been an upward trend in recent years. These cancers mostly grow continuously from a single nidus, and complete surgical resection is the preferred treatment option [81]. Traditional surgery often removes excessive normal tissues or leaves behind residual tumour tissues, so the judgment of the precise boundary between the tumour and normal tissues is essential for surgery, and CW THz imaging can provide a valuable reference for the determination of surgical tumour margins. In 2011, Joseph et al. utilised two lasers at 1.39 and 1.63 THz frequencies to image ex vivo NMSC tissues by transmissive scanning imaging [82]. The NMSC tissues were soaked in pH-balanced saline in order to remain fresh for a long time. The tryptophan content increased in the cancer tissues, leading to an increase of the water content. The absorption characteristics of the THz waves by tissues at 1.4 THz depended on the water content and tryptophan, but at 1.6 THz, they related only to the water content, because the tryptophan was not significantly absorbed at 1.6 THz. The refractive index and absorption coefficient of the skin were respectively 20 mm−1 and 2500 mm−1 at 1.4 THz, and the spatial resolution was 0.39 mm. In contrast, the refractive index and absorption coefficient were respectively 18 mm−1 and 3000 mm−1 in the same condition at 1.6 THz, and the spatial resolution was 0.49 mm. In evaluating the imaging results, they found that the H&E histology results were in good agreement with the THz images, and also that the difference in transmittivity between the tumour and normal tissues was about 60%. Although CSCC only accounts for 23% in NMSC, it invades the fatty tissues under the skin and spreads to the lymph nodes or distant tissue parts. In 2014, the same research group imaged frozen CSCC tissues slices based on cross-polarised THz reflective imaging system that is shown in Figure 3 [40]. A good consistency was found between the THz images and H&E histology images. The intensity of the tumour regions was higher in the cross-polarised THz images, indicating the lack of collagen and partial structural damage in the cancerous areas. Further, they found that the THz images had a higher contrast between the tumour and normal tissues. In 2016, the same research group added a circular polariser to the THz imaging system that is shown in Figure 4 to image fresh human ex vivo NMSC by reflective single-point scanning method [42]. The refractive index changed little due to the structural damage of the tumour tissues.
5.1.2. Breast Cancer
The process of freezing or H&E staining tissue sections is time-consuming under the current pathology detection methods. During breast-conserving surgery, surgeons analyse and remove a small part of the biopsy tissues to shorten the surgery time. The THz real-time imaging technologies can win treatment time for breast cancer patients. In 2011, Chen et al. found areas in each of 46 different breast cancer specimens whose absorption coefficient was higher than 9 mm−1 based on the imaging system showed in Figure 6 [83], and the absorption coefficients of sections without breast tumours were all under 9 mm−1. Although the breast tumours could be distinguished from normal tissues using the THz imaging system, the different types of breast cancer could not be identified. In 2013, Peter et al. used the reflective THz raster scanning imaging approach on the breast cancer tissue samples with thicknesses greater than 3–5 mm [84]. They located cancerous areas in excised human breast tissue samples at 1.89 THz and obtained the absolute refractive index values of the breast cancer. In 2018, Chernomyrdin et al. distinguished the connective fibrous tissues from normal tissues of an ex vivo breast using CW THz SI microscopy [54,85]. The working principle of the imaging method has been explored in the Section 2.5. Here, the THz image clearly revealed sub-wavelength single fat cells and the ex vivo connective fibrous tissues of the breast, as shown in Figure 13. The observed contrast was caused by the water content, THz refractive index, and absorption coefficient, which were lower in the fatty cells compared to those in the dense fibrous connective tissues.
5.1.3. Brain Glioma
Brain cancers are common malignant diseases in neurosurgery, and brain glioma is the highest incidence brain cancer. The current treatment for glioma is a combination of surgical resection, radiotherapy, and chemotherapy. The effect and prognosis of the traditional treatment are not good, so the earlier the glioma is discovered, the more effective the treatment can be for the patients [86]. Correct boundary division between normal and cancerous tissues is important for surgery and the treatment of brain glioma. In 2019, Wu et al. demonstrated the reflected CW THz imaging system that showed in Figure 2a with human brain cancer tissues in and ex vivo and visualised the cancer tissue areas clearly in both fresh resected and paraffin-embedded tumour sections [87]. Then, they utilised the same system to image the frozen sections of mouse brain cancer ex vivo and found good consistency with other traditional methods, including H&E staining, computed tomography, magnetic resonance imaging, and fluorescence imaging. The difference between normal and mouse cancer brain tissues is because of the increased water content in cancer tissues, which is caused by new blood vessels, body fluids through necrotic debris, and changes of the cell density [88]. The structure of normal brain tissues is complete, regular, and orderly. On the contrary, due to the infinite growth of malignant tumour cells, the structure of brain glioma tissues becomes deformed, dense, and irregular. Single-point scanning THz imaging technology can distinguish normal brain from cancer tissues by detecting the structure and shape of the glioma, providing a new tumour detection method as the basis for clinical application of detecting brain glioma disease.
5.1.4. Human Colon Tissues
Colon cancer, with the highest incidence in the 40–50 years old age group, is a common malignant tumor of the digestive tract in the colon and often occurs at the junction of the rectum and the sigmoid colon. It is asymptomatic in the early stage, but abdominal distension and indigestion can occur in the middle and late stages [89]. In 2016, Wahaia et al. imaged human dehydrated colon tissue resections embedded in paraffin of 2 mm thickness and 0.5 mm spatial resolution, using high-resolution transmissive and reflective imaging technologies at 590 GHz [90]. The contrast of THz wave absorption between the tumour and normal tissues reached 23%, and the colon cancer tissues had higher absorption and reflectivity, which distinguished cancer tissues from normal tissues. They also used the same system to image fresh samples and reached the same delimitation conclusion, which meant that the high water content in THz images could distinguish cancer and normal tissues in both fresh and dry samples. The imaging system could also distinguish the tumour stages, such as pT3 type (underdeveloped) and pT4 type (slightly developed). Due to the thickness and unevenness of samples, extracting accurate parameters (such as absorption) from the THz images is challenging. In recent years, some optimised CW imaging systems were developed to improve the imaging accuracy, such as THz polarisation imaging technology. In 2013, Doradla et al. used an optically pumped far-infrared molecular gas laser to produce the frequency of 584 GHz, the reflective polarisation THz imaging system as shown in Figure 3, and they imaged fresh human colon sections with 4–6 mm thickness by reflective polarisation THz imaging with a 0.6 mm spatial resolution [41]. The normal and cancerous tissues have a sharp contrast in their absorption of THz waves, so the boundary of the colon tumours can be clearly identified in Figure 14. For the minimally invasive diagnosis of malignant tumor, CW imaging technology can be applied to the diagnosis and treatment methods, such as endoscopic and laparoscopic surgery. In 2016, the same group demonstrated a THz endoscopic system at 584 GHz to visualise human colon cancer tissues using the THz transmissive and reflective co- and cross-polarised imaging methods [91]. The boundary of the cancer tissues could be clearly observed from the cross-polarised THz images, paving the way for THz endoscopic system clinical applications in colon cancer detection.
5.1.5. Liver Cancer
There are no obvious symptoms in the early stage of liver cancer, and by the time the patient feels pain or obvious discomfort of the liver, the condition of the liver cancer has mostly entered into the middle or late stages. Therefore, the early detection and treatment of liver cancer are necessary for high-risk groups of liver cancer patients [92]. In 2015, Rong et al. used the in-line CW TDH method shown in Figure 8 for the first time to image frozen liver cancer tissue slices with sizes of 3.2 mm × 2.3 mm × 30 μm thick [93]. The digital photo of the sample is shown in Figure 15a. This method proposed the phase reconstruction algorithms of in-line digital holography optimised from the terms of the constraint conditions and initial value optimisation, which improved the calculation efficiency. They also used the subpixel micro-shift and extrapolation algorithms to improve the reconstruction accuracy. With the THz images, they obtained the absorption and phase contrast distribution of the tissue slices as shown in Figure 15c,d. The tissue fibrosis and the signs of cirrhosis could be clearly observed from the intensity images. The micro vessels in the tissue slices could be viewed from the phase contrast image, which indicated that more detailed tissues information was reconstructed in the THz phase distribution image, and that was of great significance for the detection and treatment of early liver cancer.
5.2. Traumatic Brain Injury of Rat
Traumatic brain injury (TBI) is defined as damage exceeding the protective ability of the brain caused by external mechanical forces, such as squeezing, falling, and exploding, with high mortality and disability rates [94]. Therefore, the diagnosis for different degrees of TBI is important for early care and clinical treatment. In 2018, Shi et al. demonstrated a transmissive THz imaging system that is shown in Figure 1 to collect the intensity information of eighty TBI sample slices of mouse by raster scanning imaging [95]. Subsequently, they proposed a machine learning method for TBI recognition and automatic evaluation as well as a feature extraction method for TBI images. Then, they established a feature database of TBI images to classify different degrees of TBI combined with a machine learning method, achieving 87.5% classification accuracy. The automatic classification and intelligent methods are significant in enabling the surgeon to distinguish different types and degrees of TBI for carrying out clinical treatment.
5.3. Bones
The skeleton of most vertebrates is composed of hard bones, which not only support and protect the vital organs in the body but also play an important role in maintaining normal life activities. The imaging principle and setup of the CW THz-CT imaging technology have been described in Section 4, and this method can be applied to 3D imaging the biological hard tissues such as teeth and bones. The effect of water absorbing the THz waves becomes less because of the low water content of hard tissues, so clear structural information of dehydrated tissue can be obtained by CW THz-CT imaging technology. In 2012, Bessou et al. used 0.3–2.75 THz to image a dry human lumbar vertebra and skull, indicating that dense bones had higher THz absorption at 110 GHz than spongy bones. THz imaging provides many similarities with real objects [96]. The THz images could easily obtain abundant information on the absorption, refractive index, and the density distribution of bone tissues.
The chicken ulna is composed of the diaphysis and proximal epiphysis. The interior proximal epiphysis mainly includes spongy bone with a dense grid shape. From the outside to the inside of the two-dimensional cross-section view, the proximal epiphysis is respectively composed of the periosteum, compact bone, spongy bone, and bone marrow. In 2018, Li et al. combined CW THz technology with CT to image the internal structure of a dry chicken ulna; the schematic of the THz-CT imaging system is shown in Figure 12. They obtained two-dimensional cross-sectional images with different diameters of five positions of the sample [97]. The backward-wave oscillators and a Golay cell detector were utilised to build the imaging system. Furthermore, they used the filtered back projection (FBP) algorithm to reconstruct the two-dimensional cross-sectional images of the samples. Position I and position II were located in the backbone of the chicken ulna, as shown in Figure 16a. There was an irregular pattern of light and shade in the central part of the cross-sectional THz images, as shown in Figure 16c,e, because the liquid bone marrow and spongy bone marrow in the marrow cavity had different absorption coefficients for THz radiation in dry samples. The reconstructed cross-sectional images and the change of absorption coefficient from position I to position V indicated that the closer to the proximal epiphyseal bone, the smaller the marrow cavity.
A brief overview of the data is given in Table 1. It shows the CW THz imaging studies with biomedical samples that have been conducted in the last 10 years.
6. Conclusions and Perspectives
This paper mainly reviews the methods of CW THz imaging as applied in biological imaging in recent research. We first introduce the characteristics of THz radiation, which can be used in biomedical detection. Compared with the TPI system, the geometry of the CW THz imaging system is simpler and more stable, and most such systems enable real-time detection at room temperature. The size of the optical elements in the imaging system will make it easier to achieve the development of miniaturisation and portability in the future. Secondly, we introduce many methods of CW THz single-point amplitude imaging, including full-field imaging and three-dimensional imaging. The CW THz transmission and reflection single-point scanning imaging systems are the most frequently used amplitude imaging method according to an analysis of various imaging systems. The internal structure of tissues can be accurately distinguished by measuring the distribution of the absorption and reflectivity in the THz radiation. Most of the information on the biological tissue obtained by CW THz phase contrast imaging and CW THz-CT imaging, such as the refractive index and thickness information of the tissue, can be converted into the complex refractive index, and all of this information contributes to the diagnosis of early-stage cancer. Sub-wavelength imaging resolution can be obtained by the imaging method of CW THz confocal scanning microscopy and near-field microscopy. CW THz differential detection can improve the SNR of reconstructed imaging, while polarisation THz imaging obtains accurate amplitude images of the samples without the strong Fresnel reflections from the sample–holder interfaces. The algorithms of the extrapolation, sub-pixel matching, and synthetic aperture are all used to enlarge the size of the detector to improve the resolution of the reconstructed images. Finally, the status of these imaging methods in biomedical sample detection is introduced. Based on all these imaging methods, the CW THz full-field phase contrast imaging and 3D imaging should be further explored. The former can not only realize the real-time imaging but also calculate the refractive index distribution of the measured object through the phase information. This has a very great significance for recognizing the structure and properties of some biological slices. The 3D imaging can observe the defects and injuries of the internal structure of biological tissues. This intuitive imaging method can be helpful to doctors to make a more accurate clinical diagnosis.
Fresh biological samples retain the water content in tissues, but THz radiation is sensitive to water content, which has both pros and cons for experimental research. On the one hand, the water content enables the distinction between cancerous and normal tissues in the THz images. On the other hand, the detection results are affected by the distribution of the THz absorption by the water, which may be high enough to limit the THz penetration of the tissues. In this case, sample pretreatment such as freezing, formalin fixation, paraffin embedding, etc. may be helpful. In addition, if the thermal radiation effect of a sample is detected for too long in transmissive imaging, the soft tissue structure will be broken due to the strong THz radiation absorption by water. It is necessary to ensure the fixation of tissues with the above methods or use reflective imaging and THz-ATR imaging.
A biopsy is a common method to diagnose tumours, but it is tedious and time-consuming as well as traumatising for the boundary of the tumour area. In addition, while X-ray CT imaging and magnetic resonance imaging (MRI) are also available for tumour diseases, the patient needs to be subjected to higher radiation doses. Therefore, because THz imaging has the advantages of a short imaging time, free labelling, and smaller radiation doses for patients, it has become a significant research topic in recent years. THz imaging allows the accurate distinction of tumours and normal tissue, but few studies have been able to illuminate the mechanism that causes this contrast. The fact of the high absorption of THz radiation by water contained in the organism is a crucial reason for the low penetration depth of THz waves. Therefore, the non-invasive feature of THz radiation can only be used for in vivo imaging except in the case of skin cancer. Currently, H&E-stained histology is used to determine the area of tumour resection, but it is time-consuming. So, sometimes, tissue freezing is used for ex vivo THz measurements, but this method sometimes leads to destruction of the tissue structure. Thus, THz imaging technologies applied in biomedicine still face the following challenges, which impede their clinical application.
- (1)
- The lack of high sensitivity, large dynamic range, and large number of pixels challenge the development of THz array detectors for the observation and recording of biological samples in real-time.
- (2)
- The lack of multiple and flexible THz beam shaping devices to achieve diffraction-limited spatial resolution and high-quality THz images.
- (3)
- The lack of THz waveguides for lossless transmission to access tissues.
- (4)
- The lack of an effective method to sustain the activity of tissue samples for a long time through THz imaging acquisition.
THz imaging technology is an interdisciplinary research field at an early stage. Many of the imaging systems described in this article rely on the performance of the high-performance THz source, detector and imaging system. Biological tissue measurements based on modern THz instruments and methods require the cooperation of physicists, engineers, and medical personnel to be developed in the future.
Author Contributions
L.R., Y.Z. (Yaya Zhang), B.H. and S.W. searched and classified the literature; L.R., Y.Z. (Yaya Zhang), B.H., S.W., Y.Z. (Yating Zhang) and C.W. wrote the manuscript; L.R., D.W. and Y.Z. (Yongchang Zheng) applied for the funding and managed the project. All authors have read and agreed to the published version of the manuscript.
Funding
This research was funded by the National Natural Science Foundation of China (62075001&61675010), Science Foundation of Education Commission of Beijing (KZ202010005008), and Beijing Nova Program (XX2018072), and WBE Liver Fibrosis Foundation (CFHPC 2020021), and Beijing Dongcheng District Outstanding Talent Funding Project (2019DCT-M-03).
Acknowledgments
This work was supported by the National Natural Science Foundation of China (62075001&61675010), Science Foundation of Education Commission of Beijing (KZ202010005008), and Beijing Nova Program (XX2018072), and WBE Liver Fibrosis Foundation (CFHPC 2020021), and Beijing Dongcheng District Outstanding Talent Funding Project (2019DCT-M-03).
Conflicts of Interest
The authors declare no conflict of interest.
References
- Erik, B.; Heinz-Wilhelm, H.; Maurice, F. Terahertz Techniques, 1st ed.; Springer: Berlin/Heidelberg, Germany, 2012; pp. 1–28. [Google Scholar]
- Lee, Y. Principles of Terahertz Science and Technology; Springer: New York, NY, USA, 2009; pp. 1–41. [Google Scholar]
- Peralta, X.G.; Lipscomb, D.; Wilmink, G.J.; Echchgadda, I. Terahertz spectroscopy of human skin tissue models with different melanin content. Biomed. Opt. Express 2019, 10, 2942–2955. [Google Scholar] [CrossRef] [PubMed]
- Pawar, A.Y.; Sonawane, D.D.; Erande, K.B.; Derle, D.V. Terahertz technology and its applications. Drug Invent. Today 2013, 5, 157–163. [Google Scholar] [CrossRef]
- Fan, S.; He, Y.; Ung, B.; Pickwell-MacPherson, E. The growth of biomedical terahertz research. Appl. Phys. 2014, 47, 374009. [Google Scholar] [CrossRef]
- Ho, L.; Pepper, M.; Taday, P.F. Terahertz spectroscopy: Signatures and fingerprints. Nat. Photonics 2008, 2, 541–543. [Google Scholar] [CrossRef] [Green Version]
- Wang, Y.; Minamide, H.; Tang, M.; Notake, T.; Ito, H. Study of water concentration measurement in thin tissues with terahertz-wave parametric source. Opt. Express 2010, 18, 15504–15512. [Google Scholar] [CrossRef]
- Yardimci, T.; Cakmakyapan, S.; Hemmati, S.; Jarrahi, M. A High-Power Broadband Terahertz Source Enabled by Three Dimensional Light Confinement in a Plasmonic Nanocavity. Sci. Rep. 2017, 7, 4166. [Google Scholar] [CrossRef] [Green Version]
- Cheon, H.; Yang, H.J.; Lee, S.H.; Kim, Y.; Son, J.H. Terahertz molecular resonance of cancer DNA. Sci. Rep. 2016, 6, 37103. [Google Scholar] [CrossRef] [Green Version]
- Reid, C.B.; Reese, G.; Gibson, A.; Wallace, V.P. Terahertz Time-Domain Spectroscopy of Human Blood. IEEE Trans. Terahertz Sci. Technol. 2013, 3, 363–367. [Google Scholar] [CrossRef] [Green Version]
- Alibadi, A.; Macgrogan, G.; Grzyb, J.; Guillet, J.P.; Mavarani, L.; Mounaix, P.; Hillger, P.; Cassar, Q.; Zimmer, T.; Pfeiffer, U.R. Pilot study of freshly excised breast tissue response in the 300–600 GHz range. Biomed. Opt. Express 2018, 9, 2930–2942. [Google Scholar]
- Hu, B.B.; Nuss, M.C. Imaging with terahertz waves. Opt. Lett. 1995, 16, 1716–1718. [Google Scholar] [CrossRef]
- Schall, M.; Helm, H.; Keiding, S.R. Far Infrared Properties of Electro-Optic Crystals Measured by THz Time-Domain Spectroscopy. Int. J. Infrared Millim. Waves 1999, 20, 595–604. [Google Scholar] [CrossRef]
- Good, J.T.; Holland, D.B.; Finneran, I.A.; Carroll, P.B.; Kelley, M.J.; Blake, G.A. A decade-spanninghigh-resolution asynchronous optical sampling terahertz time-domain and frequency comb spectrometer. Rev. Sci. Instrum. 2015, 86, 103–107. [Google Scholar] [CrossRef] [Green Version]
- Pavlov, S.G.; HuBers, H.W.; Riemann, H.; Zhukavin, R.K.; Orlova, E.E.; Shastin, V.N. Terahertz optically pumped Si:Sb laser. J. Appl. Phys. 2002, 92, 5632–5634. [Google Scholar] [CrossRef]
- He, W.; Zhang, L.; Bowes, D.; Yin, H.; Ronald, K.; Phelps, A.D.R.; Cross, A.W. Generation of broadband terahertz radiation using a backward wave oscillator and pseudospark-sourced electron beam. Appl. Phys. Lett. 2015, 133501. [Google Scholar] [CrossRef]
- Wang, X.; Shen, C.; Jiang, T.; Zhan, Z.; Deng, Q.; Li, W.; Wu, W.; Yang, N.; Chu, W.; Duan, S. High-power terahertz quantum cascade lasers with 0.23 W in continuous wave mode. Aip. Adv. 2016, 6, 075210. [Google Scholar] [CrossRef] [Green Version]
- Maestrini, A.; Thomas, B.; Wang, H.; Jung, C.; Treuttel, J.; Jin, Y.; Chattopadhyay, G.; Mehdi, I.; Beaudin, G. Schottky diode-based terahertz frequency multipliers and mixers. C. R. Phys. 2010, 11, 480–495. [Google Scholar] [CrossRef]
- Golay Detectors. Available online: http://www.tydexoptics.com/pdf/Golay_Detectors.pdf (accessed on 25 October 2020).
- Behnken, B.N.; Karunasiri, G.; Chamberlin, D.R.; Robrish, P.R.; Faist, J. Real-time imaging using a 2.8 THz quantum cascade laser and uncooled infrared micrometer camera. Opt. Lett. 2008, 33, 440–442. [Google Scholar] [CrossRef] [Green Version]
- Ophir THz Laser Measurement Products. Available online: https://www.ophiropt.com/laser-measurement/sites/default/files/Pyrocam_1.pdf (accessed on 25 October 2020).
- Bowman, T.; Campbell, L. Terahertz transmission vs. reflection imaging and model-based characterization for excised breast carcinomas. Biomed. Opt. Express 2016, 7, 3756–3783. [Google Scholar] [CrossRef] [Green Version]
- Salhi, M.; Pupeza, I.; Koch, M. Confocal THz Laser Microscope. J. Infrared Millim. Terahertz Waves 2010, 31, 358–366. [Google Scholar] [CrossRef]
- Lisauskas, A.; Boppel, S.; Krozer, V.; Roskos, H.G. Silicon CMOS-based THz detection. In Proceedings of the 10th IEEE Conference on Sensors, Limerick, Ireland, 28–31 October 2011; pp. 55–58. [Google Scholar]
- De Cumis, U.S.; Xu, J.; Masini, L.; Degl’Innocenti, R.; Pingue, P.; Beltram, F.; Tredicucci, A.; Vitiello, M.S.; Benedetti, P.A.; Beere, H.E.; et al. Terahertz confocal microscopy with a quantum cascade laser source. Opt. Express 2012, 20, 20924–21931. [Google Scholar]
- Doradla, P.; Alavi, K.; Joseph, C.; Giles, R. Single-channel prototype terahertz endoscopic system. J. Biomed. Opt. 2014, 19, 80501. [Google Scholar] [CrossRef] [Green Version]
- Liu, Z.; Liu, L.; Yang, J.; Wu, N. A CMOS Fully Integrated 860-GHz Terahertz Sensor. IEEE Trans. Terahertz Sci. Technol. 2017, 7, 445–465. [Google Scholar] [CrossRef]
- Qin, H.; Li, X.; Sun, J.; Zhang, Z.; Sun, Y.; Yu, Y.; Li, X.; Luo., M. Detection of incoherent terahertz light using antenna-coupled high-electron-mobility field-effect transistors. Appl. Phys. Lett. 2017, 110, 171109. [Google Scholar] [CrossRef] [Green Version]
- Chen, G.; Pei, J.; Yang, F.; Zhou, X.Y.; Sun, Z.L.; Cui, T.J. Terahertz-Wave Imaging System Based on Backward Wave Oscillator. IEEE Trans. Terahertz Sci. Technol. 2012, 5, 504–512. [Google Scholar] [CrossRef]
- Wang, D.H.C.; Du, J.; Ji, F.; Li, X.D.; Zeng, D.; Smart, K. A cryogen-free HTS Josephson junction detector for terahertz imaging. Supercond. Sci. Tech. 2015, 28, 84001. [Google Scholar]
- Shi, J.; Wang, Y.; Xu, D.; Yan, C.; Chen, T.; He, Y.; Tang, L.; Nie, M.; Duan, P.; Yan, D.; et al. Terahertz Imaging Based on Morphological Reconstruction. IEEE J. Select. Topics Quantum Electron. 2017, 23, 1–7. [Google Scholar] [CrossRef]
- Yang, X.; Shi, J.; Wang, Y.; Yang, K.; Fu, W. Label-free bacterial colony detection and viability assessment by continuous-wave terahertz transmission imaging. J. Biophotonics 2018, 11, e201700386. [Google Scholar] [CrossRef]
- Panula, P.A.J. Handbook of Biological Confocal Microscopy, 2nd ed.; Springer: New York, NY, USA, 2003; pp. 228–229. [Google Scholar]
- Zhang, M.; Quan, R.; Su, H.; Hu, X. Investigation of optically pumped continuous terahertz laser in biological imaging. J. Shenzhen University Sci. Eng. 2014, 31, 160–163. [Google Scholar] [CrossRef]
- Kim, G.J.; Kim, J.I.; Jeon, S.G.; Kim, J.; Park, K.K.; Oh, C.H. Enhanced Continuous-Wave Terahertz Imaging with a Horn Antenna for Food Inspection. J. Infrared Millim. Terahertz Waves 2012, 33, 657–664. [Google Scholar] [CrossRef]
- Ok, G.; Park, K.; Kim, H.J.; Chun, H.S.; Choi, S.W. High-speed terahertz imaging toward food quality inspection. Appl. Opt. 2014, 53, 1406–1412. [Google Scholar] [CrossRef]
- Sung, S.; Garritano, J.; Bajwa, N.; Deng, S.; Taylor, Z.D. Preliminary results of non-contact THz imaging of cornea. In Proceedings of the Conference on Terahertz, RF, Millimeter, and Submillimeter-Wave Technology and Applications VIII, San Francisco, CA, USA, 10–12 February 2015; Volume 9362. [Google Scholar]
- Fucheng, Q.; Zhiyong, T.; Zhanglong, F.; Wenjian, W.; Mengqi, L.; Chang, W.; Juncheng, C. Reflective scanning imaging based on a fast terahertz photodetector. Opt. Commun. 2018, 427, 170–174. [Google Scholar]
- Wang, Y.; Sun, Z.; Xu, D.; Wu, L.; Yao, J. A hybrid method based region of interest segmentation for continuous wave terahertz imaging. J. Phys. D Appl. Phys. 2020, 53, 95403. [Google Scholar] [CrossRef]
- Joseph, C.S.; Patel, R.; Neel, V.A.; Giles, R.H.; Yaroslavsky, A.N. Imaging of ex vivo nonmelanoma skin cancers in the optical and terahertz spectral regions optical and terahertz skin cancers imaging. J. Biophotonics 2014, 7, 295–303. [Google Scholar] [CrossRef] [PubMed]
- Doradla, P.; Alavi, K.; Joseph, C.; Giles, R. Detection of colon cancer by continuous-wave terahertz polarization imaging technique. J. Biomed. Opt. 2013, 18, 0504. [Google Scholar] [CrossRef]
- Martin, J.; Joseph, C.; Giles, R. Continuous-wave circular polarization terahertz imaging. J. Biomed. Opt. 2016, 21, 070502. [Google Scholar] [CrossRef] [Green Version]
- Huang, Y.; Singh, R.; Xie, L.; Ying, Y. Attenuated Total Reflection for Terahertz Modulation, Sensing, Spectroscopy and Imaging Applications: A Review. Appl. Sci. 2020, 10, 4688. [Google Scholar] [CrossRef]
- Liu, H.; Wang, Y.; Xu, D.; Jiang, Z.; Li, J.; Wu, L.; Yan, C.; Tang, L.; He, Y.; Yan, D.; et al. Optimization for vertically scanning terahertz attenuated total reflection imaging. Opt. Express 2018, 26, 20744–20757. [Google Scholar] [CrossRef]
- Liu, H.; Wang, Y.; Xu, D.; Wu, L.; Yan, C.; Yan, D.; Tang, L.; He, Y.; Feng, H.; Yao, J. High-sensitivity attenuated total internal reflection continuous-wave terahertz imaging. J. Phys. D Appl. Phys. 2017, 50, 375103. [Google Scholar] [CrossRef]
- Born, M.; Wolf, E.; Bhatia, A.B.; Clemmow, P.C.; Gabor, D.; Stokes, A.R.; Taylor, A.M.; Wayman, P.A.; Wilcock, W.L. Interference and Diffraction with Partially Coherent Light; Cambridge University Press: Cambridge, UK, 1999; pp. 1–70. [Google Scholar]
- Adam, A.J.L. Review of Near-Field Terahertz Measurement Methods and Their Applications. J. Infrared Millim. Terahertz 2011, 32, 976–1019. [Google Scholar] [CrossRef] [Green Version]
- Chen, H.; Ma, S.H.; Yan, W.X.; Wu, X.M.; Wang, X.Z. The Diagnosis of Human Liver Cancer by using THz Fiber-Scanning Near-Field Imaging. Chin. Phy. Lett. 2013, 30, 030702. [Google Scholar] [CrossRef]
- Chen, H.; Ma, S.; Yan, W.; Wu, X.; Wang, X.C.K. All-terahertz fiber-scanning near-field microscopy. Opt. Lett. 2009, 34, 1084–1086. [Google Scholar]
- Tseng, T.F.; Yang, S.C.; Shih, Y.T.; Tsai, Y.F.; Wang, T.D.; Sun, C.K. Near-field sub-THz transmission-type image system for vessel imaging in-vivo. Opt. Express 2015, 23, 25058–25071. [Google Scholar] [CrossRef]
- McGowan, R.W.; Gallot, G.; Grischkowsky, D. Propagation of ultrawideband short pulses of terahertz radiation through submillimeter-diameter circular waveguides. Opt. Lett. 1999, 24, 1431–1433. [Google Scholar] [CrossRef]
- Rao, N. Elements of Engineering Electromagnetics, 6th ed.; Pearson Prentice Hall: Upper Saddle River, NJ, USA, 2004; pp. 527–599. [Google Scholar]
- Chernomyrdin, N.; Schadko, A.; Lebedev, S.; Tolstoguzov, V.; Kurlov, V.; Reshetov, I.; Spektor, I.; Skorobogatiy, M.; Yurchenko, S.; Zaytsev, K. Solid immersion terahertz imaging with sub-wavelength resolution. Appl. Phys. Lett. 2017, 110, 221109. [Google Scholar] [CrossRef]
- Chernomyrdin, N.; Kucheryavenko, A.; Kolontaeva, G.; Katyba, G.; Dolganova, I.; Karalkin, P.; Ponomarev, D.; Kurlov, V.; Reshetov, I.; Skorobogatiy, M.; et al. Reflection-mode continuous-wave 0.15λ-resolution terahertz solid immersion microscopy of soft biological tissues. Appl. Phys. Lett. 2018, 113, 111102. [Google Scholar] [CrossRef]
- Song, H.; Hwang, S.; An, H.; Song, H.J.; Song, J.I. Continuous-wave THz vector imaging system utilizing two-tone signal generation and self-mixing detection. Opt. Express 2017, 25, 20718. [Google Scholar] [CrossRef]
- Lim, Y.; Taimre, T.; Bertling, K.; Dean, P.; Indjin, D.; Valavanis, A.; Khanna, S.; Lachab, M.; Schaider, H.; Prow, T.; et al. High-contrast coherent terahertz imaging of porcine tissue via swept-frequency feedback interferometry. Biomed. Opt. Express 2014, 5, 3981–3989. [Google Scholar] [CrossRef] [Green Version]
- Wen, Y.; Jia, D.; Ma, W.; Feng, Y.; Liu, M.; Dong, L.; Zhao, Y.; Yu, X. Photomechanical meta-molecule array for real-time terahertz imaging. Microsyst. Nanoeng. 2017, 3, 17071. [Google Scholar] [CrossRef] [Green Version]
- Zhang, S.; Silver, J.; Shang, X.; Del Bino, L.; Ridler, N.; Del’Haye, P. Terahertz wave generation using a soliton microcomb. Opt. Express 2019, 27, 35257–35266. [Google Scholar] [CrossRef]
- Goodman, J.W. Introduction to Fourier Optics, 3rd ed.; Roberts and Company: Placerville, CA, USA, 2005; pp. 126–165. [Google Scholar]
- Xue, K.; Li, Q.; Li, Y.D.; Wang, Q. Continuous-wave terahertz in-line digital holography. Opt. Lett. 2012, 37, 3228–3230. [Google Scholar] [CrossRef]
- Ding, S.; Li, Q.; Li, Y.D.; Wang, Q. Continuous-wave terahertz digital holography by use of a pyroelectric array camera. Opt. Lett. 2011, 36, 1993–1995. [Google Scholar] [CrossRef]
- Rong, L.; Latychevskaia, T.; Wang, D.; Zhou, X.; Huang, H.; Li, Z.; Wang, Y. Terahertz in-line digital holography of dragonfly hindwing: Amplitude and phase reconstruction at enhanced resolution by extrapolation. Opt. Express 2014, 22, 17236–17245. [Google Scholar] [CrossRef] [Green Version]
- Huang, H.; Rong, L.; Wang, D.; Li, W.; Deng, Q.; Li, B.; Wang, Y.; Zhan, Z.; Wang, X.; Wu, W. Synthetic aperture in terahertz in-line digital holography for resolution enhancement. Appl. Opt. 2016, 55, A43–A48. [Google Scholar] [CrossRef]
- Li, Z.; Yan, Q.; Qin, Y.; Kong, W.; Li, G.; Zou, M.; Wang, D.; You, Z.; Zhou, X. Sparsity-based continuous wave terahertz lens-free on-chip holography with sub-wavelength resolution. Opt. Express 2019, 27, 702–713. [Google Scholar] [CrossRef]
- Li, Z.; Zou, R.; Kong, W.; Wang, X.; Deng, Q.; Yan, Q.; Qin, Y.; Wu, W.; Zhou, X. Terahertz synthetic aperture in-line holography with intensity correction and sparsity autofocusing reconstruction. Photonics Res. 2019, 7, 1391–1399. [Google Scholar] [CrossRef]
- Yamagiwa, M.; Minamikawa, T.; Minamiji, F.; Mizuno, T.; Tokizane, Y.; Oe, R.; Koresawa, H.; Mizutani, Y.; Iwata, T.; Yamamoto, H.; et al. Visualization of internal structure and internal stress in visibly opaque objects using full-field phase-shifting terahertz digital holography. Opt. Express 2019, 27, 33854–33868. [Google Scholar] [CrossRef]
- Locatelli, M.; Ravaro, M.; Bartalini, S.; Consolino, L.; Vitiello, M.; Cicchi, R.; Pavone, F.; Natale, P. Real-time terahertz digital holography with a quantum cascade laser. Sci. Rep. 2015, 5, 13566. [Google Scholar] [CrossRef] [Green Version]
- Huang, H.; Wang, D.; Rong, L.; Panezai, S.; Zhang, D.; Qiu, P.; Gao, L.; Gao, H.; Zheng, H.; Zheng, Z. Continuous-wave off-axis and in-line terahertz digital holography with phase unwrapping and phase autofocusing. Opt. Commun. 2018, 426, 612–622. [Google Scholar] [CrossRef]
- Wang, D.; Zhang, Y.; Rong, L.; Ma, D.; Zhao, J.; Wang, Y. Continuous-wave terahertz self-referencing digital holography based on Fresnel’s mirrors. Opt. Lett. 2020, 45, 913–916. [Google Scholar] [CrossRef]
- Rong, L.; Tang, C.; Wang, D.; Li, B.; Tan, F.; Wang, Y.; Shi, X. Probe position correction based on overlapped object wavefront cross-correlation for continuous-wave terahertz ptychography. Opt. Express 2019, 27, 938–950. [Google Scholar] [CrossRef]
- Stübling, E.; Rehn, A.; Siebrecht, T.; Bauckhage, Y.; Öhrström, L.; Eppenberger, P.; Balzer, J.; Ruhli, F.; Koch, M. Application of a robotic THz imaging system for sub-surface analysis of ancient human remains. Sci. Rep. 2019, 9, 3390. [Google Scholar]
- Kashiwagi, T.; Nakade, K.; Saiwai, Y.; Minami, H.; Kitamura, T.; Watanabe, C.; Ishida, K.; Sekimoto, S.; Asanuma, K.; Yasui, T.; et al. Computed tomography image using sub-terahertz waves generated from a high-Tc superconducting intrinsic Josephson junction oscillator. Appl. Phy. Lett. 2014, 104, 82603. [Google Scholar] [CrossRef] [Green Version]
- Siegel, R.; Miller, K.; Jemal, A. Cancer statistics. Cancer J. Clin. 2019, 69, 7–34. [Google Scholar] [CrossRef] [Green Version]
- Sy, S.; Huang, S.; Wáng, Y.X.; Yu, J.; Ahuja, A.; Zhang, Y.T.; Pickwell-MacPherson, E. Terahertz spectroscopy of liver cirrhosis: Investigating the origin of contrast. Phys. Med. Biol. 2010, 55, 7587–7596. [Google Scholar] [CrossRef]
- Smolyanskaya, O.; Chernomyrdin, N.; Konovko, A.; Zaytsev, K.; Ozheredov, I.; Cherkasova, O.; Nazarov, M.; Guillet, J.P.; Kozlov, S.; Yury, K.; et al. Terahertz biophotonics as a tool for studies of dielectric and spectral properties of biological tissues and liquids. Prog. Quantum Electron. 2018, 62, 1–77. [Google Scholar] [CrossRef]
- Zaytsev, K.; Dolganova, I.; Chernomyrdin, N.; Katyba, G.; Gavdush, A.; Cherkasova, O.; Komandin, G.; Shchedrina, M.; Khodan, A.; Ponomarev, D.; et al. The progress and perspectives of terahertz technology for diagnosis of neoplasms: A review. J. Opt. 2020, 22, 13001. [Google Scholar] [CrossRef]
- Oh, S.; Kim, S.H.; Ji, Y.; Jeong, K.; Park, Y.; Yang, J.; Park, D.; Noh, S.; Kang, S.G.; Huh, Y.M.; et al. Study of freshly excised brain tissues using terahertz imaging. Biomed. Opt. Express 2014, 5, 2837–2842. [Google Scholar] [CrossRef] [Green Version]
- Doleshal, M.; Magotra, A.; Choudhury, B.; Cannon, B.; Labourier, E.; Szafranska, A. Evaluation and Validation of Total RNA Extraction Methods for MicroRNA Expression Analyses in Formalin-Fixed, Paraffin-Embedded Tissues. J. Mol. Diagn. 2008, 10, 203–211. [Google Scholar] [CrossRef] [PubMed] [Green Version]
- Sim, Y.; Park, J.Y.; Ahn, K.M.; Park, C.; Son, J.H. Terahertz imaging of excised oral cancer at frozen temperature. Biomed. Opt. Express 2013, 4, 1413–1421. [Google Scholar] [CrossRef] [PubMed]
- Oh, S.; Kim, S.H.; Jeong, K.; Park, Y.; Huh, Y.M.; Son, J.H.; Suh, J.S. Measurement depth enhancement in terahertz imaging of biological tissues. Opt. Express 2013, 21, 21299–21305. [Google Scholar] [CrossRef]
- Kosutic, D.; Haw, W.; Ghura, V. Current Concepts in the Surgical Management of Non-melanoma Skin Cancers. Clin. Oncol. 2019, 31, 738–748. [Google Scholar] [CrossRef] [PubMed]
- Joseph, C.; Yaroslavsky, A.; Neel, V.; Goyette, T.; Giles, R. Dual Frequency Continuous Wave Terahertz Transmission Imaging of Nonmelanoma Skin Cancers. Laser. Surg. Med. 2011, 43, 457–462. [Google Scholar] [CrossRef]
- Chen, H.; Lee, W.J.; Chiu, C.M.; Tsai, Y.F.; Tseng, T.F.; Lu, J.T.; Lai, W.L.; Sun, C.K. Performance of THz fiber-scanning near-field microscopy to diagnose breast tumors. Opt. Express 2011, 19, 19523–19531. [Google Scholar] [CrossRef]
- Peter, B.; Yngvesson, S.; Siqueira, P.; Kelly, P.; Khan, A.; Glick, S.; Karellas, A. Development and Testing of a Single Frequency Terahertz Imaging System for Breast Cancer Detection. IEEE Trans. Terahertz Sci. Technol. 2013, 3, 374–386. [Google Scholar] [CrossRef] [Green Version]
- Chernomyrdin, N.; Zhelnov, V.; Kucheryavenko, A.; Dolganova, I.; Katyba, G.; Karasik, V.; Reshetov, I.; Zaytsev, K. Numerical analysis and experimental study of terahertz solid immersion microscopy. Opt. Eng. 2019, 59, 61605. [Google Scholar] [CrossRef]
- Van Meir, E.; Hadjipanayis, C.; Norden, A.; Shu, H.K.; Wen, P.; Olson, J. Exciting New Advances in Neuro-Oncology: The Avenue to a Cure for Malignant Glioma. CA Cancer J. Clin. 2010, 60, 166–193. [Google Scholar] [CrossRef] [PubMed]
- Wu, L.; Xu, D.G.; Wang, Y.; Liao, B.; Jiang, Z.; Zhao, L.; Sun, Z.; Wu, N.; Chen, T.; Feng, H.; et al. Study of in vivo brain glioma in a mouse model using continuous-wave terahertz reflection imaging. Biomed. Opt. Express 2019, 10, 3953–3962. [Google Scholar] [CrossRef]
- Wang, Y.; Notake, T.; Tang, M.; Nawata, K.; Ito, H.; Minamide, H. Terahertz-wave water concentration and distribution measurement in thin biotissue based on a novel sample preparation. Phys. Med. Biol. 2011, 56, 4517–4527. [Google Scholar] [CrossRef]
- Jakobsen, A.; Andersen, F.; Fischer, A.; Jensen, L.; Jørgensen, J.; Larsen, O.; Lindebjerg, J.; Pløen, J.; Rafaelsen, S.; Vilandt, J. Neoadjuvant chemotherapy in locally advanced colon cancer. A phase II trial. Acta Oncol. 2015, 54, 1747–1753. [Google Scholar] [CrossRef]
- Wahaia, F.; Kašalynas, I.; Venckevicius, R.; Seliuta, D.; Valušis, G.; Urbanowicz, A.; Molis, G.; Carneiro, F.; Silva, C.; Granja, P. Terahertz absorption and reflection imaging of carcinoma-affected colon tissues embedded in paraffin. Mol. Struct. 2015, 1107, 214–219. [Google Scholar] [CrossRef]
- Doradla, P.; Alavi, K.; Joseph, C.S.; Giles, R.H. Development of terahertz endoscopic system for cancer detection. In Proceedings of the Conference on Terahertz, RF, Millimeter, and Submillimeter-Wave Technology and Applications IX, San Francisco, CA, USA, 15–18 February 2016; Volume 9747. [Google Scholar]
- Coon, C.; Berger, N.; Eastwood, D.; Tsai, S.; Christians, K.; Mogal, H.; Clarke, C.; Gamblin, T. Primary Liver Cancer: An NCDB Analysis of Overall Survival and Margins After Hepatectomy. Ann. Surg. Oncol. 2020, 27, 1156–1163. [Google Scholar] [CrossRef] [PubMed]
- Rong, L.; Latychevskaia, T.; Chen, C.; Wang, D.; Yu, Z.; Zhou, X.; Zeyu, L.; Huang, H.; Wang, Y.; Zhou, Z. Terahertz in-line digital holography of human hepatocellular carcinoma tissue. Sci. Rep. 2015, 5, 8445. [Google Scholar] [CrossRef] [PubMed] [Green Version]
- Mejia, J.; Pasko, J. Primary Liver Cancers: Intrahepatic Cholangiocarcinoma and Hepatocellular Carcinoma. Surg. Clin. N. Am. 2020, 100, 535–549. [Google Scholar] [CrossRef] [PubMed]
- Shi, J.; Wang, Y.; Chen, T.; Xu, D.; Zhao, H.; Lin, C.; Yan, C.; Tang, L.; Yi, H.; Feng, H.; et al. Automatic evaluation of traumatic brain injury based on terahertz imaging with machine learning. Opt. Express 2018, 26, 6371–6381. [Google Scholar] [CrossRef] [PubMed]
- Bessou, M.; Chassagne, B.; Caumes, J.P.; Pradere, C.; Maire, P.; Tondusson, M.; Abraham, E. Three-dimensional terahertz computed tomography of human bones. Appl. Opt. 2012, 51, 6738–6744. [Google Scholar] [CrossRef] [PubMed] [Green Version]
- Li, B.; Wang, D.; Rong, L.; Zhai, C.; Wang, Y.; Zhao, J. Application of continuous-wave terahertz computed tomography for the analysis of chicken bone structure. Opt. Eng. 2018, 57, 23105. [Google Scholar] [CrossRef]
Figure 1.
Continuous-wave (CW)-THz single-point scanning imaging system. PMs, off-axis parabolic mirrors; M1, THz gold mirror.
Figure 1.
Continuous-wave (CW)-THz single-point scanning imaging system. PMs, off-axis parabolic mirrors; M1, THz gold mirror.

Figure 2.
CW-THz reflection single-point scanning imaging system: (a) Obliquely incident; (b) Normal incidence. Here, BS stands for beam-splitter. The direction of the incident beam was marked with black arrows, and the direction of the reflected beam was marked with orange arrows.
Figure 2.
CW-THz reflection single-point scanning imaging system: (a) Obliquely incident; (b) Normal incidence. Here, BS stands for beam-splitter. The direction of the incident beam was marked with black arrows, and the direction of the reflected beam was marked with orange arrows.

Figure 3.
Schematic of co- and cross-polarised CW-THz reflection imaging.

Figure 4.
Schematic of optical setup for CW-THz CP and LP imaging.

Figure 5.
The setup of the CW THz ATR imaging scanning imaging system.

Figure 6.
Configuration of the CW-THz near-field imaging system based on THz waveguide.

Figure 7.
Schematic diagram of the CW-THz self-mixing coherent imaging.

Figure 8.
Schematic layout of the in-line CW THz digital holography (CW TDH) scheme.

Figure 9.
Schematic layout of the setup of off-axis CW TDH.

Figure 10.
Schematic layout of the setup of self-referencing CW TDH based on Fresnel’s mirrors. O: object beam; R: reference beam.
Figure 10.
Schematic layout of the setup of self-referencing CW TDH based on Fresnel’s mirrors. O: object beam; R: reference beam.

Figure 11.
Schematic layout of the setup of CW THz ptychography.

Figure 12.
Schematic of the THz-computed tomography (CT) imaging system.

Figure 13.
THz solid immersion microscopy of soft biological tissues with the spatial resolution of 0.15 λ: (a) Photo of an ex vivo human breast tissue specimen; (b) THz SI microscopy image of human breast tissue; (c) The diagnosis of the breast tissue specimen as confirmed by histology [54]. Copyright © 2018, AIP Publishing. All rights reserved.

Figure 14.
Two datasets corresponding to different tissue samples. Photographs of normal and cancerous colon tissue and cross-polarised THz image. “N” and “C” represent normal and cancerous respectively: (a,d) Photographs of normal and cancerous colon tissue; (b,c) The cross-polarised THz image of the normal and cancerous colon tissue. Reproduced from [41] CC BY 4.0.

Figure 15.
The CW THz in-line holography of human liver cancer sample: (a) Photo of the liver cancer sample; (b) In-line THz hologram; (c) The reconstructed amplitude and (d) phase images. The phase image contains more structural information. The tissue fibrosis arrows point to a sign of cirrhosis that was untreated and developed into liver cancer. Adapted from [93] under the terms of the Creative Commons Attribution 4.0 License.

Figure 16.
The reconstructed image of the chicken ulna obtained with CW THz-CT: (a) Schematic diagram and sketch image of 2D cross-sectional image of the chicken ulna; (b,d) Photos of sections II and IV of the chicken ulna; (c,e) The corresponding 2-D cross-sectional images [97]. Copyright © 2018, Society of Photo-Optical Instrumentation Engineers (SPIE).


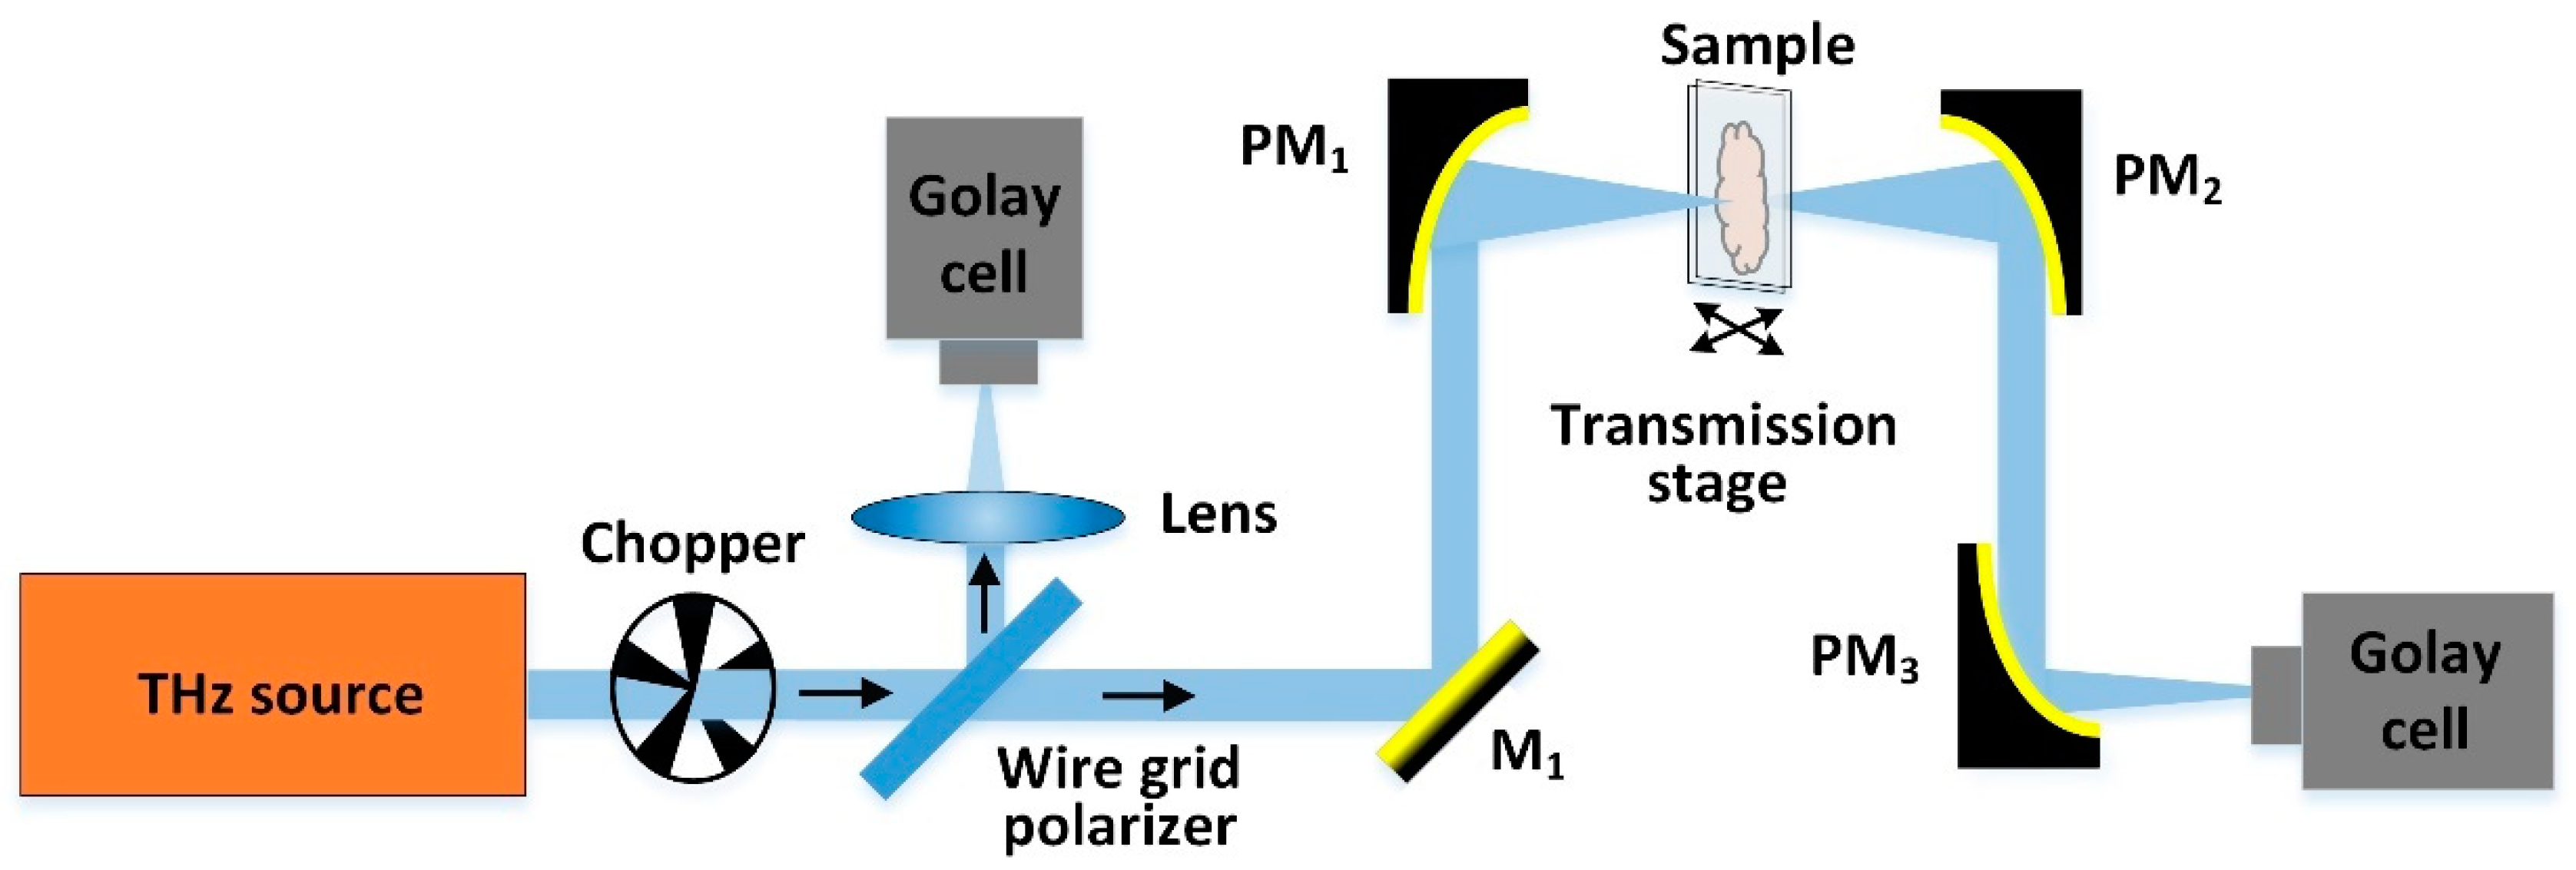
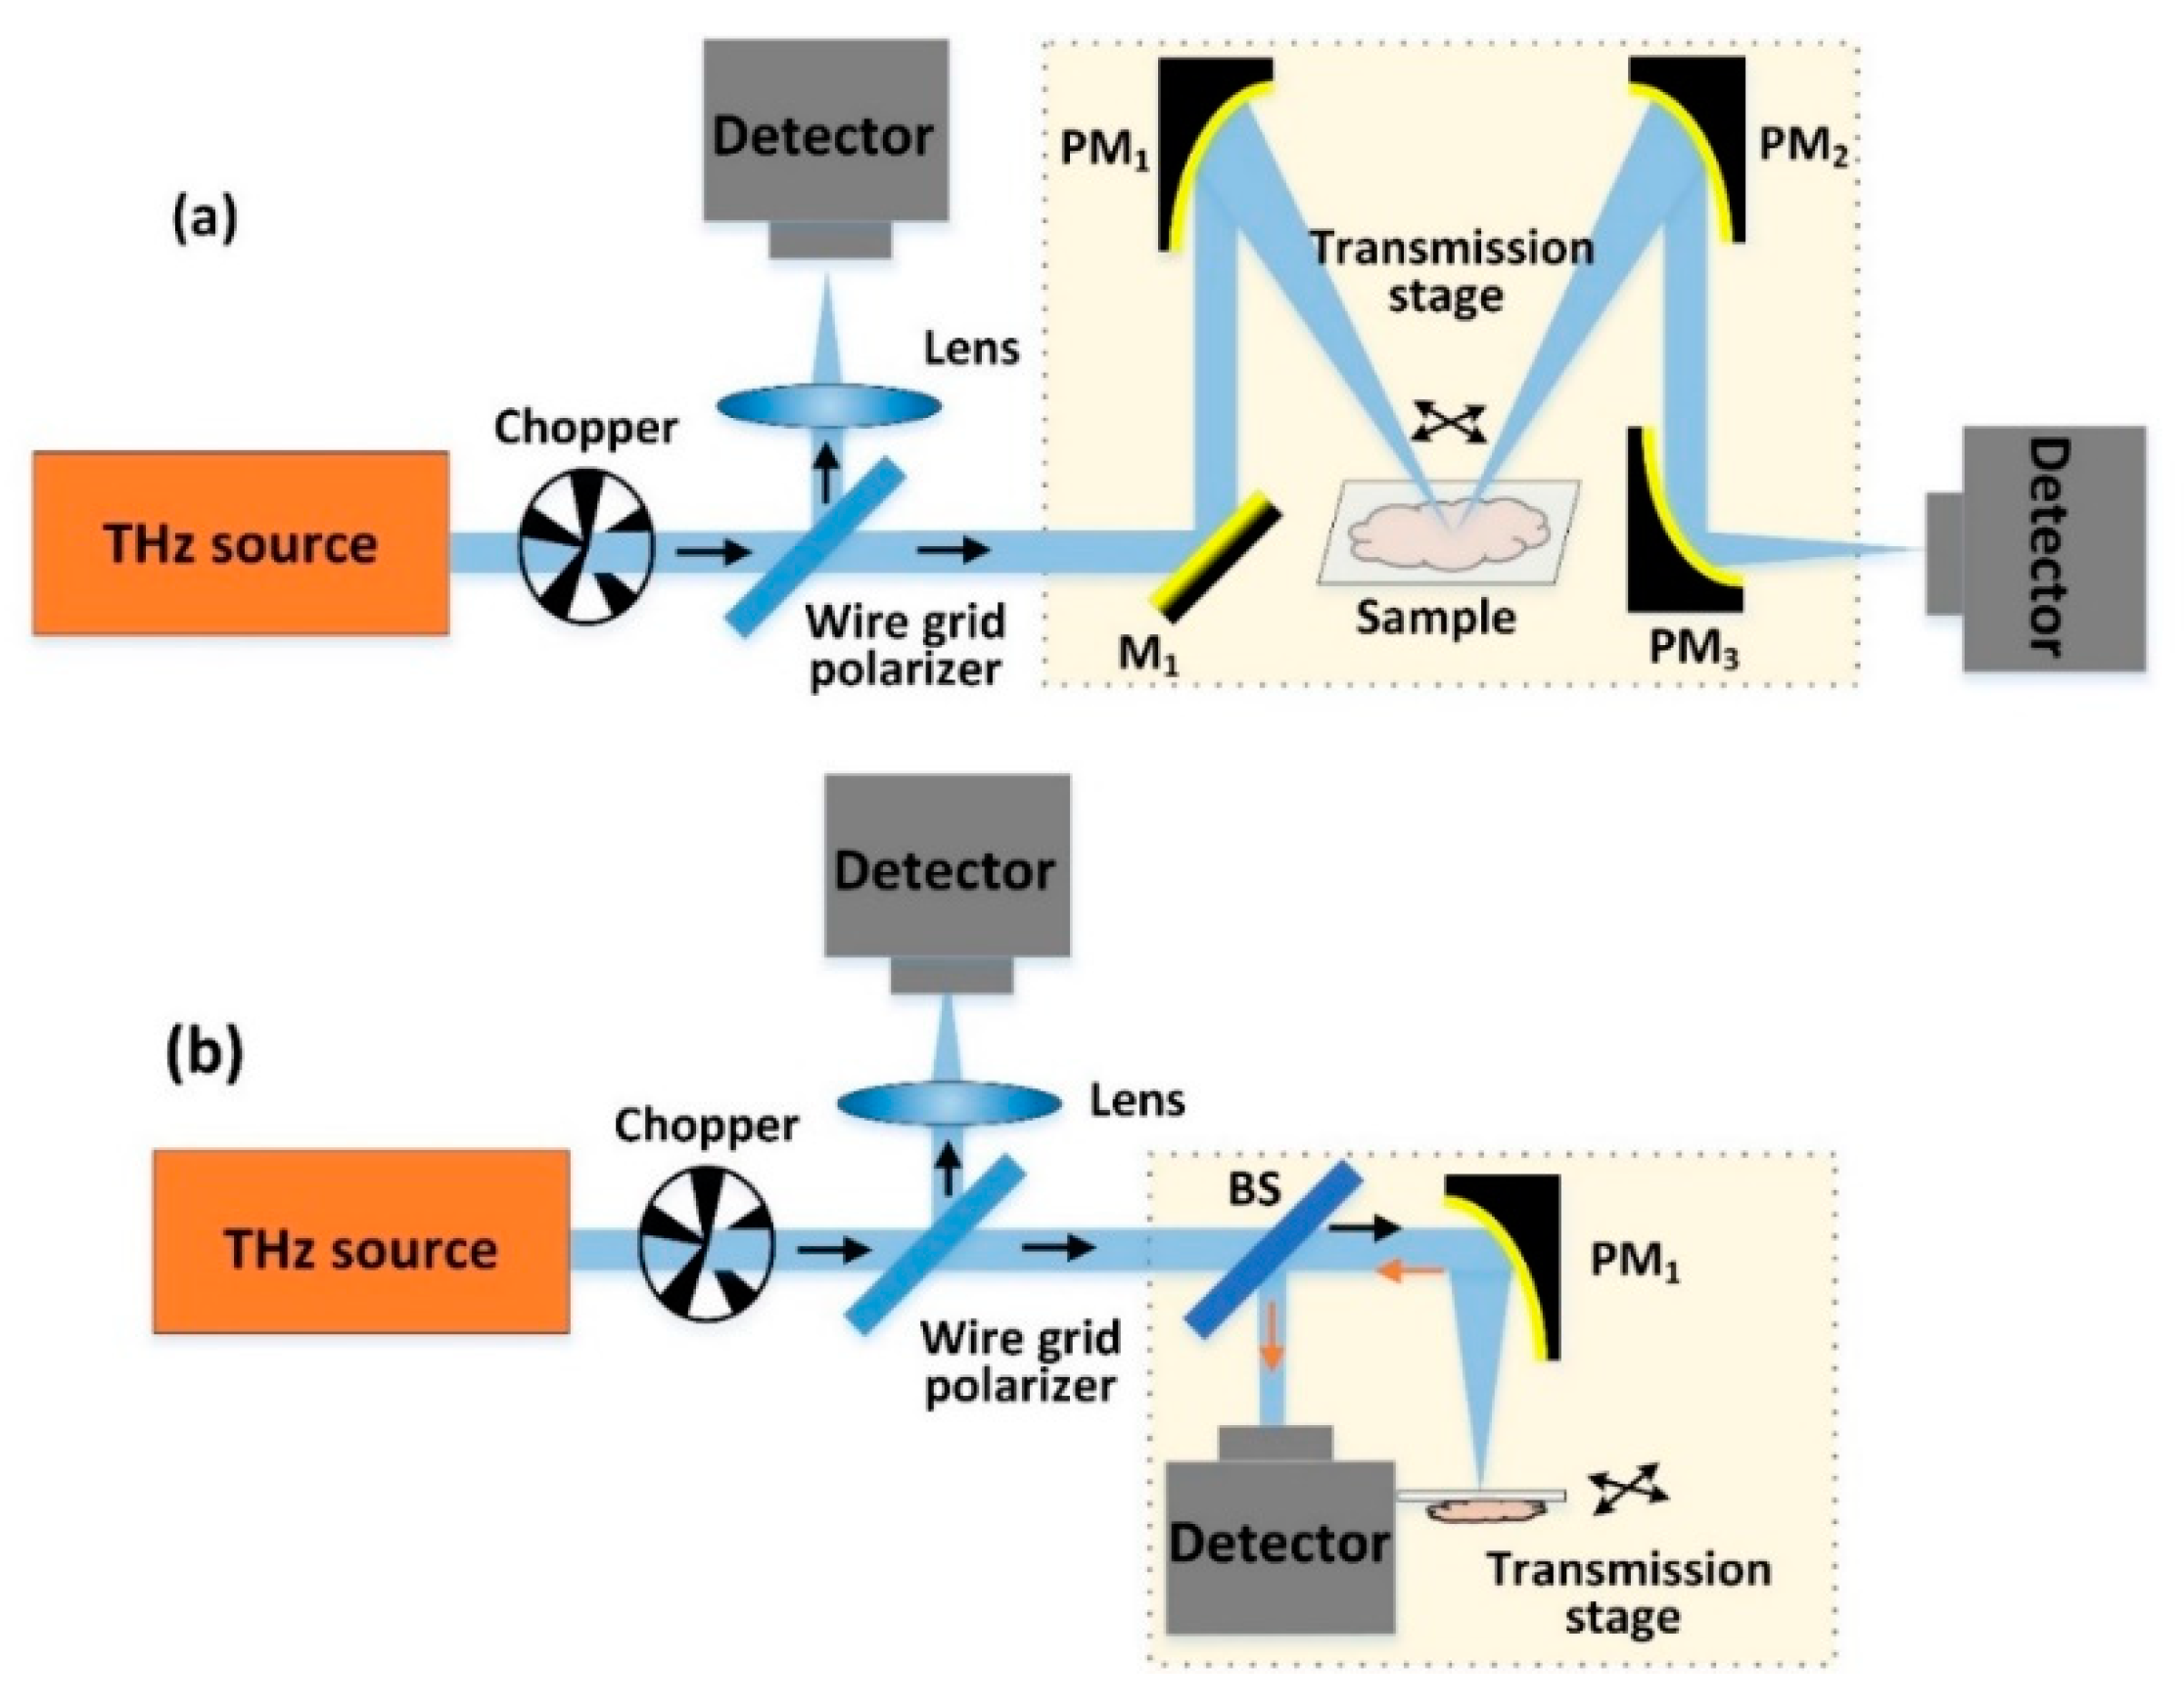
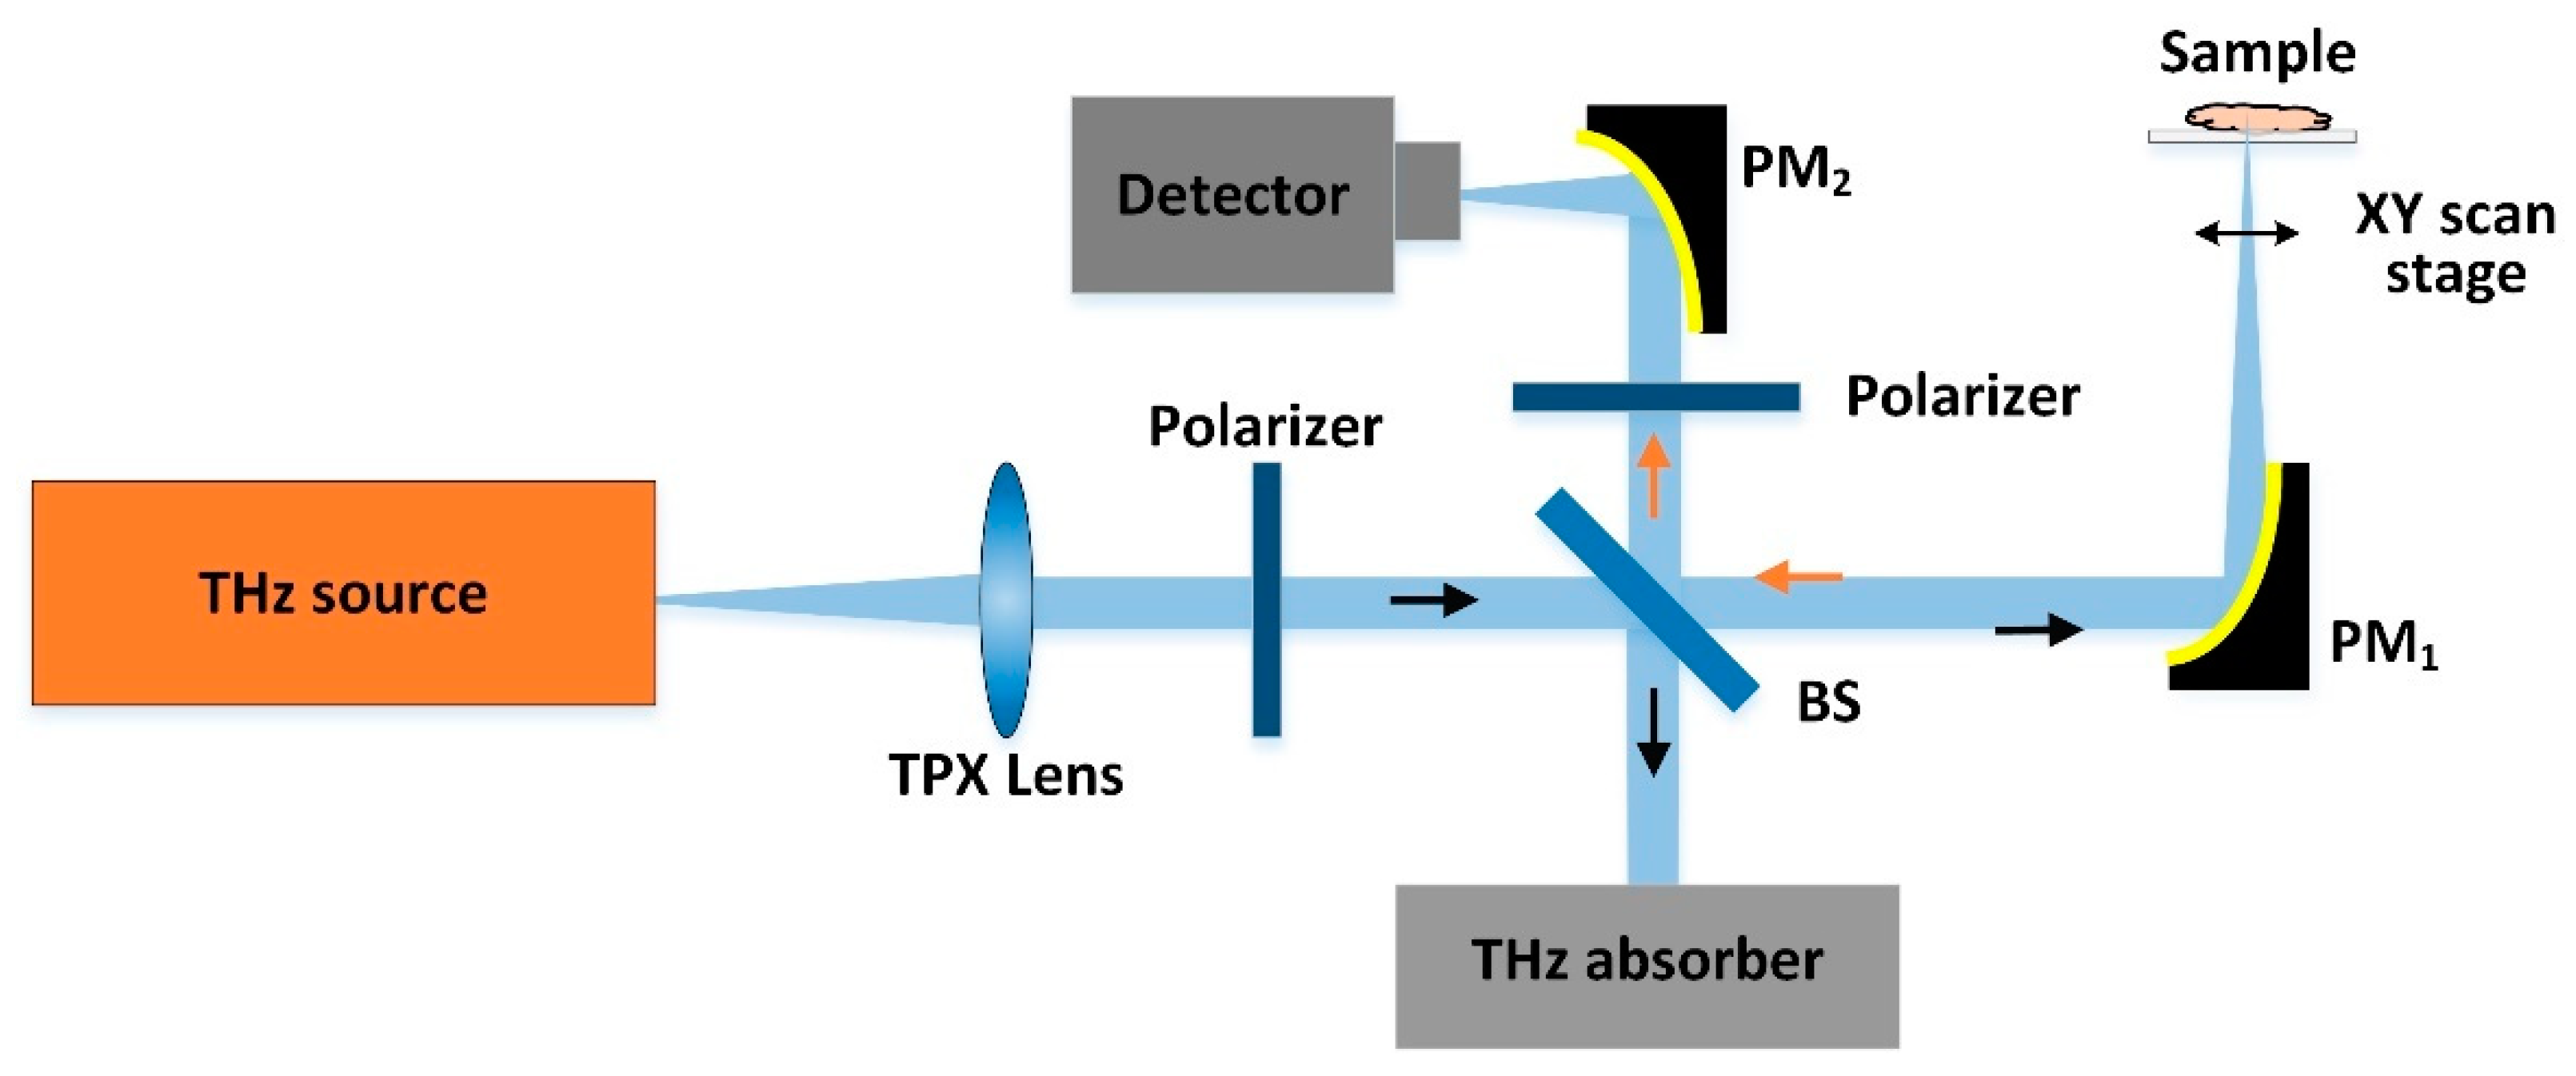
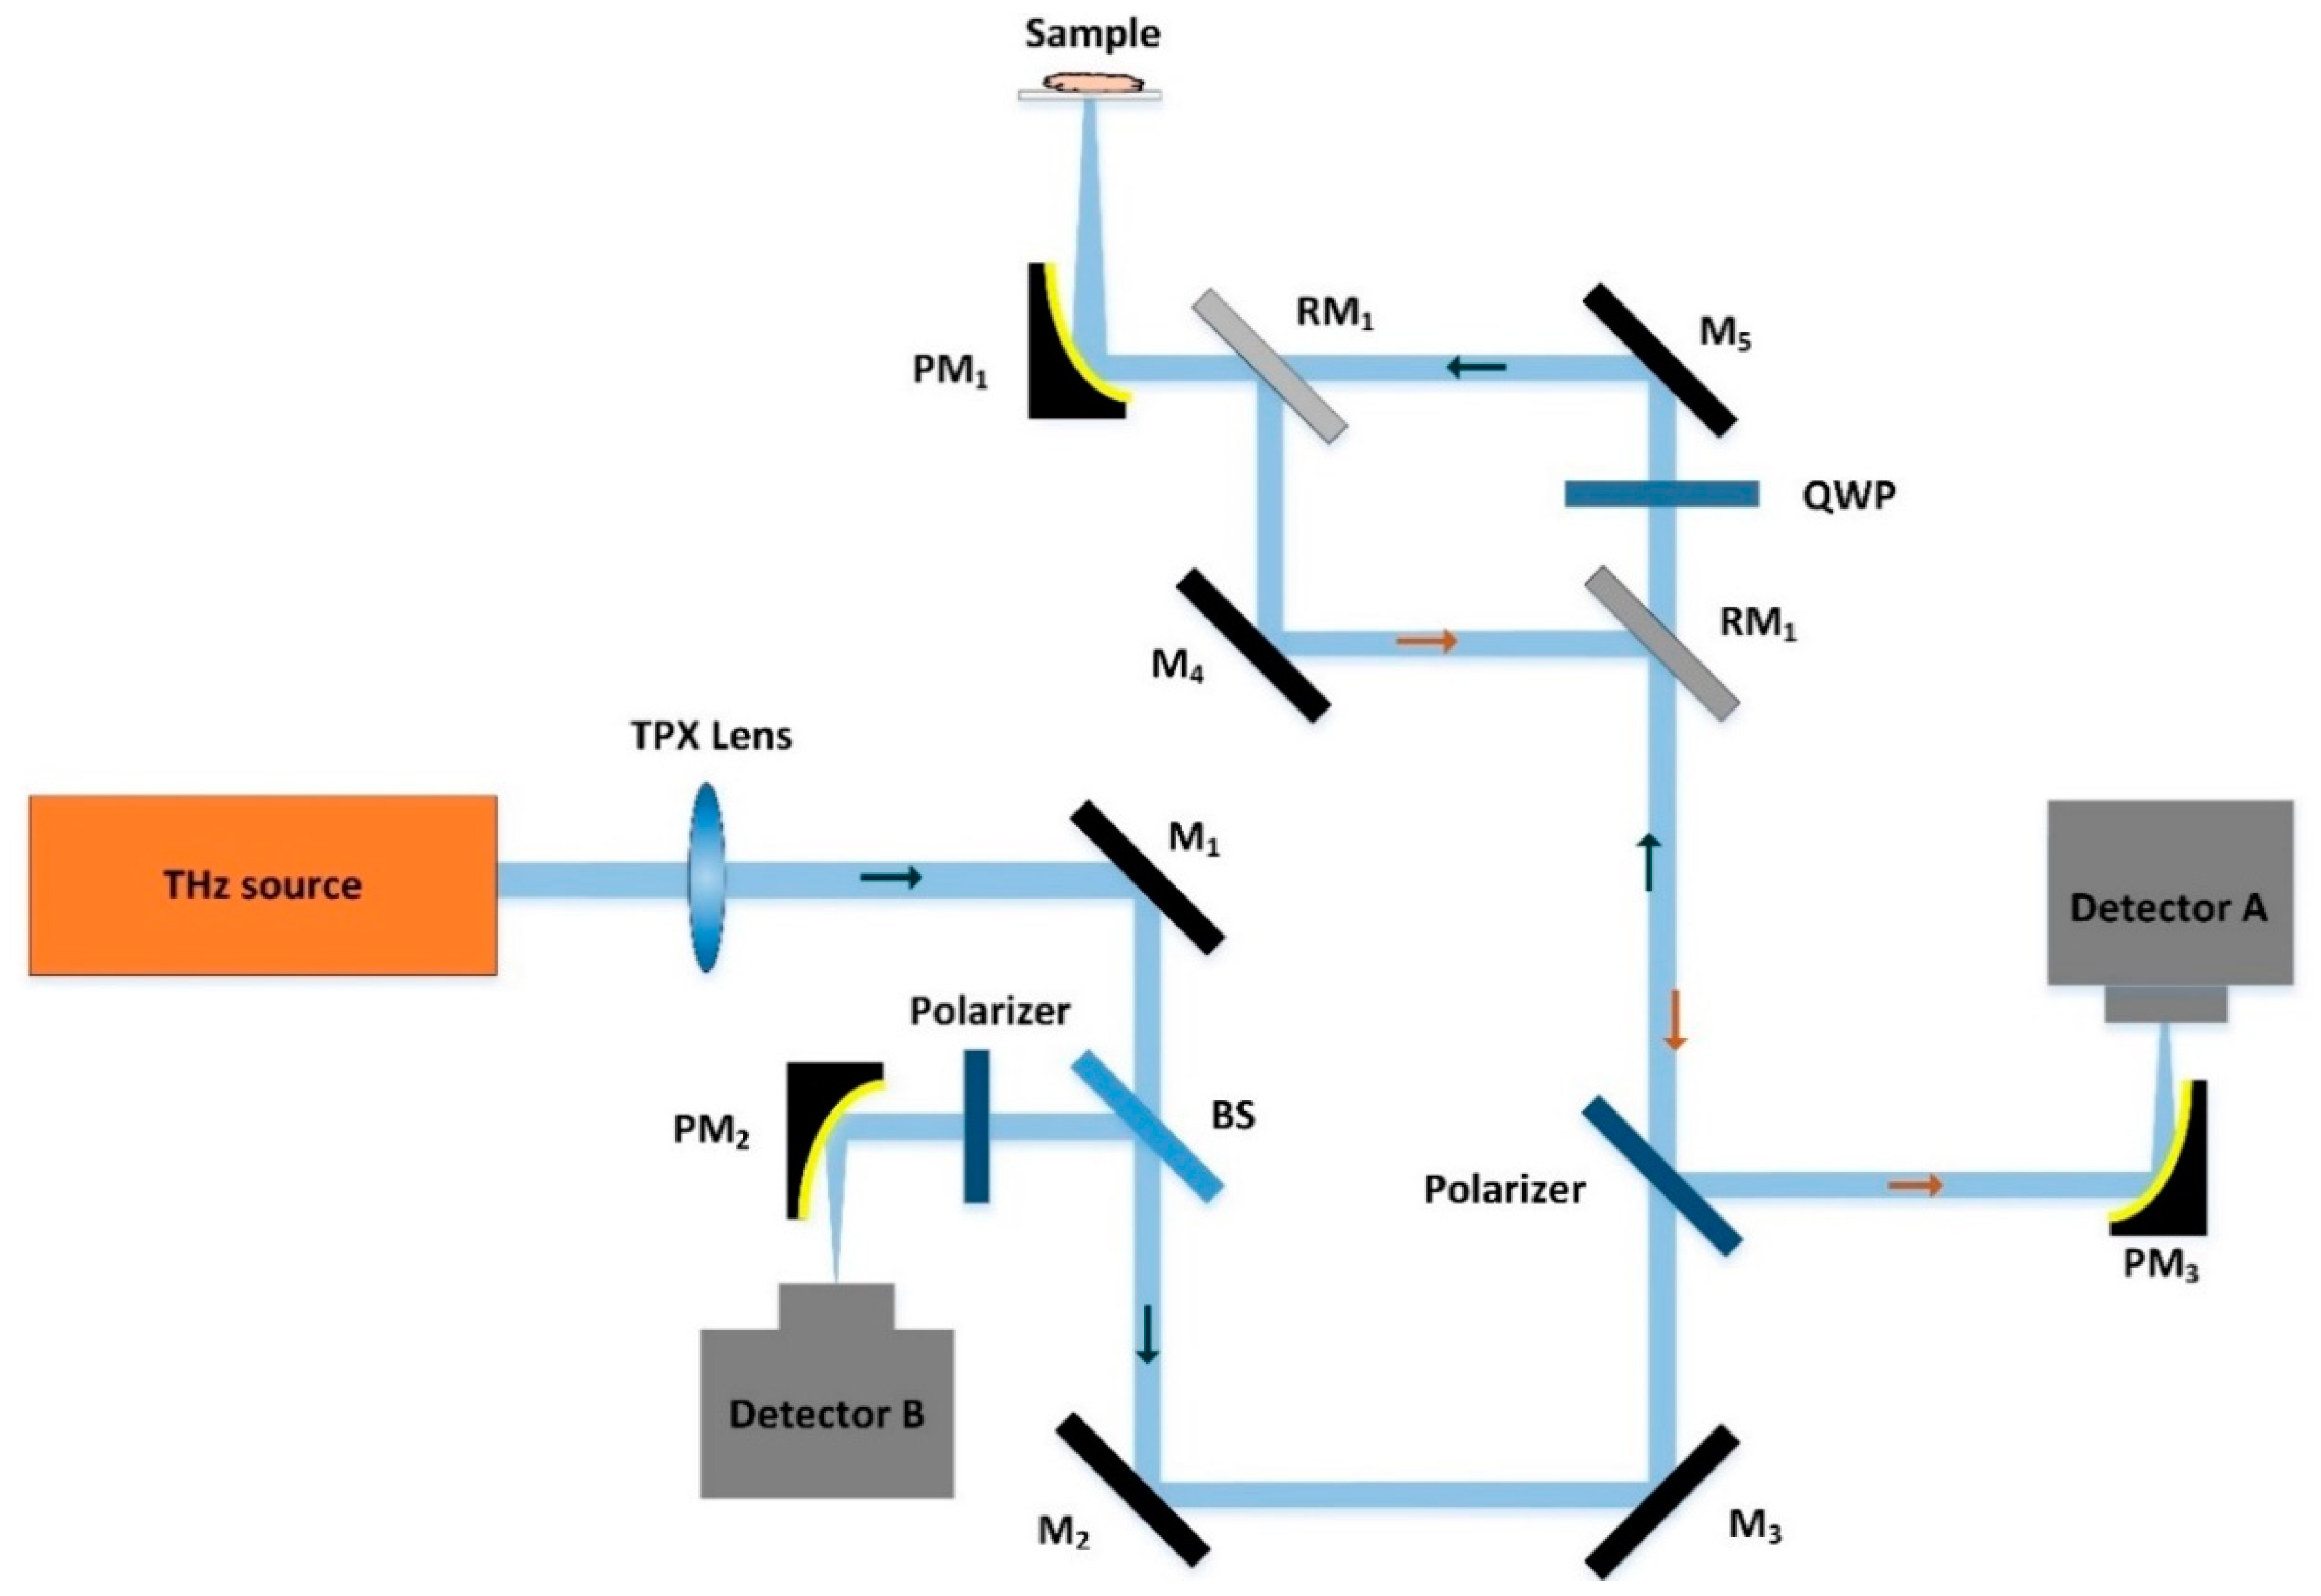
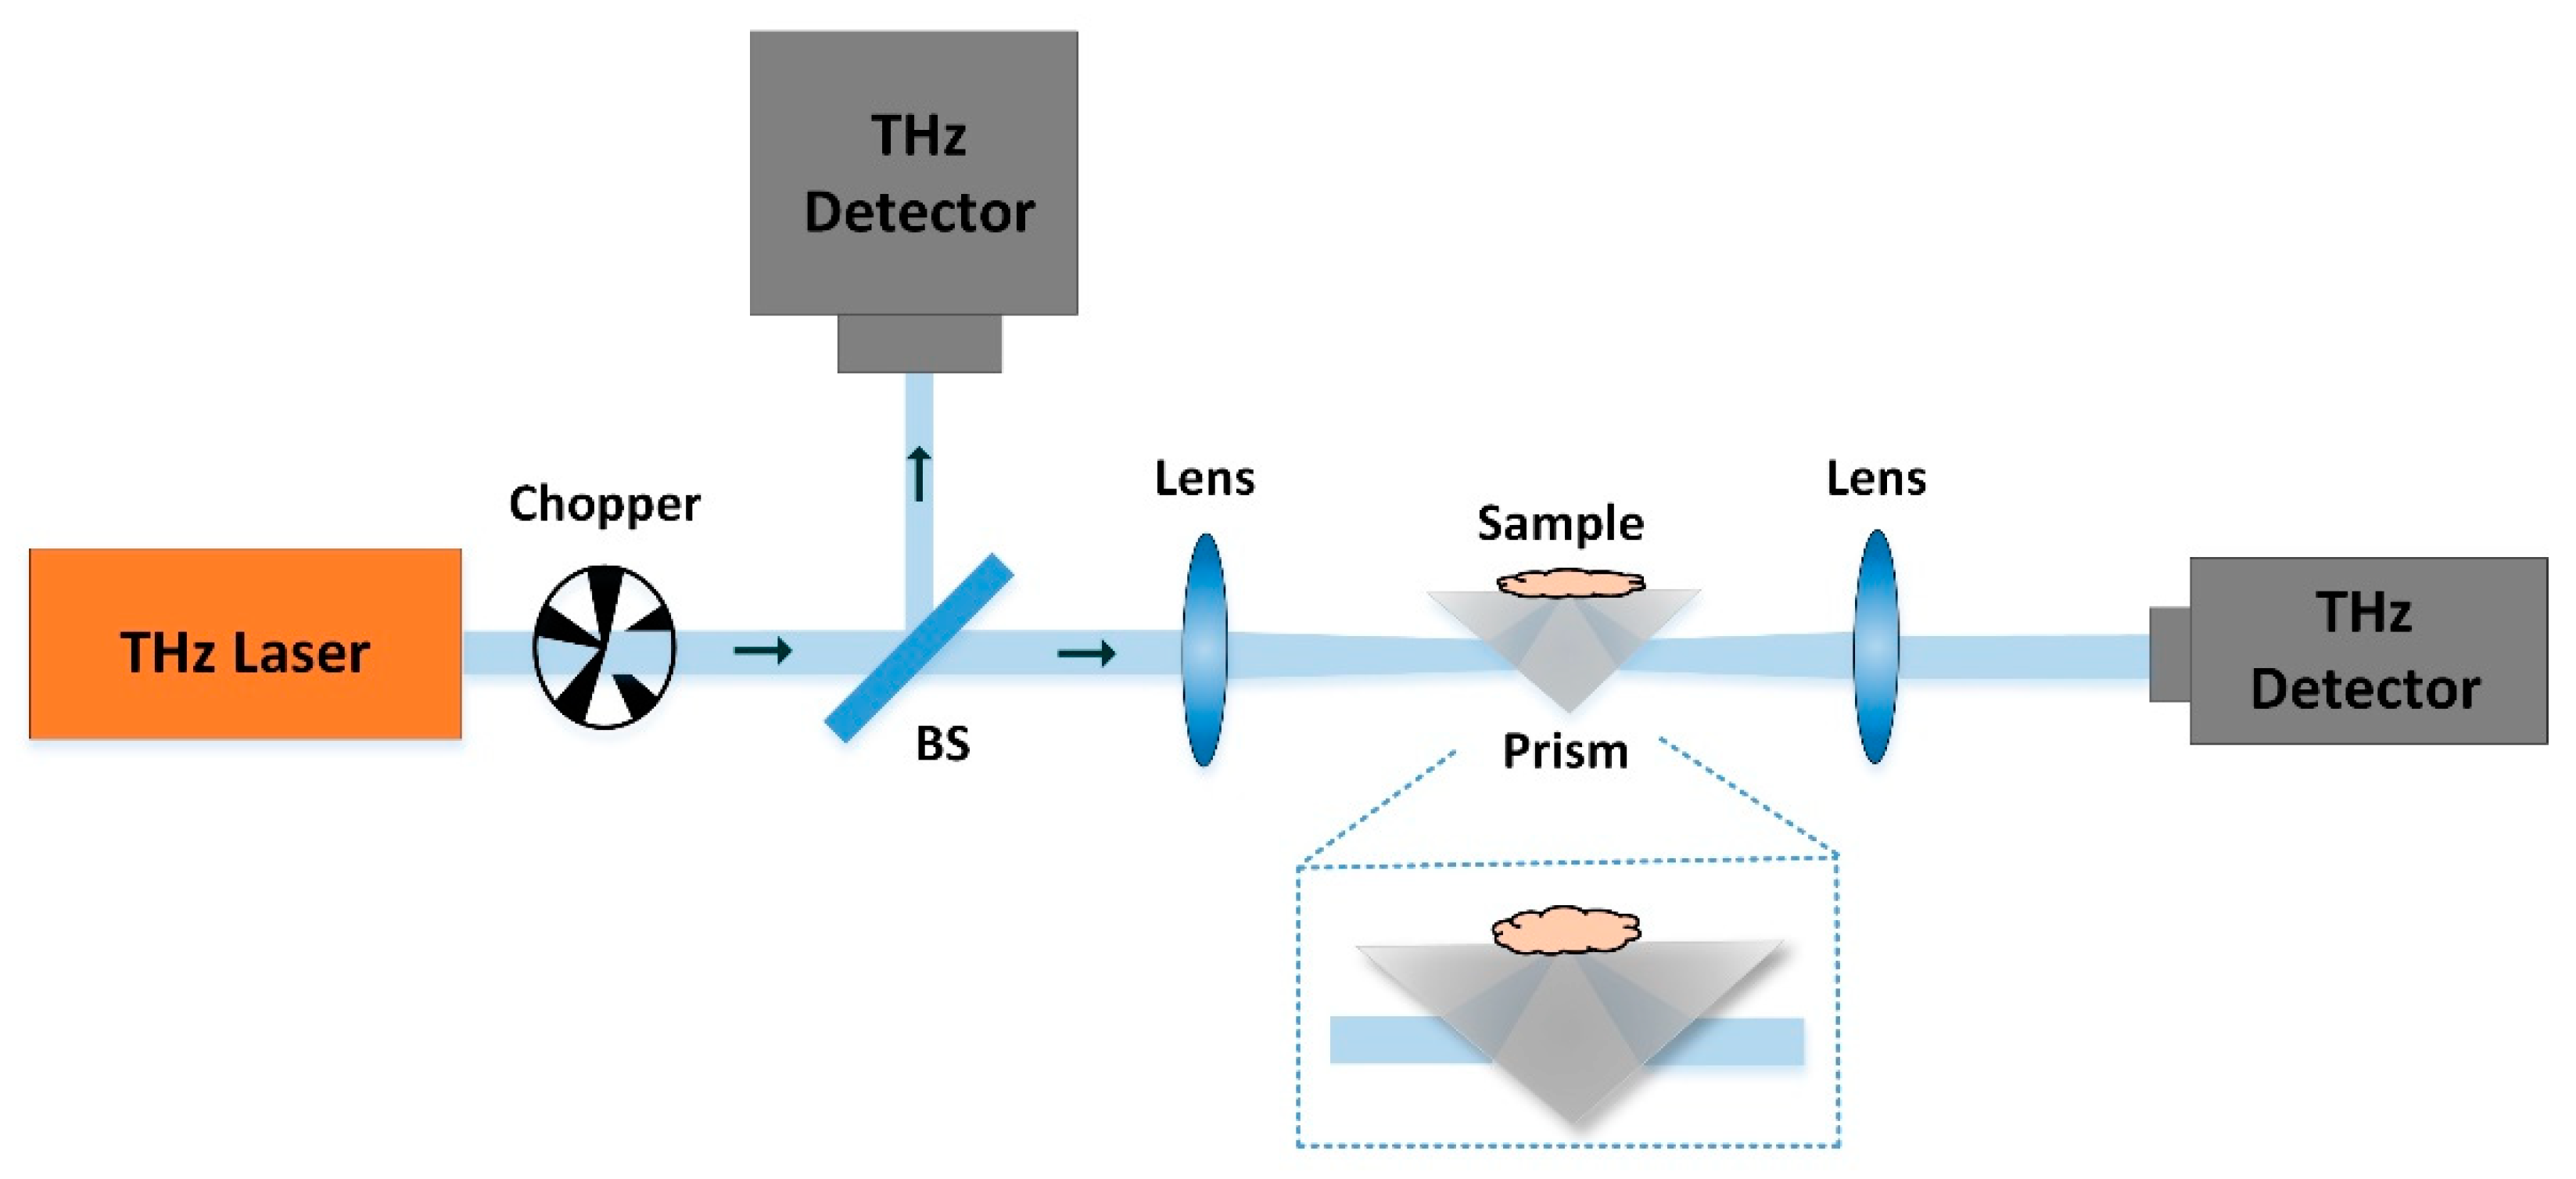
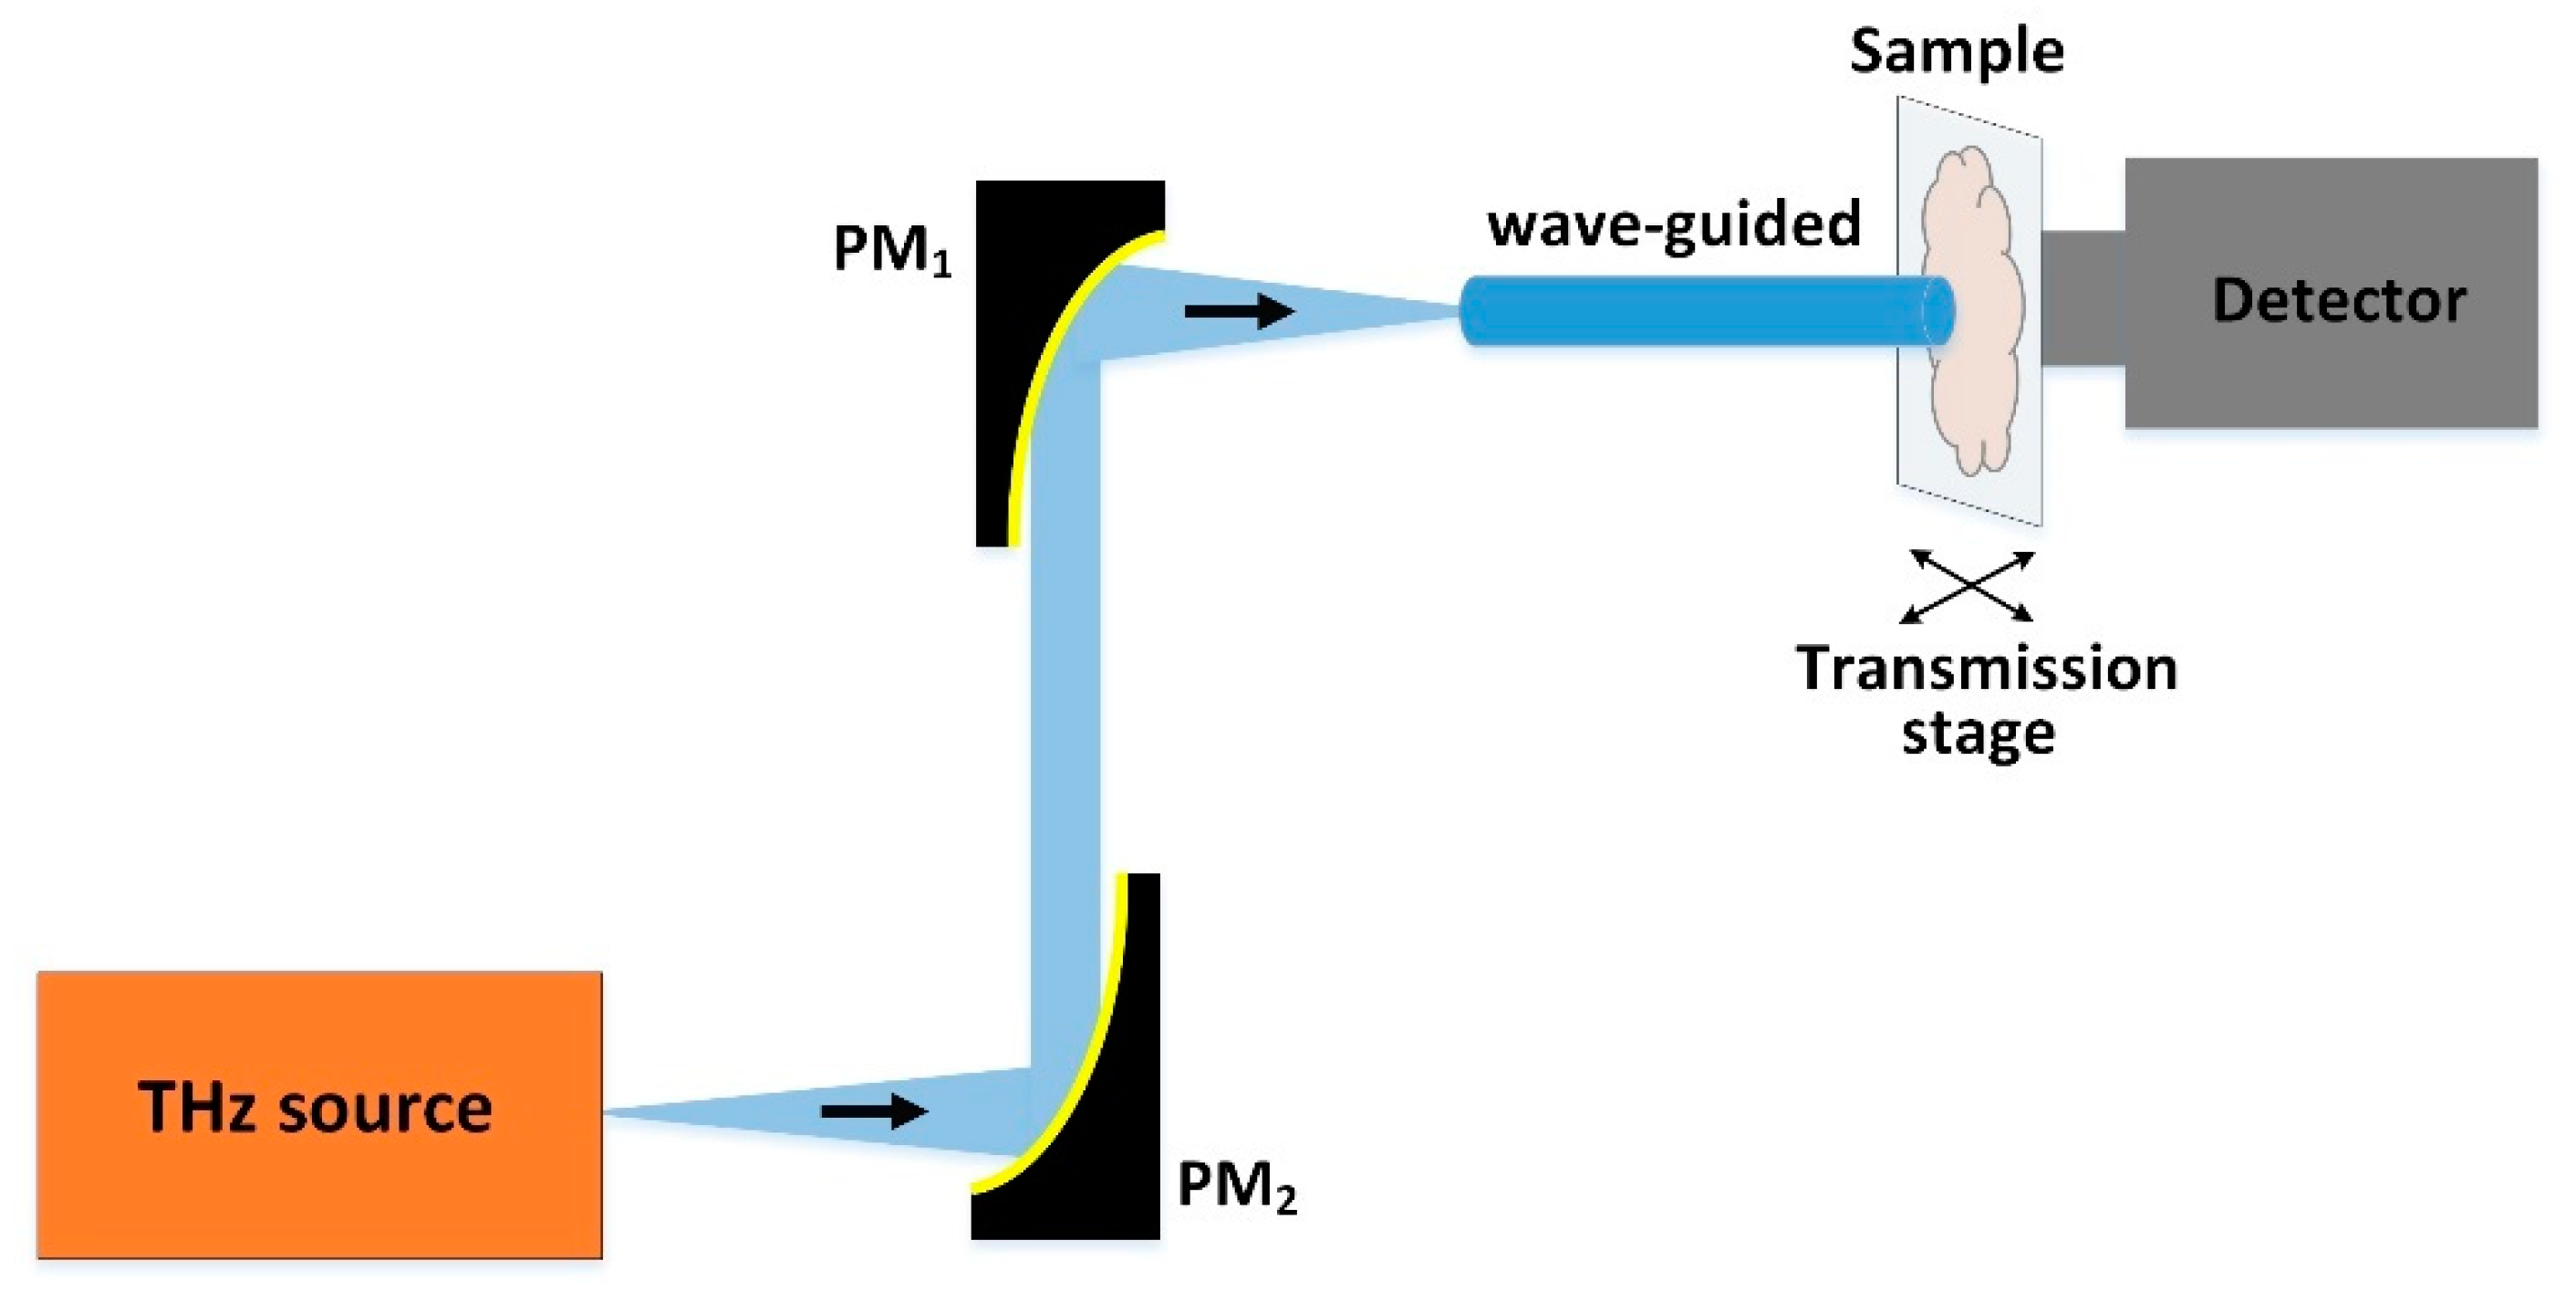
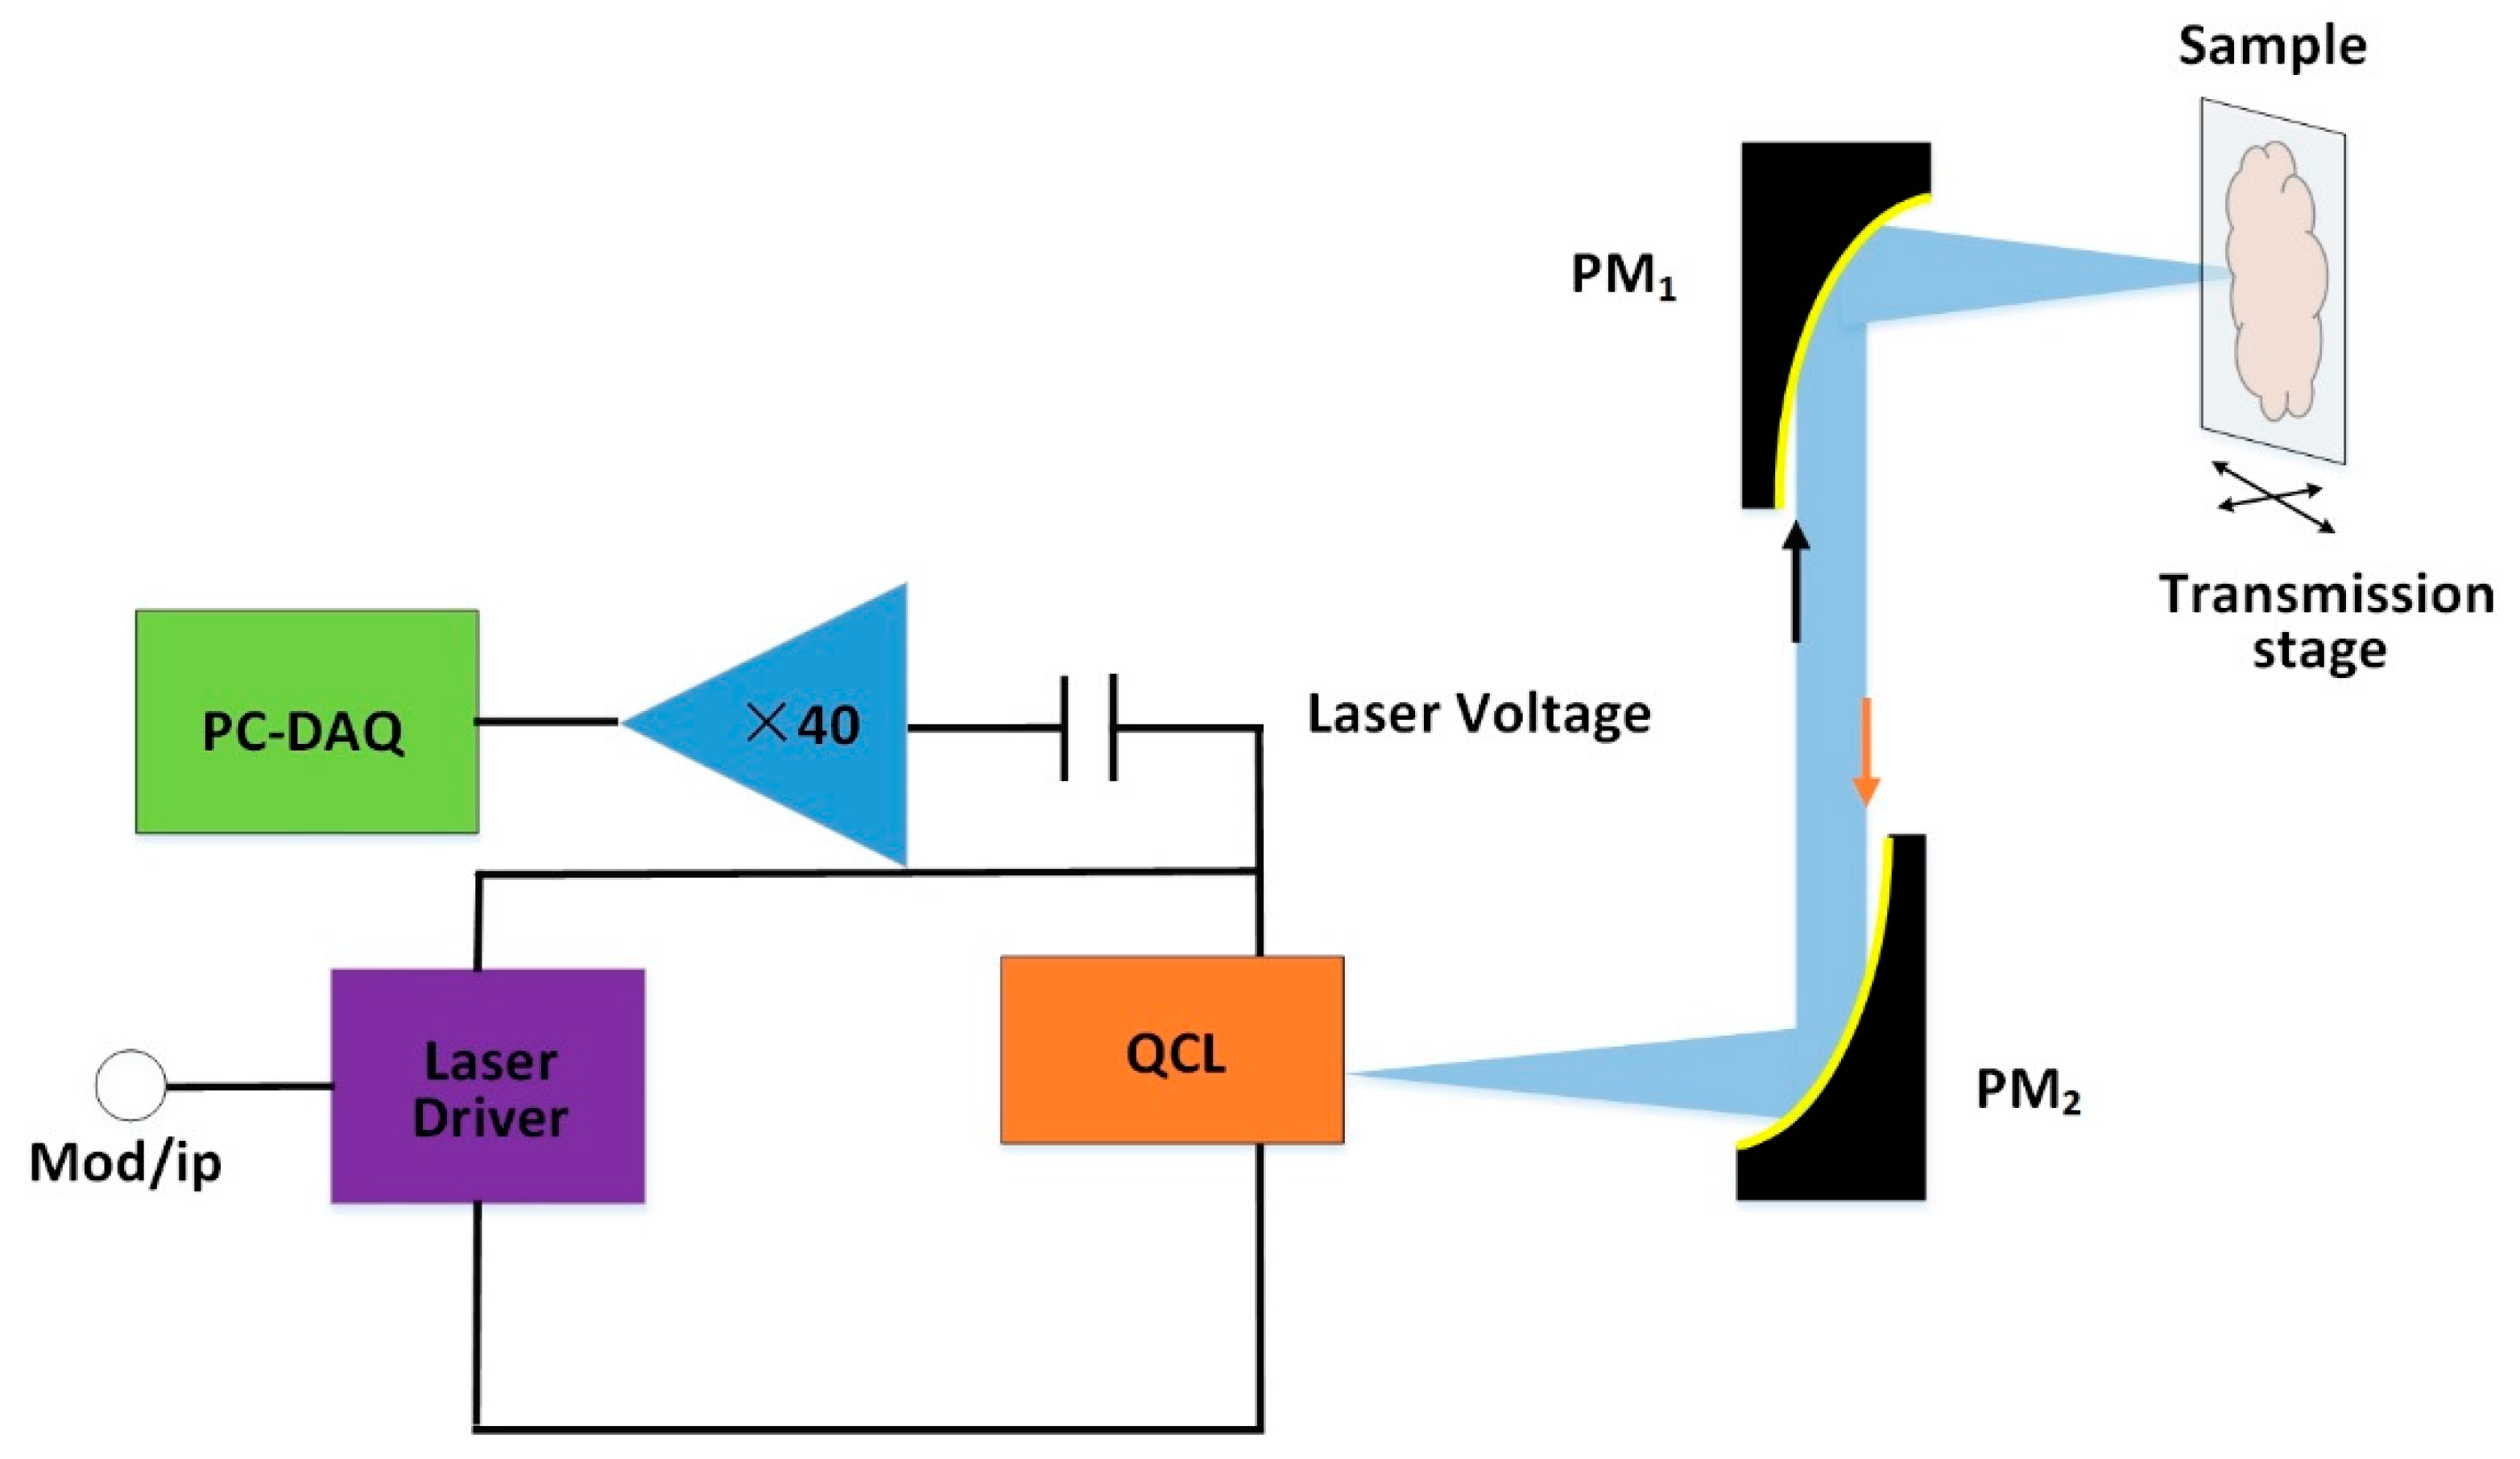
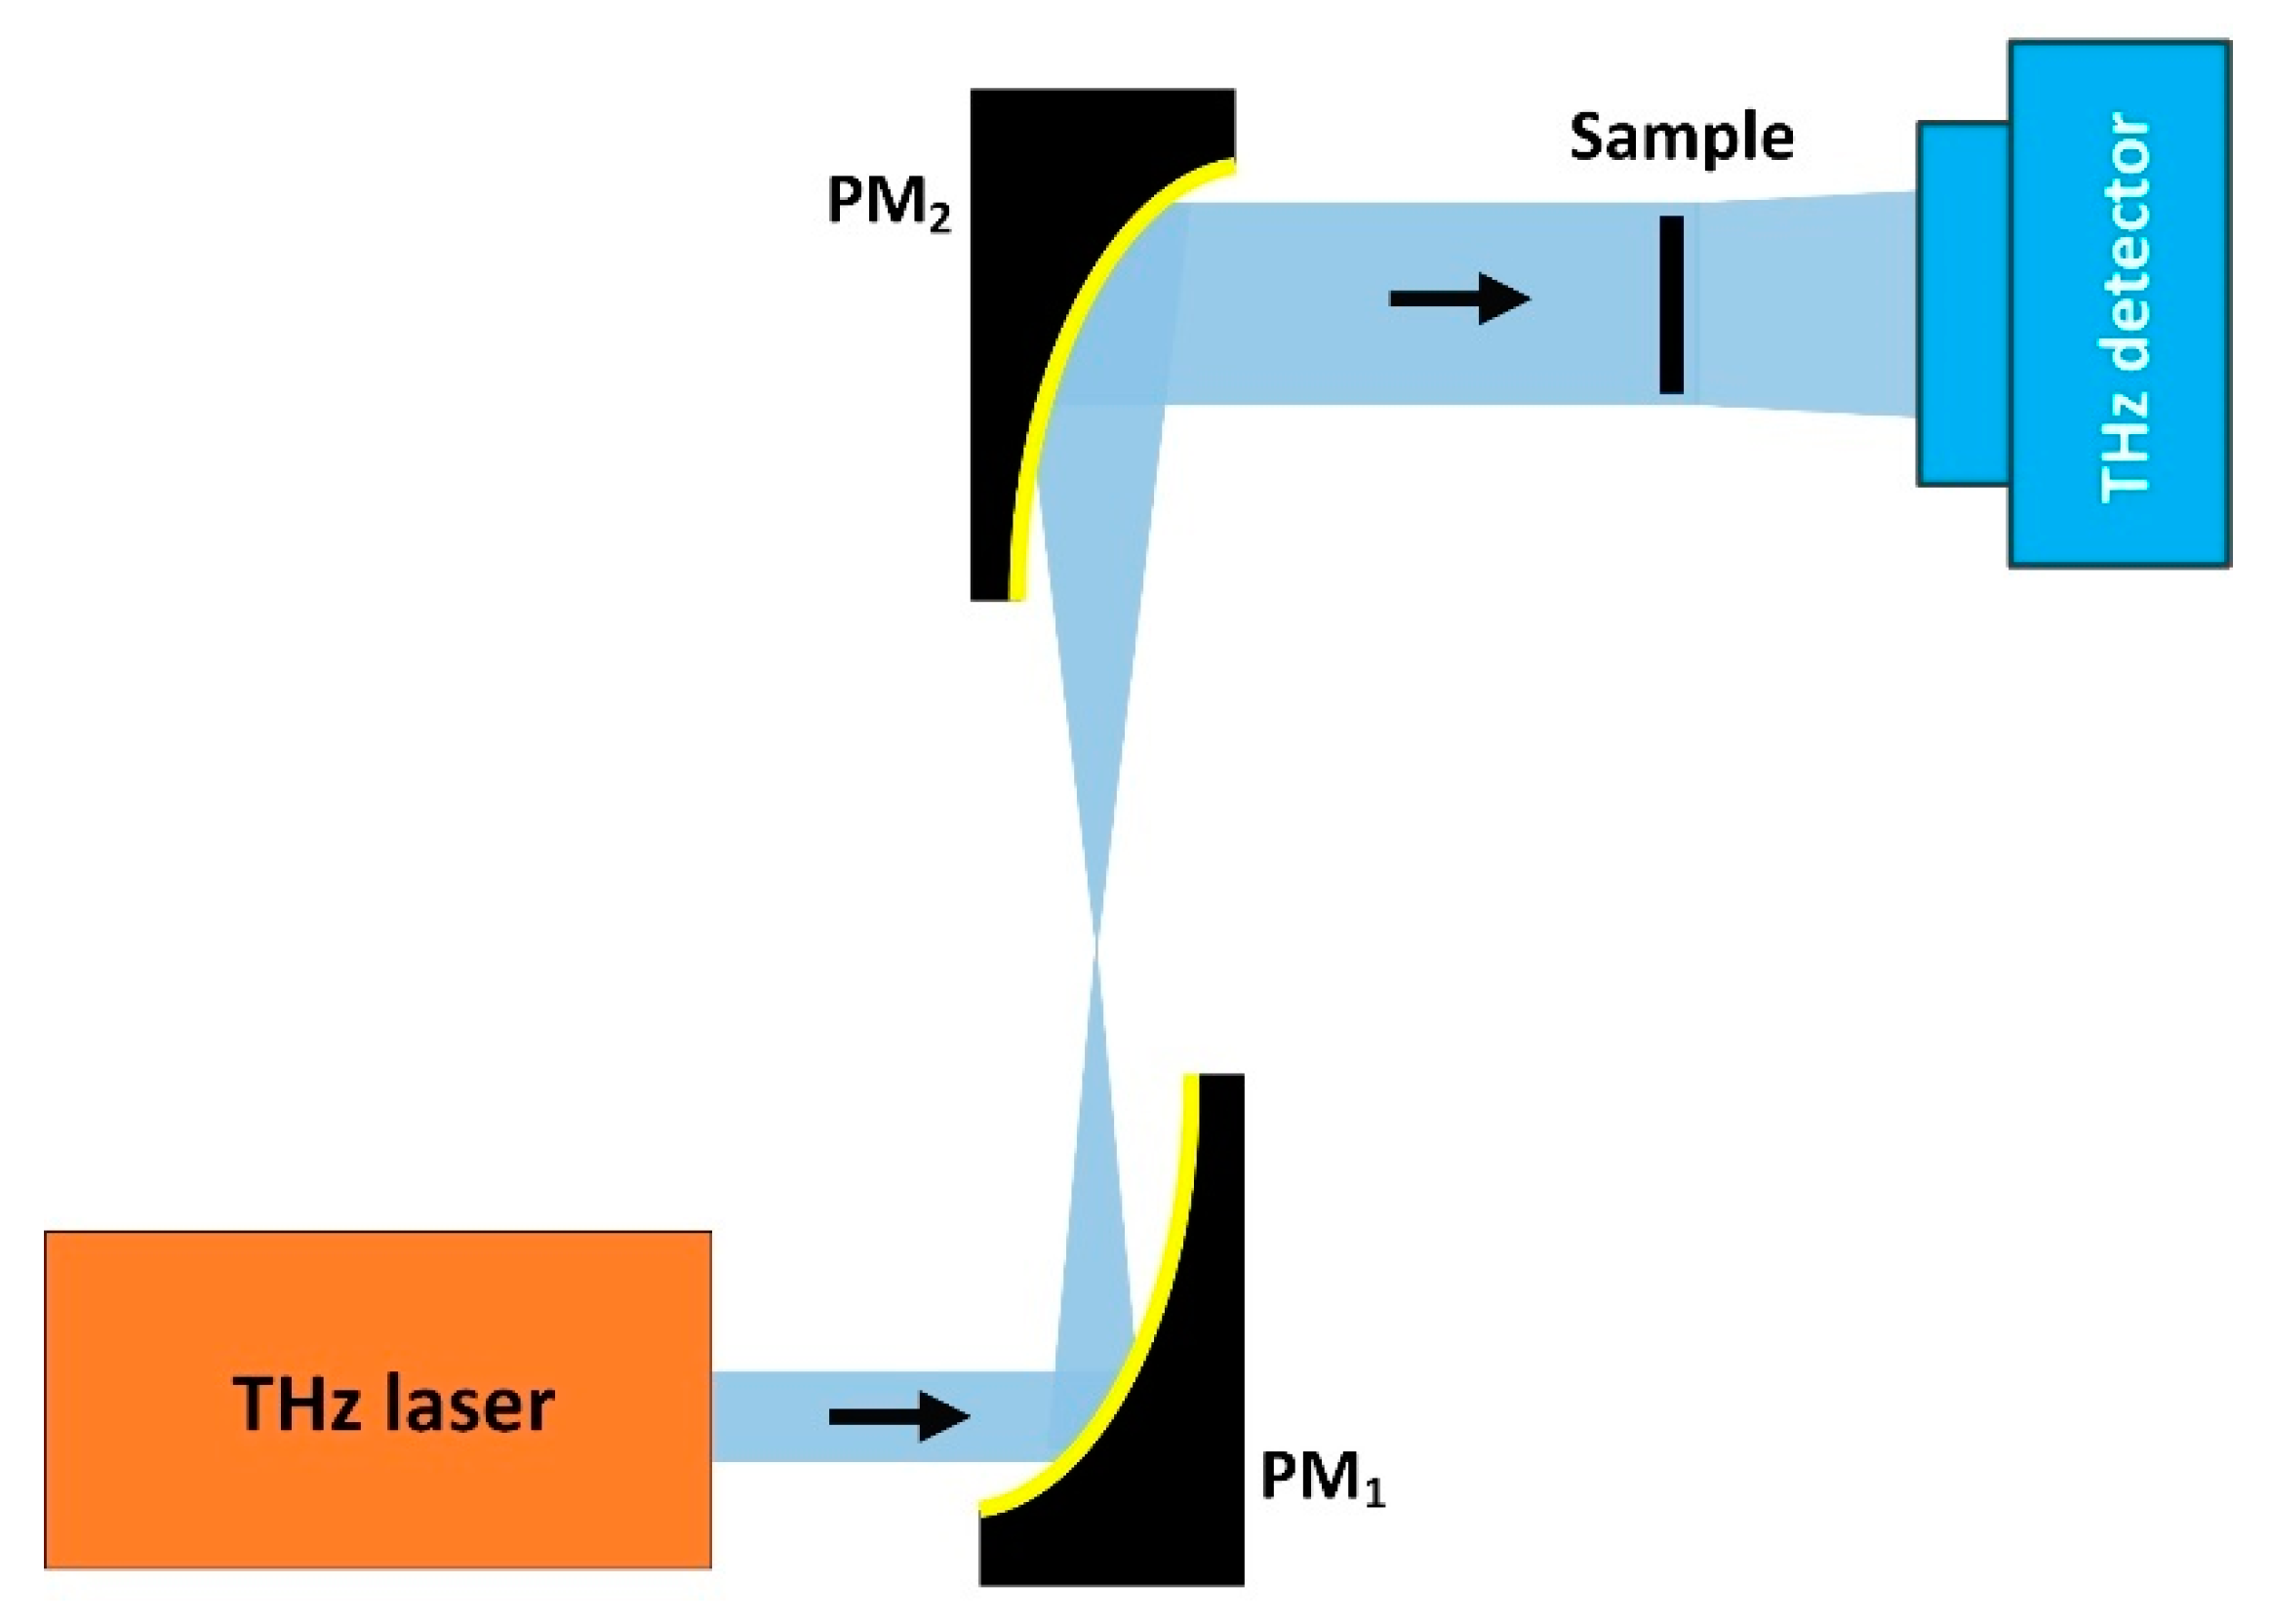
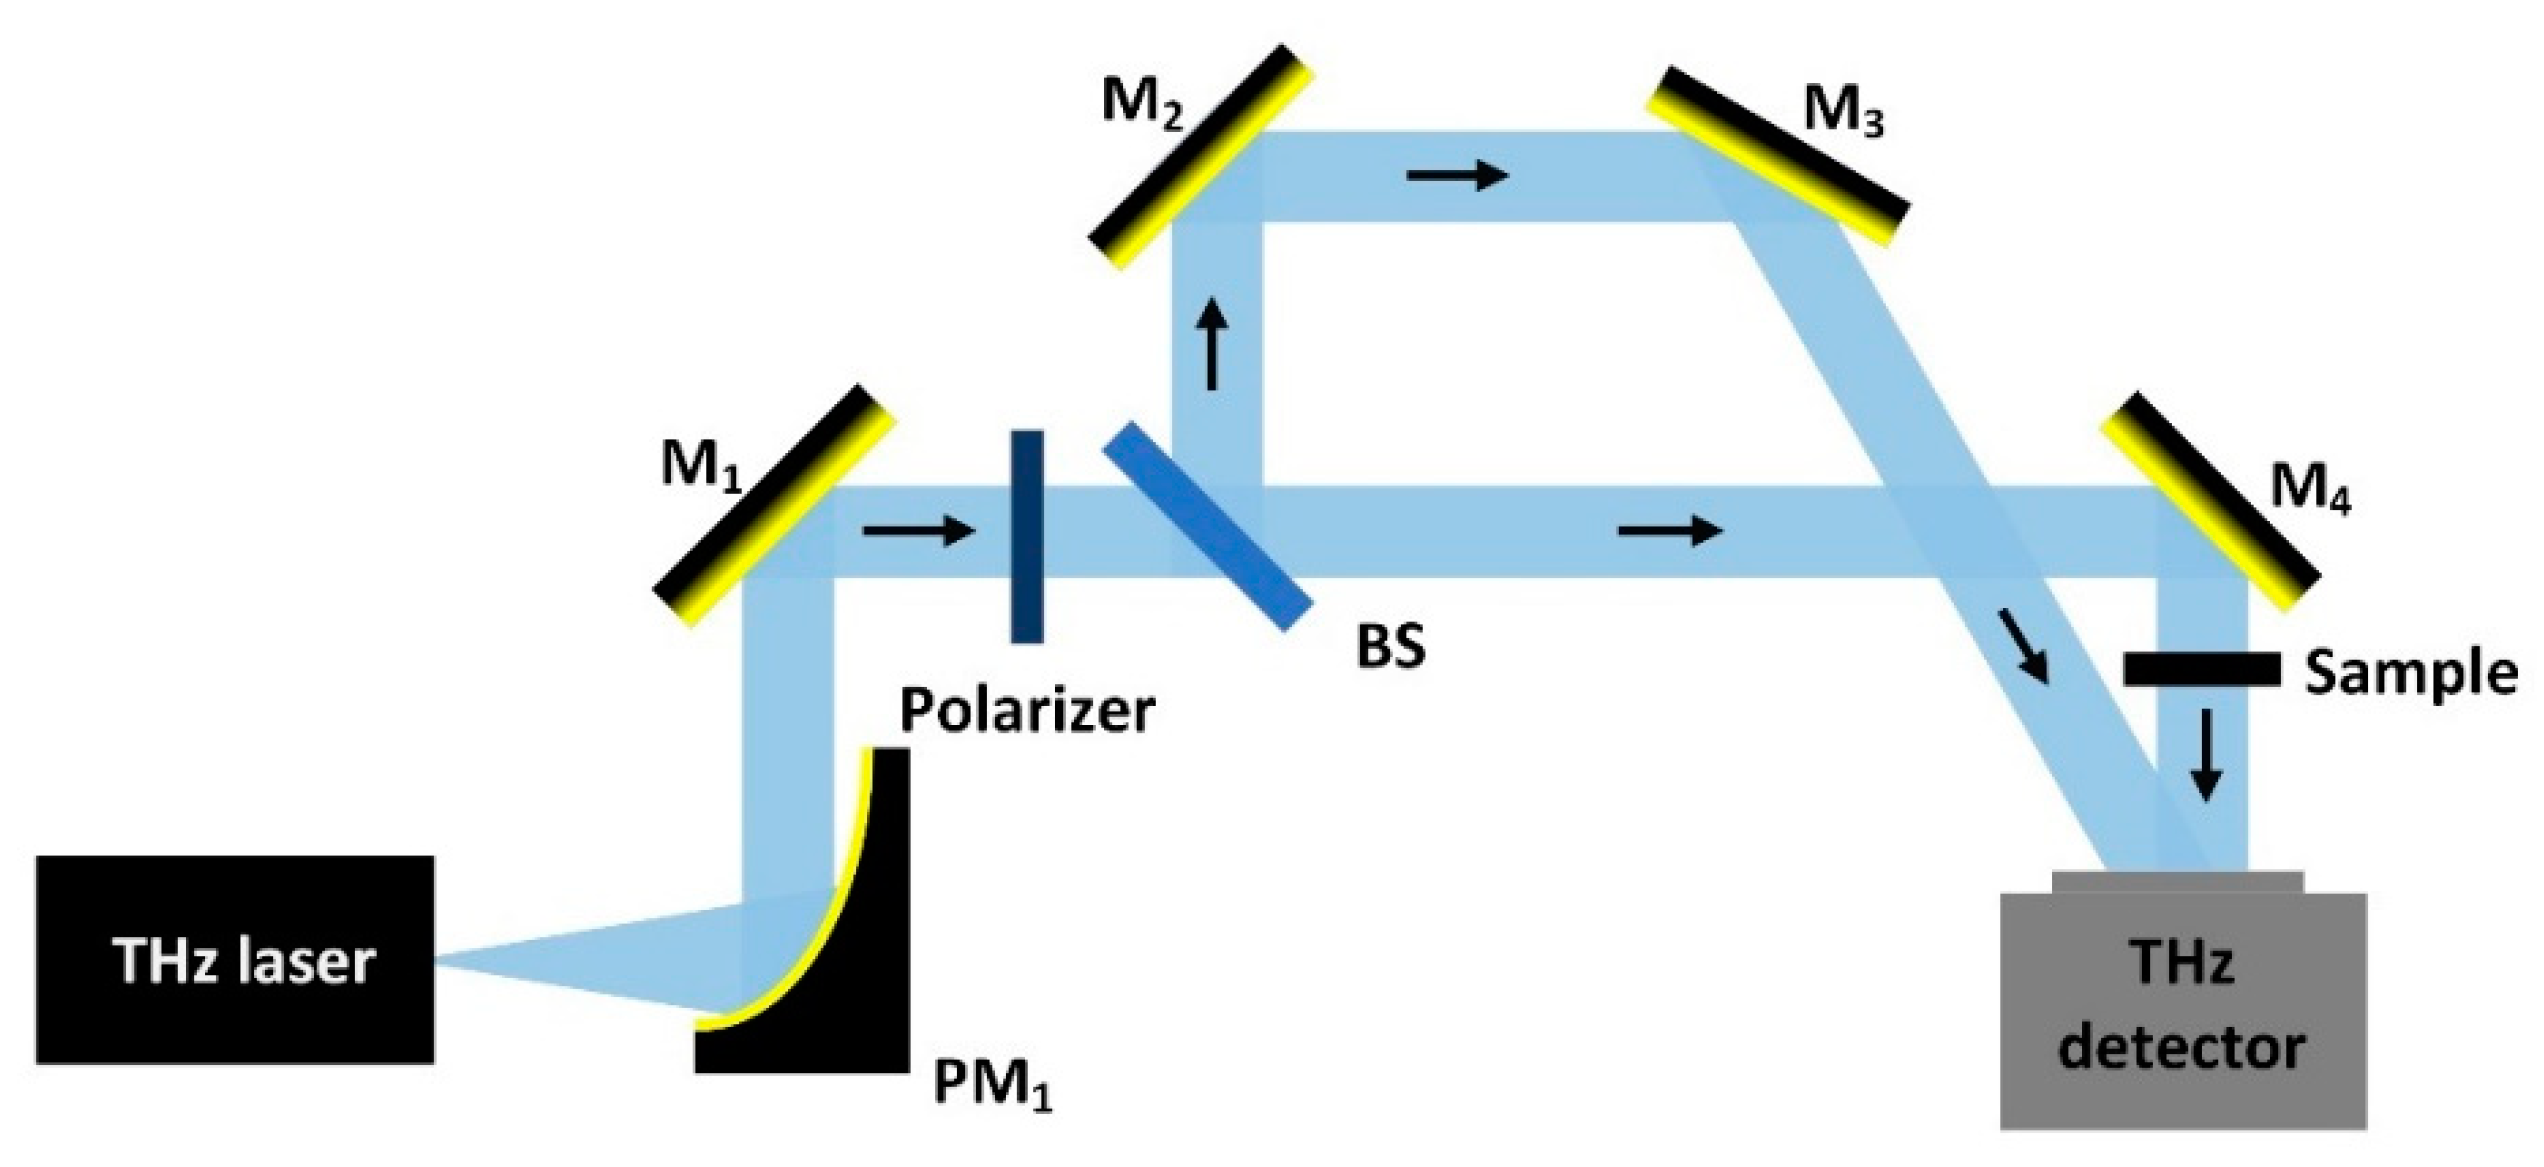
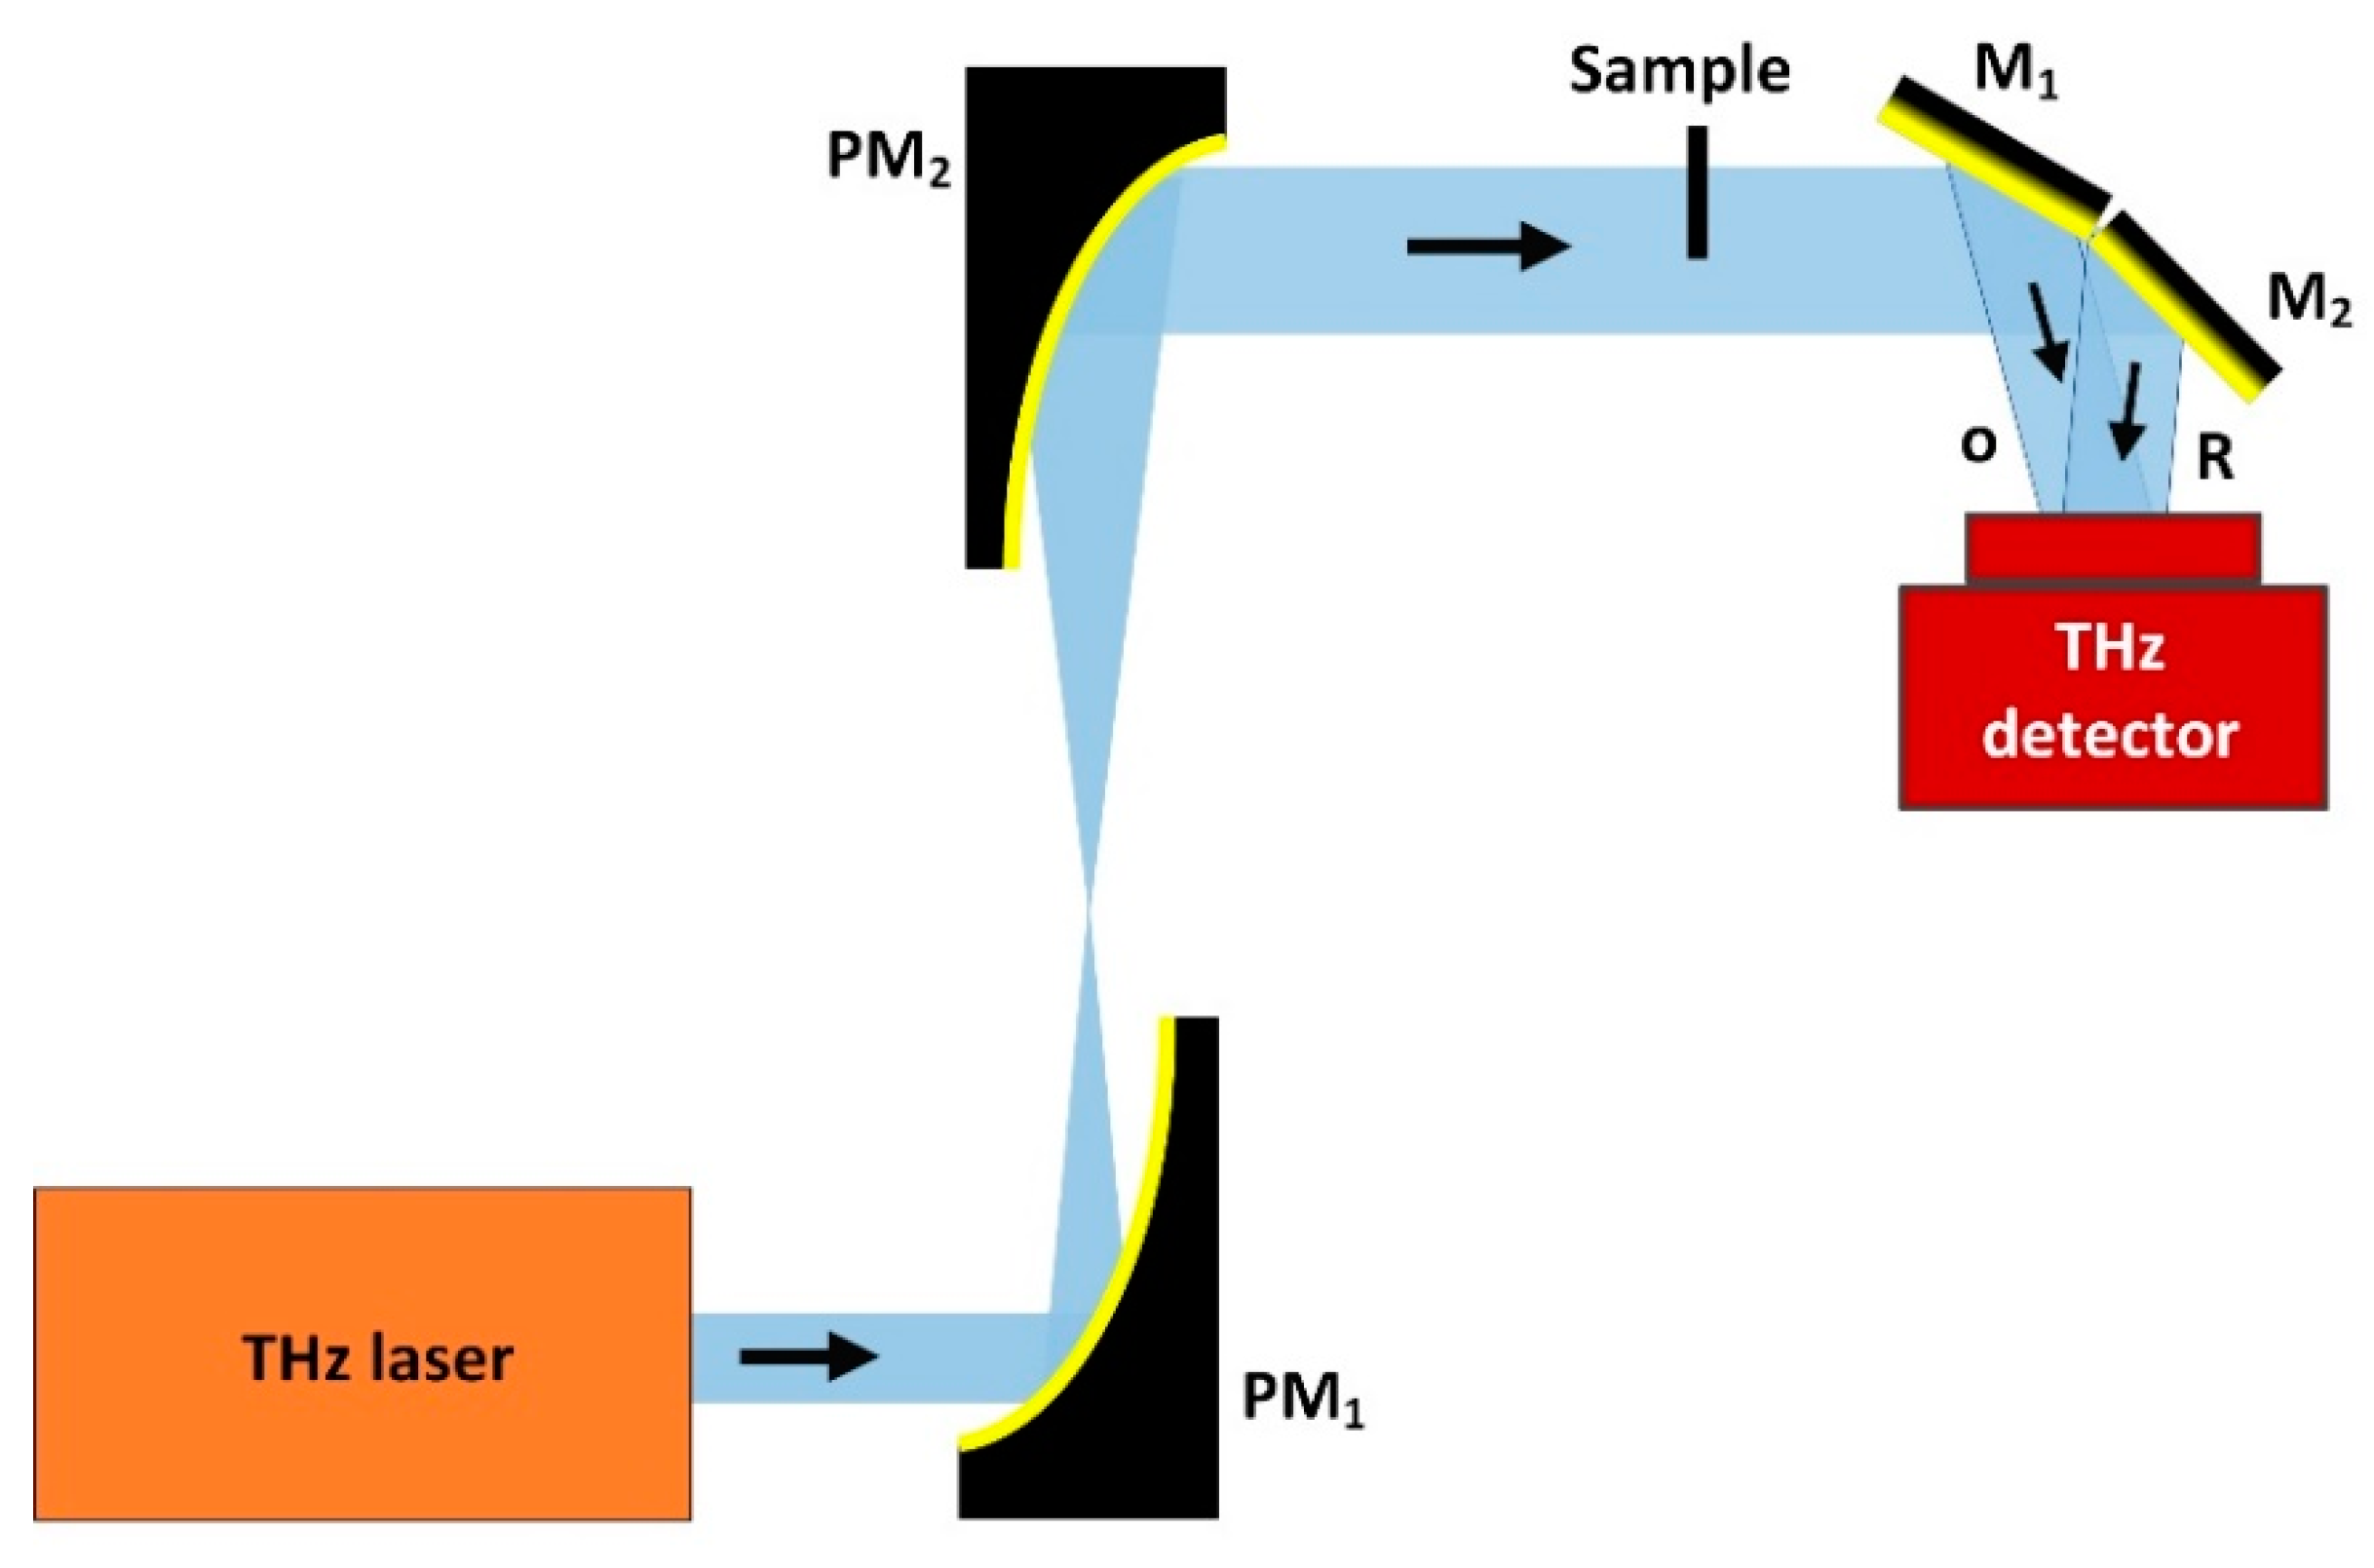
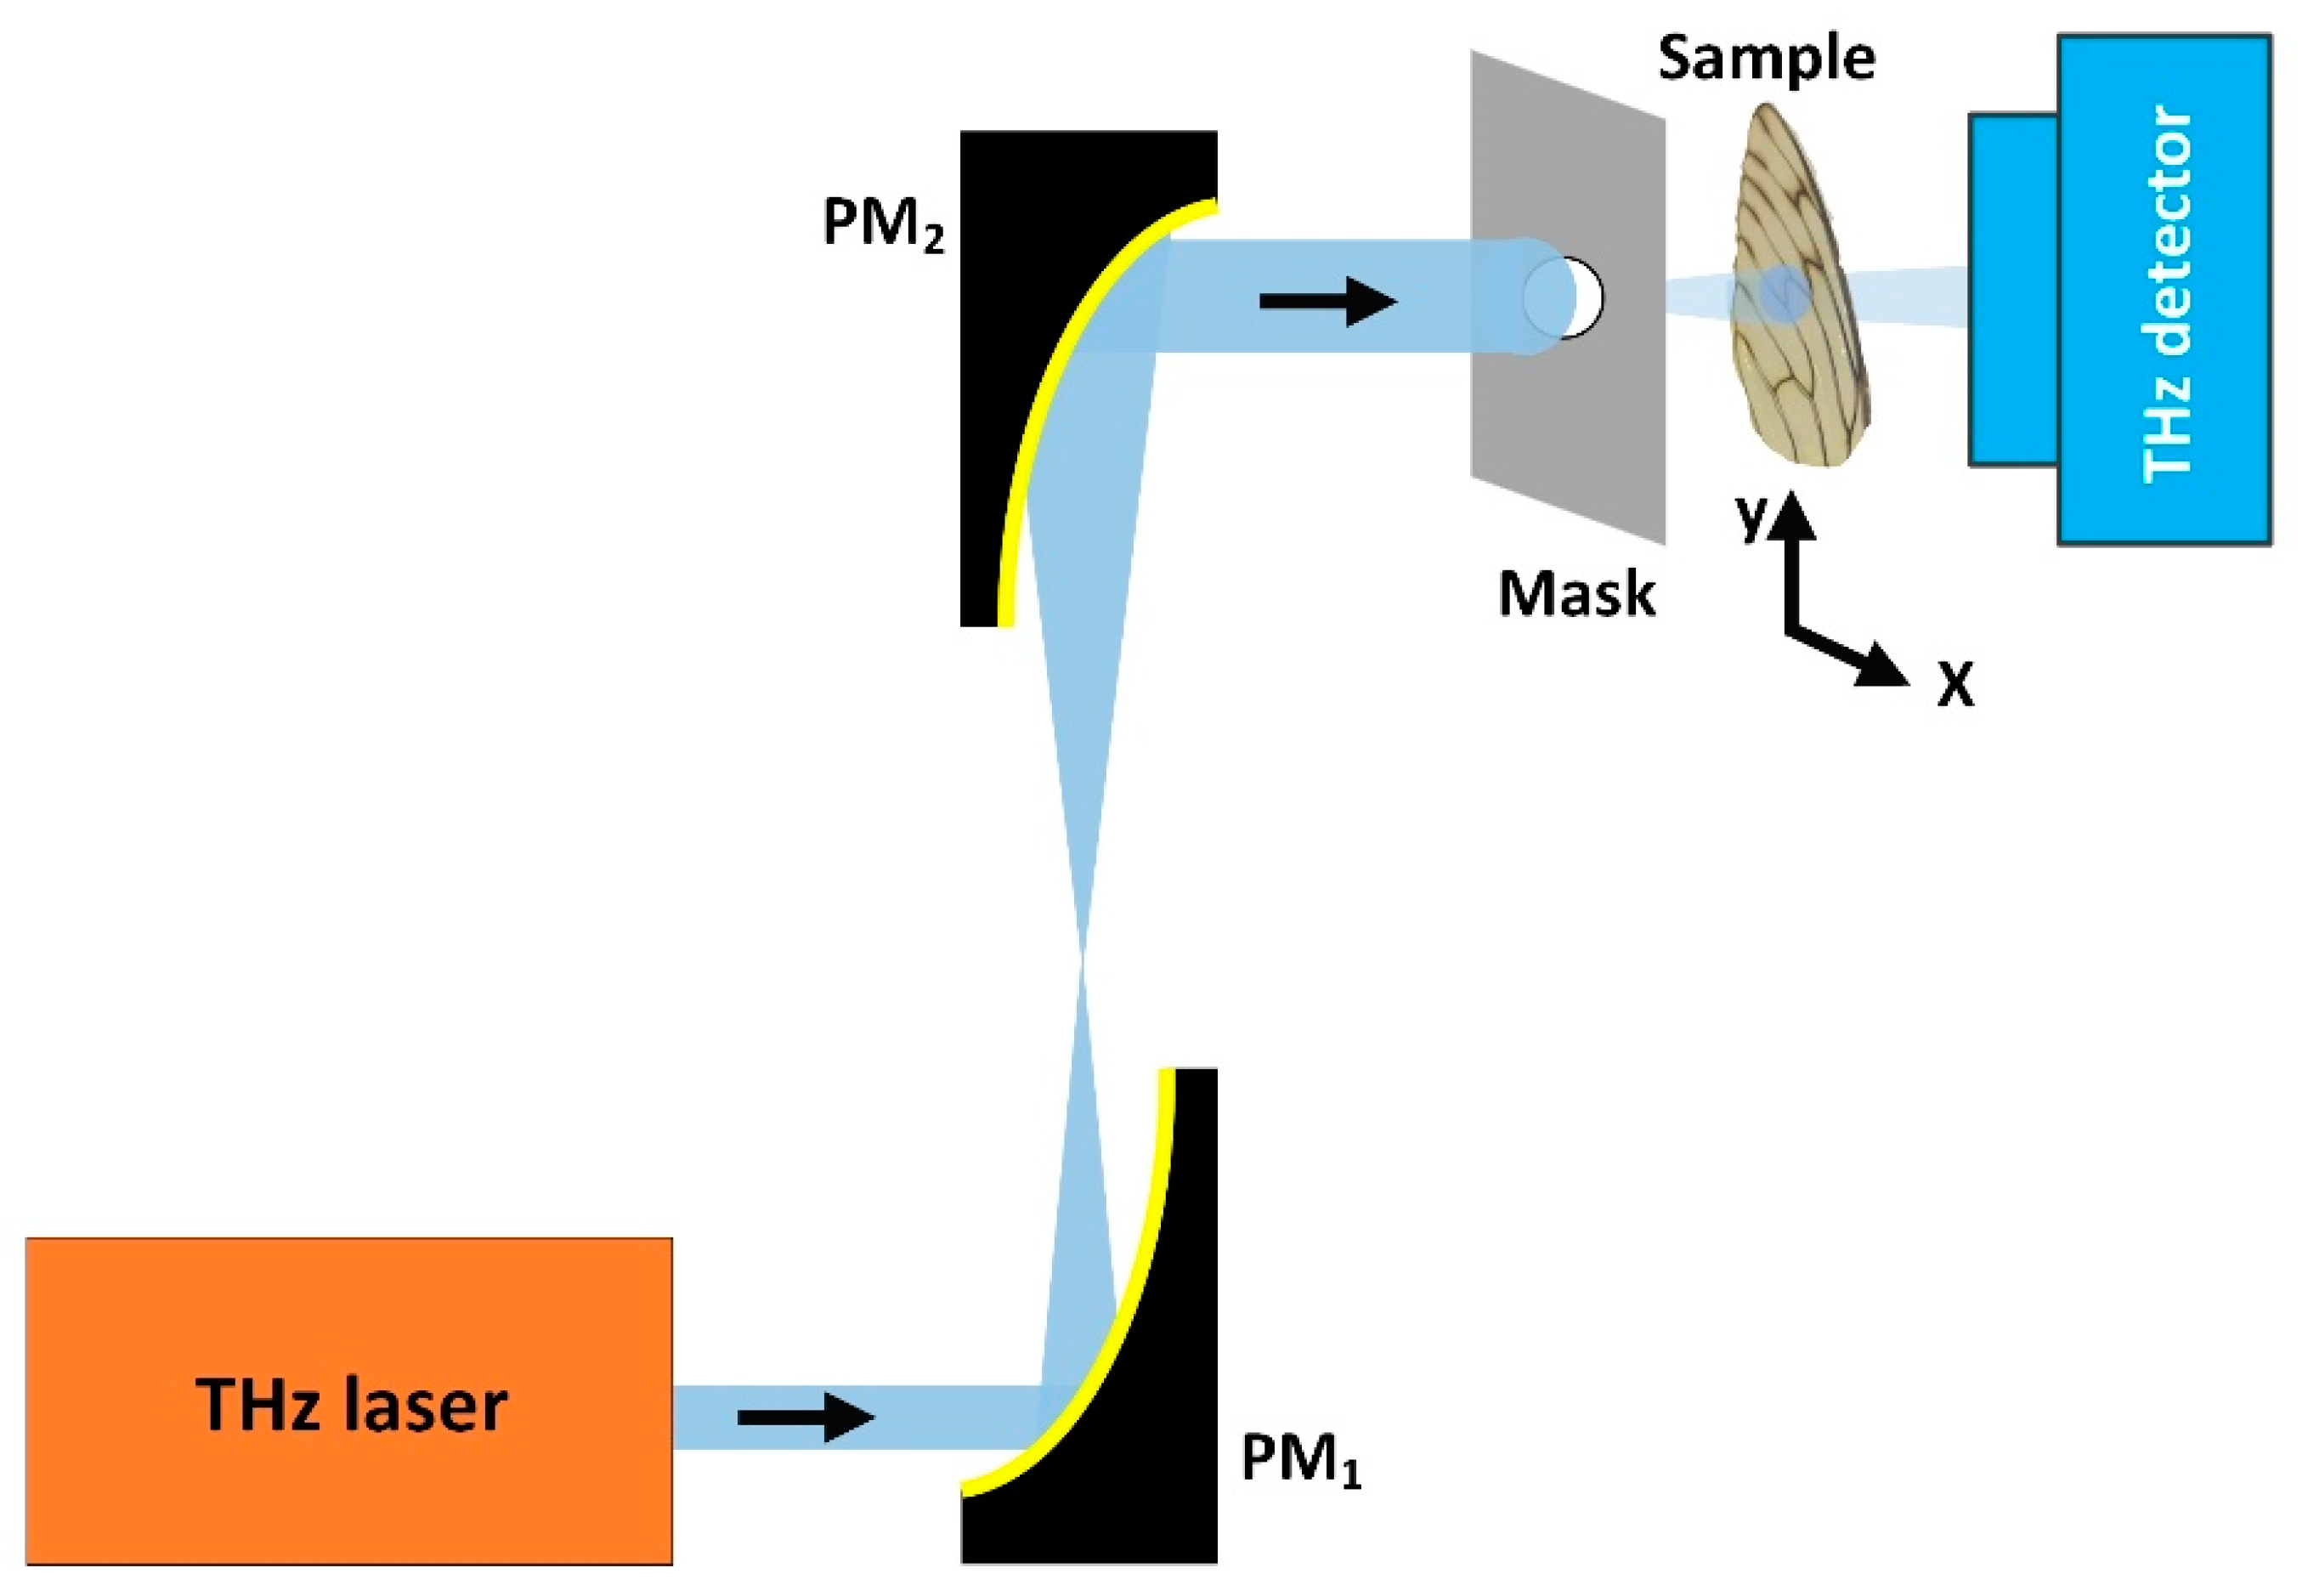
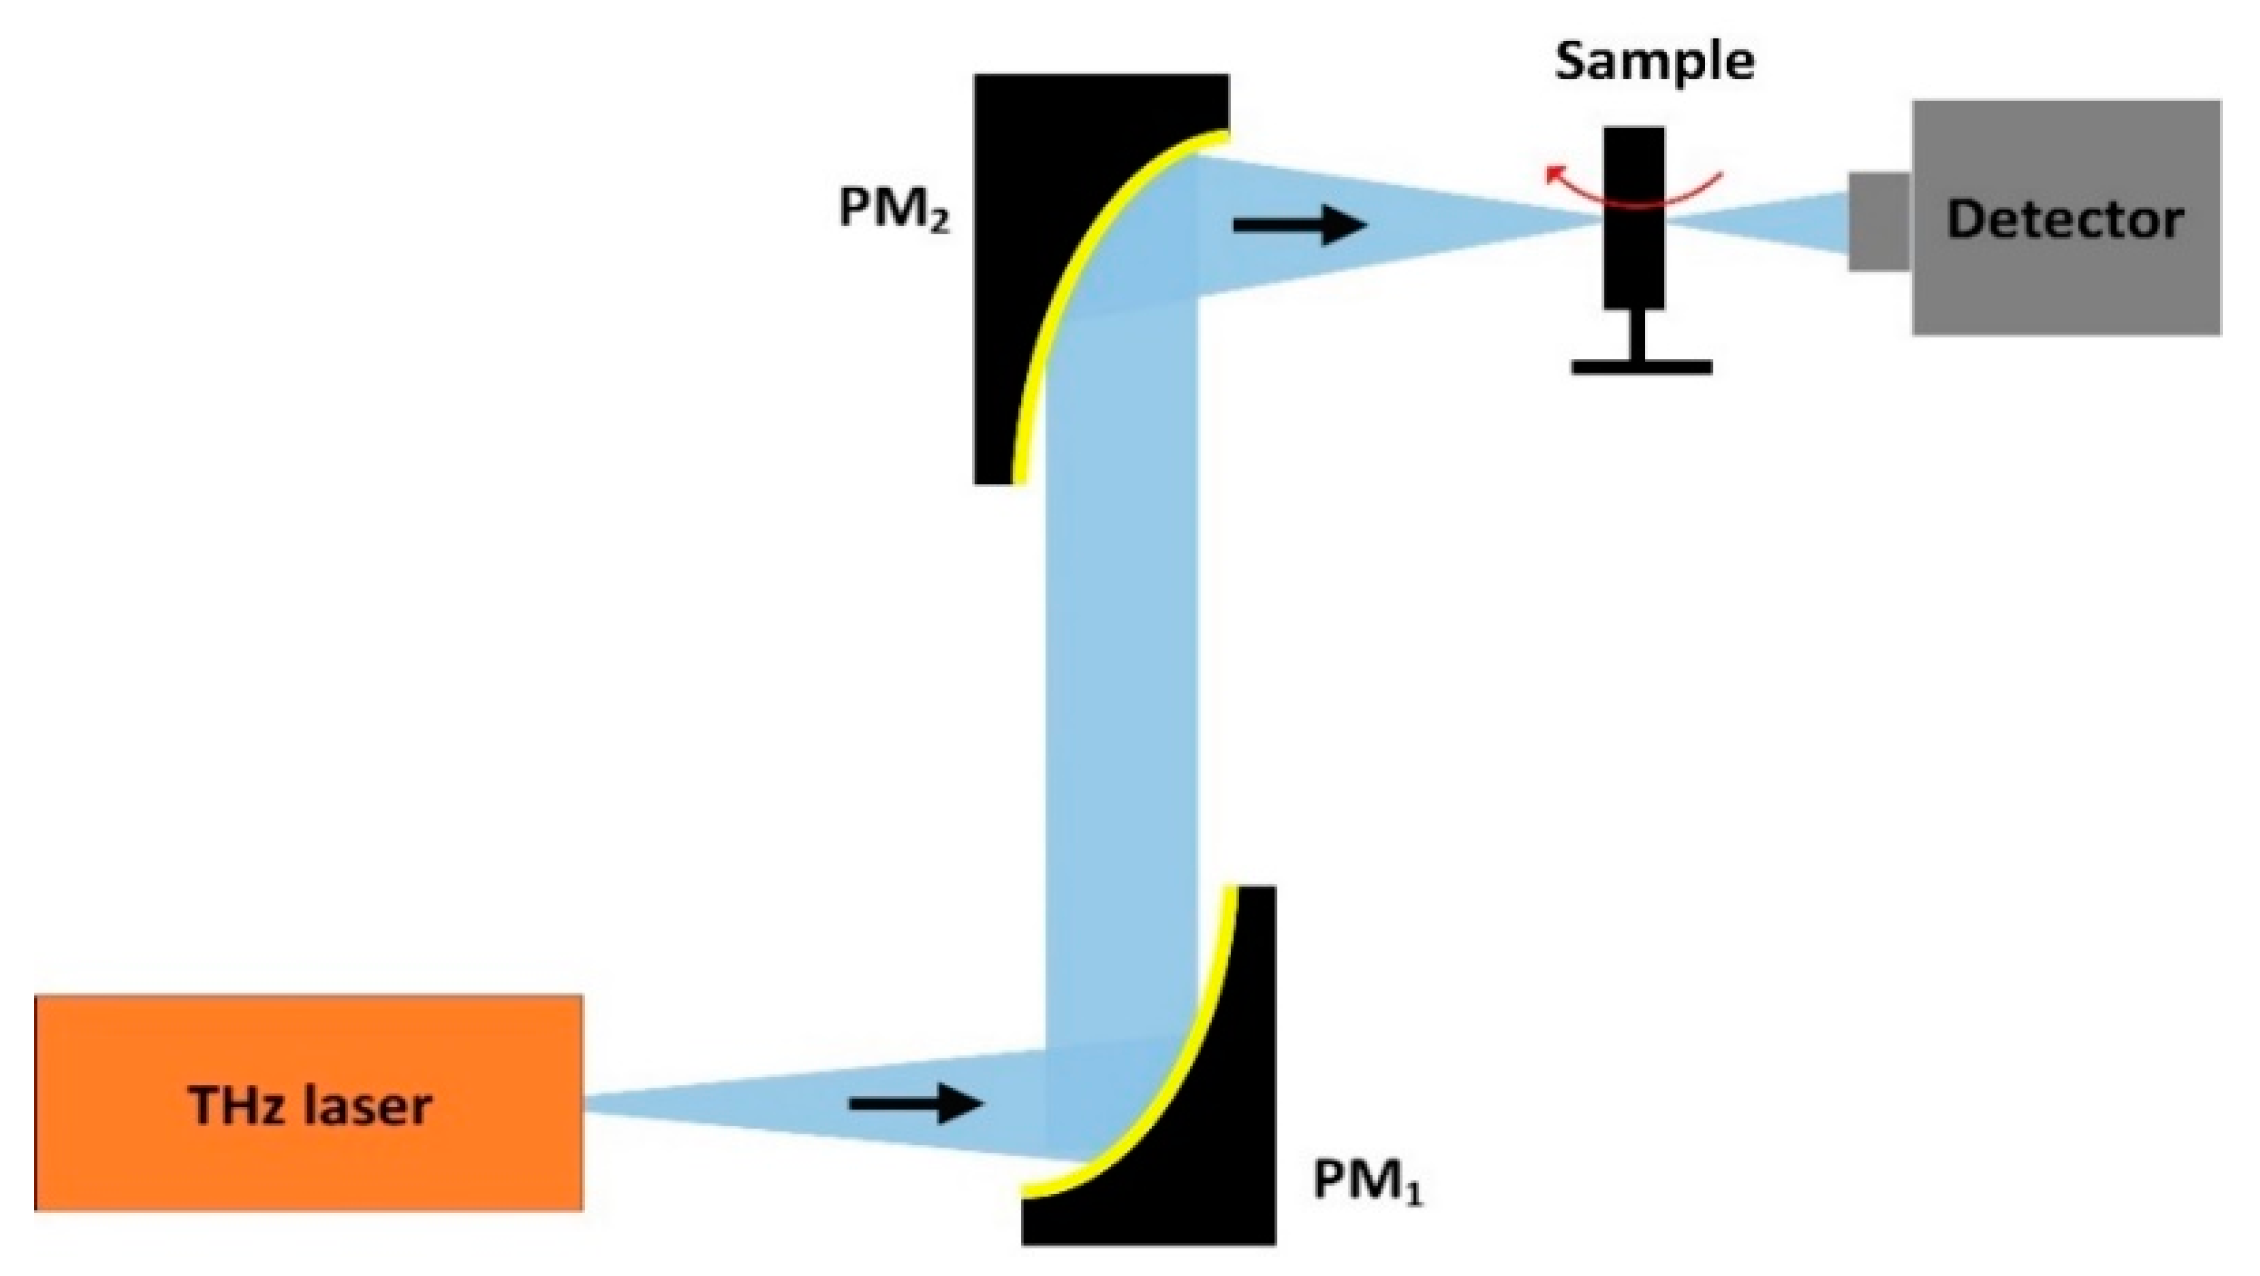
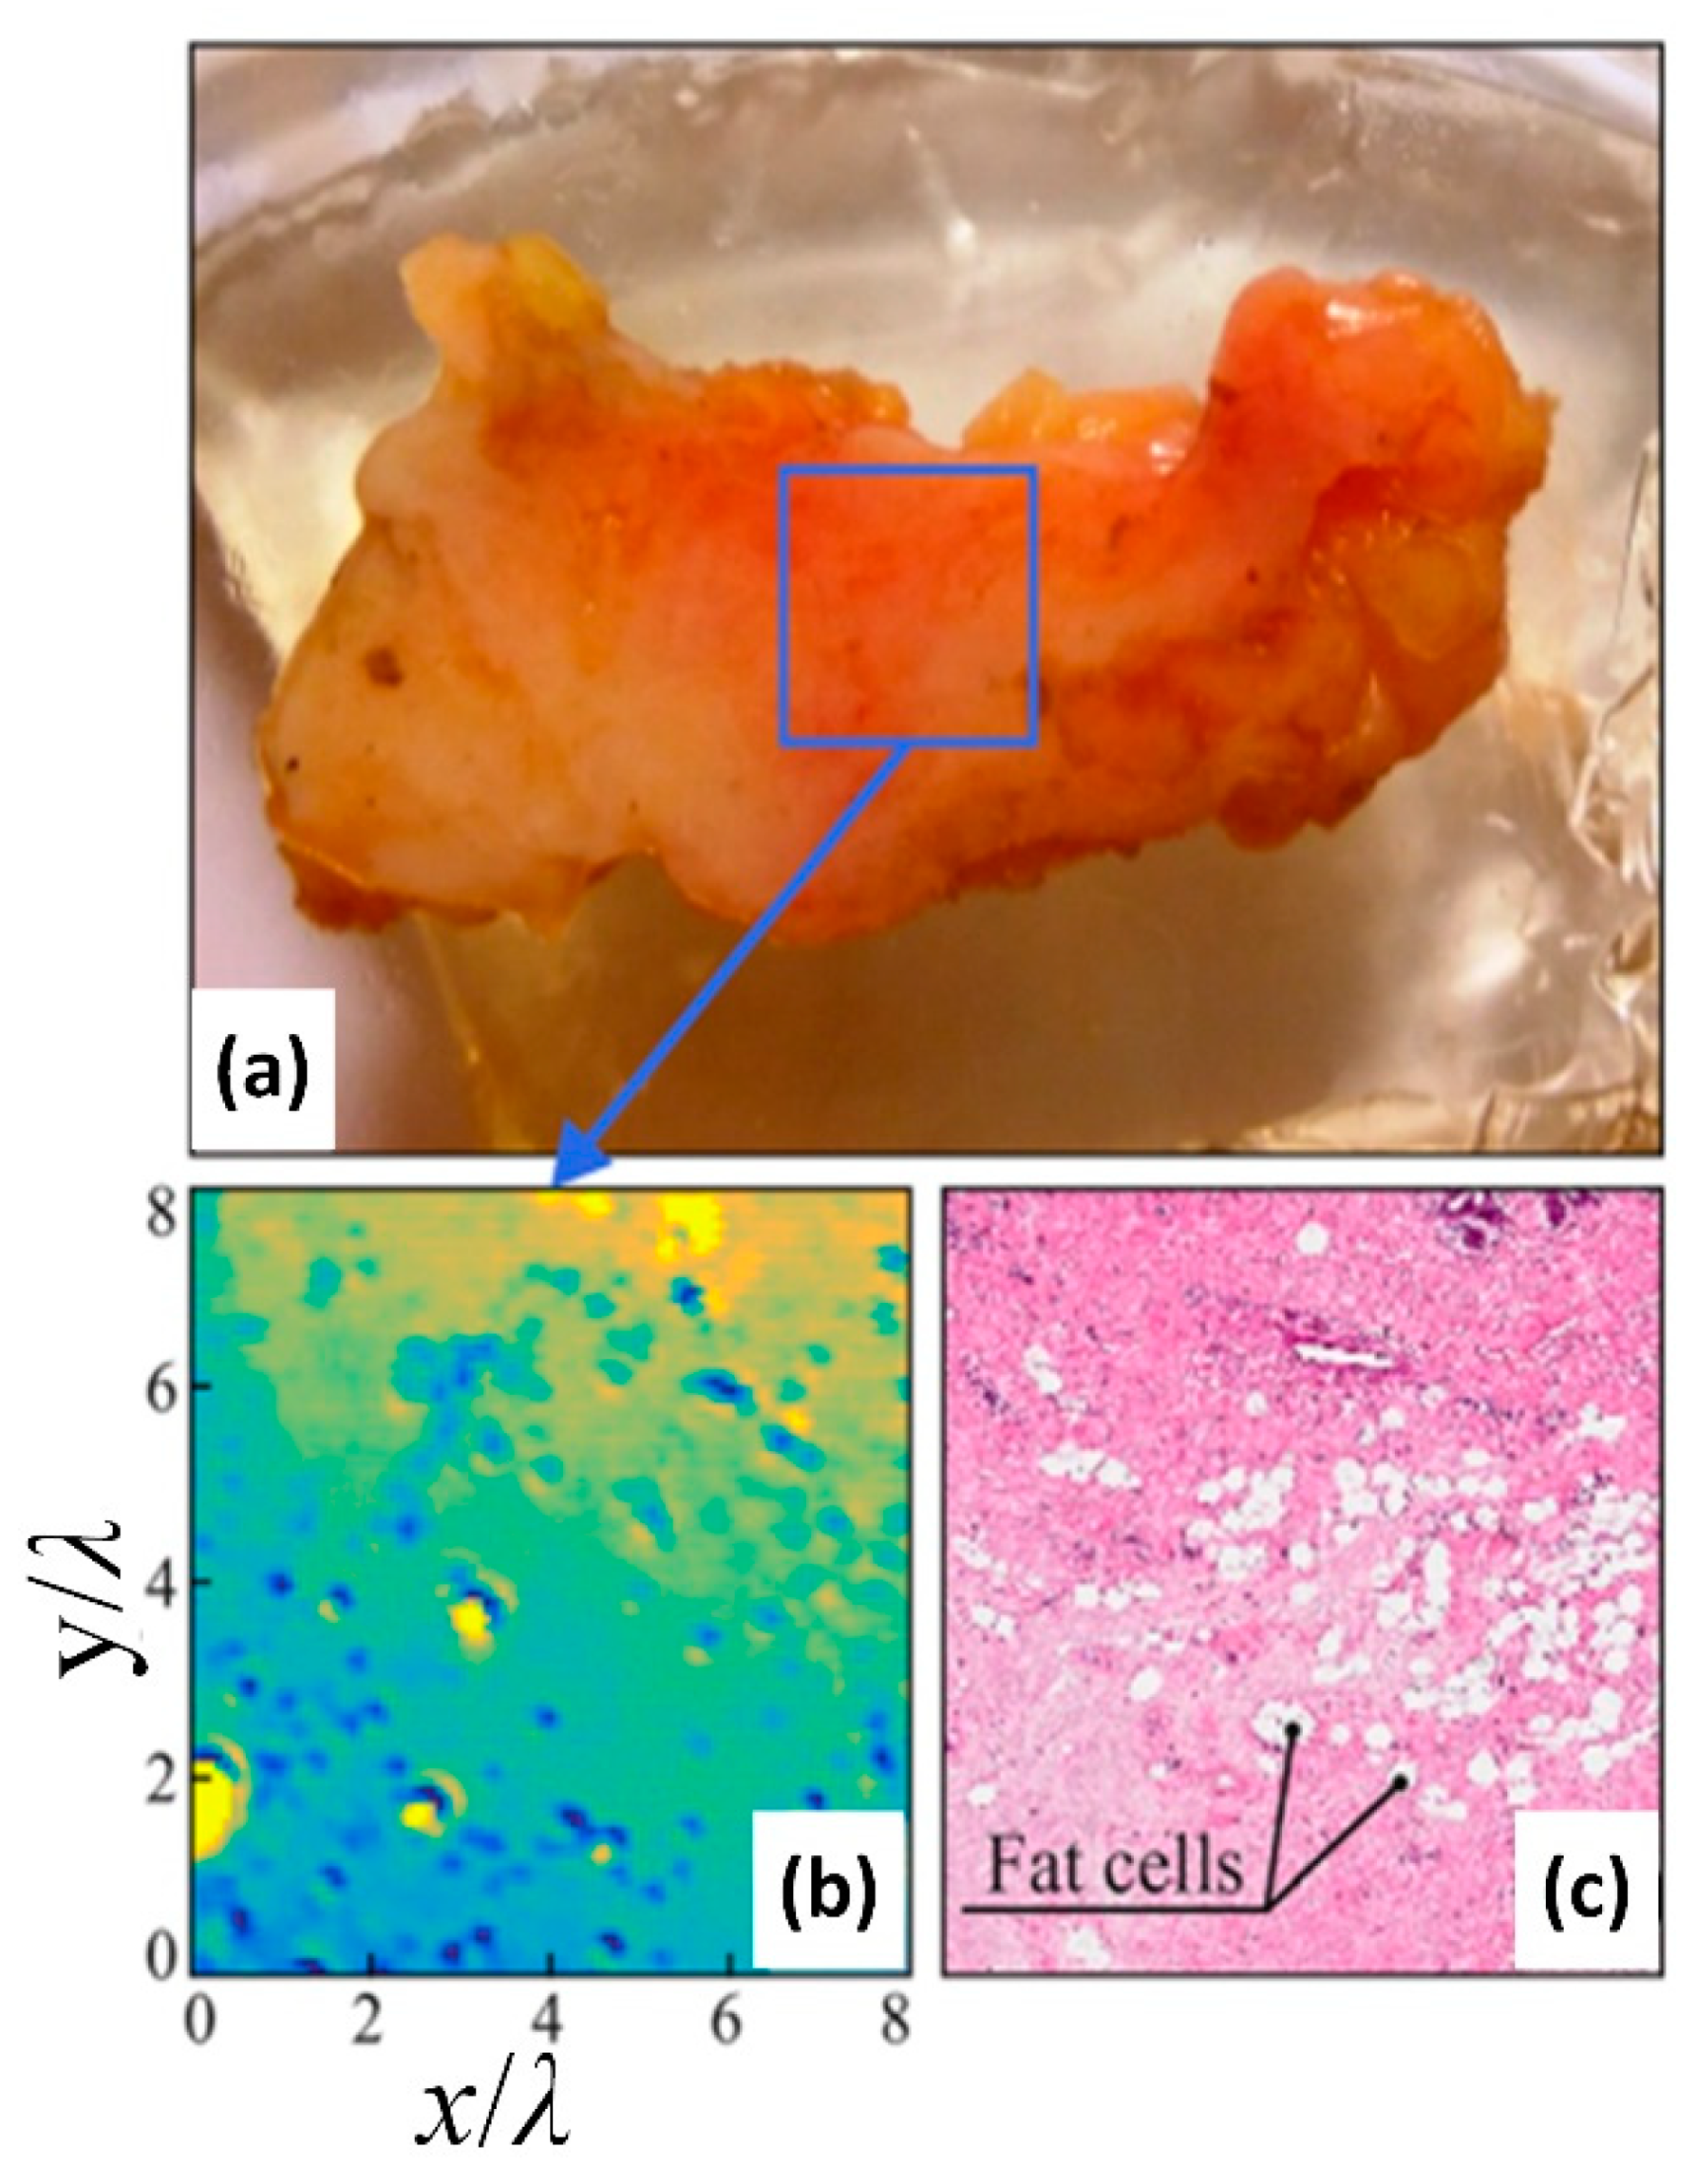
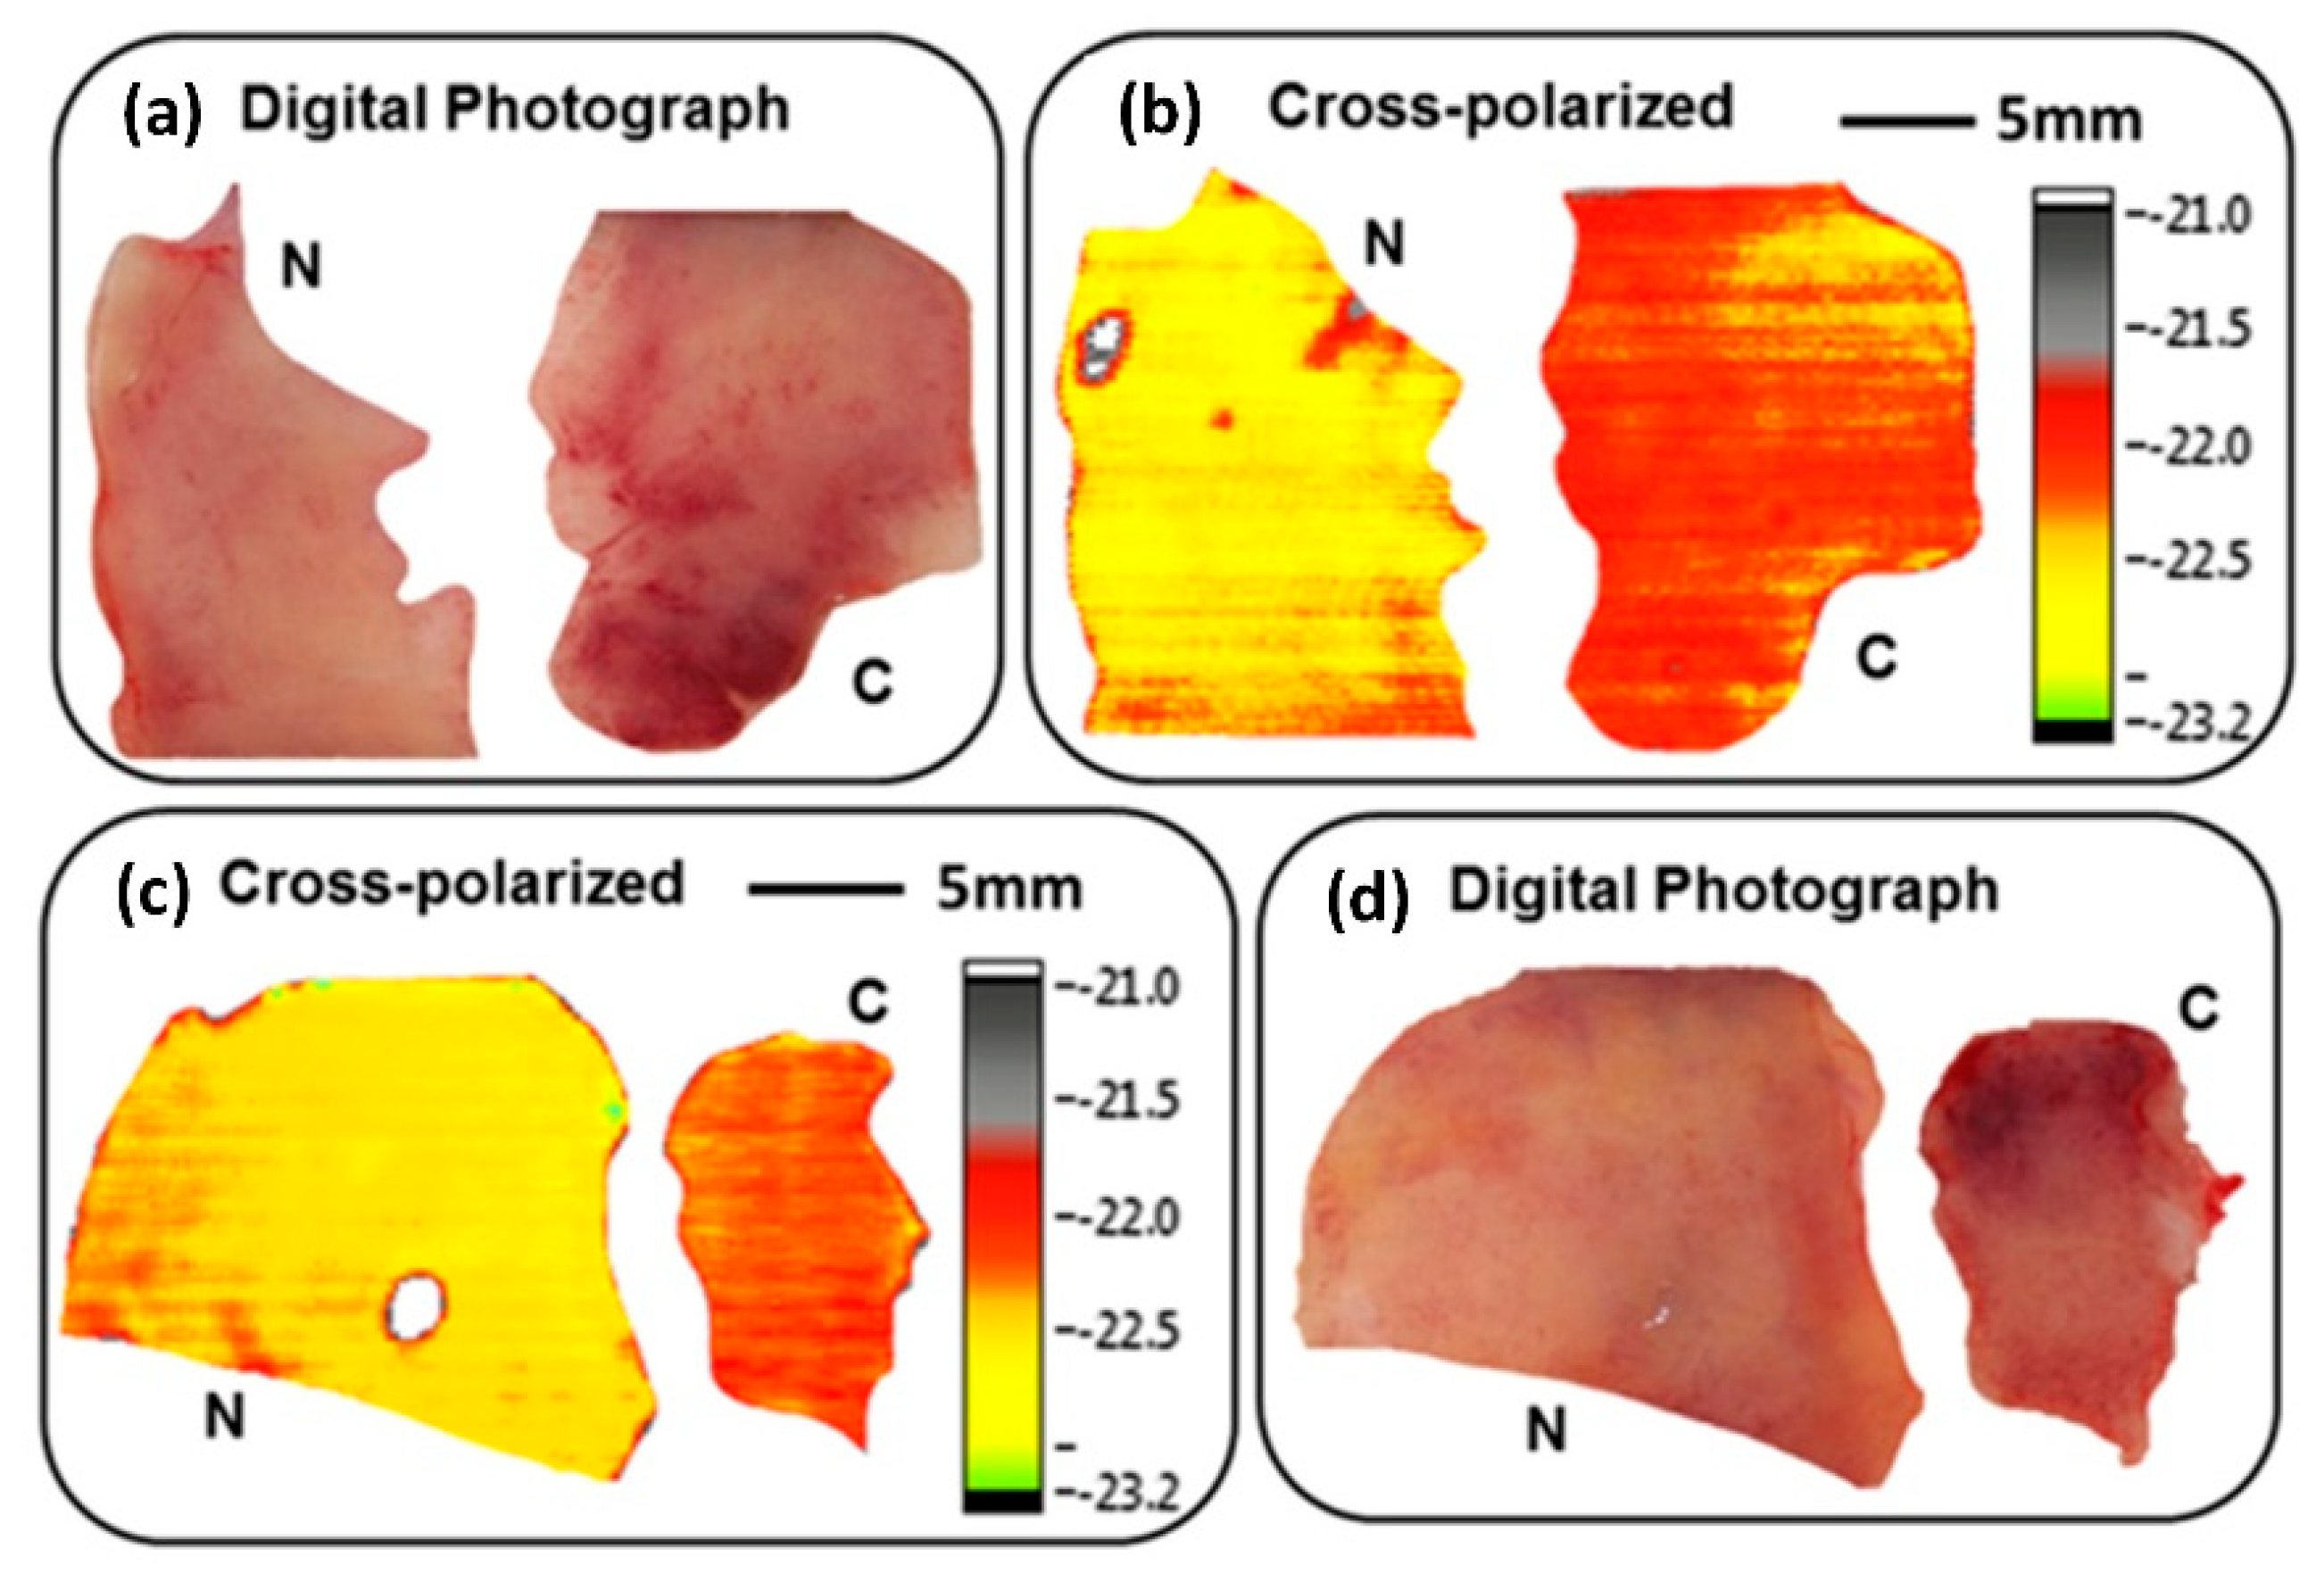
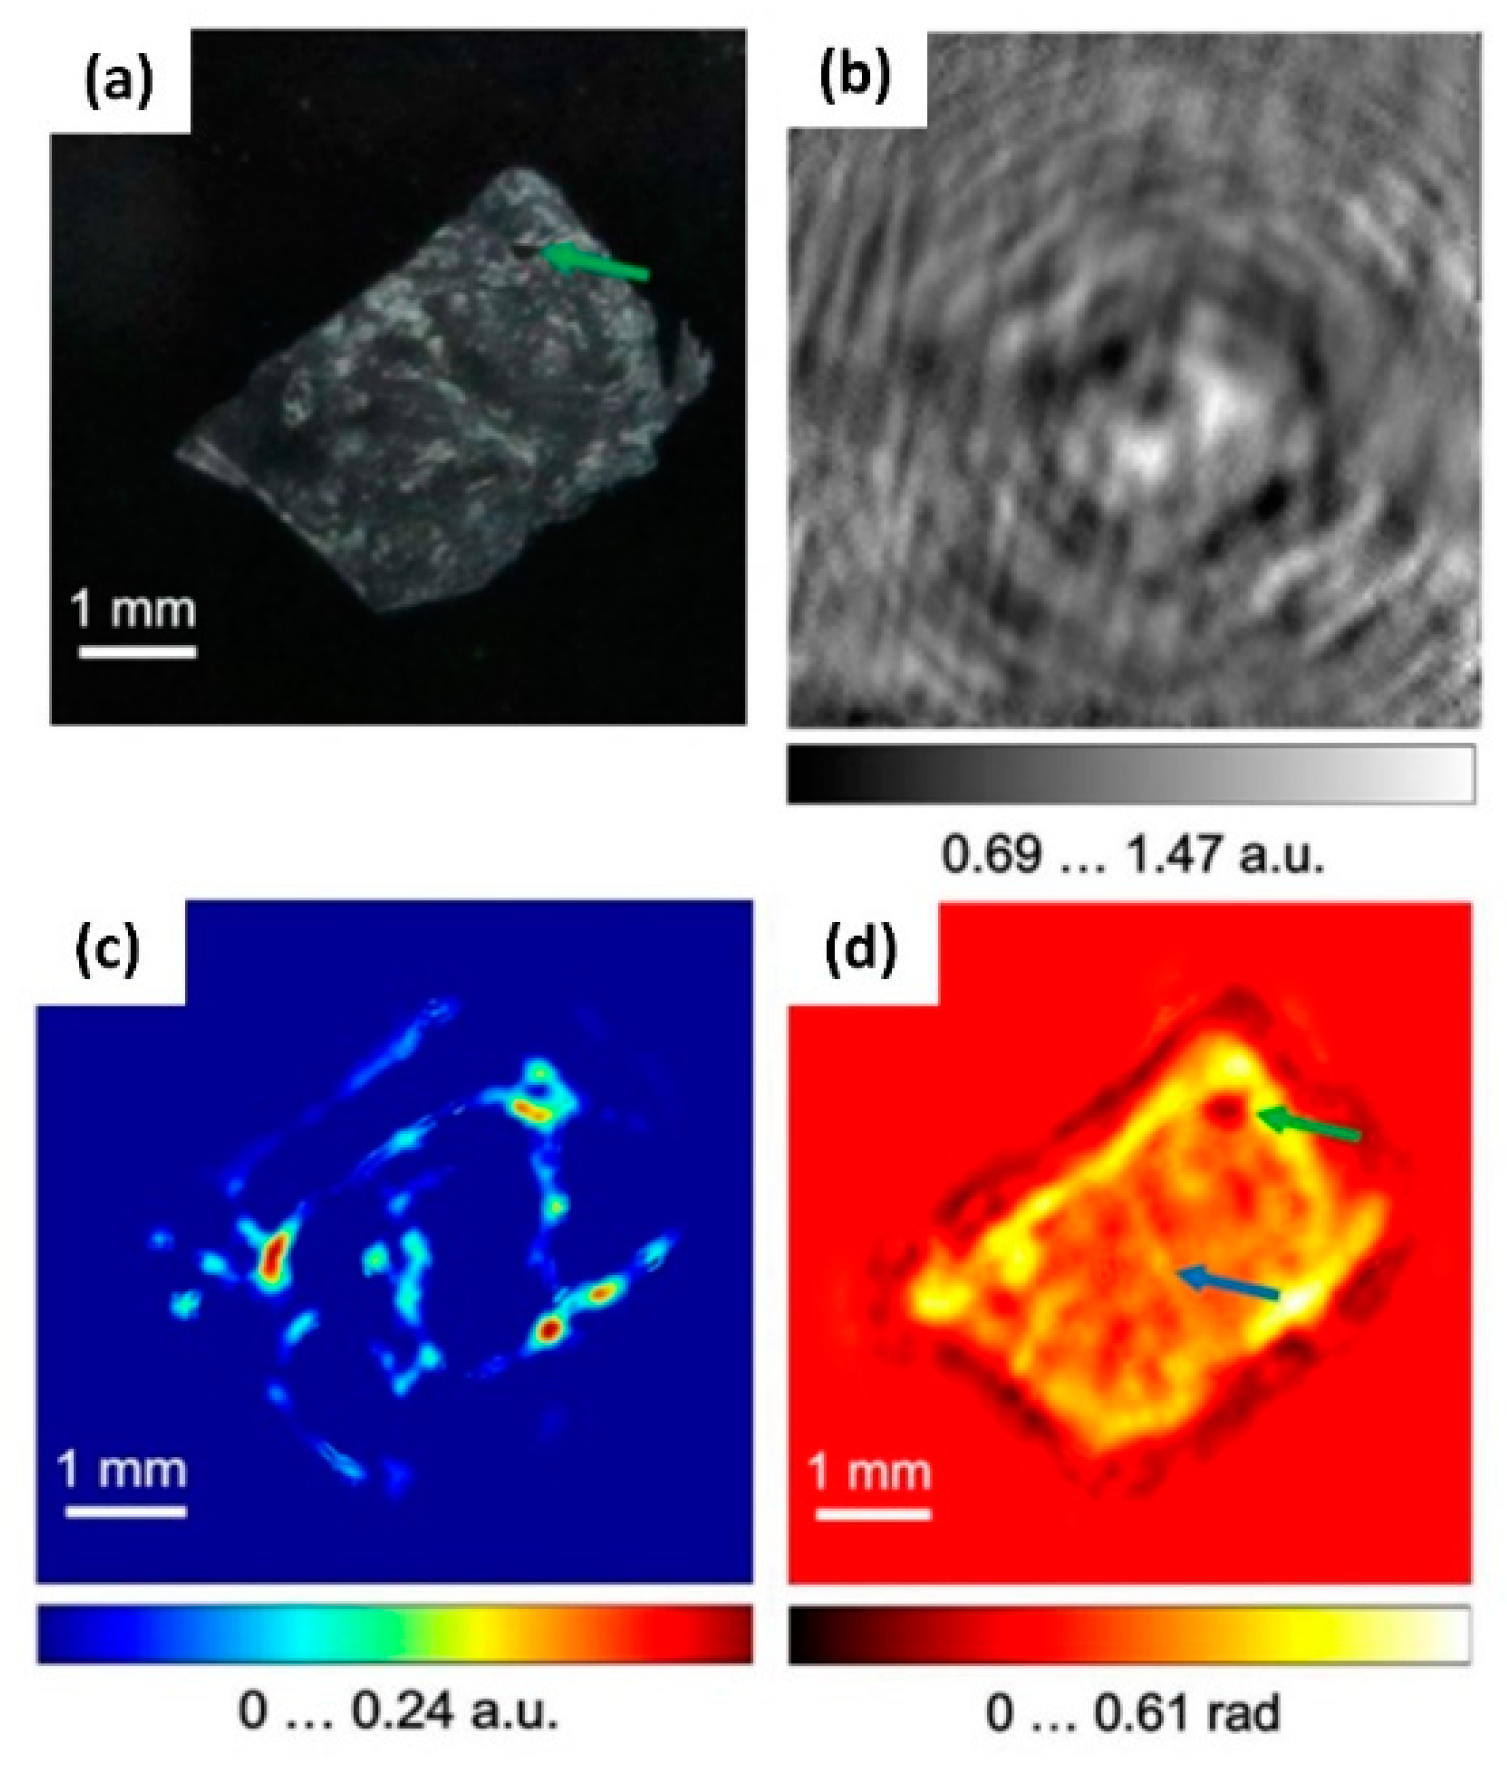
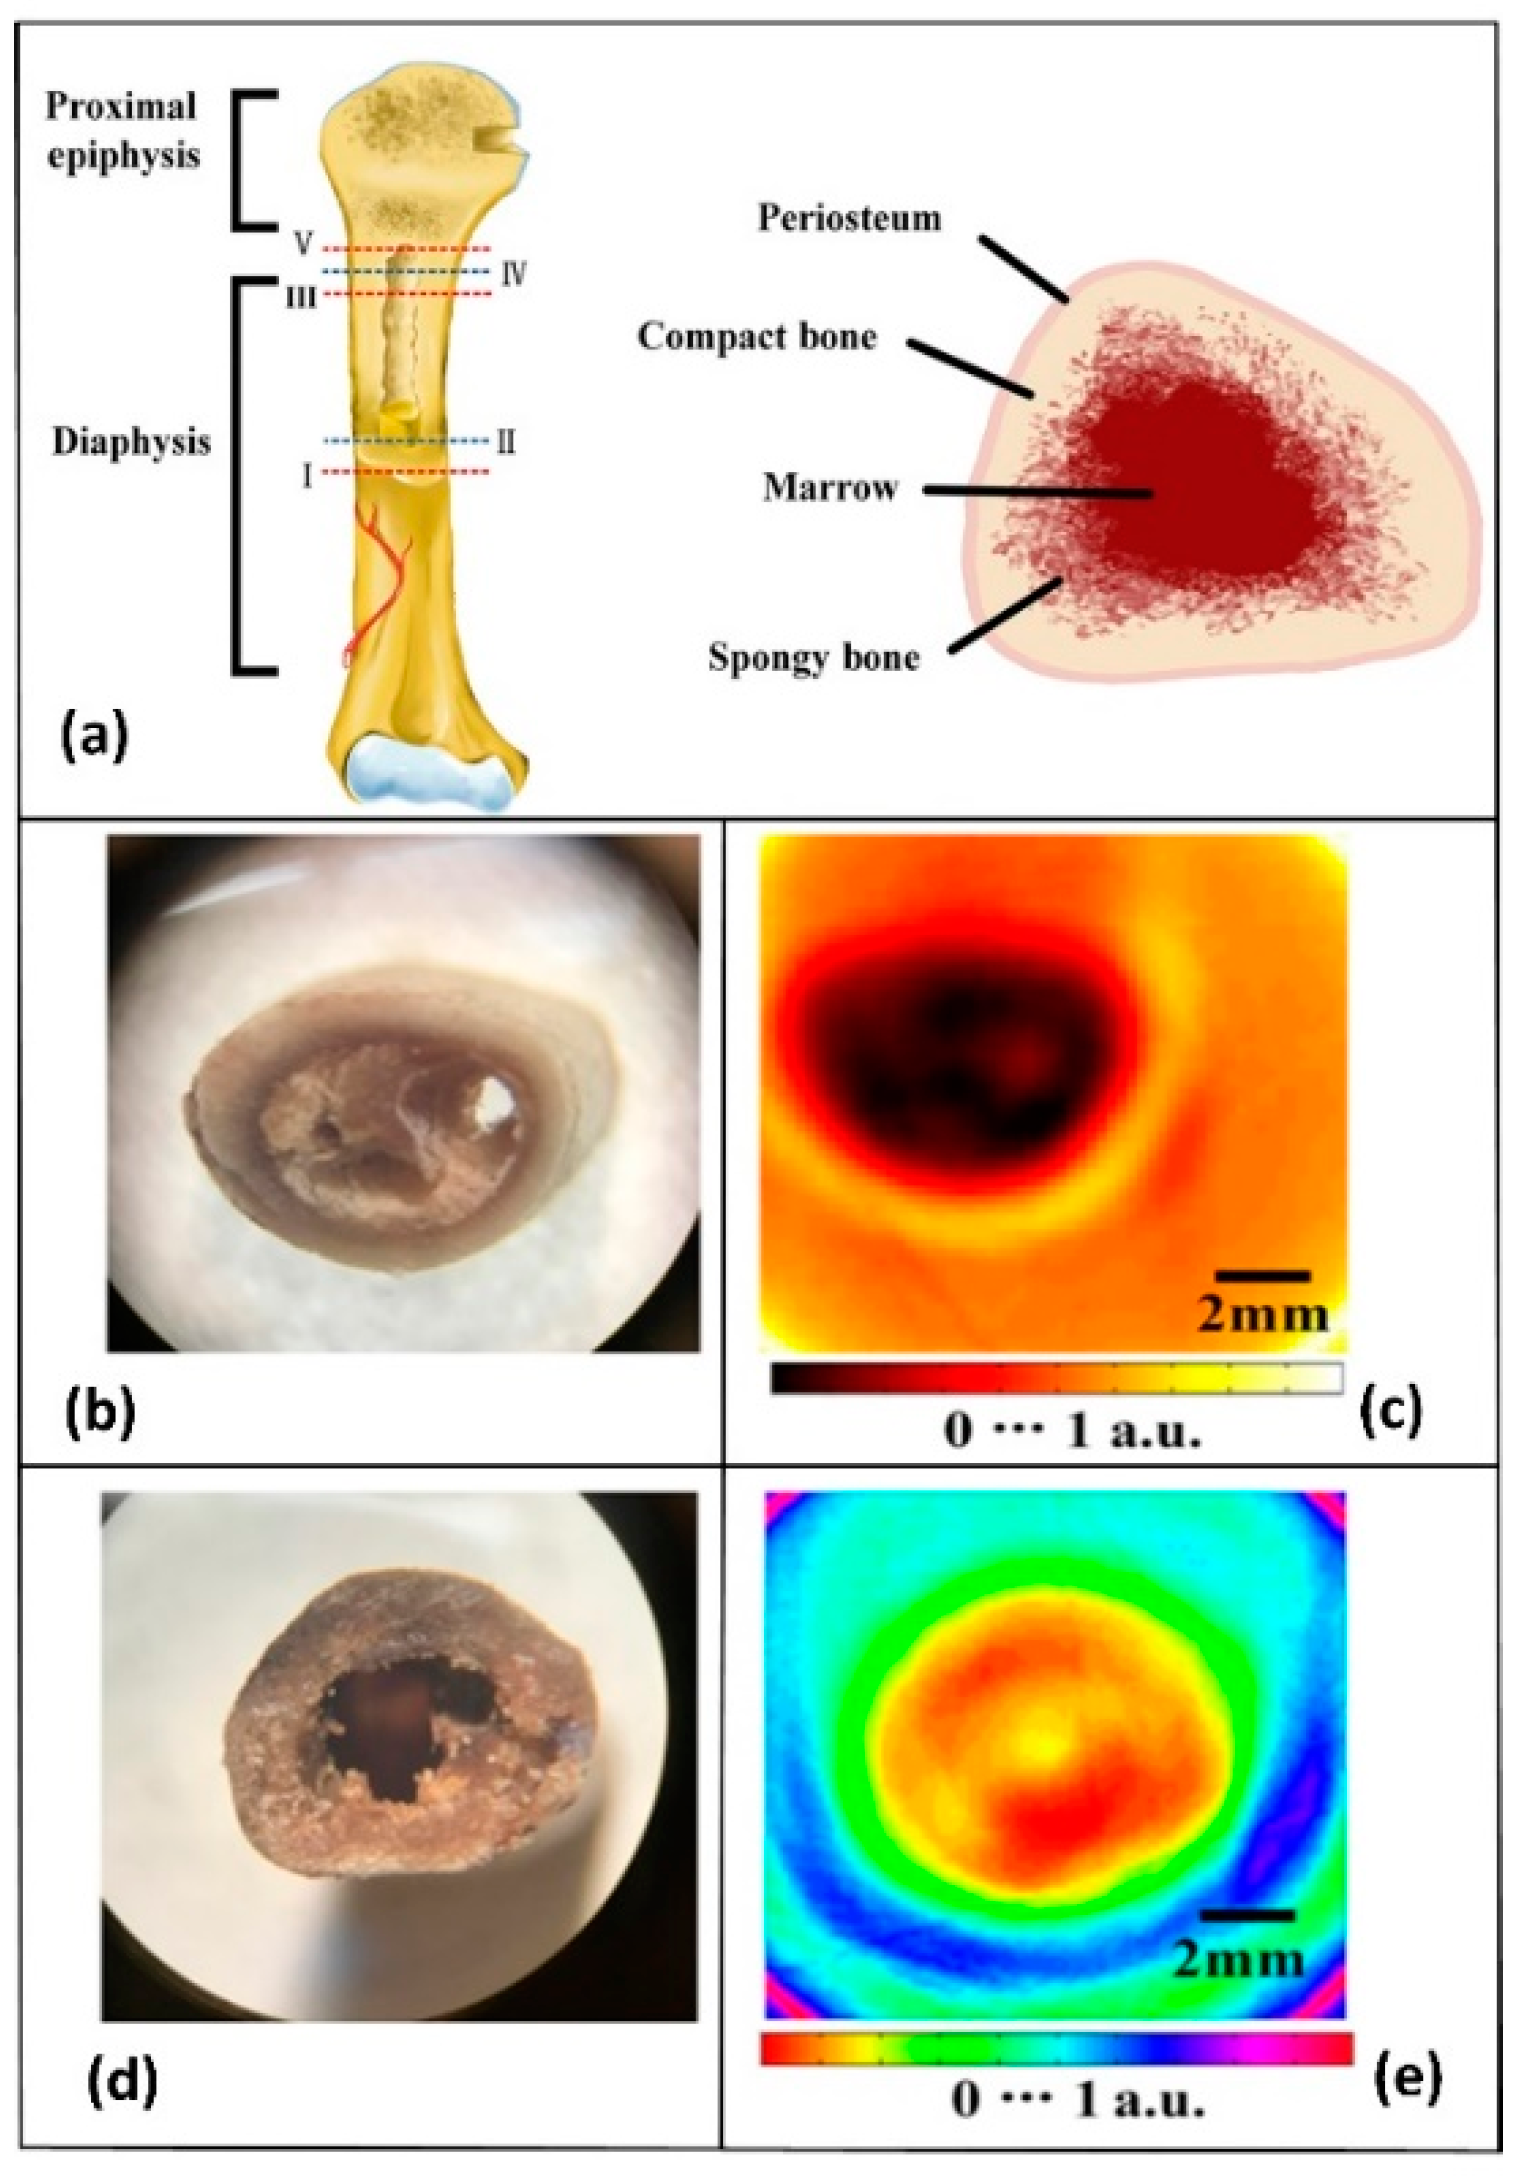
Table 1.
Current CW THz imaging studies with biomedical samples.
| Imaging Target | THz System | Results | Reference |
|---|---|---|---|
| Basal cell carcinoma (BCC) | CW THz transmission imaging mode at two frequencies of 1.39 and 1.63 THz | Good contrast between cancerous and normal tissue was found with spatial resolution of 390 μm at 1.4 THz and 490 μm at 1.6 THz | Joseph et al., 2011 [82] |
| Non-melanoma skin cancer (NMSC) delineation | Cross-polarised CW THz reflective imaging mode working at 584 GHz | The location and the different morphological features were presented by cross-polarised and polarisation optical images with resolution of 670 μm | Joseph et al., 2014 [40] |
| Fresh human tissue of NMSC | Reflective CW THz imaging system working at 584 GHz with either LP or CP radiation at 584 GHz | Contrast between cancerous and normal tissues were found with a resolution of 150 μm | Martin et al., 2016 [42] |
| Frozen sliced breast tumours | CW THz fibre-scanning near-field microscopy transmission imaging at 320 GHz | Breast tumour tissues could be clearly distinguished from normal tissues without H&E staining with a resolution of 240 μm | Chen et al., 2011 [83] |
| Human breast cancer tissue | Reflectivity CW THz imaging mode working at 1.89 THz | Obtaining the absolute refractive index values of the samples | Peter et al., 2013 [84] |
| Human breast specimen | CW THz SI microscopy reflectivity imaging system working at 10.6 THz | A fragment of the stroma of the breast ex vivo could be observed, which was formed by the dense fibrous connective tissues containing single fat cells and their agglomerates with 0.15 λ resolution | Chernomyrd et al., 2018 [54] |
| Fresh brain tissues of mouse | CW THz reflection imaging system at the frequency of 2.52 THz | The tumour regions of in vivo and ex vivo brain tissues could be well distinguished and corresponded closely with H&E-stained images results with a resolution of 600 μm | Wu et al., 2019 [87] |
| Dehydrated human colon tissues | Transmission and reflection CW THz imaging system working at 590 GHz | A contrast of 23% between the neoplastic and control tissues. The possibility of distinguishing adenocarcinoma-affected areas even without water in the tissue | Wahaia et al., 2016 [90] |
| Fresh human colonic excisions | Reflection CW THz polarisation imaging system working at 584 GHz | Good contrast between normal and tumorous tissues with a resolution of 600 μm | Doradla et al., 2013 [41] |
| Human hepatocellular carcinoma tissue | CW THz digital in-line holography imaging system working at 2.52 THz | The indication of fibrosis in the liver cancer tissue could be observed from the THz phase image, and the appearance of healthy liver tissue was more homogeneous than that of the cancerous tissue with a resolution of 158 μm | Rong et al., 2015 [93] |
| Traumatic brain injury tissues | CW THz transmission imaging mode working at 2.52 THz based on machine learning | The highest classification of different degrees of TBI accuracy was up to 87.5% | Shi et al., 2018 [95] |
| Human lumbar vertebra, coxal bone, and skull | CW THz CT imaging system working at 110 GHz | Compact bone exhibits higher THz absorption than spongy bone at 110 GHz. The THz radiation was absorbed by the vault bones | Bessou et al., 2012 [96] |
| Chicken ulna | CW THz CT imaging system working at 0.279 THz | The complex internal structure of the chicken ulna at different sections could be obtained | Li et al., 2018 [97] |
SI: solid immersion, CT: computed tomography, LP: linearly polarised, CP: circularly polarised.
Publisher’s Note: MDPI stays neutral with regard to jurisdictional claims in published maps and institutional affiliations. |
© 2020 by the authors. Licensee MDPI, Basel, Switzerland. This article is an open access article distributed under the terms and conditions of the Creative Commons Attribution (CC BY) license (http://creativecommons.org/licenses/by/4.0/).
Share and Cite
MDPI and ACS Style
Zhang, Y.; Wang, C.; Huai, B.; Wang, S.; Zhang, Y.; Wang, D.; Rong, L.; Zheng, Y. Continuous-Wave THz Imaging for Biomedical Samples. Appl. Sci. 2021, 11, 71. https://doi.org/10.3390/app11010071
AMA Style
Zhang Y, Wang C, Huai B, Wang S, Zhang Y, Wang D, Rong L, Zheng Y. Continuous-Wave THz Imaging for Biomedical Samples. Applied Sciences. 2021; 11(1):71. https://doi.org/10.3390/app11010071
Chicago/Turabian StyleZhang, Yaya, Chuting Wang, Bingxin Huai, Shiyu Wang, Yating Zhang, Dayong Wang, Lu Rong, and Yongchang Zheng. 2021. "Continuous-Wave THz Imaging for Biomedical Samples" Applied Sciences 11, no. 1: 71. https://doi.org/10.3390/app11010071
Note that from the first issue of 2016, this journal uses article numbers instead of page numbers. See further details here.