
CFD-Based Investigation on Effects of Orifice Length–Diameter Ratio for the Design of Hydrostatic Thrust Bearings


1
School of Mechatronics Engineering, Harbin Institute of Technology, Harbin 150001, China
2
The State Key Laboratory of Mechanical Transmissions, Chongqing University, Chongqing 400044, China
3
School of Electrical Engineering and Automation, Harbin Institute of Technology, Harbin 150001, China
4
Harbin Huiheng Technology Co. LTD, Harbin 150001, China
5
Maanshan Hengyongli Machinery Technology Co. LTD, Maanshan 243131, China
*
Authors to whom correspondence should be addressed.
Appl. Sci. 2021, 11(3), 959; https://doi.org/10.3390/app11030959
Submission received: 22 December 2020
/
Revised: 16 January 2021
/
Accepted: 18 January 2021
/
Published: 21 January 2021
(This article belongs to the Special Issue Visual Analytics for Multidisciplinary Engineering Design)
Abstract
:Orifice-restricted hydrostatic thrust bearings are broadly employed in ultra-precision machine tools, aerospace industries, and so forth. The orifice length–diameter ratio (OLDR) is one of the significant geometrical parameters of the orifice-restricted hydrostatic thrust bearing, which directly affects the performance of the bearing. To accurately guide the design of the hydrostatic thrust bearing, the effect of the OLDR on the performance of the hydrostatic thrust bearing needs to be thoroughly and scientifically investigated, especially for ultra-precision machine tools. In this paper, the influences of various OLDRs are comprehensively studied using the computational fluid dynamics (CFD) approach on the pressure pattern, velocity, turbulent intensity, and vortices, as well as the load capacity, stiffness, volume flow rate, and orifice flow resistance of the hydrostatic thrust bearing under identical operating conditions. The obtained results show that there are differences in performance behaviors of the hydrostatic thrust bearing caused by different OLDRs. Some new findings are obtained, particularly in the second-order small vortices which appear in the annular recesses with all OLDRs except that of 2, and the flow resistance does not always increase with increasing OLDRs. Finally, the proposed CFD approach is experimentally validated.
1. Introduction
Hydrostatic thrust bearings have excellent advantages of high film stiffness, large load capacity, low friction, good vibration damping behaviors, and precision relative motion even at low speeds, and are broadly employed in ultra-precision machine tools, aerospace industries, and so forth [1,2,3].
The design of hydrostatic thrust bearings requires accurate selection of a series of parameters such as bearing structure, pocket, restrictor, supply pressure, bearing clearance, and so on. Therein, the restrictor is an essential feature of the hydrostatic bearing which can significantly affect the performance characteristics of the hydrostatic bearing. In order to meet the prescribed requirements with respect to specific characteristics of load capacity, stiffness, precision, and so forth in a wide range of industrial products, the investigation on restrictors of hydrostatic bearings has been constantly updated over the last several decades. Jain et al. comparatively studied the effects of various types of restrictors, such as orifice, capillary, membrane restrictors, and constant flow valve, on the performance of a multirecess flexible journal bearing [4]. Gohara et al. studied the static characteristics of a water-lubricated hydrostatic thrust bearing using a membrane restrictor to achieve higher stiffness and lower power consumption at high speeds [5]. Sawano et al. studied a hydrostatic bearing using a variable inherent restrictor with a thin metal plate and found that the bearing stiffness and response behaviors were improved and the oil flow was reduced by applying the inherent restrictor with a thin metal plate [6]. Sharma et al. studied the combined effects of the geometric shape of the recess (such as circular, rectangular, elliptical, and annular recesses) and the compensating device (such as capillary, orifice, and constant flow valve restrictors) on the performance of the hydrostatic thrust pad bearing [7]. Moreover, thermal effects of the hydrostatic bearing with orifice restrictors or porous domain were studied by the computational fluid dynamics (CFD) simulation method [8,9,10].
Orifice restrictors, which are very compact devices, are most commonly restrictors for hydrostatic bearings because of simple manufacturing [11,12,13,14]. Sharma et al. analyzed the influence of wear on the performance of a four-pocket hybrid conical journal bearing compensated with an orifice restrictor of which the length–diameter ratio was more than 2.5 [15]. Nicodemus et al. investigated the performance of a four-pocket orifice-compensated hydrostatic journal bearing system with various recess shapes (square, circular, elliptical, and triangular) operating with micropolar lubricant [16]. Chen et al. found that the orifice-compensated hybrid bearings were better from the point of stability than capillary-compensated hybrid bearings for a rigid rotor subject to a specific load [17]. Du et al. investigated the static performance behaviors of the orifice-compensated hydrostatic bearing with four lubrication-fluid cases by numerically solving the turbulent Reynolds equation [18]. Sinhasan et al. conducted a theoretical study on the static and dynamic performance characteristics of the hydrostatic multirecess journal bearings with orifice restrictors using non-Newtonian lubricants [19]. Sharma and Yadav investigated the effects of microdimples on the frictional power loss of the hybrid orifice-compensated circular thrust pad bearing system and found that partial texture thrust bearing could significantly decrease the frictional power loss [20,21]. The orifice length–diameter ratio (OLDR) is one of the significant geometrical parameters of the orifice restrictor which directly affects the performance of the bearing. Although many papers had been published on the orifice-compensated hydrostatic bearing, the design of the OLDR is mainly dependent on engineering experience, and little literature was reported on the effects of the OLDR for the orifice-restricted hydrostatic thrust bearing. To accurately guide the design of the hydrostatic thrust bearing, the effect of the OLDR on the performance of the hydrostatic thrust bearing needs to be thoroughly and scientifically investigated, especially for ultra-precision machine tools.
Therefore, in this paper, the fundamental model for an orifice-restricted hydrostatic thrust bearing system is established and used to find the relationship between the OLDRs and the characteristics of the orifice-restricted hydrostatic thrust bearing. The CFD simulation method is employed to numerically analyze the influences of various OLDRs on the pressure pattern, flow velocity, turbulent intensity, and vortices, as well as the load capacity, oil film stiffness, volume flow rate, and orifice flow resistance of the hydrostatic thrust bearing. The experiments are conducted to validate the employed CFD simulation approach.
2. Orifice-Compensated Hydrostatic Thrust Bearings
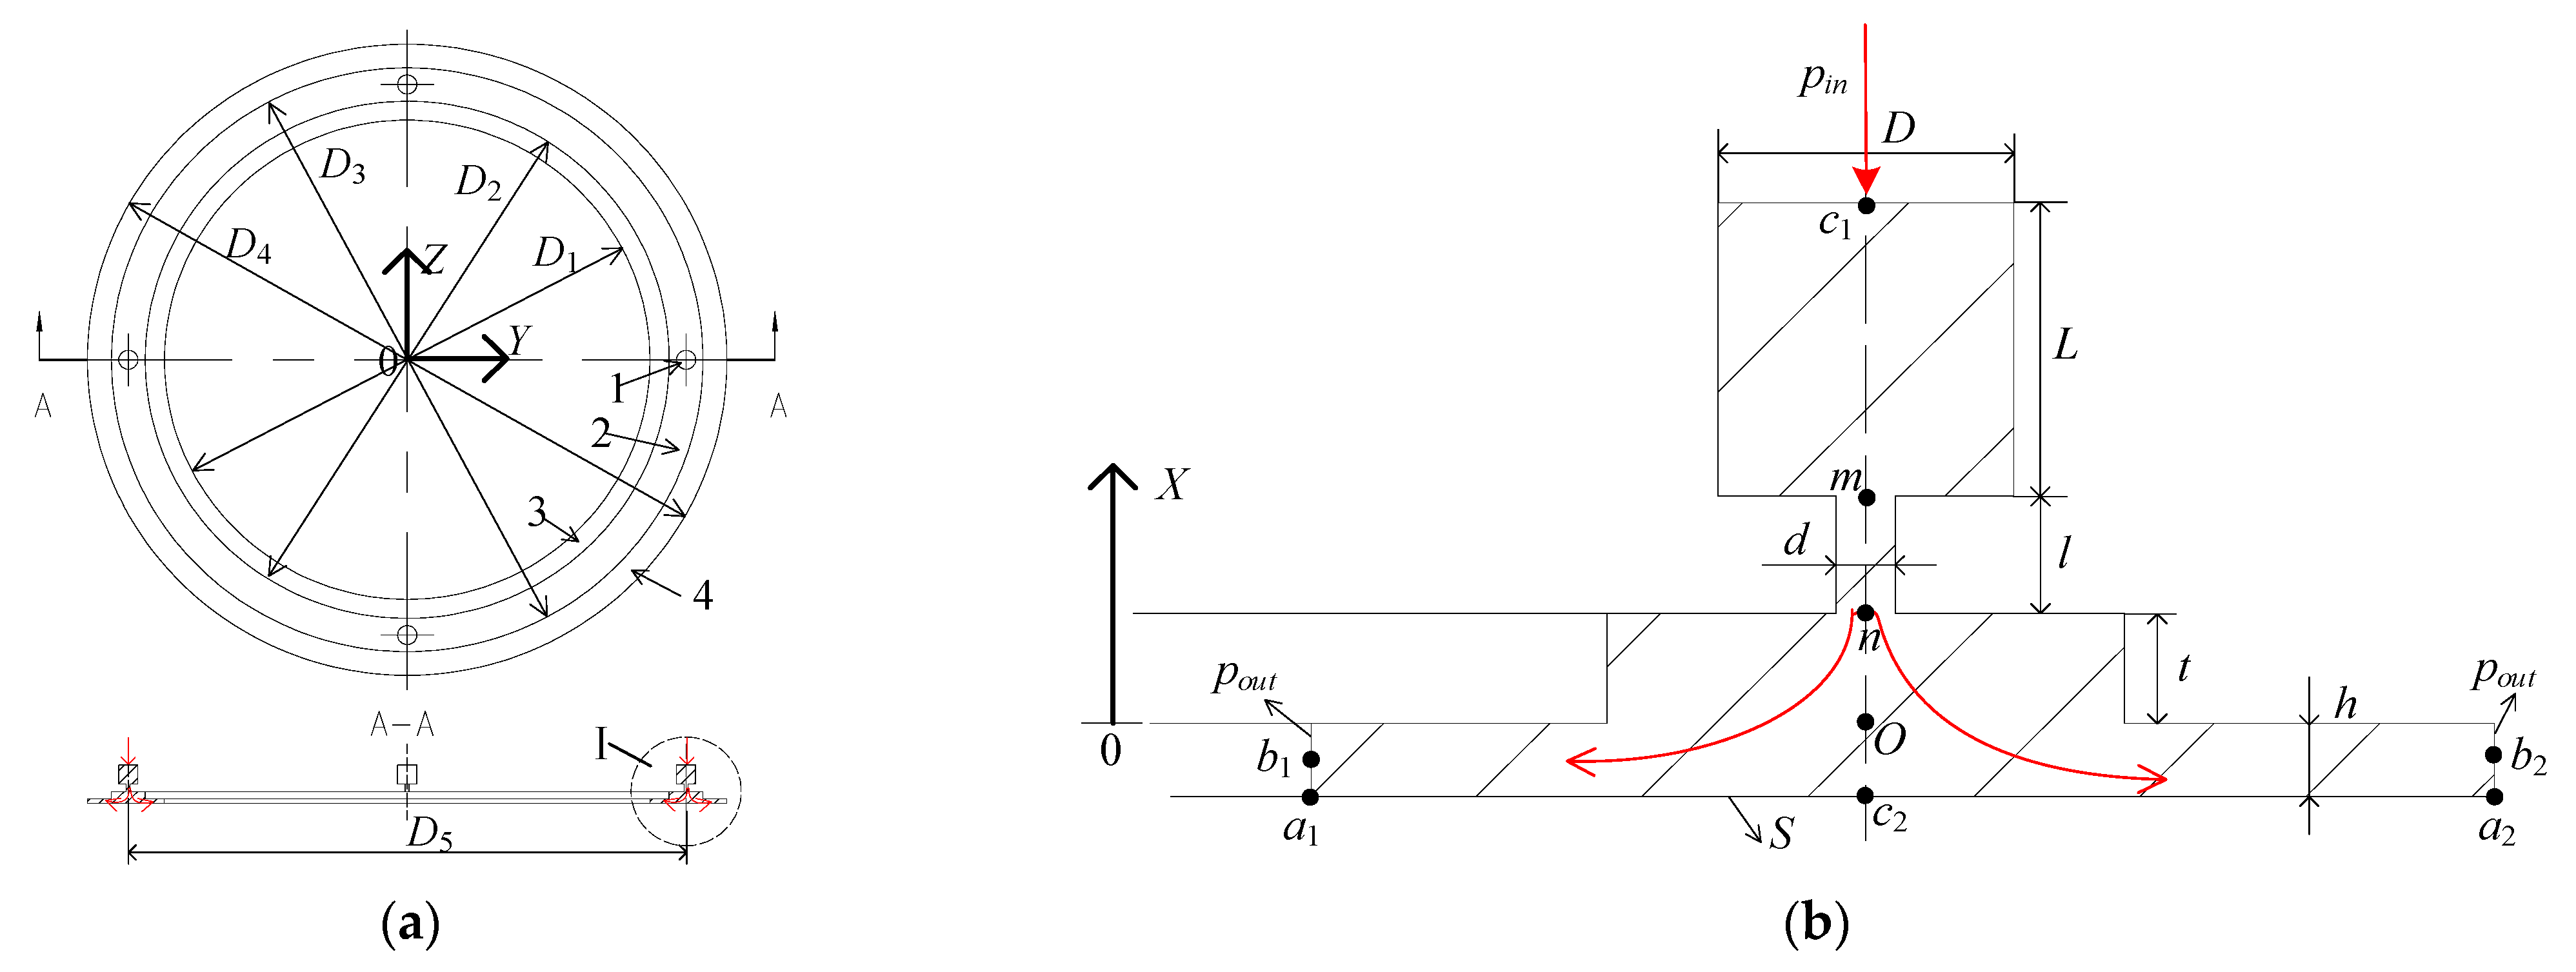
The schematic illustration of hydrostatic thrust bearings is shown in Figure 1, in which 1 depicts the orifice restrictor, 2 is the annular recess, 3 and 4 are the sealing lands. The inner diameter of the sealing land (D1) is 101 mm, the inner diameter of the annular recess (D2) is 109 mm, the outer diameter of the annular recess (D3) is 123 mm, the outer diameter of the sealing land (D4) is 133 mm. There are four orifice restrictors evenly located in the circumferential direction, and the distribution circle diameter of the orifices (D5) is 116 mm. The oil inlet diameter (D) is 4 mm, the oil inlet length (L) is 4 mm, the oil film thickness (h) is 0.02 mm, the annular recess depth (t) is 0.6 mm, the orifice diameter (d) is 0.8 mm. To investigate the effects of the length–diameter ratio (l/d) of the orifice restrictor, only the orifice length (l) is varied and the other geometrical parameters of the hydrostatic thrust bearing are constant. The length–diameter ratios are varied as 0.25, 0.5, 1, 2, 3, 4, and 5. a1–a2 is the bottom line of the oil film, and b1–b2 is the middle line of the oil film. c1–c2 is the middle line of the orifice restrictor on which m is the upper middle node and n is the bottom middle node of the orifice. In this paper, node n is fixed for various OLDRs and node m is varied along with different OLDRs. Each mi (i = 1, 2 … 7) is associated with one OLDR from 0.25 to 5. Node O located on the line of c1–c2 is the starting point at which the fluid enters the oil film.
3. CFD Modeling
It had been verified that the CFD simulation method was an effective means to accurately analyze the fluid characteristics of hydrostatic bearings [13,22,23,24,25]. Hence, the CFD simulation method is employed to investigate the effects of varied OLDRs on the performance of the hydrostatic thrust bearing.
The CFD simulation model of the hydrostatic thrust bearing is constructed under conditions of the following assumptions:
- (a)
- Isothermal flow occurs in the fluid field of the hydrostatic thrust bearing. Circulating water cooling is applied to the bearing, which keeps the temperature field of the hydrostatic thrust bearing constant.
- (b)
- The oil viscosity is mainly affected by the temperature and the oil flows out of the sealing lands in a very short time, so the oil temperature can be considered constant. Then, the oil viscosity is assumed to be constant.
- (c)
- The geometric tolerances of the hydrostatic thrust bearing are not considered in this paper.
- (d)
- The fluctuation of the supply oil pressure of the bearing is ignored.
In this study, the 3D Navier–Stokes equations are solved for numerical simulations. According to the dimensional parameters and the operating conditions of the hydrostatic thrust bearing, the realizable k-ε turbulence model is employed in the CFD model. The realizable k-ε turbulence model has shown substantial improvements where the flow features include strong streamline curvature, vortices, and rotation, which is suitable to investigate the streamline and vortices in this paper [26,27]. The governing equations are solved in steady state, which take no account of rotational velocity and gravity force [28]. The maximum y+ of the working wall of the oil film (S, shown in Figure 1) is about 3.33. The enhanced wall treatment is employed as a near-wall modeling method in this paper, which can be used with coarse meshes and possesses the accuracy of the standard two-layer approach for fine near-wall meshes [26].
The ambient pressure (po) is 101,325 Pa, which is set as the operating pressure. The boundary conditions for the inlets and outlets are pressure inlet and pressure outlet, respectively. The inlet gauge total pressure (pin) is set to 25 times that of the po and the outlet gauge pressure (pout) is set to 0 Pa. The working wall of the oil film (S, shown in Figure 1) is modeled as a “stationary wall”. The No. 2 spindle oil is specified for the hydrostatic thrust bearing, of which the oil density is 799.47 kg/m3 and the dynamic viscosity is 0.00223Pa⸱s.
The pressure-based solver is chosen for the numerical analysis in this study, and the Semi-Implicit Method for Pressure Linked Equations (SIMPLE) algorithm is used to obtain a converged solution and the others are default. The residual convergence criteria is assumed to be achieved [29] when: (i) the net flow rate of fluid entering and leaving the model is less than 7.5 × 10⁻⁶ L/min; (ii) the averaged force of the wall S reaches a stable level.
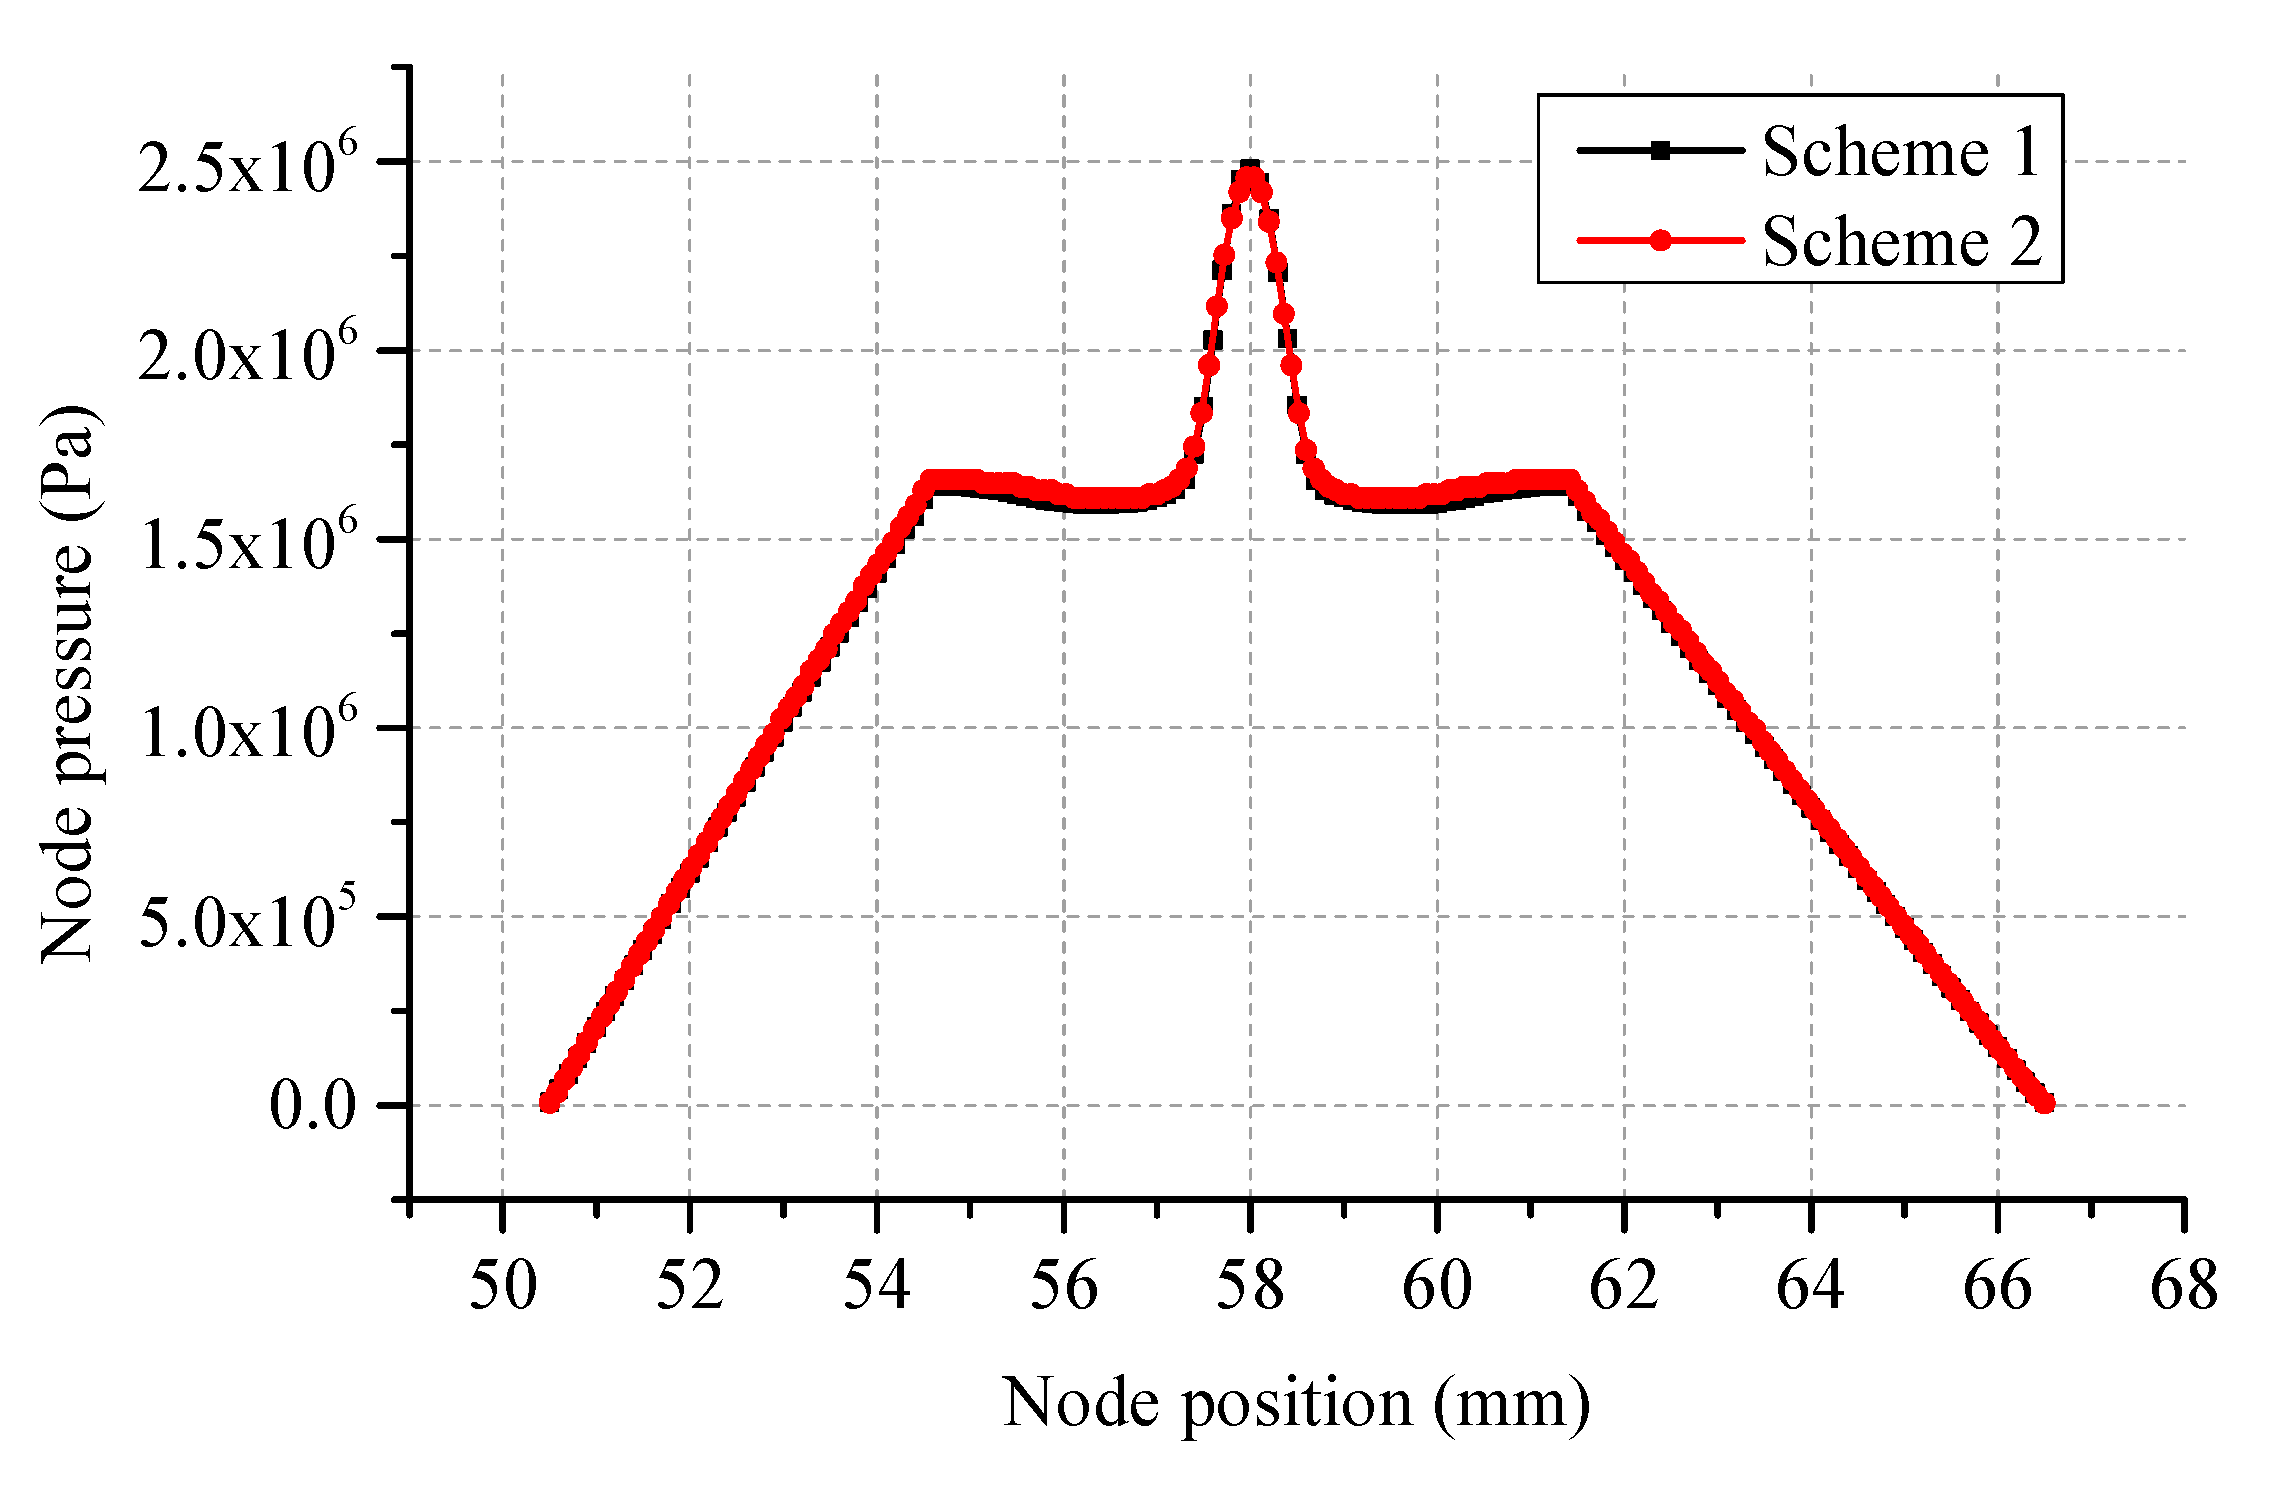
To ensure the accuracy of the numerical solution, a comparative check on grid independence is conducted for the CFD model. The OLDR of 2 is selected as a case study. Two different meshing schemes are conducted for the CFD model. Specifically, scheme 1 has 1,822,043 cells and 2,021,829 nodes, and scheme 2 has 4,227,466 cells and 4,596,011 nodes. The effect of the mesh density on the pressure pattern along the line of a1–a2 is illustrated in Figure 2. Furthermore, comparisons of load capacity, volume flow rate, and oil film stiffness of the hydrostatic thrust bearing with two different meshing schemes are depicted in Table 1. It can be found from Figure 2 and Table 1 that the differences of node pressure and other performance specifications are very small as the mesh density increases, but the time needed for convergence increases largely. It is to say that the mesh density of scheme 1 is enough, and consequently, the same meshing scheme of case 1 is used for all the CFD models in the current study.
The meshing scheme of case 1 is depicted in detail as follows:
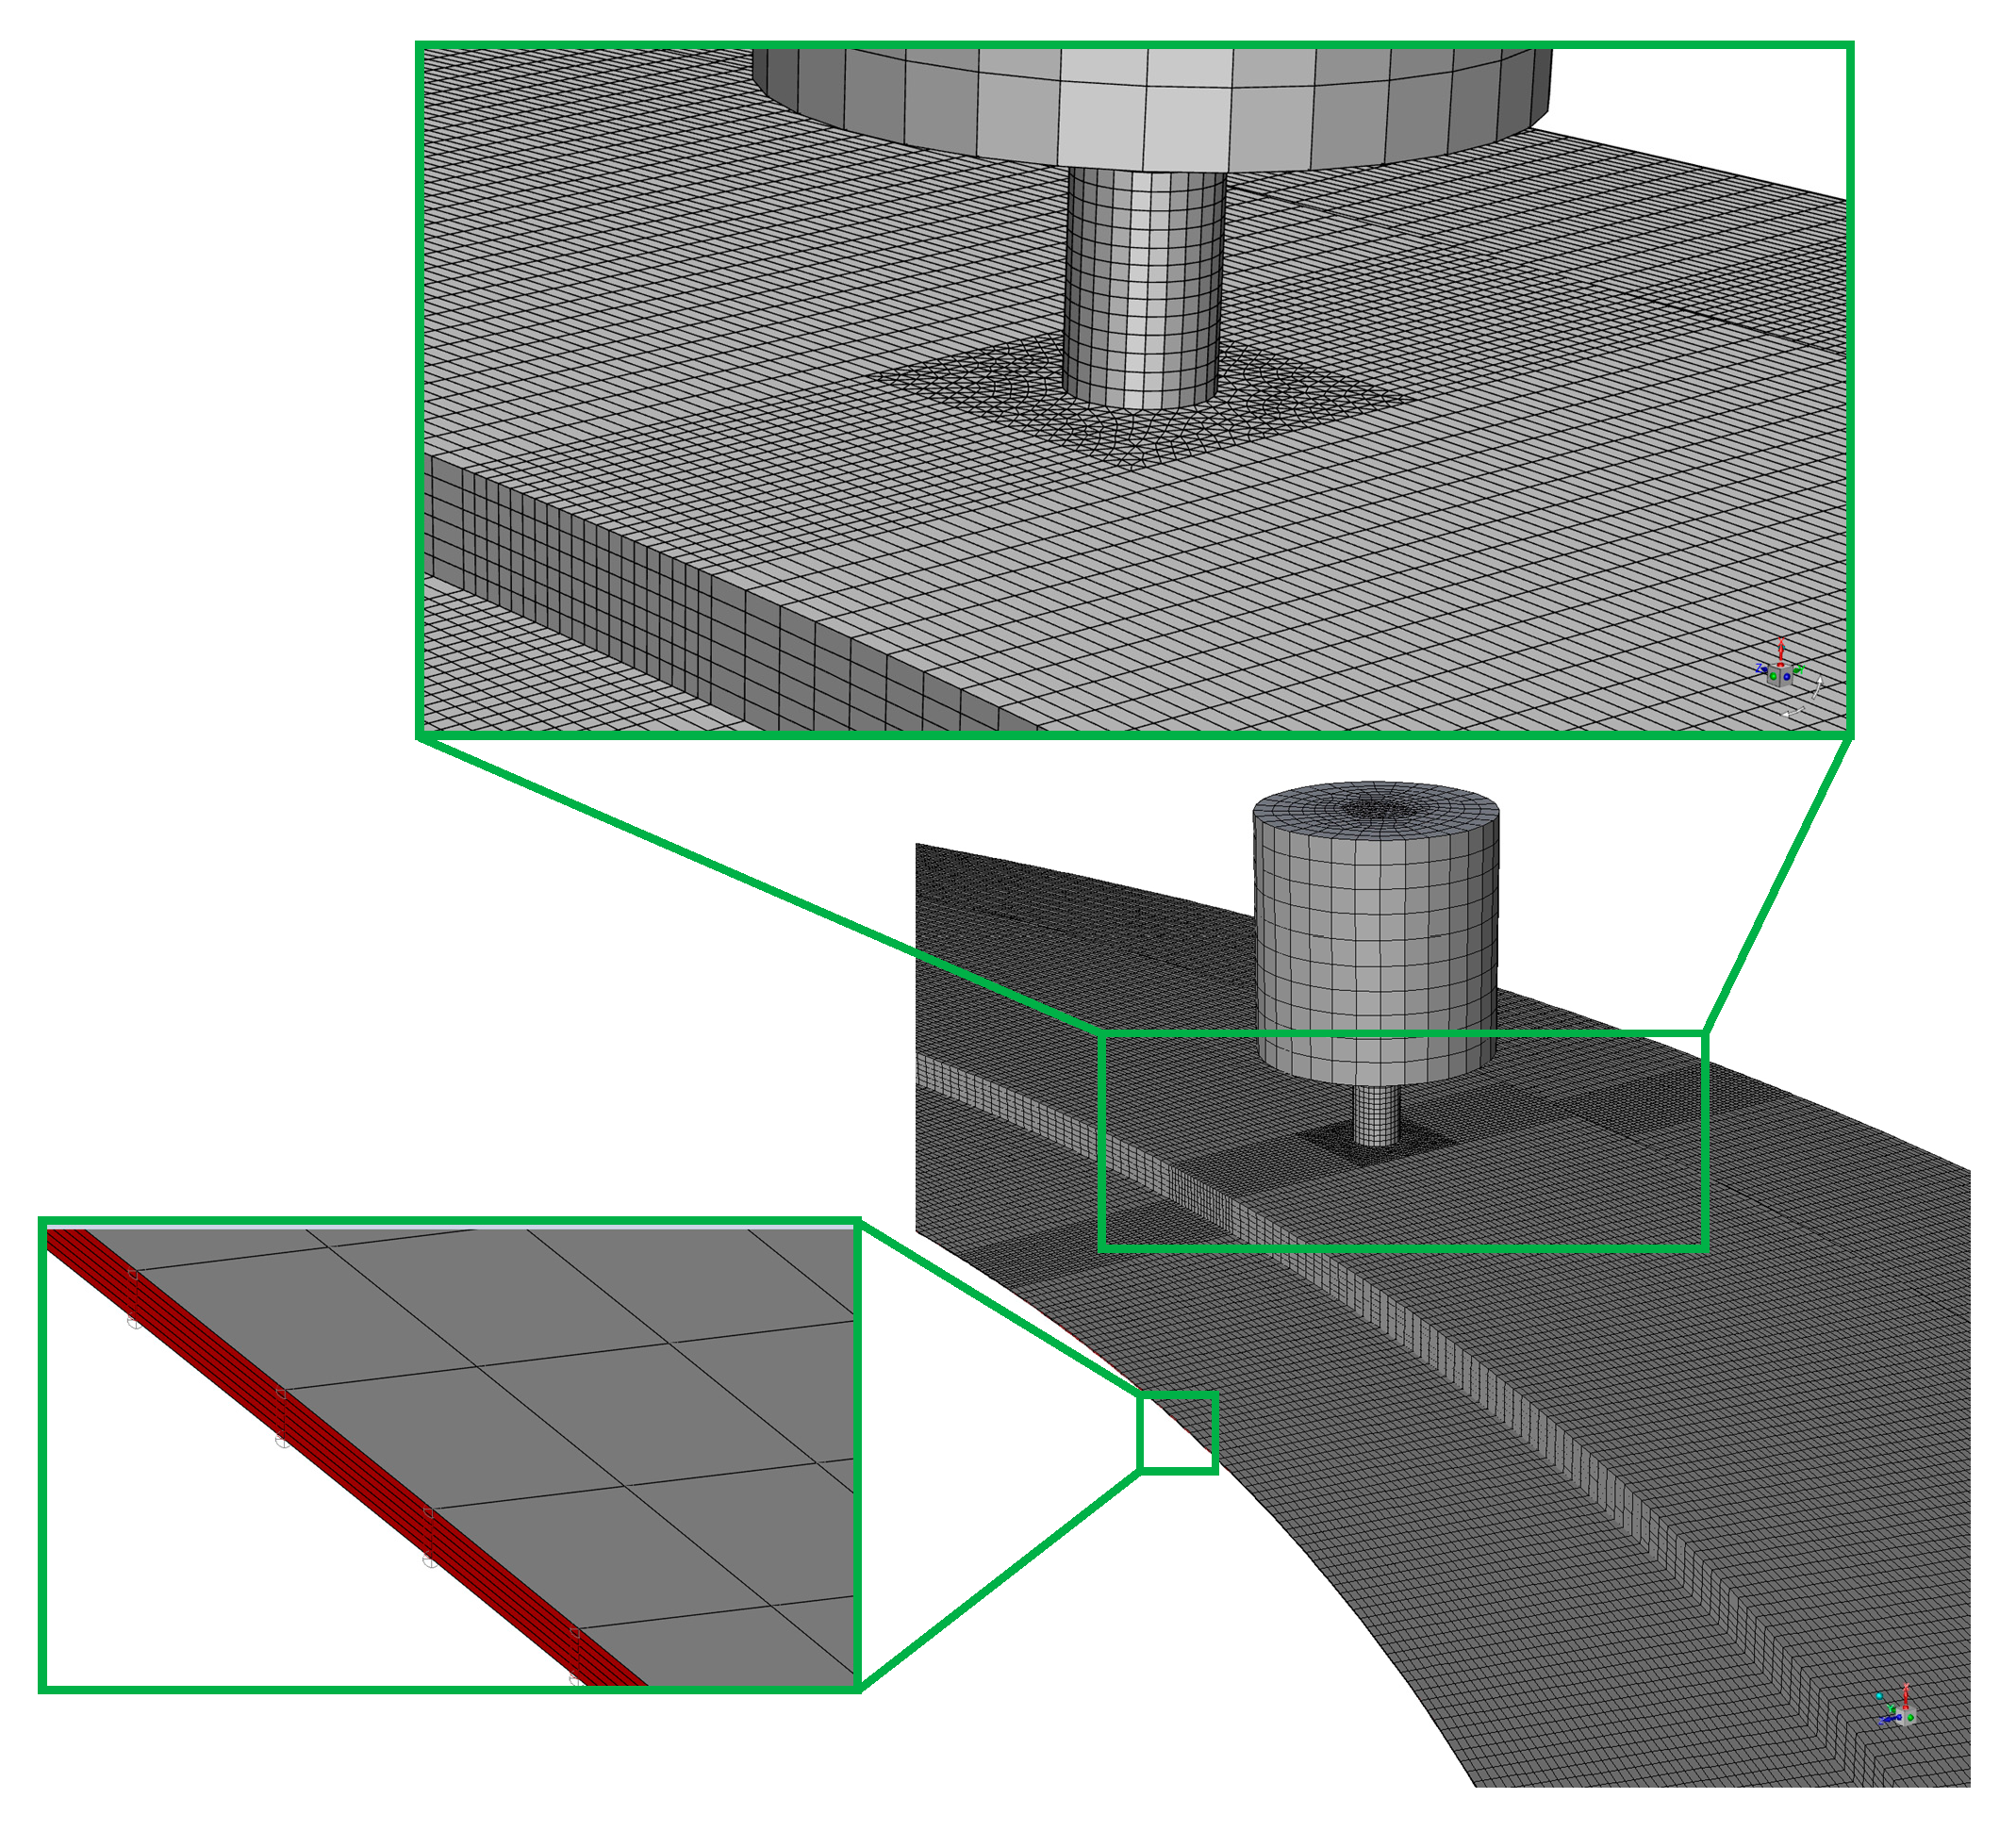
Because the oil film thickness is far less than other geometrical parameters of the hydrostatic thrust bearing, six elements are meshed along the oil film thickness direction. The meshing size is set to 0.1 mm in the orifice zone. The annular recess depth is divided into six elements. Hexahedral and tetrahedron elements are employed to mesh the whole geometry, which would result in a remarkable increase in the total number of elements. To decrease the computing time, the maximum aspect ratio of all meshes is controlled to less than 80 for an acceptable accuracy. The computational meshes are shown in Figure 3.
4. Simulation Results and Discussions
In this paper, the Fluent software (ANSYS, Inc, Canonsburg, PA, USA) is employed to carry out the CFD calculation and the Tecplot code is used to do the post-processing. The operating conditions of the hydrostatic thrust bearing are identical for varied OLDRs. The CFD simulation results on the effects of various OLDRs for performance of the hydrostatic thrust bearing are calculated and discussed. The intrinsic characteristics of flow field and the macroscopic characteristics of the bearing are all analyzed in detail. Specifically, the pressure distributions, velocity profiles, and turbulent intensity along different lines are obtained with various OLDRs. The vortices, turbulent intensity, and pressure contours of corresponding sections and surfaces are presented. Furthermore, the load capacity, oil film stiffness, volume flow rate, and orifice flow resistance of the hydrostatic thrust bearing are compared with different OLDRs.
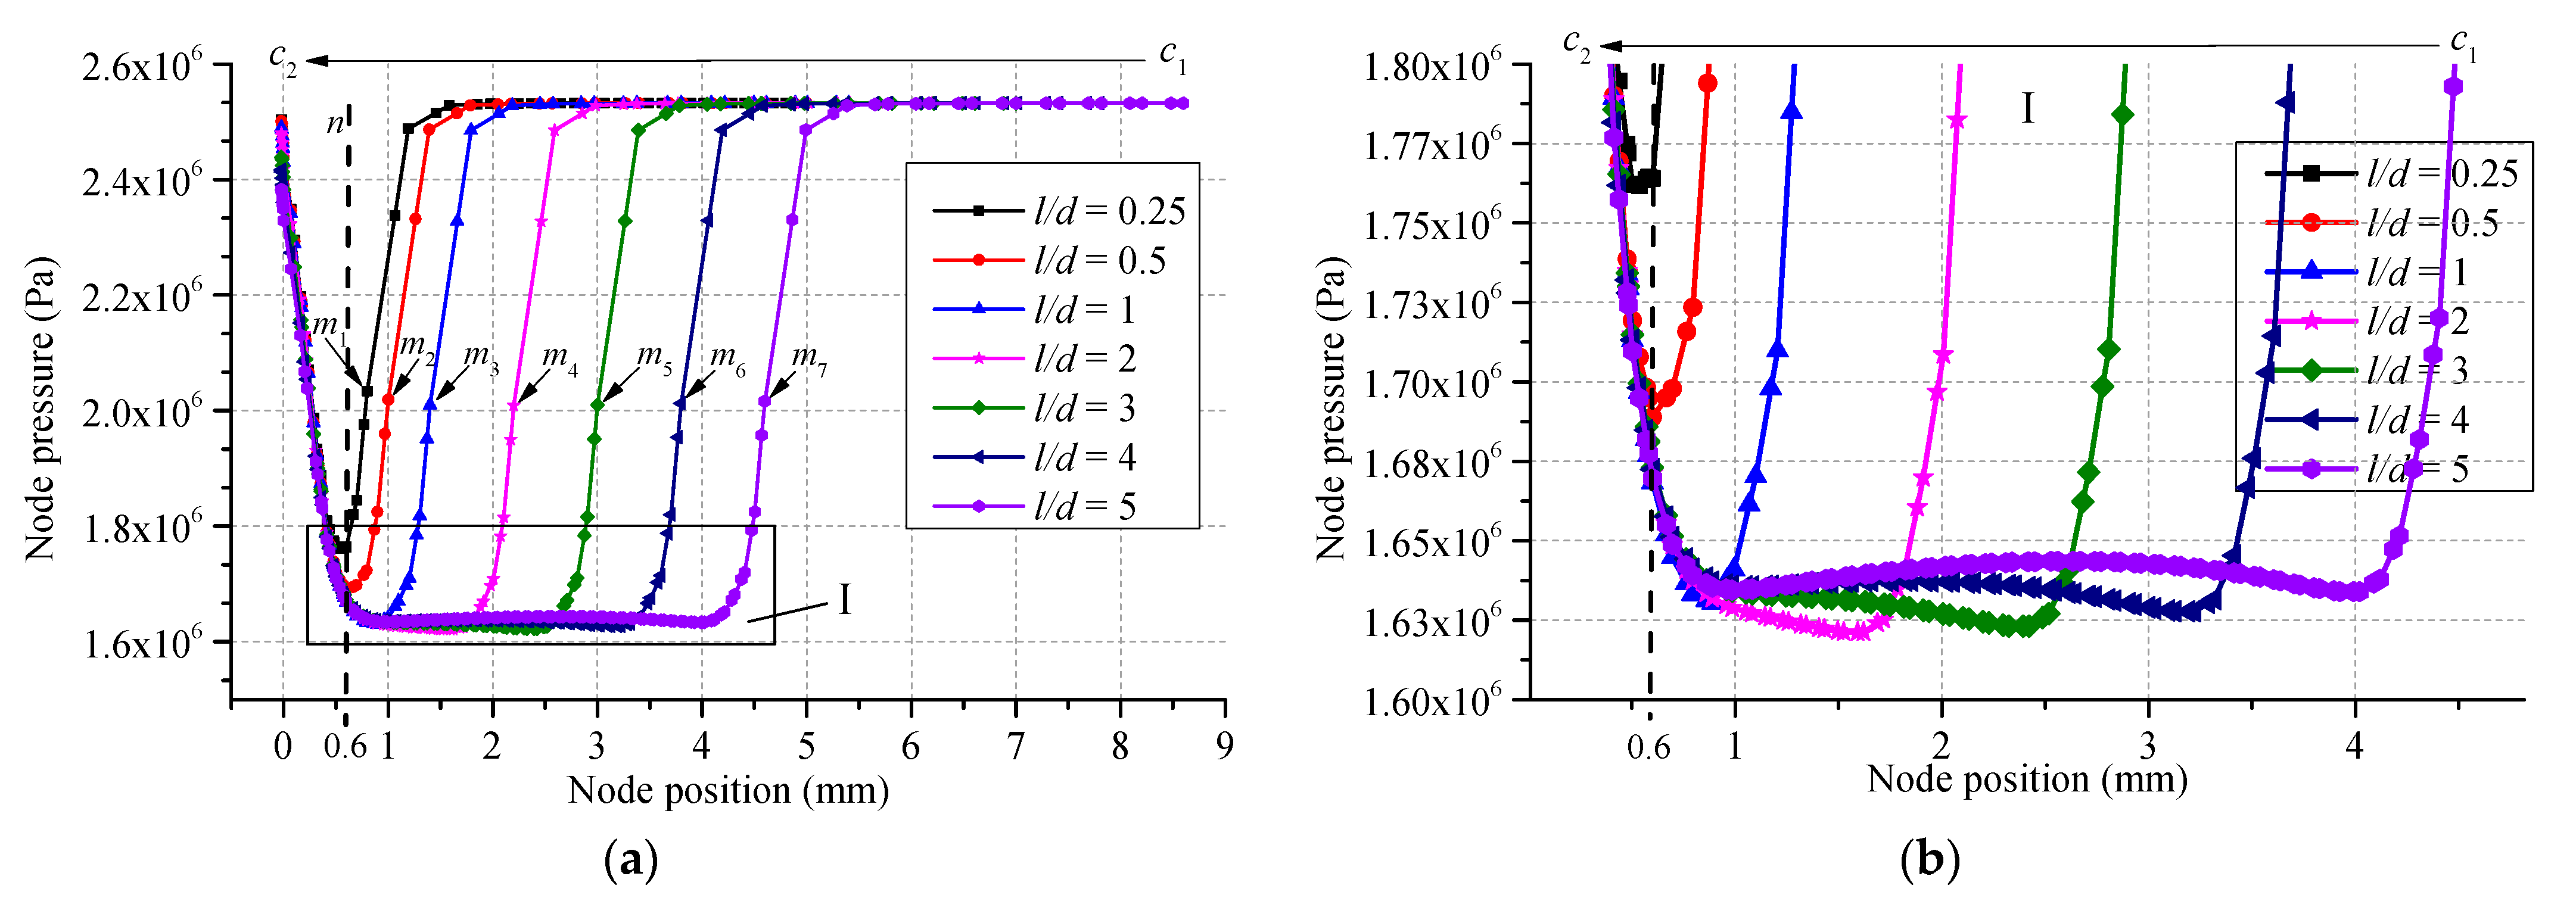
The node pressure patterns along the line of c1–c2 for different OLDRs are depicted in Figure 4. It can be found from Figure 4 that the oil pressure is equal to the inlet pressure at the beginning and then it decreases rapidly along the flow direction with almost the same declining rate for various OLDRs. The oil pressures of nodes from m1 to m7 are almost identical, indicating that there are few effects of OLDRs on the oil pressure of the orifice inlet. However, oil pressure presents different profiles in the orifice zone along the line of m–n with respect to different OLDRs. Specifically, the oil pressure reaches a minimum value and then increases slightly, and then decreases slightly, and then increases again along the flow direction for the OLDRs of 4 and 5, looking like a basin, and named a basin pressure profile in this paper. The oil pressure only increases slightly in the basin bottom for the OLDRs of 2 and 3. The oil pressure decreases to a minimum level and then increases rapidly along the flow direction for the OLDR of 1, presenting a pressure profile with no basin bottom. Only the pressure drop occurs in the orifice zone along the flow direction for the OLDRs of 0.25 and 0.5. It has almost the same pressure profile along the line of n–c2 with various OLDRs. Based on the aforementioned analysis, it can be found that the basin pressure effect is more obvious with increasing OLDRs in the orifice zone. That is to say, there is a pressure hold effect in the orifice zone and it will be more significant with increasing OLDRs. In addition, the minimum oil pressure (p’) in the orifice zone with respect to various OLDRs has the following relation:
The velocity magnitude patterns along the line of c1–c2 for different OLDRs are depicted in Figure 5. It can be found from Figure 5 that the fluid velocity magnitude is almost identical at the oil inlet and then it increases rapidly along the flow direction with almost the same growth rate for various OLDRs. The fluid velocity magnitudes of nodes from m1 to m7 are almost identical, indicating that there are few effects of OLDRs on the fluid velocity magnitude of the orifice inlet. However, fluid velocity magnitude presents different profiles in the orifice zone along the line of m–n with respect to different OLDRs. Specifically, the fluid velocity magnitude reaches a maximum value and then decreases slightly, and when the fluid reaches the orifice outlet, the fluid velocity magnitude decreases rapidly along the flow direction for the OLDRs of 2, 3, 4, and 5, looking like an inverted basin, and named an inverted basin velocity magnitude profile in this paper. The velocity magnitude increases to a maximum level and then decreases rapidly along the flow direction for the OLDR of 1, presenting a parabola profile with no basin bottom. The velocity magnitudes only increase in the orifice zone along the flow direction for the OLDRs of 0.25 and 0.5. It has almost the same profile of the velocity magnitude along the line of n–c2 for various OLDRs. It can be concluded that the inverted basin effect of the fluid velocity magnitude is more obvious with increasing OLDRs in the orifice zone. In other words, there is a velocity magnitude hold effect in the orifice zone and it will be more remarkable with increasing OLDRs. In addition, the maximum oil velocity magnitude (v’) in the orifice zone with respect to various OLDRs has the following relation:
Turbulent intensity (I) is an important parameter to characterize turbulence of the flow field, which is defined as follows:
where u’ depicts the root-mean-square of the velocity fluctuations, uavg represents the mean flow velocity.
The turbulent intensity patterns along the line of c1–c2 for different OLDRs are depicted in Figure 6. It can be found from Figure 6 that the turbulent intensity is almost identical, about 0.07%, at the oil inlet and then it increases along the flow direction with almost the same growth rate for various OLDRs.
The turbulent intensities of the fluid reach almost the same local peaks at different orifice inlets (mi, i = 1, 2 … 7) with various OLDRs. However, the turbulent intensity presents different profiles in the orifice zone along the line of m–n with respect to different OLDRs. Specifically, the turbulent intensity reaches a peak point at node m and then decreases slightly, and then increases slightly along the flow direction for the OLDRs of 3, 4, and 5, looking like a basin, and named a basin turbulent intensity profile in this paper. The turbulent intensities only decrease in the orifice zone along the flow direction for the OLDRs of 0.25, 0.5, 1, and 2. Furthermore, the turbulent intensity decreases to the valley point when the flow reaches the orifice outlet (node n) for the OLDR of 2. It has almost the same profile of the turbulent intensity along the line of n–c2 for various OLDRs. The turbulent intensity reaches its maximum (about 9.73%) at node O for various OLDRs. Based on the aforementioned analyses, it can be concluded that the turbulent intensity is very low at the oil inlet, indicating that the fluid field is the laminar flow at the oil inlet. The basin effect of the fluid turbulent intensity is more obvious with increasing OLDRs in the orifice zone, presenting that there is a turbulent intensity hold effect in the orifice zone and it will be more remarkable with increasing OLDRs. The turbulent flow reaches its most intense at the transition point (node O) at which the fluid enters the oil film from the annular recess for various OLDRs.
The node pressure patterns along the line of b1–b2 for different OLDRs are depicted in Figure 7. It can be found from Figure 7 that the oil pressure is nearly symmetric with respect to the node position of 58 mm. The maximum node pressure is located at the node position of 58 mm, and then a pressure drop and a limited pressure recovery occur further downstream. The node pressure has a linear decrease in the sealing land regions. The maximum node pressure for different OLDRs decreases as in the sequence of OLDRs of 0.25, 0.5, 1, 2, 3, 4, 5. However, the node pressure for different OLDRs decreases as in the sequence of OLDRs of 2, 3, 1, 4, 5, 0.5, 0.25 in the zone of II. It can be concluded that a too large or too small OLDR is not conducive to pressure maintenance.
The velocity magnitude patterns along the line of b1–b2 for different OLDRs are depicted in Figure 8. It can be found from Figure 8 that the distribution of fluid velocity magnitude is M-shaped and is almost symmetric with respect to the node position of 58 mm. There are four stages of the fluid velocity variation along the flow direction: acceleration–deceleration–acceleration–nearly uniform speed. The velocity magnitudes are very low at the node position of 58 mm for different OLDRs, which decrease as in the sequence of OLDRs of 2, 4, 5, 0.25, 0.5, 1, 3. The velocity magnitude is rapidly accelerated to the maximum value within a radius of 0.6 mm, which is increased by about 6 times. The maximum velocity magnitudes for various OLDRs decrease as in the sequence of OLDRs of 0.25, 0.5, 1, 2, 3, 4, 5. It can be concluded that the smaller the OLDR is, the larger the maximum velocity magnitude is. Furthermore, the maximum velocity magnitudes of OLDRs of 0.25 and 0.5 are almost equal, presenting that further reduction of the OLDR has few effects on the maximum velocity magnitude. When the velocity magnitude reaches its maximum value, it begins to decrease. As the fluid flows out of the annular recess, the small clearance of the sealing lands that follows offers an increased resistance to flow, causing a considerable acceleration of the flow. Finally, the fluid flows out of the sealing lands at a nearly uniform velocity.
The turbulent intensity patterns along the line of b1–b2 for different OLDRs are depicted in Figure 9. It can be found from Figure 9 that the pattern of turbulent intensity of each OLDR is almost symmetric with respect to the node position of 58 mm. The maximum turbulent intensity occurs near the center of the orifice inlet and it continually decreases along the flow direction until the fluid reaches near the boundary between the annular recess and the sealing lands. Then, a limited turbulent intensity recovery occurs further downstream. Finally, the fluid flows out of the sealing lands at a nearly uniform low-level turbulent intensity. The maximum turbulent intensity for different OLDRs decreases as in the sequence of OLDRs of 0.5, 0.25, 1, 2, 3, 4, 5. Furthermore, the turbulent intensities of OLDRs of 0.25 and 0.5 are almost equal, presenting that further reduction of the OLDR has little effect on the turbulent intensity.
The line of a1–a2 is one part of the operating wall S which is the boundary wall of the oil film. The node pressure patterns along the line of a1–a2 for different OLDRs are depicted in Figure 10. It can be found from Figure 10 that the node pressure profile along the line of a1–a2 is similar to that of the line of b1–b2. Furthermore, the maximum difference between the pressure values along the line of a1–a2 and the line of b1–b2 is only 0.9%, which is too small to ignore. That is because the distance between the line of a1–a2 and the line of b1–b2 is only 10μm. It can be considered that the flow characteristics are constant along the oil film thickness direction. So, the velocity magnitude and the turbulent intensity along the line of a1–a2 are not mentioned again in this section.
To investigate the influence of various OLDRs on pressure distributions of the wall S, the static pressure of the wall S for various OLDRs are calculated, as shown in Figure 11. It can be found that the maximum pressures are all located at the orifice zones (red circle zones in Figure 11). The ring-shaped high pressure located in the annular recess zone makes the oil film pressure more even, reflecting the pressure uniform effect of the annular recess. By comparing the annular pressures of various OLDRs, the annular pressure for different OLDRs decreases as in the sequence of OLDRs of 2, 3, 1, 4, 5, 0.5, 0.25.
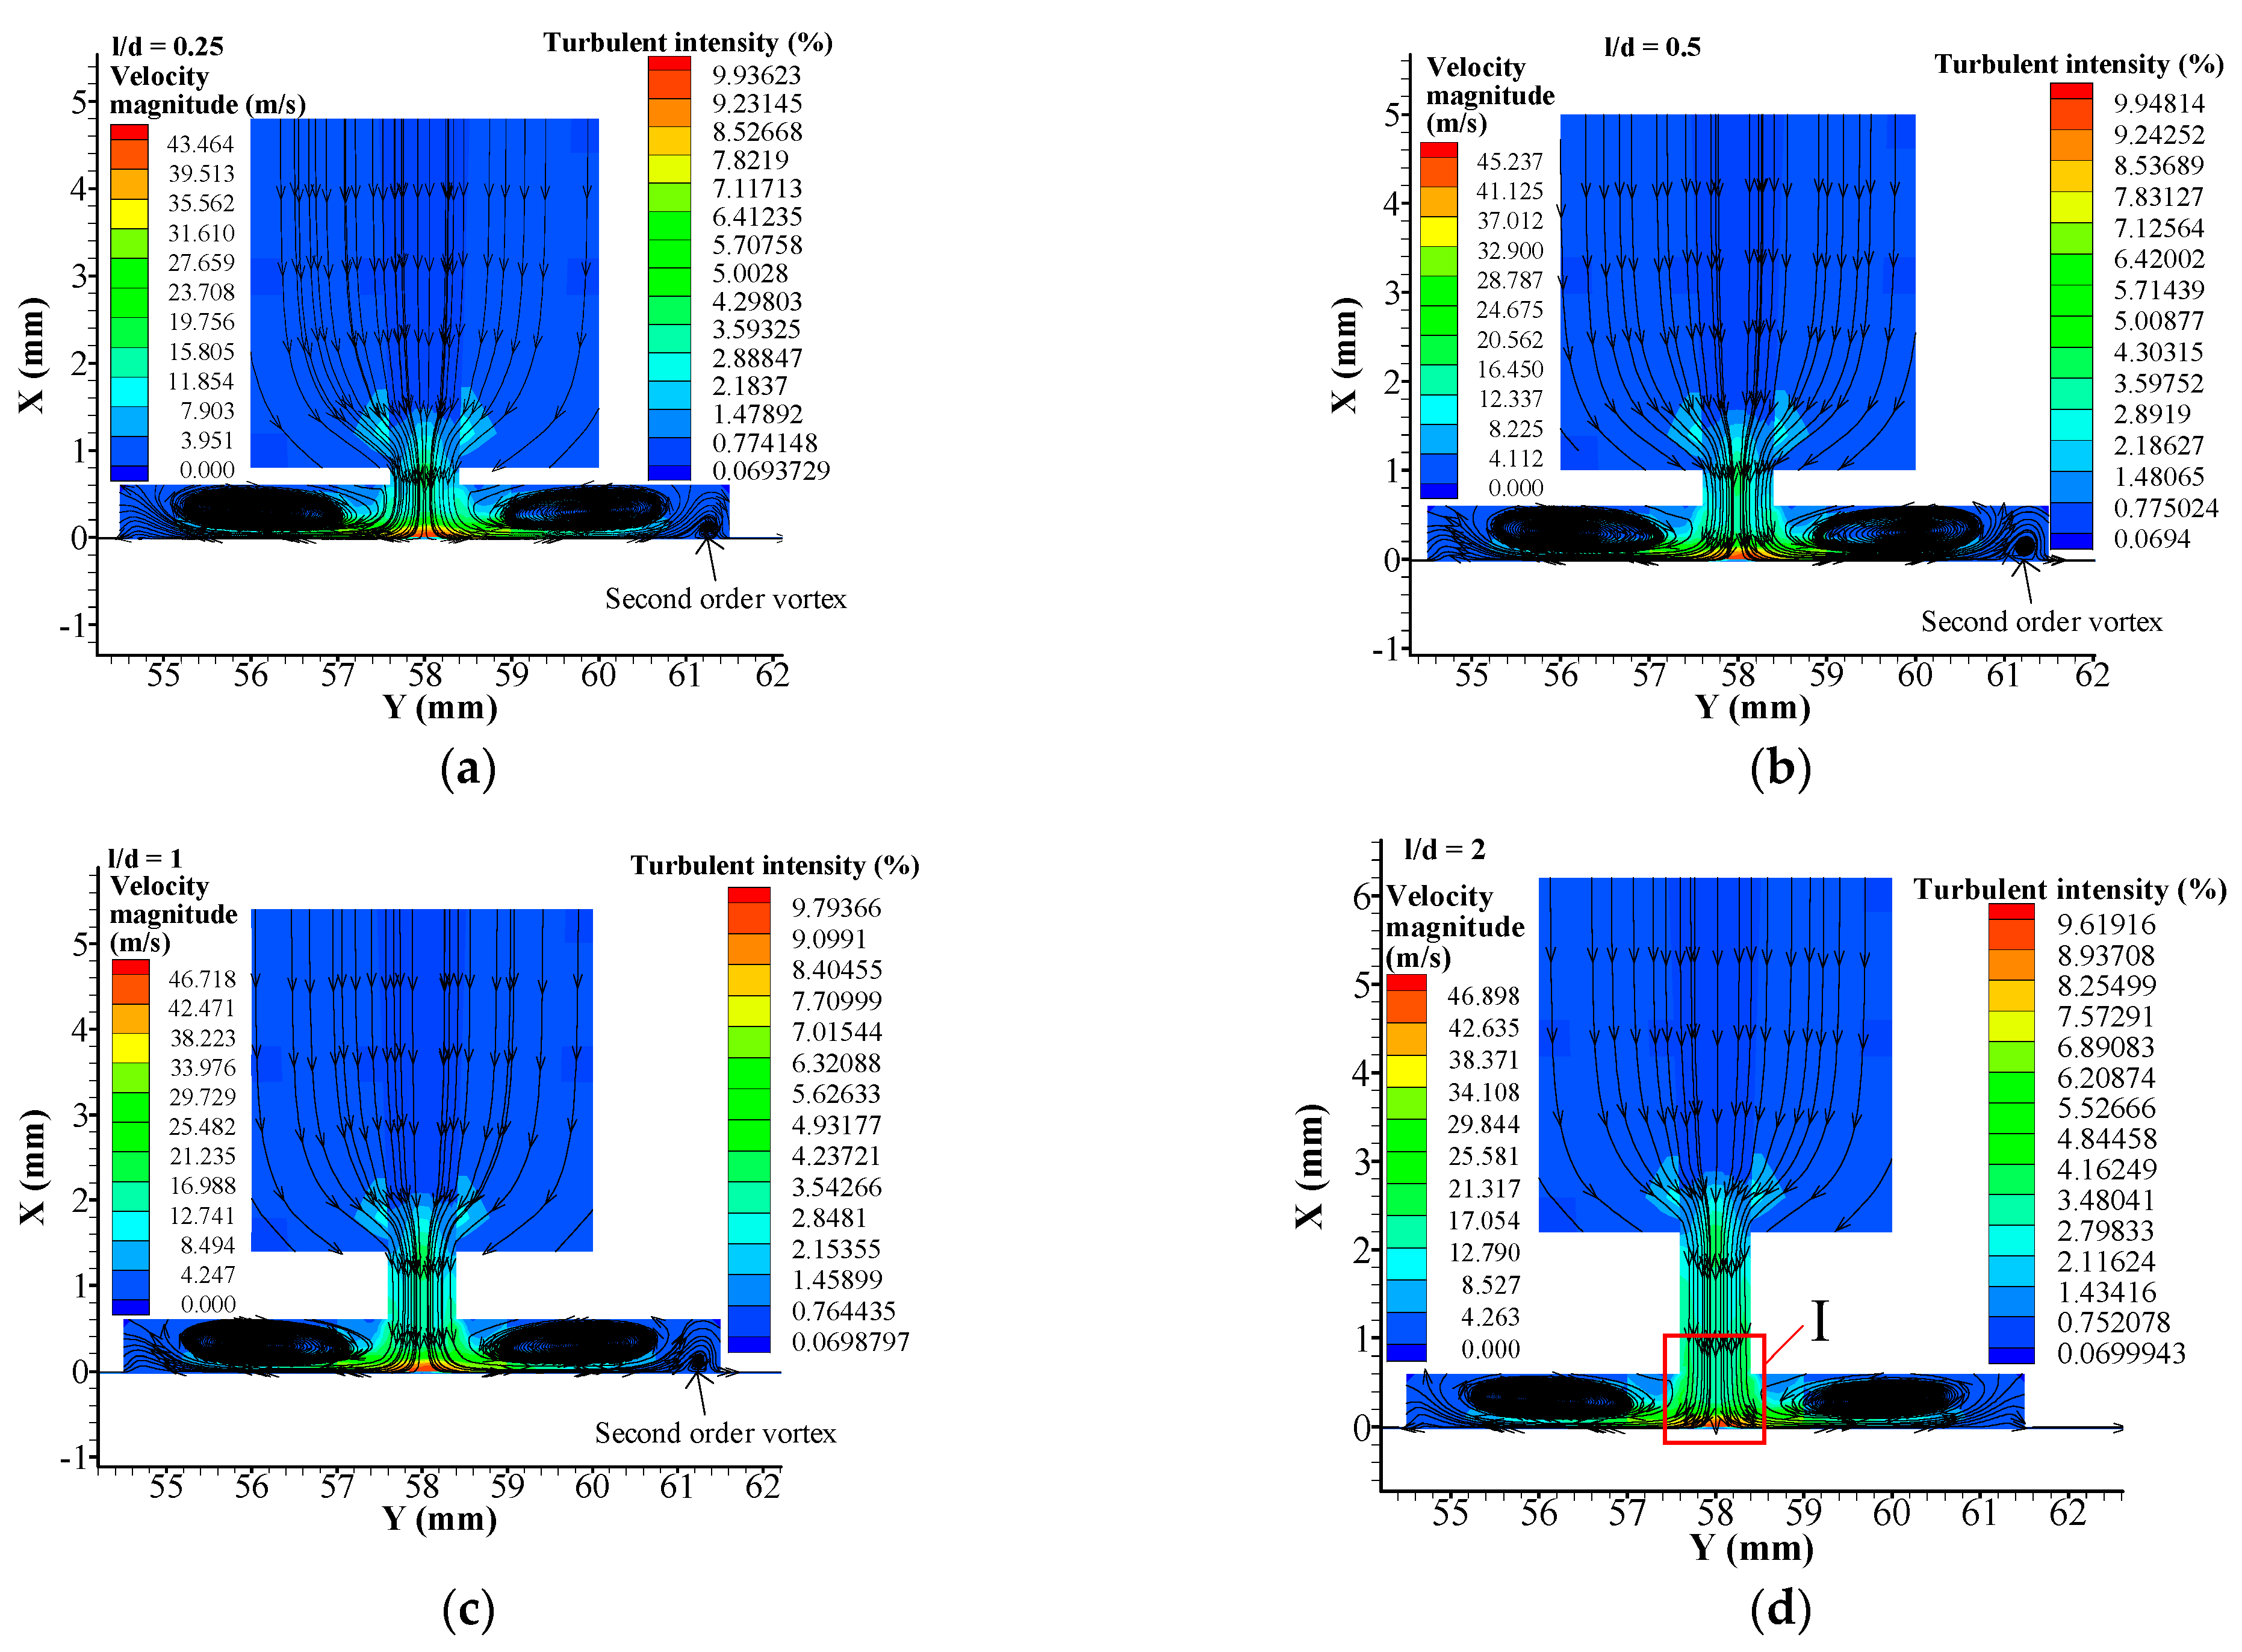
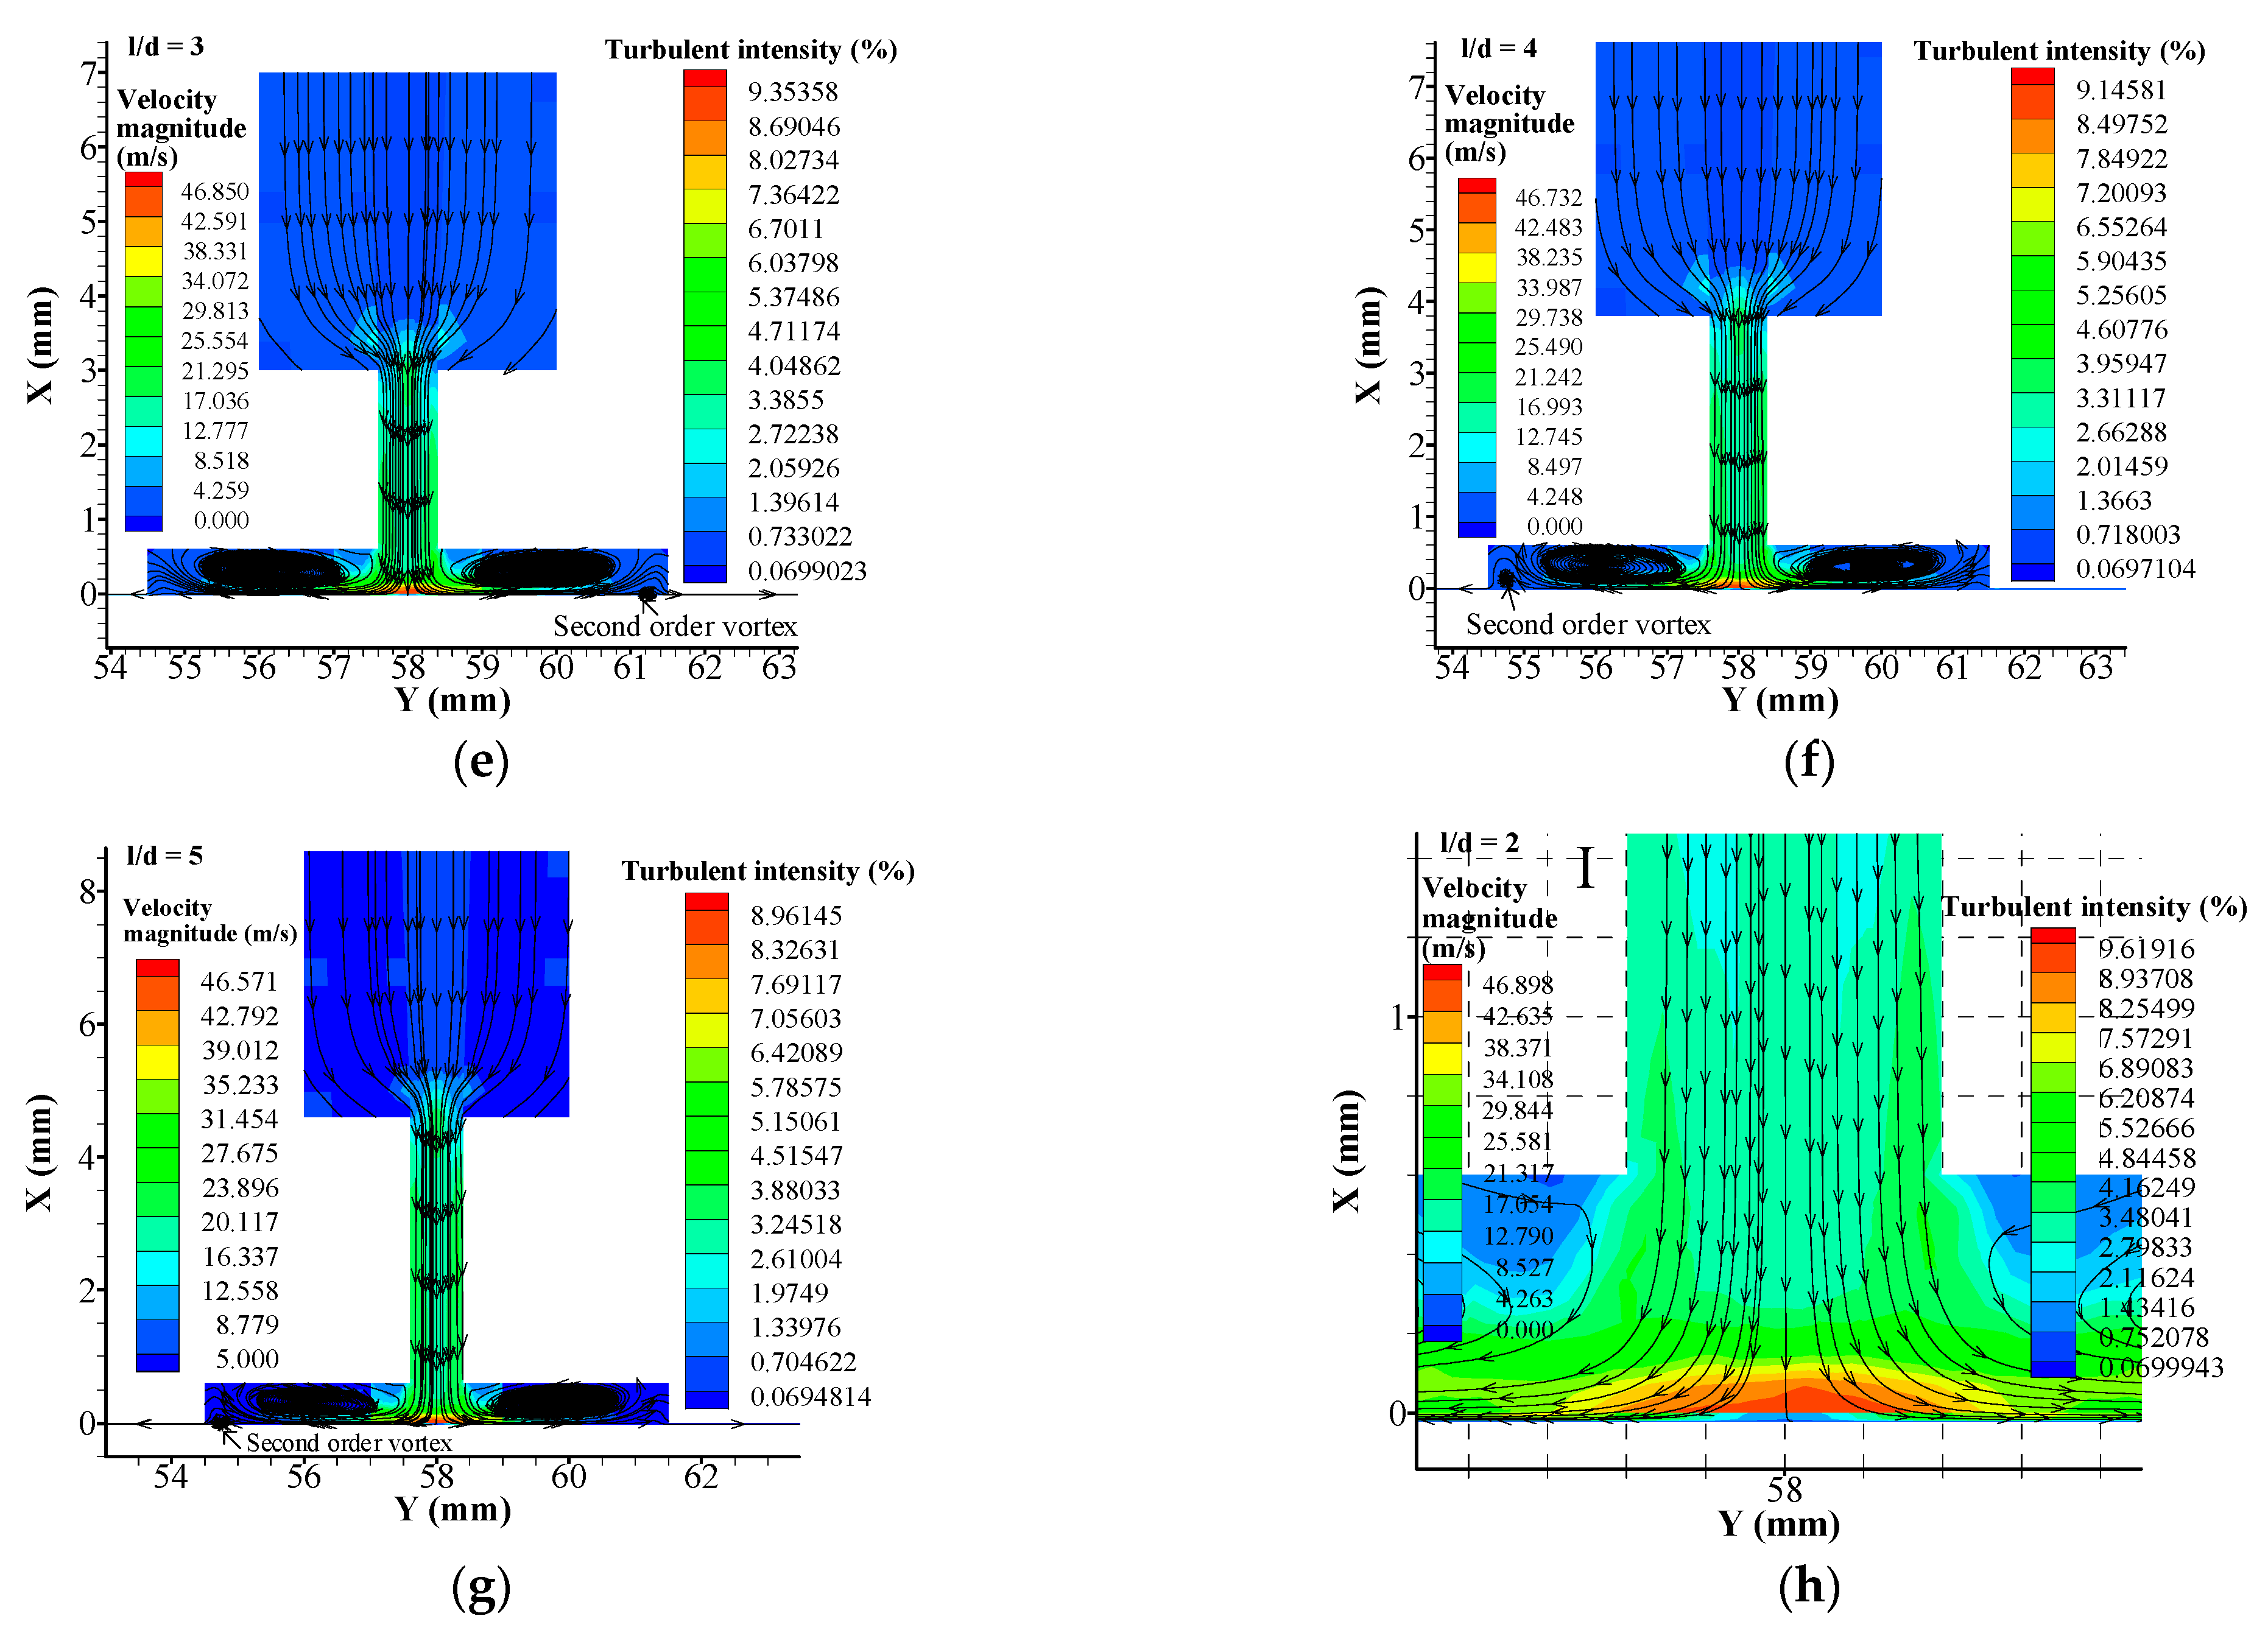
The influences of varying OLDRs on streamlines, the turbulent intensity, and the velocity magnitude of the fluid field along the orifice longitudinal sections (shown in Figure 11b) are simultaneously illustrated in Figure 12. As can be seen from these figures, the turbulent intensities at the oil inlet are all very low (about 0.07%, blue zones in Figure 12) for various OLDRs. In addition, the streamlines in the oil inlet zones are parallel and smooth for all OLDRs, presenting that the fluid field in the oil inlet zone is the laminar flow. After the high-pressure fluid passes through the orifice, two large vortices are formed in the annular recess. The two vortex centers are located near 56 mm and 60 mm along the Y direction, respectively. The left vortex rotates clockwise, and the right vortex rotates counterclockwise. The two vortices differ in the shape and the corresponding turbulent intensity.
So, the zone of high turbulent intensity is not symmetrical with respect to the node position of 58 mm, as shown in Figure 12h. The maximum turbulent intensity is not located at the orifice center line, and decreases as in the sequence of OLDRs of 0.5, 0.25, 1, 2, 3, 4, 5. It is noted that the difference of the maximum turbulent intensity between OLDRs of 0.25 and 0.5 is 0.12%, presenting that the turbulent intensities for OLDRs of 0.25 and 0.5 can be regarded as the same.
Furthermore, the second-order small vortices can be found in the annular recesses with all OLDRs except the OLDR of 2, and are located at the lower right corners of the annular recesses for the OLDRs of 0.25, 0.5, 1, 3 and at the lower left corners of the annular recesses for the OLDRs of 4 and 5. It had been reported that the small vibration of the hydrostatic bearing was mainly caused by the vortex and the vibration energy of the hydrostatic bearing increases with the strength of vortices [30,31,32]. Comparing the vortices of annular recesses with respect to various OLDRs, the OLDR of 2 has the minimum quantity of vortices and has the best ability to decrease the vibration and improve the stability of the bearing.
It can be found from the aforementioned analyses that the fluid characteristics of the orifice-restricted hydrostatic thrust bearing are not absolutely symmetric with respect to the node position of 58 mm. That is because the orifice-restricted hydrostatic thrust bearing is axisymmetric with respect to the central axis, and the fluid field of the orifice longitudinal section is not absolutely symmetric with respect to the node position of 58 mm. Besides, the orifices are located at the radius center line of the thrust bearing, and so the fluid field behaviors of the orifice section are nearly symmetric about the orifice central node.
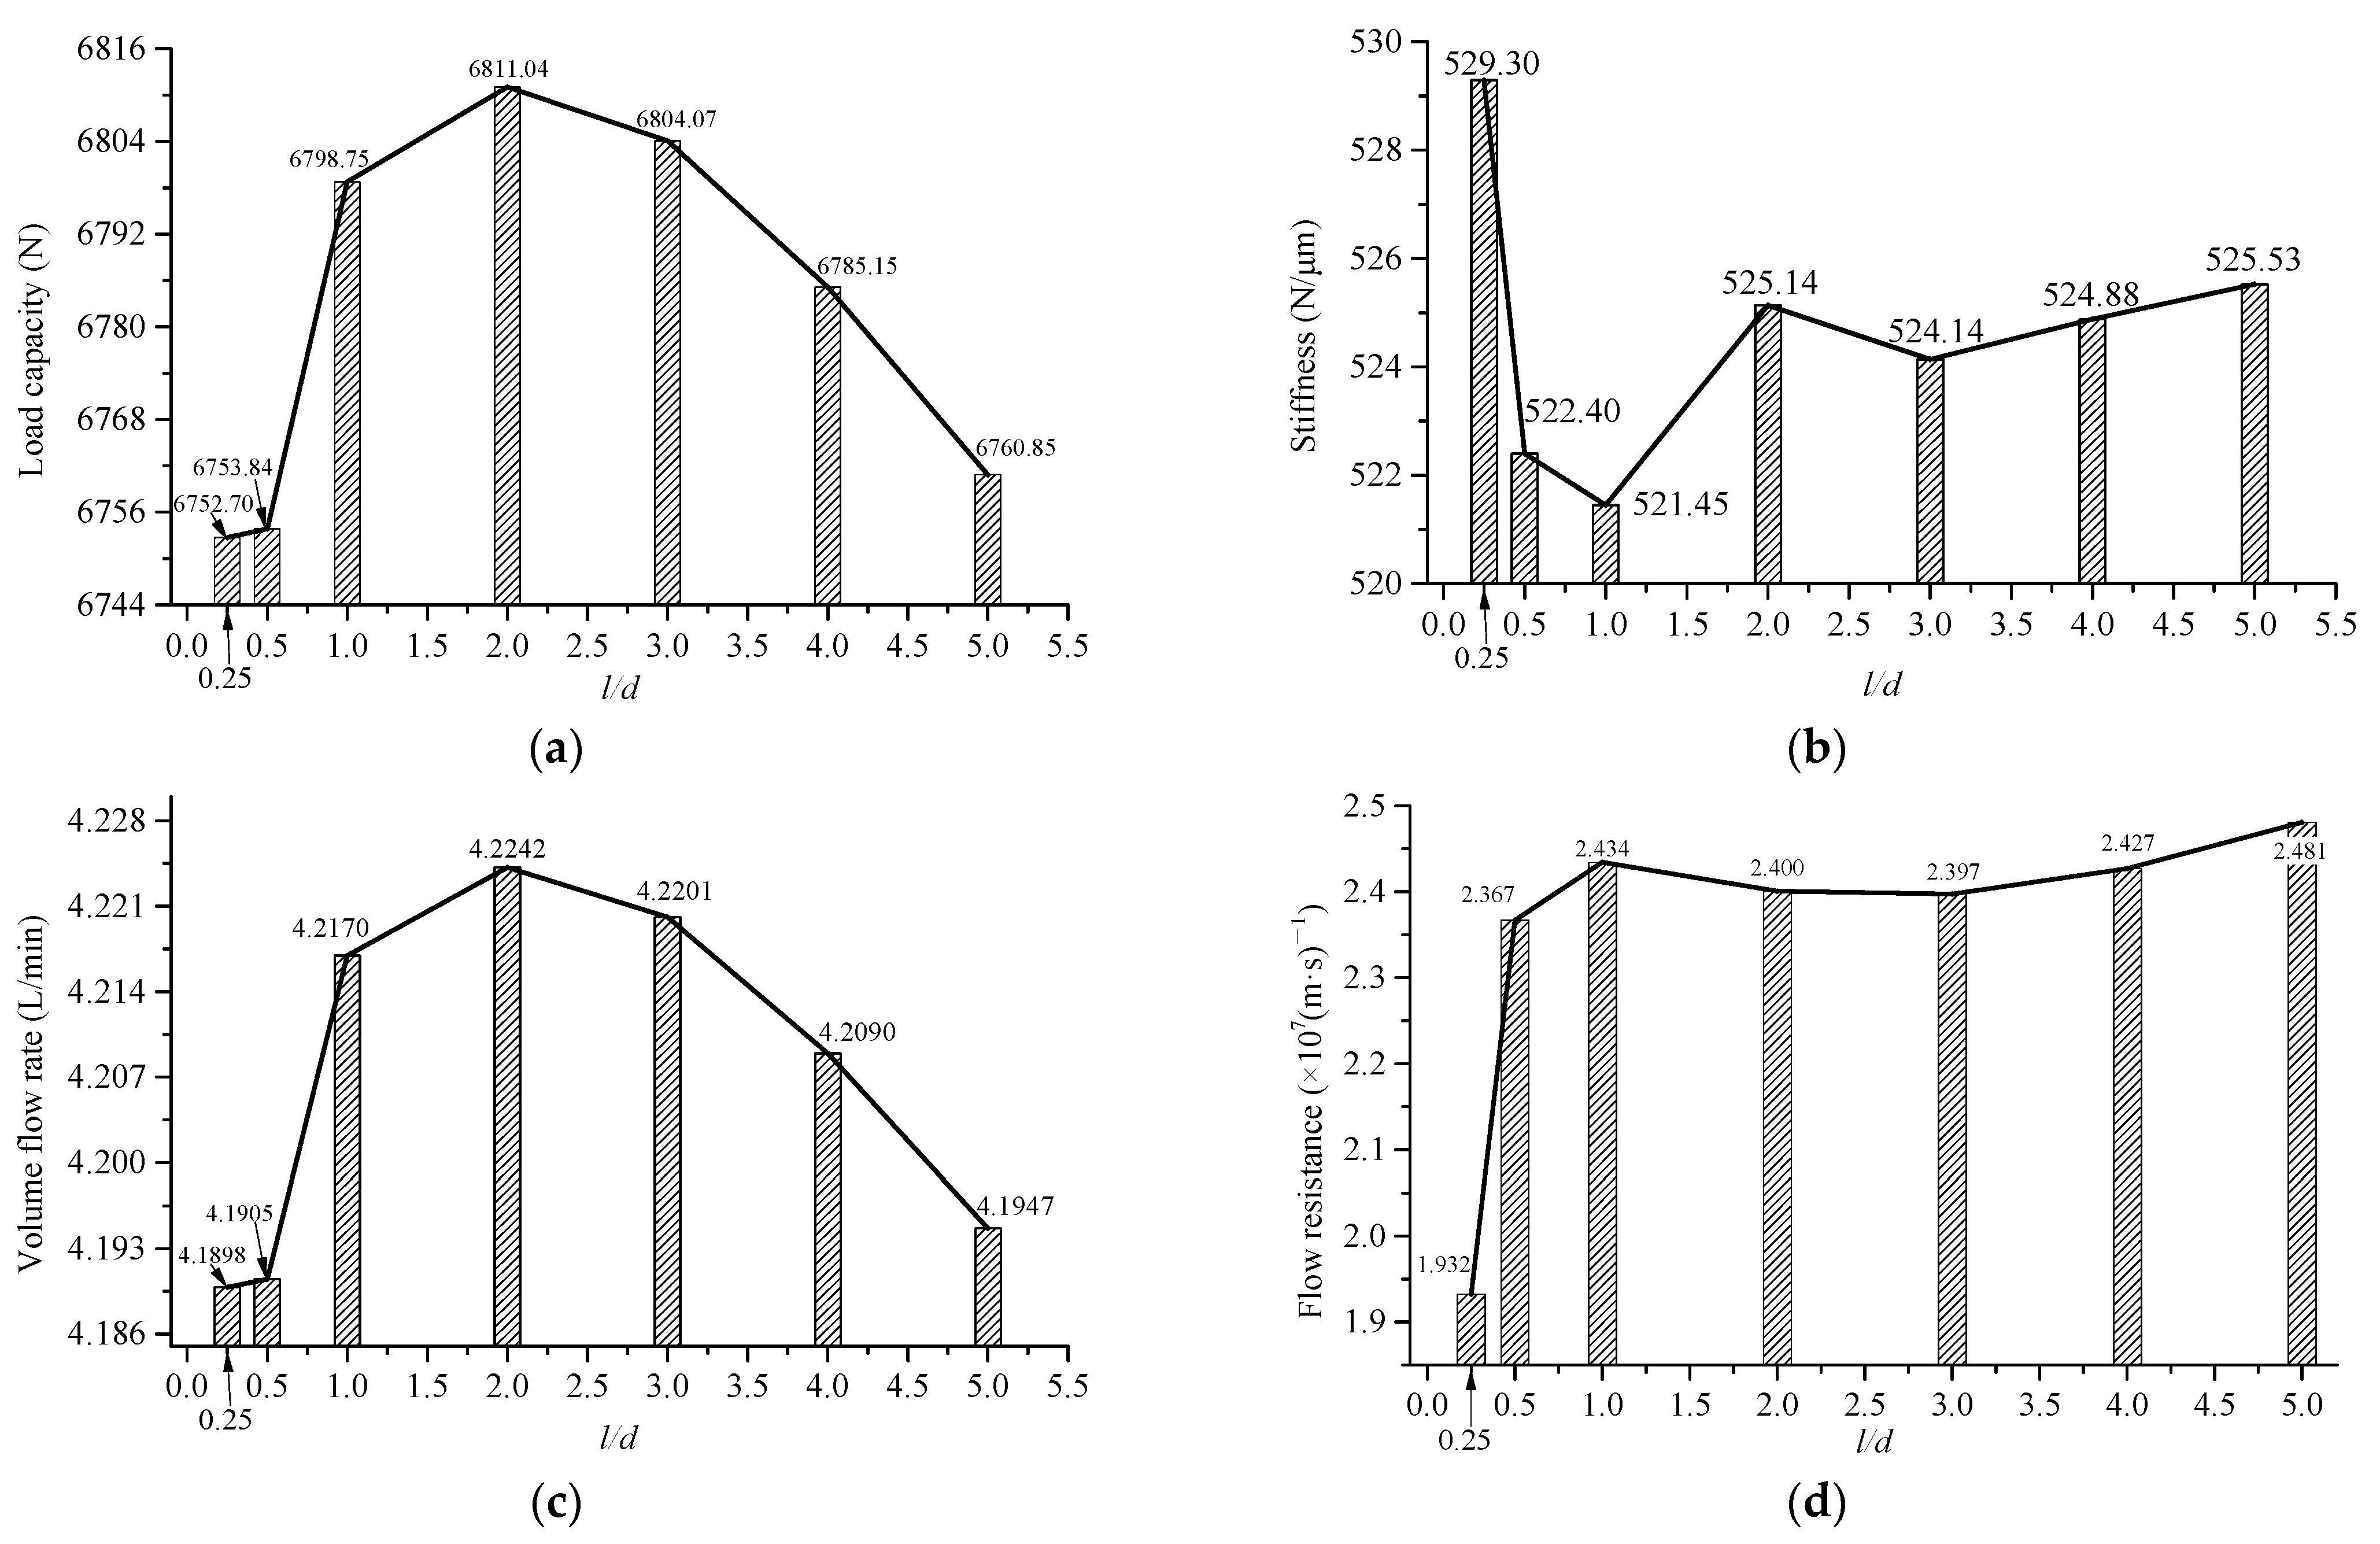
The influences of varying the OLDR on the load capacity, oil film stiffness, volume flow rate of the bearing, and the flow resistance of the orifice are shown in Figure 13. It is clear from Figure 13a that the load capacity with an OLDR of 2 is larger than those of other OLDRs, and the load capacity for different OLDRs decreases as in the sequence of OLDRs of 2, 3, 1, 4, 5, 0.5, 0.25, which is consistent with the order of annular pressure. So, it confirms that annular pressures play a dominant role in the bearing capacity.
In this paper, the oil film stiffness is calculated by the difference method (load variation divided by displacement variation). As can be found from Figure 13b, the OLDR of 0.25 corresponds to the maximum stiffness and the minimum stiffness is located at the OLDR of 1. The stiffness for different OLDRs decreases as in the sequence of OLDRs of 0.25, 5, 2, 4, 3, 0.5, 1.
The effects of varying the OLDR on the volume flow rate of the hydrostatic thrust bearing are shown in Figure 13c. It can be seen that the volume flow rate has the same variation pattern as the load capacity with various OLDRs. The volume flow rate of the hydrostatic thrust bearing with an OLDR of 2 is larger than those of other OLDRs, and the volume flow rate for different OLDRs decreases as in the sequence of OLDRs of 2, 3, 1, 4, 5, 0.5, 0.25.
The orifice restrictor of the hydrostatic thrust bearing has an impedance effect on the fluid. The relationship among the flow rate, the pressure drop, and the flow resistance is similar to Ohm’s law in electricity [33]. Then, the flow resistance of the orifice can be induced as follows:
where Rorifice is the flow resistance of an orifice, pm and pn are pressures of nodes m and n, respectively, q is the flow rate of an orifice.
Flow resistances of the orifice with different OLDRs are shown in Figure 13d. It can be found that the flow resistance increases with increasing OLDRs from 0.25 to 1, then it decreases slightly with increasing OLDRs from 1 to 3, and then it increases again with increasing OLDRs from 3 to 5, and thus does not always increase with the increasing OLDRs. The flow resistances of the orifice for different OLDRs decrease as in the sequence of OLDRs of 5, 1, 4, 2, 3, 0.5, 0.25.
It can be seen from Figure 13 that, although the load capacity, stiffness, volume flow rate, and flow resistance of the thrust bearing with different OLDRs are finitely varied, the simulation results provide theoretical direction for the accurate design of the OLDR especially for the hydrostatic thrust bearing applied in ultra-precision machines.
Based on the aforementioned comparative analyses, effects of various OLDRs on bearing characteristics are compared from different dimensions, and engineers can make selective references according to their own needs.
5. Experimental Validation
It is difficult to test the pressure distribution, velocity magnitude, turbulent intensity, streamlines, and vortices of the hydrostatic thrust bearing with various OLDRs. To decrease the experimental difficulty and cost, the proposed hydrostatic thrust bearing with the OLDR of 2 is manufactured and assembled based on Figure 1 to validate the employed CFD simulation method of this paper.
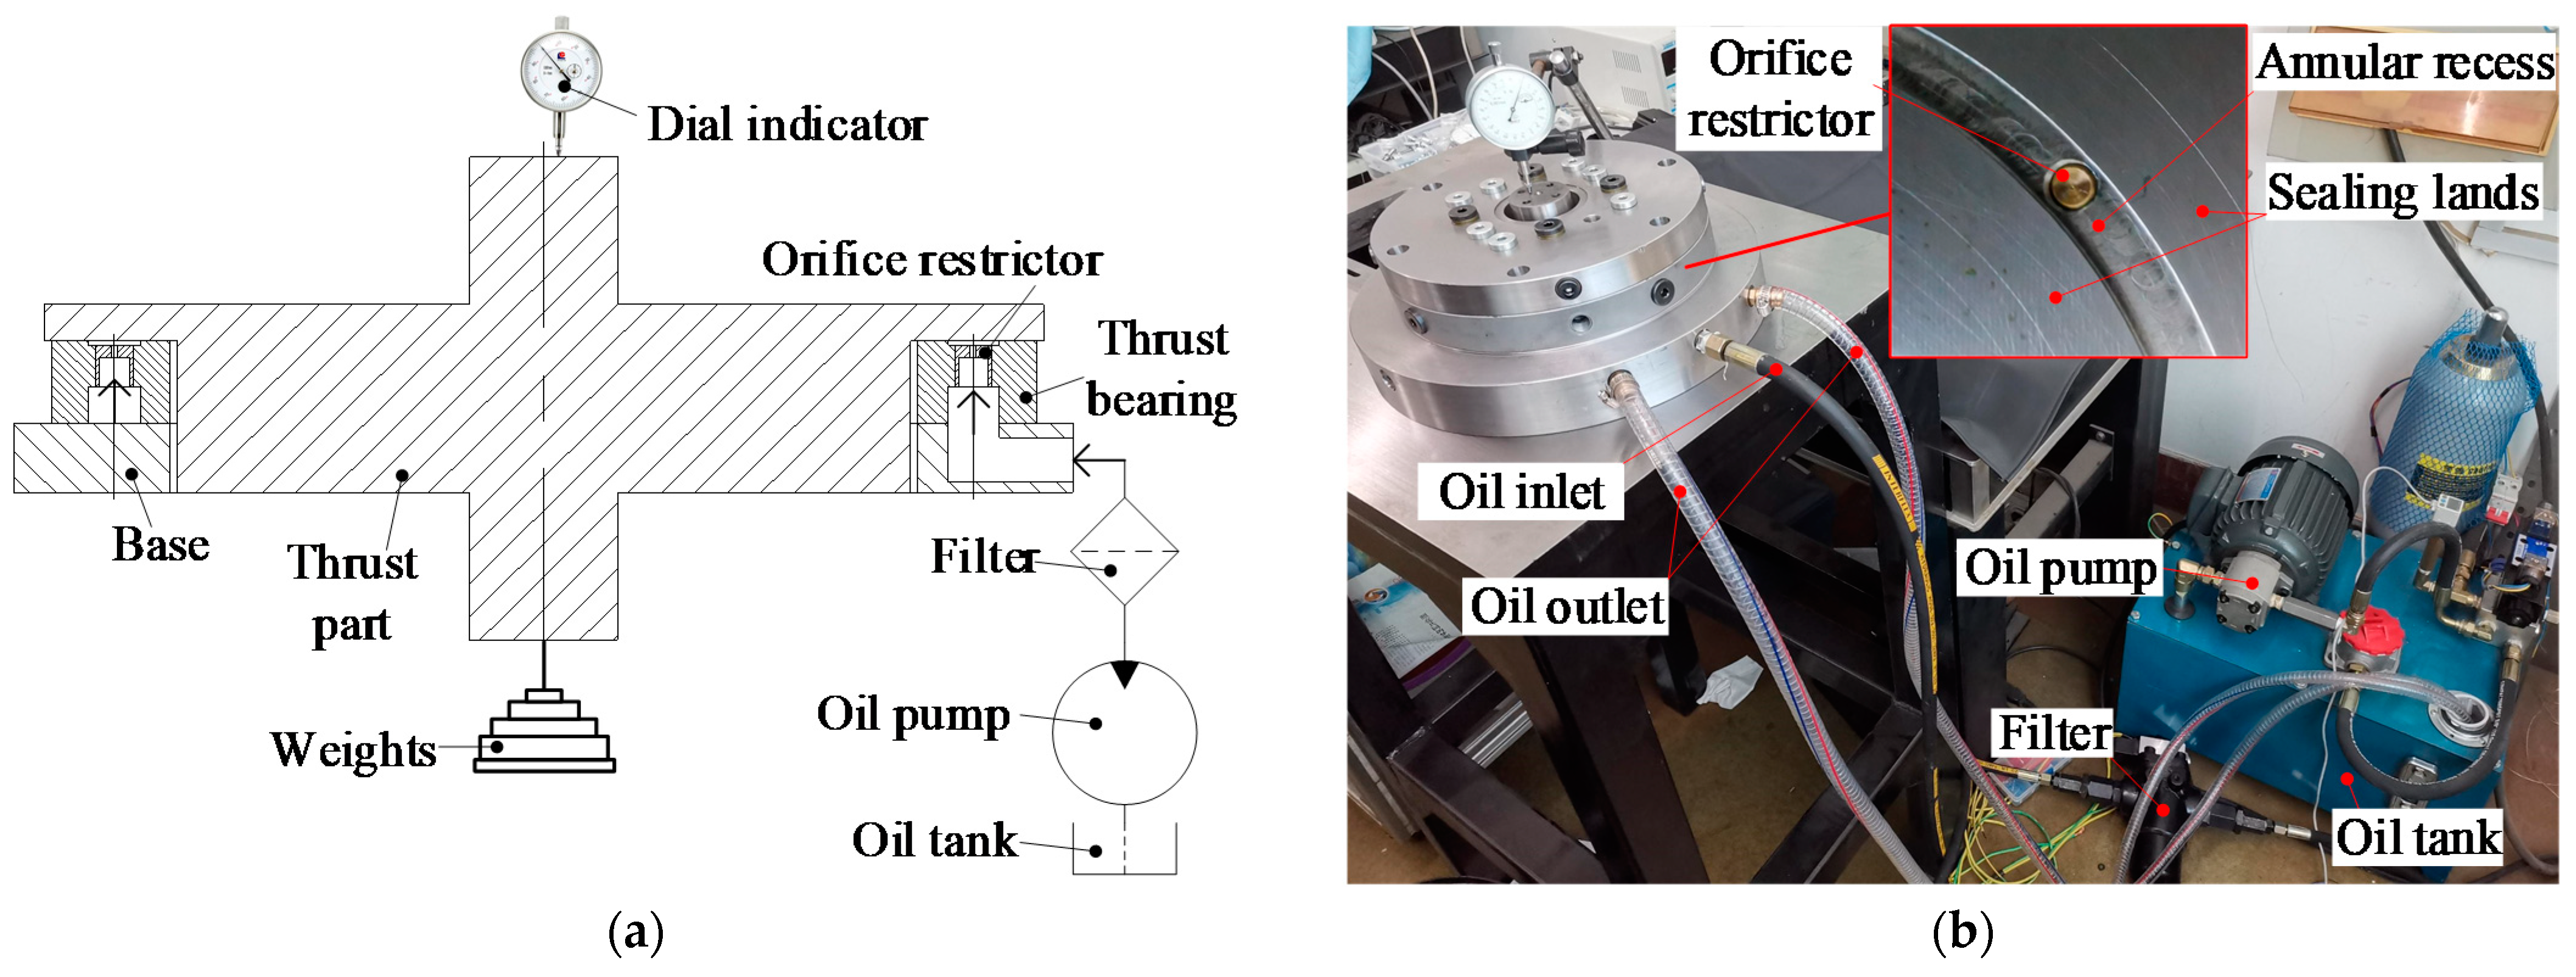
The load capacity and stiffness of the hydrostatic thrust bearing under the aforementioned operating conditions are tested based on the constructed experimental rig, as shown in Figure 14. If the experimental results are in good agreement with the simulation data, the proposed CFD simulation method of this paper will be verified and then other simulation results of this paper will be indirectly validated.
The dial indicator is employed to measure the displacements of the thrust part, and the weights combined with the gravity of the thrust part are used to balance the load capacity of the thrust bearing. Oil is not supplied to the thrust bearing at the beginning and there is no gap between the thrust bearing and the thrust part. When the thrust bearing is supplied oil with gauge total pressure of 2.5 MPa, the weights are adjusted so that the displacement of the thrust part is 20 μm and 19 μm, respectively. Then the load capacities of the thrust bearing are obtained with oil film thicknesses of 20 μm and 19 μm, respectively.
The stiffness is calculated by the difference method with the tested load variation and the displacement variation. The tested load capacities and stiffness are shown in Table 2.
It can be found from Table 2 that the errors between the CFD simulation results and the experimental data are very small, validating that the CFD simulation results of this paper are acceptable.
6. Conclusions
This paper has presented the CFD-based investigation on effects of various orifice length–diameter ratios on performance characteristics of the hydrostatic thrust bearing under identical operating conditions. The simulation results are experimentally validated. Based on the calculated results, the following conclusions can be drawn up, particularly to accurately guide the design of high-precision hydrostatic thrust bearings:
The node pressure, velocity magnitude, and turbulent intensity present different profiles in the orifice zone along the line of m–n with respect to different OLDRs, and the consequent basin effects of the fluid become more and more significant with increasing OLDRs.
For the line of b1–b2, a larger or smaller OLDR is not conducive to pressure maintenance, the distribution of fluid velocity magnitude is almost symmetric and M-shaped, and the maximum turbulent intensity for different OLDRs decreases as in the sequence of OLDRs of 0.5, 0.25, 1, 2, 3, 4, 5.
Two large vortices are formed in the annular recess with various OLDRs, which differ in the shape and the corresponding turbulent intensity. The second-order small vortices appear in the annular recesses with all OLDRs except OLDR of 2.
The load capacity and volume flow rate for different OLDRs decrease as in the sequence of OLDRs of 2, 3, 1, 4, 5, 0.5, 0.25. The stiffness for different OLDRs decreases as in the sequence of OLDRs of 0.25, 5, 2, 4, 3, 0.5, 1. The flow resistance of the orifice for different OLDRs decreases as in the sequence of OLDRs of 5, 1, 4, 2, 3, 0.5, 0.25, and does not always increase with the increasing OLDRs.
Author Contributions
Author Contributions: Conceptualization, S.G. and Q.G.; Methodology, L.L.; Software, S.G. and M.Z.; Validation, Y.S. (Yan Sun) and Y.S. (Youyun Shang); Data curation, S.G. and Q.G.; Resources, Y.S. (Yan Sun) and W.Y.; Writing—original draft, S.G. and Q.G.; Writing—review & editing, S.G., Y.S. (Youyun Shang) and L.L. All authors have read and agreed to the published version of the manuscript.
Funding
This research was funded by the State Key Laboratory of Mechanical Transmissions in Chongqing University, grant number SKLMT-KFKT-201801, and the National Natural Science Foundation of China, grant number 51705501, and the Hei Long Jiang Postdoctoral Foundation, grant number LBH-Z19149, and the State Key Lab of Digital Manufacturing Equipment and Technology in China, grant number DMETKF2017017, and Changzhou Sci&Tech Program, grant number CJ20190007.
Institutional Review Board Statement
“Not applicable” for studies not involving human or animals.
Informed Consent Statement
“Not applicable” for studies not involving human.
Data Availability Statement
The data presented in this study are available on reasonable request from the corresponding author.
Conflicts of Interest
The authors declare no conflict of interest.
References
- Liu, Z.; Wang, Y.; Cai, L.; Zhao, Y.; Cheng, Q.; Dong, X. A review of hydrostatic bearing system: Researches and applications. Adv. Mech. Eng. 2017, 9, 1–27. [Google Scholar] [CrossRef]
- Urreta, H.; Aguirre, G.; Kuzhir, P.; Lacalle, L.N.L. Seals based on magnetic fluids for high precision spindles of machine tools. Int. J. Precis. Eng. Manuf. 2018, 19, 495–503. [Google Scholar] [CrossRef] [Green Version]
- Wardle, F. Ultra Precision Bearings; Woodhead Publishing: Cambridge, UK, 2015; pp. 147–225. [Google Scholar]
- Jain, S.C.; Sinhasan, R.; Sharma, S.C. Analytical study of a flexible hybrid journal bearing system using different flow control devices. Tribol. Int. 1992, 25, 387–395. [Google Scholar] [CrossRef]
- Gohara, M.; Somaya, K.; Miyatake, M.; Yoshimoto, S. Static characteristics of a water-lubricated hydrostatic thrust bearing using a membrane restrictor. Tribol. Int. 2014, 75, 111–116. [Google Scholar] [CrossRef]
- Sawano, H.; Nakamura, Y.; Yoshioka, H.; Shinno, H. High performance hydrostatic bearing using a variable inherent restrictor with a thin metal plate. Precis. Eng. 2015, 41, 78–85. [Google Scholar] [CrossRef]
- Sharma, S.C.; Jain, S.C.; Bharuka, D.K. Influence of recess shape on the performance of a capillary compensated circular thrust pad hydrostatic bearing. Tribol. Int. 2002, 35, 347–356. [Google Scholar] [CrossRef]
- Su, H.; Lu, L.; Liang, Y.; Zhang, Q.; Sun, Y. Thermal analysis of the hydrostatic spindle system by the finite volume element method. Int. J. Adv. Manuf. Technol. 2014, 71, 1949–1959. [Google Scholar] [CrossRef]
- Cravero, C.; Domenico, D.D.; Leutcha, P.J.; Marsano, D. Strategies for the numerical modelling of regenerative pre-heating systems for recycled glass raw material. Math. Model. Eng. Probl. 2019, 6, 324–332. [Google Scholar] [CrossRef] [Green Version]
- Huang, H.; Sun, T.; Zhang, G.; Li, D.; Wei, H. Evaluation of a developed SST k-ω turbulence model for the prediction of turbulent slot jet impingement heat transfer. Int. J. Heat Mass Transf. 2019, 139, 700–712. [Google Scholar] [CrossRef]
- Chen, D.; Fan, J.; Zhang, F. Dynamic and static characteristics of a hydrostatic spindle for machine tools. J. Manuf. Syst. 2012, 31, 26–33. [Google Scholar] [CrossRef]
- Urreta, H.; Aguirre, G.; Kuzhir, P.; Lacalle, L.N.L. Actively lubricated hybrid journal bearings based on magnetic fluids for high-precision spindles of machine tools. J. Intell. Mater. Syst. Struct. 2019, 30, 2257–2271. [Google Scholar] [CrossRef] [Green Version]
- Ghezali, F.; Bouzidane, A.; Thomas, M. 3D numerical investigation of pressure field of an orifice compensated hydrostatic bearing. Mech. Ind. 2017, 18, 101. [Google Scholar] [CrossRef]
- Rowe, W.B. Hydrostatic, Aerostatic, and Hybrid Bearing Design; Butterworth-Heinemann: Oxford, UK, 2012; pp. 1–320. [Google Scholar]
- Sharma, S.C.; Phalle, V.M.; Jain, S.C. Influence of wear on the performance of a multirecess conical hybrid journal bearing compensated with orifice restrictor. Tribol. Int. 2011, 44, 1754–1764. [Google Scholar] [CrossRef]
- Nicodemus, R.E.; Sharma, S.C. Orifice compensated multirecess hydrostatic/hybrid journal bearing system of various geometric shapes of recess operating with micropolar lubricant. Tribol. Int. 2011, 44, 284–296. [Google Scholar] [CrossRef]
- Chen, C.H.; Kang, Y.; Chang, Y.; Wang, Y.; Lee, H. Influence of restrictor on stability of the rigid rotor–hybrid bearing system. J. Sound. Vib. 2006, 297, 635–648. [Google Scholar] [CrossRef]
- Du, J.; Liang, G. Performance comparative analysis of hydrostatic bearings lubricated with low-viscosity cryogenic fluids. Tribol. Int. 2019, 137, 139–151. [Google Scholar] [CrossRef]
- Sinhasan, R.; Sah, P.L. Static and dynamic performance characteristics of an orifice compensated hydrostatic journal bearing with non-Newtonian lubricants. Tribol. Int. 1996, 29, 515–526. [Google Scholar] [CrossRef]
- Sharma, S.C.; Yadav, S.K. A comparative study of full and partial textured hybrid orifice compensated circular thrust pad bearing system. Tribol. Int. 2016, 95, 170–180. [Google Scholar] [CrossRef]
- Sharma, S.C.; Yadav, S.K. Performance analysis of a fully textured hybrid circular thrust pad bearing system operating with non-Newtonian lubricant. Tribol. Int. 2014, 77, 50–64. [Google Scholar] [CrossRef]
- Arghir, M.; Attar, S.E.; Nicolas, D. Pressure drop in a hydrostatic pocket. experimental and theoretical results. Third Body Concept Interpret. Tribol. Phenom. 1996, 31, 423–432. [Google Scholar]
- Guo, Z.; Hirano, T.; Kirk, R.G. Application of CFD analysis for rotating machinery—Part i: Hydrodynamic, hydrostatic bearings and squeeze film damper. J. Eng. Gas Turbines Power 2005, 127, 445–451. [Google Scholar] [CrossRef]
- Kozdera, M.; Drbáková, S. Numerical modelling of the flow in the annular multi-recess hydrostatic thrust bearing using CFD methods. EPJ Web Conf. 2013, 45, 01051. [Google Scholar] [CrossRef]
- Zhang, Y.; Fan, L.; Li, R.; Dai, C.; Yu, X. Simulation and experimental analysis of supporting characteristics of multiple oil pad hydrostatic bearing disk. J. Hydrodyn. 2013, 25, 236–241. [Google Scholar] [CrossRef]
- Ansys Inc. ANSYS 2020 R2 Help. Available online: https://www.ansys.com/products/release-highlights (accessed on 21 January 2021).
- Shih, T.H.; Liou, W.W.; Shabbir, A.; Yang, Z.; Zhu, J. A new k-ϵ eddy viscosity model for high reynolds number turbulent flows. Comput. Fluids 1995, 24, 227–238. [Google Scholar] [CrossRef]
- Gao, G.; Yin, Z.; Jiang, D.; Zhang, X. Numerical analysis of plain journal bearing under hydrodynamic lubrication by water. Tribol. Int. 2014, 75, 31–38. [Google Scholar] [CrossRef]
- Xu, E.; Wang, Y.; Wu, J.; Xu, S.; Wang, Y.; Wang, S. Investigations on the applicability of hydrostatic bearing technology in a rotary energy recovery device through CFD simulation and validating experiment. Desalin 2016, 383, 60–67. [Google Scholar] [CrossRef]
- Aoyama, T.; Kakinuma, Y.; Kobayashi, Y. Numerical and experimental analysis for the small vibration of aerostatic guideways. CIRP Ann. 2006, 55, 419–422. [Google Scholar] [CrossRef]
- Chen, X.; Chen, H.; Luo, X.; Ye, Y.; Hu, Y.; Xu, J. Air vortices and nano-vibration of aerostatic bearings. Tribol. Lett. 2011, 42, 179–183. [Google Scholar] [CrossRef]
- Gao, S.; Cheng, K.; Chen, S.; Ding, H.; Fu, H. CFD based investigation on influence of orifice chamber shapes for the design of aerostatic thrust bearings at ultra-high speed spindles. Tribol. Int. 2015, 92, 211–221. [Google Scholar] [CrossRef]
- Lin, Y.; Liao, C.; Lin, T.; Lin, C. Simulations of flow resistances in circular and square hydrostatic bearings. Procedia Eng. 2014, 79, 114–118. [Google Scholar] [CrossRef]
Figure 1.
Schematic configuration of the orifice-compensated hydrostatic thrust bearing. (a) The hydrostatic thrust bearing; (b) local enlarged view of I.
Figure 1.
Schematic configuration of the orifice-compensated hydrostatic thrust bearing. (a) The hydrostatic thrust bearing; (b) local enlarged view of I.

Figure 2.
Pressure comparison of two meshing schemes along the line of a1–a2.

Figure 3.
Partial computational meshes.

Figure 4.
Pressure patterns of various orifice length–diameter ratio (OLDRs) along the line of c1–c2. (a) Node pressures of various OLDRs along the line of c1–c2; (b) local enlarged view of I.
Figure 4.
Pressure patterns of various orifice length–diameter ratio (OLDRs) along the line of c1–c2. (a) Node pressures of various OLDRs along the line of c1–c2; (b) local enlarged view of I.

Figure 5.
Velocity magnitude patterns of various OLDRs along the line of c1–c2. (a) Velocity magnitudes of various OLDRs along the line of c1–c2; (b) local enlarged view of I.
Figure 5.
Velocity magnitude patterns of various OLDRs along the line of c1–c2. (a) Velocity magnitudes of various OLDRs along the line of c1–c2; (b) local enlarged view of I.

Figure 6.
Turbulent intensity patterns of various OLDRs along the line of c1–c2. (a) Turbulent intensities of various OLDRs along the line of c1–c2; (b) local enlarged view of I.
Figure 6.
Turbulent intensity patterns of various OLDRs along the line of c1–c2. (a) Turbulent intensities of various OLDRs along the line of c1–c2; (b) local enlarged view of I.

Figure 7.
Pressure patterns of various OLDRs along the line of b1–b2. (a) Node pressures of various OLDRs along the line of b1–b2; (b) local enlarged view of I; (c) local enlarged view of II.
Figure 7.
Pressure patterns of various OLDRs along the line of b1–b2. (a) Node pressures of various OLDRs along the line of b1–b2; (b) local enlarged view of I; (c) local enlarged view of II.

Figure 8.
Velocity magnitude patterns of various OLDRs along the line of b1–b2. (a) Velocity magnitudes of various OLDRs along the line of b1–b2; (b) local enlarged view of I; (c) local enlarged view of II.
Figure 8.
Velocity magnitude patterns of various OLDRs along the line of b1–b2. (a) Velocity magnitudes of various OLDRs along the line of b1–b2; (b) local enlarged view of I; (c) local enlarged view of II.

Figure 9.
Turbulent intensity patterns of various OLDRs along the line of b1–b2. (a) Turbulent intensities of various OLDRs along the line of b1–b2; (b) local enlarged view of I.
Figure 9.
Turbulent intensity patterns of various OLDRs along the line of b1–b2. (a) Turbulent intensities of various OLDRs along the line of b1–b2; (b) local enlarged view of I.

Figure 10.
Pressure patterns of various OLDRs along the line of a1–a2. (a) Node pressures of various OLDRs along the line of a1–a2; (b) local enlarged view of I; (c) local enlarged view of II.
Figure 10.
Pressure patterns of various OLDRs along the line of a1–a2. (a) Node pressures of various OLDRs along the line of a1–a2; (b) local enlarged view of I; (c) local enlarged view of II.

Figure 11.
Pressure distributions of wall S for various OLDRs. (a) l/d = 0.25; (b) l/d = 0.5; (c) l/d = 1; (d) l/d = 2; (e) l/d = 3; (f) l/d = 4; (g) l/d = 5.
Figure 11.
Pressure distributions of wall S for various OLDRs. (a) l/d = 0.25; (b) l/d = 0.5; (c) l/d = 1; (d) l/d = 2; (e) l/d = 3; (f) l/d = 4; (g) l/d = 5.


Figure 12.
Streamlines and turbulent intensities contours of orifice longitudinal sections for various OLDRs. (a) l/d = 0.25; (b) l/d = 0.5; (c) l/d = 1; (d) l/d = 2; (e) l/d = 3; (f) l/d = 4; (g) l/d = 5; (h) local enlarged view of I.
Figure 12.
Streamlines and turbulent intensities contours of orifice longitudinal sections for various OLDRs. (a) l/d = 0.25; (b) l/d = 0.5; (c) l/d = 1; (d) l/d = 2; (e) l/d = 3; (f) l/d = 4; (g) l/d = 5; (h) local enlarged view of I.


Figure 13.
Performance characteristics of the bearing for various OLDRs. (a) Load capacity; (b) oil film stiffness; (c) volume flow rate; (d) flow resistance of the orifice.
Figure 13.
Performance characteristics of the bearing for various OLDRs. (a) Load capacity; (b) oil film stiffness; (c) volume flow rate; (d) flow resistance of the orifice.

Figure 14.
Experimental bench of the hydrostatic thrust bearing with OLDR of 2. (a) Schematic diagram of the test rig; (b) experimental setup.
Figure 14.
Experimental bench of the hydrostatic thrust bearing with OLDR of 2. (a) Schematic diagram of the test rig; (b) experimental setup.


Table 1.
Comparisons of performance specifications of the hydrostatic thrust bearing with two different meshing schemes.
Table 1.
Comparisons of performance specifications of the hydrostatic thrust bearing with two different meshing schemes.
| Meshing Scheme | Load Capacity (N) | Volume Flow Rate (L/min) | Oil Film Stiffness (N/μm) |
|---|---|---|---|
| Scheme 1 | 6811 | 4.22 | 520 |
| Scheme 2 | 6885 | 4.23 | 513 |
| 1.09% | 0.24% | 1.35% |
Table 2.
Comparisons of performance specifications of the hydrostatic thrust bearing with OLDR of 2 between CFD simulation results and experimental data.
Table 2.
Comparisons of performance specifications of the hydrostatic thrust bearing with OLDR of 2 between CFD simulation results and experimental data.
| Performance Parameters | Displacement | Computational Fluid Dynamics (CFD) Simulation Results | Experimental Data | Error |
|---|---|---|---|---|
| Load capacity (N) | 20 μm | 6811 | 6800 | 0.16% |
| 19 μm | 7331 | 7315 | 0.22% | |
| Oil film stiffness (N/μm) | 520 | 515 | 0.96% | |
Publisher’s Note: MDPI stays neutral with regard to jurisdictional claims in published maps and institutional affiliations. |
© 2021 by the authors. Licensee MDPI, Basel, Switzerland. This article is an open access article distributed under the terms and conditions of the Creative Commons Attribution (CC BY) license (http://creativecommons.org/licenses/by/4.0/).
Share and Cite
MDPI and ACS Style
Gao, S.; Shang, Y.; Gao, Q.; Lu, L.; Zhu, M.; Sun, Y.; Yu, W. CFD-Based Investigation on Effects of Orifice Length–Diameter Ratio for the Design of Hydrostatic Thrust Bearings. Appl. Sci. 2021, 11, 959. https://doi.org/10.3390/app11030959
AMA Style
Gao S, Shang Y, Gao Q, Lu L, Zhu M, Sun Y, Yu W. CFD-Based Investigation on Effects of Orifice Length–Diameter Ratio for the Design of Hydrostatic Thrust Bearings. Applied Sciences. 2021; 11(3):959. https://doi.org/10.3390/app11030959
Chicago/Turabian StyleGao, Siyu, Youyun Shang, Qiang Gao, Lihua Lu, Min Zhu, Yan Sun, and Weifeng Yu. 2021. "CFD-Based Investigation on Effects of Orifice Length–Diameter Ratio for the Design of Hydrostatic Thrust Bearings" Applied Sciences 11, no. 3: 959. https://doi.org/10.3390/app11030959
Note that from the first issue of 2016, this journal uses article numbers instead of page numbers. See further details here.