Augmented Reality Visualization of Modal Analysis Using the Finite Element Method
by

Merve Yavuz Erkek
1,*, 
Selim Erkek
2,
Elmira Jamei
3, 
Mehdi Seyedmahmoudian
4,
Alex Stojcevski
4 and
Ben Horan
1 1
CADET Virtual Reality Lab School of Engineering, Deakin University, Geelong, VIC 3220, Australia
2
Forms Express Pty Ltd., Geelong, VIC 3216, Australia
3
College of Engineering and Science, Victoria University, Melbourne, VIC 3011, Australia
4
Faculty of Science, Engineering & Technology, Swinburne University of Technology, Hawthorn, VIC 3122, Australia
*
Author to whom correspondence should be addressed.
Appl. Sci. 2021, 11(3), 1310; https://doi.org/10.3390/app11031310
Submission received: 18 January 2021
/
Revised: 25 January 2021
/
Accepted: 26 January 2021
/
Published: 1 February 2021
(This article belongs to the Section Mechanical Engineering)
Abstract
:Modal analysis provides the dynamic behavior of an object or structure, and is often undertaken using the Finite Element Method (FEM) due to its ability to deal with arbitrary geometries. This article investigates the use of Augmented Reality (AR) to provide the in situ visualization of a modal analysis for an aluminum impeller. Finite Element Analysis (FEA) software packages regularly use heat maps and shape deformation to visualize the outcomes of a given simulation. AR allows the superimposition of digital information on a view of the real-world environment, and provides the opportunity to overlay such simulation results onto real-world objects and environments. The presented modal analysis undertaken herein provides natural frequencies and the corresponding deformation of an aluminum impeller. The results indicate the ability for the design part and finite element analysis results to be viewed on the physical part. A mobile AR-FEA-based system was developed for Modal Analysis result visualization. This study offers designers and engineers a new way to visualize such simulation results.
1. Introduction
Finite Element Analysis (FEA) is commonly used in industrial design and is highly preferred by engineers. By using FEA, engineers understand the behavior of the part under different forces and constraints. Design process has two important steps: the drawing and the analysis of designed elements. Under the design classification, functional and aesthetical aspects are mainly taken into account. In the analysis classification, what is taken into consideration is the fact that the designed product provides the desired resistance under real working conditions. However, whether the completed design will fulfill the desired task when the operating conditions are implemented is unclear. Necessary engineering calculations and analyses must be performed in advance to respond to such issues. This is aimed at minimizing risks by predicting the real-life working conditions of the designed product or system through analysis. With a finite element analysis, the part can be made resistant to the loads to which it is exposed, and unnecessary material use is also prevented.
Given the various benefits brought by this type of analysis, it is critically important to conduct the analysis before the beginning of the production process. With FEA, the testing of complex products can be carried out in a virtual environment without actual production. As a result, there is no need to produce the parts for testing purposes. This process reduces the need for prototyping and functionality tests that are difficult to implement. This minimizes the material and labor costs. Subsequently, tests can be continued on the first series of prototypes. Featuring easy boundary conditions, FEA facilitates the use of the right material by achieving optimum results in designs and saves time by shortening the design process.
FEA is also known as one of the most effective and common methods for addressing ranges of different issues in engineering and physics [1]. This method is based on the modeling of complex structures with smaller structures that can be calculated. This method is also used in almost all fields of engineering, including structural analysis (e.g., static, dynamic, linear and nonlinear), heat transfer, and flow analysis. FEA is the first step for the optimization of the products. FEA is used to identify the weaknesses and strengths of designs. While FEA enables engineers to apply and test a scenario in a virtual environment, by now this virtual environment has been provided by computer simulations. With the development of technology, it is predicted that engineering analysis will be supported with Augmented Reality (AR) and Virtual Reality (VR). Accordingly, this study aimed to combine both FEA and AR. AR offers the opportunity to support people with additional information while they are performing their role. Finite element analysis helps to anticipate product real behavior under real effects such as vibration, forces, heat and flow. FEA uses a large number of finite elements to divide real objects. Each element’s behavior is calculated via mathematical equations. All elements’ behaviors are collected by computer to predict the real objects’ behaviors. Augmented reality uses the object recognition features of the devices to visualize virtual objects on real images (Figure 1a). AR overlays digital content onto a live view of the real environment, is normally implemented on a wearable AR headset or smartphone/tablet device, and has been used in a number of applications [2,3,4]. By using the AR-FEA system, engineers can perform and evaluate simulations in a real environment. Simulation results can be visualized on real components. AR-FEA visualization allows for the easy identification of critical areas and a better interpretation of data. Displaying the analysis result in a real environment strengthens FEA.
In the literature, many modal analysis studies have been conducted with finite element analysis. The results of the modal analysis were always viewed on the computer. In this study, the modal analysis results obtained by finite element analysis have been displayed for the first time with augmented reality on a mobile phone application. Modal analysis and augmented reality combination issues have not been studied before in the literature. The determination of the modal analysis results of impellers and the ability to display these results in a mobile application with increased reality render this an original study.
VR environments are computer-sourced 3D environments where individuals experience the feeling of being within a space. As soon as the user enters the virtual reality environment, disconnection from reality occurs and the user can experience the feeling of being in a space created by VR (Figure 1b).
Based on the sense of reality they create for participants, VR environments are classified into three categories. These categories are as follows: 1—Partial Participation Environments: Using various physical elements and virtual images, this environment engenders a sense of reality for the participant (e.g., flight simulators) without completely breaking the relationship with the real world. 2—Fully Participated Environments, which consist of a CAVE, or “Computer Assisted Virtual Environment”, where all of the sensory perceptions of the participants are fully addressed. A typical CAVE system includes floor projection, walls and sensor speakers that facilitate the broadcasting of music or sounds (Figure 2). 3—Multi-Participation Environments: All of these environments provide a place for participants to connect and interact within these virtual worlds. These environments enable people to exchange ideas by participating in a virtual environment via their computers. The joystick, glove, head-mounted display and other equipment help users to come into contact with the virtual environment.
Virtual Reality (VR) enables the user to get fully immersed in a virtual environment and creates a wide range of applications through the use of high-quality consumer-grade headsets [5,6,7,8,9].
Day by day, the use of VR and AR is increasing in every field. The existing literature has revealed that the importance of AR in visualizing the finite element is well-established in the literature. Li et al. [10,11] presented an investigation of research studies on FEA simulations and analyses in AR. They developed an FEA result visualization system, FEA-AR integration and offer a strong level of understanding in relation to engineering issues. The effectual and strong visualization of the results can prevent the misinterpretation of FEA simulation results. Ong and Huang [12] presented an AR-FEA combination system to improve the design and simulation. Users could add virtual loads and could change physical structures with this combination system. Huang et al. [13,14,15] aimed to visualize FEA results on a real structure by using AR. They examined FEA results superimposed on real objects. This process enabled the facilitation of the interpretation of the analysis results. Lechner et al. [16] visualized the simulation results using AR solutions with Hololens in order to position the designs and analysis in a real environment. Seo et al. [17] proposed FEA and a product simulation platform to ensure small and medium-sized enterprises and enable the customers to have a platform for collaborations to achieve high-performing engineering product designs. Hu et al. [18] presented a VR simulation of an FEA analysis visualization via a discrete event system specification (DEVS) method. Turkan et al. [19] introduced a new pedagogy for teaching structural analysis that combined interactive 3D visualization technology and AR. They examined the behavior of structures under different boundary conditions by using 3D models and augmented reality. They aimed to improve structural analysis worksheets and textbooks. Ryken and Vance [20] studied a tractor lift arm stress analysis by using virtual reality techniques. Fukuda et al. [21] developed a new augmented reality methodology to visualize an indoor thermal environment. They aimed to use this methodology to build regeneration projects. This study aimed to help users easily figure out computational fluid dynamics simulation results via an augmented visualization.
Erdemir and Ozkan [22] carried out a modal analysis for models obtained by using the Acrylonitrile Butadiene Styrene (ABS), Polylactic Acid (PLA) and Polyethylene Terephthalate Glycol copolymer (PET-G) materials of a fastener with locking details on the foot, which was described as a beam. A harmonic response analysis was performed using the data obtained from the modal analysis. Palanivelu et al. [23] examined a rolling tyre modal analysis. They used Abaqus Software for Explicit FEA. A new method was used to determine the modal parameters. Haffar and Sandor [24] discussed the buckling behavior of stiffened plates. They used a finite element analysis to determine modal deformations. Kumar [25] examined aluminum beam modal analysis behavior by using the finite element method with ANSYS software. Gu and Luo [26] conducted an experimental modal analysis and finite element modal analysis of a turbine disk by using the hammering method and Ansys software. Singh et al. [27] studied the modal analysis of two different horn profiles, steeped and exponential, performed using finite element-based ANSYS software. The mode shape and natural frequencies of two profiles made of titanium and aluminum were taken into consideration.
The literature shows that the AR and FEA combination is often a big challenge. There are many articles on finite element analysis and modal analysis without AR visualization. Several applications have been developed by combining AR with stress analysis and computational fluid dynamics simulations. However, there is a lack of studies that combine modal analysis and augmented reality.
2. Materials and Methods
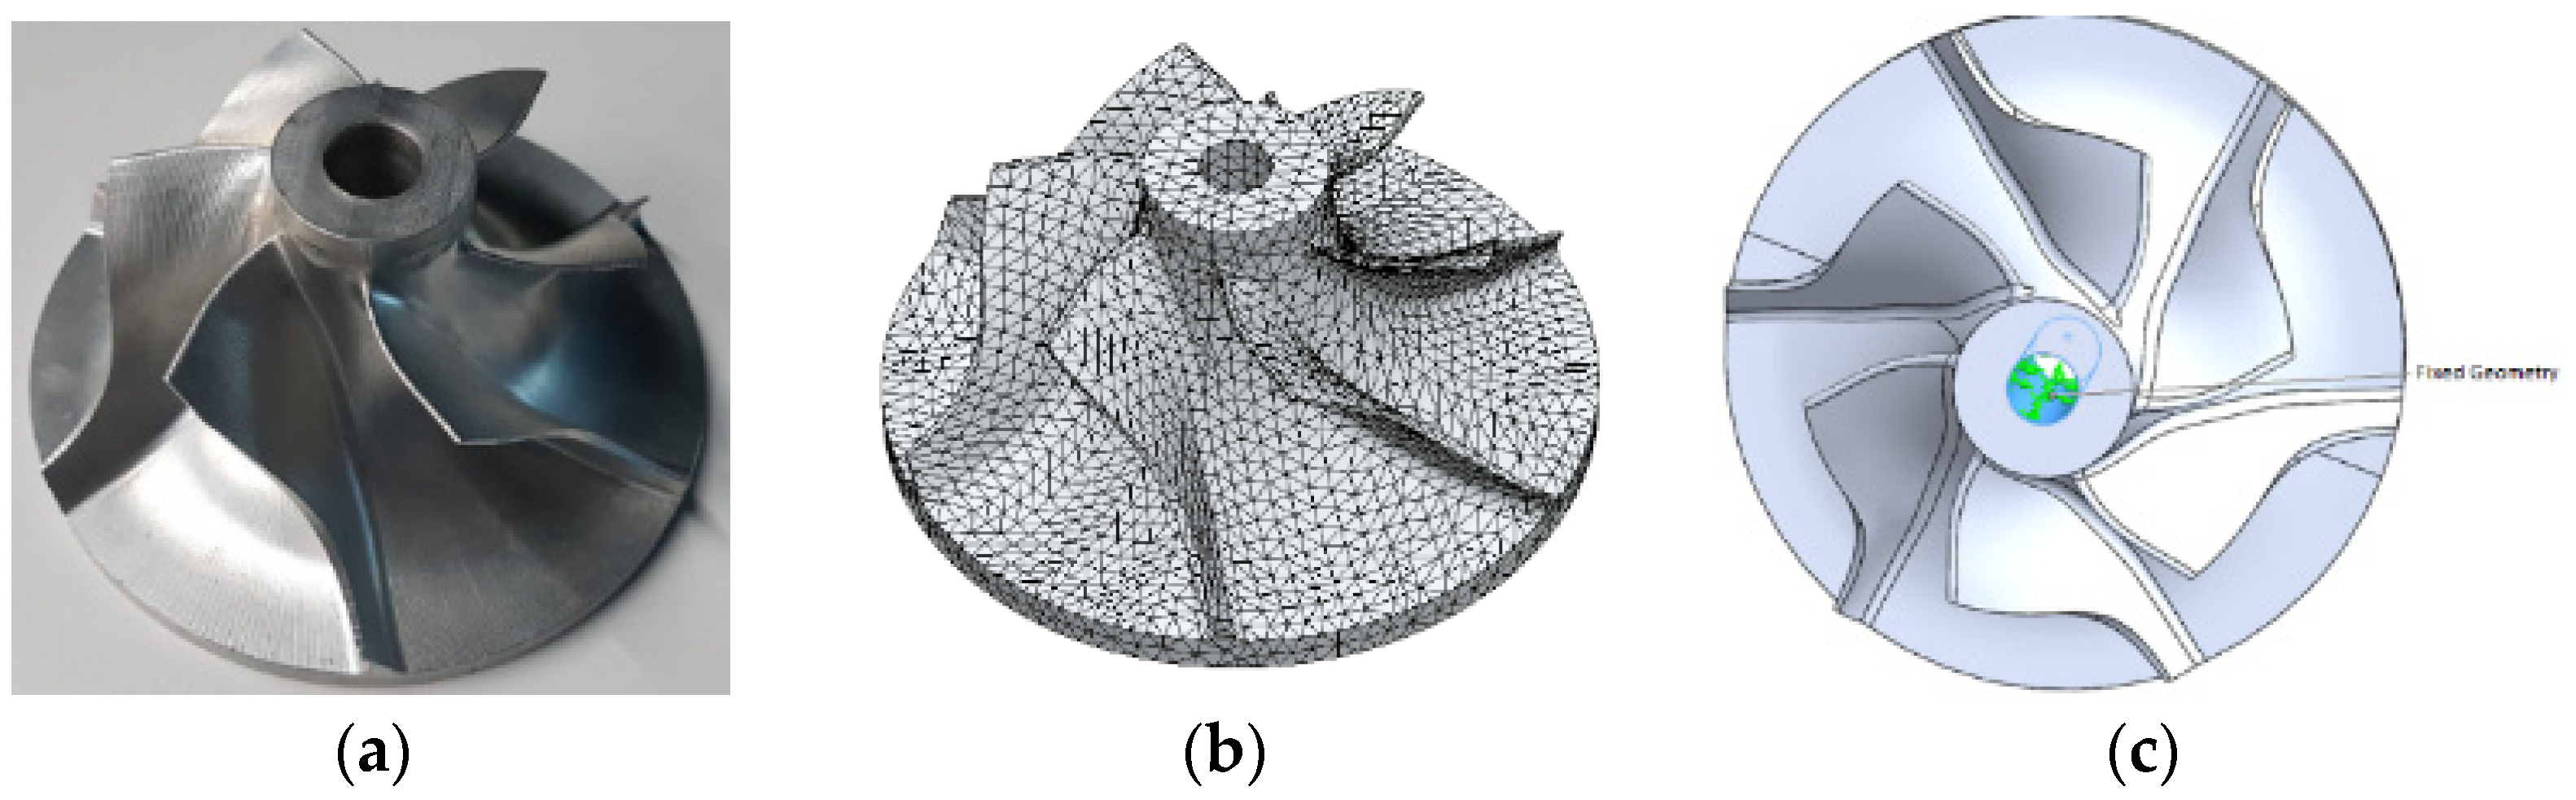
Pumps generate energy thanks to the fluid flow, and the impeller inside makes the greatest impact on the pump performance. The impeller is used for energy transfer (Figure 3a). The correct impeller design enables the pump to deliver the desired properties, while also decreasing the operating costs. For this reason, it is necessary to optimize the design variables that affect the impeller performance. The aluminum impellers used in this study are widely used in the industry and are known for their strength, corrosion resistance and excellent heat resistance. Impeller failure is frequently encountered as a result of fatigue. Resonance is an undesirable situation on an impeller. To avoid impeller resonance, an optimum design is important. Therefore, determining the modal analysis, which is the first step of the dynamic analysis before designing impellers, is of great importance. This study aims to obtain the mode shapes of an aluminum impeller by modal analysis. The first six natural frequencies are obtained through modal analysis. Knowing the natural frequencies is important for determining the region where resonance may occur in the system. The deformation on the first six mode shapes is examined after determining the natural frequencies. The geometric model is designed on Computer Aided Design (CAD) software. For the design of the geometric model, a computer-aided design program Solidworks 2019 is used. The material properties, mesh and boundary condition steps are determined before obtaining the simulations results. On the CAD software, the value of the size to be calculated in an element is found by interpolation, using the values in the nodes. In the finite element method, the unknown and required values are the values in the nodes. Using a variance principle, a set of equations is obtained for the values of the size field at the nodes. This impeller is made of 6061 aluminum alloy, and 51,422 nodes and 32,265 meshes are used in the model design (Figure 3b). The hole passing through the middle part is fixed as a boundary condition (Figure 3c). The finite element analysis workflow steps are followed in this study (Figure 4a).
The representation of this set of equations in matrix form is a simple finite element equation Equation (1). F is the force vector, the applied load, in global coordinates [N]. u is the displacement vector, the nodal deformation [m or mm]. K is the element stiffness matrix.
[K] × [u] = [F]
Finite Element Analysis (FEA) software packages regularly use heat maps and shape deformation to visualize the outcomes of a given situation. Despite being an effective way to demonstrate the effect on a 3D object, in the case where a physical object exists (such as when refining a design or analyzing an existing system), it can be difficult to correlate the FEA simulation-provided visual information with the physical part.
The CAD model and FEA simulation results are combined on 3dsMax 2020 software (Figure 4b). The combined data is imported as an Fbx. file on Unity Hub. Unity Vuforia Model Target is used to create an Android package kit (APK) file. An Android package can be installed on a mobile phone or tablet. The AR android program, which is designed to operate when the camera of a mobile phone or tablet sees the real product, recognizes the real product and fits the 3D analysis result on the real product. In this way, the FEA result is provided so as to be displayed on the real product. Moreover, engineers can see the analysis result on the real product in the real environment with the naked eye. Accordingly, the analysis results can be seen in the real environment.
3. Results
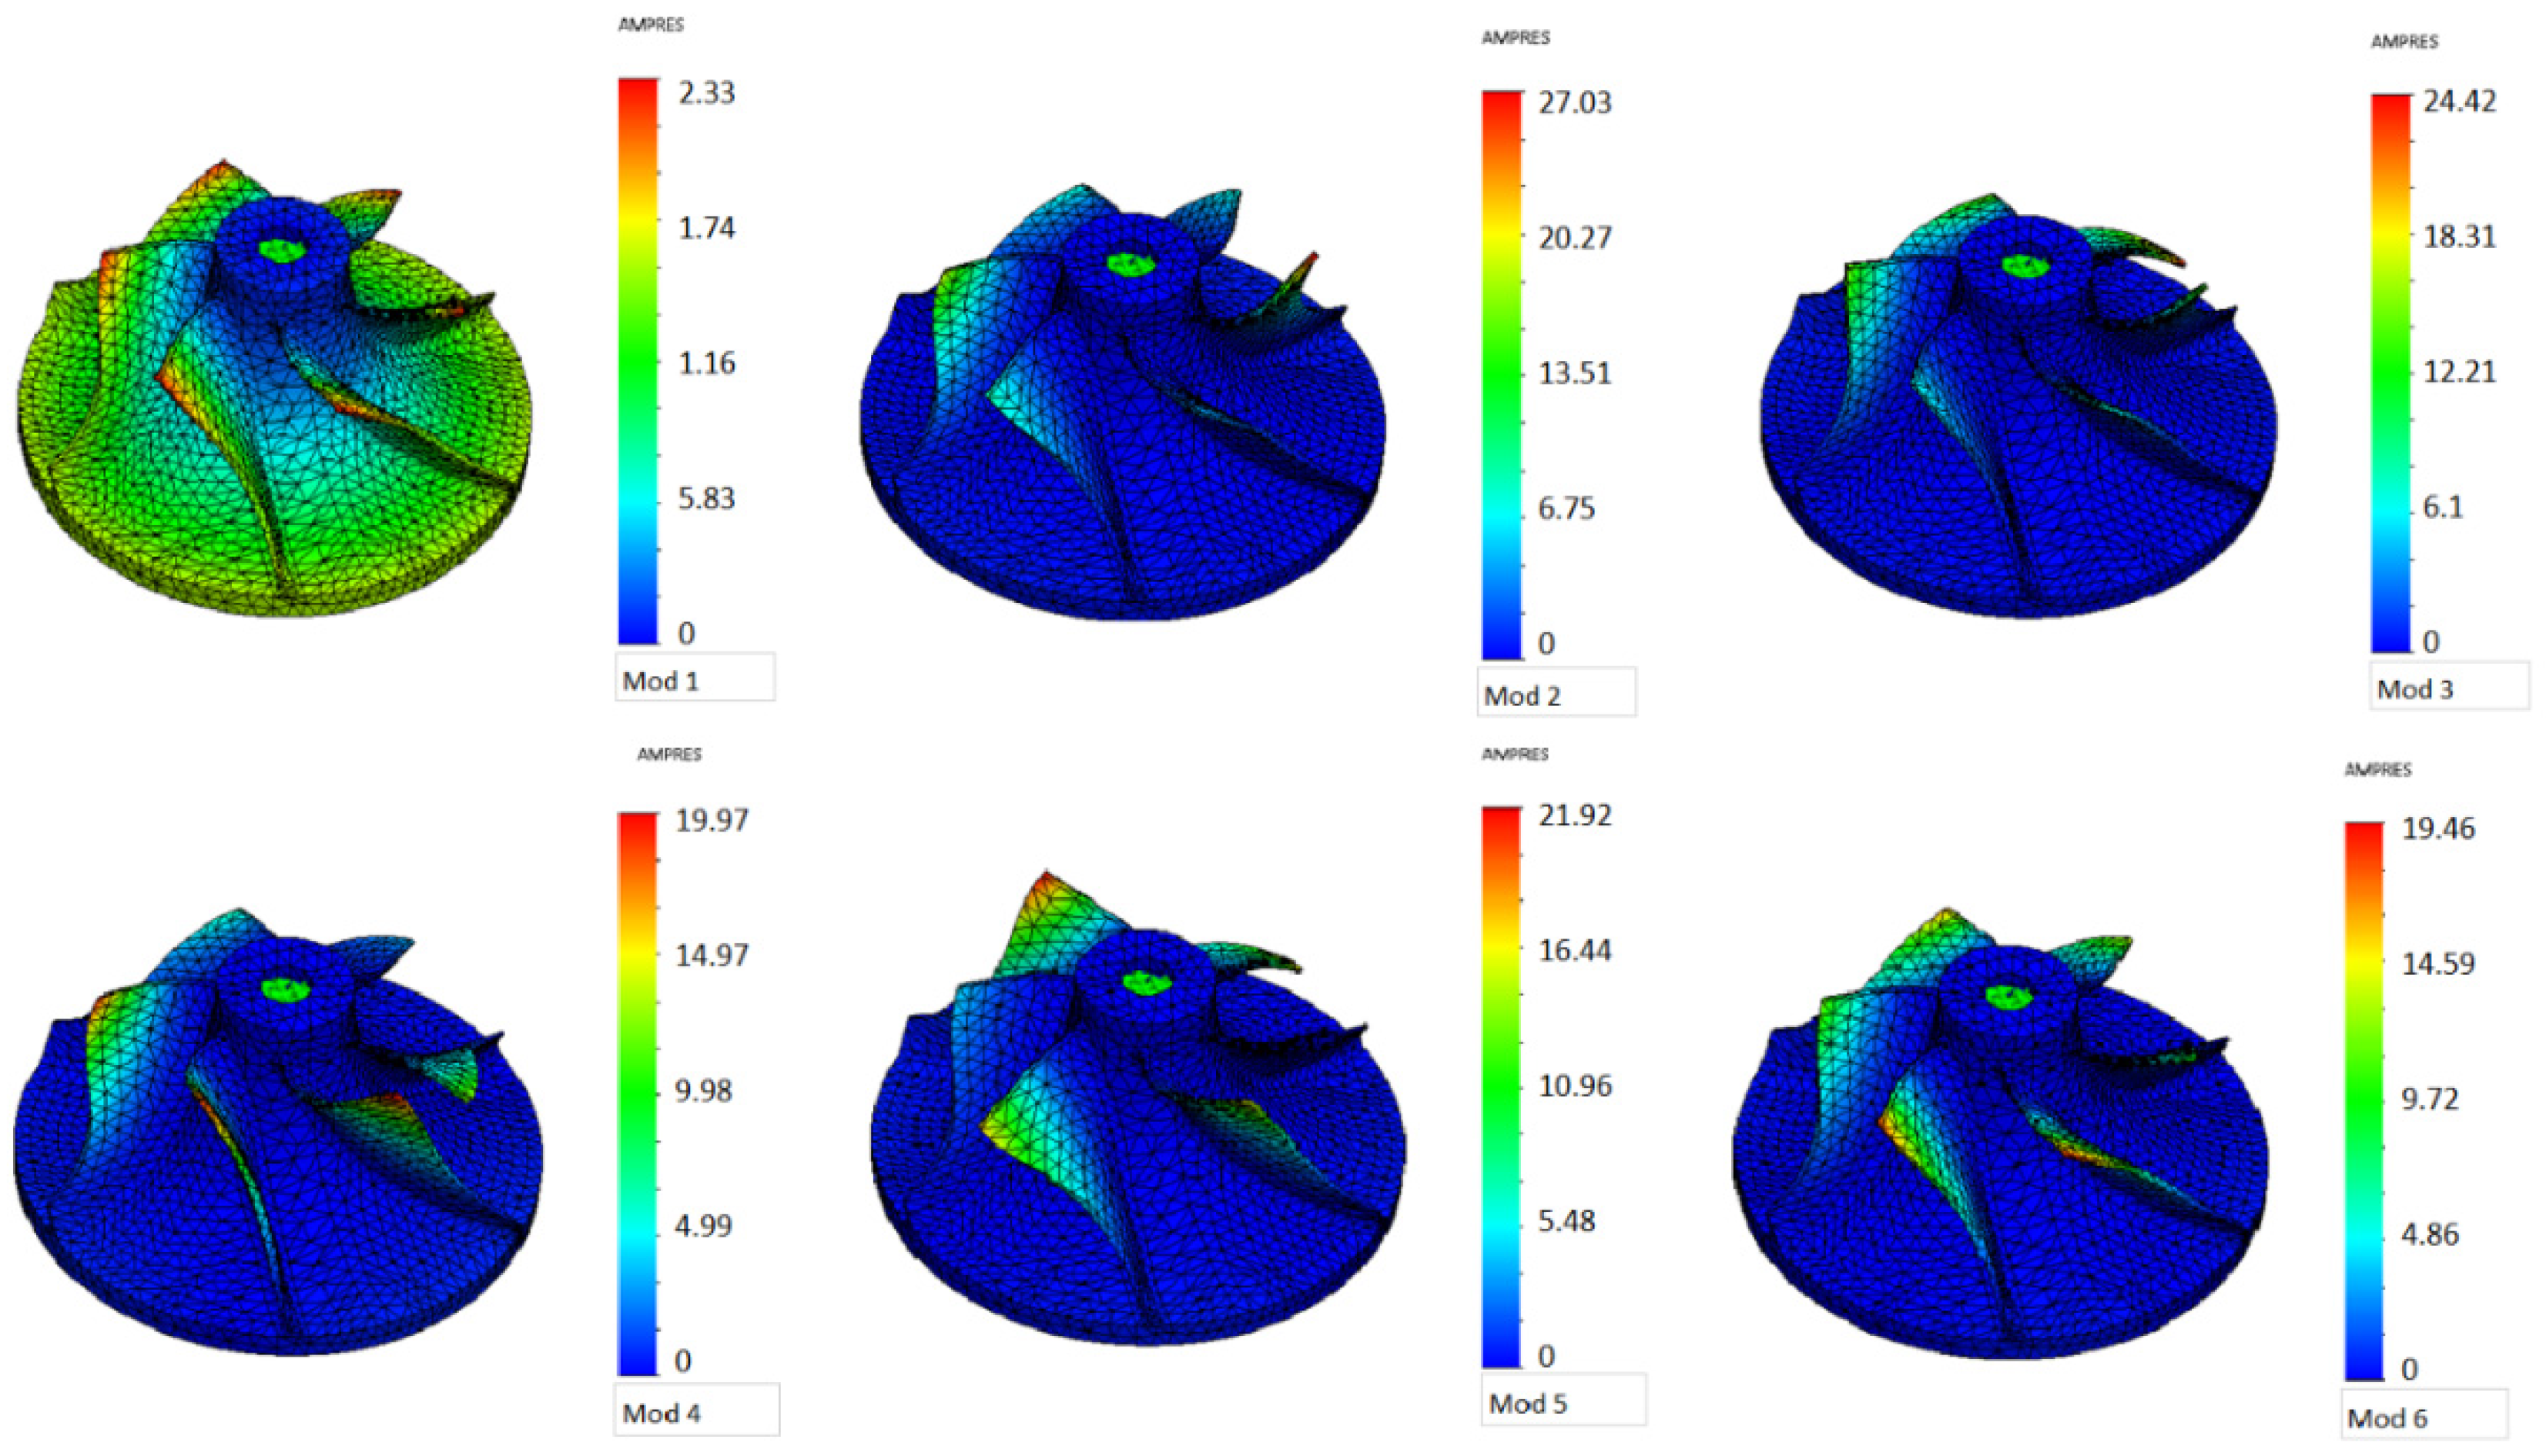
The first mod value is determined as 20,625 rad/sn and 3282.6 Hz. This result is slightly different from those of the other five modes. Other mod values are closer to each other and are around 28,700 rad/s and 4500 Hz.
Table 1 lists the frequency-produced modes for the impeller made of aluminum. Similarly, Figure 5 depicts the variation of the natural frequency modes for the impeller obtained as a result of the modal analysis. Figure 6 shows the deformation on the first six mode shapes with a finite analysis results view.
The mode shapes of the part and natural frequencies are obtained through a modal analysis. These factors determine the part’s free vibration characteristic. This characteristic depends only on the physical properties of the part. Free vibration modes and natural frequencies allow the response of the structure to be determined under coercive forces. Knowing the natural frequencies is important for determining the region where resonance may occur in the system.
The impeller component has been designed and analyzed on Solidworks 2019 software, which is a computer-aided design and engineering program. The impeller solid model is uploaded to the 3ds Max program. Additionally, the finite element analysis result simulation is upload to the 3ds Max program for simulation visualization. The combined model that is obtained is loaded into the Unity–Vuforia Model Target program, where the application of the AR model is implemented (Figure 7). An Android package kit (APK) file is created on Unity. The APK has been installed on a mobile device. Such an Android package kit recognizes the real solid model (Figure 8). The analysis result has been visualized on the real impeller part.
4. Discussion
In this study, a mobile AR-FEA-based system was developed for a Modal Analysis result visualization. Every product must execute design requirements. The modal analysis technique determines the dynamic behavior and dynamic characteristics of different boundary conditions. Thus, unexpected failure conditions can be prevented. By using modal analysis vibration characteristics, mode shapes, resonant frequencies and damping characteristic can be identified. Determining these features is important for the design. The modal analysis is the first dynamic analysis step. The next steps can be the spectrum analysis, transient dynamic and harmonic responses.
An aluminum impeller has been turned into a solid model by using a computer-aided design program. Modal analysis is performed in the obtained model’s augmented environment, created through Solidworks. The obtained mode results in an idea of which shapes can be predicted when the structure vibrates in possible vibrational situations. Modal analysis is defined as the first stage of dynamic analysis. By using modal analysis, engineers can obtain natural frequency values and mode shapes. Obtaining the natural frequencies and vibration modes is important for determining the region where resonance may occur in the system. This condition aims to display the analysis result in a real environment on the real part. However, this process is only possible with AR. Through this innovative study, an FEA-AR integrated system superimposes computer-aided design parts on the corresponding real parts, and the finite element analysis simulation can be examined on these parts. By using the AR-FEA system, engineers can perform and evaluate simulations in a real environment. Simulation results can be visualized on real components. AR-FEA visualization allows for the easy identification of critical areas and a better interpretation of data. Displaying the analysis result in a real environment strengthens FEA. AR-FEA real world visualization facilitates the understanding of the analysis results. Engineering analysis results’ visualization on the real-world scene is crucial. The findings of this study assist engineers, designers and relevant industries in better visualizing the outcomes of the simulation and lead to more informed and efficient decision-making.
AR has recently become a famous research topic. Over the past several decades, FEA has long been a worldwide research topic. Until recently, FEA engineering analysis results could only be viewed on desktop computers in a virtual environment.
Through the development of the AR-FEA combination system, FEA results are becoming augmented reality visualizations on real models. Engineering analyses are observed on mobile AR visualizations. The analysis results can be viewed on portable devices and in the real environment in which the part is operating. AR-FEA studies will increase in the future. This study is one of the first samples of AR-FEA studies.
Author Contributions
M.Y.E. and B.H. planned and developed the concept of the finite element analysis and augmented reality perspective and critically reviewed the manuscript. M.Y.E. and S.E. conducted the modal analysis and augmented reality apps and critically reviewed the manuscript. M.Y.E. wrote the first draft of the manuscript. E.J. and M.S. critically reviewed and technically revised the manuscript. Conceptualization, M.Y.E. and B.H.; methodology, M.Y.E. and S.E.; modal analysis and augmented reality apps, M.Y.E. and S.E.; validation and analytical verification B.H., E.J., M.S. and A.S.; investigation, M.Y.E.; resources, M.Y.E.; writing—original draft preparation, M.Y.E.; writing technical review and editing, B.H., E.J., M.S. and A.S.; visualization, M.Y.E.; supervision, B.H.; project administration, B.H. All authors have read and agreed to the published version of the manuscript.
Funding
This research received no external funding.
Institutional Review Board Statement
Not applicable.
Informed Consent Statement
Not applicable.
Data Availability Statement
Not applicable.
Conflicts of Interest
The authors declare no conflict of interest.
References
- Kaya, N.; Erkek, M.Y.; Guven, C. Hyperelastic modelling and shape optimisation of vehicle rubber bushings. Int. J. Veh. Des. 2016, 71, 212–225. [Google Scholar] [CrossRef]
- Lin, J.; Cao, J.; Zhang, J.; Treeck, C.; Frisch, J. Visualization of indoor thermal environment on mobile devices based on augmented reality and computational fluid dynamics. Autom. Constr. 2019, 103, 26–40. [Google Scholar] [CrossRef]
- Scaravetti, D.; Doroszewski, D. Augmented Reality experiment in higher education, for complex system appropriation in mechanical design. Procedia CIRP 2019, 84, 197–202. [Google Scholar] [CrossRef]
- Desselle, M.R.; Brown, R.A.; James, A.R.; Midwinter, M.J.; Powell, S.K.; Woodruff, M.A. Augmented and Virtual Reality in Surgery. Comput. Sci. Eng. 2020, 22, 18–26. [Google Scholar] [CrossRef]
- Sportillo, G.D.; Paljic, A.; Ojeda, L. Get ready for automated driving using Virtual Reality. Accid. Anal. Prev. 2018, 118, 102–113. [Google Scholar] [CrossRef]
- Wolfartsberger, J. Analysing the potential of Virtual Reality for engineering design review. Autom. Constr. 2019, 104, 27–37. [Google Scholar] [CrossRef]
- Jamei, E.; Mortimer, M.; Seyedmahmoudian, M.; Stojcevski, B.H.A. Investigating the Role of Virtual Reality in Planning for Sustainable Smart Cities. Sustainability 2017, 9, 2006. [Google Scholar] [CrossRef] [Green Version]
- Su, S.; Perry, V.; Bravo, L.; Kase, S.; Roy, H.; Cox, K.; Dasari, V.R. Virtual and Augmented Reality Applications to Support Data Analysis and Assessment of Science and Engineering. Comput. Sci. Eng. 2020, 22, 27–39. [Google Scholar] [CrossRef]
- Heemskerka, C.J.M.; de Baarb, M.R.; Boessenkoola, H.; Graaflandc, B.; Hayed, M.J.; Koningb, J.F.; Vahedic, M.; Visserd, M. Extending Virtual Reality simulation of ITER maintenance operations with dynamic effects. Fusion Eng. Des. 2011, 86, 2082–2086. [Google Scholar] [CrossRef]
- Li, W.K.; Nee, A.Y.C.; Ong, S.K. A State-of-the-Art Review of Augmented Reality in Engineering Analysis and Simulation. Multimodal Technol. Interact. 2017, 1, 17. [Google Scholar] [CrossRef]
- Li, W.K.; Nee, A.Y.C.; Ong, S.K. Mobile augmented reality visualization and collaboration techniques for on-site finite element structural analysis. Int. J. Modeling Simul. Sci. Comput. 2018, 9, 1840001. [Google Scholar] [CrossRef]
- Ong, S.K.; Huang, J.M. Structure design and analysis with integrated AR-FEA. CIRP Ann. Manuf. Technol. 2017, 66, 149–152. [Google Scholar] [CrossRef]
- Huang, J.; Ong, S.K.; Nee, A.Y.-C. An approach for augmented learning of finite element analysis. Comput. Appl. Eng. Educ. 2019, 27, 921–933. [Google Scholar] [CrossRef]
- Huang, J.M.; Ong, S.K.; Nee, A.Y.C. Real-time finite element structural analysis in augmented reality. Adv. Eng. Softw. 2015, 87, 43–56. [Google Scholar] [CrossRef]
- Huang, J.M.; Ong, S.K.; Nee, A.Y.C. Visualization and interaction of finite element analysis in augmented reality. Comput.-Aided Des. 2017, 84, 1–14. [Google Scholar] [CrossRef]
- Lechner, M.; Schulte, R.; Merklein, M. Evaluation of simulation results using augmented reality. In Proceedings of the 12th European LS-DYNA Conference, Koblenz, Germany, 14–16 May 2019. [Google Scholar]
- Seo, D.; Kim, E.; Kim, J. Finite Element Analysis & Augmented Reality based Mechanical Product Simulation Platform for Small-Medium sized Enterprise Industry. Adv. Sci. Technol. Lett. 2014, 64, 26–30. [Google Scholar]
- Hu, L.; Liu, Z.; Tan, J. A VR simulation framework integrated with multisource CAE analysis data for mechanical equipment working process. Comput. Ind. 2018, 97, 85–96. [Google Scholar] [CrossRef]
- Turkana, Y.; Radkowskib, R.; Karabulut-Ilgu, A.; Behzadand, A.H.; Chenc, A. Mobile augmented reality for teaching structural analysis. Adv. Eng. Inform. 2017, 34, 90–100. [Google Scholar] [CrossRef]
- Ryken, M.J.; Vance, J.M. Applying virtual reality techniques to the interactive stress analysis of a tractor lift arm. Finite Elem. Anal. Des. 2000, 35, 141–155. [Google Scholar] [CrossRef] [Green Version]
- Fukuda, T.; Yokoi, K.; Yabuki, N.; Motamedi, A. An indoor thermal environment design system for renovation using augmented reality. J. Comput. Des. Eng. 2018, 6, 179–188. [Google Scholar] [CrossRef]
- Erdemir, F.; Ozkan, M.T. Plastik Parçalarda Bir Esneyerek Kilitlenen Bağlantı Modelinin Modal Analizi. J. Polytech. 2019, 22, 927–933. [Google Scholar] [CrossRef]
- Palanivelu, S.; Rao, K.N.; Ramarathnam, K.K. Determination of rolling tyre modal parameters using Finite Element techniques and Operational Modal Analysis. Mech. Syst. Signal Process. 2015, 64–65, 385–402. [Google Scholar] [CrossRef]
- Haffar, M.Z.; Sandor, A. On the buckling of longitudinally stiffened plates, part 1: Modal analysis by the constrained finite element method. Thin-Walled Struct. 2019, 145, 106394. [Google Scholar] [CrossRef]
- Kumar, B.G.; Velmurugan, V.; Paramasivam, V.; Thanikaikarasan, S. Prediction of material discontinuity and modal analysis of aluminium beam using finite element method. Mater. Today Proc. 2020, 21, 782–786. [Google Scholar] [CrossRef]
- Gu, J.; Luo, G. Modal test and finite element analysis of a turbine disk. Vibroengineering Procedia 2018, 20, 108–112. [Google Scholar]
- Singh, D.P.; Mishra, S.; Porwal, J.K. Modal Analysis of Ultrasonic Horn using Finite Element Method. Mater. Today Proc. 2019, 18, 3617–3623. [Google Scholar] [CrossRef]
Figure 1.
(a) Sample of an Augmented Reality project; (b) Virtual Reality headset and tools. (Deakin University Cadet Laboratory).
Figure 1.
(a) Sample of an Augmented Reality project; (b) Virtual Reality headset and tools. (Deakin University Cadet Laboratory).

Figure 2.
Cad Design Visualization Wall and Immersive and Virtual Reality Cave (Deakin University Cadet Laboratory).
Figure 2.
Cad Design Visualization Wall and Immersive and Virtual Reality Cave (Deakin University Cadet Laboratory).

Figure 3.
(a) Impeller; (b) The mathematical mesh finite element model; (c) The boundary condition.

Figure 4.
(a) Finite element analysis workflow; (b) Data visualization and Augmented Reality workflow.
Figure 4.
(a) Finite element analysis workflow; (b) Data visualization and Augmented Reality workflow.

Figure 5.
Natural frequency-mode graphics obtained as a result of the modal analysis.

Figure 6.
Amplitude values representation for modes 1 to 6.

Figure 7.
An AR Android package kit camera view.

Figure 8.
Modal analysis simulation results on the mobile AR visualization.

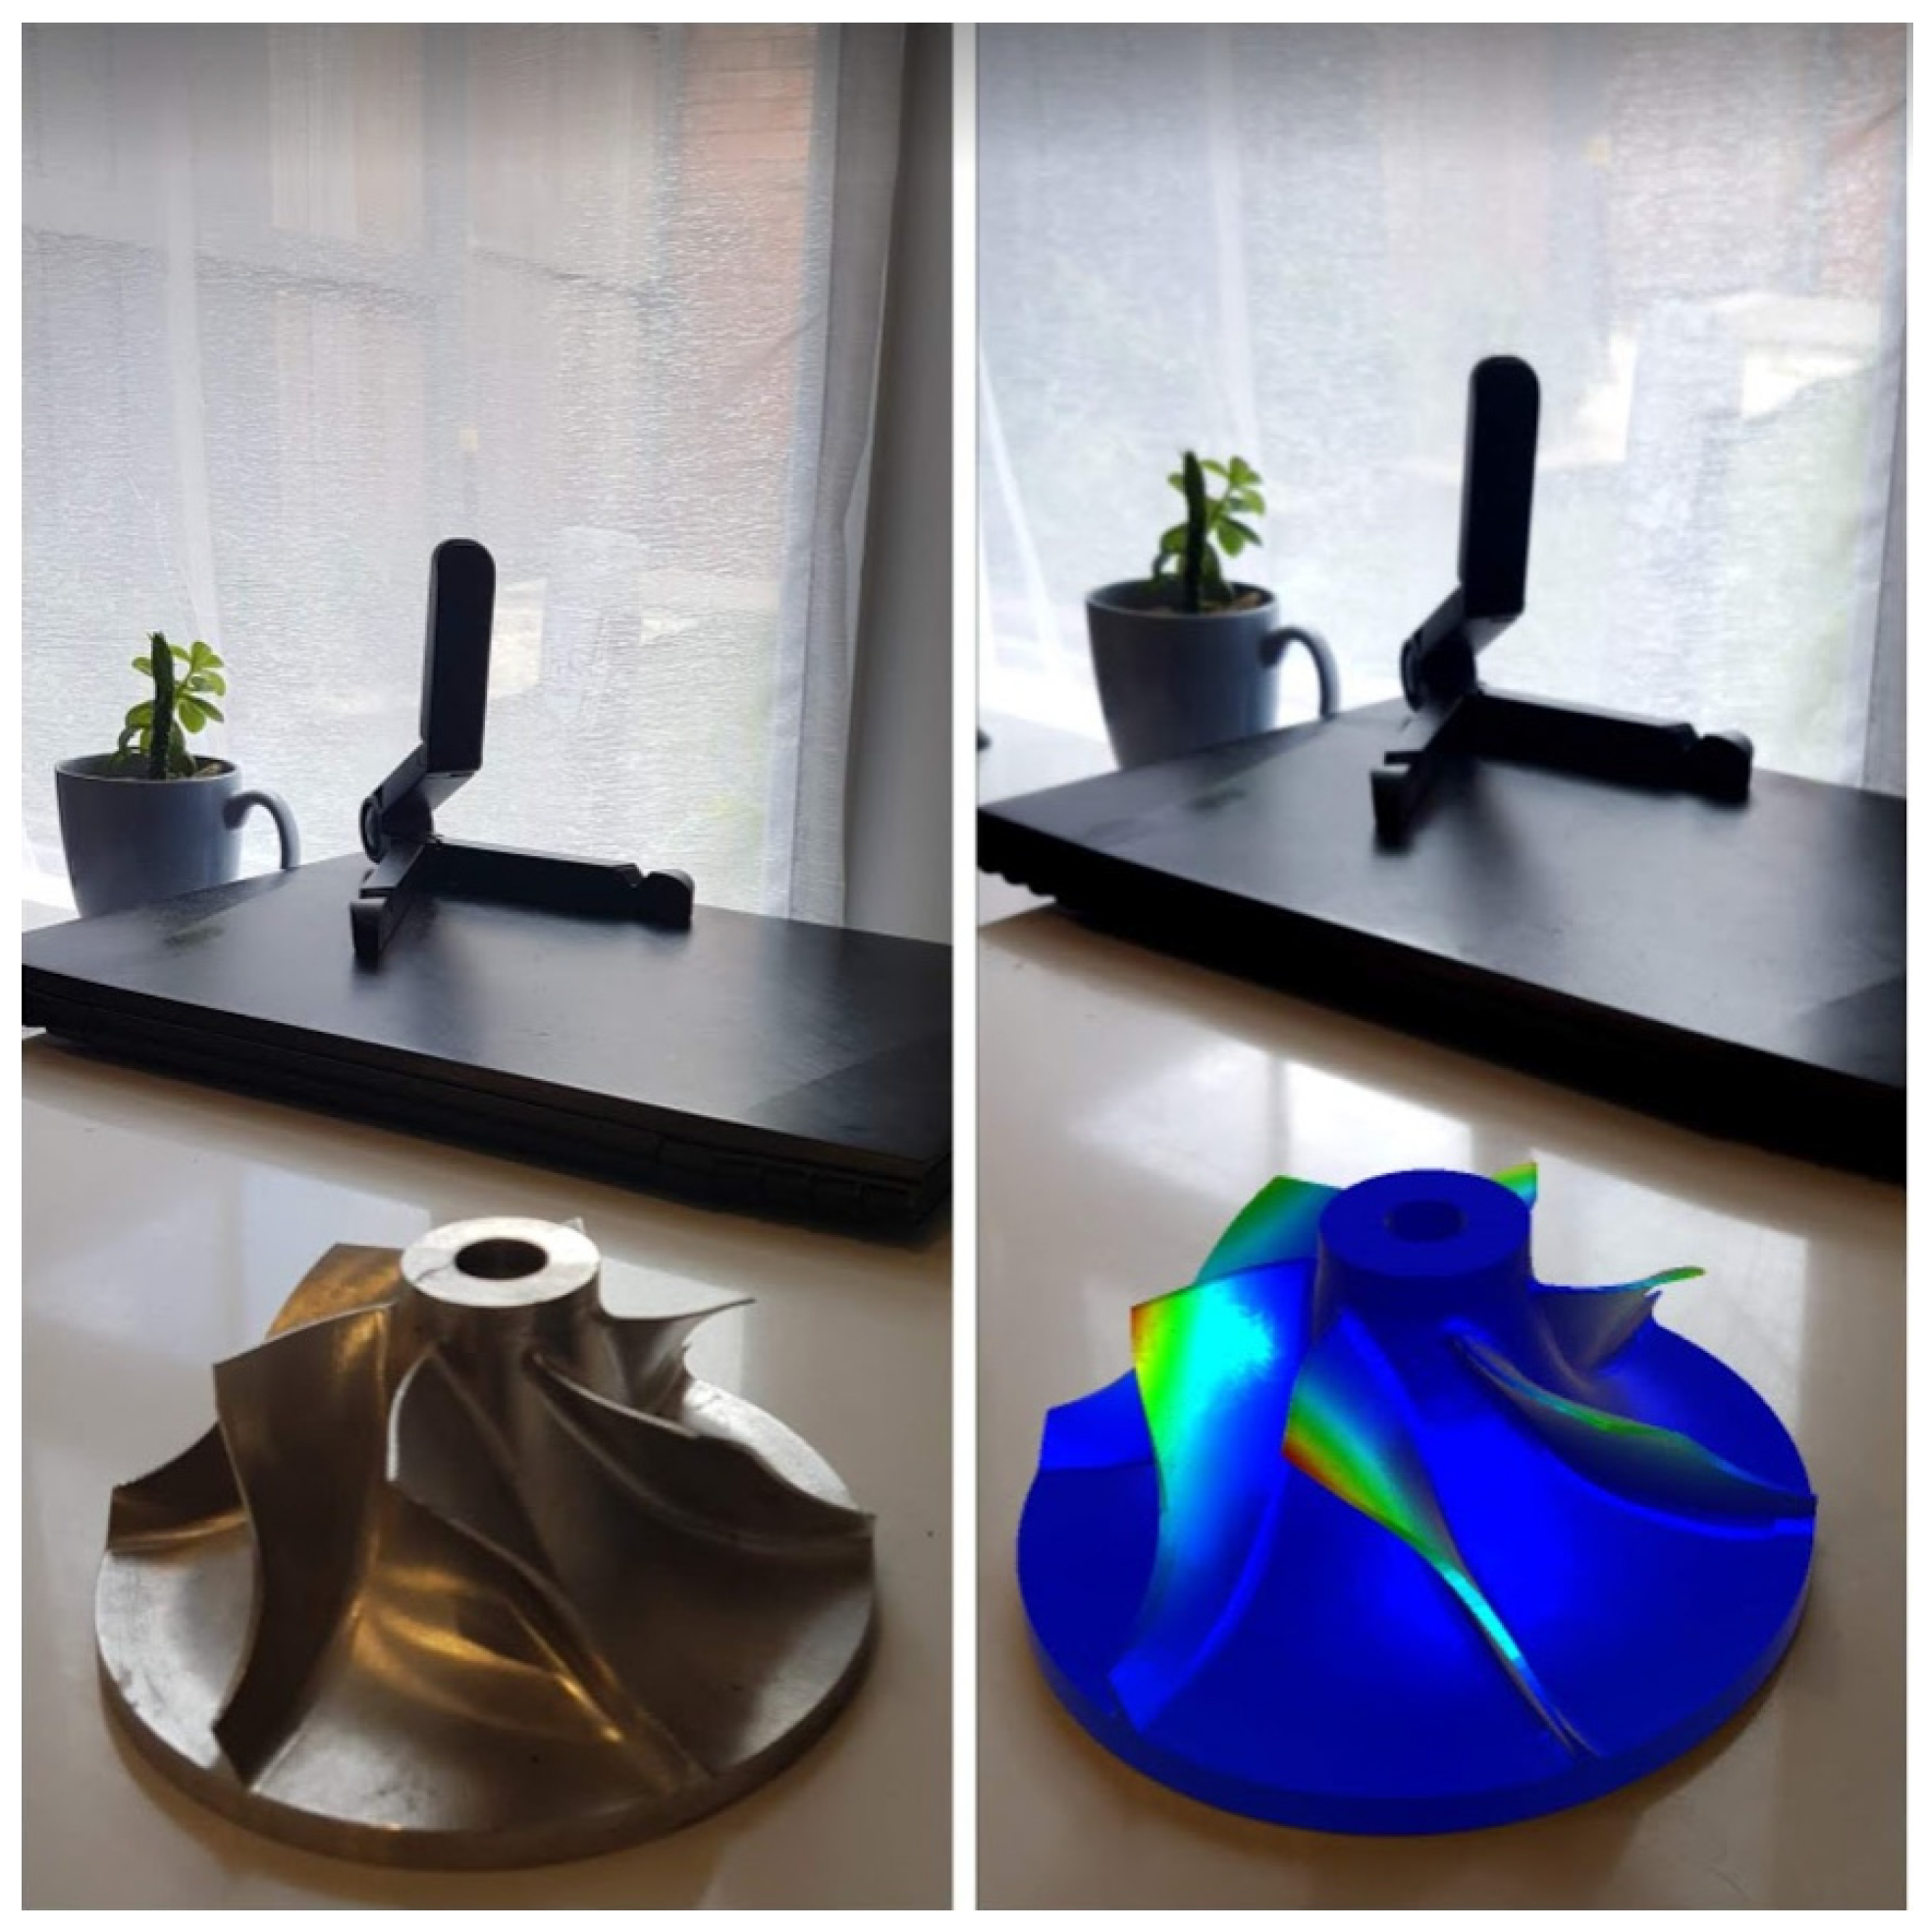
Figure 9.
Product real view and AR visualization in a real environment.

Figure 10.
Modal analysis simulation results for modes 1 to 6 on the mobile AR visualization.

Figure 11.
An AR Android package kit camera view. The FEA results and real parts superimposed with the FEA-AR integrated system.
Figure 11.
An AR Android package kit camera view. The FEA results and real parts superimposed with the FEA-AR integrated system.


Table 1.
Natural frequencies for the aluminum impeller.
| Mode Number | Frequency (rad/s) | Frequency (Hz) | Period (s) |
|---|---|---|---|
| 1 | 20,625 | 3282.6 | 0.00030463 |
| 2 | 28,711 | 4569.5 | 0.00021884 |
| 3 | 28,749 | 4575.6 | 0.00021855 |
| 4 | 28,760 | 4577.3 | 0.00021847 |
| 5 | 28,795 | 4582.8 | 0.00021821 |
| 6 | 28,863 | 4593.6 | 0.00021769 |
Publisher’s Note: MDPI stays neutral with regard to jurisdictional claims in published maps and institutional affiliations. |
© 2021 by the authors. Licensee MDPI, Basel, Switzerland. This article is an open access article distributed under the terms and conditions of the Creative Commons Attribution (CC BY) license (http://creativecommons.org/licenses/by/4.0/).
Share and Cite
MDPI and ACS Style
Yavuz Erkek, M.; Erkek, S.; Jamei, E.; Seyedmahmoudian, M.; Stojcevski, A.; Horan, B. Augmented Reality Visualization of Modal Analysis Using the Finite Element Method. Appl. Sci. 2021, 11, 1310. https://doi.org/10.3390/app11031310
AMA Style
Yavuz Erkek M, Erkek S, Jamei E, Seyedmahmoudian M, Stojcevski A, Horan B. Augmented Reality Visualization of Modal Analysis Using the Finite Element Method. Applied Sciences. 2021; 11(3):1310. https://doi.org/10.3390/app11031310
Chicago/Turabian StyleYavuz Erkek, Merve, Selim Erkek, Elmira Jamei, Mehdi Seyedmahmoudian, Alex Stojcevski, and Ben Horan. 2021. "Augmented Reality Visualization of Modal Analysis Using the Finite Element Method" Applied Sciences 11, no. 3: 1310. https://doi.org/10.3390/app11031310
Note that from the first issue of 2016, this journal uses article numbers instead of page numbers. See further details here.