Article

Genetic-Convex Model for Dynamic Reactive Power Compensation in Distribution Networks Using D-STATCOMs

by
Oscar Danilo Montoya
1,2,*,
Harold R. Chamorro
3,*,
Lazaro Alvarado-Barrios
4,
Walter Gil-González
5,* and
César Orozco-Henao
6
1
Facultad de Ingeniería, Universidad Distrital Francisco José de Caldas, Bogotá D.C. 11021, Colombia
2
Laboratorio Inteligente de Energía, Universidad Tecnológica de Bolívar, Cartagena 131001, Colombia
3
Department of Electrical Engineering at KTH, Royal Institute of Technology, SE-44 100 Stockholm, Sweden
4
Department of Engineering, Universidad Loyola Andalucía, 41704 Sevilla, Spain
5
Grupo GIIEN, Facultad de Ingeniería, Institución Universitaria Pascual Bravo, Campus Robledo, Medellín 050036, Colombia
6
Department of Electrical and Electronic Engineering, Universidad del Norte, Barranquilla 80001, Colombia
*
Authors to whom correspondence should be addressed.
Appl. Sci. 2021, 11(8), 3353; https://doi.org/10.3390/app11083353
Submission received: 14 February 2021 / Revised: 19 March 2021 / Accepted: 7 April 2021 / Published: 8 April 2021
(This article belongs to the Special Issue Smart Energy Systems and Technologies)

Abstract

:
This paper proposes a new hybrid master–slave optimization approach to address the problem of the optimal placement and sizing of distribution static compensators (D-STATCOMs) in electrical distribution grids. The optimal location of the D-STATCOMs is identified by implementing the classical and well-known Chu and Beasley genetic algorithm, which employs an integer codification to select the nodes where these will be installed. To determine the optimal sizes of the D-STATCOMs, a second-order cone programming reformulation of the optimal power flow problem is employed with the aim of minimizing the total costs of the daily energy losses. The objective function considered in this study is the minimization of the annual operative costs associated with energy losses and installation investments in D-STATCOMs. This objective function is subject to classical power balance constraints and device capabilities, which generates a mixed-integer nonlinear programming model that is solved with the proposed genetic-convex strategy. Numerical validations in the 33-node test feeder with radial configuration show the proposed genetic-convex model’s effectiveness to minimize the annual operative costs of the grid when compared with the optimization solvers available in GAMS software.

1. Introduction

Electric distribution networks represent the majority portion of electrical power systems, which are responsible for providing electrical services to end-users at medium- and low-voltage levels [1,2]. They are typically built-in with radial structures to simplify the coordination of the protective devices and minimize the investment costs in conductors [3]. However, the main problems of radial structures in these networks are the increase in energy losses and the deterioration of the voltage profiles [4,5]. One way to reduce these problems is by installing shunt devices such as fixed-step capacitors [6,7,8] or distribution static compensators (D-STATCOMs) [9,10]. In the case of the fixed-step capacitors, the amount of reactive power injected into the grid is dependent on the voltage profile of the node, which implies that it is not possible to ensure constant reactive power injections [11]. Furthermore, the reactive power is injected in fixed steps, which limits the improvement of voltage profiles and reduction of energy losses. Conversely, D-STATCOMs can operate continuously in a range of operations, permitting constant reactive power injections depending on the demand load behavior, and these can vary their outputs as a function of the grid operating conditions [12,13]. This implies that these can be considered as dynamic reactive power compensators [14]. The general structure of a D-STATCOM is depicted in Figure 1, where it can be noted that the power electronic converter makes it possible to control the amount of reactive power injected into the grid [10].
In the literature, the problem of the optimal placement and sizing of D-STATCOMs has been studied with different optimization methodologies for medium-voltage applications [15]. Following are some of these approaches. In [9], analytical and heuristic optimization methods were used for the optimal placement and sizing of D-STATCOMs in distribution networks. In [9], fitness functions based on voltage stability and power loss indices were implemented to enhance distribution network performance. In [10], a multi-objective particle swarm optimizer was utilized to size and locate D-STATCOMs in a medium-voltage electrical network, using simultaneous system reconfiguration. Although in [10] a multi-objective optimizer was used (e.g., active power loss reduction, voltage stability index, and distribution line loadability factor), only the load condition was considered, which is not appropriate as it leads to selection of over-sized devices. In [16], a heuristic algorithm based on costs was developed to assess the performance in an isolated power system based on location and dimensioning of D-STATCOMs. Nevertheless, the analysis performed in [16] was greatly simplified as it modeled the power system as a unique nodal system. In [17], a genetic algorithm and optimal power flow implemented in DigSILENT software were presented to size and place D-STATCOMs in distribution networks. Although [17] used a real distribution grid to test the algorithm, a cost analysis was not shown. In [18], a fuzzy multi-objective algorithm using an ant colony optimization approach was presented to improve the distribution system’s performance regarding locating and sizing photo-voltaic generations and D-STATCOMs. The fitness functions used in [16] were the reduction of power losses, improvement of the voltage profiles, and load balance increase. In [19], a heuristic algorithm based on power loss and voltage indices was described for the sizing and placement of D-STATCOM in radial distribution systems.
Based on the literature review of the above-mentioned state-of-the-art studies, this study makes the following contributions:
  • Formulation of the mixed-integer nonlinear programming (i.e., MINLP) problem of the optimal location and sizing of D-STATCOMs in distribution networks into a mixed-integer convex optimization model using the branch power flow representation of the grid, which generates a new conic optimization model.
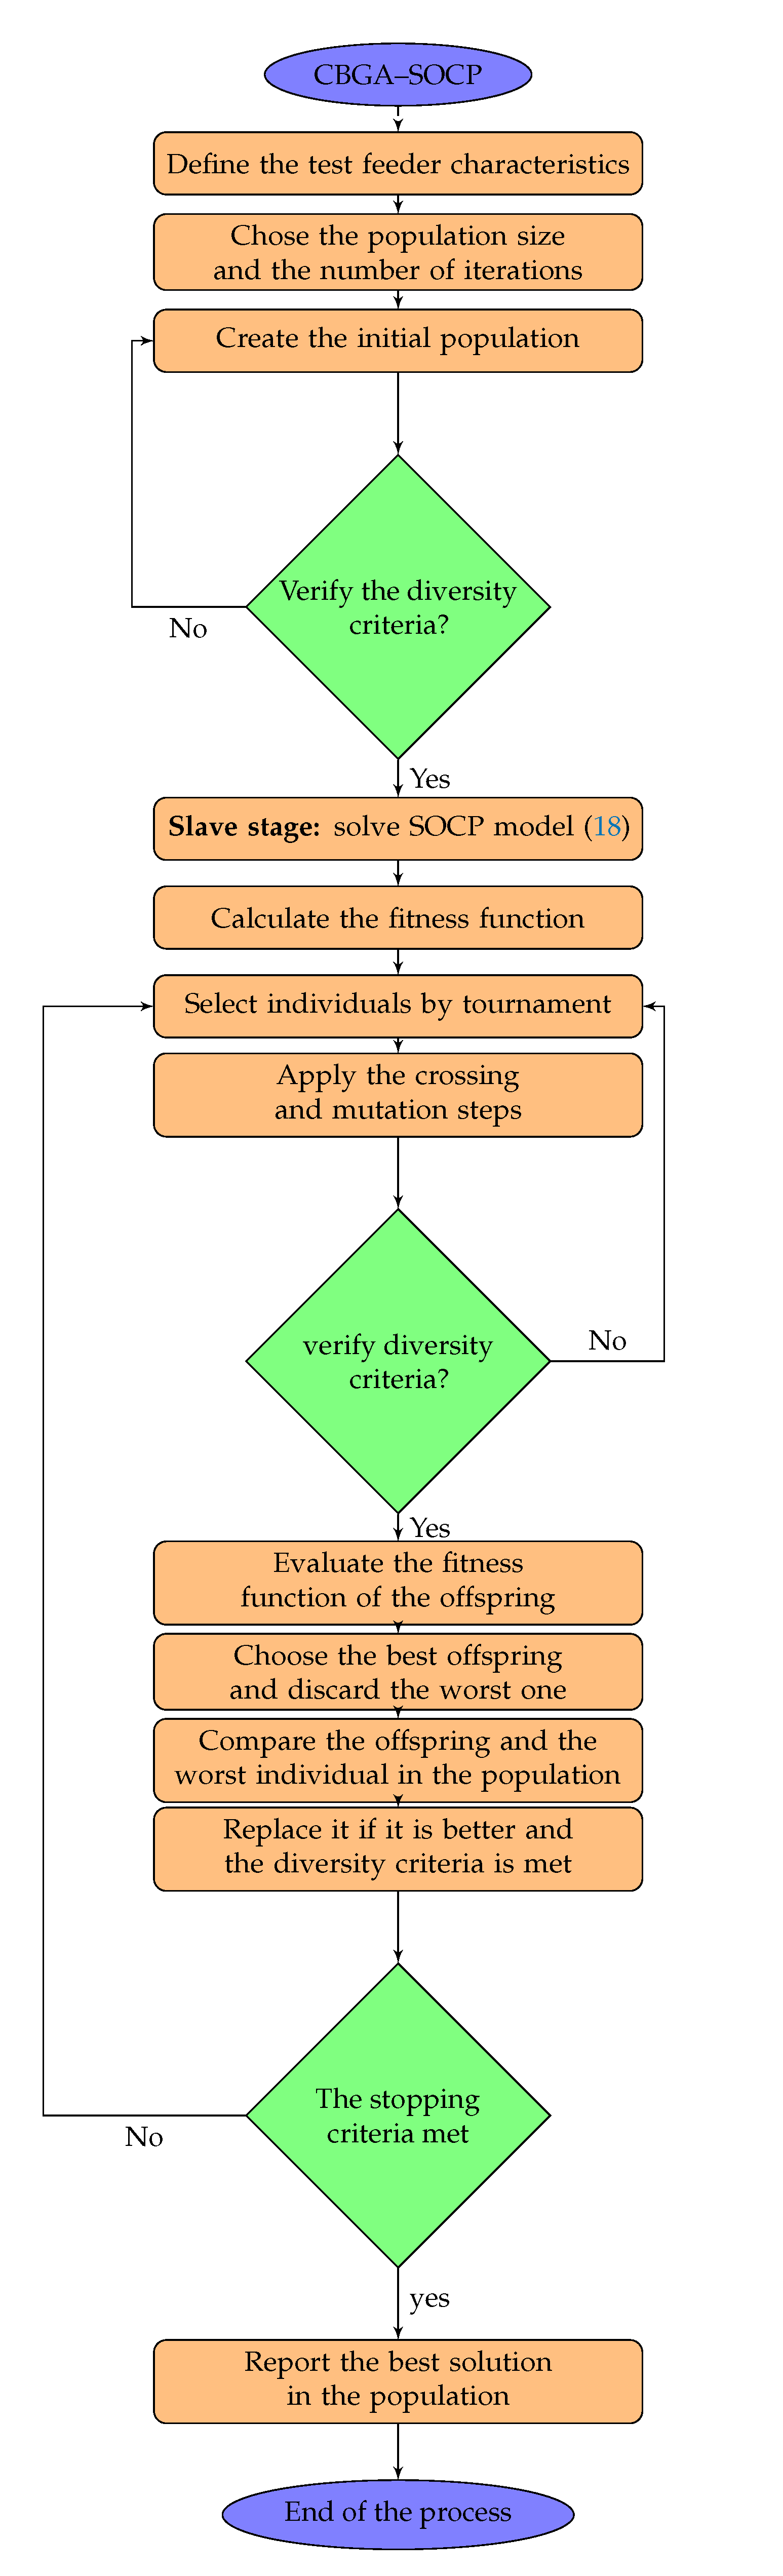
  • Implementation of a new optimization strategy called the genetic-convex optimizer that works in a master–slave connection, where the master stage is guided by a classical Chu and Beasley genetic algorithm (CBGA) to determine the location of the D-STATCOMs, and the slave stage is entrusted with the optimal sizing of the D-STATCOMs via second-order cone programming (SOCP).
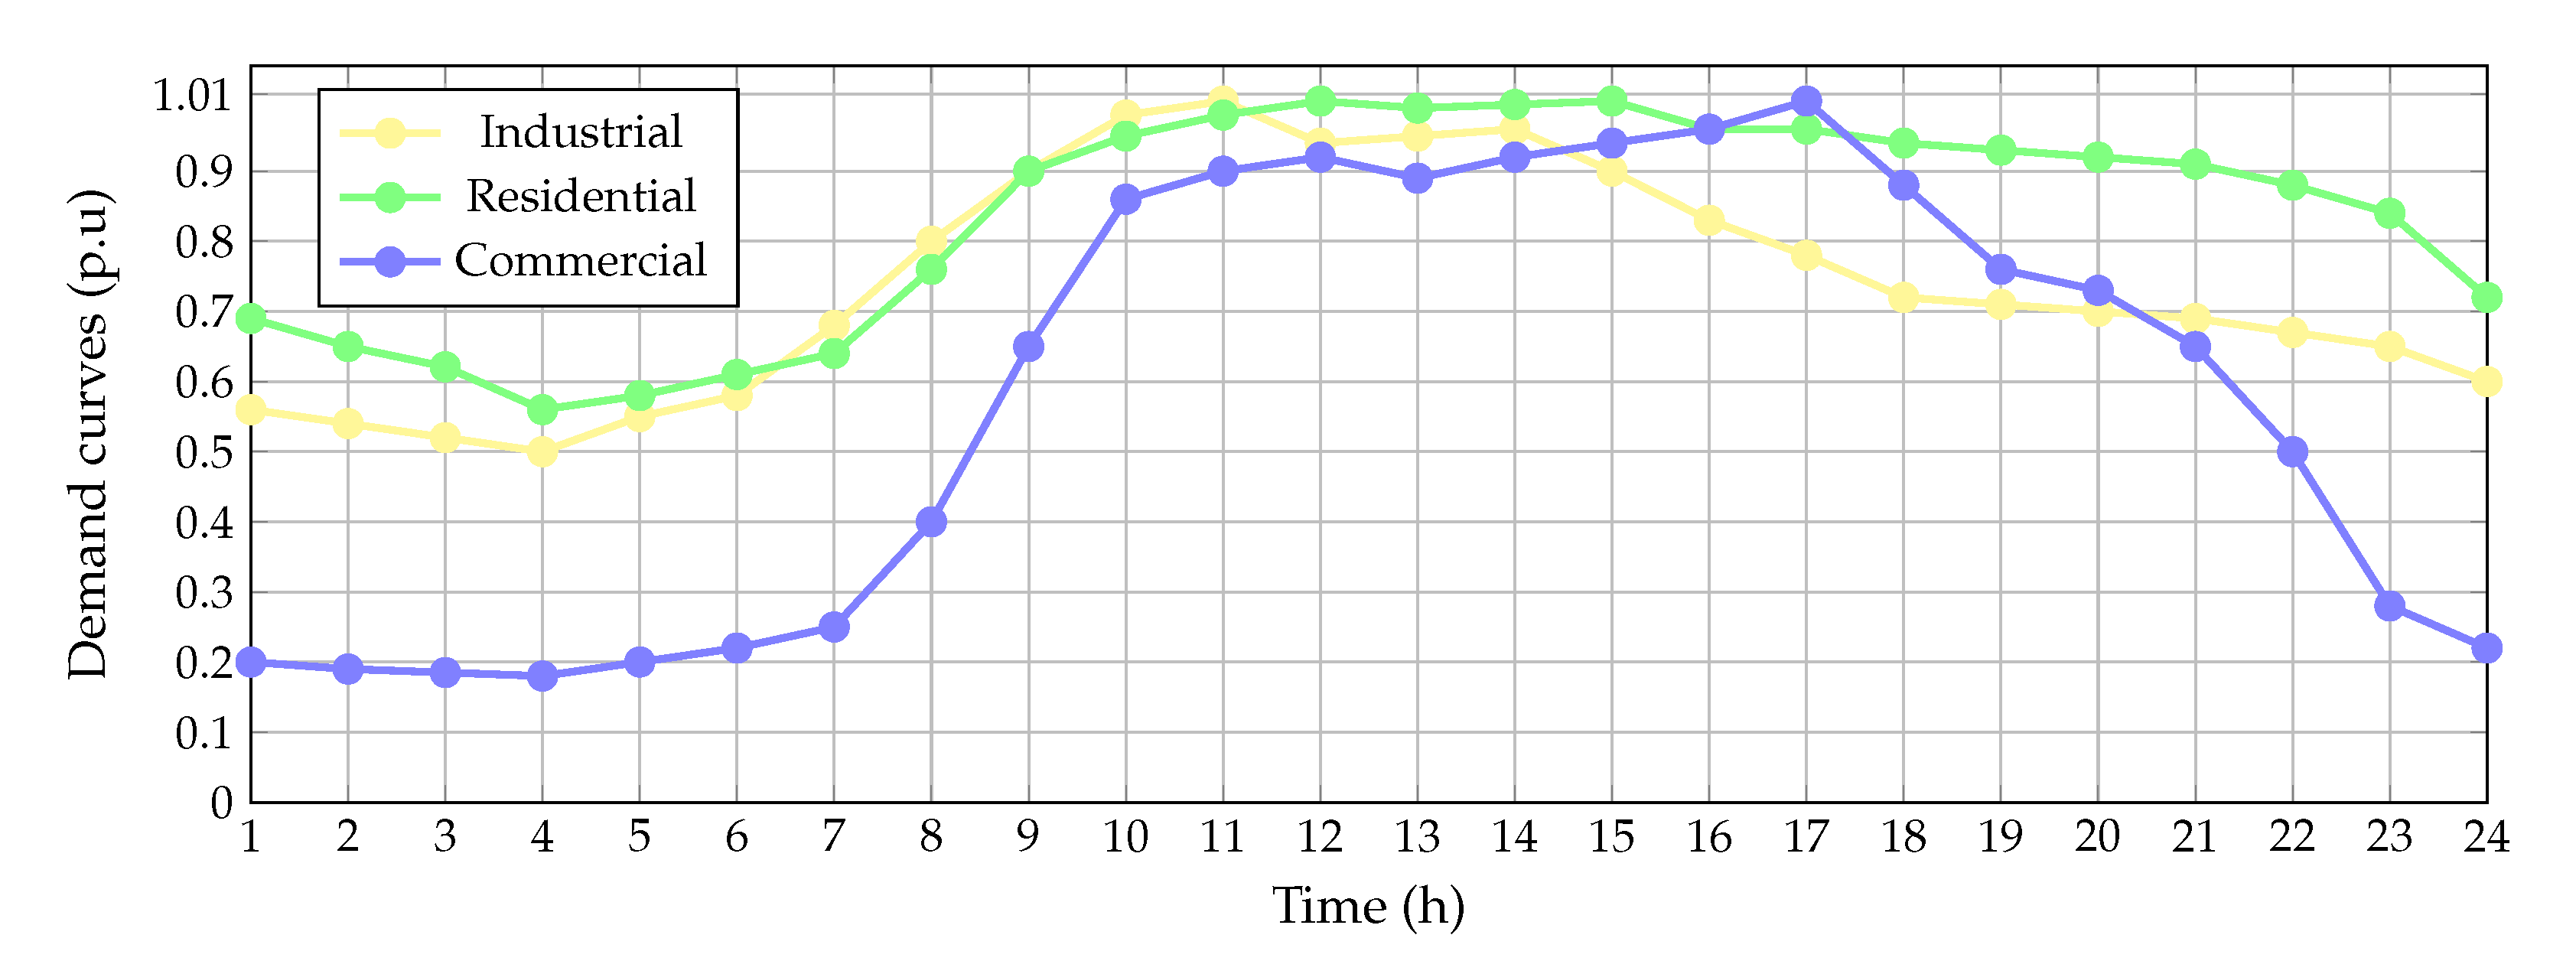
  • Inclusion in the optimization model of the curves associated with residential, industrial, and commercial loads under an economic multi-period operation environment for radial distribution networks.
  • Comparison of the proposed master–slave approach with the GAMS optimization package, where the results show that the proposed approach achieves a better reduction of the total operating costs in the test system.
The scope of this research is circumscribed to medium-voltage distribution grids with strictly radial configuration, and the convex reformulation of the power flow problem is based on the branch method reported in [20], which works under the radiality assumption. In addition, D-STATCOMs are modeled for optimization purposes as constant reactive power sources since the power electronic interface presented in Figure 1 makes it possible to control the amount of reactive power provided to the electrical distribution system.
The rest of this study has the following structure: Section 2 describes the general MINLP model that represents the problem of the optimal siting and sizing of D-STATCOMs in electrical grids, considering a time-varying formulation that minimizes the annual operative costs regarding energy losses added with the annualized investments in D-STATCOMs. Section 3 presents the convex reformulation of the MINLP model that converts it into a mixed-integer second-order cone programming equivalent by using the branch power flow representation of the distribution networks with radial configuration and the main characteristics of the CBGA, to determine the location of the D-STATCOMs using an integer codification. Section 4 describes the distribution test feeder.

2. Mixed-Integer Nonlinear Programming Model

The problem of the dynamic reactive power compensation in AC distribution networks can be represented by a MINLP model since (i) the binary part is defined by the location or number of a D-STATCOM in a particular node of the network, (ii) the continuous part is associated with the power flow variables, i.e., voltages and active and reactive power generations, and (iii) the active and reactive power flow gives the nonlinear characteristics of the model in lines and their voltage drops. The complete mathematical model that represents the problem of the optimal siting and sizing of D-STATCOMs in electrical distribution grids is described below.

2.1. Objective Function Formulation

The objective function associated with the optimal placement and dimensioning of D-STATCOMs in electrical distribution grids corresponds to a linear combination of the annual costs of the energy losses and the annual required investments in D-STATCOMs. The objective function is presented below:
min A cost = z 1 + z 2 , z 1 = C kWh T h H i j L R i j I i j h 2 Δ h , z 2 = T c 1 c 2 j N α q j c r 2 + β q j c r + γ q j c r ,
where A cost represents the objective function value associated with the annual operational costs of the grid; z 1 represents the part of the objective function associated with the costs of the annual energy losses; z 2 is the part of the objective function related with the annualized investment costs in D-STATCOMs; C kWh represents the average energy cost for a typical month of operation of the electrical distribution grid; T represents a constant related with the operational period, i.e., 365 days; R i j is the resistance value of the conductor that connects nodes i and j; I i j , h is the magnitude of current flowing in the line that connects nodes i and j in the period of time h; Δ h corresponds to the length of the time period associated with the power flow calculation (here, we assumed this time as 1 h); c 1 and c 2 are positive constants associated with the annualization of the investment costs and the life-time of the D-STATCOM, respectively; α , β , and γ are positive constants related with variable costs of installing a D-STATCOM with a reactive power rate of q j c r . Notice that H , L , and N are the sets that contain all the periods of time, all the branches, and all the nodes of the network, respectively.

2.2. Set of Constraints

The set of constraints associated with optimal siting and sizing of D-STATCOMs in electrical distribution grids is associated with active and reactive power balance equations in nodes, voltage drops in lines, and binary constraints related with installing the D-STATCOMs, among others. All the constraints of the studied problem are listed below:
p i j , t R i j I i j h 2 k : j , k L p j k h = P j h ; j N , h H ,
q i j X i j I i j h 2 k : j , k L q j k h = Q j h q j c r j N , h H ,
V j h 2 = V i h 2 2 ( R i j p i j h + X i j q i j h ) + R i j 2 + X i j 2 I i j h 2 , ( i , j ) L , h H ,
I i j h 2 = p i j h 2 + q i j h 2 V i h 2 , ( i , j ) L , h H ,
x j q c r , max q j c r x j q c r , max , j N ,
j N x j N max c r
V min V j h V max , h H , j N ,
x j 0 , 1 , j N ,
where p i j h and q i j h represent the active and reactive power flows, respectively, that travel from node i to node j during the period of time t; p j k h and q j k h have the same definitions as have been mentioned for nodes j and k, respectively; P j h and Q j h represent the active and reactive power consumption, respectively, at node j for each period of time h (note that these loads have been formulated as constant power consumption); q j c r is the reactive power injection of the dynamic reactive power compensator, i.e., the D-STATCOM connected to the node j; V i h and V j h are the magnitudes of the voltage profiles at nodes i and j, respectively, in the period of time t; q j c r , max represents the maximum upper bound of the reactive power injection by the D-STATCOM connected at node j; and V min and V max represent the minimum and maximum voltage regulation bounds allowed, respectively, for all the nodes of the grid. The variable x j determines the installation ( x j = 1 ) or number ( x j = 0 ) of a D-STATCOM in the node j. In addition, N max c r represents the maximum number of D-STATCOMs available for installation in the electric distribution network.
The interpretation of the mathematical model aimed at the optimal siting and sizing of D-STATCOMs for dynamic reactive power compensation in electric distribution grids, as defined from Equations (1) to (9), is as follows: Equation (1) corresponds to the objective function associated with minimizing the costs of the annual energy losses added with the annualized investment costs in D-STATCOMs. Equations (2) and (3) represent the active and reactive power balance expressions, respectively, applied to each node at each period of time. Equation (4) corresponds to the voltage drop at each line as a function of the power and current flow. Equation (5) denotes the average apparent power definition (i.e., application of the second Tellegen theorem) calculated in the sending node of the line. The inequality constraint in Equation (6) is a box-type constraint that defines the capability of injecting/absorbing reactive power into/from the D-STATCOM device if its binary variable is activated for the node j. The inequality expression in Equation (7) defines the maximum number of dynamic reactive power compensators that can be installed along the electric distribution test feeder, which is a limitation typically imposed by the grid operator. The box-type constraint in Equation (8) corresponds to the voltage regulation bounds allowed for all nodes of the network at any period of time; these bounds are typically selected between ± 5 % and ± 10 % for medium-voltage grids in the Colombian context. Finally, Equation (9) shows the binary nature of the decision variable related to the installation of a D-STATCOM at node j.

3. Solution Methodology

To determine the optimal sizing and location of D-STATCOMs in electrical distribution grids for dynamic reactive power compensation considering daily load curves, to minimize the annual operative costs of the grid, we propose a master–slave optimization procedure: the genetic-convex approach. In the master stage, a classical CBGA is used to determine the optimal location of the D-STATCOMs, i.e., the nodes where these will be connected. For this purpose, an integer codification is employed. In the slave stage, a conic reformulation of the multi-period optimal power flow problem is entrusted with the minimization of the amount of the daily energy losses by defining the optimal sizes of the D-STATCOMs. The master and slave stages are described below.

3.1. Slave Stage

The slave stage corresponds to the heart of the optimization methodology, since it is entrusted with the minimization of the annual energy losses considering daily active and reactive power consumption. This stage also defines the optimal sizes for D-STATOMs, which help determine their annualized investment costs. To develop the slave stage, we assume that the nodes where the D-STATCOMs have been provided by the CBGA in the master stage, i.e., the part of the optimization model associated with the optimal power flow solution ( z 1 in Equation (1) and constraints defined in Equations (2) to (4) and (8)), can be formulated as a second-order cone programming equivalent. This reformulation is described below:
To reformulate the nonlinear optimal power flow problem into an equivalent convex problem, we define the following auxiliary variables: l i j h = I i j h 2 and u i h = V i h 2 . These definitions imply that Equations (2) to (4) and (8) take the following form:
z 1 = C kWh T h H i j L R i j l i j h Δ h ,
p i j , t R i j l i j h k : j , k L p j k h = P j h ; j N , h H ,
q i j X i j l i j h k : j , k L q j k h = Q j h q j c r j N , h H ,
u j h = u i h 2 ( R i j p i j h + X i j q i j h ) + R i j 2 + X i j 2 l i j h , ( i , j ) L , h H ,
l i j h u i h = p i j h 2 + q i j h 2 , ( i , j ) L , h H ,
V min 2 u j h V max 2 , h H , j N ,
From the set of Equations (10) to (15), it can be observed that the remainder nonlinear non-convex constraint is related with the power balance definition in Equation (14), due to the product between variables as well as the the equality imposition [20]. However, this constraint can be relaxed using its conic equivalent [21]. To transform this equality constraint into a cone equivalent, we use the hyperbolic relation between two variables as follows:
l i j , t u i h = 1 4 l i j h + u i h 2 1 4 l i j h u i h 2 , p i j h 2 + q i j h 2 = 1 4 l i j h + u i h 2 1 4 l i j h u i h 2 l i j h + u i h 2 = 2 p i j h 2 + 2 q i j h 2 + l i j h u i h 2 , 2 p i j h 2 q i j h l i j h u i h = l i j h + u i h , ( i , j ) L , t T .
It is worth mentioning that the inequality constraint at Equation (16) is still non-convex due to the equality imposition; however, this imposition can be relaxed using a lower-equal symbol, as recommended in [20], which converts this constraint into a convex conic one, as presented below.
2 p i j h 2 q i j h l i j h u i h l i j h + u i h , ( i , j ) L , t T .
The optimization model that is addressed in the slave stage is summarized in Equation (17), where it is assumed that the master stage has provided the values of the binary variables x j (note that inequality constraints at Equations (7) and (9) are also fulfilled during the implementation of the CBGA).
min z 1 = C kWh T h H i j L R i j l i j h Δ h ,
p i j , t R i j l i j h k : j , k L p j k h = P j h ; j N , h H ,
q i j X i j l i j h k : j , k L q j k h = Q j h q j c r j N , h H ,
u j h = u i h 2 ( R i j p i j h + X i j q i j h ) + R i j 2 + X i j 2 l i j h , ( i , j ) L , h H ,
2 p i j h 2 q i j h l i j h u i h l i j h + u i h , ( i , j ) L , t T ,
x j q c r , max q j c r x j q c r , max , j N ,
V min 2 u j h V max 2 , h H , j N .
To solve the equivalent SOCP reformulation of the optimal power flow problem in Equation (18), assuming that x j is an input parameter, the CVX tool can be used in the MATLAB environment with the SeDuMi and the SDPT3 solvers [22,23]. The main advantage of doing this is that the global optimum finding is ensured due to the convex structure of the objective function and the solution space [20].
Once the optimization model of Equation (18) is solved to determine the values of the q j c r , these are used to evaluate the component of the objective function associated with annual costs of installing D-STATCOMs in the electrical distribution system, i.e., z 2 .

3.2. Master Stage

The master stage can be considered the brain of the solution methodology, since it is entrusted with guiding the exploration of the solution space by choosing the best set of nodes to install D-STATCOMs. To conduct this task, this study proposes to apply the CBGA with an integer codification, as proposed in [24], to solve the problem of the optimal placement of distributed generators in electrical distribution grids. The codification proposed in implementing the CBGA is presented in Equation (19):
w i t = n , 2 , , k ,
where w i t represents the i t h component of the population in the iteration t, n is the number of nodes of the system, and k is a value between 2 and n. Note that the slack bus is not considered in the codification since this position is not suitable for the connection of a D-STATCOM.
The CBGA implemented in this research works with a population of about 20 individuals for up to 100 iterations, where a tournament is conducted with 4 individuals (randomly selected) to select the 2 individuals with the best objective function, i.e., m A cost . Then, these individuals are crossed using one recombination point to produce two new offspring. For these two individuals, the recombination strategy is applied with a probability of 75% using one bit for mutating. In the case of mutation, it is selected for one of these individuals, and an arbitrary position of the vector is changed for a node between 2 and n. Finally, these offspring are evaluated with the SOCP model presented in Equation (18) to determine the values of their objective functions, which implies that the best individual (minimum A cost value) is selected to replace the worst individual in the current population [25]. To make this replacement, the diversity criteria are applied to avoid the current population’s information. The procedure mentioned above is repeated until it reaches the maximum number of iterations.
Figure 2 summarizes the master–slave optimization algorithm’s application to the problem of the optimal placement and sizing of D-STATCOMs in distribution networks considering different load profiles to minimize the annual operative costs of the grid.

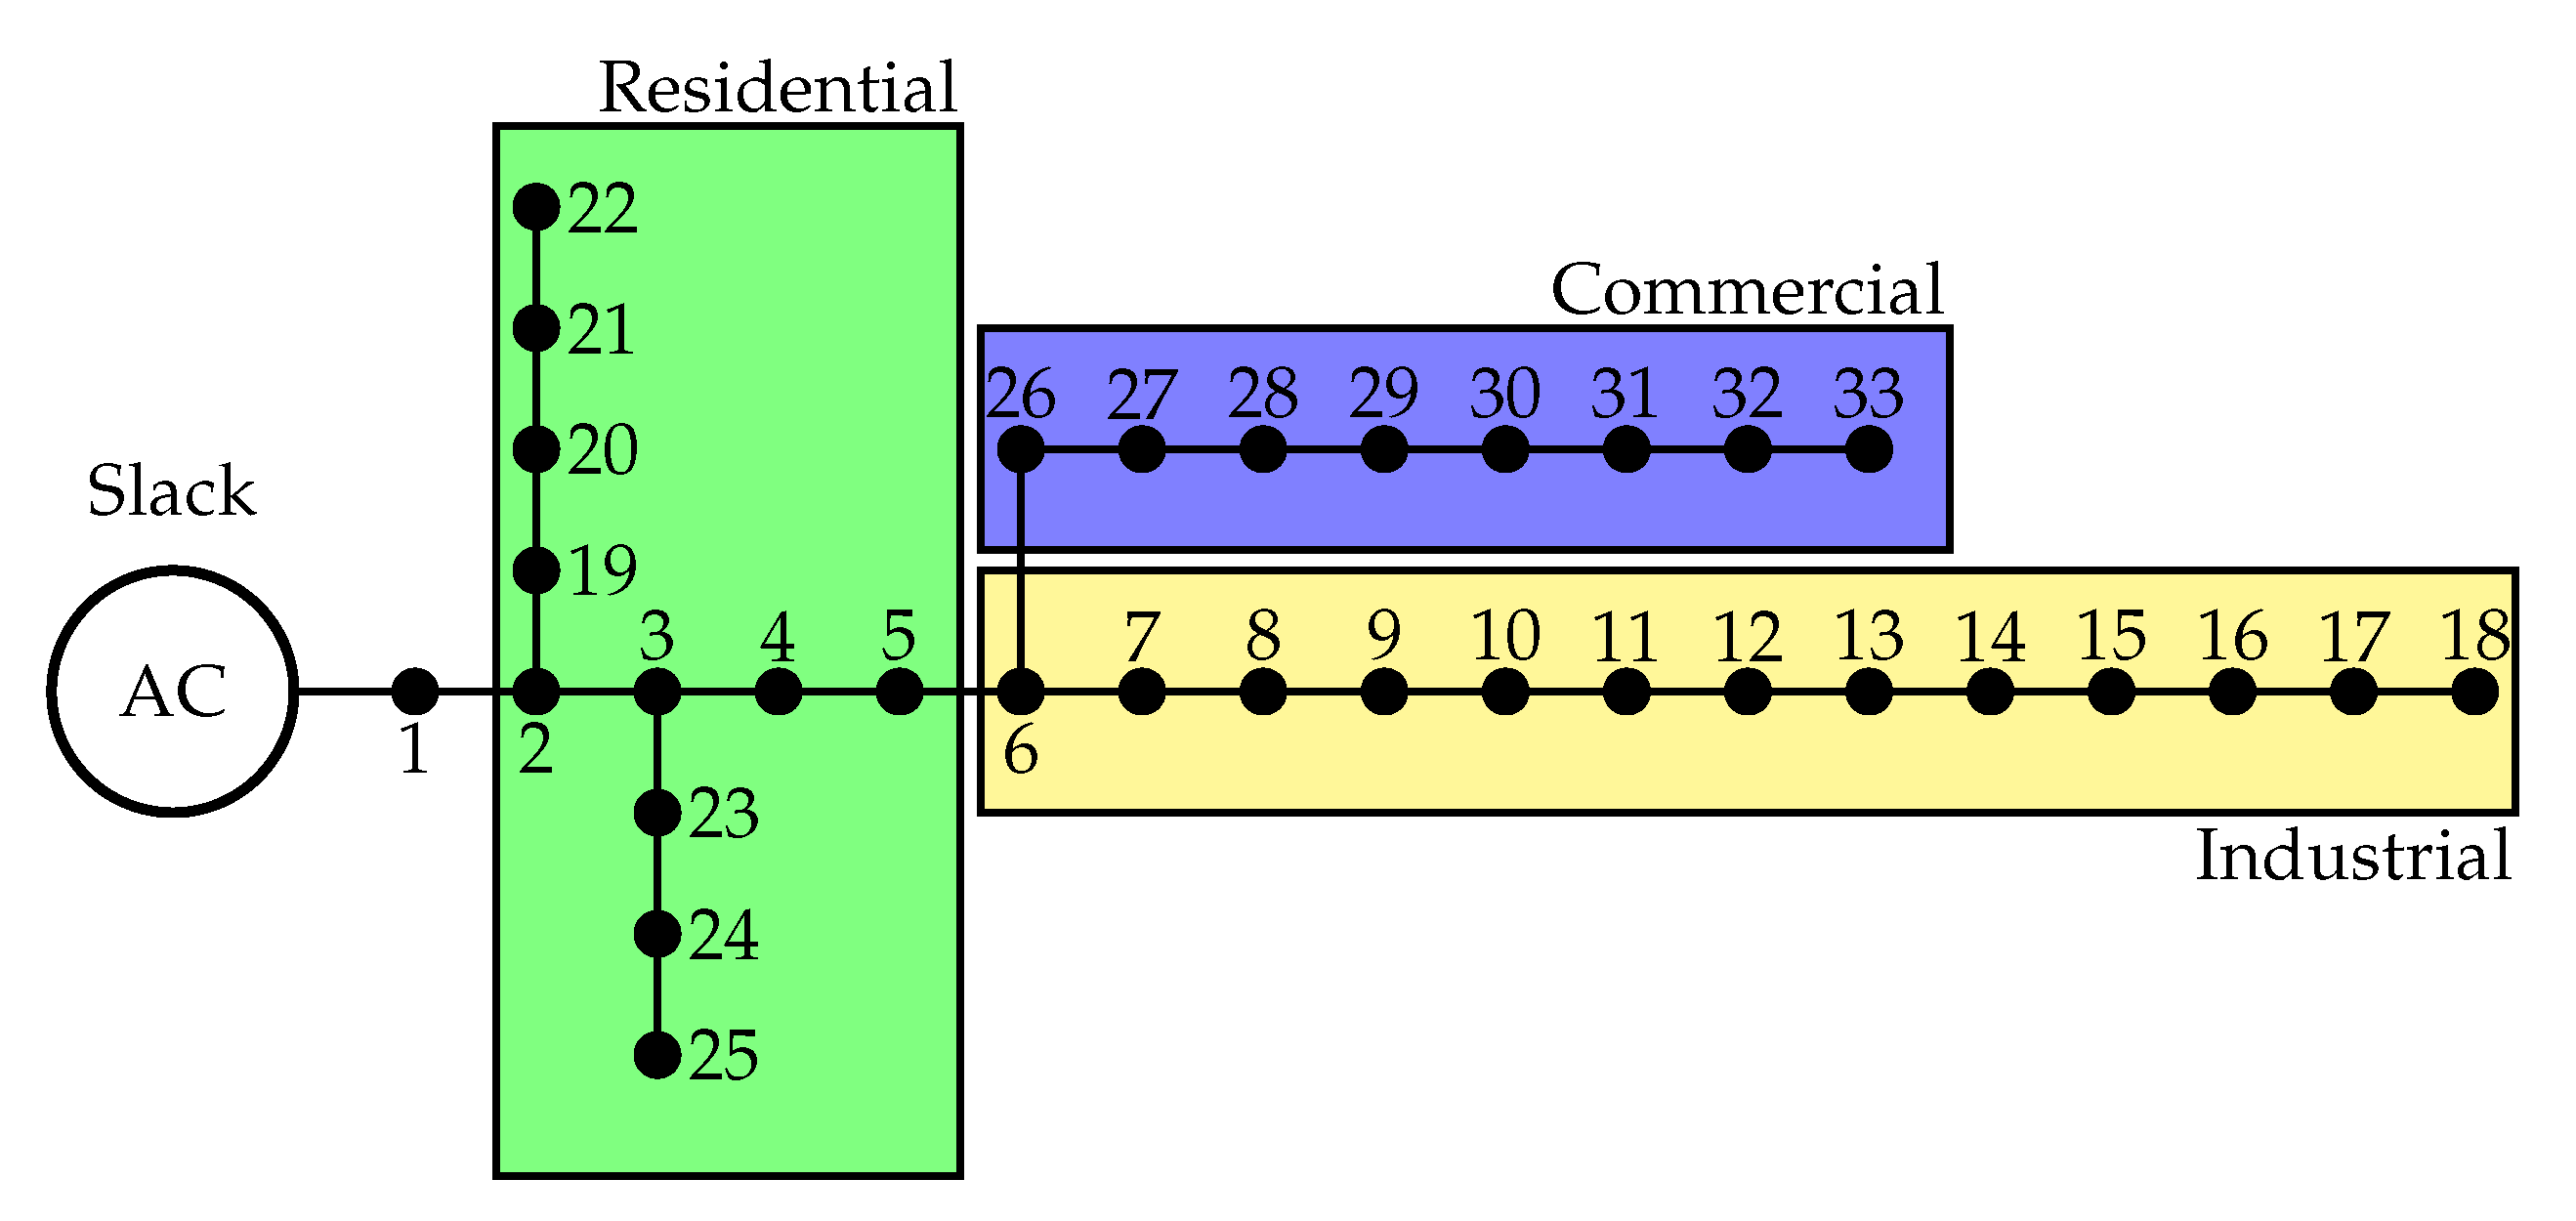
4. Electrical Distribution Grid Under Study

The proposed master–slave optimization methodology for the optimal siting and dimensioning of D-STATCOMs in electric distribution grids was tested in a classical and well-known distribution grid composed of 33 nodes and 32 lines (radial topology), which is denominated in this research as the IEEE-33 bus test feeder. This test feeder was operated at medium-voltage levels with 12.66 kV at the substation node (see Figure 3). The total active and reactive power consumption in the peak load condition are 3715 kW and 2300 kvar, respectively. In addition, this test feeder has 210.9876 kW of power losses in this operative scenario. The information about active and reactive power consumption during the peak load case and the branch parameters for the IEEE-33 bus test feeder are listed in Table 1 [26].
The shaded areas in Figure 3 represent the types of consumer connected to the distribution grid, i.e., industrial, commercial, and residential loads. Each of the per-unit demand curves are depicted in Figure 4.
To compare the results of future works regarding D-STATCOMs in distribution grids with the results of the proposed CBGA-SOCP approach, in Table 2 is presented the information depicted in Figure 4 for all the load types.
The objective function defined in Equation (1) was evaluated using the parameters presented in Table 3. Note that some of these values have been taken from [27] and [10]. It is also important to highlight that to evaluate the objective function regarding the annual costs of the installation of D-STATCOMs, i.e., z 2 , the values of the variable q j c r must be defined in MVAr [27].

5. Computational Implementation

The proposed optimization approach based on the hybridization of the CBGA and the SOCP, used to solve the problem of the optimal placement and sizing of D-STATCOMs in electrical distribution grids, was performed using MATLAB software version 2020 b in a PC with an AMD Ryzen 7 3700 2.3 -GHz processor and 16.0 GB RAM, running on a 64-bit version of Microsoft Windows 10 Single Language.

5.1. Optimization Results

To validate the efficiency of the proposed CBGA-SOCP approach to site and size D-STATCOMs in distribution networks for annual operative cost minimization, we used 100 iterations and population sizes between 20 and 100 in steps of 20, to observe the convergence rate of our proposal as well as the required processing times.
Table 4 presents the objective function values reached by each of the proposed master–slave CBGA-SOCP strategies regarding the total annual operating costs and the average processing times after 100 consecutive evaluations.
The results in Table 4 present following observations:
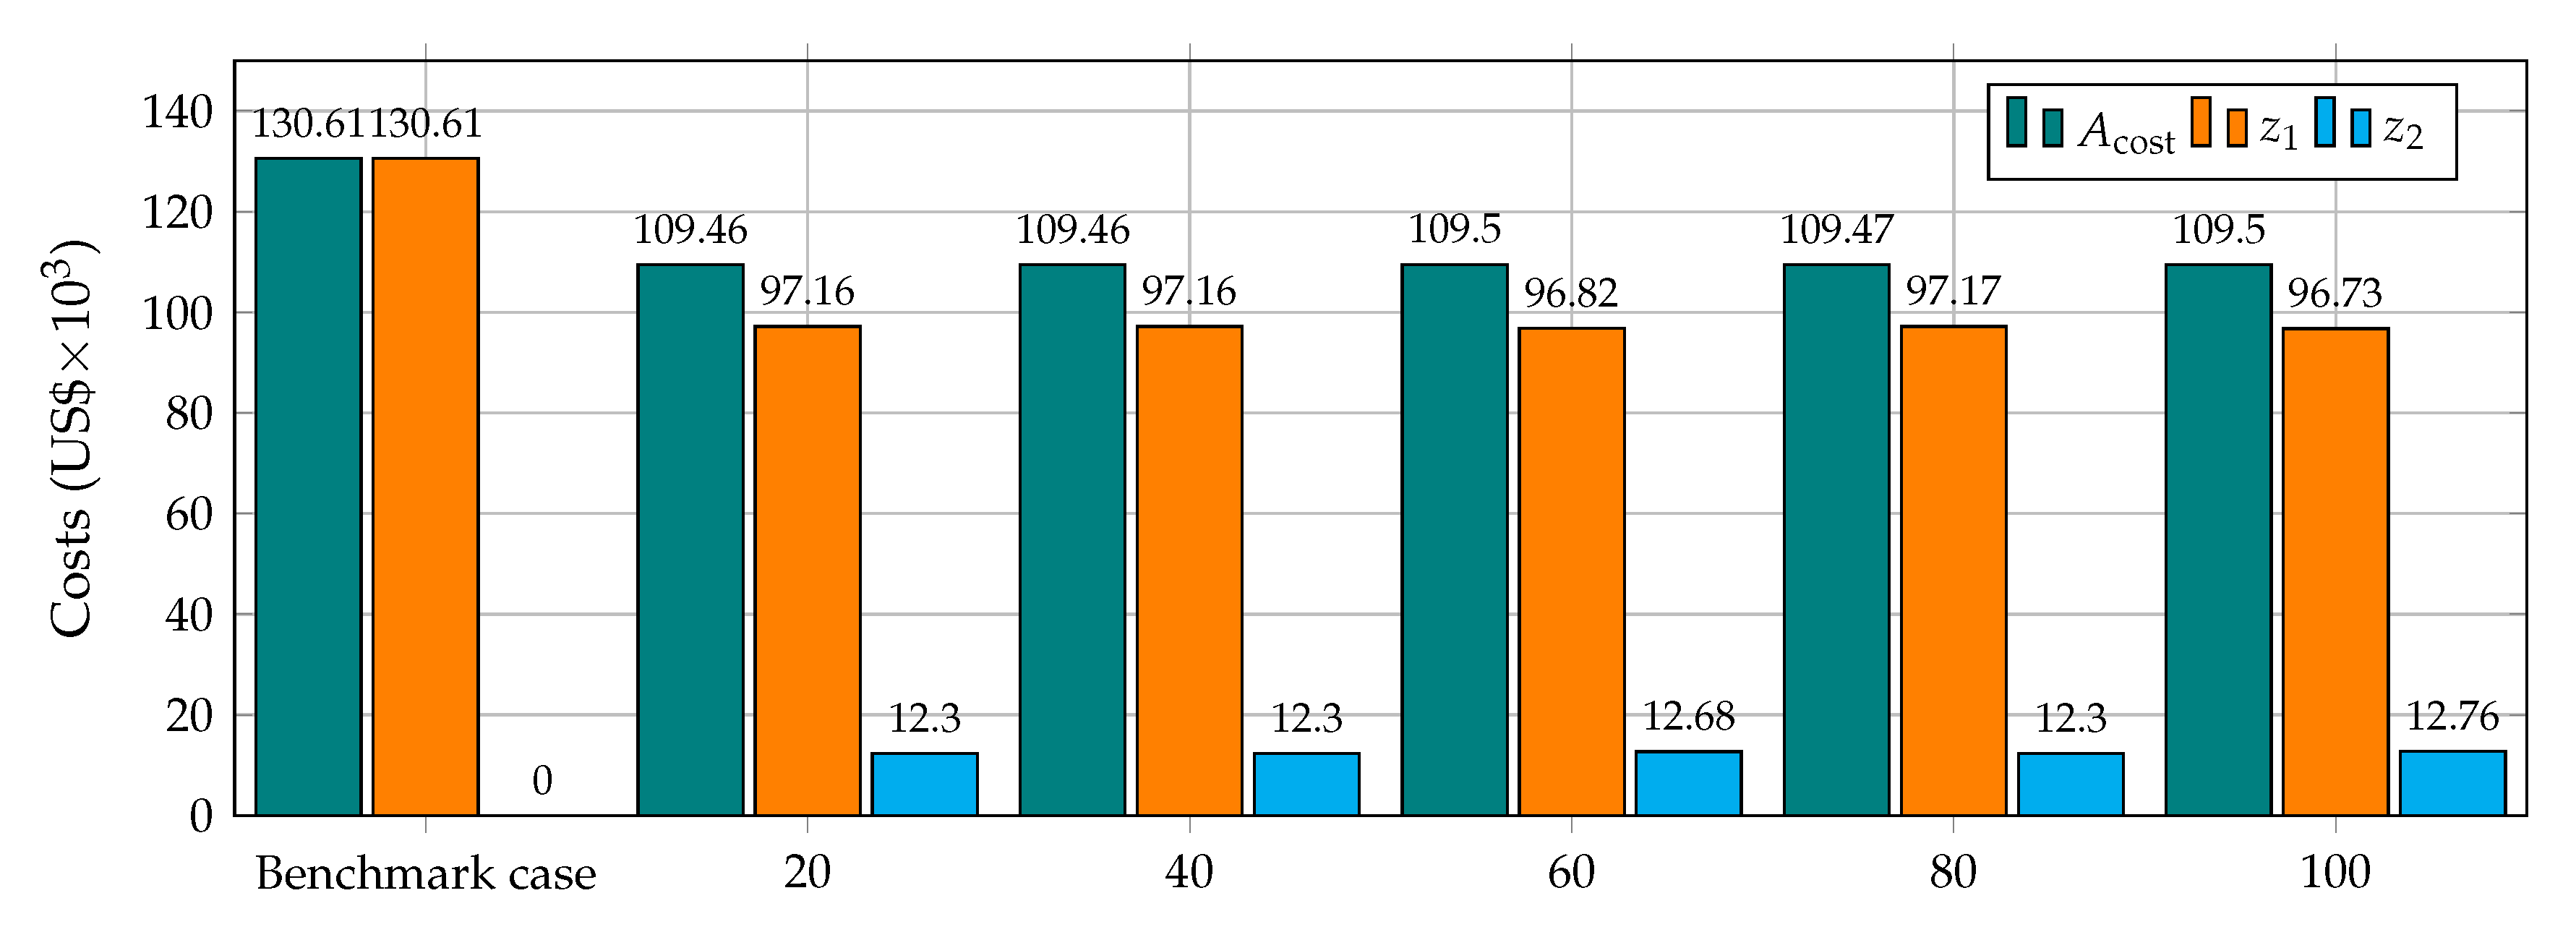
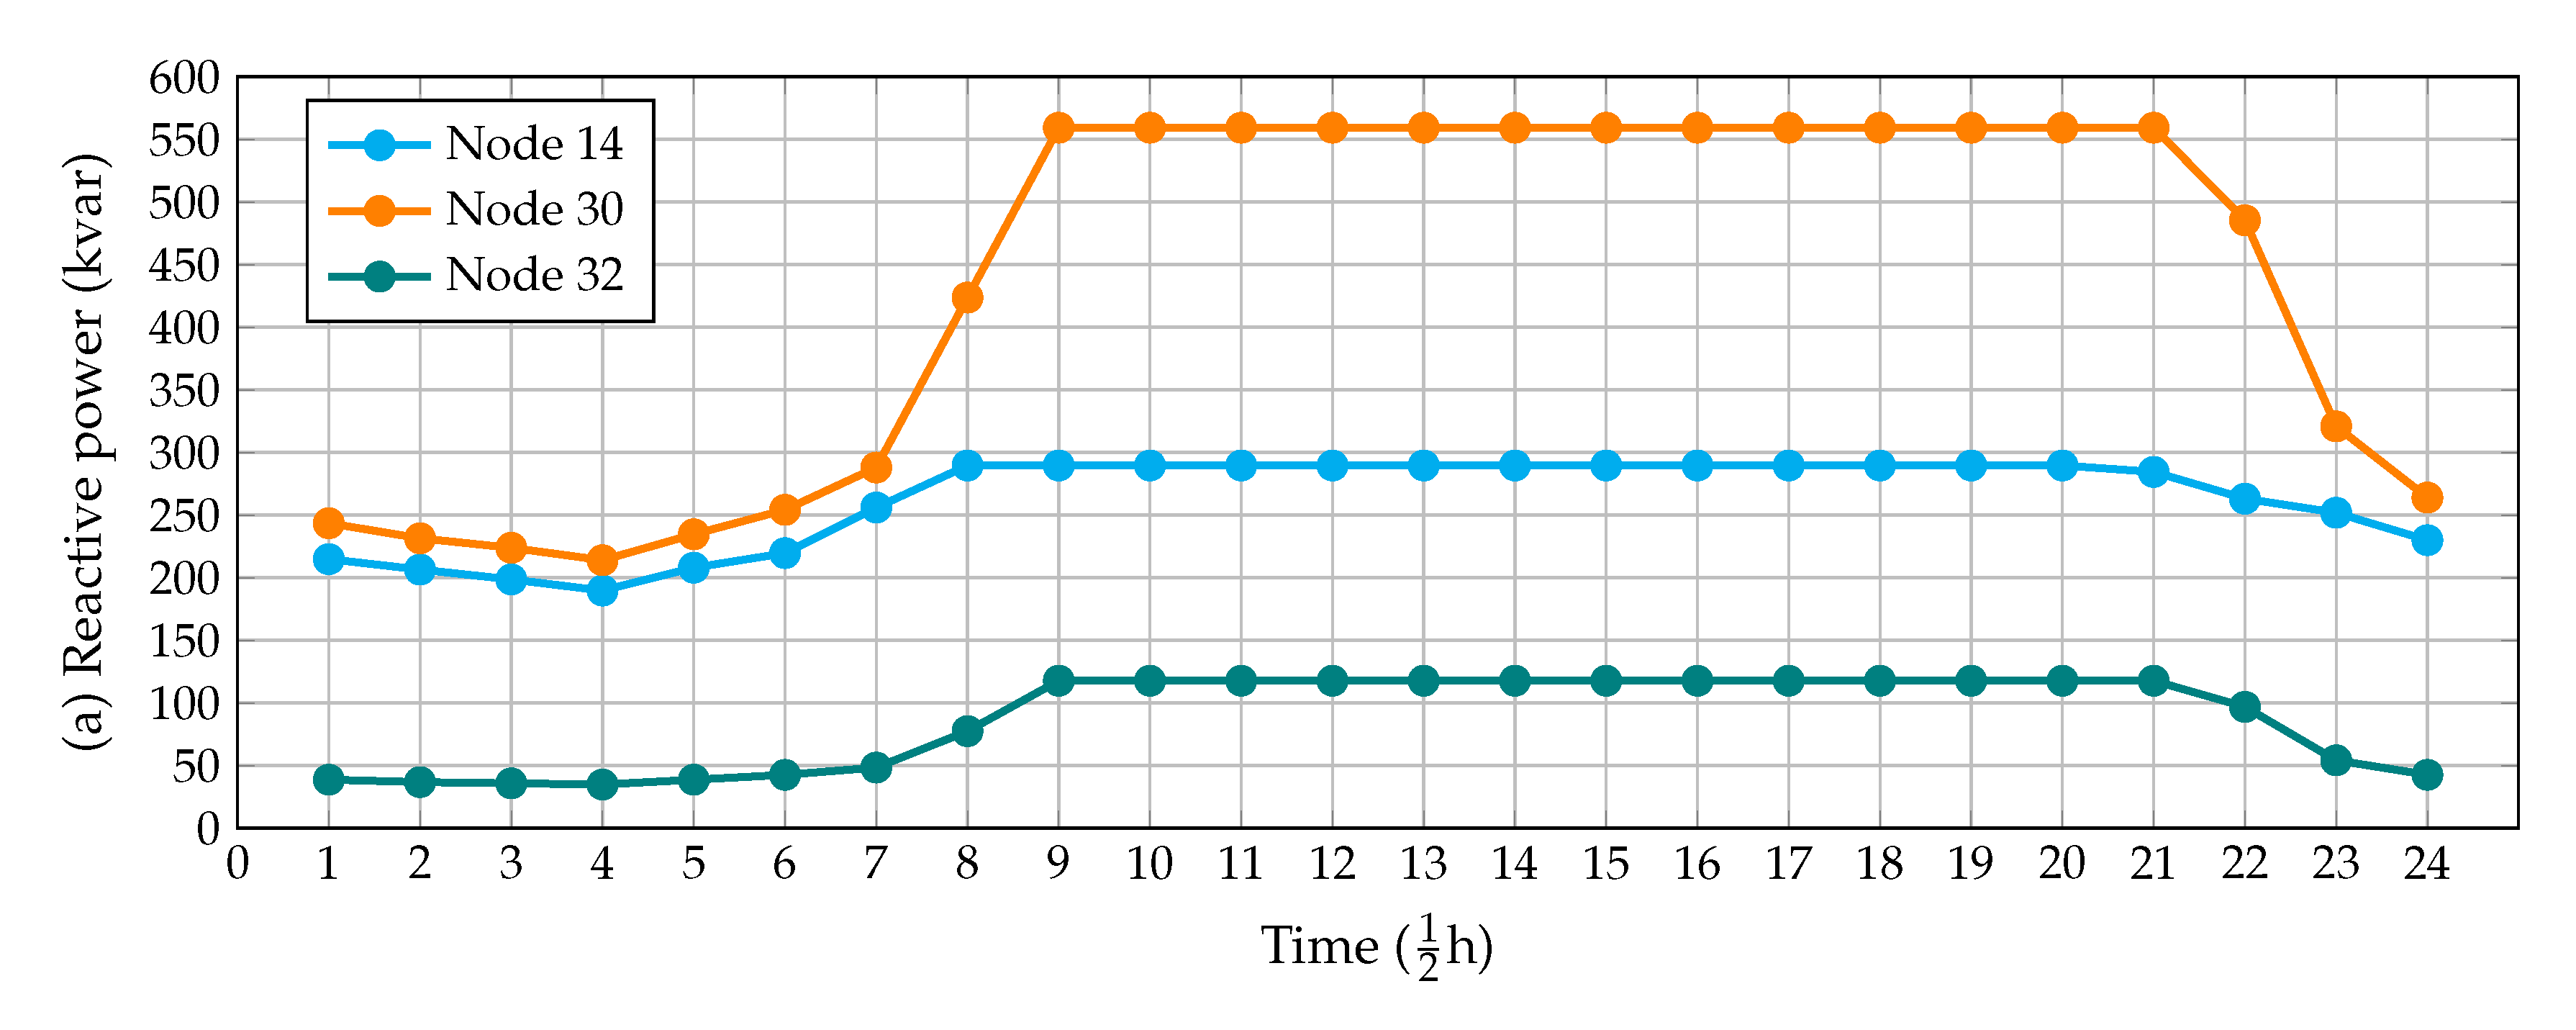
  • The best objective function value is reached with population sizes of 20 and 40, with an average processing time of about 3.1144 h; here, nodes 14, 30, and 32 are selected, with nominal rates of 0.2896 MVAr, 0.5593 MVAr, and 0.1177 MVAr, respectively, producing a total annual operating cost of US$/year 109455.96 . This solution allows annual cost reductions of 16.20 % .
  • The worst solution reached by using the hybrid CBGA-SOCP approach corresponding to the nodes 12, 14, and 30, with D-STATCOM capacities of 0.1920 MVAr, 0.1488 MVAr, and 0.6556 MVAr, respectively, generating a final objective function value of US$/year 109498.91 ; however, the difference with respect to the best objective function is only 42.94 dollars per year of operation.
  • All the solutions in Table 4 identify nodes 14 and 30 in the final solution, and their differences are associated with the third node, with the particularity that all the D-STATCOMs are located in the commercial and industrial areas, as can be seen in Figure 3.
  • Regarding processing times in Table 4, it can be observed that the required processing times increase as a function of population size in the initial population, since to start searching the solution space, the CBGA requires the evaluation of the initial population, which consumes additional processing time.
Figure 5 presents the desegregated costs of the solutions reached by using the proposed hybrid CBGA-SOCP approach as a function of the population size.
The results in Figure 5 show that in general, the annual investment cost in D-STATCOMs is about US$/year 12300 for the best optimal solutions, which implies that with this inversion, the total reduction in cost of energy losses is about 33,450 dollars per year of operation. This justifies the investments in dynamic reactive power compensators, since the net profit in the best solution is about US$/year 21,150.
Table 5 presents the solutions reached by using the proposed CBGA-SOCP when 20 individuals are considered in the population. From this table, it is possible to note that (i) 95% of the solutions include node 30, confirming that this is the most sensitive node in terms of minimizing energy cost reduction, considering daily load profiles; (ii) the difference between the optimal solution (i.e., solution No. 1) and the last solution (i.e., solution No. 20) is about 613.45 dollars per year of operation, which demonstrates that all the solutions in Table 5 can be considered adequate to minimize the annual operative costs of the electric distribution network when D-STATCOMs are installed; and (iii) the solutions reported in Table 4 for different population sizes are contained in the first four solutions reported in Table 5, which implies that a population size of 20 can efficiently solve the problem of the optimal siting and sizing of D-STATCOMs in electric distribution networks.

5.2. Comparison with the GAMS Optimization Package

To corroborate the effectiveness and robustness of the proposed hybrid optimization algorithm so as to locate and size D-STATCOMs in radial distribution grids, we implemented the exact MINLP model defined from Equations (1) to (9) in the GAMS optimization package by using the BONMIN and the COUENNE solvers. Table 6 presents the numerical results obtained after implementing MINLP solvers in GAMS.
From Table 6, it can be concluded that (i) GAMS BONMIN and COUENNE solvers get stuck in local optimal solutions compared to the solution informed by the proposed hybrid optimization approach; (ii) the total operating cost reductions achieved by the BONMIN and COUENNE solvers are 16.12% and 15.94%, respectively, while the proposed approach reaches a value of 16.20%; and (iii) the GAMS solvers and the proposed genetic-convex approach identify the commercial area in Figure 3 as the most important zone to inject reactive power, since the largest sizes of D-STATCOMs are concentrated in nodes 30 and 32.

5.3. Additional Operative Gains

To verify the effectiveness of the usage of dynamic reactive power compensators (D-STATCOMs) in electric distribution networks, when compared with classical fixed-step capacitor banks, we present in Figure 6 the daily output in the D-STATCOMs for the optimal solution reported in Table 5.
Based on the reactive behavior in Figure 6, we can conclude that (i) all the D-STATCOMs work with a dynamic reactive power output lower than the nominal rate during the periods from 1 to 9 h and 21 to 24 h, leading to residential, industrial, and commercial loads below 90% of their consumption, as can be seen in Figure 4; and (ii) the cost of the annual energy losses considering the dynamic power outputs in Figure 6 is US$/year 94 , 398.03 , which, compared with the fixed-capacitor case, i.e., US$/year 97 , 157.27 , implies an effective additional gain of about 2759.24 dollars per year of operation.

6. Conclusions and Recommendations

In this paper we solved the problem of optimal siting and sizing of D-STATCOMs in electrical distribution grids with radial structure considering residential, industrial, and commercial loads, by proposing a new hybrid optimization approach based on the combination of the classical CBGA and the SOCP reformulations of the optimal power flow problem. The former addressed the discrete part of the optimization problem, i.e., the location of the D-STATCOMs, while the latter solved the the optimal sizing problem of the D-STATCOMs via conic optimization. Numerical results demonstrated that with a population size of 20 in the CBGA, the optimal solution was obtained; this solution allowed for reducing the annual operational costs to about 16.20 % by inverting about 12 , 300 dollars per year of operation.
The use of D-STATCOMs instead of fixed-step capacitor banks for reactive power compensation in distribution grids demonstrated that the variable reactive power injection as function of the grid demand behaviors allows additional monetary gains per year of operation to be reached, which in the case of the IEEE-bus test feeder was about US$/year 2759.24 .
Numerical comparisons with the MINLP solvers BONMIN and COUENNE (available in the GAMS optimization package) confirmed that these get stuck in local optimal solutions when compared with the results reached by the proposed genetic-convex approach. This situation occurred in the GAMS solvers due to the non-convexity of the solution space, which makes it difficult to explore and exploit the solution space with exact optimization techniques.
In future, researchers can work on the following aspects: (i) to extend the application of the D-STATCOMs in optimization problems associated with greenhouse gas emission minimization, and (ii) reformulation of the objective functions associated with the costs of the D-STATCOMs, such as a convex quadratic function, which will ensure the finding of the global optimal solution via branch-and-bound and interior point methods to solve the MISOCP equivalent formulation.

Author Contributions

Conceptualization: O.D.M. and W.G.-G.; methodology: O.D.M. and W.G.-G.; investigation: O.D.M. and W.G.-G.; writing, review, and editing: O.D.M., W.G.-G., H.R.C., L.A.-B., and C.O.-H. All authors have read and agreed to the published version of the manuscript.

Funding

This work was partially supported in part by the Laboratorio de Simulación Hardware-in-the-loop para Sistemas Ciberfísicos under Grant TEC2016-80242-P (AEI/FEDER), and in part by the Spanish Ministry of Economy and Competitiveness under Grant DPI2016-75294-C2-2-R.

Institutional Review Board Statement

Not applicable.

Informed Consent Statement

Not applicable.

Data Availability Statement

No new data were created or analyzed in this study. Data sharing is not applicable to this article.

Acknowledgments

The first author was supported by the Centro de Investigación y Desarrollo Científico de la Universidad Distrital Francisco José de Caldas, under grant 1643-12-2020 associated with the project “Desarrollo de una metodología de optimización para la gestión óptima de recursos energéticos distribuidos en redes de distribución de energía eléctrica” and in part by the Dirección de Investigaciones de la Universidad Tecnológica de Bolívar, under grant PS2020002 associated with the project “Ubicación óptima de bancos de capacitores de paso fijo en redes eléctricas de distribución para reducción de costos y pérdidas de energía: Aplicación de métodos exactos y metaheurísticos.”

Conflicts of Interest

The authors declare no conflict of interest.

References

  1. Girbau-Llistuella, F.; Díaz-González, F.; Sumper, A.; Gallart-Fernández, R.; Heredero-Peris, D. Smart Grid Architecture for Rural Distribution Networks: Application to a Spanish Pilot Network. Energies 2018, 11, 844. [Google Scholar] [CrossRef] [Green Version]
  2. Montoya, O.D.; Serra, F.M.; Angelo, C.H.D. On the Efficiency in Electrical Networks with AC and DC Operation Technologies: A Comparative Study at the Distribution Stage. Electronics 2020, 9, 1352. [Google Scholar] [CrossRef]
  3. Celli, G.; Pilo, F.; Pisano, G.; Cicoria, R.; Iaria, A. Meshed vs. radial MV distribution network in presence of large amount of DG. In Proceedings of the IEEE PES Power Systems Conference and Exposition, New York, NY, USA, 10–13 October 2004. [Google Scholar] [CrossRef]
  4. Li, H.; Cui, H.; Li, C. Distribution Network Power Loss Analysis Considering Uncertainties in Distributed Generations. Sustainability 2019, 11, 1311. [Google Scholar] [CrossRef] [Green Version]
  5. Sharma, A.K.; Murty, V.V.S.N. Analysis of Mesh Distribution Systems Considering Load Models and Load Growth Impact with Loops on System Performance. J. Inst. Eng. India Ser. B 2014, 95, 295–318. [Google Scholar] [CrossRef]
  6. Gil-González, W.; Montoya, O.D.; Rajagopalan, A.; Grisales-Noreña, L.F.; Hernández, J.C. Optimal Selection and Location of Fixed-Step Capacitor Banks in Distribution Networks Using a Discrete Version of the Vortex Search Algorithm. Energies 2020, 13, 4914. [Google Scholar] [CrossRef]
  7. Tamilselvan, V.; Jayabarathi, T.; Raghunathan, T.; Yang, X.S. Optimal capacitor placement in radial distribution systems using flower pollination algorithm. Alex. Eng. J. 2018, 57, 2775–2786. [Google Scholar] [CrossRef]
  8. Riaño, F.E.; Cruz, J.F.; Montoya, O.D.; Chamorro, H.R.; Alvarado-Barrios, L. Reduction of Losses and Operating Costs in Distribution Networks Using a Genetic Algorithm and Mathematical Optimization. Electronics 2021, 10, 419. [Google Scholar] [CrossRef]
  9. Sirjani, R.; Jordehi, A.R. Optimal placement and sizing of distribution static compensator (D-STATCOM) in electric distribution networks: A review. Renew. Sus. Energ. Rev. 2017, 77, 688–694. [Google Scholar] [CrossRef]
  10. Marjani, S.R.; Talavat, V.; Galvani, S. Optimal allocation of D-STATCOM and reconfiguration in radial distribution network using MOPSO algorithm in TOPSIS framework. Int. Trans. Electr. Energy Syst. 2018, 29, e2723. [Google Scholar] [CrossRef]
  11. Stanelyte, D.; Radziukynas, V. Review of Voltage and Reactive Power Control Algorithms in Electrical Distribution Networks. Energies 2019, 13, 58. [Google Scholar] [CrossRef] [Green Version]
  12. Guo, C.; Zhong, L.; Zhao, J.; Gao, G. Single-Phase Reactive Power Compensation Control for STATCOMs via Unknown System Dynamics Estimation. Math. Probl. Eng. 2020, 2020, 1–9. [Google Scholar] [CrossRef]
  13. Montoya, O.D.; Gil-González, W.; Hernández, J.C. Efficient Operative Cost Reduction in Distribution Grids Considering the Optimal Placement and Sizing of D-STATCOMs Using a Discrete-Continuous VSA. Appl. Sci. 2021, 11, 2175. [Google Scholar] [CrossRef]
  14. Tsai, S.J.S.; Chang, Y. Dynamic and unbalance voltage compensation using STATCOM. In Proceedings of the 2008 IEEE Power and Energy Society General Meeting—Conversion and Delivery of Electrical Energy in the 21st Century, Pittsburgh, PA, USA, 20–24 July 2008. [Google Scholar] [CrossRef]
  15. Yuvaraj, T.; Ravi, K.; Devabalaji, K. DSTATCOM allocation in distribution networks considering load variations using bat algorithm. Ain Shams Eng. J. 2017, 8, 391–403. [Google Scholar] [CrossRef] [Green Version]
  16. Saxena, N.K.; Kumar, A. Cost based reactive power participation for voltage control in multi units based isolated hybrid power system. J. Electr. Syst. Inf. Technol. 2016, 3, 442–453. [Google Scholar] [CrossRef] [Green Version]
  17. Samimi, A.; Golkar, M.A. A Novel Method for Optimal Placement of STATCOM in Distribution Networks Using Sensitivity Analysis by DIgSILENT Software. In Proceedings of the 2011 Asia-Pacific Power and Energy Engineering Conference, Wuhan, China, 25–28 March 2011. [Google Scholar] [CrossRef]
  18. Tolabi, H.B.; Ali, M.H.; Rizwan, M. Simultaneous Reconfiguration, Optimal Placement of DSTATCOM, and Photovoltaic Array in a Distribution System Based on Fuzzy-ACO Approach. IEEE Trans. Sustain. Energy 2015, 6, 210–218. [Google Scholar] [CrossRef]
  19. Gupta, A.R.; Kumar, A. Energy Savings Using D-STATCOM Placement in Radial Distribution System. Procedia Comput. Sci. 2015, 70, 558–564. [Google Scholar] [CrossRef] [Green Version]
  20. Farivar, M.; Low, S.H. Branch Flow Model: Relaxations and Convexification—Part I. IEEE Trans. Power Syst. 2013, 28, 2554–2564. [Google Scholar] [CrossRef]
  21. Farivar, M.; Low, S.H. Branch Flow Model: Relaxations and Convexification—Part II. IEEE Trans. Power Syst. 2013, 28, 2565–2572. [Google Scholar] [CrossRef]
  22. Gil-González, W.; Garces, A.; Montoya, O.D.; Hernández, J.C. A Mixed-Integer Convex Model for the Optimal Placement and Sizing of Distributed Generators in Power Distribution Networks. Appl. Sci. 2021, 11, 627. [Google Scholar] [CrossRef]
  23. Eltved, A.; Dahl, J.; Andersen, M.S. On the robustness and scalability of semidefinite relaxation for optimal power flow problems. Optim. Eng. 2019, 21, 375–392. [Google Scholar] [CrossRef] [Green Version]
  24. Montoya, O.D.; Gil-González, W.; Orozco-Henao, C. Vortex search and Chu-Beasley genetic algorithms for optimal location and sizing of distributed generators in distribution networks: A novel hybrid approach. Eng. Sci. Technol. Int. J. 2020, 23, 1351–1363. [Google Scholar] [CrossRef]
  25. Montoya, O.D.; Gil-González, W.; Grisales-Noreña, L.F. Hybrid GA-SOCP Approach for Placement and Sizing of Distributed Generators in DC Networks. Appl. Sci. 2020, 10, 8616. [Google Scholar] [CrossRef]
  26. Montoya, O.D.; Gil-González, W. Dynamic active and reactive power compensation in distribution networks with batteries: A day-ahead economic dispatch approach. Comput. Electr. Eng. 2020, 85, 106710. [Google Scholar] [CrossRef]
  27. Sharma, A.K.; Saxena, A.; Tiwari, R. Optimal Placement of SVC Incorporating Installation Cost. Int. J. Hybrid Inf. Technol. 2016, 9, 289–302. [Google Scholar] [CrossRef]
Figure 1. Schematic diagram of a distribution static compensator (D-STATCOM).
Applsci 11 03353 g001
Figure 2. Flowchart of the Chu and Beasley genetic algorithm (CBGA)-second-order cone programming (SOCP) approach for the optimal sizing and placement of D-STATCOMs in electrical distribution grids.
Applsci 11 03353 g002
Figure 3. Grid configuration for the IEEE 33-bus system, with different shaded areas representing different types of load.
Applsci 11 03353 g003
Figure 4. Type of load: residential, commercial, and industrial curves.
Applsci 11 03353 g004
Figure 5. Discriminated costs considering different population sizes for the CBGA.
Applsci 11 03353 g005
Figure 6. Dynamic reactive power behavior during a typical operation day for the D-STATCOMs in electric distribution networks in the IEEE 33-bus test feeder.
Applsci 11 03353 g006
Table 1. Electrical parameters of the 33-node test feeder.
Node iNode j R ij  ( Ω ) X ij  ( Ω ) P j  (kW) Q j  (kvar)Node iNode j R ij  ( Ω ) X ij  ( Ω ) P j  (kW) Q j  (kvar)
120.09220.04771006017180.73200.57409040
230.49300.251190402190.16400.15659040
340.36600.18641208019201.50421.35549040
450.38110.1941603020210.40950.47849040
560.81900.7070602021220.70890.93739040
670.18720.61882001003230.45120.30839050
781.71141.235120010023240.89800.7091420200
891.03000.7400602024250.89600.7011420200
9101.04000.740060206260.20300.10346025
10110.19660.0650453026270.28420.14476025
11120.37440.1238603527281.05900.93376020
12131.46801.1550603528290.80420.700612070
13140.54160.71291208029300.50750.2585200600
14150.59100.5260601030310.97440.963015070
15160.74630.5450602031320.31050.3619210100
16171.28901.7210602032330.34100.53026040
Table 2. Types of load profile.
Hour (h)Ind. (p.u)Res. (p.u)Com. (p.u)Hour (h)Ind. (p.u)Res. (p.u)Com. (p.u)
10.560.690.20130.950.990.89
20.540.650.19140.960.990.92
30.520.620.18150.901.000.94
40.500.560.18160.830.960.96
50.550.580.20170.780.961.00
60.580.610.22180.720.940.88
70.680.640.25190.710.930.76
80.800.760.40200.700.920.73
90.900.900.65210.690.910.65
100.980.950.86220.670.880.50
111.000.980.90230.650.840.28
120.941.000.92240.600.720.22
Table 3. Parameters associated with the objective function calculation.
Par.ValueUnitPar.ValueUnit
C kWh 0.1390US$kWhT365Days
Δ h 1.00h α 0.30US$/MVAr 3
β −305.10US$/MVAr 2 γ 127380US$/MVAr
c 1 6/21901/days c 2 10Years
Table 4. Performance of the CBGA-SOCP approach with different population sizes.
No. of IterationsLocation and Size Node (MVAr) A cost (US$/year)Proc. Times (h)
Benchmark case130,613.90
20 { 14 ( 0.2896 ) , 30 ( 0.5593 ) , 32 ( 0.1177 ) } 109,455.963.0697
40 { 14 ( 0.2896 ) , 30 ( 0.5593 ) , 32 ( 0.1177 ) } 109,455.963.1592
60 { 12 ( 0.1920 ) , 14 ( 0.1488 ) , 30 ( 0.6556 ) } 109,498.913.3368
80 { 14 ( 0.2896 ) , 30 ( 0.5489 ) , 31 ( 0.1281 ) } 109,472.553.4647
100 { 11 ( 0.1982 ) , 14 ( 0.1539 ) , 30 ( 0.6509 ) } 109,496.843.6171
Table 5. Best solutions found by the proposed CBGA-SOCP approach with a population size of 20.
Sol. No.Location (Node) A cost (US$/year)Sol. No.Location (Node) A cost (US$/year)
1 { 14 , 30 , 32 } 109,455.9611 { 13 , 16 , 30 } 109,530.77
2 { 14 , 30 , 31 } 109,472.5412 { 8 , 14 , 30 } 109,713.95
3 { 11 , 14 , 30 } 109,496.8413 { 13 , 29 , 30 } 109,720.81
4 { 12 , 14 , 30 } 109,498.9114 { 12 , 30 , 31 } 109,770.17
5 { 12 , 16 , 30 } 109,501.6015 { 13 , 28 , 30 } 109,905.94
6 { 10 , 14 , 30 } 109,504.5816 { 10 , 12 , 30 } 109,908.50
7 { 13 , 30 , 31 } 109,511.6317 { 10 , 30 , 31 } 109,955.44
8 { 13 , 30 , 33 } 109,513.6218 { 9 , 12 , 30 } 109,960.30
9 { 13 , 17 , 30 } 109,515.7219 { 13 , 29 , 31 } 109,961.47
10 { 10 , 16 , 30 } 109,525.5120 { 8 , 12 , 30 } 110,069.41
Table 6. Numerical results obtained after implementing mixed-integer nonlinear programming (MINLP) model in  GAMS.
SolverLocation and Size Node (MVAr) A cost (US$/year)
Benchmark case130,613.90
BONMIN { 8 ( 0.2980 ) , 25 ( 0.0920 ) , 30 ( 0.5127 ) } 109,560.85
COUENNE { 13 ( 0.1850 ) , 16 ( 0.0825 ) , 32 ( 0.4478 ) } 109,791.14
Genetic-Convex { 14 ( 0.2896 ) , 30 ( 0.5593 ) , 32 ( 0.1177 ) } 109,455.96
Publisher’s Note: MDPI stays neutral with regard to jurisdictional claims in published maps and institutional affiliations.

