Article

Patient–Ventilator Interaction Testing Using the Electromechanical Lung Simulator xPULM™ during V/A-C and PSV Ventilation Mode

1
Department of Life Science Engineering, University of Applied Sciences Technikum Wien, Hoechstaedtplatz 6, 1200 Vienna, Austria
2
Department of Biomedical Engineering, Brno University of Technology, Technicka 3058, 61600 Brno, Czech Republic
3
Centro Hospitalar de Trás-os-Montes e Alto Douro, EPE Department of Intensive Care and Emergency Care, Lordelo, 5000-508 Vila Real, Portugal
*
Author to whom correspondence should be addressed.
Appl. Sci. 2021, 11(9), 3745; https://doi.org/10.3390/app11093745
Submission received: 25 January 2021 / Revised: 26 March 2021 / Accepted: 9 April 2021 / Published: 21 April 2021
(This article belongs to the Section Applied Biosciences and Bioengineering)

Abstract

:

Featured Application

The presented approached can be used to evaluate disparities in fundamental ventilation characteristics (pressure, flow, volume) between a patient and a mechanical ventilator. The system could be applied for mechanical ventilation development and testing.

Abstract

During mechanical ventilation, a disparity between flow, pressure and volume demands of the patient and the assistance delivered by the mechanical ventilator often occurs. This paper introduces an alternative approach of simulating and evaluating patient–ventilator interactions with high fidelity using the electromechanical lung simulator xPULM™. The xPULM™ approximates respiratory activities of a patient during alternating phases of spontaneous breathing and apnea intervals while connected to a mechanical ventilator. Focusing on different triggering events, volume assist-control (V/A-C) and pressure support ventilation (PSV) modes were chosen to test patient–ventilator interactions. In V/A-C mode, a double-triggering was detected every third breathing cycle, leading to an asynchrony index of 16.67%, which is classified as severe. This asynchrony causes a significant increase of peak inspiratory pressure (7.96 ± 6.38 vs. 11.09 ± 0.49 cmH2O, p < 0.01)) and peak expiratory flow (−25.57 ± 8.93 vs. 32.90 ± 0.54 L/min, p < 0.01) when compared to synchronous phases of the breathing simulation. Additionally, events of premature cycling were observed during PSV mode. In this mode, the peak delivered volume during simulated spontaneous breathing phases increased significantly (917.09 ± 45.74 vs. 468.40 ± 31.79 mL, p < 0.01) compared to apnea phases. Various dynamic clinical situations can be approximated using this approach and thereby could help to identify undesired patient–ventilation interactions in the future. Rapidly manufactured ventilator systems could also be tested using this approach.

1. Introduction

The functionality of the human respiratory system can be impaired mainly by respiratory pump failure or lung failure. These effects may occur based on a variety of causes such as trauma, drug effects, neural damages and other pathologies such as edema [1,2,3]. Furthermore, a combination of both respiratory failures may occur simultaneously, as is the case in patients with chronic obstructive pulmonary disease (COPD) and carbon dioxide retention [2,4]. Respiratory pump failure ultimately leads to the need for controlled or assisted mechanical ventilation, which is meant to support or fully replace spontaneous breathing of a patient providing time for recovery [5,6,7]. In such scenarios, mechanical ventilators can be deployed to decrease the work of breathing and to deliver a high concentration of oxygen into the lungs. A mechanical ventilator is essentially a medical device combining actuators, sensors, digital electronic and software to fulfill a predefined ventilation strategy [8,9,10]. The basic structure and main functional building blocks of a typical mechanical ventilator are depicted in Figure 1. Assisted mechanical ventilation should be ideally fully adaptive to a patient’s respiratory behavior by providing limited and fully synchronous respiratory support. Otherwise, asynchrony between the patient needs and the output of the ventilator arises [11,12].

1.1. Patient–Ventilator Asynchrony

Patient–ventilator asynchrony (PVA) occurs when inspiratory and expiratory times of a ventilator do not match the neural control of patient’s respiratory effort or when there is a disparity between flow, pressure or volume demands of the patient and the assistance delivered by the mechanical ventilator [13]. The neural inspiratory time can be estimated to describe the demands of a patient’s respiratory system by measuring the electrical activity of the respiratory muscles. For this purpose, diaphragm electromyographic recordings and airflow signals of healthy subjects are evaluated according to respiratory protocols on respiratory rate increments and fractional inspiratory time decrements [14]. Modern synchronization algorithms use new approaches such as deep learning [13,15,16] to estimate patients’ respiratory mechanics and neural activity based on the measured pressure and flow waveforms, esophageal pressure or transdiaphragmatic pressure readings, or diaphragm electromyography [17,18]. However, errors of bias in the estimations can further contribute to an increased incidence of PVA [17].

1.2. Occurrence of PVA

The PVA occurs during both invasive and noninvasive ventilation and can be categorized into four general types: flow asynchrony, trigger asynchrony, cycle asynchrony and mode asynchrony [11,13]. Common manifestations are cases of autotriggering (ventilator breath occurs without patient effort), double-triggering (patients inspiratory effort continues beyond the ventilator inspiratory time), ineffective breaths (inspiratory effort is not followed by ventilator breath), premature cycling (the ventilator terminates the inspiratory flow prior to the patient’s need) and late cycling (ventilator inspiratory time exceeds the patient’s inspiratory time) [19,20]. Noninvasive ventilation techniques are prone to PVA due to leakages [19]. A framework for evaluating the clinical impact of PVA and attempts to better structure such efforts was presented by Gonzalez-Bermejo et al. [21].
Patient–ventilator asynchronies occur frequently and in the most common ventilation modes [18,20,22]. A severe PVA can be defined by proportion (PVA events in ≥10% of breathing cycles) or by clustering in 3 min period (PVA in 50% of breaths, assuming a breathing rate of 20 per minute) [20,23]. A recently suggested method estimate PVA severity based on recurrence (PVA is observed twice a day for at least two minutes) [24]. However, the proposed concept requires further validation. Negative physical and mental outcomes such as excessive load on respiratory muscles, lung injury, prolonged ICU stay, discomfort and anxiety have been linked with severe PVA [13,22,25,26,27]. A higher frequency of asynchronies has been associated with higher mortality as well [13,20]. Some studies report a lower incidence of severe asynchronies when modern ventilation modes such as neurally adjusted ventilation assist (NAVA) is used in comparison to conventional ones (PSV, V/A-C) [11,18,28,29,30,31]. However, conventional modes of mechanical ventilation stand a test of time and remain frequently used. This is in part due to the increased complexity of new ventilation modes. Current emerging solutions focus on shortening the weaning process and increasing lung protective ventilation techniques [32], mainly supported by AI software solutions with advanced in vivo monitoring [33,34]. In some cases, this can lead to the ventilation device becoming a “black-box” for an attending physician. Furthermore, there is no strict taxonomy in the naming of ventilation modes and manufacturers often introduce different names for similar modes, which can lead to confusion. Further advances in the complex field of mechanical ventilation could benefit from a truly interdisciplinary approach combining the knowledge of medical professionals and biomedical engineers [8,35].

1.3. Simulation Techniques Utilized in PVA Studies

Studies evaluating patient–ventilator interactions (e.g., triggering functions) often utilize simulation techniques to represent the patient. There are various approaches to test and calibrate a mechanical ventilator. Several approaches target to simulate a passive lung with singular interchangeable properties, such as resistance and compliance. Some testing devices allow to also target patient ventilator interaction at specific boundary conditions (e.g., chosen ventilation modes, patient specific characteristics) [36,37,38].
Examples for the passive test systems are the IMT test lung (imtmedical, Buchs, Switzerland) ), representing a single compartment solution as well as the TTL lung simulator (Michigan Instruments, Kentwood, USA), allowing a two compartment simulation. The ASL500 breathing simulator (IngMar Medical, Pittsburgh, USA) is an example of a more sophisticated test system, targeting also the comparison of ventilation modes, which has been shown in several studies [39,40,41,42]. The fundamental disadvantage of such methods are the unchangeable maximum volume of the test lung, restricted possibility of simulating lung behavior and limited simulation of expiratory efforts [41].

1.4. Aim of the Work

This work aims to introduce a novel approach of simulating and evaluating disparities in fundamental ventilation characteristics using the electromechanical lung simulator xPULM™ [43]. The purpose of this study is to apply the xPULM™ as a simulation device for patient–ventilator interaction testing under laboratory conditions, as demonstrated in the Supplementary Video.
This simulator can be used as a hybrid simulation device. It provides the basic, passive lung simulation with interchangeable resistance and compliance characteristics on one side. Additionally, the xPULM™ is acting as a spontaneous actively breathing lung on the other side. For both modes, the lung volumes and the breathing pattern can be tailored in accordance to the individual simulation conditions (e.g., varying inspiratory and expiratory efforts). Moreover, the simulator at hand provides the option to easily exchange lung equivalent as well. This includes the use of latex bags of different sizes and properties, as well as the inclusion of artificial organoid structures or even the use of explanted lung tissue as the lung equivalent.
In this paper, patient–ventilator interactions are evaluated for two frequently used ventilation modes: (i) volume/assist-control ventilation mode and (ii) pressure support ventilation mode during spontaneous breathing simulation [44].

2. Material & Methods

The measurement setup consists of the electromechanical lung simulator xPULM™ connected with a standard single tube to a Bellavista™ 1000 mechanical ventilator (imtmedical, Switzerland) [45]. The simulator acts as a ventilated patient and replicates spontaneous sinusoidal breathing while supported by different modes of assisted ventilation. Frequently used volume/assist-control mode (V/A-C) ventilation mode and pressure support ventilation (PSV) modes were chosen in this study, as they account for 53% of ventilation modes used in mechanically ventilated and intubated patients [44].

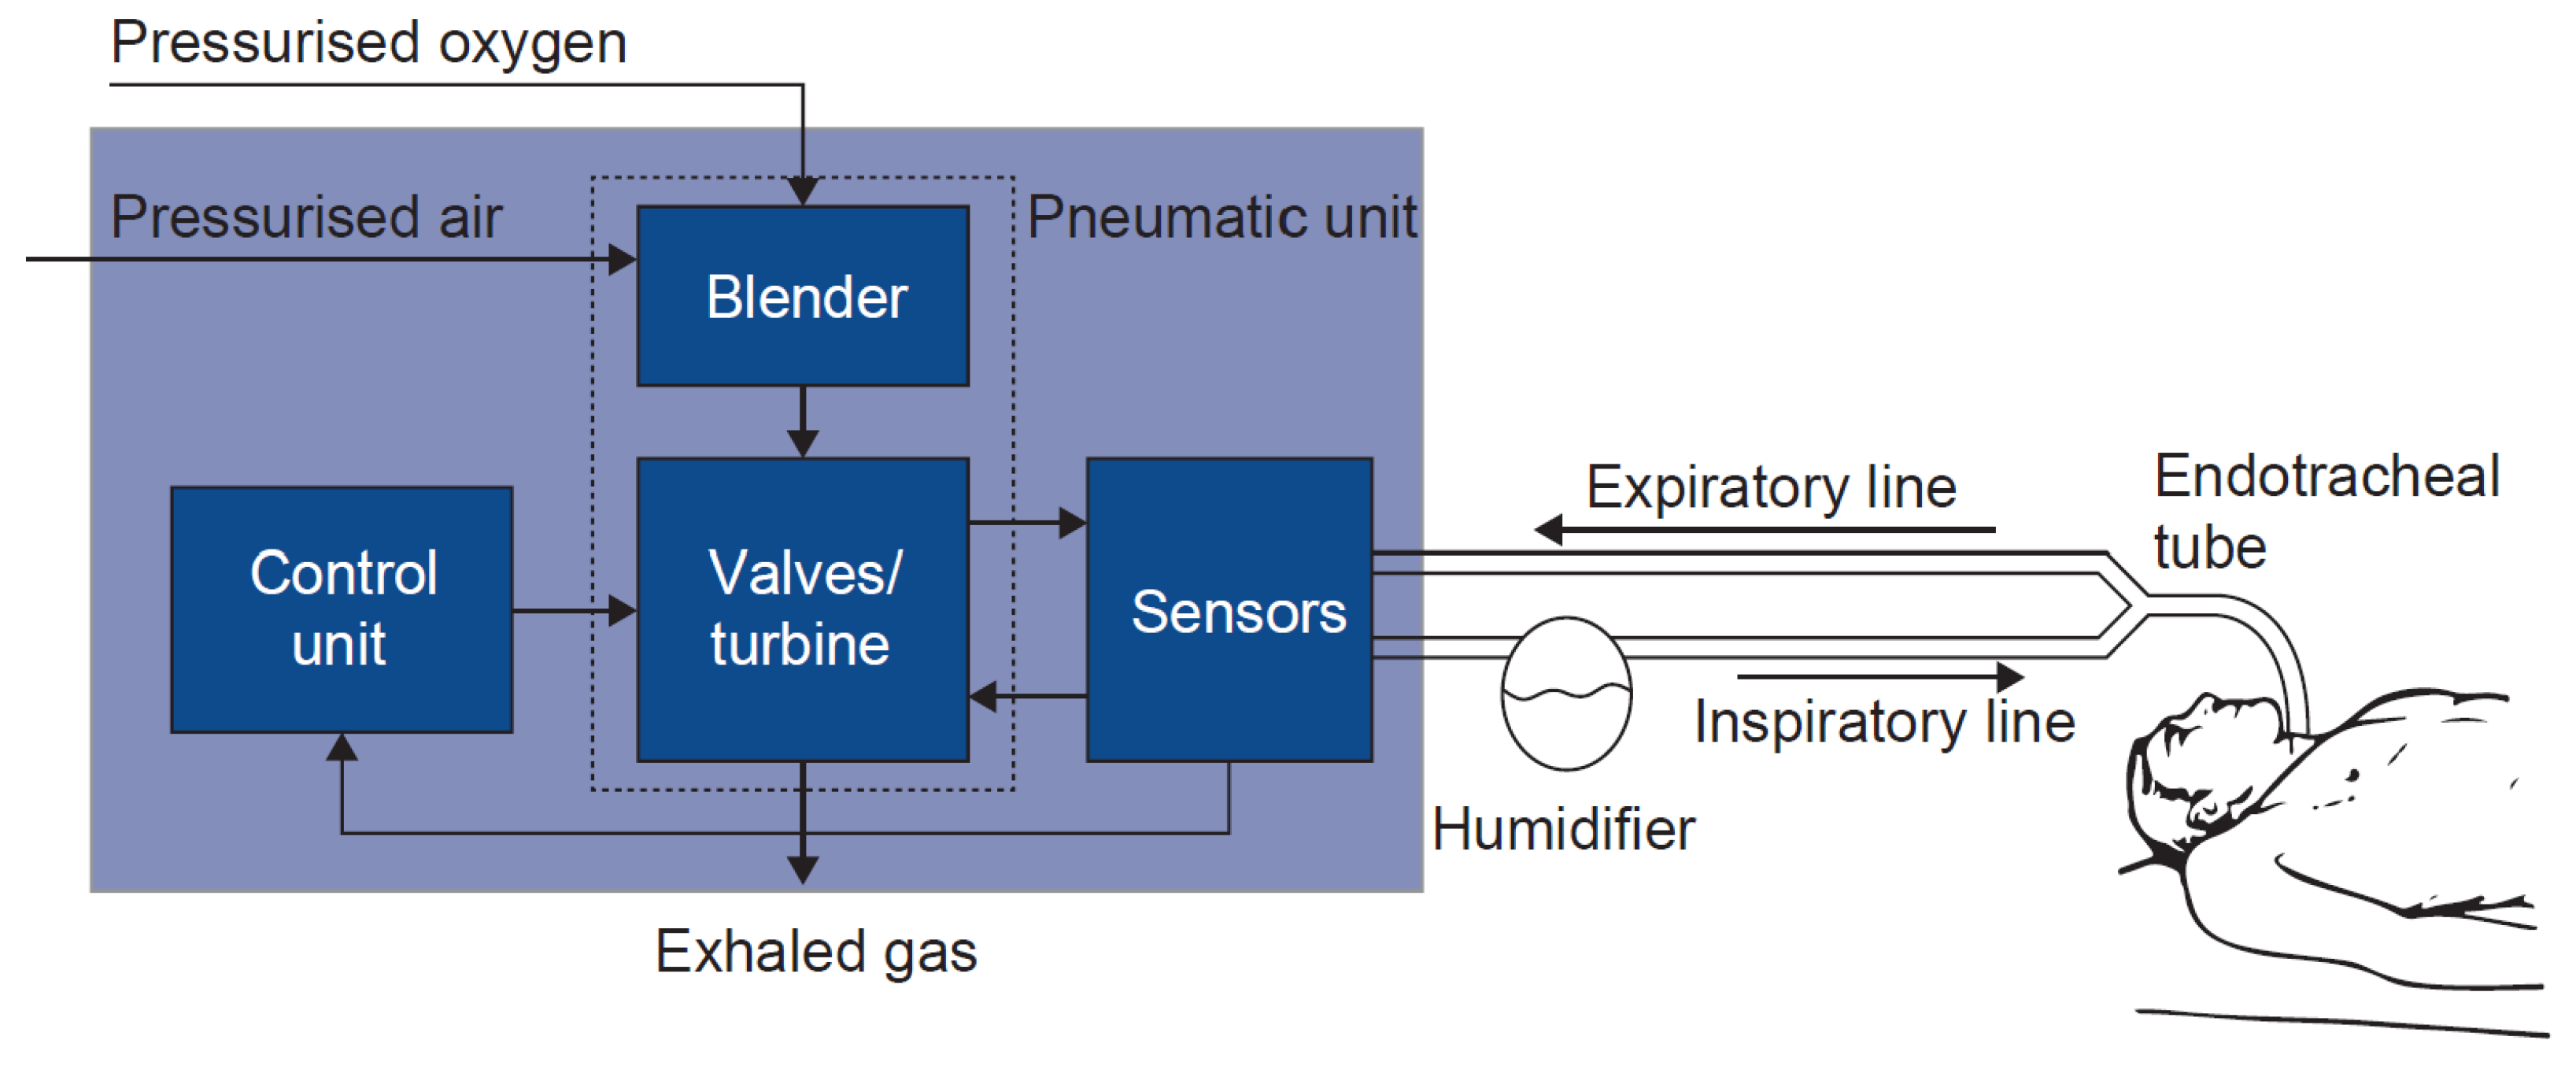
2.1. Electromechanical Lung Simulator xPULM™

The electromechanical lung simulator xPULM™ was developed to replicate anatomically as well as physiologically realistic breathing simulation. The basic mechanical setup of the xPULM™ consists of a thoracic chamber, housing a lung equivalent, and a connected bellows system acting as a respiratory pressure driving unit (Figure 2).
The system, as described by Pasteka et al. in [43], allows the use of simplified lung equivalents such as latex bags of different sizes, as well as the inclusion of a porcine lung. The breathing simulation is controlled by a real-time data acquisition and processing FPGA (field-programmable gate array) unit (National Instruments, Austin, USA). The opportunity to simulate active spontaneous breathing patterns of various parameters is the key for patient–ventilator interaction testing, presented in this work. In contrast to common ventilator testing setups and mechanical lung simulators, the xPULM™ simulator does not actively pump the gaseous volume into the lung equivalent. The driving power of the volume displacement during breathing simulation with xPULM™ is the pressure difference between the thoracic chamber and the surrounding atmosphere. Depending on the included lung equivalent, different lung capacities can be simulated. Furthermore, key parameters of the respiratory system such as airway resistance and lung compliance are adjustable. A resistance of the airways can be simulated by inclusion of an exchangeable resistive element. Both linear and parabolic resistances can be used in this setup. Additionally, lung equivalents from different materials can be included in the thoracic chamber representing various values of lung compliance [43].

2.2. Volume/Assist-Control Ventilation Mode (V/A-C)

Under volume-controlled ventilation, a predefined tidal volume (VT) is administered to the patient’s lung at a set rate. Therefore, the airway pressure depends on the tidal volume as well as lung compliance and resistance. Advantages of having VT as a control variable is a stable minute volume and lower initial flow rate than in pressure-controlled modes, depicted on Figure 3a. However, insufficient flow may increase incidence of patient–ventilator asynchronies. In the measurement setup, the VT is adapted to the currently measured tidal volume VTcurrent according to the Equation (1). Frequently used version of the volume-controlled ventilation is the volume/assist-control mode (V/A-C) where spontaneous respiratory efforts of the patient trigger controlled breaths during the ventilation cycles [45,46].
V Tcurrent = V Tinsp + V Texp 2

2.3. Pressure Support Ventilation Mode (PSV)

In pressure-controlled ventilation (Figure 3b), a pressure applied to the airway is the controlled variable of the system. Therefore, tidal volume depends on the inspiratory pressure as well as lung compliance and resistance. This mode of ventilation has been advocated to reduce barotrauma and to reduce the work of breathing. However, the delivered VT could be too high. For patients exhibiting spontaneous breathing activity, pressure support ventilation (PSV) has been the recommended option. The ventilation device delivers inspiratory pressure-supported breaths Psupp triggered on a synchronized basis [45,46].

2.4. Measurement Setup & Protocol

The measurement setup includes two main components: The xPULM™ simulator and the IMT Bellavista™ ventilator. Two 3 L latex bags with measured compliance Cstat = 49 mL/cmH2O and Cdyn = 47 mL/cmH2O are used as the equivalent of lungs. Additionally, parabolic airway resistance Rp20 (Michigan Instruments, USA) with characteristics similar to those of standard endotracheal tubes is included in the setup [47]. The pressure drop across the resistor Δ P can be expressed as:
Δ P = k 2 ρ ν ¯ 2
where ρ is the gas density, ν ¯ is the average gas velocity over the cross-section of the resistor and k is a resistive loss coefficient as stated by Martin et al. [39]. Calculated pressure drop and equivalent airway resistance values for flow rates in the measurement region are summarized in Table 1.
The xPULM™ simulator acts as a spontaneously breathing human with a breathing frequency of 12 bpm (breaths per minute) and a tidal volume (VT) of 500 mL. The apnea phase ( V ˙ = 0 L/min) is introduced after 60 s of sinusoidal spontaneous breathing simulation for a time interval of 60 s. After the apnea, active spontaneous breathing is resumed, with the same settings, again for a duration of 60 s. This stepwise procedure introduces the necessary triggers for the interaction between the mechanical ventilator and the lung simulator. Both devices are started consecutively. This maneuver represents patients suffering from severe cases of diseases accompanied by respiratory failure. Intervention with mechanical ventilation is required as the disease progresses. The scenario was inspired by the cases presented by Williams et al. [48].
The mechanical ventilator was operated in two ventilation modes: volume assist-control mode and pressure support ventilation mode. The measurement protocol with the apnea interval was used in both cases. The measurements were repeated three times. The V-A/C mode is operated with the following settings: VT = 500 mL, PEEP = 0 cmH2O, f = 12 bpm, Tinsp = 1.7 s, flowtrigg = 2.0 L/min. The PSV mode is operated with the following settings: Psupp = 10 cmH2O, PEEP = 0 cmH2O. If apnea occurs, the backup ventilation mode is switched on with f = 12 bpm, TinspMax = 1.7 s, Flowtrigg = 2.0 L/min. Both measurements were performed under laboratory conditions (T = 21.6 °C, RH = 52% Patm = 1030 hPa) and with an ambient air gas mixture (21% O2, 78% N and 1% trace gases).

2.5. Asynchrony Index

The asynchrony index (AI) for each ventilation mode is calculated across all measurement trials as a number of asynchrony events (NAE)/total respiratory rate (RRTotal) × 100 [22]. The identification of asynchronies has been performed by combining several methods. First, abrupt changes in flow or pressure were identified. Second, the shape of the curves was compared to literature-based references, as depicted in Figure 3. Additionally, the recorded waveforms were evaluated by a clinician with a focus on intensive care medicine.

2.6. Statistics

Results were analyzed with nonparametric requirements, as the variance differences for the compared sample groups were significantly high (failed to prove no differences in variances with the F-test). Significance in peak inspiratory pressure (PIP) and peak expiratory flow (PEF) between synchronous and asynchronous phases during the VAC mode was determined using the Wilcoxon signed-rank test. Additionally, significance in delivered volume between a sinusoidal spontaneous breathing phase and apnea phase during the PSV mode was determined using the Wilcoxon signed-rank test. Statistical significance was set at p < 0.01.

3. Results

The patient–ventilator interaction measurements are separated into two phases and are investigated under two different ventilator modes. The phases are divided into initial spontaneous sinusoidal breathing (SB) performed by the xPULM™ simulator (Phase 1), with simulated apnea (SA) phase in between where the electromechanical simulator is not operating (Phase 2). The tracings of flow, volume and pressure at the airways showing the interactions between the xPULM™ simulator and the mechanical ventilator for both phases are depicted in Figure 4 and Figure 5. The transitions between phases are characterized by rapid changes of airway pressure and flow. For each phase, a total of 36 breathing cycles were analyzed.

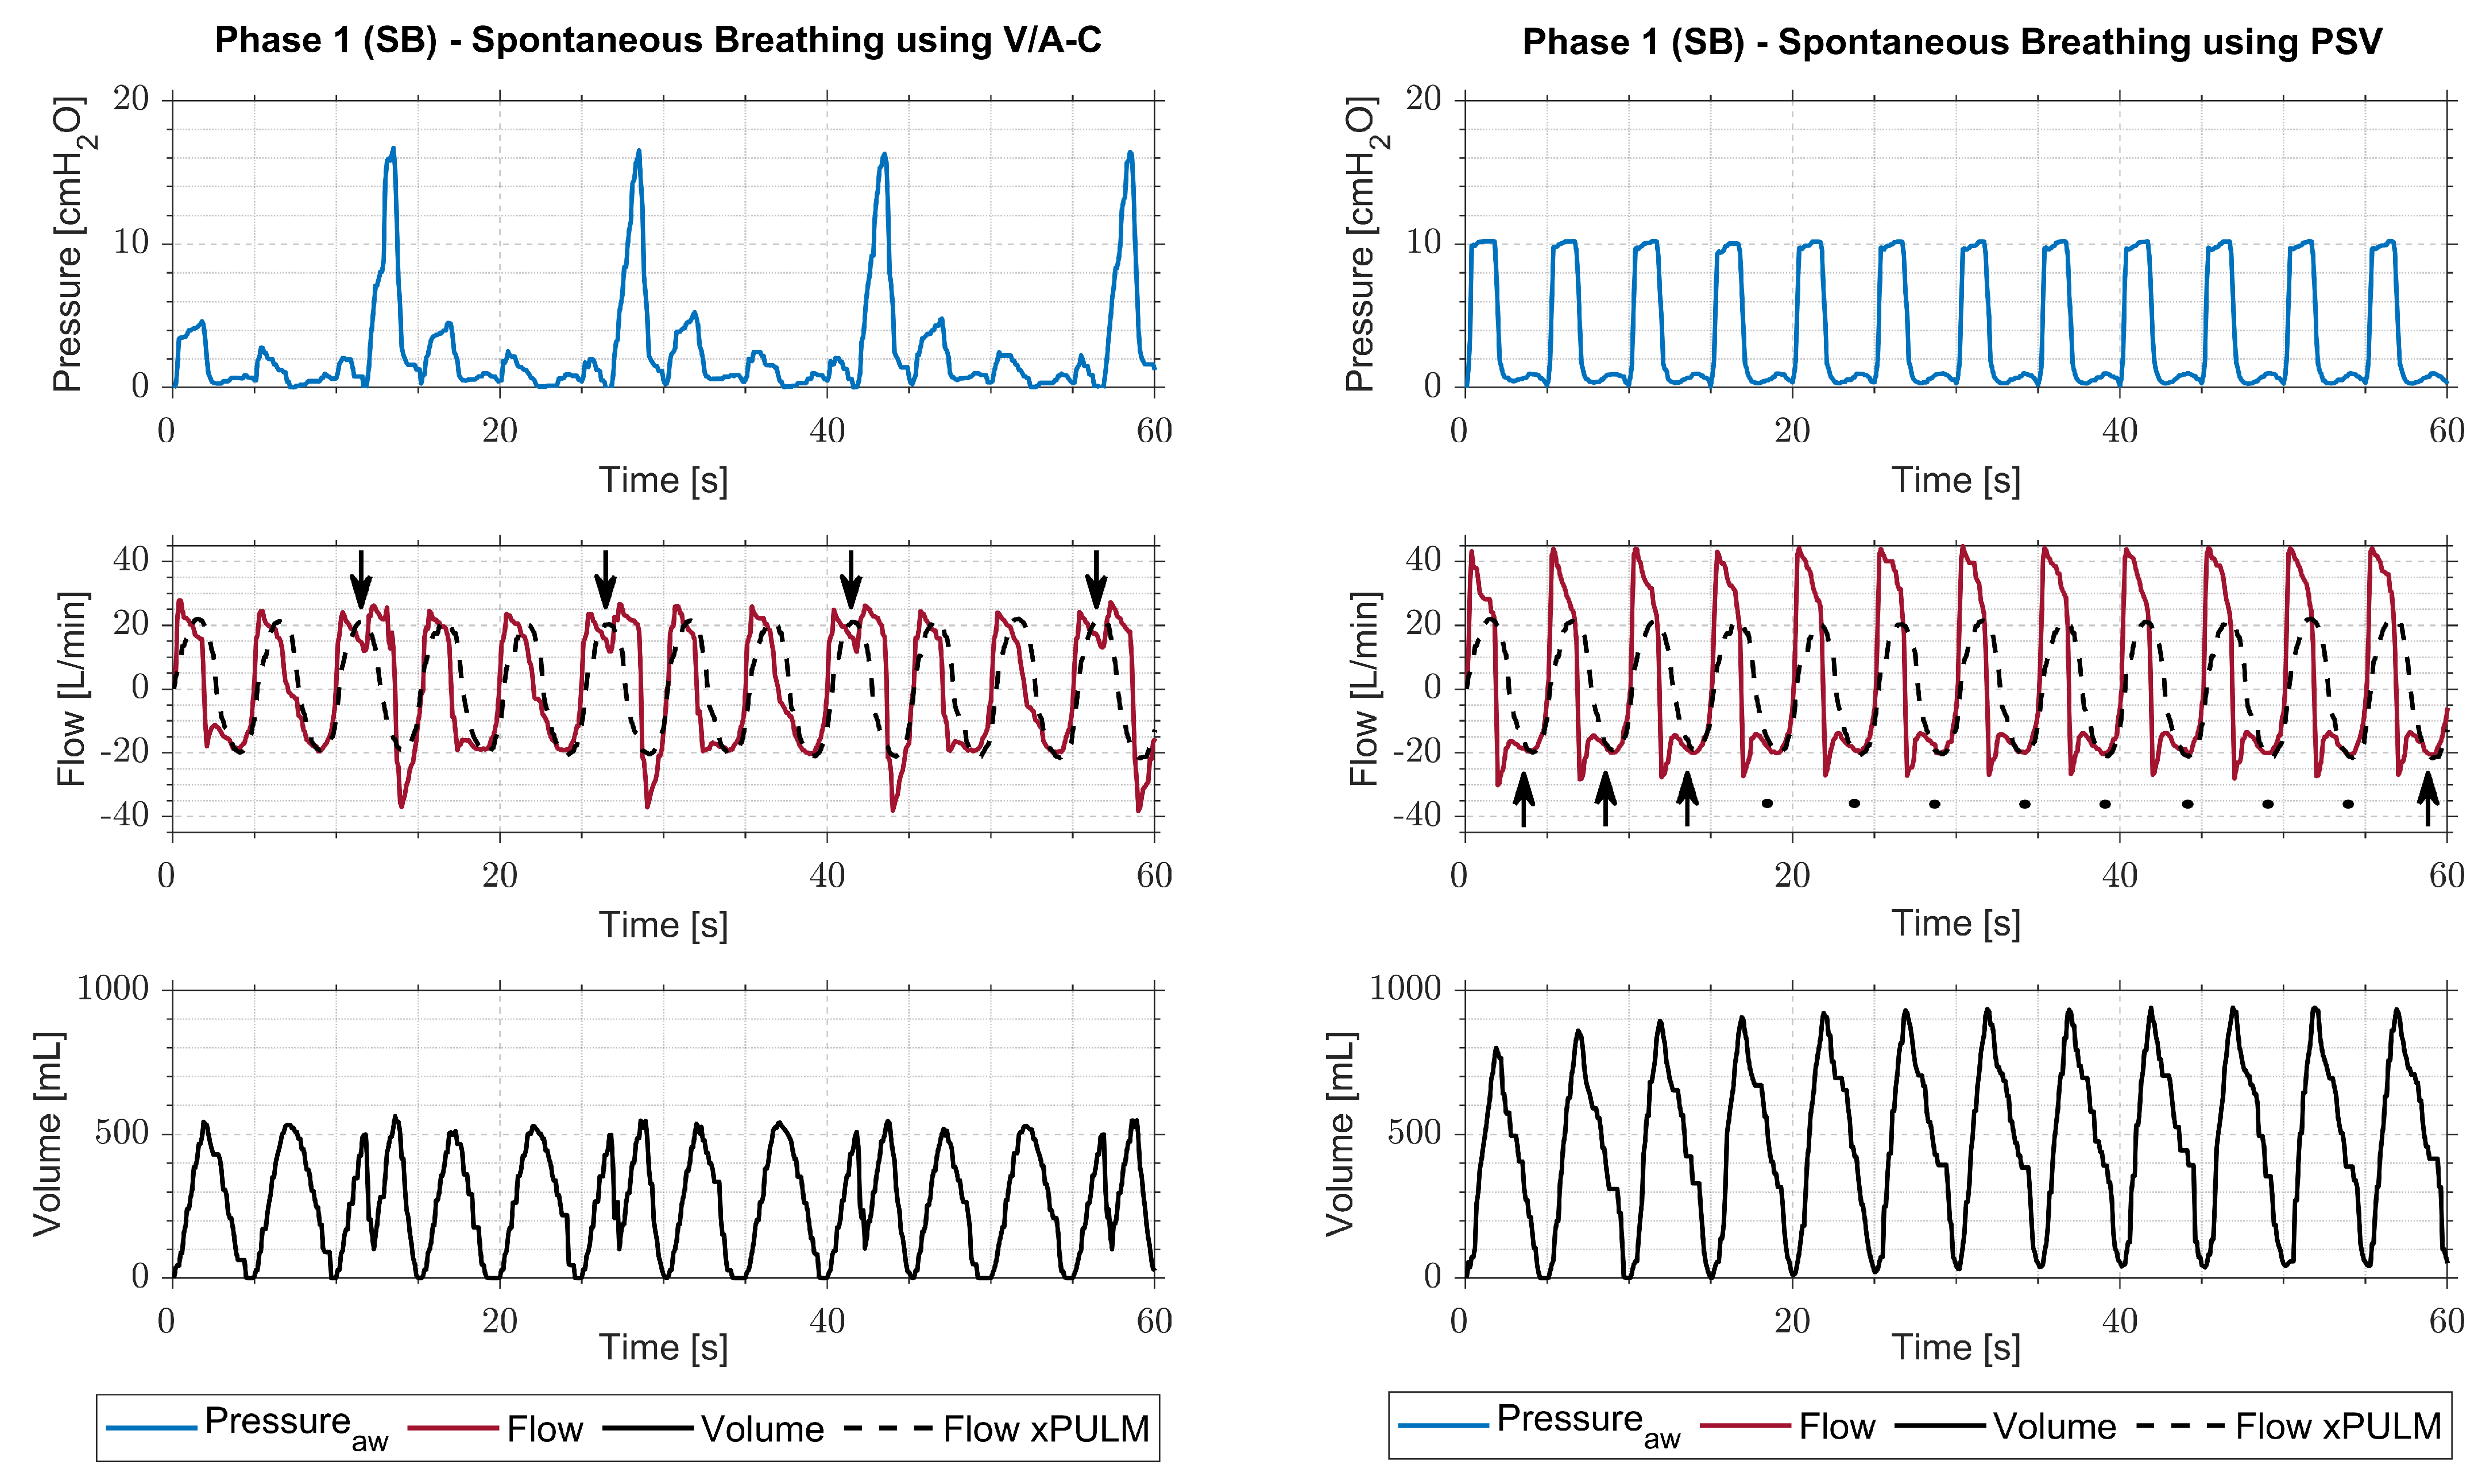
3.1. Measurements with V/A-C Ventilation Mode

The measurements of the xPULM™ simulator and the mechanical ventilator operating in V/A-C mode are shown in Figure 4. During Phase 1, the xPULM™ is actively breathing while the mechanical ventilator is operating for a period of 60 s. A forced second inhalation cycle is triggered (double triggering) by the mechanical ventilator every third breathing cycle, leading to an abrupt increase of pressure, which is followed by a higher exhalation flow in comparison to the other breathing cycles. With a total amount of 4 asynchronies during the observed time span, the asynchrony index for both phases in V/A-C mode is 16.67%. In the Phase 2, the electromechanical simulator was paused to simulate apnea with the mechanical ventilator taking over the entire breathing effort. Steady breathing cycles can be seen with maximum pressure peaks at the end of the inhalation cycle. To reach the same flow, the necessary pressure exerted by the mechanical ventilator doubles in comparison to the Phase 1.

3.2. Measurements with PSV Ventilation Mode

In Figure 5, the measurement of interactions between simulated spontaneous breathing and the PSV mode of the mechanical ventilator are depicted. Similarly to the V/A-C mode, the mechanical ventilator is not fully in phase with the lung simulator. The inspiratory time of the lung simulator does not surpass the set maximum inspiratory time threshold of the PSV mode, leading to an intended interaction for all phases during the measurement. However, the delivered peak volume during the active spontaneous sinusoidal breathing Phases 1 increases significantly (917.09 ± 45.74 vs. 468.40 ± 31.79 mL, p < 0.01) compared to apnea Phase 2. With a total amount of 12 asynchronies during the observed time span, the asynchrony index for both phases in PSV mode is 50%. The effect of asynchronies can be seen in the increased inspiratory flow of both the lung simulator and mechanical ventilator.

3.3. Comparison of Measurements with V/A-C and PSV

The comparison of simulation measurements showing patient–ventilator interactions using different modes of ventilation is summarized in Table 2. During V/A-C mode, the results exhibit high standard deviations. This applies to σ FLOW for inhalation and exhalation peak flow as well as σ PRESSURE for inhalation peak pressure in both spontaneous breathing phases. The standard deviation for exhalation peak pressure can be neglected for both modes as the PEEP was set to zero for both modes and minor oscillations around zero for dynamic systems are expected. The high standard deviation outcome for V/A-C mode during spontaneous breathing is linked to double triggering, which can be seen in Figure 4 for every third breathing cycle. During simulated apnea in V/A-C mode, the standard deviation σ FLOW lies below 2.17% for inhalation and exhalation peak flow and σ PRESSURE lies below 4.42% for inhalation peak pressure. For the PSV mode, σ FLOW lies below 3.53% for inhalation and exhalation peak flow and σ PRESSURE lies below 0.41% for inhalation peak pressure when considering both phases.

3.4. The V/A-C Asynchronous Events

The maximum inhalation and exhalation peaks for flow and pressure values were analyzed for the breathing cycles where the lung simulator interacts with the mechanical ventilator in phase (synchronous) as shown in Table 3. Additionally, the values were calculated for breathing cycles where the lung simulator and the mechanical ventilator are out of phase (asynchronous), which is characterized by the occurrence of double triggering. This asynchrony caused a significant increase of peak inspiratory pressure (7.96 ± 6.38 vs. 11.09 ± 0.49 cmH2O, p < 0.01)) and peak expiratory flow (−25.57 ± 8.93 vs. 32.90 ± 0.54 L/min, p < 0.01) when compared to synchronous phases of the breathing simulation. The differentiation resulted in a decrease of σ FLOW and σ PRESSURE during synchronous and asynchronous simulator–ventilator interaction in comparison to the nondifferentiated event analysis (see Table 2 and Table 3).

3.5. The PSV Asynchronous Events

In Figure 4 (PSV mode, Phase 1), the arrows depicted in the flow graph are pointing to the initiation of trigger asynchrony events. Rises in flow, being out of phase with simulator’s flow pattern, can be observed during exhalation phase. The asynchronous events occur during every exhalation phase. In this specific case, the flow is set as trigger parameter for the PSV measurements. The simulator’s expiratory time is delayed in comparison to the ventilator’s calculated expiratory time. The resulting rise in flow, caused by the simulator–ventilator interaction, is not sufficient to start the inspiration phase, which ultimately leads to premature cycling.

3.6. Pressure Changes in the Thoracic Chamber of the xPULM™ 

Recordings of pressure changes inside the thoracic chamber of the xPULM (hereafter referred to as a thoracic pressure), depicted in Figure 6, present an alternative opportunity to further explore the effect of PVA on patients and operation of mechanical ventilators. Automatic adjustments of ventilator’s control algorithm in response to the asynchronous events are evident.
Changes in the driving pressure exerted by the ventilator to deliver the predefined tidal volume in V/A-C mode can be observed prior to the asynchronous event (double triggering). Thoracic pressure applied during first breath following the double triggering event is significantly lower to SA phase. This is partially compensated by the increase of driving pressure during the second breath. However, in the course of the third breath, double triggering occurs and the entire process repeats as shown in Figure 6 (left).
The effect of premature cycling during PSV ventilation are equivalently reflected in the changes of the thoracic pressure. This trigger asynchrony causes an increase of the delivered tidal volume and manifests as a secondary peak in the thoracic pressure recordings Figure 6 (right).
The changes in peak pressure (>4 cmH2O, left) and occurrence of premature cycling at every breath (right) in Figure 6 are complementary to the data set recorded by the ventilator and shown in Figure 4 and Figure 5 and indicate the occurrence of asynchronous events during Phase 1 simulations.

4. Discussion

Thorough testing of patient–ventilator interactions is necessary to ensure that patient demands during all phases of mechanical ventilation are met. The occurrence of asynchronies has been linked to high load on ventilation muscles and causes overload, fatigue or even injury [13,25,26]. Modern approaches are needed to capture the clinical environment with higher fidelity. The xPULM™ simulator reliably replicates sinusoidal human breathing with adjustable waveform parameters (e.g., tidal volume, frequency) as shown in our previous work [43]. The lung simulator, therefore, seems like a suitable candidate to expand setups for patient–ventilator interaction testing and to aid the development of modern ventilation modes in the future. This especially applies for exploring patient ventilation interactions under various dynamic conditions (changing breathing patterns and timing of respiration phases) and different pulmonary parameters (airway resistance and lung compliance). The focus of this paper is to introduce this simulation approach and to examine changes of ventilation during widely used V/A-C and PSV ventilation modes. The measurement setup simulates a physiological respiratory system situation. Airway resistance is represented by the inclusion of an interchangeable pneumatic resistor to further simulate realistic airway behavior. The resistors used allow to reflect different physiological and pathological conditions of the airways. The same applies to the used lung equivalent. The results show occurrences of asynchronies during V/A-C and PSV ventilation modes with a simulated patient during spontaneous breathing and apnea periods.

4.1. Influences of V/A-C and PSV Ventilation Mode

The first trial show the interaction with the simulated patient during the V/A-C mode, which is based on a continuous mandatory ventilation mode. In this case, simulated patient’s breathing frequency is not in phase with the ventilator’s frequency representing realistic conditions. Patient–ventilator asynchrony can be identified and manifests as a forced second inhalation every third breathing cycle (double triggering). This event represents a force working against the effort of a spontaneous breathing patient. The mechanical ventilator intervenes despite the patient being sufficiently ventilated. However, this is in concordance with the principle of the V/A-C ventilation mode where the patient always receives at least the set tidal volume. The forced second inhalation, in general, occurs when the ventilator inspiratory time is shorter than the patient’s inspiratory time. The results are corresponding with clinical findings reported by Thille et al. [22].
The second trial demonstrate the influence of PSV ventilation mode during simulations of spontaneous breathing and apnea phases. Mechanical ventilation in PSV mode is supportive but leads to an excessively high peak pressure during spontaneous breathing phases caused by premature cycling. The volume supplied by the mechanical ventilator is compounded upon the tidal volume delivered by spontaneous breathing. Consequently, the total volume during SB phases doubles in comparison to the apnea phases. This leads to insufficient ventilation during the apnea phases.
Furthermore, the pressure changes inside the thoracic chamber of the xPULM™, which are complementary to the data set recorded by the ventilator, have been presented. This provides additional information about how asynchronies influence the conditions in the thoracic chamber in comparison to synchronous mechanical ventilation. These pressure changes in the thoracic chamber partially reflect the interplay between changing compliance of the lung, the chest wall mechanics and the varying respiratory muscle effort (PMUS), which is at the heart of most clinically relevant PVA.

4.2. Limitations of the Approach

The primary limitation of the presented approach and other studies using test lungs or lung simulators is the principal inability of capturing the full complexity of patient–ventilator interactions [38,42]. This raises the question of medical relevance. The ventilation parameters such as flow, average peak pressure and plateau pressure, observed at bed-site, can be higher than was simulated in this work. Nevertheless, the presented results serve as proof of concept and set the basis for scaleable experiments.
Typically, an ASL500 breathing simulator (IngMar Medical, USA) or Michigan Instruments double compartment test lung (Michigan instruments, USA) is used to represent the behavior of a patient [36,37,38,39,40,41,42]. However, such models capture lung properties and expiratory efforts only to a limited extent [37,38,39,40,41,42]. The lung simulator xPULM™ used in this paper can represent various lung properties (compliance, volume, inner structure) by the inclusion of different lung equivalents. In this study, two 3L latex bags have been used and have to be seen as limiting realistic measurements due to their missing inner structure and their specific elasticity characteristics. Moreover, this study is limited by strictly regular, sinusoidal simulation of the patient’s breathing and the use of only one mechanical ventilator operated in two ventilation modes.

4.3. Further Work

The modes and techniques used during mechanical ventilation are mature and cover a wide spectrum of cases encountered in the clinical environment. Despite this fact, there is a room for further improvements and innovations. One of the opportunities is to simulate patients behavior with high fidelity of anatomical and physiological characteristics using lung simulators. Breathing simulations with a primed porcine lung was shown to be feasible and representative of anatomical and physiological situations in previous work [43]. Further research will, therefore, aim to include primed porcine lungs obtained from the slaughterhouse process to the xPULM™ ventilator testing setup. Aside from the inclusion of advanced lung equivalents, further studies will target diverse asynchronies associated with various ventilation modes and the corresponding set of ventilation parameters.
Additionally, rapidly manufactured ventilator systems are being developed to cover potential shortages of mechanical ventilators during an emergency. Such solutions should be rigorously tested due to the cyclical occurrence of events triggering such demands (e.g., viral pandemic). Interactions of rapidly manufactured ventilators could be tested using the lung simulator xPULM™. Comprehensive evaluation could be conducted, helping to identify strengths and weaknesses of different approaches under realistic scenarios.

5. Conclusions

In this paper, an approach of testing patient–ventilator interactions using the electromechanical lung simulator xPULM™ is introduced. The simulator is used to replicate a spontaneously breathing patient under mechanical ventilation. Overall, the presented approach demonstrates the possibility of simulating and evaluating disparities in fundamental ventilation characteristics under V/A-C and PSV ventilation modes. Due to the versatility of the used lung simulator, dynamic changes in breathing patterns can be simulated. This method approximates the clinical situation and can help to identify, investigate and test undesired patient–ventilation interactions under laboratory conditions. Rapidly manufactured ventilator systems could also be tested using this approach.

Supplementary Materials

The following are available online at https://www.mdpi.com/article/10.3390/app11093745/s1, Video S1.

Author Contributions

Conceptualization, R.P., M.F. and J.P.S.d.C.; methodology, R.P., M.F. and J.P.S.d.C.; formal analysis, R.P. and J.P.S.d.C.; investigation, R.P.; data curation, R.P., J.P.S.d.C.; writing—original draft preparation, R.P.; writing—review and editing, R.P., J.P.S.d.C., M.F., N.B. and R.K.; visualization, R.P.; supervision, M.F., N.B. and R.K. All authors have read and agreed to the published version of the manuscript.

Funding

This research received no external funding.

Institutional Review Board Statement

Not applicable.

Informed Consent Statement

Not applicable.

Data Availability Statement

Measurement data are available upon reasonable request.

Acknowledgments

Open Access Funding by the University of Applied Sciences Technikum Wien.

Conflicts of Interest

The authors declare no conflict of interest.

Abbreviations

The following abbreviations are used in this manuscript:
AIAsynchrony index
COPDChronic obstructive pulmonary disease
FPGAField-programmable gate array
NAVANeurally adjusted ventilation assist
PEEPPositive end expiratory pressure
PEFPeak expiratory flow
PIPPeak inspiratory pressure
PSVPressure support ventilation
PVAPatient–ventilator asynchrony
V/A-CVolume assist-controlled

References

  1. Scala, R.; Heunks, L. Highlights in acute respiratory failure. Eur. Respir. Rev. 2018, 27. [Google Scholar] [CrossRef] [PubMed]
  2. Roussos, C.; Koutsoukou, A. Respiratory failure. Eur. Respir. J. 2003, 22, 3s–14s. [Google Scholar] [CrossRef] [PubMed] [Green Version]
  3. Schmidt, G.A. Mechanical Ventilation. In Acute Respiratory Distress Syndrome: A Comprehensive Clinical Approach; Russell, J.A., Walley, K.R., Eds.; Cambridge University Press: Cambridge, UK, 1999; pp. 139–162. [Google Scholar] [CrossRef]
  4. Marini, J.J. Mechanical ventilation: Past lessons and the near future. Crit. Care 2013, 17, S1. [Google Scholar] [CrossRef] [PubMed] [Green Version]
  5. Pham, T.; Brochard, L.J.; Slutsky, A.S. Mechanical Ventilation: State of the Art. Mayo Clin. Proc. 2017. [Google Scholar] [CrossRef] [PubMed] [Green Version]
  6. Goligher, E.C.; Ferguson, N.D.; Brochard, L.J. Clinical challenges in mechanical ventilation. Lancet 2016. [Google Scholar] [CrossRef]
  7. Haitsma, J.J. Physiology of Mechanical Ventilation. Criti. Care Clin. 2007. [Google Scholar] [CrossRef]
  8. Dellaca, R.L.; Veneroni, C.; Farre, R. Trends in mechanical ventilation: Are we ventilating our patients in the best possible way? Breathe 2017, 13, 84–98. [Google Scholar] [CrossRef]
  9. Chatburn, R.L. Understanding mechanical ventilators. Expert Rev. Respir. Med. 2010, 4, 809–819. [Google Scholar] [CrossRef]
  10. Kacmarek, R.M.; Stoller, J.K.; Heuer, A. Egan’s Fundamentals of Respiratory Care; Elsevier: Amsterdam, The Netherlands, 2013. [Google Scholar]
  11. Kacmarek, R.M.; Pirrone, M.; Berra, L. Assisted mechanical ventilation: The future is now! BMC Anesthesiol. 2015. [CrossRef] [Green Version]
  12. Kondili, E.; Prinianakis, G.; Georgopoulos, D. Patient-ventilator interaction. Br. J. Anaesth. 2003, 91, 106–119. [Google Scholar] [CrossRef] [Green Version]
  13. De Haro, C.; Sarlabous, L.; Esperanza, J.; Magrans, R.; Blanch, L. ERS Practical Handbook of Invasive Mechanical Ventilation; Chapter Monitoring patient-ventilator, interaction; Leo Heunks, M.J.S., Ed.; The European Respiratory Society: Lausanne, Switzerland, 2019. [Google Scholar] [CrossRef]
  14. Estrada, L.; Torres, A.; Sarlabous, L.; Jane, R. Onset and Offset Estimation of the Neural Inspiratory Time in Surface Diaphragm Electromyography: A Pilot Study in Healthy Subjects. IEEE J. Biomed. Health Inform. 2018, 22, 67–76. [Google Scholar] [CrossRef] [PubMed]
  15. Zhang, L.; Mao, K.; Duan, K.; Fang, S.; Lu, Y.; Gong, Q.; Lu, F.; Jiang, Y.; Jiang, L.; Fang, W.; et al. Detection of patient-ventilator asynchrony from mechanical ventilation waveforms using a two-layer long short-term memory neural network. Comput. Biol. Med. 2020, 120, 103721. [Google Scholar] [CrossRef] [PubMed]
  16. Perchiazzi, G.; Högman, M.; Rylander, C.; Giuliani, R.; Fiore, T.; Hedenstierna, G. Assessment of respiratory system mechanics by artificial neural networks: An exploratory study. J. Appl. Physiol. 2001, 90, 1817–1824. [Google Scholar] [CrossRef] [PubMed]
  17. Parthasarathy, S.; Jubran, A.; Tobin, M.J. Assessment of neural inspiratory time in ventilator-supported patients. Am. J. Respir. Crit. Care Med. 2000, 162, 546–552. [Google Scholar] [CrossRef] [Green Version]
  18. Subirà, C.; de Haro, C.; Magrans, R.; Fernández, R.; Blanch, L. Minimizing asynchronies in mechanical ventilation: Current and future trends. Respir. Care 2018, 63, 464–478. [Google Scholar] [CrossRef] [PubMed] [Green Version]
  19. Vignaux, L.; Vargas, F.; Roeseler, J.; Tassaux, D.; Thille, A.W.; Kossowsky, M.P.; Brochard, L.; Jolliet, P. Patient-ventilator asynchrony during non-invasive ventilation for acute respiratory failure: A multicenter study. Intens. Care Med. 2009, 35, 840–846. [Google Scholar] [CrossRef] [PubMed]
  20. Blanch, L.; Villagra, A.; Sales, B.; Montanya, J.; Lucangelo, U.; Luján, M.; García-Esquirol, O.; Chacón, E.; Estruga, A.; Oliva, J.C.; et al. Asynchronies during mechanical ventilation are associated with mortality. Intens. Care Med. 2015, 41, 633–641. [Google Scholar] [CrossRef] [Green Version]
  21. Gonzalez-Bermejo, J.; Janssens, J.P.; Rabec, C.; Perrin, C.; Lofaso, F.; Langevin, B.; Carlucci, A.; Lujan, M. Framework for patient-ventilator asynchrony during long-term non-invasive ventilation. Thorax 2019, 74, 715–717. [Google Scholar] [CrossRef]
  22. Thille, A.W.; Rodriguez, P.; Cabello, B.; Lellouche, F.; Brochard, L. Patient-ventilator asynchrony during assisted mechanical ventilation. Intens. Care Med. 2006, 32, 1515–1522. [Google Scholar] [CrossRef]
  23. Vaporidi, K.; Babalis, D.; Chytas, A.; Lilitsis, E.; Kondili, E.; Amargianitakis, V.; Chouvarda, I.; Maglaveras, N.; Georgopoulos, D. Clusters of ineffective efforts during mechanical ventilation: Impact on outcome. Intens. Care Med. 2017, 43, 184–191. [Google Scholar] [CrossRef] [PubMed]
  24. See, K.C.; Sahagun, J.; Taculod, J. Defining patient–ventilator asynchrony severity according to recurrence. Intens. Care Med. 2020, 10. [Google Scholar] [CrossRef] [PubMed]
  25. De Haro, C.; Ochagavia, A.; López-Aguilar, J.; Fernandez-Gonzalo, S.; Navarra-Ventura, G.; Magrans, R.; Montanyà, J.; Blanch, L. Patient-ventilator asynchronies during mechanical ventilation: Current knowledge and research priorities. Intens. Care Med. Experiment. 2019, 7. [Google Scholar] [CrossRef] [PubMed]
  26. Gattinoni, L.; Marini, J.J.; Collino, F.; Maiolo, G.; Rapetti, F.; Tonetti, T.; Vasques, F.; Quintel, M. The future of mechanical ventilation: Lessons from the present and the past. Crit. Care 2017. [Google Scholar] [CrossRef] [PubMed]
  27. Beitler, J.R.; Sands, S.A.; Loring, S.H.; Owens, R.L.; Malhotra, A.; Spragg, R.G.; Matthay, M.A.; Thompson, B.T.; Talmor, D. Quantifying unintended exposure to high tidal volumes from breath stacking dyssynchrony in ARDS: The BREATHE criteria. Intens. Care Med. 2016, 42, 1427–1436. [Google Scholar] [CrossRef] [Green Version]
  28. Lamouret, O.; Crognier, L.; Bounes, F.V.; Conil, J.M.; Dilasser, C.; Raimondi, T.; Ruiz, S.; Rouget, A.; Delmas, C.; Seguin, T.; et al. Neurally adjusted ventilatory assist (NAVA) versus pressure support ventilation: Patient-ventilator interaction during invasive ventilation delivered by tracheostomy. Crit. Care 2019, 23, 2. [Google Scholar] [CrossRef] [Green Version]
  29. Chen, C.; Wen, T.; Liao, W. Neurally adjusted ventilatory assist versus pressure support ventilation in patient-ventilator interaction and clinical outcomes: A meta-analysis of clinical trials. Ann. Translat. Med. 2019, 7, 382. [Google Scholar] [CrossRef]
  30. Yonis, H.; Crognier, L.; Conil, J.M.; Serres, I.; Rouget, A.; Virtos, M.; Cougot, P.; Minville, V.; Fourcade, O.; Georges, B. Patient-ventilator synchrony in Neurally Adjusted Ventilatory Assist (NAVA) and Pressure Support Ventilation (PSV): A prospective observational study. BMC Anesthesiol. 2015, 15. [Google Scholar] [CrossRef] [Green Version]
  31. Bertrand, P.M.; Futier, E.; Coisel, Y.; Matecki, S.; Jaber, S.; Constantin, J.M. Neurally adjusted ventilatory assist vs pressure support ventilation for noninvasive ventilation during acute respiratory failure: A crossover physiologic study. Chest 2013, 143, 30–36. [Google Scholar] [CrossRef]
  32. Calfee, C.S.; Matthay, M.A. Recent advances in mechanical ventilation. Am. J. Med. 2005. [Google Scholar] [CrossRef]
  33. Grieco, D.L.; Bitondo, M.M.; Aguirre-Bermeo, H.; Italiano, S.; Idone, F.A.; Moccaldo, A.; Santantonio, M.T.; Eleuteri, D.; Antonelli, M.; Mancebo, J.; et al. Patient-ventilator interaction with conventional and automated management of pressure support during difficult weaning from mechanical ventilation. J. Crit. Care 2018, 48, 203–210. [Google Scholar] [CrossRef]
  34. Gutierrez, G. Artificial Intelligence in the Intensive Care Unit. Crit. Care 2020. [Google Scholar] [CrossRef] [Green Version]
  35. Chatburn, R.L.; Mireles-Cabodevila, E. Closed-loop control of mechanical ventilation: Description and classification of targeting schemes. Respir. Care 2011, 56, 85–98. [Google Scholar] [CrossRef] [Green Version]
  36. Marjanovic, N.S.; De Simone, A.; Jegou, G.; L’her, E. A new global and comprehensive model for ICU ventilator performances evaluation. Ann. Intens. Care 2017, 7, 68. [Google Scholar] [CrossRef] [Green Version]
  37. Garnier, M.; Quesnel, C.; Fulgencio, J.P.; Degrain, M.; Carteaux, G.; Bonnet, F.; Similowski, T.; Demoule, A. Multifaceted bench comparative evaluation of latest intensive care unit ventilators. Br. J. Anaesth. 2015, 115, 89–98. [Google Scholar] [CrossRef] [Green Version]
  38. L’Her, E.; Roy, A.; Marjanovic, N. Bench-test comparison of 26 emergency and transport ventilators. Crit. Care 2014, 18, 1–14. [Google Scholar] [CrossRef] [PubMed] [Green Version]
  39. Martin, A.R.; Katz, I.M.; Jenöfi, K.; Caillibotte, G.; Brochard, L.; Texereau, J. Bench experiments comparing simulated inspiratory effort when breathing helium-oxygen mixtures to that during positive pressure support with air. BMC Pulmon. Med. 2012, 12, 62. [Google Scholar] [CrossRef] [PubMed] [Green Version]
  40. Thille, A.W.; Lyazidi, A.; Richard, J.C.M.; Galia, F.; Brochard, L. A bench study of intensive-care-unit ventilators: New versus old and turbine-based versus compressed gas-based ventilators. Intens. Care Med. 2009, 35, 1368–1376. [Google Scholar] [CrossRef] [PubMed] [Green Version]
  41. Ferreira, J.C.; Chipman, D.W.; Kacmarek, R.M. Trigger performance of mid-level ICU mechanical ventilators during assisted ventilation: A bench study. Intens. Care Med. 2008, 34, 1669–1675. [Google Scholar] [CrossRef]
  42. Richard, J.C.; Carlucci, A.; Breton, L.; Langlais, N.; Jaber, S.; Maggiore, S.; Fougère, S.; Harf, A.; Brochard, L. Bench testing of pressure support ventilation with three different generations of ventilators. Intens. Care Med. 2002, 28, 1049–1057. [Google Scholar] [CrossRef]
  43. Pasteka, R.; Forjan, M.; Sauermann, S.; Drauschke, A. Electro-mechanical Lung Simulator Using Polymer and Organic Human Lung Equivalents for Realistic Breathing Simulation. Sci. Rep. 2019, 9, 1–12. [Google Scholar] [CrossRef]
  44. Metnitz, P.G.; Metnitz, B.; Moreno, R.P.; Bauer, P.; Sorbo, L.D.; Hoermann, C.; De Carvalho, S.A.; Ranieri, V.M. Epidemiology of Mechanical Ventilation: Analysis of the SAPS 3 Database. Intens. Care Med. 2009, 35, 816–825. [Google Scholar] [CrossRef] [PubMed]
  45. Imtmedical. Service Manual Bellavista 1000/1000e; Imtmedical: Buchs, Switzerland, 2017; p. 185. [Google Scholar]
  46. Larsen, R.R.; Ziegenfuß, T.; Mathes, A. Beatmung: Indikationen-Techniken-Krankheitsbilder; Springer: Berlin/Heidelberg, Germany, 2018; p. 516. [Google Scholar]
  47. Michigan Instruments. Dual Adult TTL Training/Testing Lung: User’s Manual; Michigan Instruments: Grand Rapids, MI, USA, 2016; p. 51. [Google Scholar]
  48. Williams, K.; Hinojosa-Kurtzberg, M.; Parthasarathy, S. Control of breathing during mechanical ventilation: Who is the boss? Respir. Care 2011, 56, 127–139. [Google Scholar] [CrossRef] [PubMed] [Green Version]
Figure 1. Basic structure and main functional building blocks of a mechanical ventilator (taken and adapted from [8]).
Applsci 11 03745 g001
Figure 2. Key functional elements of the xPULM™ electromechanical lung simulator [43].
Applsci 11 03745 g002
Figure 3. Relationships between ventilation parameters in (a) volume-controlled and (b) pressure-controlled ventilation mode in relation to the ventilation phases of (I’) minimal inspiration time, (I) inspiration, (E’) minimal exhalation time, (E) exhalation, (T) waiting for a trigger (T’) trigger action and (P) plateau phase. The main ventilation parameters are depicted as well, including slope, PEEP, Tinsp and f as well as a schematic representation of a trigger event in the pressure and flow regime (taken and adapted from [45]).
Applsci 11 03745 g003
Figure 4. Pressure, flow and volume tracings during spontaneous sinusoidal breathing simulation (SB) phases with the xPULM™ and mechanical ventilator BellaVista™ in the V/A-C mode (left) and in the PSV mode (right). Simulated patient’s breathing frequency is not in phase with the ventilator’s frequency representing realistic conditions. This leads to trigger asynchrony (double-triggering) in the V/A-C mode (arrows on the left) and trigger asynchrony (premature cycling) in the PSV mode (arrows on the right).
Applsci 11 03745 g004
Figure 5. Pressure, flow and volume tracings during simulated apnea (SA) phase. The xPULM™ does not generate any airflow in this phase, and the mechanical ventilator BellaVista™ is overtaking the entire ventilation process using the V/A-C mode (left) and the PSV mode (right).
Applsci 11 03745 g005
Figure 6. Pressure changes in the thoracic chamber of the xPULM™ recorded during Phase 1—spontaneous sinusoidal breathing (SB), blue solid line and Phase 2—simulated apnea (SA), black dashed line in the V/A-C mode (left) and in the PSV mode (right). The changes in peak pressure (>4 cmH2O, left) and occurrence of premature cycling at every breath (right) indicate asynchrony events during mechanical ventilation and correspond to the data recorded by the ventilator.
Applsci 11 03745 g006
Table 1. Calculated pressure drop Δ P and equivalent linear airway resistance (R) values for flow rates in the measurement region for the used parabolic resistor Rp20.
Resistork V ˙ [L/min] Δ P [cmH2O]R [cmH2O·s/L]
Rp2021.5151.094.39
304.398.78
459.8813.17
6017.5717.57
Table 2. Patient–ventilator interaction. Differentiation between phases: (1) spontaneous sinusoidal breathing (SB) and (2) simulated apnea (SA) for both V/A-C and PSV mode with a breathing frequency of 12 bpm.
Ventilator
Mode
PhasePeak
Inspiratory
Flow
σ FLOW )
[L/min]
Peak
Inspiratory
Pressure
σ PRESSURE )
[cmH2O]
Peak
Expiratory
Flow
σ FLOW )
[L/min]
Peak
Expiratory
Pressure
σ PRESSURE )
[cmH2O]
V/A-CSB25.56 (±1.34)7.96 (±6.38)−25.57 (±8.93)0.14 (±0.20)
SA26.43 (±0.57)11.09 (±0.49)−32.9 (±0.54)0 (±0.03)
PSVSB43.96 (±0.01)10.18 (±0.04)−27.5 (±0.97)0.24 (±0.08)
SA41.19 (±0.31)10 (±0.02)−32.16 (±0.51)0 (±0.03)
Table 3. Comparison of peak flow and pressure values for the recorded spontaneous sinusoidal breathing phase (SB) of the V/A-C mode. The mode introduced a forced inspiratory cycle (double triggering) based on the trigger event. The inspiratory and expiratory peaks are differentiated based on the trigger event. Synchronous: the lung simulator’s spontaneous breathing is in phase with the mechanical ventilator during V/A-C mode; asynchronous: the lung simulator and the mechanical ventilator are out of phase during V/A-C mode.
Phase
(V/A-C)
Triggered
Event
Peak Inspiratory
Flow
σ FLOW )
[L/min]
Peak Inspiratory
Pressure
σ PRESSURE )
[cmH2O]
Peak Expiratory
Flow
σ FLOW )
[L/min]
Peak Expiratory
Pressure
σ PRESSURE )
[cmH2O]
SBSynchronous25.06 (±1.38)3.68 (±1.21)−19.53 (±0.45)0.24 (±0.15)
Asynchronous26.54 (±0.49)16.48 (±0.17)−37.66 (±0.68)−0.07 (±0.07)
Publisher’s Note: MDPI stays neutral with regard to jurisdictional claims in published maps and institutional affiliations.

