
Insulator Faults Detection in Aerial Images from High-Voltage Transmission Lines Based on Deep Learning Model


1
College of Electronic and Information Engineering, Nanjing University of Aeronautics and Astronautics, Nanjing 211106, China
2
College of Mechanical and Electrical Engineering, Chizhou University, Chizhou 247000, China
3
School of Information Science and Engineering, Southeast University, Nanjing 211106, China
*
Authors to whom correspondence should be addressed.
Appl. Sci. 2021, 11(10), 4647; https://doi.org/10.3390/app11104647
Submission received: 18 April 2021
/
Revised: 9 May 2021
/
Accepted: 16 May 2021
/
Published: 19 May 2021
(This article belongs to the Section Computing and Artificial Intelligence)
Abstract
:Insulator fault detection is one of the essential tasks for high-voltage transmission lines’ intelligent inspection. In this study, a modified model based on You Only Look Once (YOLO) is proposed for detecting insulator faults in aerial images with a complex background. Firstly, aerial images with one fault or multiple faults are collected in diverse scenes, and then a novel dataset is established. Secondly, to increase feature reuse and propagation in the low-resolution feature layers, a Cross Stage Partial Dense YOLO (CSPD-YOLO) model is proposed based on YOLO-v3 and the Cross Stage Partial Network. The feature pyramid network and improved loss function are adopted to the CSPD-YOLO model, improving the accuracy of insulator fault detection. Finally, the proposed CSPD-YOLO model and compared models are trained and tested on the established dataset. The average precision of CSPD-YOLO model is 4.9% and 1.8% higher than that of YOLO-v3 and YOLO-v4, and the running time of CSPD-YOLO (0.011 s) model is slightly longer than that of YOLO-v3 (0.01 s) and YOLO-v4 (0.01 s). Compared with the excellent object detection models YOLO-v3 and YOLO-v4, the experimental results and analysis demonstrate that the proposed CSPD-YOLO model performs better in insulator fault detection from high-voltage transmission lines with a complex background.
1. Introduction
With the increasing demand for electrical energy, especially in the context of smart power grids, high-voltage transmission is becoming more and more important. As one of the most common and fault-prone components, the insulator plays an important role in mechanical support and electrical insulation during the operation of power grids [1,2], as shown in Figure 1a, where the insulator is encircled by a red rectangular box. However, due to insulator being exposed to the outdoor environment for a long time period, it is inevitable that a fault will occur [3]—a missing fault of an insulator is shown in Figure 1b. In addition, the occurrence of insulator faults is diverse and random, and in the event of an insulator fault, it will harm the safety and stable operation of the entire transmission line, and even cause huge economic losses to power grids. Consequently, in order to ensure the normal operation of power grids, insulator fault detection has become one of primary tasks for transmission lines’ intelligent inspection [4]. Traditional manual patrol is inefficient and wastes human resources, which has been gradually replaced by unmanned aerial vehicle (UAV) patrols [5,6], meaning that workers do not need to detect insulator faults along transmission lines by telescope. However, the complexity and variability of application scenarios have brought huge challenges to the automatic identification of insulator faults.
Many researchers used aerial images and traditional image processing technology to identify insulators and their faults [7,8,9,10]. Generally, traditional image processing algorithms segmented insulators through specific features (e.g., color, gradient, texture, shape, etc.), and then implemented fault detection through matching algorithms. However, these algorithms relied on manually designed classification features, and these manually designed features are not suitable for multi-scale detection in complex backgrounds. As the correlation features of insulators in aerial images are uncertain, the accuracy of traditional image processing algorithms is reduced.
In recent years, with the rapid development of deep learning theory, image processing methods based on deep neural networks have been widely used in the field of object detection and classification, which have several advantages over traditional image processing methods [11,12,13,14,15]. Object detection methods based on deep neural networks are composed of convolutional neural networks (CNN), which are capable of extracting image features automatically and learning from different environmental conditions. With the widespread application of CNN, deep learning methods overcome the limitations of the traditional image processing techniques, thus exhibiting high performance and greatly improving the accuracy of object detection [16,17,18]. In the task of object detection, the existing deep learning methods can be divided into two categories—one-stage networks and two-stage networks [19,20]. Two-stage networks are regional suggestion methods which have a region regarding the proposal of interest and a separate region regarding the classification of the object, firstly generating candidate regions of interest, and then carrying on with the classification of extracted features. Typical two-stage networks include regions with convolutional neural networks (R-CNN) [21], fast R-CNN [22], faster R-CNN [23], region-based fully convolutional networks (R-FCN) [24], Mask R-CNN [25], and so on. In some public datasets, the detection accuracy of two-stage networks is slightly higher than that of one-stage networks; however, the detection speed of two-stage networks is far inferior to that of one-stage networks. Therefore, one-stage networks, represented by You Only Look Once (YOLO) [26,27,28,29] and Single Shot multi-box Detector (SSD) [30], came into being. One-stage networks are end-to-end detection methods which can predict the classification probability and position information simultaneously. Due to the characteristics of the deep neural networks’ architecture, two-stage networks are superior compared to one-stage networks in terms of detection accuracy, while one-stage networks are much faster than two-stage networks in terms of detection speed. The real-time operation, limitations, and application scenarios of some representative object detection networks are summarized in Table 1.
With the continuous development of various hardware and parallel computing technologies, compared with the traditional image processing methods, the overall performance of image processing based on deep learning methods has greatly improved [31]. The application based on deep learning methods on insulator detection has become an important research issue for transmission lines’ automatic inspection. Naturally, the existing one-stage networks can be adapted to insulators and their fault detection by a transfer learning strategy. Jiang et al. [32] proposed a new method based on multi-level perception for the detection of insulator faults. The detection model with a multi-level perception architecture was trained by an SSD algorithm, and then the well-trained deep learning model was utilized to detect insulator faults automatically. Experimental results demonstrate that the precision and recall of insulator fault detection under diverse background could reach 91.23% and 93.69%, which were obviously superior to those of the traditional image processing algorithms. In the work of [33], a novel intelligent monitoring system based on UAV and a deep learning model was proposed for transmission line inspection. Firstly, to solve the problem of lacking training samples, four component fault datasets were created for the training model. Then, multiple data augmentation techniques were adopted to deal with class imbalance. Finally, a deep learning model based on SSD was proposed for detecting small components and their faults. Experimental results reveal that the common component faults can be detected quickly and accurately by the proposed monitoring system. Although the detection speed of the SSD model has been greatly improved compared to the two-stage networks, the running time of SSD model is not as good as YOLO models [34]. In particular, YOLO-v2 and YOLO-v3 have a good effect on detection speed and accuracy, and have been widely used in the object detection field. In [35], a real-time detection model based on deep neural networks was proposed for the automatic detection of insulators. Firstly, aerial images captured by UAV were collected to create a dataset for training. Secondly, to avoid overfitting, data augmentation techniques were applied to enlarge the training set size. Finally, YOLO-v2 was utilized for insulator detection training and testing in aerial images. It is demonstrated from the experimental results that YOLO-v2 could detect insulators accurately and met the requirements for real-time application. Adou et al. [36] proposed a deep learning method for insulator bunch-drop detection. YOLO-v3 model was adopted to train an insulator dataset for insulator localization and fault detection. The experimental results show that the YOLO-v3 model could effectively localize insulators and detect their faults, and the speed of insulator detection could reach 45 frames per second. In the work of [37], a cascaded deep learning model was proposed to detect insulators and their missing faults. Firstly, an improved YOLO-v3 model based on the backbone network of Resnet 50 was employed to locate insulators. Then, the regions of located insulators were regarded as regions of interest (RoI) for missing fault detection. Finally, a YOLO-v3 tiny model was used to detect the missing faults of insulators in RoI. The experimental results demonstrate that the average running time of the proposed model could reach 30 ms per image, which had the potential for real-time fault detection from high-voltage transmission lines. In order to promote feature reuse and propagation, in the work of [38], dense blocks were adopted to YOLO-v3 for traffic sign detection in real scenes, and the average precision of the modified YOLO model could reach 95.92%.
In a word, the application of deep learning methods for insulator faults detection has very considerable prospects. However, there are several challenges for insulator fault detection in the inspection of transmission lines, including the lack of insulator fault images, aerial images with complex background interference, insulator faults being small compared with the size of the insulator, and so on. To solve the above issues, inspired by the work of [38] and YOLO models, this paper proposed a Cross Stage Partial Dense YOLOv3 (CSPD-YOLO) model for insulator fault detection in aerial images with complex backgrounds. A novel insulator faults dataset was created to solve the lack of insulator fault images. To improve feature reuse and propagation in the low-resolution feature layers, Cross Stage Partial Dense (CSPD) blocks were adopted to the feature extraction network of the CSPD-YOLO model. To obtain multi-scale features of insulator faults, a structure of feature fusion was adopted into CSPD-YOLO model. To improve the detection accuracy of insulator faults, an improved loss function and the k-mean++ clustering algorithm were adopted to the CSPD-YOLO model.
The rest of this paper is organized as follows: (1) Section 1 reports the existing works of insulators and their fault detection; (2) Section 2 details the modified network CSPD-YOLO model; (3) Section 3 gives experimental results and analysis; (4) and finally, Section 4 presents the conclusion of this paper.
2. Materials and Methods
YOLO-v3 is a one-stage network based on the method of regression to extract the features and directly predict and classify the input images; it not need to generate a large number of candidate windows compared with two-stage networks, and has excellent recognition speed and detection accuracy. Specifically, YOLO-v3 first resizes the input image to the 416 × 416 pixels fed into deep neural networks for training, and then divides the image into S × S grids, with each grid being responsible for predicting the object within it. The feature extraction network of YOLO-v3 is composed of Darknet-53 [39] and multi-scale feature fusion (26 × 26 feature maps are fused with 52 × 52 feature maps via up-sampling, similarly, the 13 × 13 feature maps are fused with the 26 × 26 ones via up-sampling). The detection accuracy can be greatly improved by the combination of the deep feature and the shallow feature.
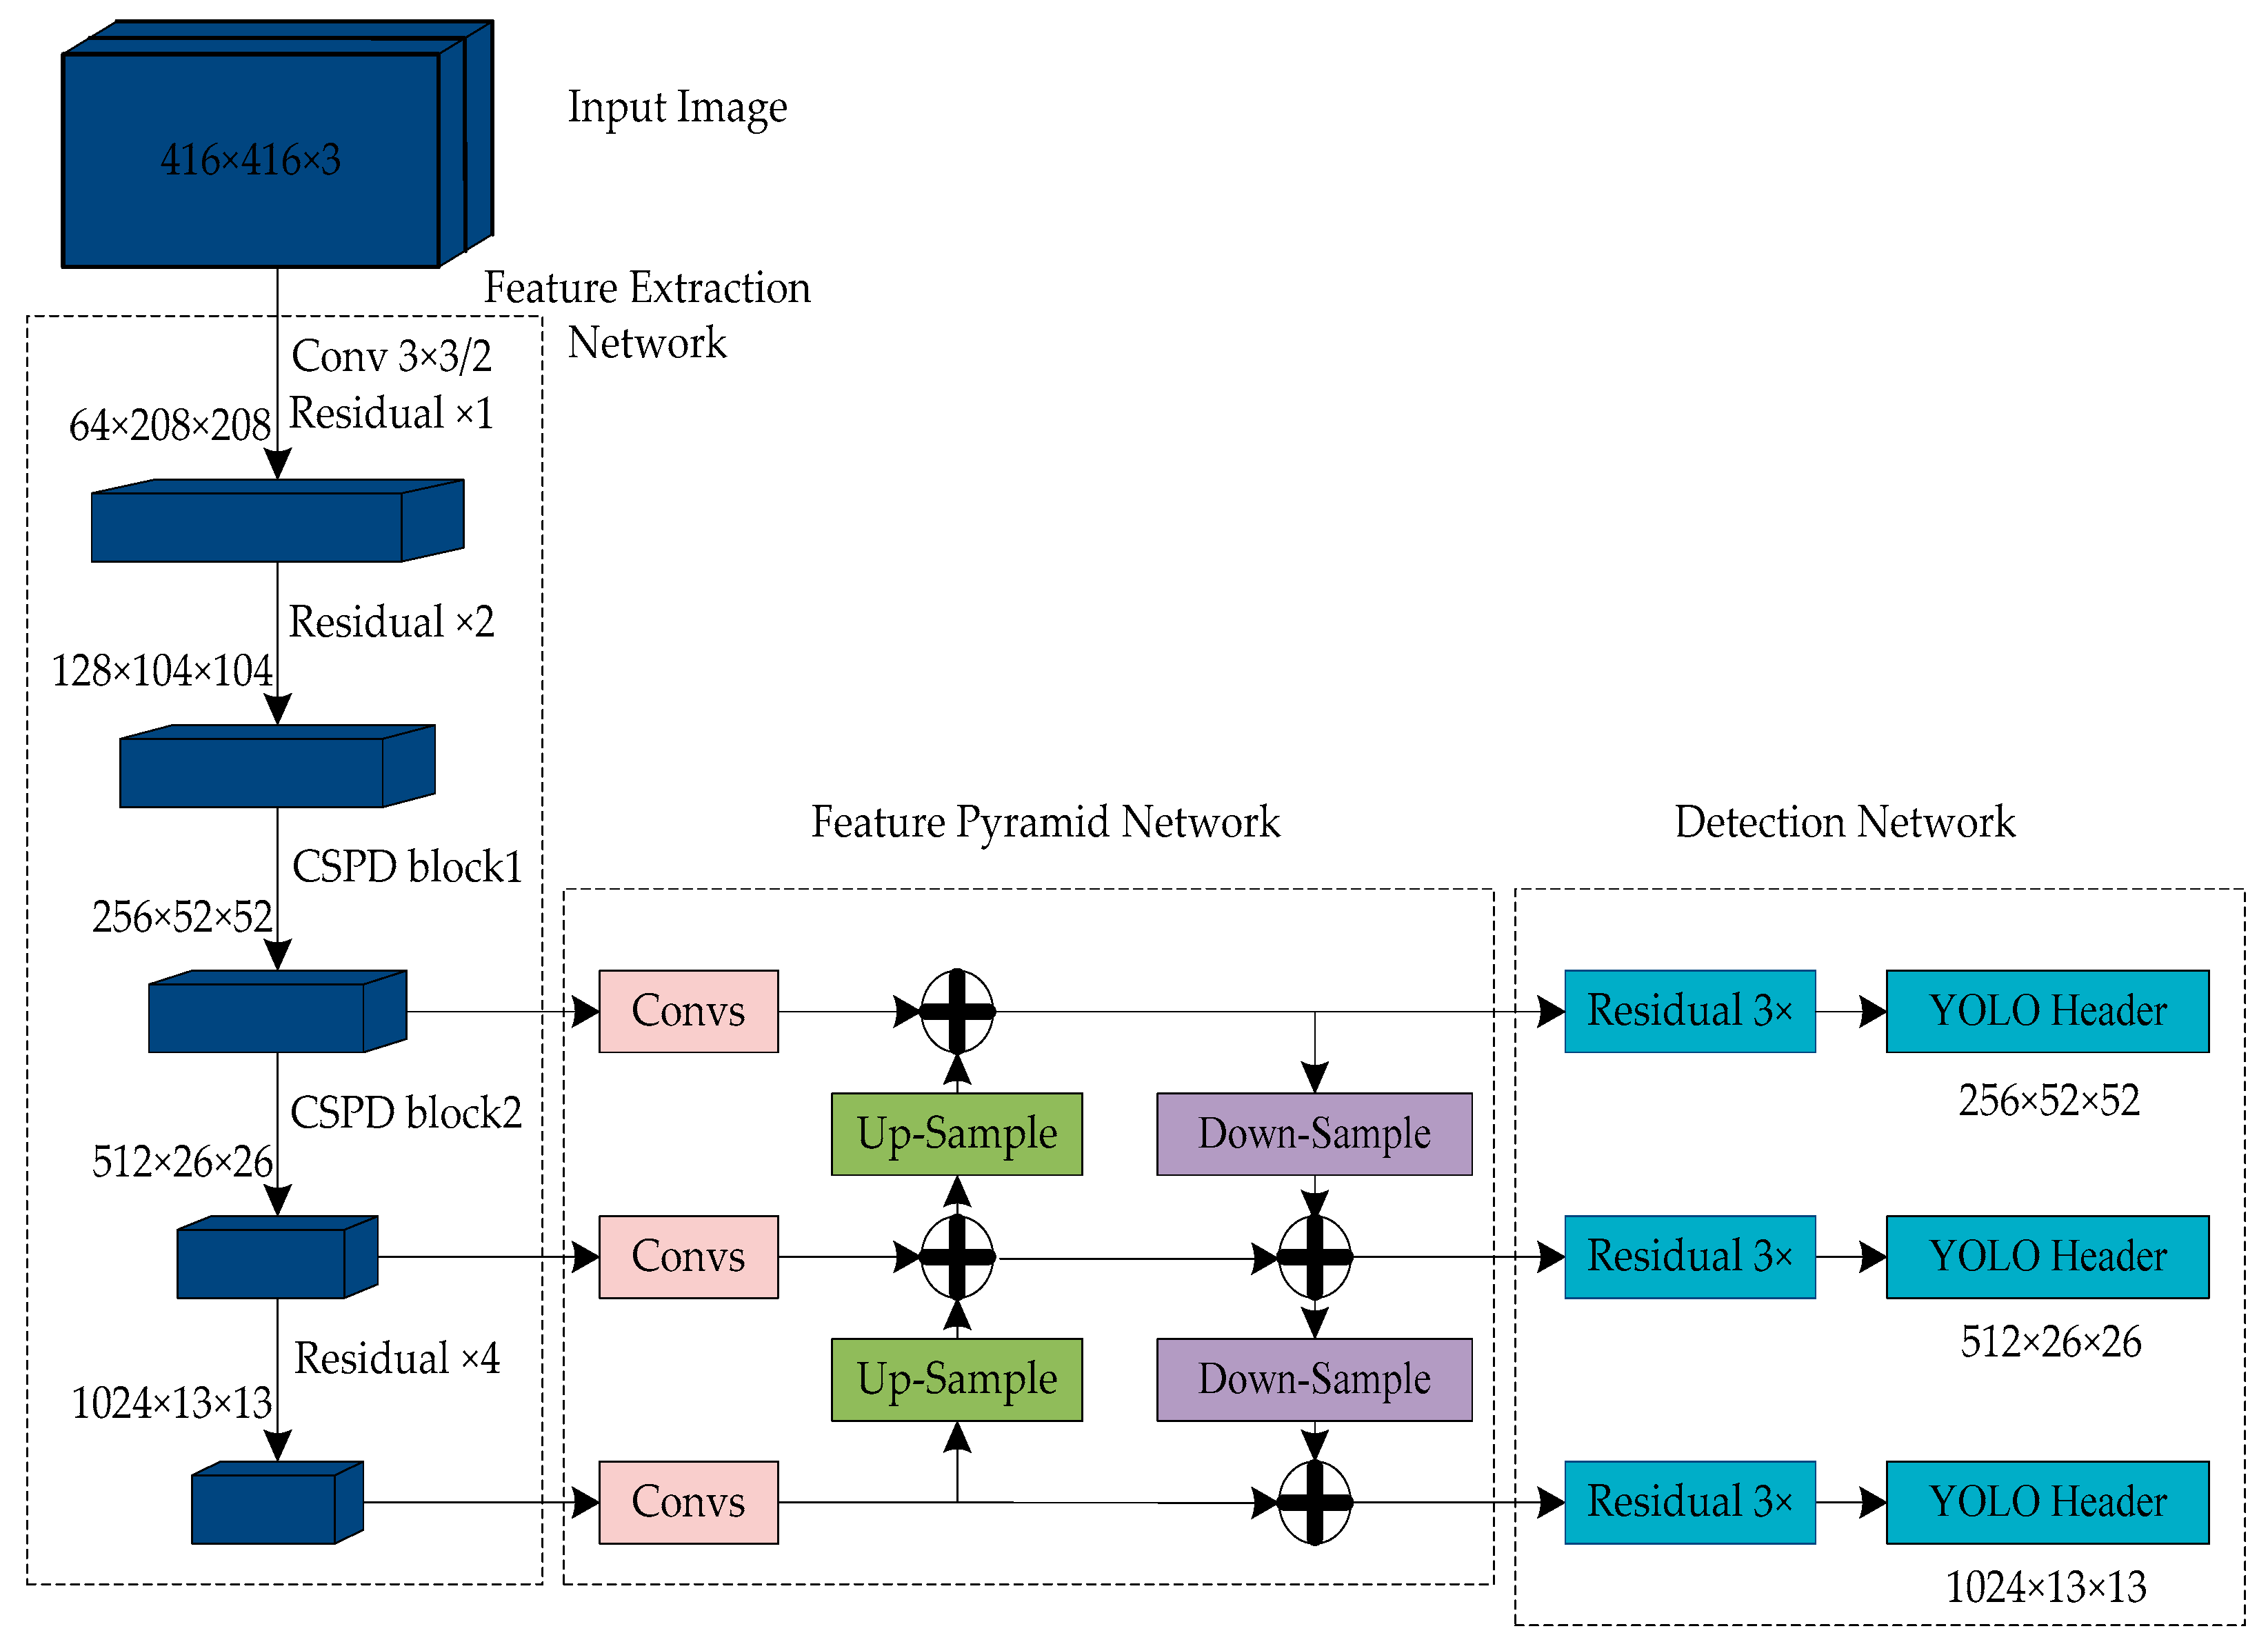
Compared with most other object detection models, YOLO-v3 has the advantages of faster detection speed and higher detection accuracy, but it still has several challenges when directly applied for insulator detection in aerial images from transmission lines (e.g., missed detection in small object detection, insufficient extraction of low resolution feature, and Recall of the model is low, etc.). In order to solve the above issues, on the basis of YOLO-v3 and DenseNet, a Cross Stage Partial Dense YOLOv3 (CSPD-YOLO) model is proposed in this paper. The entire structure of the CSPD-YOLO model is shown in Figure 2, which is composed of a feature extraction network, feature pyramid network (FPN), and detection network. To promote feature reuse and propagation in the low-resolution feature layers, Cross Stage Partial Dense (CSPD) blocks were adopted to the feature extraction network of the CSPD-YOLO model. To obtain multi-scale features of insulator faults, a structure of feature fusion was adopted to the CSPD-YOLO model. To avoid gradient vanishing, three residual units were adopted in front of YOLO headers. To improve the detection accuracy of insulator faults, an improved loss function was adopted to the CSPD-YOLO model.
2.1. The Feature Extraction Network of CSPD-YOLO Model
The network depth is very important to the performance of a deep learning model, which can extract efficient features for detection. However, the deeper the network layers, the more complex the detection network, and the deep learning model will quickly reach saturation with the deepening of network layers, resulting in gradient disappearance or explosion. In order to solve the degradation of the deep learning model, the Residual Network (ResNet) [40,41,42] and Dense Network (DenseNet) [43,44,45] were proposed to reduce the effect of gradient disappearance and explosion.
The ResNet structure in DarkNet-53 is composed of convolutional layers—(Conv) 1 × 1 and Conv 3 × 3. Specifically, the Conv 1 × 1 layer compresses the number of channels for the feature layer X, and then the Conv 3 × 3 layer is used to enhance feature extraction and expand the number of channels. Finally, the feature layer X and F(X) are connected by a shortcut and the feature layer H(X) is obtained, which can be defined in Formula (1).
H(X) = F(X) + X
The structure of ResNet can improve detection accuracy by increasing the depth considerably; at the same time, the internal residual unit uses shortcut connection to alleviate the gradient disappearance caused by increasing the depth of the deep learning model.
In deep neural networks, as the network layers deepen, the transmission of image features will gradually be weakened. To solve this problem, DenseNet was introduced to prevent the feature from disappearing, and thereby the performance of deep neural networks can be improved. The basic structure of DenseNet is shown in Figure 3, which uses a feed-forward manner to connect each layer to other layers; in other words, the th layer receives all the feature maps of the previous layers as input:
In Formula (2), denotes the output of th layer, represents the spliced feature maps of the previous layers, and refers to the non-linear transform function composed of batch normalization (BN), the rectified linear unit (ReLU), and a convolutional layer (Conv). Generally, BN-ReLU-Conv (1 × 1) and BN-ReLU-Conv (3 × 3) are employed as transform functions.
In order to further improve the feature extraction network of YOLO-v3, DenseNet and Cross Stage Partial Network (CSPNet) [46] were introduced into YOLO-v3 in this paper. CSPNet is the backbone network of YOLO-v4, used to enhance the learning capacities of CNN, which reduces the computing bottleneck and memory cost while being lightweight. This paper applied the Cross Stage Partial Dense (CSPD) blocks to the DarkNet53 network and constructed a CSPD-YOLO model; the structure of CSPD blocks is shown in Figure 4. CSPD blocks divided the feature maps of the input feature layer into two parts, and then concatenated through the cross-stage hierarchical structure to reduce the amount of calculation while ensuring detection accuracy. Specifically, in Figure 4a, CSPD block1 is composed of two Conv 3 × 3, one Conv 1 × 1, four residual units, and four dense units, used to extract scale feature 52 × 52. Firstly, the input feature layer was 128 × 104 × 104, and then Conv 256 × 3 × 3/2 was used to reduce dimensions, and the feature maps 256 × 52 × 52 were obtained. Secondly, the network was divided into two parts: one part through Conv 256 × 3 × 3 to generate feature maps 256 × 52 × 52, and the other part through four residual units for feature extraction, the number of channels was adjusted to 128 by Conv 128 × 1 × 1, and then four dense units were used to continue extracting features to obtain feature maps 256 × 52 × 52. BN-ReLU-Conv 32 × 1 × 1 and BN-ReLU-Conv 32 × 3 × 3 were applied to each dense unit. Finally, the feature maps 256 × 52 × 52 of the two parts were concatenated as the output layer (256 × 52 × 52). Similarly, in Figure 4b, CSPD block2 is composed of two Conv 3 × 3, one Conv 1 × 1, and eight dense units, used to extract scale feature 26 × 26. Firstly, the input feature layer was 256 × 52 × 52, and then Conv 512 × 3 × 3/2 was used to reduce dimensions, and the feature maps 512 × 26 × 26 were obtained. Secondly, the network was divided into two parts: one part through Conv 512 × 3 × 3 to generate feature maps 512 × 26 × 26, the other part through Conv 256 × 1 × 1 to adjust the number of channels, and then eight dense units were used to extract feature to obtain feature maps 512 × 26 × 26. BN-ReLU-Conv 32 × 1 × 1 and BN-ReLU-Conv 32 × 3 × 3 were applied to each dense unit. Finally, the feature maps 512 × 26 × 26 of the two parts were concatenated as the output layer (512 × 26 × 26).
The feature extraction network of the CSPD-YOLO model is shown in Table 2, which can be divided into six parts, as follows: (1) in the first part, the input feature layer was 3 × 416 × 416, Conv 32 × 3 × 3 was used for feature extraction, and the output feature layer 32 × 416 × 416 was generated after the convolution operation; (2) one residual unit and three convolutional layers were employed in the second part—the input feature layer was 32 × 416 × 416, Conv 64 × 3 × 3/2, Conv 32 × 1 × 1, and Conv 64 × 3 × 3 were used to extract features, and the output feature layer 64 × 208 × 208 was obtained after the convolution operation; (3) two residual units and five convolutional layers were used in the third part—the input feature layer was 64 × 208 × 208, Conv 128 × 3 × 3/2, Conv 64 × 1 × 1, and Conv 128 × 3 × 3 were employed for feature extraction, and the output feature layer 128 × 104 × 104 was generated after the convolution operation; (4) 19 convolutional layers, four residual units, and four dense units were employed in the fourth part—the input feature layer was 128 × 104 × 104, Conv 256 × 3 × 3/2, Conv 128 × 1 × 1, Conv 32 × 1 × 1, Conv 32 × 3 × 3, and Conv 256 × 3 × 3 were used for feature extraction, and the output feature layer 256 × 52 × 52 was obtained after the convolution operation; (5) 19 convolutional layers and eight dense units were employed in the fifth part—the input feature layer was 256 × 52 × 52, Conv 512 × 3 × 3/2, Conv 256 × 1 × 1, Conv 32 × 1 × 1, Conv 32 × 3 × 3, and Conv 512 × 3 × 3 were used to extract features, and the output feature layer 512 × 26 × 26 was obtained after the convolution operation; (6) 9 convolutional layers and four residual units were used in the last part—the input feature layer was 512 × 26 × 26, Conv 1024 × 3 × 3/2, Conv 512 × 1 × 1, and Conv 1024 × 3 × 3 were employed for feature extraction, and the output feature layer 1024 × 13 × 13 was generated after the convolution operation.
2.2. The Feature Pyramid Network of CSPD-YOLO Model
In the deep neural networks, the low-level (high-resolution) feature layer contains more detailed information, and the high-level (low-resolution) feature layer contains more semantic information. As the network layer gradually deepens, the detailed information continues to decrease, while the semantic information continues to increase. To achieve multi-scale object detection, the feature pyramid network (FPN) fuses high-level semantic information with low-level detailed information of different layers, which can improve feature extraction capabilities and the detection accuracy of small objects.
To obtain multi-scale semantic information of insulator faults, motivated by the works of [47,48,49], a structure of the feature pyramid network was adopted in this paper, as shown in Figure 5. The multi-scale prediction process of insulator faults is as follows: firstly, the large feature layer (LFL0) 256 × 52 × 52, medium feature layer (MFL0) 512 × 26 × 26, and small feature layer (SFL0) 1024 × 13 × 13 were effective feature layers extracted from the backbone network of the CSPD-YOLO model. Secondly, the feature layer SFL1 was obtained after the convolution operation of feature layer SFL0, and then feature layer SFL1 was fused with feature layer MFL0 via up-sampling to generate feature layer MFL1, while the feature MFL1 was fused with feature layer LFL0 via up-sampling to obtain feature layer LFL1. Finally, feature layer LFL2 was obtained after the convolution operation of feature layer LFL1, and then the feature layer LFL2 was fused with feature layer MFL1 via down-sampling to generate feature layer MFL2, while the feature layer MFL2 was fused with feature layer SFL1 via down-sampling to obtain feature layer SFL2. The feature layers LFL2, MFL2, and SFL2 were connected to three residual units for multi-scale prediction, respectively. Feature reuse was further realized by the top-down and bottom-up feature fusion strategies, which can effectively improve the prediction accuracy of insulator faults. The parameters of three residual units are shown in Table 3.
2.3. Improved Loss Function of CSPD-YOLO Model
Intersection over union (IoU) is one of the most commonly used evaluation criteria for current deep neural networks, denoted by the overlap ratio between the predicted box and the ground truth. The complete intersection over union (CIoU) [50] was adopted to replace mean square error in this paper, and the loss function of CSPD-YOLO model was defined in Formula (3), which was divided into three parts: the CIoU loss function , confidence loss function , and classification loss function . The CIoU loss function , confidence loss function , and classification loss function are defined in Formulas (4)–(6), respectively.
Specifically, in Formulas (3)–(6), denotes the number of grids in the image, and refers to the number of bounding boxes generated by each grid. is the Euclidean distance between the center point of the predicted box and ground truth, and is the diagonal distance of the smallest closure area that contains both the predicted box and the ground truth. is the width and height of the predicted box, and is the width and height of ground truth. denotes whether an object falls in the th predicted box of grid . and are the predicted confidence and true confidence, and and are the predicted probability and true probability of object classification, respectively.
3. Experiments Results and Discussion
In this paper, the proposed model was verified under the experimental conditions including a Windows 10 PC with Intel(R)-i9 processor, a CPU at 3.60 GHz, 32 GB RAM, and the NVIDIA GeForce GTX 3080 with 10 GB memory. The relevant hardware and software environment is presented in Table 4.
3.1. Data Processing
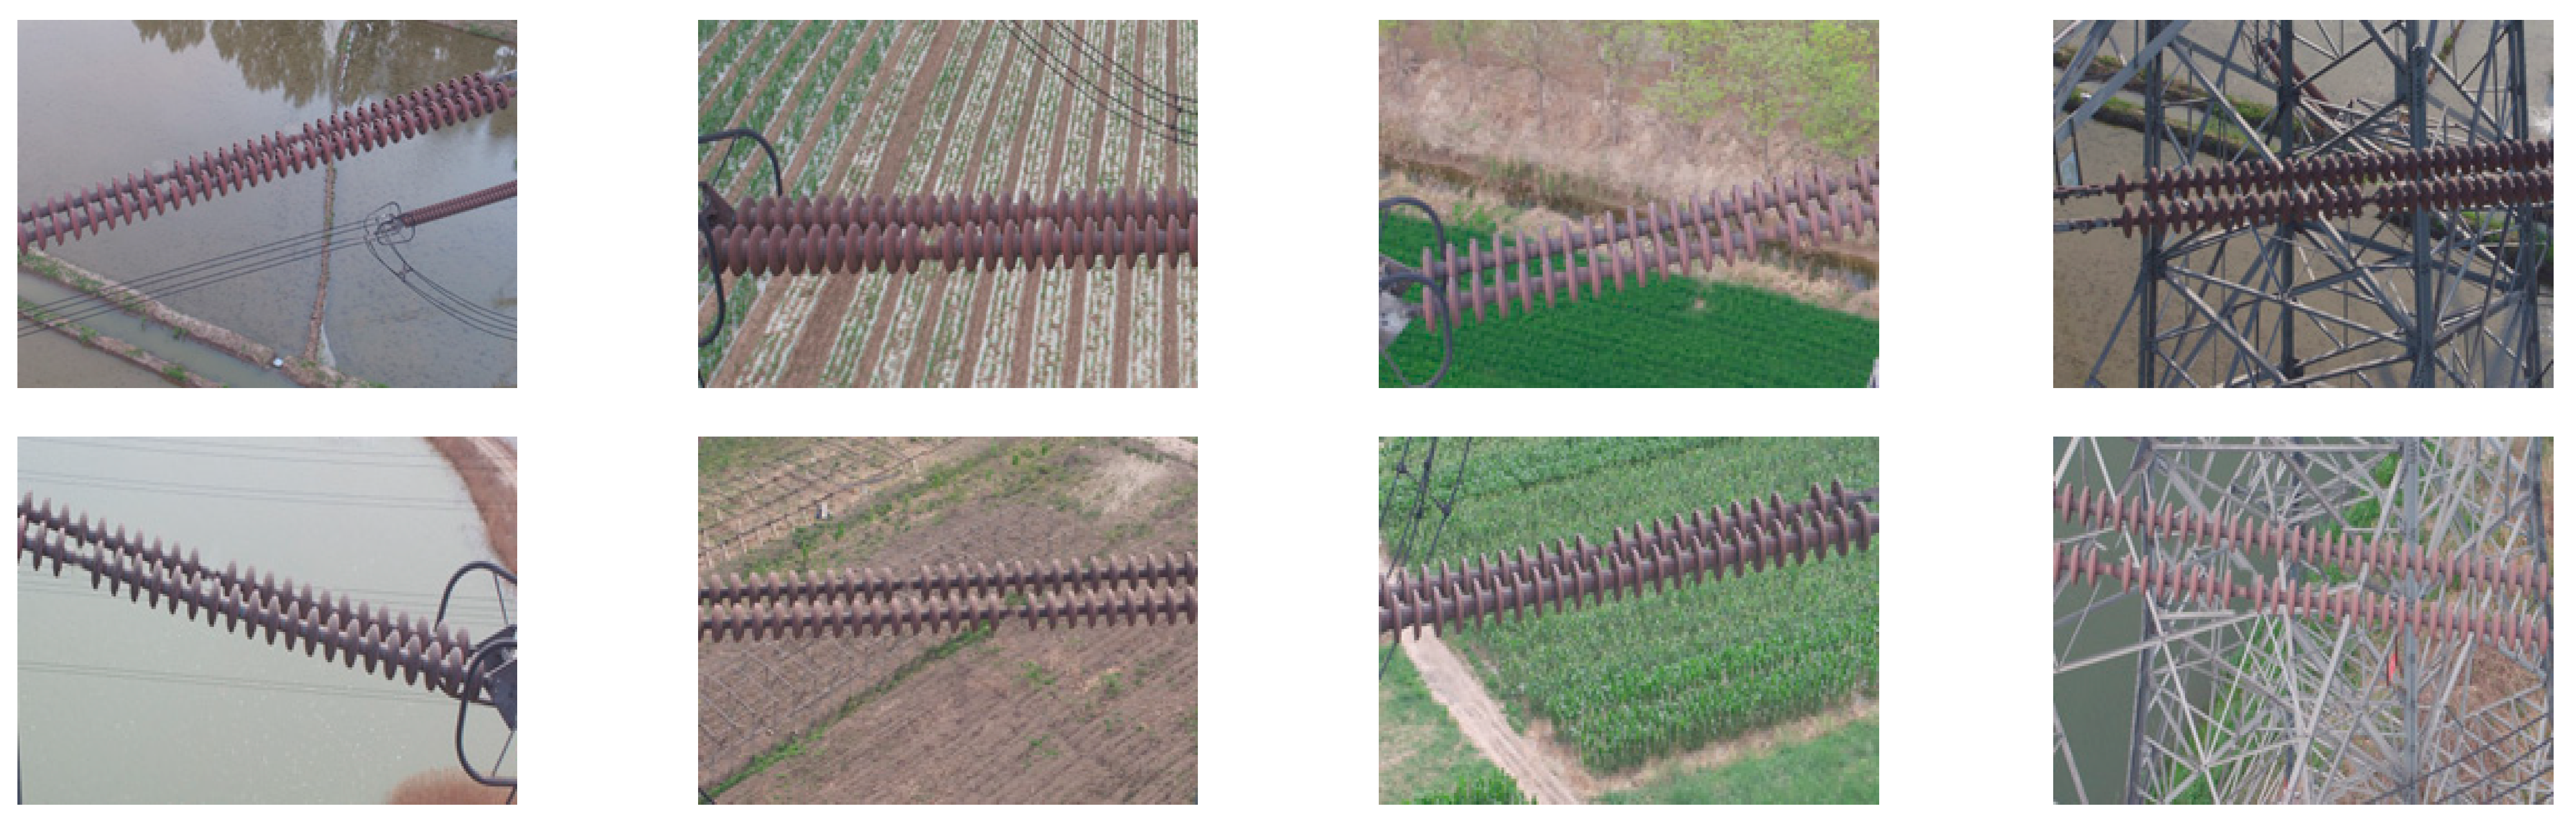
To the best of our knowledge, there is no standard dataset for insulator fault training and testing. Since aerial images of insulator faults are rare and not easy to collect, in order to obtain as many insulator faults images as possible, on the basis of the Chinese Power Line Insulator Dataset (‘CPLID’) [51], the simulated insulator faults samples were created by the use of the software Photoshop, which was used to erase the normal insulator strings and replace them with their nearby pixels. The samples of insulator faults with diverse scenes are shown in Figure 6.
Specifically, 1331 simulated insulator fault images were collected using the above method. Then, the faults’ position on the insulator in the aerial images were labeled by the tool Label-Image. Finally, an insulator faults dataset named ‘InSF-detection’ (Insulator Fault, InSF) was established including 1331 aerial images with 2104 faults in total. We randomly selected 809 aerial images as the training set, and designated the other 522 aerial images as the testing set; detailed information regarding the ‘InSF-detection’ dataset is shown in Table 5.
3.2. Anchor Boxes Clustering
Generally, in the YOLO-v3 model, the k-means clustering algorithm is used to cluster analysis on the labeled boxes of the COCO dataset. However, the k-means clustering method has large randomness in the selection of initial clustering points. In this paper, the k-means++ clustering algorithm was adopted to cluster analysis on the dataset of ‘InSF-detection’, and the relationship curve between cluster center k and the average IoU is shown in Figure 7. It can be seen from Figure 7 that the average IoU becomes more and more stable with the increase in k values; when k = 9, the average IoU is 89.13%, and the average IoU varies slowly when the number k is bigger than 9. Finally, the clustering center k was set as 9 for dataset ‘InSF-detection’, and the initial anchor boxes for insulator faults detection were obtained as follows: (17, 13), (23, 15), (20, 17), (25, 17), (21, 21), (24, 19), (26, 23), (23, 26), and (30, 28), respectively.
3.3. Quantitative and Qualitative Analysis
In this paper, to test and verify the feasibility of the CSPD-YOLO model for insulator fault detection, experiments were conducted on YOLO-v3, the model in the literature [38] (two Dense blocks were added to the backbone network of YOLO-v3), YOLO-v4, and the CSPD-YOLO model. To perform a fair comparison, the four network models were trained and tested on the dataset ‘InSF-detection’. In the field of machine learning, four common types are used to evaluate binary classification model, including true positive (TP), false positive (FP), true negative (TN), and false negative (FN), which are defined in Table 6.
The average precision (AP), precision (P), recall (R), F1 score, and running time are employed to evaluate performances of the compared networks: YOLO-v3, method in the literature [38], YOLO-v4, and CSPD-YOLO model. The precision (P), recall (R), and F1 score are defined in Formulas (7)–(9), respectively. The P–R curve is composed of precision (P) and recall (R), taking recall (R) as the x-axes and precision (P) as the y-axis. AP is the closure area of the P–R curve, which is defined in Formula (10).
The experimental effects of different networks for insulator fault detection are listed in Table 7, and the P–R curves of the proposed network and the compared networks (YOLO-v3, the model in the literature [38], and YOLO-v4) are shown in Figure 8, which were conducted on the testing set of ‘InSF-detection’. Specifically, the average precision (AP) values of the four network models were YOLO-v3 (93.31%), the literature model [38] (95.07%), YOLO-v4 (96.38%), and the CSPD-YOLO model (98.18%), and the AP of the CSPD-YOLO model was 4.9%, 3.1%, and 1.8% higher than that of YOLO-v3, the literature model [38], and YOLO-v4, respectively. The precision (P) values of the four network models were YOLO-v3 (94%), the literature model [38] (97%), YOLO-v4 (98%), and the CSPD-YOLO model (99%), and the precision (P) of the CSPD-YOLO model was 5%, 2%, and 1% higher than that of YOLO-v3, the literature model [38], and YOLO-v4, respectively. The recall (R) values of the four network models were YOLO-v3 (94%), the literature model [38] (95%), YOLO-v4 (95%), and the CSPD-YOLO model (98%), the recall (R) of the CSPD-YOLO model was 4%, 3%, and 3% higher than that of YOLO-v3, the literature model [38], and YOLO-v4, respectively. The F1 score values of the four network models were YOLO-v3 (94%), the literature model [38] (96%), YOLO-v4 (97%), and the CSPD-YOLO model (99%), and the F1 score of the CSPD-YOLO model was 5%, 3%, and 2% higher than that of YOLO-v3, the literature model [38], and YOLO-v4, respectively. Based on the values of average precision (AP), precision (P), recall (R), and F1 score, it is proved that the proposed CSPD-YOLO model is superior to the compared networks. The running times of the networks were YOLO-v3 (0.01 s), the literature model [38] (0.011 s), YOLO-v4 (0.01 s), and the CSPD-YOLO model (0.011 s), and it can be concluded that the proposed CSPD-YOLO model can run in real time. Consequently, as it achieves a good trade-off between average precision (AP), precision (P), recall (R), F1 score, and running time, the proposed CSPD-YOLO model may be more advantageous than YOLO-v3, the literature model [38], and YOLO-v4.
Moreover, the aerial images used for the dataset ‘InSF-detection’ include diverse background interference in order to evaluate the performance of insulator fault detection. The experimental results with different scenes analyzed by the CSPD-YOLO model are shown in Figure 9a–e; in each figure, the pink rectangular box is used to locate the position of the insulator faults. Specifically, Figure 9a–c present the experimental results with one-fault or multiple fault in scenes of rivers, vegetation, and power towers, respectively. As the backgrounds of rivers and vegetation are simple, the insulator faults in Figure 9a,b were easily detected by the CSPD-YOLO model. Although the background of power towers is complex in Figure 9c, all the faults were accurately detected by the proposed CSPD-YOLO model. Figure 9d demonstrates the experimental scene with occlusion of insulator strings, and Figure 9e exhibits the experimental scene with the insulator’s color being similar to the background. It is difficult to achieve effective insulator fault detection using traditional image processing methods in these cases; however, as can be seen from Figure 9d,e, all the insulator faults were accurately detected by the CSPD-YOLO model. Therefore, the experimental results from Figure 9 reveal that the proposed CSPD-YOLO model can obtain good efficacy in the detection of insulator faults in aerial images with the interference of complex backgrounds.
To further verify the effectiveness and robustness of the proposed CSPD-YOLO model, several typical aerial images were selected to exhibit the visualization performance of YOLO-v3, the literature model [38], YOLO-v4, and the CSPD-YOLO model; as shown in Figure 10, Figure 11, Figure 12, the positions of insulator faults were located by pink rectangular boxes. Specifically, the experimental results with a river background are shown in Figure 10; since the insulator faults are relatively small, only two insulator faults were detected by YOLO-v3 (Figure 10a), the model in the literature [38] (Figure 10b), and YOLO-v4 (Figure 10c), while all of the insulator faults were correctly detected by the CSPD-YOLO model (Figure 10d). Figure 11 demonstrates the experimental results with the background of trees; although the background is complex, all of the insulator faults were detected by the CSPD-YOLO model (Figure 11d), while two insulator faults were detected by YOLO-v3 (Figure 11a) and the literature model [38] (Figure 11b), and three insulator faults were detected by YOLO-v4 (Figure 11c). The experimental results with a power tower background are shown in Figure 12; due to the color of background being similar to that of the insulator and the power tower background being complex, two insulator faults were detected by YOLO-v3 (Figure 12a), three insulator faults were detected by the literature model [38] (Figure 12b) and YOLO-v4 (Figure 12c), while all of the insulator faults were detected by the CSPD-YOLO model (Figure 12d). Consequently, compared with YOLO-v3, the literature model [38], and YOLO-v4, the proposed CSPD-YOLO model performs better for insulator fault detection in aerial images with complex backgrounds.
It can be concluded that the proposed CSPD-YOLO model has advantages in insulator fault detection in inspection images with complex backgrounds and small objects. In future study, the CSPD-YOLO model will be utilized in UAV for fault detection in the automatic inspection of high-voltage transmission lines, and the CSPD-YOLO model will be extended into the detection of other component faults (e.g., missing anti-vibration hammers, breakage in power lines, missing metal fittings, etc.) in the inspection of high-voltage transmission lines.
4. Conclusions
This study presented a modified YOLO-v3 detection model for insulator fault detection in aerial images. Firstly, a novel dataset named ‘InSF-detection’ was established, consisting of 1331 aerial images with one fault or multiple faults. Secondly, to achieve insulator fault detection in aerial images with complex backgrounds, on the basis of the YOLO-v3 model, Cross Stage Partial Network, and DenseNet, a Cross Stage Partial Dense YOLOv3 (CSPD-YOLO) model was proposed in this paper. CSPD blocks were adopted into the feature extraction network to increase feature reuse and propagation in the low-resolution feature layers, a structure of feature fusion was adopted into the CSPD-YOLO model to obtain multi-scale features of insulator faults, and an improved loss function and the k-mean++ clustering algorithm were adopted into the CSPD-YOLO model to improve the detection accuracy of insulator faults. Finally, the proposed CSPD-YOLO model, YOLO-v3, the model in the literature [38], and YOLO-v4 were carefully trained and tested on the established dataset. Experiments on insulator fault detection were conducted on the ‘InSF-detection’ dataset, and experimental results of the compared models showed that the average precision (AP) values of YOLO-v3, the literature model [38], YOLO-v4, and the CSPD-YOLO model were 93.31%, 95.07%, 96.38%, and 98.18%, respectively, proving that the proposed CSPD-YOLO model was superior to YOLO-v3, the model in the literature [38], and YOLO-v4. In addition, in the CSPD-YOLO model, the values of precision (P), recall (R), and F1 score were higher than those of the compared models. The average detection time of the CSPD-YOLO model (0.011 s) was slightly longer than that of YOLO-v3 (0.01 s) and YOLO-v4 (0.01 s); however, the proposed CSPD-YOLO model could still be applied for the real-time detection of insulator faults with diverse scenes. Consequently, the CSPD-YOLO model achieved good performance in insulator fault detection amid diverse background interference.
In future studies, the proposed CSPD-YOLO model will be utilized in UAV for the detection of on-line faults on high-voltage transmission lines.
Author Contributions
Writing, finished the experiment and this paper, C.L.; methodology, Y.W.; experiments and analysis, J.L.; data collection and analysis, Z.S.; labeling the ground truth for each image in our dataset, H.X. All authors have read and agreed to the published version of the manuscript.
Funding
This research was funded by the National Nature Science Founding of China under grant 61573183; Major Natural Research Project of Anhui Provincial under grant KJ2019ZD63; Excellent Young Talents support plan in Colleges of Anhui Province under grant gxyq 2019109, gxgnfx 2019056.
Institutional Review Board Statement
Not applicable.
Informed Consent Statement
Not applicable.
Data Availability Statement
Not applicable.
Acknowledgments
The authors wish to thank the editor and reviewers for their suggestions and thank Yiquan Wu for his guidance.
Conflicts of Interest
The authors declare no conflict of interest.
References
- Zhao, Z.; Zhen, Z.; Zhang, L.; Qi, Y.; Kong, Y.; Zhang, K. Insulator Detection Method in Inspection Image Based on Improved Faster R-CNN. Energies 2019, 12, 1204. [Google Scholar] [CrossRef] [Green Version]
- Liu, Y.; Pei, S.; Fu, W.; Zhang, K.; Ji, X.; Yin, Z. The discrimination method as applied to a deteriorated porcelain insulator used in transmission lines on the basis of a convolution neural network. IEEE Trans. Dielectr. Electr. Insul. 2017, 24, 3559–3566. [Google Scholar] [CrossRef]
- Han, J.; Yang, Z.; Zhang, Q.; Chen, C.; Li, H.; Lai, S.; Hu, G.; Xu, C.; Xu, H.; Wang, D.; et al. A Method of Insulator Faults Detection in Aerial Images for High-Voltage Transmission Lines Inspection. Appl. Sci. 2019, 9, 2009. [Google Scholar] [CrossRef] [Green Version]
- Zhai, Y.; Wang, D.; Zhang, M.; Wang, J.; Guo, F. Fault detection of insulator based on saliency and adaptive morphology. Multimed. Tools Appl. 2017, 76, 12051–12064. [Google Scholar] [CrossRef]
- Li, Y.; Zhang, W.; Li, P.; Ning, Y.; Suo, C. A Method for Autonomous Navigation and Positioning of UAV Based on Electric Field Array Detection. Sensors 2021, 21, 1146. [Google Scholar] [CrossRef]
- Ma, Y.; Li, Q.; Chu, L.; Zhou, Y.; Xu, C. Real-Time Detection and Spatial Localization of Insulators for UAV Inspection Based on Binocular Stereo Vision. Remote Sens. 2021, 13, 230. [Google Scholar] [CrossRef]
- Wang, W.; Wang, Y.; Han, J.; Liu, Y. Recognition and Drop-Off Detection of Insulator Based on Aerial Image. In Proceedings of the 2016 9th International Symposium on Computational Intelligence and Design (ISCID), Hangzhou, China, 10–11 December 2016. [Google Scholar]
- Liao, S.; An, J. A Robust Insulator Detection Algorithm Based on Local Features and Spatial Orders for Aerial Images. IEEE Geosci. Remote Sens. Lett. 2014, 12, 963–967. [Google Scholar] [CrossRef]
- Zhai, Y.; Chen, R.; Yang, Q.; Li, X.; Zhao, Z. Insulator Fault Detection Based on Spatial Morphological Features of Aerial Images. IEEE Access 2018, 6, 35316–35326. [Google Scholar] [CrossRef]
- Cheng, H.; Zhai, Y.; Chen, R.; Wang, D.; Dong, Z.; Wang, Y. Self-Shattering Defect Detection of Glass Insulators Based on Spatial Features. Energies 2019, 12, 543. [Google Scholar] [CrossRef] [Green Version]
- Wen, Q.; Luo, Z.; Chen, R.; Yang, Y.; Li, G. Deep Learning Approaches on Defect Detection in High Resolution Aerial Images of Insulators. Sensors 2021, 21, 1033. [Google Scholar] [CrossRef]
- Glowacz, A. Fault diagnosis of electric impact drills using thermal imaging. Measurement 2021, 171, 108815. [Google Scholar] [CrossRef]
- Fan, P.; Shen, H.M.; Zhao, C.; Wei, Z.; Yao, J.G.; Zhou, Z.Q.; Fu, R.; Hu, Q. Defect Identification Detection Research for Insulator of Transmission Lines Based on Deep Learning. In Proceedings of the 2020 International Symposium on Automation, Information and Computing (ISAIC 2020), Beijing, China, 2–4 December 2020. [Google Scholar]
- Lin, T.; Liu, X. An intelligent recognition system for insulator string defects based on dimension correction and optimized faster R-CNN. Electr. Eng. 2021, 103, 541–549. [Google Scholar] [CrossRef]
- Shi, C.; Huang, Y. Cap-Count Guided Weakly Supervised Insulator Cap Missing Detection in Aerial Images. IEEE Sens. J. 2021, 21, 685–691. [Google Scholar] [CrossRef]
- Chen, H.; He, Z.; Shi, B.; Zhong, T. Research on Recognition Method of Electrical Components Based on YOLO V3. IEEE Access 2019, 7, 157818–157829. [Google Scholar] [CrossRef]
- Wang, Y.; Li, Z.; Yang, X.; Luo, N.; Zhao, Y.; Zhou, G. Insulator Defect Recognition Based on Faster R-CNN. In Proceedings of the 2020 International Conference on Computer, Information and Telecommunication Systems (CITS), Hangzhou, China, 5–7 October 2020. [Google Scholar]
- Wu, W.; Li, Q. Machine Vision Inspection of Electrical Connectors Based on Improved Yolo v3. IEEE Access 2020, 8, 166184–166196. [Google Scholar] [CrossRef]
- Masita, K.L.; Hasan, A.N.; Shongwe, T. Deep Learning in Object Detection: A Review. In Proceedings of the 2020 International Conference on Artificial Intelligence, Big Data, Computing and Data Communication Systems (icABCD), Durban, South Africa, 6–7 August 2020. [Google Scholar]
- Miao, X.; Liu, X.; Chen, J.; Zhuang, S.; Fan, J.; Jiang, H. Insulator Detection in Aerial Images for Transmission Line Inspection Using Single Shot Multibox Detector. IEEE Access 2019, 7, 9945–9956. [Google Scholar] [CrossRef]
- Zhang, J.; Xie, Z.; Sun, J.; Zou, X.; Wang, J. A Cascaded R-CNN With Multiscale Attention and Imbalanced Samples for Traffic Sign Detection. IEEE Access 2020, 8, 29742–29754. [Google Scholar] [CrossRef]
- Huang, X.; Shang, E.; Xue, J.; Ding, H.; Li, P. A Multi-feature Fusion-based Deep Learning for Insulator Image Identification and Fault Detection. 2020 IEEE 4th Inf. Technol. Netw. Electron. Autom. Control Conf. (ITNEC) 2020, 1, 1957–1960. [Google Scholar] [CrossRef]
- Ren, S.; He, K.; Girshick, R.; Sun, J. Faster R-CNN: Towards Real-Time Object Detection with Region Proposal Networks. IEEE Trans. Pattern Anal. Mach. Intell. 2017, 39, 1137–1149. [Google Scholar] [CrossRef] [PubMed] [Green Version]
- Tomaszewski, M.; Michalski, P.; Osuchowski, J. Evaluation of Power Insulator Detection Efficiency with the Use of Limited Training Dataset. Appl. Sci. 2020, 10, 2104. [Google Scholar] [CrossRef] [Green Version]
- He, K.; Gkioxari, G.; Dollár, P.; Girshick, R. Mask R-CNN. arXiv 2018, arXiv:1703.068703v3. Available online: https://arxiv.org/abs/1703.06870 (accessed on 24 January 2018).
- Wang, H.; Hu, Z.; Guo, Y.; Yang, Z.; Zhou, F.; Xu, P. A Real-Time Safety HelmetWearing Detection Approach Based on CSYOLOv3. Appl. Sci. 2020, 10, 6732. [Google Scholar] [CrossRef]
- Rahman, E.; Zhang, Y.; Ahmad, S.; Ahmad, H.; Jobaer, S. Autonomous Vision-Based Primary Distribution Systems Porcelain Insulators Inspection Using UAVs. Sensors 2021, 21, 974. [Google Scholar] [CrossRef] [PubMed]
- Huang, Z.; Wang, J.; Fu, X.; Yu, T.; Guo, Y.; Wang, R. DC-SPP-YOLO: Dense connection and spatial pyramid pooling based YOLO for object detection. Inf. Sci. 2020, 522, 241–258. [Google Scholar] [CrossRef] [Green Version]
- Bochkovskiy, A.; Wang, C.; Liao, H. YOLOv4: Optimal Speed and Accuracy of Object Detection. arXiv 2020, arXiv:2004.10934. [Google Scholar]
- Liu, X.; Li, Y.; Shuang, F.; Gao, F.; Zhou, X.; Chen, X. ISSD: Improved SSD for Insulator and Spacer Online Detection Based on UAV System. Sensors 2020, 20, 6961. [Google Scholar] [CrossRef]
- Ge, C.; Wang, J.; Qi, Q.; Sun, H.; Liao, J. Towards automatic visual inspection: A weakly supervised learning method for industrial applicable object detection. Comput. Ind. 2020, 121, 103232. [Google Scholar] [CrossRef]
- Jiang, H.; Qiu, X.; Chen, J.; Liu, X.; Miao, X.; Zhuang, S. Insulator Fault Detection in Aerial Images Based on Ensemble Learning with Multi-Level Perception. IEEE Access 2019, 7, 61797–61810. [Google Scholar] [CrossRef]
- Nguyen, V.N.; Jenssen, R.; Roverso, D. Automatic autonomous vision-based power line inspection: A review of current status and the potential role of deep learning. Int. J. Electr. Power Energy Syst. 2018, 99, 107–120. [Google Scholar] [CrossRef] [Green Version]
- Wang, X.; Xu, T.; Zhang, J.; Chen, S. SO-YOLO Based WBC Detection with Fourier Ptychographic Microscopy. IEEE Access 2018, 6, 51566–51576. [Google Scholar] [CrossRef]
- Sadykova, D.; Pernebayeva, D.; Bagheri, M.; James, A. IN-YOLO: Real-Time Detection of Outdoor High Voltage Insulators Using UAV Imaging. IEEE Trans. Power Deliv. 2020, 35, 1599–1601. [Google Scholar] [CrossRef]
- Adou, M.W.; Xu, H.; Chen, G. Insulator Faults Detection Based on Deep Learning. In Proceedings of the 2019 IEEE 13th International Conference on Anti-counterfeiting, Security, and Identification (ASID), Xiamen, China, 25–27 October 2019. [Google Scholar]
- Han, J.; Yang, Z.; Xu, H.; Hu, G.; Zhang, C.; Li, H.; Lai, S.; Zeng, H. Search Like an Eagle: A Cascaded Model for Insulator Missing Faults Detection in Aerial Images. Energies 2020, 13, 713. [Google Scholar] [CrossRef] [Green Version]
- Du, L.; Ji, J.; Pei, Z.; Zheng, H.; Fu, S.; Kong, H.; Chen, W. Improved detection method for traffic signs in real scenes applied in intelligent and connected vehicles. IET Intell. Transp. Syst. 2020, 14, 1555–1564. [Google Scholar] [CrossRef]
- Project of the Dark-Net Framework. Available online: https://github.com/AlexeyAB/darknet (accessed on 25 October 2020).
- He, K.; Zhang, X.; Ren, S.; Sun, J. Identity Mappings in Deep Residual Networks. In Proceedings of the Transactions on Petri Nets and Other Models of Concurrency XV., Amsterdam, The Netherlands, 8–16 October 2016. [Google Scholar]
- Chen, S.; Liu, J.; Niu, W.; Han, Y.; Xiao, Y.; Xue, Y.; Ye, X. Research on The Detection Method for Insulation Piercing Connectors and Bolts on The Transmission Line Based on SSD Algorithm. In Proceedings of the 2019 IEEE 4th Advanced Information Technology, Electronic and Automation Control Conference (IAEAC), Chengdu, China, 20–22 December 2019. [Google Scholar]
- Wang, S.; Liu, Y.; Qing, Y.; Wang, C.; Lan, T.; Yao, R. Detection of Insulator Defects with Improved ResNeSt and Region Proposal Network. IEEE Access 2020, 8, 184841–184850. [Google Scholar] [CrossRef]
- Huang, G.; Liu, Z.; Van Der Maaten, L.; Weinberger, K.Q. Densely Connected Convolutional Networks. arXiv 2016, arXiv:1608.06993. Available online: https://arxiv.org/abs/1608.06993 (accessed on 25 August 2016).
- Xu, Z.; Shi, H.; Li, N.; Xiang, C.; Zhou, H. Vehicle Detection Under UAV Based on Optimal Dense YOLO Method. In Proceedings of the 2018 5th International Conference on Systems and Informatics (ICSAI), Nanjing, China, 10–12 November 2018. [Google Scholar]
- Yuan, X.; Xia, J.; Wu, J.; Shi, J.; Deng, L. Low Altitude Small UAV Detection Based on YOLO model. In Proceedings of the 2020 39th Chinese Control Conference (CCC), Shenyang, China, 27–29 July 2020. [Google Scholar]
- Wang, C.-Y.; Liao, H.-Y.M.; Wu, Y.-H.; Chen, P.-Y.; Hsieh, J.-W.; Yeh, I.-H. CSPNet: A New Backbone that can Enhance Learning Capability of CNN. arXiv 2019, arXiv:1911.11929v1. Available online: https://arxiv.org/abs/1911.11929 (accessed on 27 November 2019).
- Lin, T.-Y.; Dollar, P.; Girshick, R.; He, K.; Hariharan, B.; Belongie, S. Feature Pyramid Networks for Object Detection. arXiv 2017, arXiv:1612.03144. Available online: https://arxiv.org/abs/1612.03144 (accessed on 19 April 2017).
- Liu, S.; Qi, L.; Qin, H.; Shi, J.; Jia, J. Path Aggregation Network for Instance Segmentation. arXiv 2018, arXiv:1803.01534. Available online: https://arxiv.org/abs/1803.01534 (accessed on 18 September 2018).
- Li, Y.; Pei, X.; Huang, Q.; Jiao, L.; Shang, R.; Marturi, N. Anchor-Free Single Stage Detector in Remote Sensing Images Based on Multiscale Dense Path Aggregation Feature Pyramid Network. IEEE Access 2020, 8, 63121–63133. [Google Scholar] [CrossRef]
- Zheng, Z.; Wang, P.; Liu, W.; Li, J.; Ye, R.; Ren, D. Distance-IoU Loss: Faster and Better Learning for Bounding Box Regression. In Proceedings of the AAAI Conference on Artificial Intelligence; Association for the Advancement of Artificial Intelligence (AAAI): Menlo Park, CA, USA, 2020; Volume 34, pp. 12993–13000. [Google Scholar]
- Insulator Data Set—Chinese Power Line Insulator Dataset (CPLID). Available online: https://github.com/InsulatorData/InsulatorDataSet (accessed on 15 September 2020).
Figure 1.
Insulator in transmission lines and missing fault of an insulator.

Figure 2.
The entire structure of Cross Stage Partial Dense YOLOv3 (CSPD-YOLO) model.

Figure 3.
The structure of the Dense Connected Neural Network (DenseNet).

Figure 4.
The structure of Cross Stage Partial Dense (CSPD) blocks.

Figure 5.
The structure of feature pyramid network.

Figure 6.
The simulated samples of insulator faults with diverse scenes.

Figure 7.
The clustering results on dataset ‘InSF-detection’.

Figure 8.
The P–R curves of the proposed network and the compared networks.

Figure 9.
Experimental results with different scenes conducted by the CSPD-YOLO model.


Figure 10.
Experimental results of insulator fault detection with a river background.


Figure 11.
Experimental results of insulator fault detection with a background of trees.

Figure 12.
Experimental results of insulator fault detection with a power tower background.


Table 1.
The comparative analysis of some representative object detection networks.
| Algorithms | Real-Time | Limitation | Applicable Scenes |
|---|---|---|---|
| R-CNN | No | Detection is time-consuming and does not share features | Object detection |
| Fast R-CNN | No | Extracting object candidate boxes is time-consuming | Object detection |
| Faster R-CNN | Poor | Model is complex and the small target detection effect is not good | Object detection |
| R-FCN | Poor | Model is complex and large amount of calculation | Semantic segmentation |
| Mask R-CNN | Poor | The cost of instance segmentation is expensive | Instance segmentation |
| YOLO-v1 | Excellent | The locating error is large and the detection accuracy is low | Object detection |
| SSD | Excellent | Features of small object is lost | Multi-scale detection |
| YOLO-v2 | Excellent | The effect of small object detection is poor | Object detection |
| YOLO-v3 | Excellent | Recall of the model is low | Multi-scale detection |
| YOLO-v4 | Excellent | The detection accuracy needs to be improved | High precision detection |
Table 2.
The feature extraction network of CSPD-YOLO.
| Type | Filters | Size | Output | ||
|---|---|---|---|---|---|
| Convolutional | 32 | 3 × 3/1 | 32 × 416 × 416 | ||
| Convolutional | 64 | 3 × 3/2 | |||
| 1× | Convolutional | 32 | 1 × 1/1 | ||
| Convolutional | 64 | 3 × 3/1 | |||
| Residual | 64 × 208 × 208 | ||||
| Convolutional | 128 | 3 × 3/2 | |||
| 2× | Convolutional | 64 | 1 × 1/1 | ||
| Convolutional | 128 | 3 × 3/1 | |||
| Residual | 128 × 104 × 104 | ||||
| Convolutional 256 × 3 × 3 | Convolutional | 256 | 3 × 3/2 | ||
| 4× | Convolutional | 128 | 1 × 1/1 | ||
| Convolutional | 256 | 3 × 3/1 | |||
| Residual | |||||
| Convolutional | 128 | 1 × 1/1 | |||
| 4× | Convolutional | 32 | 1 × 1/1 | ||
| Convolutional | 32 | 3 × 3/1 | |||
| Dense | 256 × 52 × 52 | ||||
| Convolutiona l512 × 3 × 3 | Convolutional | 512 | 3 × 3/2 | ||
| Convolutional | 256 | 1 × 1/1 | |||
| 8× | Convolutional | 32 | 1 × 1/1 | ||
| Convolutional | 32 | 3 × 3/1 | |||
| Dense | 512 × 26 × 26 | ||||
| Convolutional | 1024 | 3 × 3/2 | |||
| 4× | Convolutional | 512 | 1 × 1/1 | ||
| Convolutional | 1024 | 3 × 3/1 | |||
| Residual | 1024 × 13 × 13 |
Table 3.
The parameters of three residual units.
| Feature Layer | Type | Filters | Size | Output | |
|---|---|---|---|---|---|
| 3× | Large | Convolutional | 128 | 1 × 1/1 | |
| Convolutional | 256 | 3 × 3/1 | |||
| Residual | 256 × 52 × 52 | ||||
| 3× | Medium | Convolutional | 256 | 1 × 1/1 | |
| Convolutional | 512 | 3 × 3/1 | |||
| Residual | 512 × 26 × 26 | ||||
| 3× | Small | Convolutional | 512 | 1 × 1/1 | |
| Convolutional | 1024 | 3 × 3/1 | |||
| Residual | 1024 × 13 × 13 |
Table 4.
The relevant experimental environment.
| Parameters | Configuration |
|---|---|
| CPU | Intel(R) Core(TM) i9-9900K, CPU/3.60 GHz |
| GPU | Nvidia GeForce GTX 3080/10 GB |
| Accelerated Environment | CUDA 11.1, cuDNN 8.0.5 |
| Visual Studio Framework | Open CV 3.4.0, Visual Studio 2017 |
| Training Framework | Dark-net |
Table 5.
The detailed information of ‘InSF-detection’ dataset.
| Number of Images | Training Set | Testing Set | Image Size | Number of Faults |
|---|---|---|---|---|
| 1331 | 809 | 522 | 416 × 416 | 2104 |
Table 6.
The definition of TP, FP, TN, and FN.
| Ground Truth | Predicted | Definition |
|---|---|---|
| Positive | Positive | TP |
| Positive | Negative | FP |
| Negative | Positive | TN |
| Negative | Negative | FN |
Table 7.
The experimental effects of different networks.
| Networks | AP | Precision | Recall | F1 Score | Running Time (s) |
|---|---|---|---|---|---|
| YOLO-v3 | 93.31% | 94% | 94% | 94% | 0.01 |
| Literature [38] | 95.07% | 97% | 95% | 96% | 0.011 |
| YOLO-v4 | 96.38% | 98% | 95% | 97% | 0.01 |
| CSPD-YOLO | 98.18% | 99% | 98% | 99% | 0.011 |
Publisher’s Note: MDPI stays neutral with regard to jurisdictional claims in published maps and institutional affiliations. |
© 2021 by the authors. Licensee MDPI, Basel, Switzerland. This article is an open access article distributed under the terms and conditions of the Creative Commons Attribution (CC BY) license (https://creativecommons.org/licenses/by/4.0/).
Share and Cite
MDPI and ACS Style
Liu, C.; Wu, Y.; Liu, J.; Sun, Z.; Xu, H. Insulator Faults Detection in Aerial Images from High-Voltage Transmission Lines Based on Deep Learning Model. Appl. Sci. 2021, 11, 4647. https://doi.org/10.3390/app11104647
AMA Style
Liu C, Wu Y, Liu J, Sun Z, Xu H. Insulator Faults Detection in Aerial Images from High-Voltage Transmission Lines Based on Deep Learning Model. Applied Sciences. 2021; 11(10):4647. https://doi.org/10.3390/app11104647
Chicago/Turabian StyleLiu, Chuanyang, Yiquan Wu, Jingjing Liu, Zuo Sun, and Huajie Xu. 2021. "Insulator Faults Detection in Aerial Images from High-Voltage Transmission Lines Based on Deep Learning Model" Applied Sciences 11, no. 10: 4647. https://doi.org/10.3390/app11104647
Note that from the first issue of 2016, this journal uses article numbers instead of page numbers. See further details here.