
A Binocular Vision-Based 3D Sampling Moiré Method for Complex Shape Measurement

1
School of Aerospace Engineering, Tsinghua University, Beijing 100084, China
2
College of Mechanical and Vehicle Engineering, Hunan University, Changsha 410082, China
*
Authors to whom correspondence should be addressed.
Appl. Sci. 2021, 11(11), 5175; https://doi.org/10.3390/app11115175
Submission received: 19 April 2021
/
Revised: 26 May 2021
/
Accepted: 28 May 2021
/
Published: 2 June 2021
(This article belongs to the Special Issue Time-Series Measurements of 3D Shape and Deformation Using Image Analysis)
Abstract
:As a promising method for moiré processing, sampling moiré has attracted significant interest for binocular vision-based 3D measurement, which is widely used in many fields of science and engineering. However, one key problem of its 3D shape measurement is that the visual angle difference between the left and right cameras causes inconsistency of the fringe image carrier fields, resulting in the phase mismatch of sampling moiré. In this paper, we developed a phase correction method to solve this problem. After epipolar rectification and carrier phase introduction and correction, the absolute phase of the fringe images was obtained. A more universal 3D sampling moiré measurement can be achieved based on the phase match and binocular vision model. Our numerical simulation and experiment showed the high robustness and anti-noise ability of this new 3D sampling moiré method for high-precision 3D shape measurement. As an application, cantilever beams are fabricated by directed energy deposition (DED) using different process parameters, and their 3D deformation caused by residual stresses is measured, showing great potential for residual stress analyses during additive manufacturing.
1. Introduction
With the rapid development of digital technology, fringe image processing methods have been widely applied to shape and deformation measurement [1,2,3]. Morimoto [1] proposed a new fringe image processing method called sampling moiré and performed a shape measurement based on digital phase shifting. Unlike the traditional phase shifting method [4,5], which requires phase shifting hardware and multiple phase shifting images, this new method makes it possible to conduct a phase analysis with a single fringe image [6]. Related research has demonstrated that, at the same order of precision, the processing time of sampling moiré is less than that of Fourier or Windowed Fourier analysis [7]. Due to the advantages of high precision and fast calculation, sampling moiré is becoming more prevalent in the real-time deformation measurement of large-scale structures [8,9,10,11], and in micro/nano-scale measurement [12,13,14,15].
For sampling moiré, 3D shape measurement can be achieved with a single camera. Morimoto [16] developed a single-camera projection fringe technique, realizing dynamic measurement of 3D shapes. Ri [17] established a spatiotemporal phase-shifting method for sampling moiré and proved that this method has higher robustness than traditional phase shifting methods. It is worth noting that the calculation of phase change caused by 3D shapes is imperative for high-precision measurement, and it is necessary to capture the fringe images of the object and the reference plane from a fixed visual angle, which ensures that the deformed and reference fringe images have the same carrier phase [18].
Compared to the single-camera measurement method, binocular vision is currently one of the most important 3D shape measurement methods. A common binocular vision technique is to use two cameras or control the tilt of a single camera to provide images in two or more visual angles [19,20]. Then the match algorithm is used to calculate the binocular disparity of the same point in both images. Finally, the 3D shape of the object is calculated according to the calibrated internal and external camera parameters. However, in binocular vision measurement, the carrier field of the captured images from different visual angles is different, making it impossible for sampling moiré to calculate the binocular disparity. Fujigaki [21,22] developed an ingenious calibration method, using the fringe pattern attached to the specimen surface for 3D shape and deformation measurements. During the calibration process, a liquid crystal calibration panel is controlled to display the phase shifting fringe pattern, and to move at equal intervals in the out-of-plane direction. Then, the relationship between the phase change and the 3D displacement can be established and calibrated. However, this method is only applicable within the moving space range of the calibration panel. Considering that the deformation range is usually unpredictable in many practical engineering problems, it was necessary to develop a more universal 3D sampling moiré method for 3D measurement.
In this study, combined with the binocular vision model [23] and sampling moiré, we proposed a 3D sampling moiré method to transcend the usual limits of the previous sampling moiré calibration methods. The numerical and experimental results showed its high robustness and anti-noise capability for accurate 3D shape measurement. This paper is organized as follows: Section 2 introduces the principle of 3D sampling moiré, including the sampling moiré, binocular vision model, and phase correction method for 3D sampling moiré. Section 3 shows a digital verification experiment and discusses the anti-noise capability of sampling moiré. Section 4 verifies the measurement accuracy of 3D sampling moiré using a three-point bending experiment. As an application, we measured the residual deformation of a cantilever beam after direct energy deposition. Section 5 presents the conclusions.
2. Principles
2.1. Principles of the Sample Moiré Method
Figure 1 shows the process of sampling moiré, primarily including sparse sampling, interpolation, and digital phase shifting. For the fringe image captured by the camera (Figure 1a), its intensity distribution is shown by the red curves in Figure 1a, which can be expressed as [24]:
where I is the fringe intensity, and Ib and Ia are the background intensity and the amplitude of the fringe intensity, respectively. The pg is the fringe pitch, and is the initial phase. The captured fringe image is sampled with an integer pixel (sampling pitch ps). Under the fixed sampling pitch, a series of sampling moiré can be obtained by changing the position of the initial sampling points. Then, the sampling moiré patterns with the same size as the original image can be obtained by using the spline difference (shown in Figure 1b). As the sampling position moves, the sampling moiré patterns also have the phase shift shown in Figure 1c. The sampling moiré spacing pm is obtained by [24]:
where pm represents the sampling moiré spacing, and the phase shift step of the sampled moiré is 2π/ ps. The intensity of the sampling moiré patterns under different phase shifting steps can be expressed as [24]:
where Im represents the sampling moiré intensity and is the phase of the initial sampling moiré patterns, which can be obtained by the discrete Fourier transform algorithm using Equation (4), as follows [6]:
2.2. Three-Dimensional Shape Measurement Method with Binocular Vision
Figure 2 shows the classical binocular vision model. The projector projects the fringe onto the object surface, and the surface images are captured by the left and right cameras. Taking the left camera as an example, the relationship between a certain point (Point A) on the object surface and the corresponding point in the digital image in the camera (Point ) can be expressed as [25]:
where (uL, vL) are the pixel coordinates of the digital image, and KL is the internal parameter matrix. The external parameter matrix, composed of the rotation matrix RL and the translation vector TL, represents the spatial relationship between the camera coordinate system and the world coordinate system. By calculating the internal and external parameter matrices of the left and right cameras simultaneously, we obtain [26]:
where and () are constants, which can be obtained by calibration. Thanks to the sampling moiré method, the pixel coordinates of a certain point in two cameras can be calculated. Then, combining the calibrated internal and external parameters, the 3D coordinates of the object can be reconstructed to realize the 3D measurement based on Equation (6).
2.3. Phase Correction
When using sampling moiré for 3D projection fringe measurement, a single camera is often used to capture the fringe image. The 3D shape of the object causes the fringe image to deform. The phase distribution of the fringe images before and after deformation are denoted by and . The phase distribution of sampling moiré before and after deformation are denoted by and . The displacement field of the fringe deformation can be expressed by Equation (7) [17]:
From a fixed viewing angle, the fringe images before and after deformation have the same original fringe pitch Pg and initial phase , which are eliminated during the process of displacement calculation by phase subtraction. This ensures that the phase difference of the sampled moiré is equal to the one of the fringe. However, in binocular vision, the spatial position and visual angle of the left and right cameras are not the same. As a result, there is a difference of initial phase between the left and right fringe images (). Moreover, the fringe pitch of the left and right images will also be different (). Therefore, it is difficult to directly use Equation (7) to calculate the binocular disparity between the left and right cameras by sampled moiré.
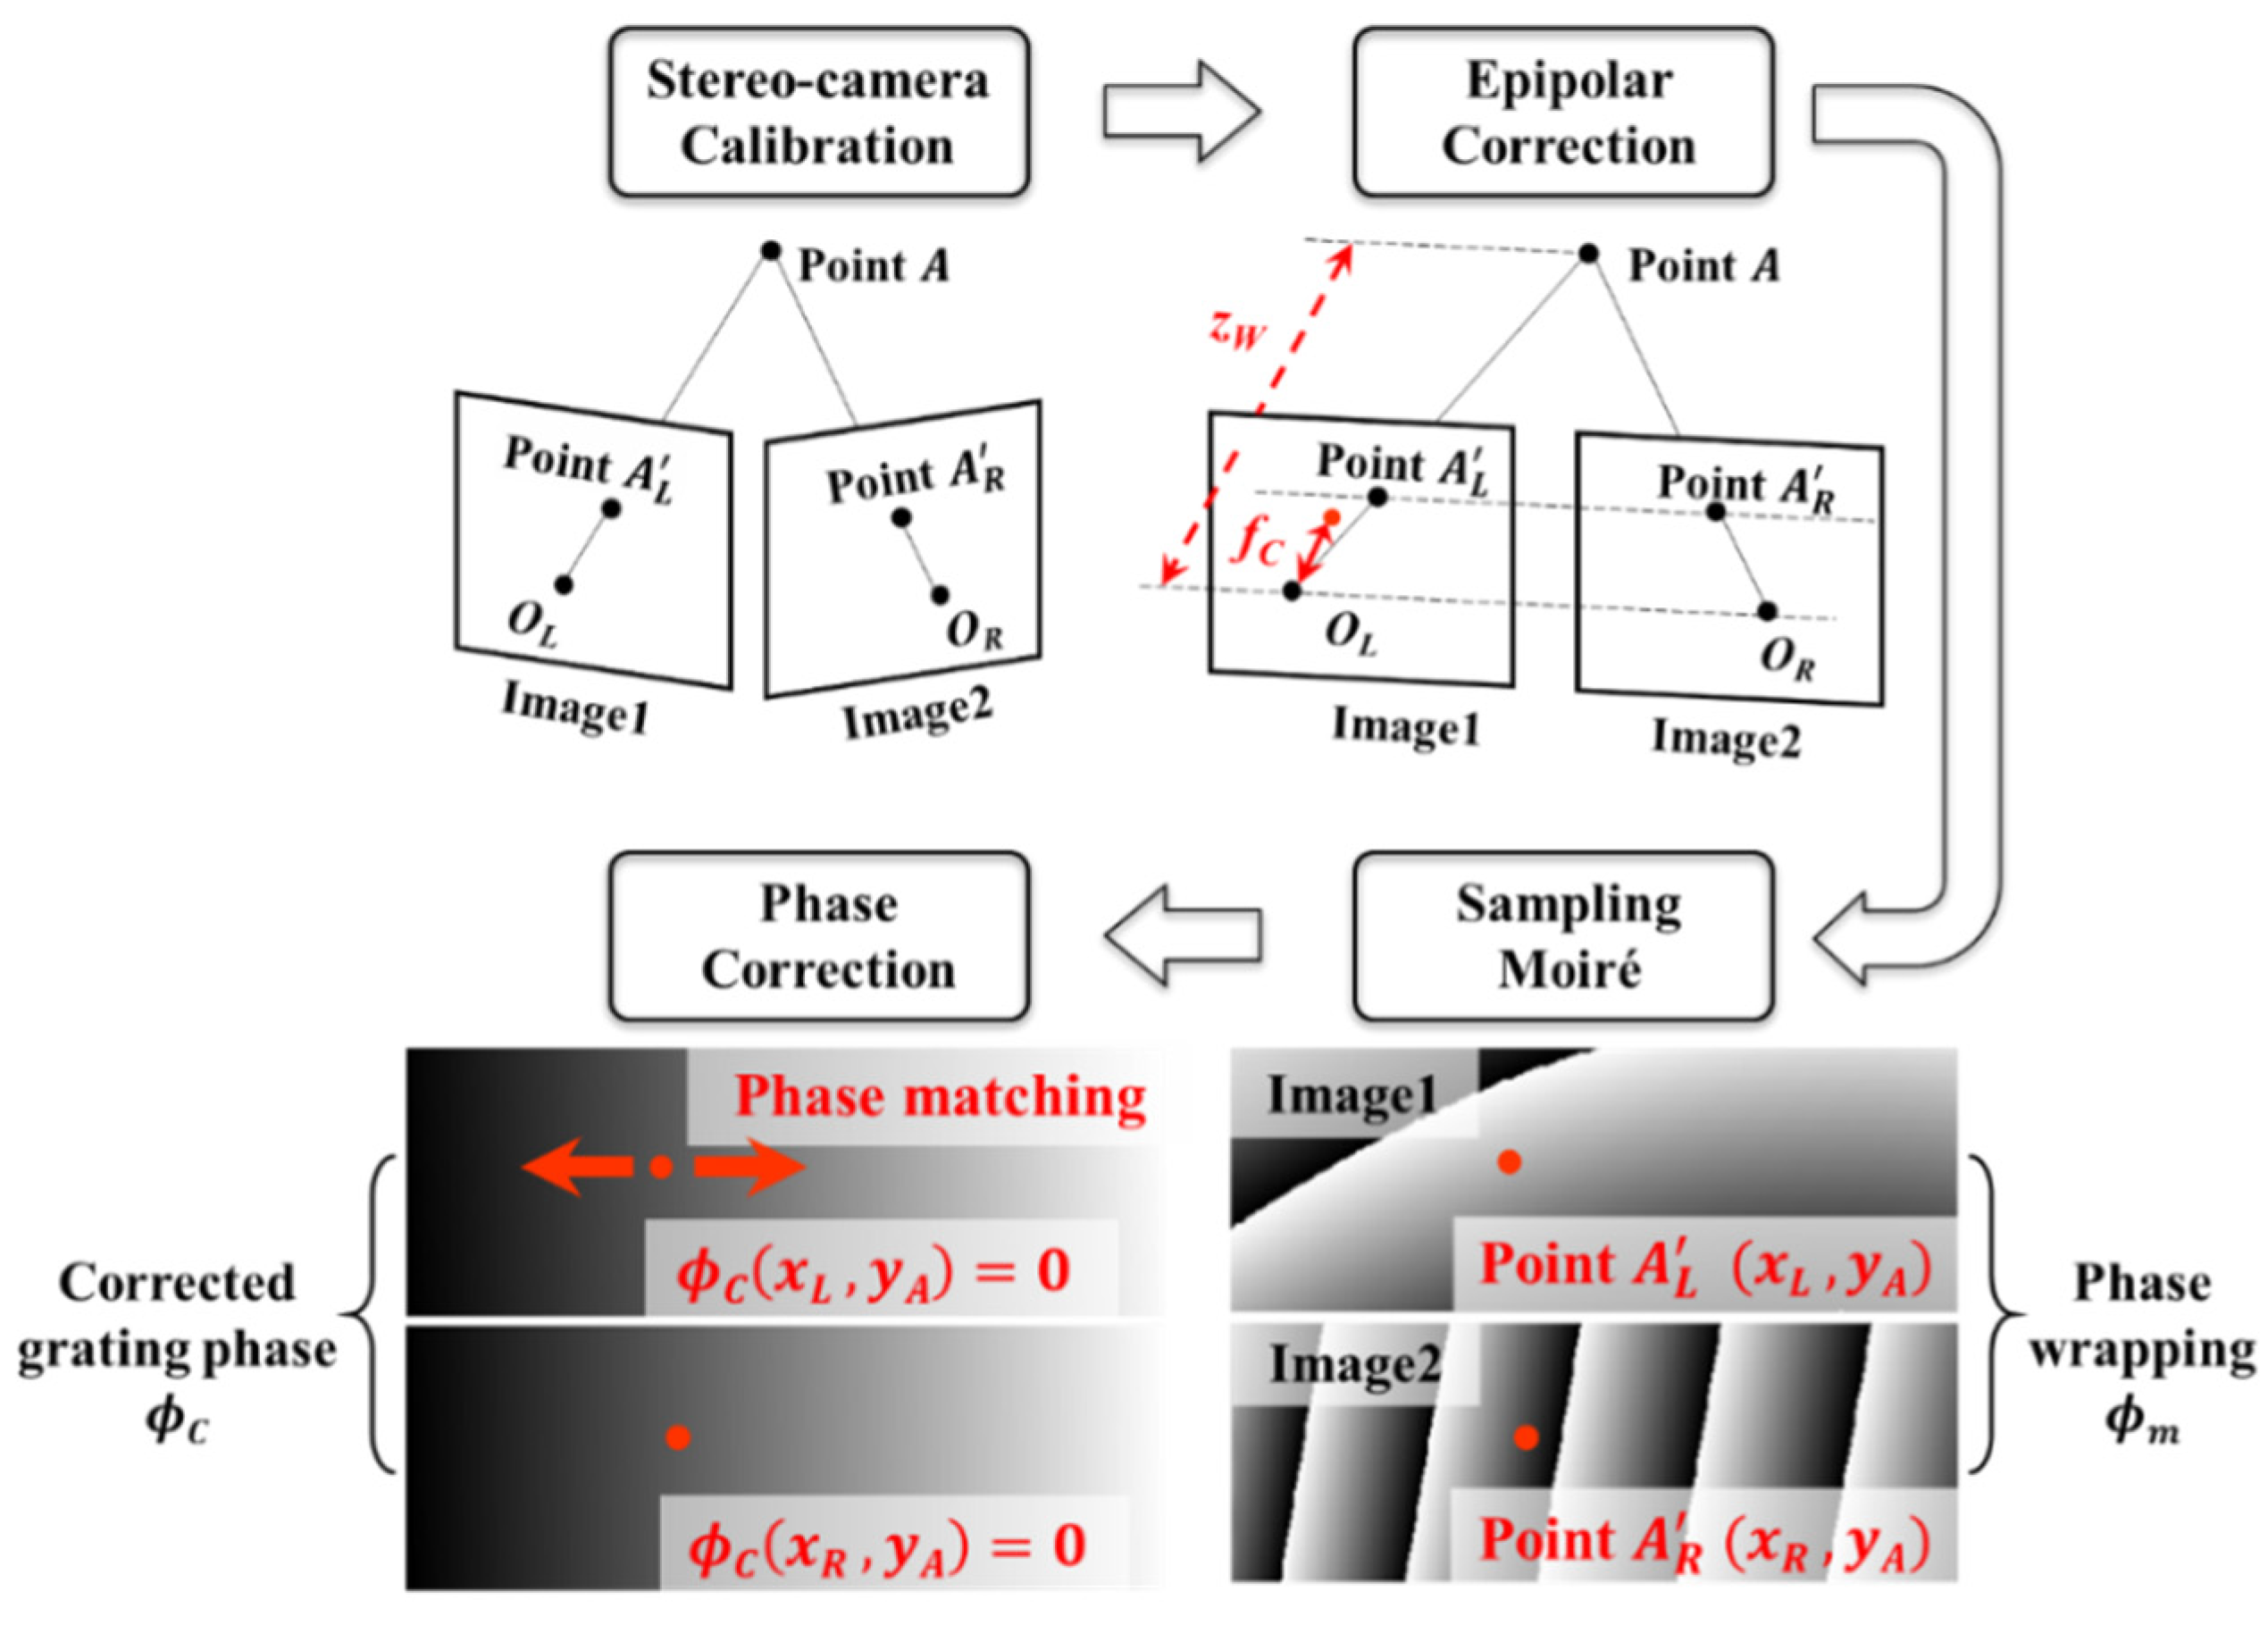
Herein, we propose a phase correction and phase matching algorithm, and its process is shown in Figure 3. First, the Zhang’s calibration method [23] is used to calibrate the internal and external parameter matrices of the left and right cameras. Then, Andrea’s algorithm [27] is used for epipolar rectification. The optical axes of the left and right cameras after correction are parallel, so that the two points (Point and Point) of the same object point (Point A) have the same y-coordinate. This step eliminates the parallax between the two cameras in the Y direction. In addition, after correction, there is a simple relationship [27] between the distance from Point A to the baseline (depth zW) and the distance between Point and Point (). As shown in Equation (8), the depth can be calculated according to the proportional relationship, so that the calculation speed is higher than when using Equation (6).
where fC represents the corrected focal length; is the spatial distance between the optical center of the left and right cameras; and is the pixel distance between image points. For the fringe images after epipolar rectification, the wrapping phase () of the sampled moiré can be obtained. Because the left and right images have different initial phases , the phase of sampling moiré needs to be corrected. The specific process is shown in Equation (9). The sampled moiré phase () is obtained after wrapped phase unwrapping, while the phase distribution of the fringe images is revealed after adding the sampling phase (). Finally, selecting any object as point A, the fringe phase of the image point ( and) is subtracted from the fringe phase of corresponding images, and the phase correction is completed. The corrected fringe phase causes the same object point to have the same phase value in the left and right images.
After phase correction, for each phase value in the left image (image1), we can search the subpixel coordinates of the same phase value in the right image (image2). Thanks to the epipolar rectification, a pair of corresponding image points in the left and right images have the same y coordinates. Consequently, the match point can be found in the same line instead of searching in the whole right image, which significantly improves the searching speed.
3. Digital Simulation Experiment and Discussions
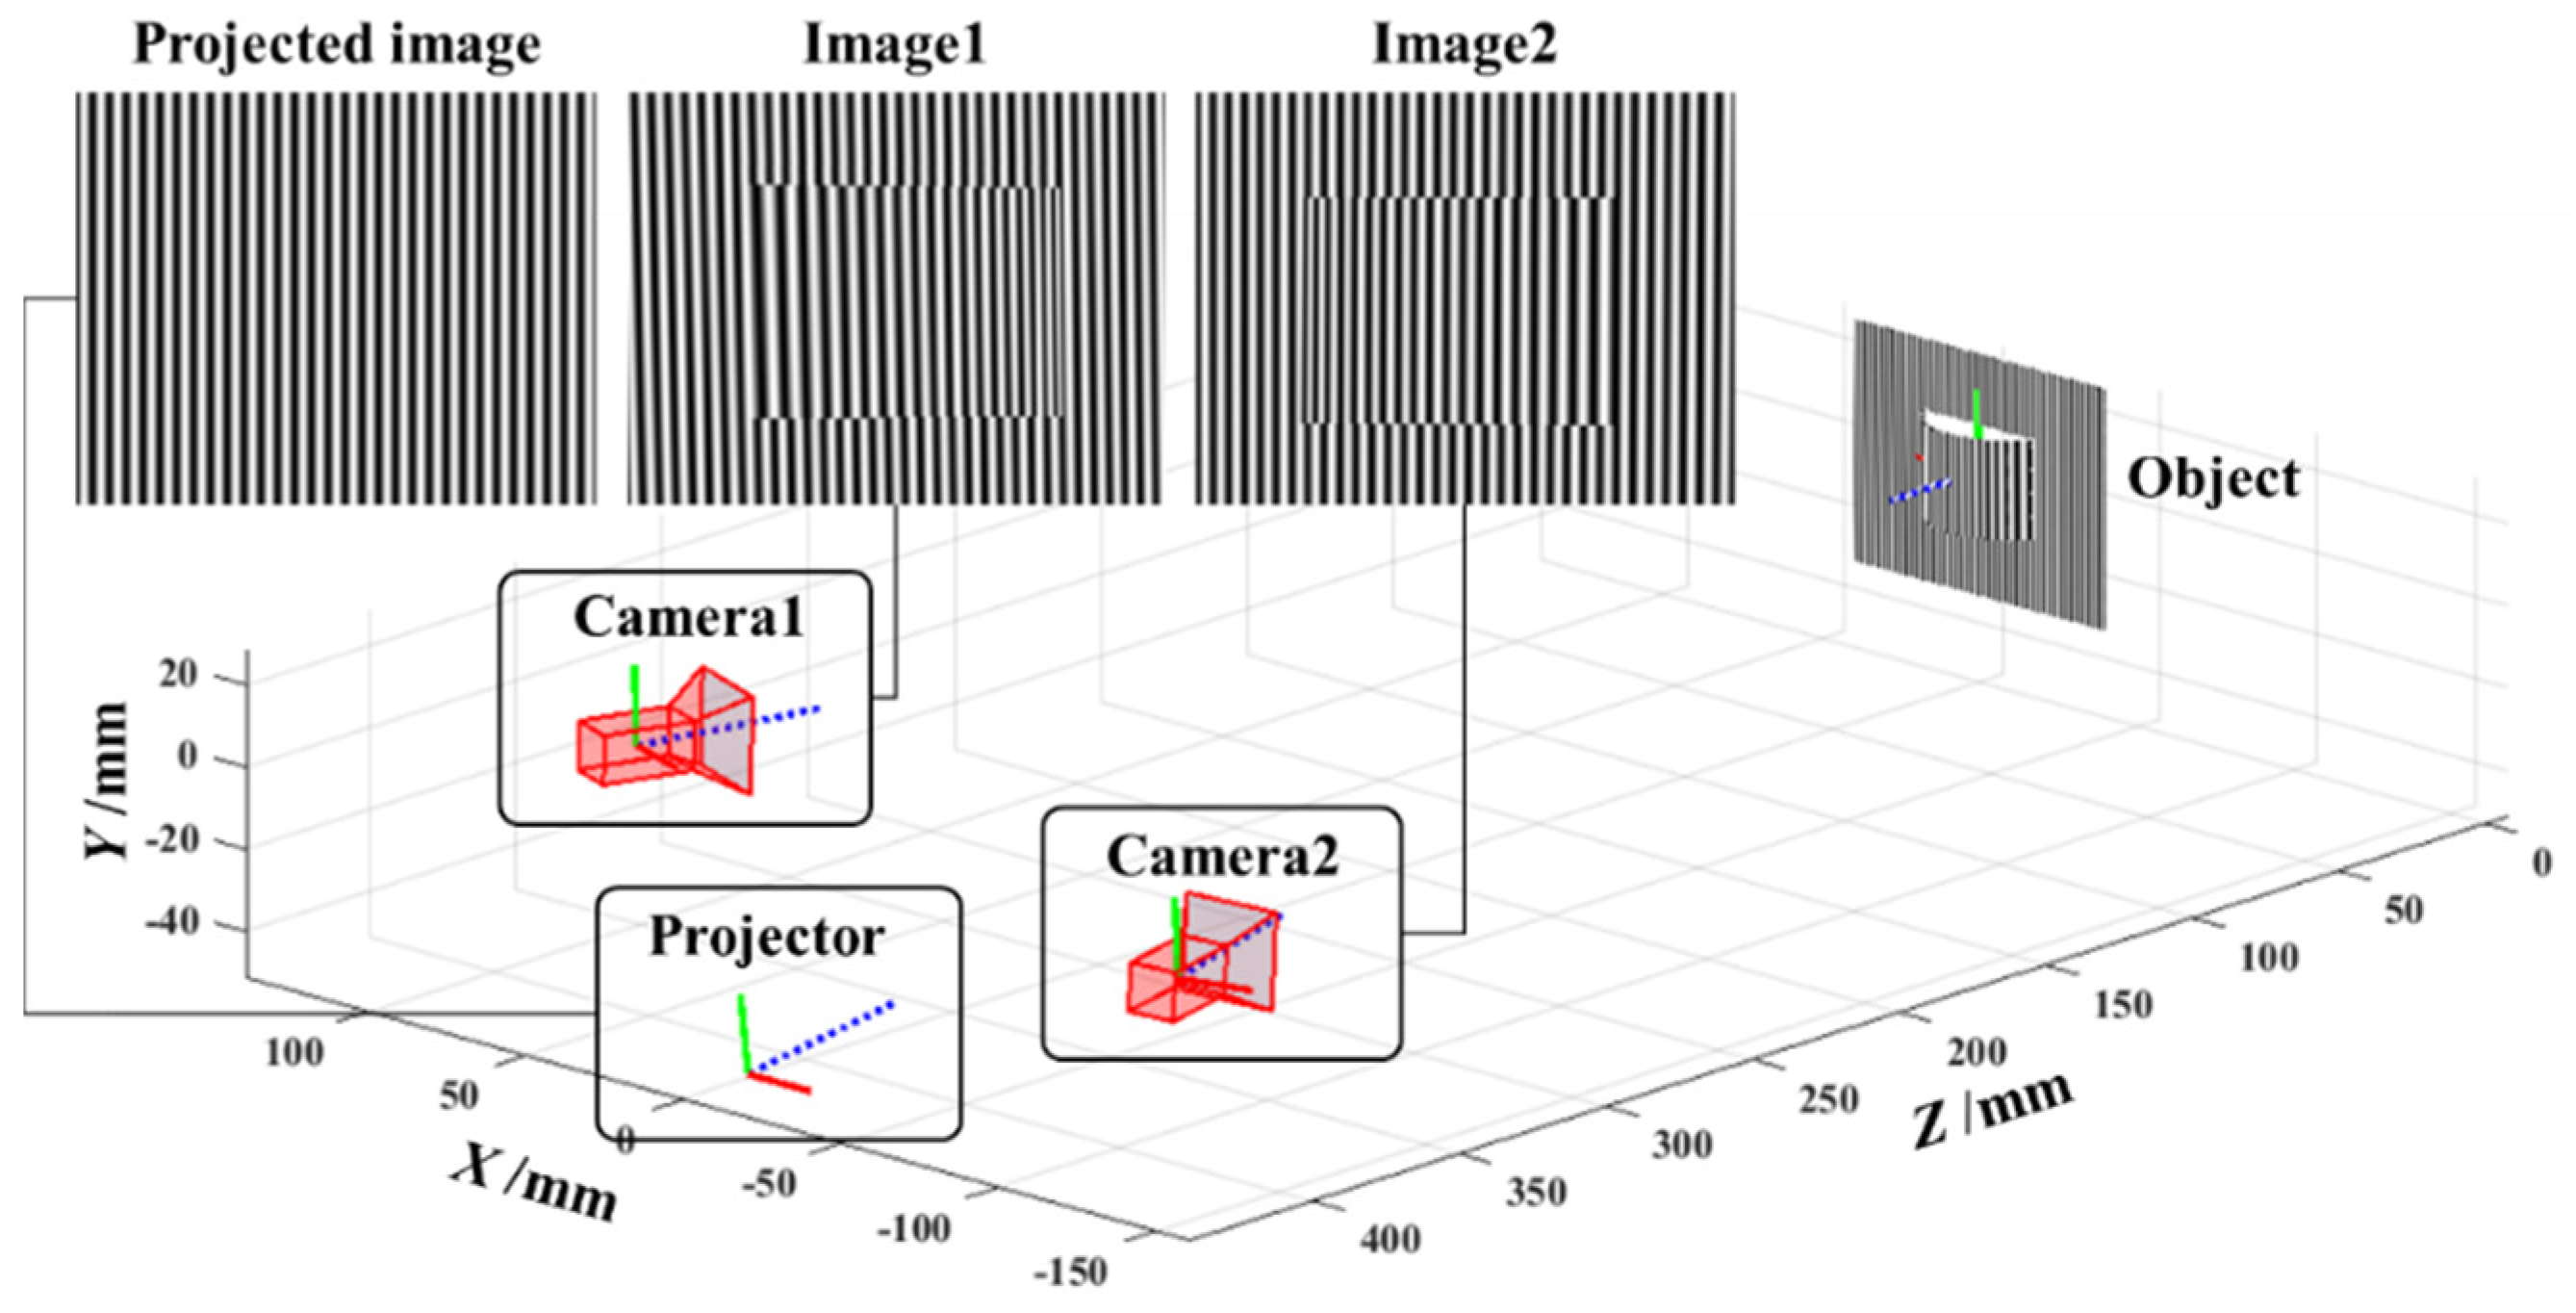
In order to verify the reliability and measurement accuracy of 3D sampling moiré (3D-SM), we developed a digital simulation platform based on MATLAB (shown in Figure 4). In the simulation, the projector projected the fringe image onto the object surface, and the left and right images were captured by both cameras. The internal and external parameters of the cameras and projector, the projection fringe images, and the 3D shape of the object can be preset to simulate 3D-SM measurement in different situations.
3.1. Precision of 3D Shape Measurement
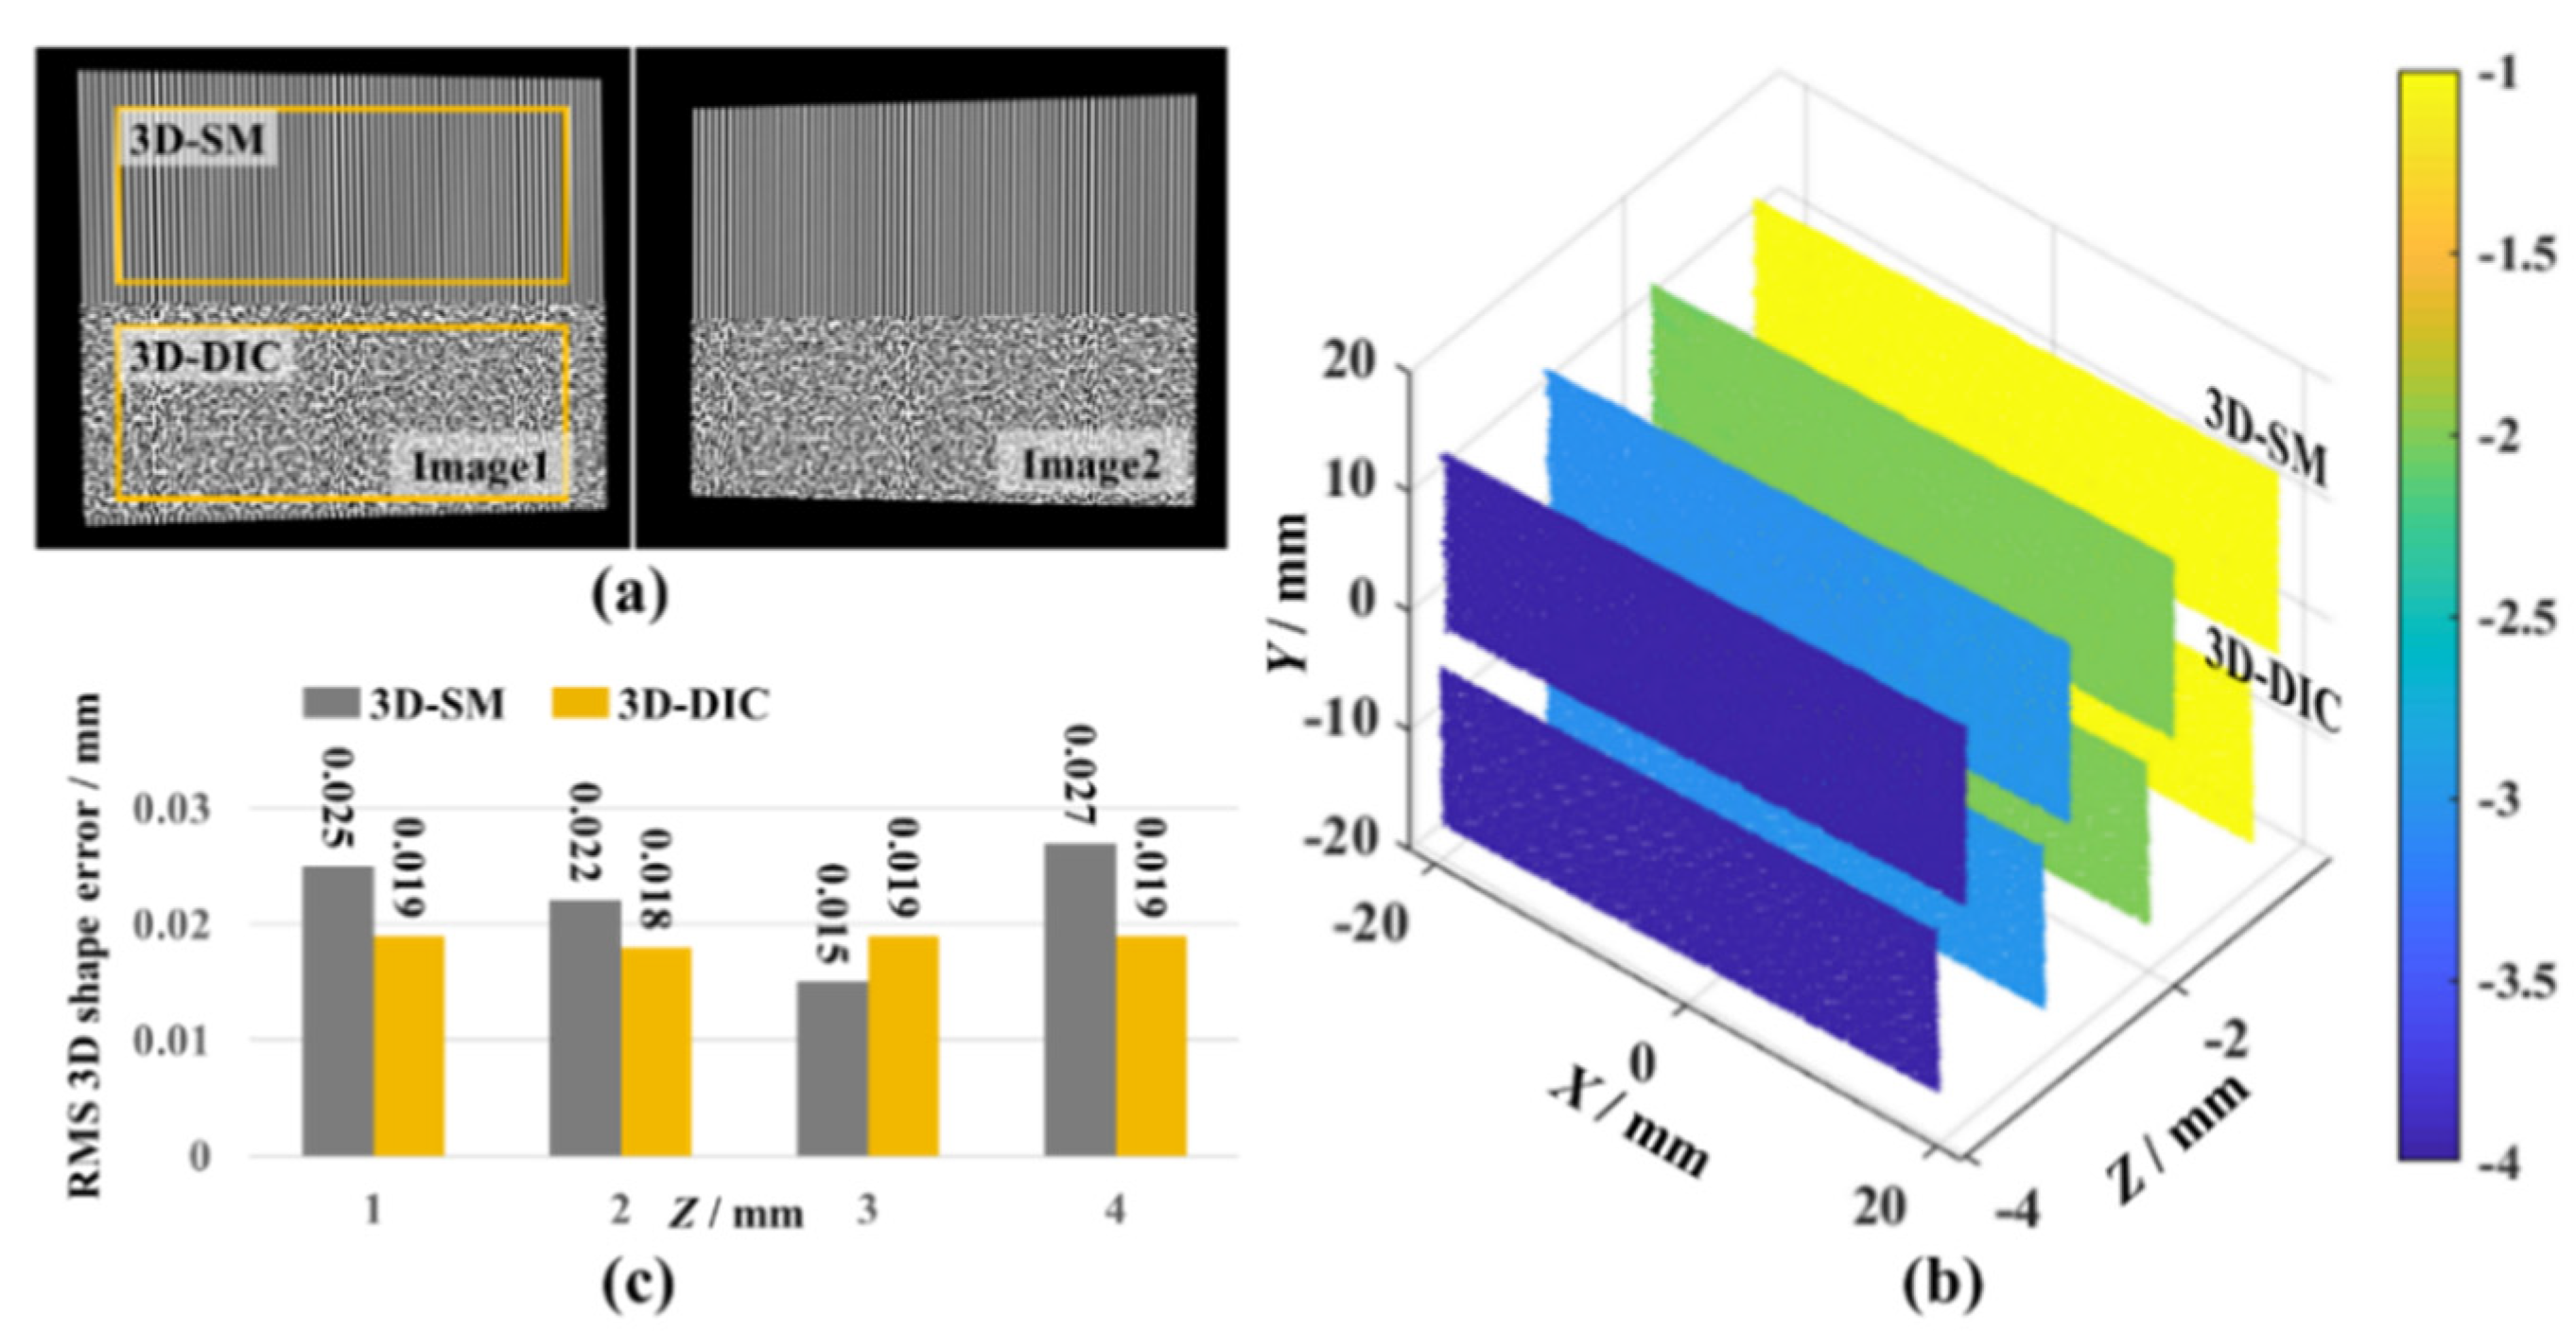
Firstly, 3D digital image correlation (3D-DIC) was used for comparison with the results of the 3D sampling moiré to verify its accuracy. For random speckle patterns, the 3D-DIC method can be used to calculate displacement by tracking the location of subsets. Three dimensional DIC has been widely used for 3D measurement with high reliability [28,29]. For a virtual plane, its upper and lower parts are projected onto fringe and speckle patterns, respectively (shown in Figure 5a). The fringe spacing is 10 pixels, and the diameter of a single speckle spot is 6~9 pixels. In the simulation experiment, the plane was translated 1, 2, 3, and 4 mm along the z-axis. Three-dimensional SM and 3D-DIC were used, respectively, to calculate the plane shape after translation. The calculation results are shown in Figure 5b. Further error analysis (Figure 5c) showed that at different translation positions, the measurement errors of 3D-SM and 3D-DIC were steady and at the same order of magnitude, which proves the reliability of 3D-SM.
3.2. Anti-Noise Ability
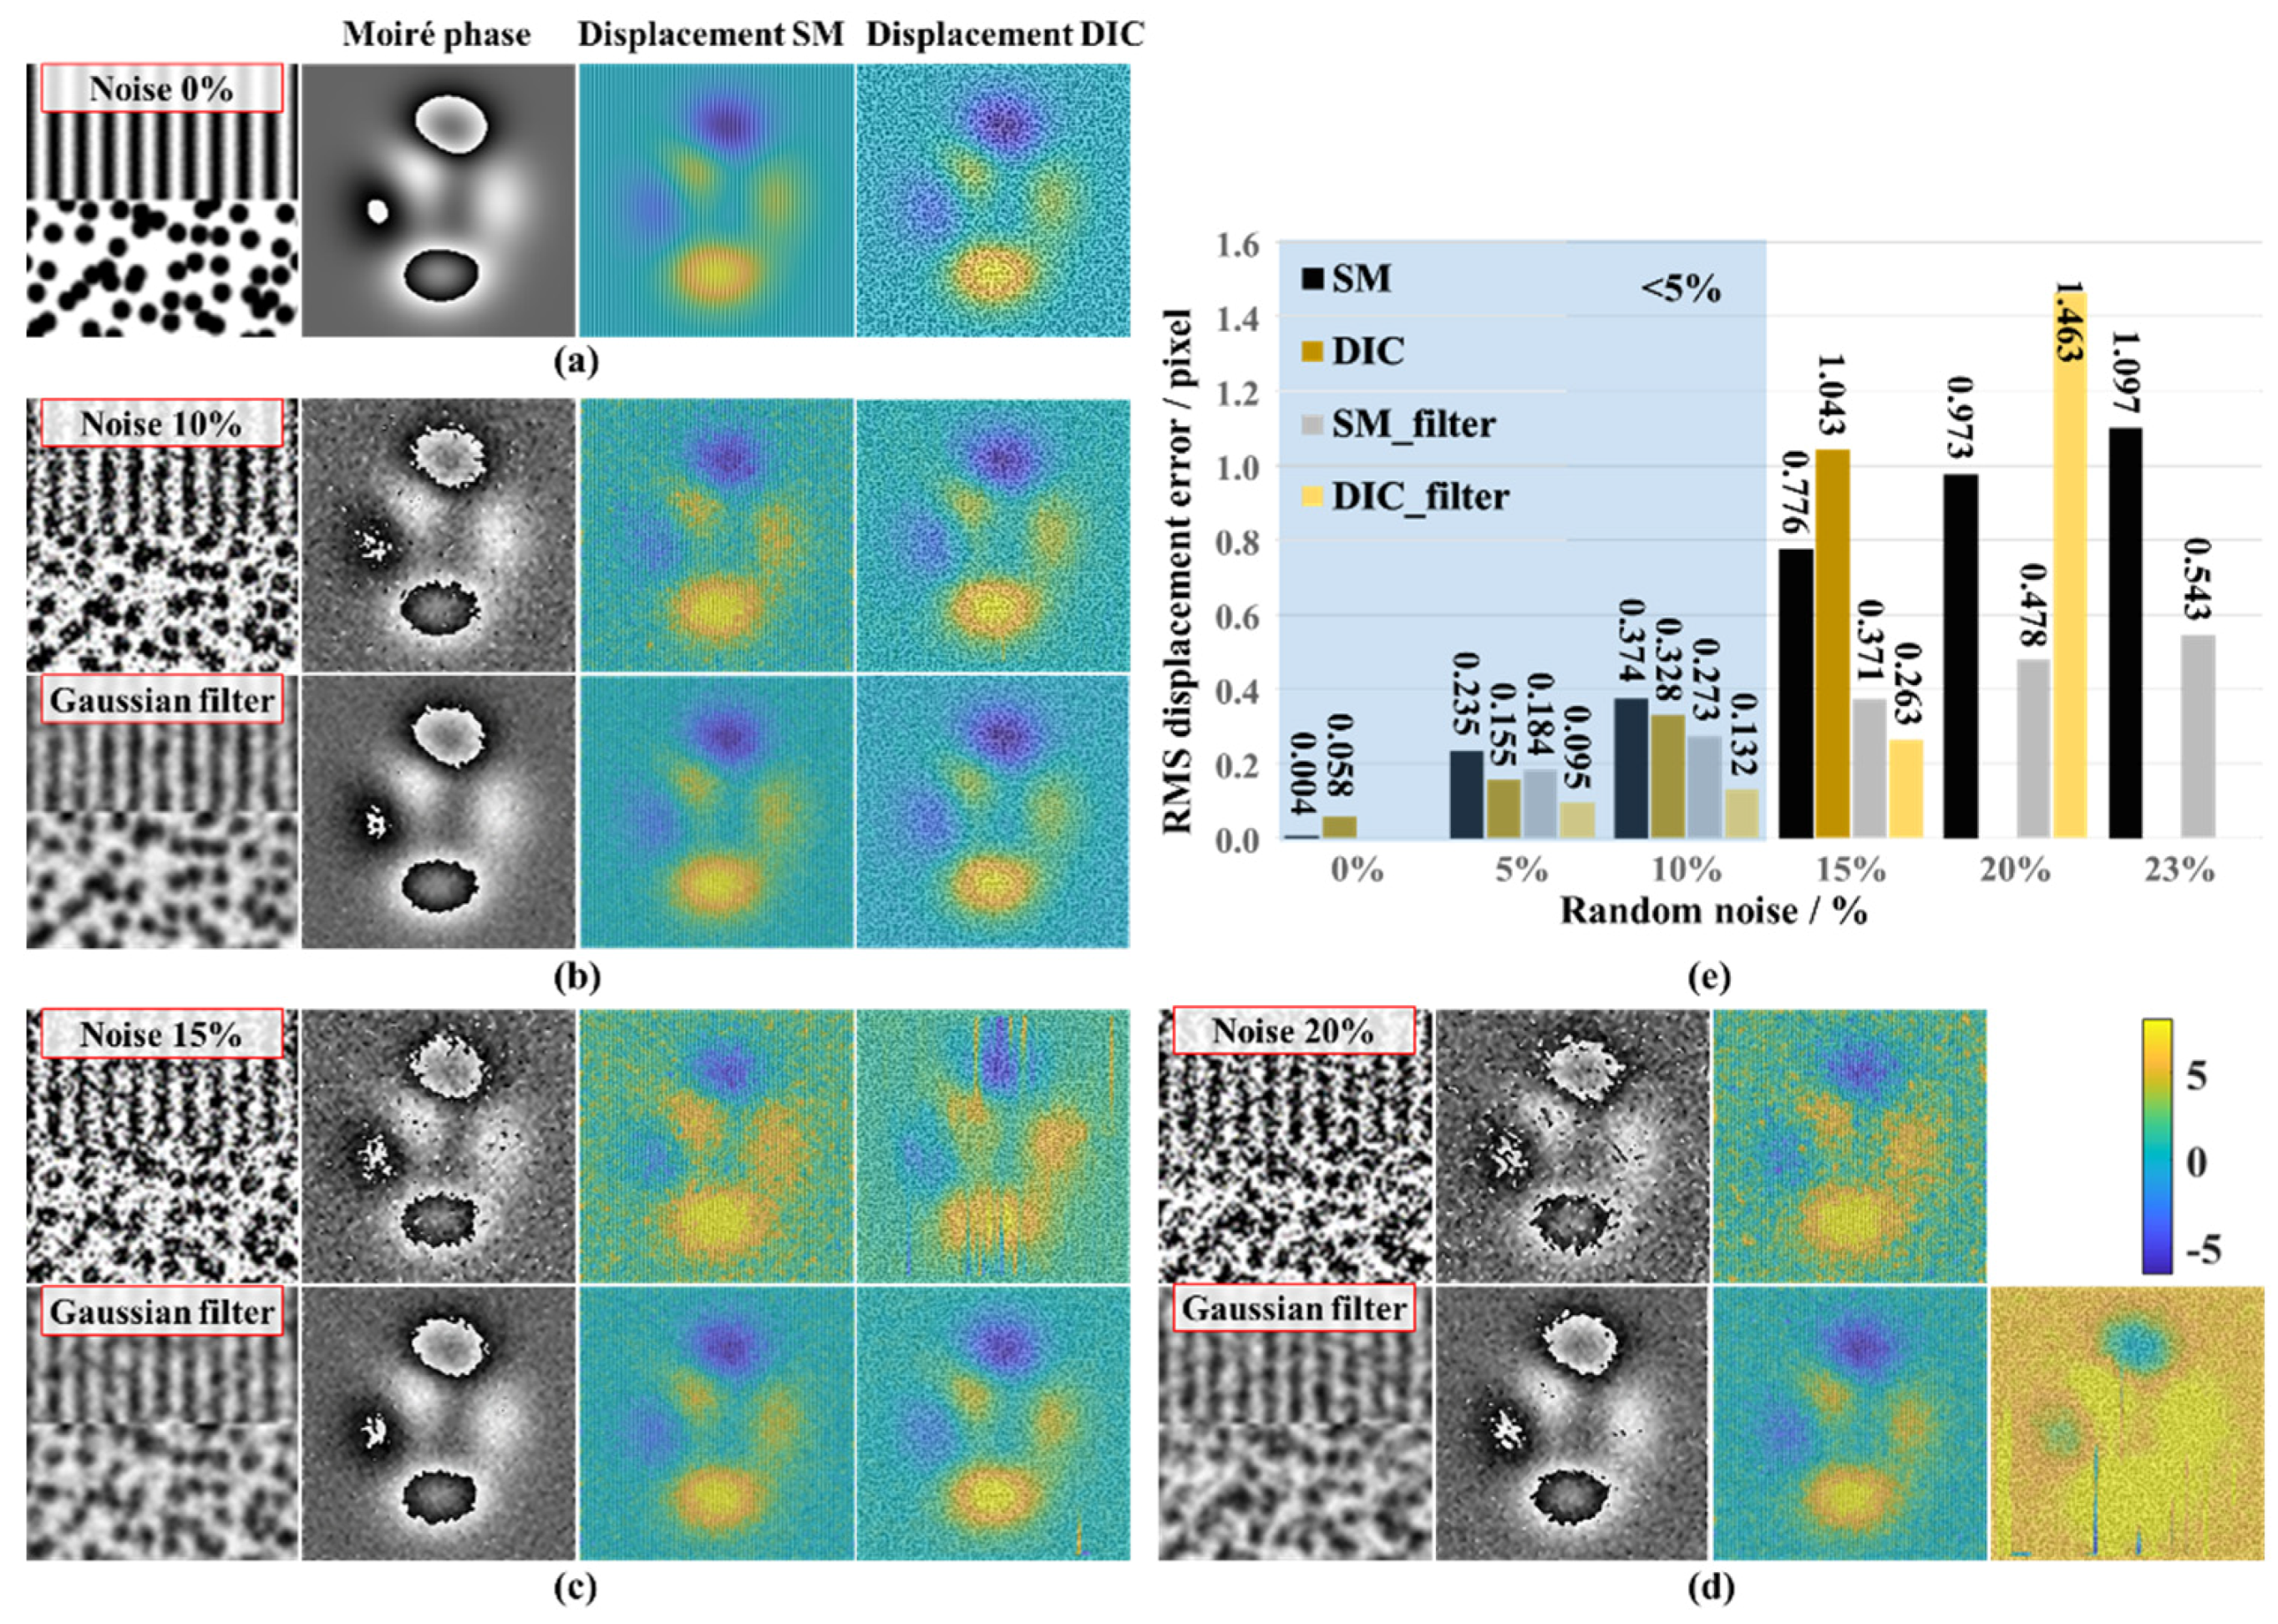
In actual measurement, noise is inevitable in digital images. The heterogeneous reflectivity of the measured object or improper settings of the camera, such as underexposure or an excessive ISO, can result in significant noise [17]. In order to verify the anti-noise capability of the sampling moiré method, we introduce displacement field u into the undeformed fringe and speckle images and obtained the deformed images through the sub-pixel difference. The expression of u is shown in Equation (10), and its value range was from –6.5 to 8.1 pixels. Second, different levels of random noise were added to the fringe and speckle images. The noise was composed of Gaussian noise with an average value of 0, a standard deviation of 0%~23%, and salt-and-pepper noise with a density of 0%~23%. In the digital experiment, the size of the fringe and speckle images was 500 × 500 pixels, the fringe spacing and sampling pitch were 10 pixels, the diameter of a single speckle in the speckle images was 7–9 pixels, and the subset size calculated by DIC was 21 × 21 pixels. In addition, a common processing method for random noise is filtering. After Gaussian filtering of the fringe and speckle images under different noise levels, the displacement field was also calculated for comparison. A Gaussian window with a size of 5 × 5 pixels and a standard deviation of 1 were used in the filtering process.
Figure 6 shows the displacement results of sampling moiré and DIC under different noise levels. As can be seen, in an ideal noise-free situation (Figure 6a), the accuracy of sampling moiré is an order of magnitude higher than that of DIC. At a noise level of 10% (Figure 6b), the root mean square (RMS) of the displacement error was similar, and both were less than 5% of the u displacement field. When the noise level reached 15% (Figure 6c), there were several obvious line-shaped zones in the DIC displacement contour, meaning that the displacement inside was not reliable. In this regard, the image filtering process can improve the result. When the noise reaches 20% (Figure 6d), the speckle images before and after deformation lose their correlation, making the DIC calculation fail, and even filter processing cannot obtain the correct result. In contrast, sampling moiré under such a noise level can still be used to acquire the displacement field. Even when the noise level reaches 23% (Figure 6d) and the fringe shape is difficult to recognize by the naked eye, the displacement field distribution obtained by sampling moiré remains close to u. According to the comparison with DIC, sampling moiré has a stronger anti-noise capability, which means it may have good potential for further applications.
3.3. Effect of Sampling Pitch
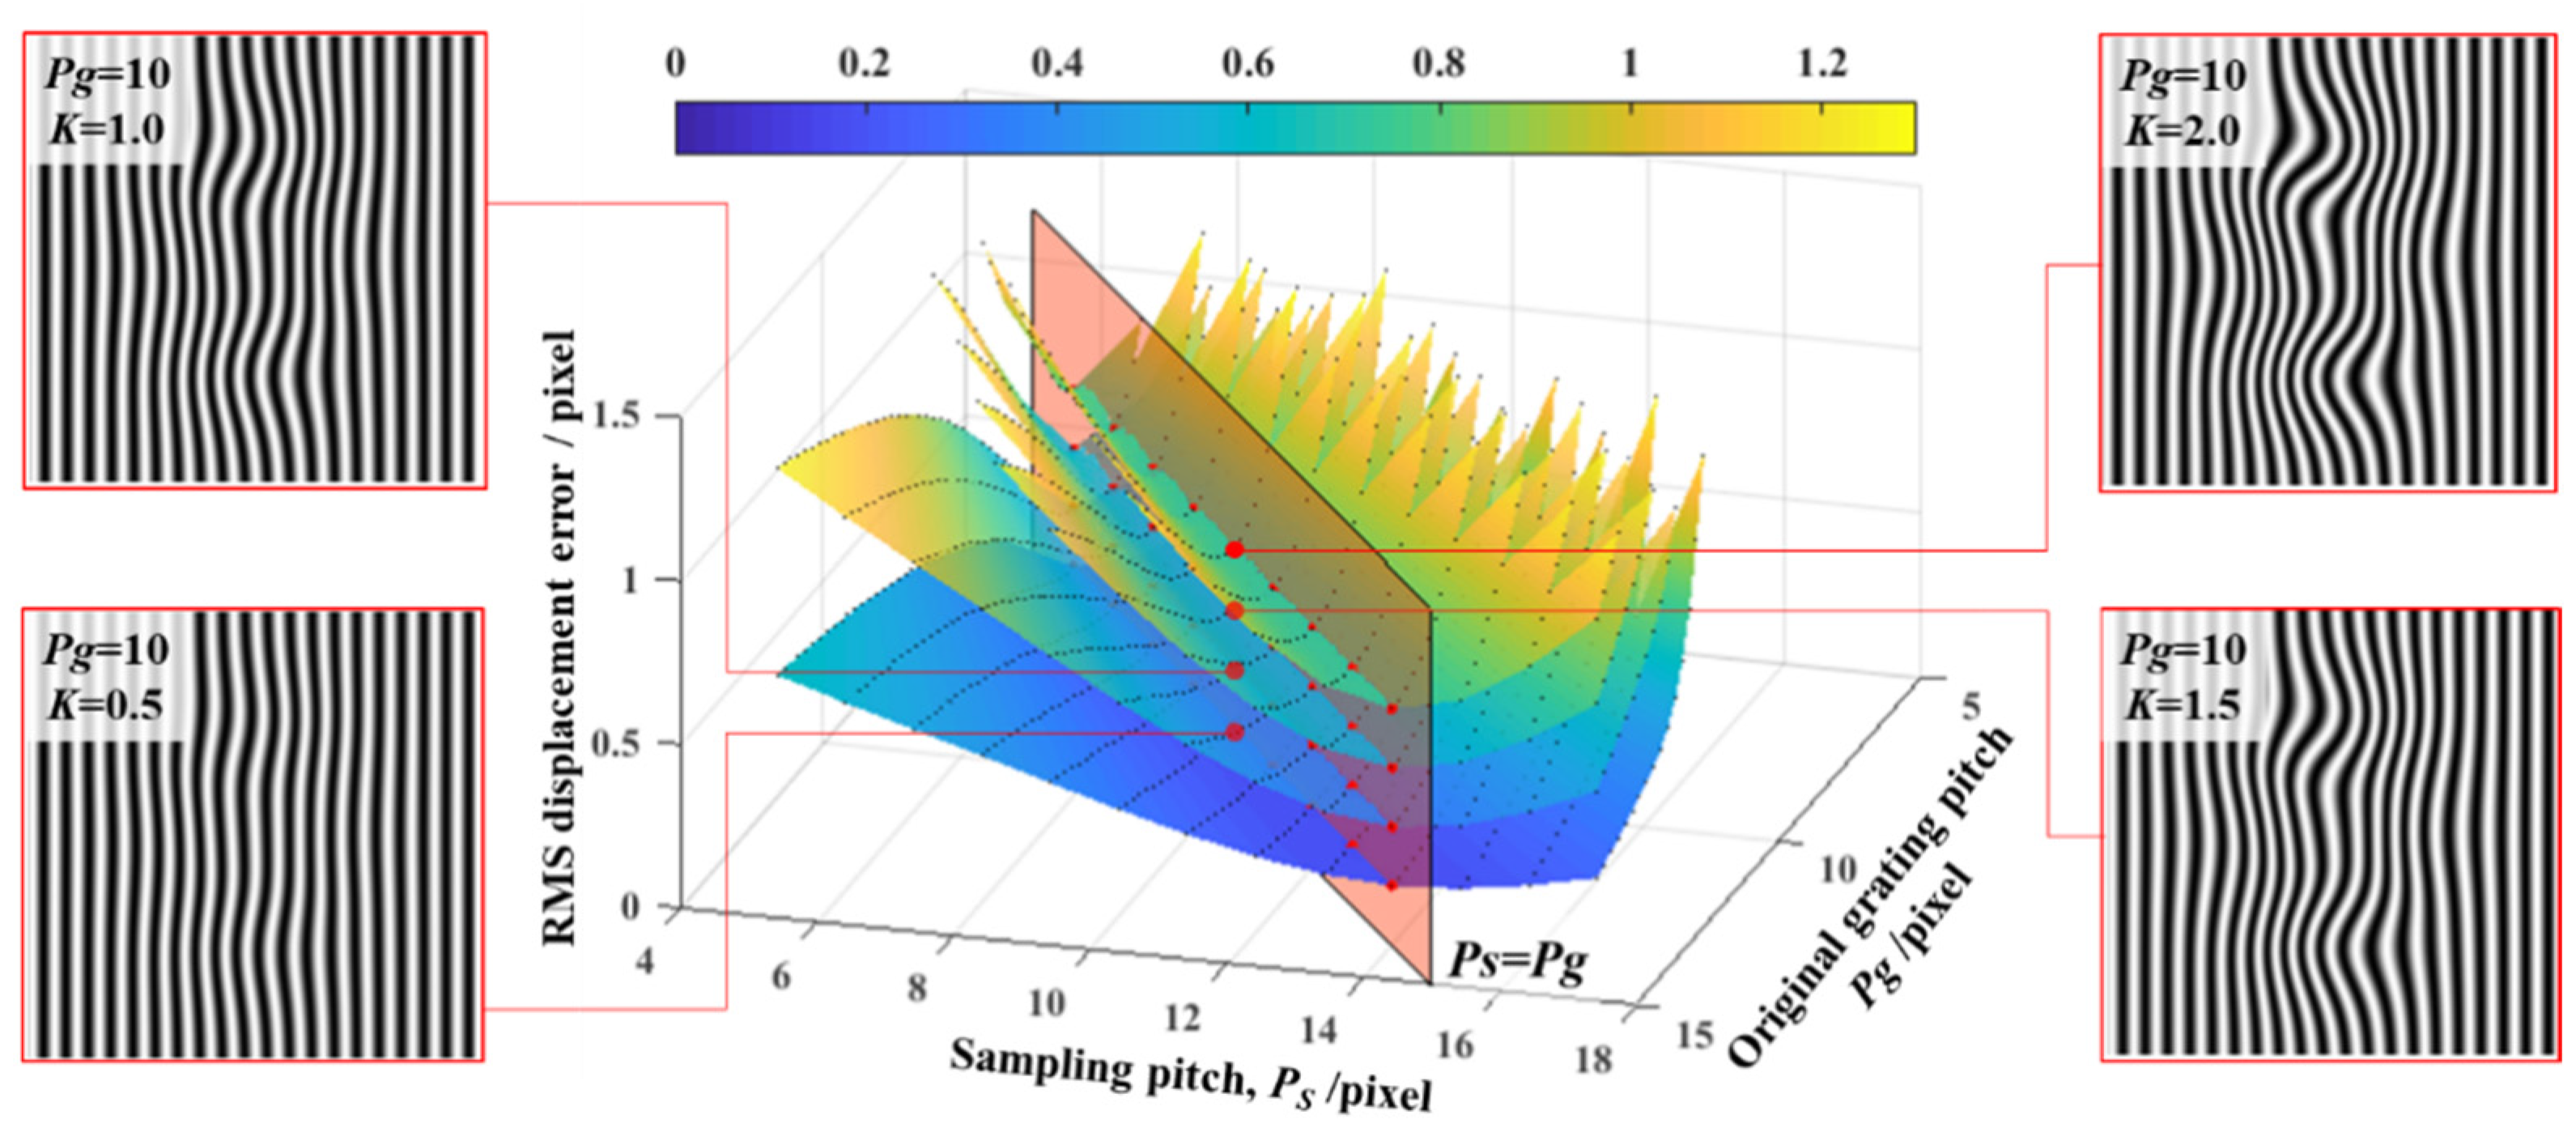
In the process of the sampling moiré calculation, the most important parameter of input is the sampling pitch PS. For a certain fringe image, different sampling pitches affect the accuracy of the phase calculation [6]. In order to study the influence of the sampling pitch Ps, we introduced the displacement field of different amplitudes into the images with different fringe spacing Pg and analyzed the displacement calculation errors caused by different sampling pitches. In the experiment, the fringe spacing range was set to 6~14 pixels, the sampling pitch range was 5~17 pixels, and the displacement field was , K = [0.5, 1.0, 1.5, 2.0]. The calculation results are shown in Figure 7. As the displacement amplitude becomes larger, the fringe images become increasingly nonlinear, and the calculation error of sampling moiré also becomes larger. It is worth noting that under different fringe spacing conditions, the calculation error reaches a minimum when the sampling pitch is close to the fringe spacing. In addition, as the deformation increases, the shape of the displacement error contour gradually changes from flat to concave, indicating that the calculation accuracy under a large deformation is more sensitive to the sampling pitch. In this situation, larger fringe spacing helps to make the calculation results of sampling moiré more stable.
3.4. Effect of the Fringe Pattern
In actual experiments, besides image noise, non-linear and oversaturated interferences often exist in the captured fringe images. Common factors affecting fringe images include non-linearity and oversaturation [17]. Figure 8 shows the influence of various factors on the phase calculation of the sampling moiré and the traditional four step phase shifting method (PS) [17]. In the simulation, the fringe period was 10 pixels, and the introduced displacement field was u. We performed a phase analysis on the ideal sinusoidal fringe, square wave fringe, oversaturated fringe, and gamma-distorted fringe images. Specifically, the duty ratio of the square wave fringe was 50%. The over-saturated fringe and gamma distortion fringe were generated according to Equation (11) (S = 150) and Equation (12) (γ = 5), respectively. In Figure 8, the intensity distribution of the fringe is drawn as a red curve.
For optical 3D measurement, phase shifting (PS) is one of the most common phase analysis methods and is applicable to the phase measurement of fringe images or interference images [4,30]. For an ideal noise-free fringe image with a sinusoidal intensity distribution (Figure 8A), the phase error caused by phase shifting is one order of magnitude smaller than sampling moiré. However, in actual experiments, the fringe, as a deformable carrier, is often similar to a square wave [31]. In this case, the phase error caused by phase shifting increases sharply (the RMS of the phase error increases by nearly 100 times), and correspondingly, the RMS of sampling moiré only increases from 0.0268 to 0.1721. In the experiment, an overlong time of exposure and overlarge aperture set caused image oversaturation, leading to the loss of detailed fringe information [17] (Figure 8C). In this case, the RMS of the sampling moiré error was 0.0335, close to the ideal result of 0.0268. Finally, the commercial projector is often gamma-corrected to adapt to the human eye. This process often leads to non-linear gamma distortion in the captured fringe image [17] (Figure 8D). It should be noted that sampling moiré is barely affected by gamma distortion, while the error of RMS (0.0298) is very close to the ideal result.
4. Experimental Verification and Application
4.1. Experimental Verification
After digital experimental verification of the 3D sampling moiré method, we used three-point bending specimens for experimental verification of the shape measurement. The experimental equipment is shown in Figure 9a. The projector projected the fringe pattern onto the specimen surface, and a high-precision stepper motor was used to apply displacement load and generate out-of-plane displacement at the panel center. The deformed fringe images were captured by the left and right cameras, and the shape was calculated by 3D sampling moiré and compared with the real value. In this experiment, the three-point bending specimen size was set to 100 × 10 × 2 mm3, while the projector and cameras were set about 750 mm away from the specimen. It is worth noting that the stepper motors advance by a fixed step displacement (0.5 μm) each time a pulse signal is provided. In each displacement loading, 2000 stepping actions of the stepping motor are used to produce an out-of-plane displacement of 1.000 mm. The projector and camera resolution were 1920 × 1080 pixels and 1280 × 1024 pixels, respectively, and the projected fringe spacing was 9 pixels.
Figure 9b shows the 3D shape of the three-point bending specimen under different displacement loadings. Among them, L0~L3 refers to the centerline of the specimen (shown by the red line). The x-z coordinates of the centerline are shown in Figure 9c. Compared with the real displacement of 1 mm, the calculated displacement at the top of the centerline was 1.047 mm, 0.966 mm, and 0.988 mm, respectively, and the average measurement error of the out-of-plane displacement was 31 μm. This result was close to the measurement accuracy of the binocular projection fringe method based on phase shifting [32,33], and sampling moiré is more suitable for dynamic measurement because the phase analysis can be completed with only one image.
4.2. Experimental Application
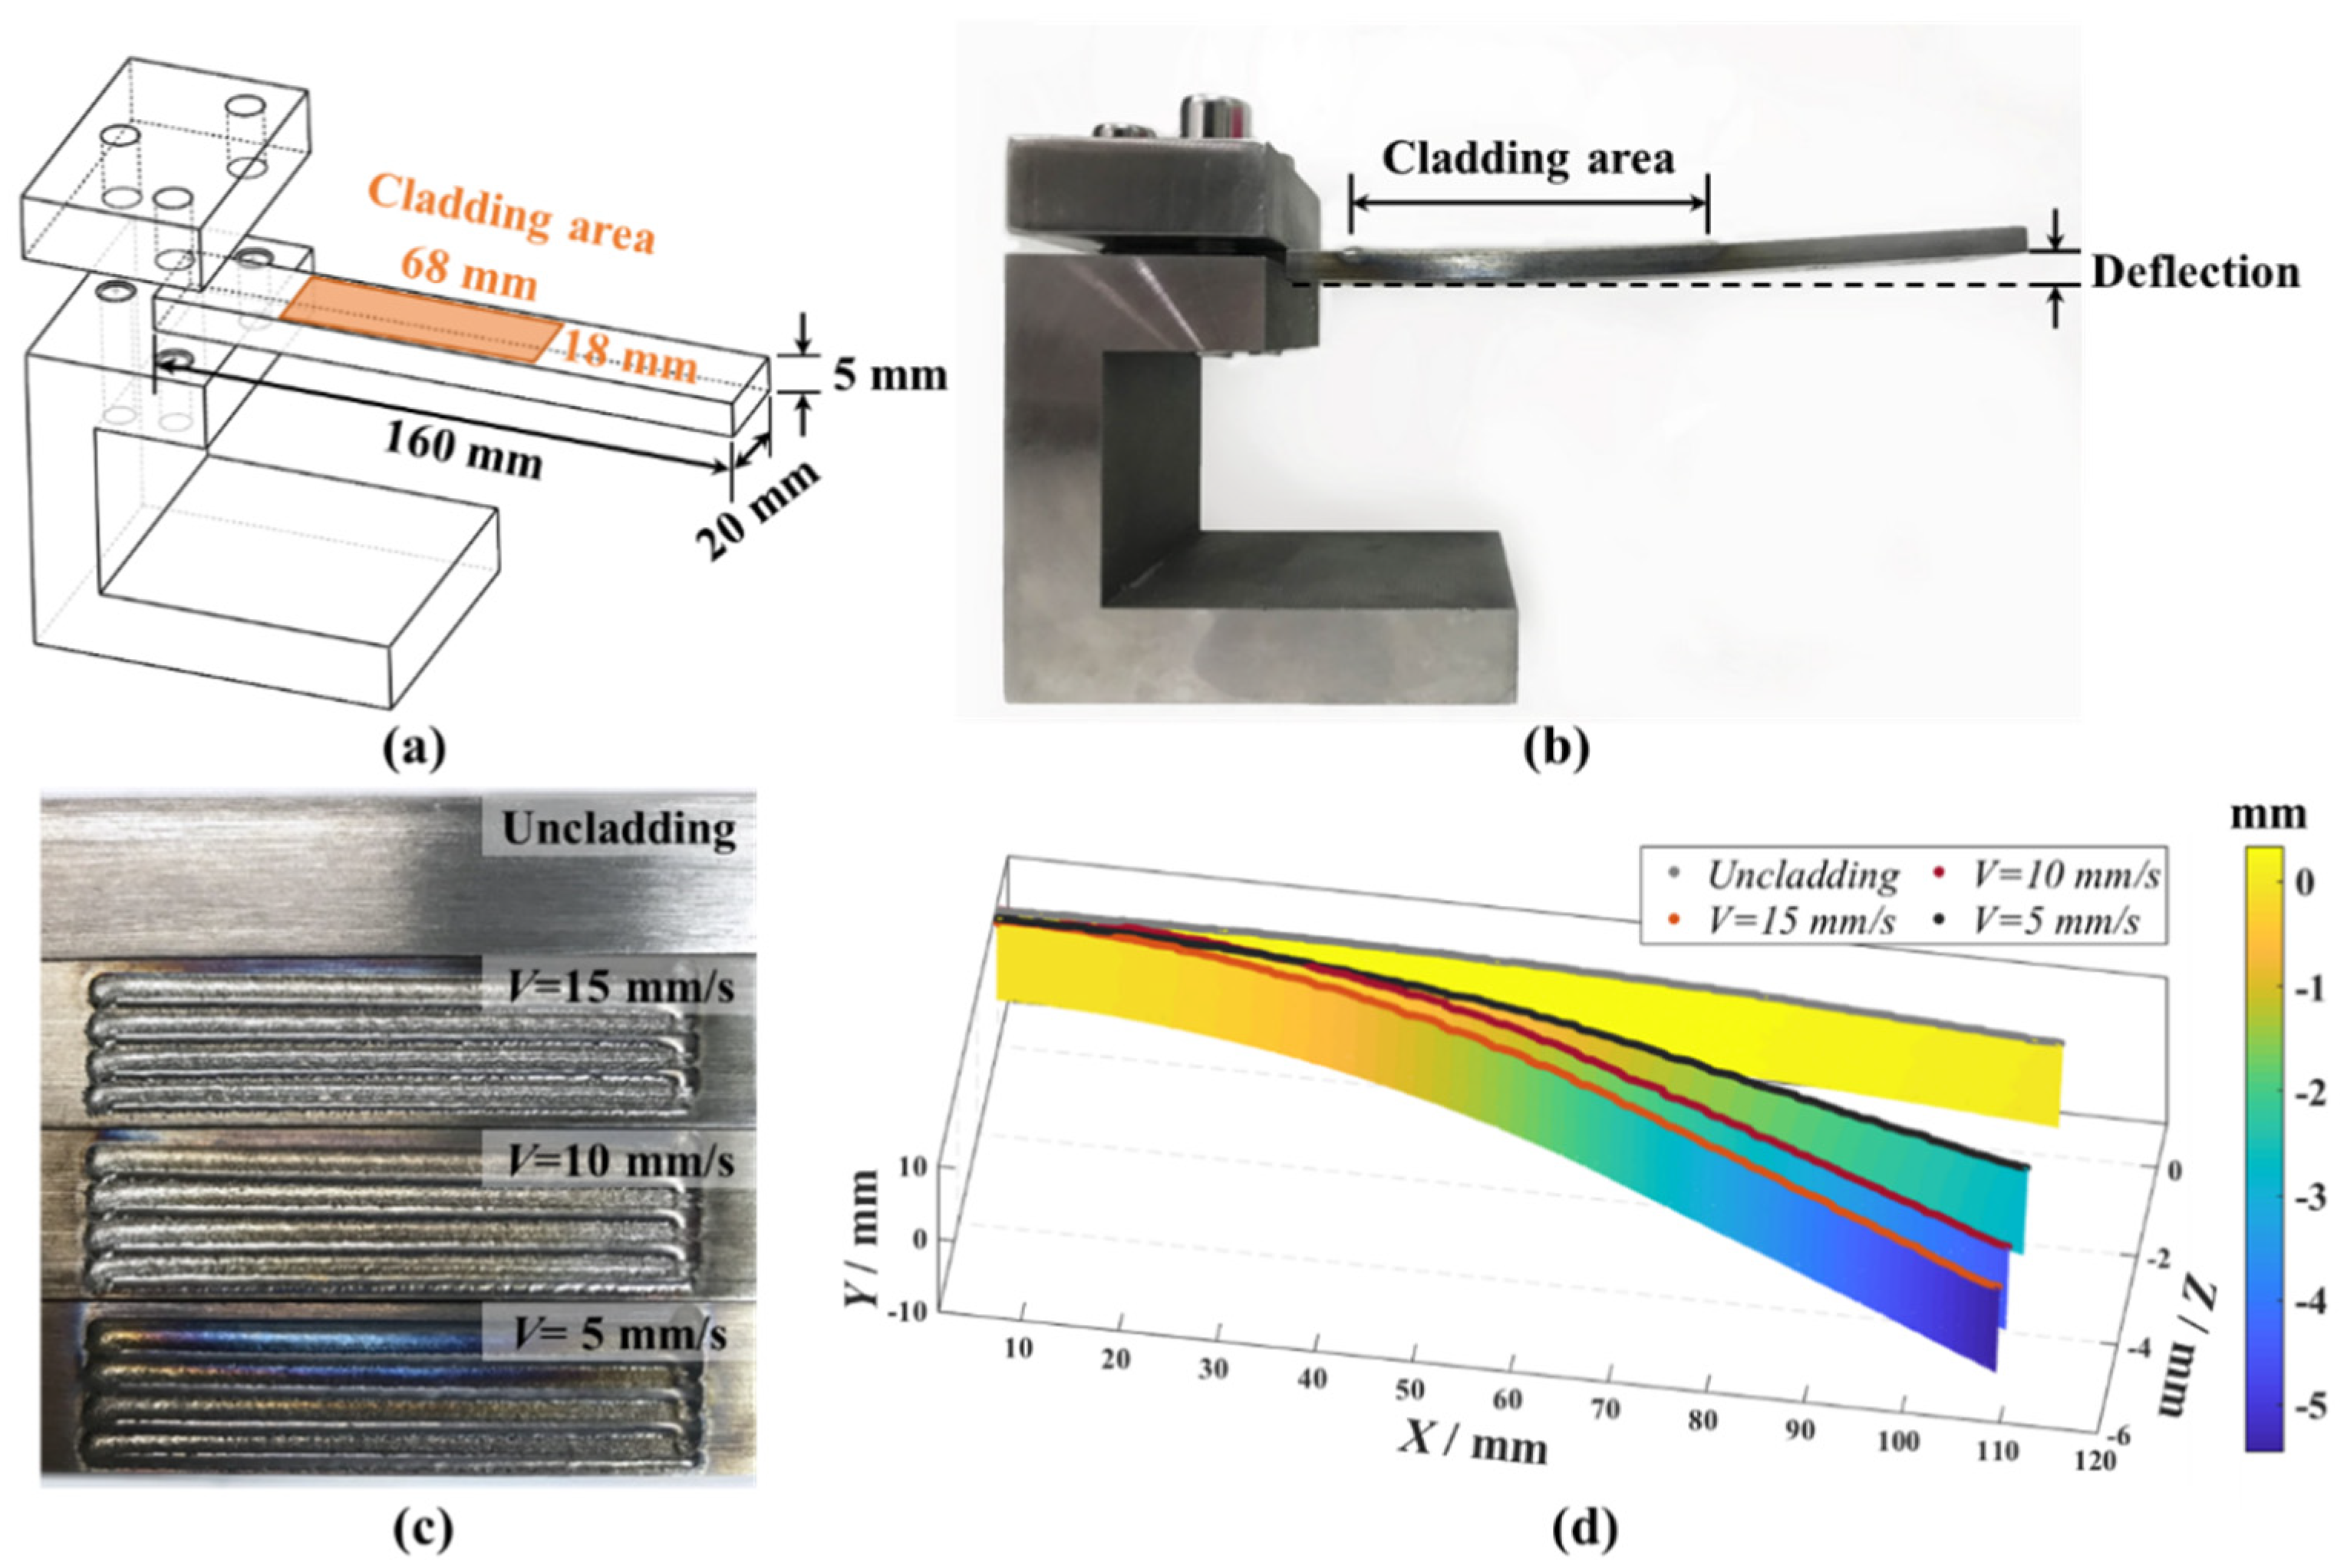
Directed energy deposition (DED)is a representative additive manufacturing technology, and has achieved rapid development in many fields, including aerospace and industrial machinery. In this technology, a laser is used to generate a molten pool in the cladding area, and then moves to realize layer-by-layer printing. During the printing process, the sharp temperature gradient causes residual stress, which will lead to the deformation of the printing specimen or even fracture failure [34]. Consequently, residual stress measurement is very important. Herein, we refer to Denlinger’s idea [35] to design the cantilever beam, as shown in Figure 10a. The cantilever beam is made of 304 stainless steel, and its size is 169 × 20 × 5 mm3. Using the same projector and cameras as in Section 4.1, the deformation of the cantilever beam is measured. A single metal layer is printed in the cladding area on the upper surface of the beam. Owing to the effect of residual stress, the cantilever beam with a cladding layer shows deflection deformation (shown in Figure 10b). In the experiment, the laser scanning speed (V) was changed to control the energy density during the printing process, and 3D sampling moiré was used to measure the deflection change of the cantilever beam, to study the effects of different printing parameters on the deformation. As shown in Figure 10c, as the scanning speed gradually decreases, the energy density input into the substrate increases, and when the scanning speed decreases to 5 mm/s, the surface of the cladding layer is significantly oxidized. Correspondingly, the deflection measurement results in Figure 10d show that as the scanning speed decreases, the deflection of the cantilever beam tends to decrease. This result indicates that 3D sampling moiré is highly beneficial to the analysis of residual deformation and stress arising from the additive manufacturing process.
5. Conclusions
Based on the binocular vision model and sampling moiré method, a universal 3D sampling moiré method was developed in this study. The main conclusions are as follows:
- (1)
- Based on the binocular vision model, the y direction parallax in the left and right images can be eliminated through epipolar rectification. On that basis, a phase correction method for sampling moiré was developed to solve the phase match problem of sampling moiré at different visual angles, and accurate measurement of 3D shapes by sampling moiré was achieved.
- (2)
- Through numerical simulation, 3D sampling moiré and 3D-DIC were compared in terms of measurement accuracy and anti-noise capability, and the influence of sampling pitch and fringe patterns on the measurement accuracy was analyzed. The results showed that the 3D sampling moiré method has the same level of measurement accuracy as 3D-DIC, but its anti-noise capability is much better than that of DIC. In the experiment, a sampling pitch close to the fringe pitch was selected, effectively reducing the measurement error. Compared with the traditional phase shifting method, sampling moiré is insensitive to the distortion of fringe patterns, so it is more effective for deformation measurement in a complex environment.
- (3)
- A three-point bending loading configuration was used for experimental verification of the measurement accuracy of 3D sampling moiré. The measurement results of 3D sampling moiré were compared with the linear displacement of the high-precision stepping motor, indicating that the average measurement error of the out-of-plane displacement was 31 μm. Three-dimensional sampling moiré has the same level of measurement accuracy as the phase shifting method, but has higher measurement efficiency because only one image is necessary for phase analysis.
- (4)
- The cantilever configuration was designed and DED carried out to print a cladding layer on the beam surface. The deflection deformation caused by the residual stress with different printing parameters was experimentally characterized based on the 3D sampling moiré method. The effective experimental results showed that this method is applicable to the deflection measurement, which has the potential for the analysis of residual deformation and stress arising in additive manufacturing processes.
Author Contributions
Conceptualization, W.S.; Methodology, W.S. and Q.Z.; Software, W.S. and Q.Z.; Supervision, H.X.; Writing—original draft, W.S.; Writing—review & editing, W.H. and H.X. All authors have read and agreed to the published version of the manuscript.
Funding
This work was financially supported by the National Natural Science Foundation of China (Grant Nos. 12032013, 11972209, and 11802156), the National Key Research and Development Program of China with grant No. 2017YFB1103900, and the National Science and Technology Major Project (2017-VⅠ-0003-0073).
Institutional Review Board Statement
Not applicable.
Informed Consent Statement
Not applicable.
Conflicts of Interest
The authors declare no conflict of interest.
References
- van der Jeught, S.; Dirckx, J.J.J. Real-time structured light profilometry: A review. Opt. Lasers Eng. 2016, 87, 18–31. [Google Scholar] [CrossRef]
- Feng, S.; Zhang, L.; Zuo, C.; Tao, T.; Chen, Q.; Gu, G. High dynamic range 3D measurements with fringe projection profilometry: A review. Meas. Sci. Technol. 2018, 29, 122001. [Google Scholar] [CrossRef]
- Mohammadi, F.; Kofman, J. Multi-Wavelength Digital-Phase-Shifting Moiré Based on Moiré Wavelength. Appl. Sci. 2019, 9, 1917. [Google Scholar] [CrossRef] [Green Version]
- Zuo, C.; Feng, S.; Huang, L.; Tao, T.; Yin, W.; Chen, Q. Phase shifting algorithms for fringe projection profilometry: A review. Opt. Lasers Eng. 2018, 109, 23–59. [Google Scholar] [CrossRef]
- González, A.L.; Meneses, J.E. Fourier Spectral Analysis to Reduce the Gamma Effect in Fringe Projection Profilometry. In Digital Holography and Three-Dimensional Imaging; Optical Society of America: Washington, DC, USA, 2019; p. Th3A.31. [Google Scholar]
- Morimoto, Y.; Fujigaki, M. Accuracy of sampling moiré method. In Proceedings of the ICEM 2008: International Conference on Experimental Mechanics, Nanjing, China, 8–11 November 2008; Volume 7375, p. 737526. [Google Scholar]
- Ri, S.; Agarwal, N.; Wang, Q.; Kemao, Q. Comparative study of sampling moiré and windowed Fourier transform techniques for demodulation of a single-fringe pattern. Appl. Opt. 2018, 57, 10402–10411. [Google Scholar] [CrossRef] [PubMed]
- Ri, S.; Saka, M.; Nanbara, K.; Kobayashi, D. Dynamic Thermal Deformation Measurement of Large-Scale, High-Temperature Piping in Thermal Power Plants Utilizing the Sampling Moiré Method and Grating Magnets. Exp. Mech. 2013, 53, 1635–1646. [Google Scholar] [CrossRef]
- Ri, S.; Muramatsu, T.; Saka, M.; Nanbara, K.; Kobayashi, D. Accuracy of the Sampling Moiré Method and its Application to Deflection Measurements of Large-Scale Structures. Exp. Mech. 2011, 52, 331–340. [Google Scholar] [CrossRef]
- Hara, T.; Nakabo, M.; Fujigaki, M. Dynamic deformation measurement of real bridge using sampling moire camera. In IEEE Conference Anthology; IEEE: New York, NY, USA, 2013; pp. 1–6. [Google Scholar]
- Ri, S.; Wang, Q.; Tsuda, H.; Shirasaki, H.; Kuribayashi, K. Optical Phase-Based Method for Dynamic Deflection Measurement of Railroad Bridge. In Mechanical Engineering and Materials; Springer: Cham, Switzerland, 2019; pp. 21–25. [Google Scholar]
- Wang, Q.; Ri, S.; Enomoto, T. Residual Thermal Strain Distribution Measurement of Underfills in Flip Chip Electronic Packages by an Inverse Approach Based on the Sampling Moiré Method. Exp. Mech. 2020, 60, 611–626. [Google Scholar] [CrossRef] [Green Version]
- Wang, Q.; Ri, S.; Tsuda, H.; Takashita, Y.; Kitamura, R.; Ogihara, S. Interlaminar Shear Behavior of Laminated Carbon Fiber Reinforced Plastic from Microscale Strain Distributions Measured by Sampling Moiré Technique. Materials 2018, 11, 1684. [Google Scholar] [CrossRef] [Green Version]
- Wang, Q.H.; Ri, S.; Tsuda, H.; Kodera, M.; Suguro, K.; Miyashita, N. Visualization and automatic detection of defect distribution in GaN atomic structure from sampling Moiré phase. Nanotechnol 2017, 28, 455704. [Google Scholar] [CrossRef] [Green Version]
- Xia, P.; Wang, Q.; Ri, S.; Tsuda, H. Calibrated Phase-Shifting Digital Holographic Microscope Using a Sampling Moiré Technique. Appl. Sci. 2018, 8, 706. [Google Scholar] [CrossRef] [Green Version]
- Morimoto, Y.; Masaya, A.; Ueki, M. High-speed 3D shape measurement by one pitch phase analysis method using brightness values in small square area of single-shot image. Opt. Lasers Eng. 2019, 113, 38–46. [Google Scholar] [CrossRef]
- Ri, S.; Wang, Q.; Xia, P.; Tsuda, H. Spatiotemporal phase-shifting method for accurate phase analysis of fringe pattern. J. Opt. 2019, 21, 095702. [Google Scholar] [CrossRef]
- Lei, Z.K.; Wang, Z.L. Vibration Testing Parameters Measured by Sampling Moiré Method. Appl. Mech. Mater. 2012, 226–228, 1975–1980. [Google Scholar] [CrossRef]
- Cheng, X.; Liu, X.; Li, Z.; Zhong, K.; Han, L.; He, W.; Gan, W.; Xi, G.; Wang, C.; Shi, Y. High-Accuracy Globally Consistent Surface Reconstruction Using Fringe Projection Profilometry. Sensors 2019, 19, 668. [Google Scholar] [CrossRef] [Green Version]
- Marinello, F.; Bariani, P.; Pasquini, A.; De Chiffre, L.; Bossard, M.; Picotto, G.B. Increase of maximum detectable slope with optical profilers, through controlled tilting and image processing. Meas. Sci. Technol. 2007, 18, 384–389. [Google Scholar] [CrossRef]
- Tomita, D.; Murata, Y.; Fujigaki, M. 3D Displacement Distribution Measurement Using Sampling Moire Method with Multiple Cameras. In Emerging Challenges for Experimental Mechanics in Energy and Environmental Applications, Proceedings of the 5th International Symposium on Experimental Mechanics and 9th Symposium on Optics in Industry (ISEM-SOI); Conference Proceedings of the Society for Experimental Mechanics Series; Martínez-García, A., Furlong, C., Barrientos, B., Pryputniewicz, R., Eds.; Springer: New York, NY, USA, 2015. [Google Scholar] [CrossRef]
- Shimo, K.; Fujigaki, M.; Masaya, A.; Morimoto, Y. Dynamic shape and strain measurements of rotating tire using a sampling moiré method. Opt. Eng. 2011, 50. [Google Scholar] [CrossRef]
- Zhang, Z. A Flexible New Technique for Camera Calibration. IEEE Trans. Pattern Anal. Mach. Intell. 2000, 22, 1330–1334. [Google Scholar] [CrossRef] [Green Version]
- Zhang, Q.; Xie, H. Determination of the moiré spacing in sampling moiré method based on the generation mechanism of sampling moiré. In Proceedings of the Sixth International Conference on Optical and Photonic Engineering (icOPEN 2018), Shanghai, China, 24 July 2018; Volume 10827, p. 082724. [Google Scholar]
- Sonka, M.; Hlavac, V.; Boyle, R. Image Processing, Analysis, and Machine Vision; Cengage Learning: Boston, MA, USA, 2014. [Google Scholar]
- Hu, Z.; Xie, H.; Lu, J.; Wang, H.; Zhu, J. Error evaluation technique for three-dimensional digital image correlation. Appl. Opt. 2011, 50, 6239–6247. [Google Scholar] [CrossRef] [PubMed]
- Fusiello, A.; Trucco, E.; Verri, A. A compact algorithm for rectification of stereo pairs. Mach. Vis. Appl. 2000, 12, 16–22. [Google Scholar] [CrossRef]
- Pan, B.; Wu, D.; Yu, L. Optimization of a three-dimensional digital image correlation system for deformation measurements in extreme environments. Appl. Opt. 2012, 51, 4409–4419. [Google Scholar] [CrossRef] [PubMed]
- Sutton, M.; Yan, J.; Tiwari, V.; Schreier, H.; Orteu, J. The effect of out-of-plane motion on 2D and 3D digital image correlation measurements. Opt. Lasers Eng. 2008, 46, 746–757. [Google Scholar] [CrossRef] [Green Version]
- Zhang, S. Absolute phase retrieval methods for digital fringe projection profilometry: A review. Opt. Lasers Eng. 2018, 107, 28–37. [Google Scholar] [CrossRef]
- Fujigaki, M.; Tomita, D.; Murata, Y. Surface Orientation Measurement Using Sampling Moire Method; Advancement of Optical Methods in Experimental Mechanics, Volume 3; Springer: New York, NY, USA, 2017; pp. 49–54. [Google Scholar]
- He, W.; Zhong, K.; Li, Z.; Meng, X.; Cheng, X.; Liu, X.; Shi, Y. Accurate calibration method for blade 3D shape metrology system integrated by fringe projection profilometry and conoscopic holography. Opt. Lasers Eng. 2018, 110, 253–261. [Google Scholar] [CrossRef]
- Zhong, K.; Li, Z.; Li, R.; Shi, Y.; Wang, C. Pre-calibration-free 3D shape measurement method based on fringe projection. Opt. Express 2016, 24, 14196–14207. [Google Scholar] [CrossRef] [PubMed]
- Mukherjee, T.; Zuback, J.; Zhang, W.; DebRoy, T. Residual stresses and distortion in additively manufactured compositionally graded and dissimilar joints. Comput. Mater. Sci. 2018, 143, 325–337. [Google Scholar] [CrossRef]
- Denlinger, E.R.; Heigel, J.C.; Michaleris, P.; Palmer, T. Effect of inter-layer dwell time on distortion and residual stress in additive manufacturing of titanium and nickel alloys. J. Mater. Process. Technol. 2015, 215, 123–131. [Google Scholar] [CrossRef]
Figure 1.
The flow chart of the sample moiré method. (a) Fringe image, (b) Sampled points in the fringe image, (c) Multiple phase-shifted sampling moiré patterns obtained by sampled point interpolation, (d) The phase distribution of the initial sampling moiré pattern.
Figure 1.
The flow chart of the sample moiré method. (a) Fringe image, (b) Sampled points in the fringe image, (c) Multiple phase-shifted sampling moiré patterns obtained by sampled point interpolation, (d) The phase distribution of the initial sampling moiré pattern.

Figure 2.
The binocular vision mode.

Figure 3.
Phase correction process.

Figure 4.
Digital simulation of 3D-sample moiré.

Figure 5.
Comparison of 3D shape measured by 3D-SM and 3D-DIC. (a) Left and right view of the virtual plane, (b) Measurement results of 3D-SM and 3D-DIC, (c) RMS 3D shape error of different displacements.
Figure 5.
Comparison of 3D shape measured by 3D-SM and 3D-DIC. (a) Left and right view of the virtual plane, (b) Measurement results of 3D-SM and 3D-DIC, (c) RMS 3D shape error of different displacements.

Figure 6.
The RMS displacement error versus random noise obtained by SM and DIC. (a) Noise-free (b) Noise 10%, (c) Noise 15%, (d) Noise 20%, (e) RMS displacement error under different noise levels.
Figure 6.
The RMS displacement error versus random noise obtained by SM and DIC. (a) Noise-free (b) Noise 10%, (c) Noise 15%, (d) Noise 20%, (e) RMS displacement error under different noise levels.

Figure 7.
The RMS displacement errors when the original fringe pitch changes from 6 to 14 pixels and the sampling pitch changes from 4 to 17 pixels.
Figure 7.
The RMS displacement errors when the original fringe pitch changes from 6 to 14 pixels and the sampling pitch changes from 4 to 17 pixels.

Figure 8.
Comparison results of the RMS phase error for different fringe conditions.

Figure 9.
The three-point bending experiment and the 3D-SM measurement results. (a) Schematic diagram of the experimental device, (b) 3D shape of three-point bending specimens under different loads, (c) The shape of the specimen’s centerline.
Figure 9.
The three-point bending experiment and the 3D-SM measurement results. (a) Schematic diagram of the experimental device, (b) 3D shape of three-point bending specimens under different loads, (c) The shape of the specimen’s centerline.

Figure 10.
Measurement of cantilever beam deflection. (a) Cantilever structure, (b) Deflection after printing, (c) Printed results at different scanning speeds, (d) Deflection at different scanning speeds.
Figure 10.
Measurement of cantilever beam deflection. (a) Cantilever structure, (b) Deflection after printing, (c) Printed results at different scanning speeds, (d) Deflection at different scanning speeds.

Publisher’s Note: MDPI stays neutral with regard to jurisdictional claims in published maps and institutional affiliations. |
© 2021 by the authors. Licensee MDPI, Basel, Switzerland. This article is an open access article distributed under the terms and conditions of the Creative Commons Attribution (CC BY) license (https://creativecommons.org/licenses/by/4.0/).
Share and Cite
MDPI and ACS Style
Shi, W.; Zhang, Q.; Xie, H.; He, W. A Binocular Vision-Based 3D Sampling Moiré Method for Complex Shape Measurement. Appl. Sci. 2021, 11, 5175. https://doi.org/10.3390/app11115175
AMA Style
Shi W, Zhang Q, Xie H, He W. A Binocular Vision-Based 3D Sampling Moiré Method for Complex Shape Measurement. Applied Sciences. 2021; 11(11):5175. https://doi.org/10.3390/app11115175
Chicago/Turabian StyleShi, Wenxiong, Qi Zhang, Huimin Xie, and Wei He. 2021. "A Binocular Vision-Based 3D Sampling Moiré Method for Complex Shape Measurement" Applied Sciences 11, no. 11: 5175. https://doi.org/10.3390/app11115175
Note that from the first issue of 2016, this journal uses article numbers instead of page numbers. See further details here.