
From Femtoseconds to Hours—Measuring Dynamics over 18 Orders of Magnitude with Coherent X-rays


1
Deutsches Elektronen-Synchrotron DESY, Notkestr. 85, 22607 Hamburg, Germany
2
The Hamburg Centre for Ultrafast Imaging, Luruper Chaussee 149, 22761 Hamburg, Germany
*
Author to whom correspondence should be addressed.
Appl. Sci. 2021, 11(13), 6179; https://doi.org/10.3390/app11136179
Submission received: 3 May 2021
/
Revised: 16 June 2021
/
Accepted: 23 June 2021
/
Published: 2 July 2021
(This article belongs to the Special Issue Trends in Sub-Microsecond X-ray Science with Coherent Beams)
Abstract
:X-ray photon correlation spectroscopy (XPCS) enables the study of sample dynamics between micrometer and atomic length scales. As a coherent scattering technique, it benefits from the increased brilliance of the next-generation synchrotron radiation and Free-Electron Laser (FEL) sources. In this article, we will introduce the XPCS concepts and review the latest developments of XPCS with special attention on the extension of accessible time scales to sub-s and the application of XPCS at FELs. Furthermore, we will discuss future opportunities of XPCS and the related technique X-ray speckle visibility spectroscopy (XSVS) at new X-ray sources. Due to its particular signal-to-noise ratio, the time scales accessible by XPCS scale with the square of the coherent flux, allowing to dramatically extend its applications. This will soon enable studies over more than 18 orders of magnitude in time by XPCS and XSVS.
1. Introduction
With the advent of third generation synchrotron radiation sources in the early 1990s, the application of coherent X-ray beams has become possible for the first time. This is demonstrated in Figure 1a showing Airy fringes from Fraunhofer diffraction measured at the coherence beamline ID10 of ESRF [1,2]. Thanks to the marked increase of brilliance the coherent flux has risen many orders of magnitude compared to previous sources, paving the way for new coherence-based techniques [3], such as coherent diffractive imaging (CDI) [4,5], X-ray ptychography [6] and X-ray photon correlation spectroscopy (XPCS). The rise of hard X-ray free-electron lasers (FEL) and the step to the next-generation storage rings based on the multibend achromat lattice [7,8] will significantly expand the applications of these techniques [9]. XPCS benefits in a larger degree than any other technique from the increasing brilliance. Beyond the new facilities, many upgrades in beamline and detector technology have improved the spatial and temporal resolution of these techniques. For instance, XPCS particularly profits from the development of two-dimensional detectors, allowing for real-time experiments up to sub-ms time resolution. In this article, we review the major achievements using XPCS during the last decade.
XPCS probes the dynamic properties of matter by analyzing temporal correlations in real time [10,11,12,13,14,15,16,17,18,19]. It is the X-ray analogue to dynamical light scattering (DLS) [20], extending the probed length scale to atomic dimensions. Similar to DLS, it relies on the coherent properties of the beam. When a coherent X-ray beam is scattered by a sample, a grainy diffraction pattern, the so-called speckle pattern, is generated. If the sample changes its structure over time, so does the speckle pattern, which is tracked by XPCS.
After the first measurements of X-ray speckles [22] XPCS has been demonstrated in 1994 [1,21], see Figure 1b. In the following, dedicated beamlines for XPCS have been established at the European Synchrotron Radiation Facility (ESRF) in France [23,24] and at the Advanced Photon Source (APS) at Argonne National Laboratory (USA) [25]. A second generation of XPCS beamlines was built at PETRA III and NSLS II during the last decade, that provided an increase of coherent flux and more flexibility on scattering geometries. Finally, XPCS is also a driving force for FEL science, such as at the X-ray Correlation Spectroscopy (XCS) instrument at LCLS [26] or the Materials Imaging and Dynamics (MID) instrument at the European XFEL [27]. The development of XPCS is highlighted in Figure 2 showing the number of XPCS publications per year as well as the associated subject areas. Therefore, a search on SCOPUS and Web of Science has been performed on “X-ray Photon Correlation Spectroscopy”, its alternative name “X-ray Intensity Fluctuation Spectroscopy” (XIFS), and the related technique “X-ray Speckle Visibility Spectroscopy” (XSVS). Their appearance has been limited to titles, keywords, and abstract, so that the actual number of XPCS and XSVS publications is likely slightly larger. Since the late 1990s, the number of XPCS publications grew linearly, resulting to more than 40 publications in 2020. In addition, the starting dates of new beamlines and the ID10 (ESRF) upgrade are marked as well.
While focussing first on slow dynamics on length scales of several 10 nm (i.e., using a small-angle scattering geometry) [28], the application of XPCS has extended recently on both time and length scales. Three main directions can be identified, that experienced a strong boost in the last 10 years: (1) extension of XPCS to milli- and microseconds thanks to new type of detectors and increased brilliance, (2) studies of molecular and atomic length scales, and (3) XPCS and XSVS studies at FEL sources. Besides the FEL application, XPCS will play a major role at the currently designed and already built next generation of storage ring sources [7,8], as they promise to extend the time scale of XPCS towards nanoseconds. In this review we will first introduce the XPCS concepts including higher-order correlations, XSVS and the role of coherence. Afterwards, setup parameters for XPCS are discussed. The main part of this review discusses dynamics studies from the last 10 years, focussing on the new possibilities thanks to accessing faster timescales at storage rings and the performance of XPCS at FEL sources. Recent highlights that will be addressed in this review include the observation of two types of liquid water [29] as well as probing real-time dynamics in liquid water on femto- to picosecond time scales [30,31]. Furthermore, new routes of understanding stress relaxation in glasses have been revealed recently [32]. The possibility of reaching faster time scales in a real time experiment enables the study of in-operando dynamics, e.g., ion transport in lithium batteries [33], and paves the way to sub-s dynamics of soft matter [34,35] and biological systems [36,37,38,39]. Finally, future opportunities will be addressed with special attention on possibilities at the new facilities.
2. XPCS Concepts
When a (partially) coherent beam is scattered by a sample that is static during the exposure, a grainy diffraction pattern, the so-called speckle pattern, is generated. This speckle pattern includes information on the position of all scattering objects in the exposed volume that can be obtained by iterative algorithms in many cases [3]. If the sample shows any dynamics during the exposure, the speckle pattern will change accordingly. The concept of XPCS is to track these changes over time by means of correlation functions from series of speckle patterns (see Figure 3). The experimental quantity in XPCS studies is the normalized intensity autocorrelation function
that compares the intensities and at two different times with a lag time of . Here, q is the modulus of the wave vector transfer given by , with wavelength and scattering angle . The averaging in Equation (1) is performed over both detector pixels with equivalent q-values and all times t. Therefore, the -function provides information on the average dynamics during the exposure. Strategies for measuring dynamic heterogeneities without averaging over t are presented in the next section.
As a correlation function of intensity, the function is a second-order correlation function. It relates to the first-order or field autocorrelation function via the Siegert relation [40] to
Here, is the speckle contrast that is related to the degree of coherence and is further discussed in Section 2.4. Obviously, a non-zero degree coherence is needed to detect any dynamics information. The field correlation function is also known as intermediate scattering function. It is expressed by the normalized structure factor that contains all dynamic information of the sample via the trajectories of all N scatterers
Depending on the underlying dynamics, can be expressed in different forms. Some examples will be given below. The standard approach for the majority of sample systems is a Kohlrausch–Williams–Watts (KWW) function
The characteristic relaxation time is obtained as the inverse of the relaxation rate that shows a characteristic q-dependence . The KWW exponent is a measure of the distribution of relaxation times of individual particles. Both exponents, p and , specify the type of the dynamics. For diffusion, e.g., Brownian motion of nanoparticles, one obtains an exponential decay with and a square-dependence of the relaxation rate, i.e., . For spherical (nano-)particles dispersed in a liquid solvent the relaxation rate is then given by
with the Stokes–Einstein diffusion constant that depends on the particles radius R, the solvent viscosity at temperature T, and Boltzmann’s constant . Deviations from the exponents indicate, e.g., hyper- or subdiffusive dynamics, examples are discussed below. For dense samples, the dynamics is slowed down due to particle-particle interactions and the effective diffusion constant becomes length-scale dependent:
with the static structure factor . The function describes the hydrodynamic interactions, including electrostatic repulsion between particles and solvent fluctuations due to particle movement [41,42,43,44]. Furthermore, multiple dynamical processes can be measured as well as a superposition of different decay of . Exemplary -functions are shown in Figure 3b,c.
When performing an XPCS experiment, typically a series of n speckle patterns is measured on a equidistant time scale. The exposure time of each pattern has to be slower than the characteristic time that needs to be measured while the total duration of the series should extend significantly longer. Ideally, the shortest time should at least be about , while the length of the series should be longer than . Afterwards, the function is obtained by averaging over the whole series. This reveals several concerns: (a) What happens if the sample shows heterogeneous dynamics, i.e., the dynamics change during the exposure, (b) can dynamics faster than the minimum frame rate be detected, and (c) what is the role of the degree of coherence ? These questions will be addressed the following subsections.
2.1. Higher-Order Correlations
If the sample dynamics change during the XPCS series, the -function in Equation (1) will not detect the dynamics of the sample accurately because of the averaging over time t. In order to quantity such dynamical heterogeneities, the two-time correlation
can be used [45,46]. It calculates the correlation between two patterns of the series at times and averaged over all detector pixels of same q without any time averaging. Therefore, it is mirror symmetric along the axis, i.e., . Furthermore, the function can be obtained by averaging over as , with . Figure 4a shows an exemplary two-time correlation matrix of an aging system. It was calculated from diffusing disks whose diffusion constant decreased with every speckle pattern. In this way the correlated region in the vicinity of the - axis broadens with experimental time. This becomes obvious from Figure 4b showing cuts through C for fixed that highlight the continuous slowing down. The degree and time scale of the dynamical heterogeneities are quantified by the variance [47]
whose peak marks the characteristic time scale and degree of dynamical heterogeneities (see Figure 4c). Besides aging phenomena as shown in Figure 4, this procedure can be used to detect avalanche dynamics, e.g., during phase transitions or sudden rearrangements of structures, as well as intrinsic heterogeneous processes such as gelation or glass transitions.
Figure 3.
(a) XPCS scheme in small-angle X-ray scattering (SAXS) geometry. The speckle patterns are recorded with repetition rate of several meters downstream of the sample. Adapted from [48]. (b) Calculated functions for nanoparticles with radius of 50 nm dispersed in water at room temperature. The speckle contrast is set to . The -dependence of the relaxation time is visible by the non-equidistant functions. (c) showing different shapes: stretched with , single exponential, and double exponential with 1:1 contribution of the two decays. The first decay is compressed () and is additionally shown as single curve as dashed green line. The dashed black lines mark the corresponding relaxation times found at .

2.2. X-ray Speckle Visibility Spectroscopy
Many current XPCS experiments are limited by the detector, i.e., the fastest accessible time scale is defined by the lowest detector repetition rate. Nowadays, two-dimensional megapixel detectors used for XPCS experiments reach several kHz up to MHz, allowing to measure sub-ms correlations, see Section 3.2 for details. X-ray speckle visibility spectroscopy (XSVS) is one way to circumvent the repetition rate and reach faster time scales [49,50,51,52].
In an XSVS experiment, single speckle patterns are measured with different exposure times. Different from XPCS, all patterns are treated individually. If the sample shows any dynamics during the exposure, the speckle patterns will smear out and loose contrast. An examples is shown in Figure 5a. Here speckle patterns from diffusing disks are calculated for four different exposure times of 1, 10, 30 and 100 arb.u., respectively. Especially with increasing q the reduction of speckle contrast becomes visible. The contrast obtained close to the minimum intensity drops from for the fastest exposure to for a 100 times longer exposure. This is even more pronounced at larger q.
The contrast in XSVS experiments can be calculated from the exposure time and the intermediate scattering function via [49,51]
with the coherence factor, i.e., the speckle contrast for , . For an exponential as in the case of diffusion, Equation (1) can be solved analytically to
As XSVS does only depend on the exposure time, it can be used for faster processes than conventional XPCS if the exposure time is controlled by, e.g., fast shutter systems or electronic detector triggers. It allows in particular the reduction of the radiation dose because the sample has to be exposed only up to , and may allow more flexible control of intensity. In particular for fast processes in the fs range probed at FEL sources this is the only way to obtain dynamics via speckle correlations.
2.3. Double-Pulse XSVS
While XSVS at storage rings as quasi-continuous X-ray sources is performed by changing the exposure time on the sample or the detector, this concept cannot be applied at FEL sources for studying fast time scales. Here, the pulse length can be varied, however, this is limited to the femtosecond range [53,54,55]. This time scale can be extended using a double-pulse XSVS scheme. Therein, either two pulses are generated by the FEL, or a split-and-delay device is used to generate two X-ray pulses (see Section 4.2.4). The detector measures the sum of both speckle patterns, allowing to use detectors with a slower read out than the actual time scale that should be probed. Similar to XSVS, the speckle contrast is analyzed to obtain the sample dynamics, but as a function of time delay between both patterns. It can be shown [56] that the measured contrast is given as
with the speckle contrast of a single pulse . The intermediate scattering function can be measured in a similar way than in standard XPCS. Note that the maximum of the double-pulse contrast equals the single-pulse contrast, while the minimum, i.e., full decorrelation, results in an experimental contrast of .
This calculation holds if both pulses are equal in size, coherence, intensity and pointing. However, this is hardly achieved in experiments because of pulse-to-pulse fluctuations or imperfect diffractive optics. Such fluctuations may result in different intensities as well as varying overlap of both pulses. In these cases, a decoherence factor has to be measured, e.g., from scattering from a static sample [57]. This typically affects the maximum and minimum contrast in Equation (11). In addition, the intensity ratio of both pulses will affect the measured contrast significantly. Therefore, the intensity of each pulse has to be measured separately, and the intermediate scattering function can be obtained via [56,57]
where denotes the splitting ratio of the intensities and of both pulses. This double-pulse XSVS has been demonstrated user laser scattering [58] and is currently applied at FEL sources covering delay times up to nanoseconds (see Section 4.2.4 for more details) [57].
2.4. Coherence and Speckle Contrast
The feasibility of XPCS and XSVS experiments strongly depends on the coherence properties of the X-ray beam and the possibility of resolving speckles. The coherence properties are given by the mutual coherence function of the field E in spatial and temporal dimensions
where denote an ensemble average. Typically, the degree of coherence is used that is given by the normalized mutual coherence as
As in X-ray experiments the intensity I is measured, a second order degree coherence is used as
For Gaussians fluctuations, the Siegert relation combines both degrees of coherence to
This is also the basis for XPCS where the time evolution of correlations is probed. For calculation of the speckle contrast of single speckle patterns, we concentrate now on the spatial coordinates.
Following Equation (15), the degree of coherence can be calculated from the speckle pattern with as variance of intensity at positions on the detector
The subtraction of 1 yields .
An important quantity in experiments is the speckle size that can be obtained from a spatial autocorrelation of intensity [59]. The speckle size is connected to the coherence volume of the X-rays. Typically, one distinguishes between the transverse coherence, that depends on the source size, and the longitudinal or temporal coherence, that reflect the monochromaticity of the beam. At current storage-ring beamlines the transverse coherence length reaches values of several 10 m to 100 m, while FEL beams are typically fully coherent over their whole size [60]. In contrast, as the longitudinal coherence is bandwidth-dependent, it is typically around 1 m for standard bandwidths in the order of . The coherence volume is connected to the degree of coherence by the number of coherence modes M via . If the illuminated sample volume is larger than the coherence volume, the sample can be divided into M volumes, each of them of the size of the coherence volume. Therefore, a fully coherent illumination consist of one coherent mode and yields thus .
As in SAXS the path length differences of the X-rays are well below the longitudinal coherence length, the transverse coherence properties can be probed directly by the speckle contrast via Equation (17). In this case the speckle size is given by
with the sample-detector distance and the beam size w. With increasing scattering angle, the longitudinal coherence length affects the speckle contrast resulting in effective reduction. The contrast can be calculated by considering the actual beam shape and coherence lengths, details can be found in [59]. Here we want to discuss several consequences for measuring speckle contrast and thus performing XPCS and XSVS experiments. Besides the bandwidth, coherence length and beam sizes, the sample dimensions and detector pixel sizes define the measured speckle contrast. Examples for such geometrical speckle contrasts are given in Figure 6. Note that this has to be multiplied by the actual degree of transverse coherence to obtain the experimental speckle contrast. For a SAXS geometry, the contrast is maximized, and drops towards the WAXS regime. This further demonstrates, that XPCS or XSVS in SAXS geometry can be typically performed with beam sizes in the range of 10 m and sample thicknesses in the mm range. In contrast, WAXS geometries that allow probing molecular length scales, demand smaller beam sizes and in particular thinner samples or a smaller bandwidth. As both reduces the scattering intensity, XPCS in WAXS geometry typically results in lower count rates.
In general, the speckle contrast can be either obtained from spatial correlations by Equation (17) from single speckle patterns or similarly via XPCS from slow or static sample by correlating in the time domain. However, at low intensities the validity of Equation (17) is limited. In such cases one can take advantage of the intensity distribution of coherent scattering experiments [61]. For fully coherent beams (), the intensity follows a gamma distribution. At low count rates with single photon detections, the Poisson distribution of photon detection processes is taken into account by convoluting it with the gamma distribution. The result is the negative-binomial distribution
with the gamma function , the number of photons k and the average number of photons per pixel . The contrast is then obtained as inverse of the mode number M by histogramming the number of pixels that detected k photons. Furthermore, as the variance of the negative binomial distribution is the sum of those for the gamma and the Poisson distribution, the speckle contrast becomes [59]
For low count rates the second term dominates so that the extraction of contrast will be affected a lot by counting statistics and thus be inaccurate. Instead for , can be approximated by its Taylor series leading to a contrast estimate from the number of two-photon events as [59]. It is important to note that at least one two-photon event is necessary to estimate the contrast, if only 0 and 1 photon events are measured cannot be distinguished from a Poisson distribution.
3. Experimental
In this section, we discuss experimental parameters for XPCS studies. We will focus first on the signal-to-noise ratio which results from the definition of the function and compare it for XPCS and XSVS. Afterwards, current detectors as critical components of XPCS studies are shortly introduced. Finally, resulting experimental parameters such as beamsize and scattering geometry are discussed.
3.1. Signal-to-Noise Ratio
The signal-to-noise ratio in XPCS experiments is given by [62,63]
where denotes the incident coherent flux, is the number of detector pixels, T the total acquisition time and the shortest accessible time, e.g., defined by the repetition rate of the detector. As a result, an increase of a factor x of intensity will result in a reduction the accessible time scale of at the same . This demonstrates that XPCS benefits strongly from an increased brilliance at new X-ray sources and high-speed detectors.
Depending on the setup and sample, an optimal can be found. For SAXS geometries the optimal is obtained when the speckle size matches the detector pixel size, although the contrast will be smaller than the maximum value [63]. Furthermore, considering dose limitations for radiation-sensitive samples, a linear increase of with was reported [64]. For XSVS, the signal-to-noise ratio is given by [59]
with the number of patterns . Depending on the sample, number of images and delay times, this values can be larger than the one for XPCS [65].
3.2. Detectors
A critical component for XPCS experiment is the detector. On the one hand the repetition rate of the detector defines the accessible time scale of the dynamics, on the other hand it should provide a single-photon sensitivity because of the low count rate in many XPCS studies. Furthermore, speckles need to be resolved for optimum contrast. During the last decades XPCS was typically performed using CCD detectors with repetition rates in the range of seconds. Therefore, slow dynamics of condensed matter have been investigated frequently, with special attention on colloidal glasses, gels and polymer melts [47,66,67,68,69,70,71,72]. Faster dynamics have been probed using fast diodes, such as for studying capillary waves [73,74,75,76,77] or hydrodynamic functions [41,42,43,44]. Although microseconds could be reached, such experiments are characterized by long data collection times to reach sufficient statistics. In addition, as an effective single-pixel detector, only one q can be probed at one time.
With the rise of commercial 2D counting and hybrid detectors, the sub-s regime became accessible for real-time XPCS [78]. Nowadays, Eiger detectors and Medipix-based developments are used at XPCS beamlines, enabling repetition rates up to several kHz. The detectors used at current XPCS beamlines are outlined in Table 1 highlighting their size in pixel units, pixel size p and maximum repetition rate f. For comparison, the current version of the PI PIXIS CCD detector is added as well, which provides a significantly smaller pixel size on the cost of a slow repetition rate. Further detector developments point towards even faster repetition rates [79,80,81], such as the recently developed Rigaku XSPA detector or the Sydor Keck-PAD, at least in burst-mode operation collecting a limited number of patterns. A different detection scheme may become available using event-based detection with Timepix3 [82] and its successor Timepix4 that is currently under design. With Timepix3, a single event can be detected with a time resolution of 1.56 ns in the event-based detection scheme. However, using such a detector demands new types of analysis routines, tracking single events via their time stamps.
At FEL sources, special integrating detectors have been developed that are adapted to both the high peak brilliance and the particular repetition rate at the different instruments. This includes the AGIPD at European XFEL, the ePix detector at LCLS and the MPCCD at SACLA, listed as well in Table 1. A commercialized version of the AGIPD is currently designed and named SPARTA, allowing the collection of several 100 patterns with MHz repetition rate.
3.3. Experimental Parameters for XPCS Experiments
Following the estimations from the signal-to-noise ratio, an optimum is achieved for matching sizes of speckles and detector pixels. Typically, pixel sizes of hard X-ray detectors are in the range of 10 m to several 100 m (see Table 1). Thus, using a speckle size of m and a wave length of nm we can estimate from Equation (18) a relation between beam size w and sample detector distance to detect speckles: . Consequently, XPCS beamlines need a long sample-detector distance of several meters and small beam sizes in the m range. This is further supported by the coherence properties discussed in Figure 6. In particular, as the transverse coherence lengths is as well in the range of several 10 to 100 m, the beam size has to be limited to these dimensions. Slits or pinhole are frequently used to the reduce the beam size to about 10 m. With the development of different focussing schemes, compound-refractive or kinoform lenses have become a standard equipment at XPCS beamlines [96,97]. Together with a smaller source size, larger coherence lengths are achieved that enable coherent fluxes of above photons per second. Especially for experiments at q values probing molecular length scales the beam size is typically reduced to few m. At the same time, the sample-detector distance is chosen to several meters. A standard configuration is m. Such a configuration is used at XPCS instruments at beamlines 8-ID (APS) [25,98], ID10 (ESRF), P10 (PETRA III), 11-ID (NSLS-II) [99], XCS at LCLS [26], as well as MID (European XFEL) [27]. All of those instruments enable as well WAXS studies. In addition, a growing number of XPCS beamlines offer USAXS options, allowing for larger beamsizes that are particularly suited for radiation-sensitive samples. Sample-detector distances from 16 m (CHX at NSLS-II) over 21 m (P10 at PETRA III [38]) up to 30 m (ID02 at ESRF [100]) are currently used.
4. Studies
In this section, we want to discuss the main directions of XPCS and XSVS studies during the last decade. As introduced before, three key topics have been pursued:
- Extension of XPCS from slow dynamics to milli- and microseconds for complex fluids;
- Studies of molecular and atomic length scales;
- XPCS and XSVS studies at FEL laser sources.
Recent advances on molecular and atomic length scale comprise domain wall dynamics, atomic diffusion and glass transition studies [101,102,103] and are discussed in the review by Ruta et al. in the same issue. Therefore, we will focus on the first and third point in this chapter.
4.1. Towards Microsecond Real-Time XPCS at Storage-Ring Sources
As pointed out above, XPCS has recently experienced a marked increase of performance—defined by the accessible relaxation times—thanks to new detectors and increased brilliance. The kHz regime has become standard in many different applications at storage-ring beamlines, particularly enabling real-time studies beyond equilibrium dynamics. In this section, we will present recent XPCS studies, with special attention on soft matter and liquids.
4.1.1. Dynamical Heterogeneities via Two-Times Correlations
One of the main directions of XPCS research in recent years focussed on the measurement of dynamical heterogeneities. As introduced above, the use of higher-order correlation functions reveals non-equilibrium processes by accessing the age-dependence of the relaxation time in real-time experiments. Dynamical heterogeneities are particularly present in gels [47,104,105], elastomers [106], in glasses and close to the glass transition [29,107,108,109,110], as well as reported recently during liquid–liquid separations in dense protein dispersions [39]. Here, we want to highlight few recent examples.
In an combined XPCS-XRD experiment, Perakis et al. studied the transition from high-density amorphous ice (HDA) to low-density amorphous ice (LDA) in the SAXS regime [29]. At temperature around 89 K, the dynamics are dominated by viscoelastic relaxation and stress release of the metastable HDA. Upon heating, a second relaxation process appeared above 110 K that further speeded up at higher temperatures. This is accompanied by an abrupt decay of indicating a transition from heterogeneous to more homogeneous dynamics. These observations let to the conclusion that the HDA-LDA transition is actually taking place via high- and low-density liquid forms of water named HDL and LDL, i.e., a HDA-HDL-LDL-LDA transition was observed. This study provided one of the first experimental evidence for the existence of two forms of liquid water, that has been strengthened in subsequent FEL studies on water [111,112,113].
Recently, two-time correlations have been used in in-operando studies. Johnson et al. investigated the dynamics of nanoparticles in epoxy resin during 3D printing in real-time [114]. By mapping the sample both spatially and temporally its dynamics and morphology was found to reach a quasi-equilibrium state during the first few seconds after deposition and were characterized by slow aging similar to colloidal clay suspensions. The dynamics are anisotropic during the recovery process of the printed material, indicating structural alignment on the nanoscale induced by the extrusion and deposition. The dynamics associated with the curing of an industrial epoxy adhesive at different temperatures was investigated by Yavitt et al. [115]. Tracer particles have been used to perform the XPCS experiment in SAXS geometry. Approaching the curing temperature, the dynamics speed up and slow down rapidly once this temperature is reached. Both in operando XPCS studies provided new information on industrial products which may help to improve the design of future generations of tailor-made products.
A particular application of two-time correlations is the stress-relaxation in amorphous matter. Such spontaneous events are hardly visible in ensemble-averaged experimental quantities, but can be tracked by higher-order correlations. Therefore, we discuss four recent examples on interfaces, colloidal glasses and gels.
Boucheron et al. probed the stress-relaxation of a monolayer of nanoparticles on the water surface [116]. The particles formed island that have been laterally compressed. After the compression had been stopped the dynamics showed aging, i.e., continuously slowed down with different characteristics depending on the stressed state, including sudden rearrangements visible as “pinch-points” in the two-time correlation matrix. At the same time, the average structure was unchanged.
In general, the extraction of a two-time correlation function relies on sufficient statistical accuracy. Therefore, 2D detectors are essential, because the correlation function is averaged over many 1000 pixels forming an iso-q ring. Recently, thanks to the increased detector performance and coherent flux, direction-dependent structural heterogeneities could be accessed for different samples, calculated from fractions of pixels. Jain et al. studied the aging of a colloidal gel after quenching it close to and below the gelation point [105]. Stress-induced microcollapses were found to couple with cooperative rearrangements on larger scales, as indicated by dynamical heterogeneities at small q. These were captured in the ‘‘slower’’ horizontal direction, while aging dominates the temporal fluctuations in the vertical direction. As the gel ages, the distribution of the stress points homogenizes and the anisotropy of the dynamics reduces.
Dallari et al. investigated the stress relaxation in colloidal glasses [32]. They used a special sample preparation that leads to colloidal glasses with an directional built-in stress field. The stress-induced dynamics were investigated as a function of direction from the two-dimensional speckle patterns, see Figure 7 showing a two-time correlation function in horizontal direction together with the corresponding results. The maximum of is found at corresponding to the maximum and thus to the interparticle distance. In this study, the stress-induced dynamics were interpreted as a collection of mobile regions with approximately 20 particle diameters corresponding to about 2 m that move cooperatively with an overall stationary but locally ballistic dynamics. This study showed that a glass may consist of a collection of mobile regions on the mesoscale. These rearrange intermittently and heterogeneously with the residual stresses acting as driving force. Furthermore, the glass remains trapped in an overall out-of-equilibrium condition, which evolves only very slowly on the time scale of the experiment.
Chen and co-workers combined XPCS with in situ rheometry on soft colloidal glasses [117]. The microscopic process of stress relaxation was found to be associated with slow convective motion antiparallel to the preceding strain. This motion persist for long times and is accompanied by intermittent motion in the perpendicular direction. Similarities to other studies suggest that this stress relaxation may be generalized to all amorphous solids.
4.1.2. Anisotropic Dynamics
As already introduced in the previous section, anisotropic dynamics are observed frequently in gel or glasses. Besides, anisotropic dynamics are particularly relevant for anisotropic particles. In [118], the dynamics of peanut-shaped magnetic nanoparticles have been studied. In presence of a magnetic field, these particles form chains along the field direction. There the dynamics strongly depends on the length scale probed, showing diffusive and superdiffusive regimes. In the perpendicular direction, diffusion dominates, accompanied by sedimentation due to gravity.
In presence of such advective motion, the function becomes direction-dependent [119]
where is the diffusive part from Equation (4) and describes the contribution from advection. This typically depends on the distribution of velocities [120]. For uniformly distributed velocities, one obtains for the direction of the movement
leading to oscillations in the measured function and thus access to the velocity v. Möller et al. used these models for accessing the dynamics of sedimenting nanoparticles [120]. A well-defined distribution of velocities dominated the early sedimentation stage. At later times, the contribution of advective motion decreased and Brownian motion dominated. Using similar models, Lhermitte and co-workers measured the parabolic velocity distribution of Poiseuille flow in a mm-sized flow channel [121].
Combining the study of anisotropic dynamics by XPCS and X-ray microscopy, the ion transport in lithium-ion battery electrolytes has recently been revealed [33]. With a heterodyne XPCS approach, oscillations in the functions taken in operando could be related to the ion velocity in the electrolyte providing a concentration-independent transference number of 0.2. This study particularly highlights the applicability of modern XPCS for understanding and solving technological challenges.
4.1.3. Kinetics during Gelation
Many studies on dynamics in gels and during gelation revealed a reduction of the experimental speckle contrast [105,122,123]. This indicates that a faster dynamic process appears during gelation that falls outside the accessible time scale of the detector. Such a two-step relaxation process is typical for gels and glasses, often denoted as - and -relaxation [124]. The fast -relaxation describes the dynamics of the single particles, i.e., rattling of particles, while the -relaxation reflects the collective dynamics, e.g., due to the structure or jamming. In many gel studies the -relaxation was not accessible. However, the lack of contrast is frequently modelled with a localization length [66] that is a measure of the range of localized particle motion. With the avenue of measuring faster dynamics, direct access to the full relaxation process will be in range.
This was first demonstrated by Zhang et al. [125,126]. Using a prototype of the UFXC32k chip that has become part of the XSPA-500k detector (see Table 1), the formation of a colloidal gel was followed with few s time resolution. Gel formation of octadecyl-grafted silica particles suspended in decalin was followed after temperature quenches around the gel temperature of 278 K. A unified scaling between the depth of the quench and the gel formation was observed. The effective interaction derived from the data is much stronger than anticipated from the interaction potential. This is consistent with a collective behavior connected to the gel formation.
Begam et al. recently revealed the kinetics of the heat-induced gelation of hen-egg white [38]. Conventional hen-egg white from chicken eggs was used and heated to 80 C. The subsequent gelation was measured in USAXS geometry, allowing to use a large X-ray beam and thus reducing the radiation-induced damage. A reaction-limited aggregation process was found with an average network mesh size of about 400 nm. At this length scale, the relaxation time grew exponentially with experimental time. This was followed by a steady state after about 400 s that was characterized by a compressed exponential correlation function and temporal heterogeneity. This study demonstrates the possibility of investigating processes on length scales from nm to m which are particularly relevant for the food industry.
4.1.4. Phase Behaviour of Soft Colloids
Despite their simple interaction, colloidal hard spheres show different phases depending on their volume fraction and size dispersity [127], covering liquid, crystal and glass. Soft colloids show an even more complex phase diagram [128,129,130], including, e.g., different crystalline phases as well as glasses and gels. The most frequently studied soft colloidal system is micro- or nanogels of poly(N-isopropylacrylamide) (PNIPAm) particles dispersed in water [131,132]. These particles show a reversible volume transition at a lower critical solution temperature (LCST) around 306 K. Below the LCST, the particles are swollen with water, while they become hydrophobic above and reduce their volume. Different from hard spheres, these microgels can reach overpacked states, i.e., volume fractions well above the packing limit of spheres of 0.74.
Several XPCS studies have recently studied the phase behaviour of PNIPAm-based colloidal suspension. Frenzel et al. [133] used a core-shell systems of a silica core and PNIPAm shell. In a densely-packed system, the relaxation rate showed an anomalous -behaviour together with a compressed function below the LCST that might be connected to the chain-dynamics of the polymer. Above the LCST, the dynamics slowed down by several orders of magnitude, and changed to a -dependence and , indicating the formation of colloidal gel. This was later extended to effective volume fractions between about 0.01 and overpacked states above 1, revealing the temperature and concentration-dependence of the gelation via the structure and dynamics of the dispersion [134]. Furthermore, the influence of the co-solvent trimethylamine N-oxide (TMAO) on the gelation temperature has been investigated [135]. A reduction of the gelation temperature with increasing TMAO concentration was found, indicating a reduction of PNIPAm-water hydrogen bonds. This results in a stabilisation of the collapsed PNIPAm state and suppresses gelation of the nanogel dispersion.
Nigro et al. performed combined DLS and XPCS studies on interpenetrating networks of PNIPAm and poly(acrylic acid) (PAAc) [136,137]. By tuning the ratio of both constituents, a different particle softness was achieved and thus the system’s fragility [138]. The experiment was focused on two temperatures below and above the LCST, studying the dynamics as function of volume fraction. In this way more than nine orders of magnitude in time were covered from s to more than 1000 s, see Figure 8a. At a critical volume fraction the behaviour of the relaxation time changes from a super-Arrhenius to a slower than Arrhenius behavior. At the same volume fraction, a minimum for the KWW exponent was found that coincides with a maximum of the exponent n reflecting the q-dependence of the relaxation time (see Figure 8). A similar behaviour was observed for other soft systems using light scattering, the origin of this behaviour is currently under discussion [139].
4.1.5. XSVS for Radiation-Sensitive Samples
The increasing coherent flux at modern X-ray sources challenges the application of XPCS experiments on radiation sensitive samples. Here, XSVS may offer an alternative approach to study the sample dynamics. Most importantly, the repetition rate of the detector does not define the accessible time scale because shorter exposure times can be used in many cases. Instead, electronic triggers may enable accessing much faster timescales. An example was given by Möller et al. using the Eiger 4M and Eiger 500k detectors [140] with exposure times down to 10 s. However, the authors found a peculiar detection error of the detector, which resulted in too many 2-photon events. While this is not relevant for many applications, low-intensity XSVS relies on the correct counting of all photons. Nevertheless, the authors presented a correction algorithm which allowed the calculation of speckle contrasts.
Advantages of XSVS for longer time scales were shown in [65]. Therein, the dynamics of ionic liquids were studied around their structure factor peak close to their glass transition. Independent from the exposure time, the sample volume experienced the same dose, resulting in count rates below photons per pixel. The exposure times were chosen between 0.05 s and 1 s. These times would be as well accessible by standard sequential-mode XPCS, however, much higher doses would have been needed. On the other hand, the correlation functions are built from many single measurements taking several minutes to hours which does not allow to access out-of-equilibrium processes or real-time experiments.
4.1.6. Sub-Ms Relaxation Times and Beyond
The availability of new fast detector generation recently resulted in studies focussing on sub-ms relaxation times. In particular at beamline 8-ID at APS the UFXC32k chip and its commercialized version as XSPA-500k have been used in many studies, providing repetition rates faster than 1 s using a special burst mode of the detector, see Figure 9a [81]. Here we want to highlight some of such s XPCS studies at storage rings.
In a combined XPCS and rheology experiment Chen and co-workers probed the dynamics of Laponite clay over almost 8 orders of magnitude [141]. This system evolves over time, changing from a fluid to a soft glass which is governed by aging. At short time scales, indications of the faster relaxation process have been found that is mostly unaccessible as discussed above. The data suggest that heterogeneous localization plays a key role in the evolution towards nonergodicity.
Sheyfer et al. studied critical fluctuation dynamics in a complex fluid [142]. It consisted of a mixture of dodecane mixed with a large-molecule amphiphilic extractant and Ce(NO). Such a systems is used in liquid–liquid extraction of ions. Studies of critical dynamics are usually performed by DLS as they are typically too fast for standard XPCS experiments. In this study, the authors could reach a time resolution of 20 s, allowing them to cover the relevant time and–different from DLS experiments–length scale. A good agreement with both static and dynamic scaling was found and the critical exponents agree with Ising models.
In a recent study by Jo et al. at beamline P10 of PETRA III, the ultimate time resolution at a storage ring for XPCS was achieved [35]. The authors used a single ASIC of the AGIPD [93] which was designed for the sub-s resolution of the European XFEL. This enabled the measurement of speckle patterns from single X-ray pulses using the 40-bunch mode of PETRA III, corresponding to a pulse separation of 192 ns, see Figure 9b. In this way, the diffusion dynamics of nanoparticles in water were tracked by measuring the full -function. This study demonstrate the possibility of nanosecond XPCS using the full time window at next-generation storage-ring sources.
4.2. XPCS at Free-Electron Laser Sources
Revealing ultrafast dynamics on molecular length scale is a key science question motivating the design and construction of free-electron lasers in the hard X-ray regime in the last two decades. The LCLS [143,144], SACLA [145], PAL-XFEL [146], and SwissFEL [147] provide single pulses with repetition rates around 100 Hz, whereas the European XFEL [148] is based on superconducting accelerator technology and allows for experiments using MHz rates. Due to the exceptional coherence obtained at these facilities, they are supposed to be perfectly suited for XPCS and XSVS experiments. Especially in the soft X-ray regime, their high degree of coherence was proven by double-slit experiments [60,149,150,151]. For hard X-rays, coherence properties have been obtained from speckle patterns from amorphous samples as discussed above [59,152,153,154,155].
Due to the short pulse length in the femtosecond range, XFEL facilities are particularly suited for XSVS experiments, using both double pulses from a split-and-delay line or single pulses with varying lengths. Examples for both are presented below. Apart from that, even with repetition rates in the 100 Hz range, XFEL sources provide still an average coherent flux per second that exceeds storage-ring source by two to three orders of magnitude. This enables studies of slow dynamics in weakly scattering materials in the range of milliseconds. Furthermore, MHz repetition rates have become available at the European XFEL and will be provided at LCLS-II, which can currently only be achieved for special cases at storage-ring sources as shown in the previous section. However, the application of such sequential-mode XPCS at FEL sources is challenging for several reasons [156]:
- 1.
- Because of the exceptional high peak intensity the sample may be damaged after the first pulse.
- 2.
- 3.
- Typically, the full SASE beam without monochromator (pink beam) is used at FEL sources, making large q experiment impossible because the large bandwidth leads to very low speckle contrasts (see Figure 6).
Attempts how to circumvent these challenges are discussed in the following two sections, presenting the first sequential-mode XPCS experiments at LCLS, SACLA and European XFEL. This studies particularly demonstrate the performance of sequential-mode XPCS, double-pulse XSVS using split-and-delay devices as well as single pulse XSVS as proposed more than a decade ago as a science case for such FEL [156,159].
4.2.1. Role of SASE Fluctuations
In a first XPCS study performed at LCLS, Carnis et al. measured slow dynamics of gold nanoparticles suspended in polymer melts [160]. The experiment was performed at the XCS instrument [26] using a monochromatized beam of 8.7 keV, which resulted in about photons per pulse. Speckle patterns were measured in SAXS geometry using a PI CCD camera, that only allowed to access a minimum lag time of s. Nevertheless, dynamics could be measured between 7 s and 1000 s and showed the expected behaviour. Therefore, significant impact from radiation damage could be ruled out, the estimated temperature increase due to absorption of X-rays [59,156] was on the one hand well below the damage threshold. On the other hand, the heat relaxed faster than 100 s, so that even with the 120 Hz repetition rate of the LCLS the temperature has been equilibrated before the next pulse. Although the correlation times matched the expected trends, the functions only showed a speckle contrast of about 0.1. From the experimental parameters a single-pulse contrast above 0.8 was estimated [152,153]. The authors connected this with the SASE fluctuations, leading to an effective reduction of the speckle contrast in the functions.
A study at SACLA proved this by comparing XPCS series of static and dynamic samples [161] using a repetition rate of 30 Hz at BL3 [162]. While the contrast of single patterns using a pink beam was in the range of 0.4 to 0.5 [154,161], the functions showed values around 0.1. This reduced contrast could be modelled assuming variations of beam size and pointing positions, e.g., average variations of about 20% of both, corresponding to about 0.3 m on a pulse-to-pulse level would already result in the observed difference. Nevertheless, the diffusion dynamics of nanoparticles could be obtained from series of several 100 to 1000 pulses without any indication of radiation damage. This study highlighted the importance of measuring the maximum speckle contrast using, e.g., static samples as a starting point for obtaining dynamics information. Otherwise, potential faster processes may not be identified, or a wrongly assigned speckle contrast leads to incorrect correlation times and KWW exponents.
In order to address the question of the radiation damage on soft matter samples, the dynamics of radiation-sensitive PNIPAm nanogel systems have been studied as well at SACLA in a sequential XPCS experiment with 30 Hz repetition rate [163]. Similar to the previous study, the speckle contrast was determined using static samples. Analysis of structure and dynamics of pure PNIPAm nanogels and silica-PNIPAm core-shell systems showed that below a critical dose in the range of Gy the dynamics of dense systems could be obtained. This threshold is similar to the ones observed at storage-ring based experiments [133], proving that similar models are valid for both type of experiments.
4.2.2. Sub-Microsecond Dynamics of Non-Equilibrium Dynamics
With the start of the European XFEL as the first MHz repetition rate hard X-ray FEL [148], sequential XPCS is possible down to the sub-s level. This has been demonstrated in an experiment at the SPB/SFX instrument [164] on a prototypical soft matter sample of silica nanoparticles dispersed in water [34]. The European XFEL offers a different pulse scheme than the normal-conducting FEL sources. Every 0.1 s pulse trains of up to 2700 pulses and repetition rates up to 4.5 MHz are generated. In the first XPCS experiment, the pulse trains consisted of 120 pulses with a repetition rate of 1.128 MHz. Diffraction patterns taken with the AGIPD are shown in Figure 10a. It was found, that already a single train of 120 pulses is sufficient to obtain the dynamics of the sample, as shown by the intermediate scattering functions at different q in Figure 10b. Different from the XPCS experiments at LCLS and SACLA as reported above, the temperature increase after one pulse does not relax before the next pulse impinges on the sample. Consequently, the sample heats up step-wise [156] resulting in a speeding-up of the dynamics during the pulse train. This was demonstrated by two-time correlation functions that enabled the determination of starting from different pulse numbers within the train. Besides the water, the nanoparticles show a higher temperature increase, but with a faster relaxation. However, existing models of Brownian motion of such hot particles [165] overestimated the diffusion coefficients, instead the speeding-up could be modelled by non-linear and time-resolved temperature increase. Depending on the fluence of the X-ray pulses, effective temperatures above 450 K have been reported, indicating extremely overheated water states. The dynamics of the particles were still diffusive. While no futher radiation damage was observed, such XPCS experiments can be applied for measuring both equilibrium and non-equilibrium dynamics during gradual temperature increase.
Besides the dynamics study, the speckle contrast was measured as well for the different pulse schemes of the European XFEL. With the given setup, single pulse speckle contrasts were measured between 0.2 and 0.3 in SAXS geometry. This perfectly matches the calculated values taking beam size, wavelength and the AGIPD geometry into account. Most importantly, the same values were obtained from function measured from static samples. Consequently, there is no significant contribution from SASE fluctuations during the pulse trains. Train-train correlations were about a factor of 3 lower, reproducing the results from LCLS and SACLA. These results indicate that a superconducting accelerator such as the European XFEL provides a superior stability that perfectly matches the requirements of sequential XPCS experiments.
4.2.3. Femtosecond Dynamics by Pulse Length Variations
Access to dynamics in the range below 100 fs is realized by changing the pulse length of the FEL pulses. This was applied in [30] studying the dynamics of liquid water at LCLS. The X-ray pulse length was modified between 13 fs and 126 fs. The pulses impinged on a water jet of 100 m thickness giving rise to a speckle pattern measured in the vicinity of the structure factor peak of water around 2 Å. These patterns were analyzed using the XSVS scheme. With increasing pulse length, the contrast drops due to the dynamics of the sample. This decreasing contrast was compared to a ballistic dynamics model as well as two molecular dynamics (MD) models, see Figure 11a. While the ballistic model underestimates the speckle contrast and thus the relaxation time, the MD model match the data well. Here, the semi-classic MB-pol model [166] provided a slightly better match than the classic TIP4P/2005 [167], however, both models did not cover the temperature dependence of the contrast well. The results indicate that the water dynamics are influenced by cage effects, i.e., the molecules are slowed down due to the hydrogen bonding to their neighbours, in contrast to the common assumption of ballistic-like motion in the sub-150 fs regime. Hence, this real-time study of molecular dynamics represents a benchmark for MD simulations. To extend the time scales covering the full dynamics up to nanoseconds, double-pulse schemes can be applied as presented in the subsequent section.
4.2.4. Split-And-Delay Lines
In order to produce two FEL pulses, so-called split-and-delay lines are used. Therein, the FEL pulse is split in two pulses that proceed on different routes with tunable lengths introducing a delay between them. For dynamics studies, both pulses generate a speckle pattern whose sum is measured by the detector. The dynamics are obtained as described above, considering the intensity splitting ratio and the overlap between the two pulses.
Due to spatial restrictions, delays up to few nanoseconds can be achieved by such devices. Special accelerator modi have been introduced at the FEL machines, that allow generation of double pulse, however, limited to multiples of a fundamental radio-frequency of the accelerator, e.g., 350 ps at LCLS [168,169]. Shorter time scales, or flexible choice of longer ones, demand the application of a split-and-delay line. Here, the pulses are split either by amplitude, i.e., using thin crystals [170], or geometrically by wavefront splitting [171]. The first split-and-delay device has been installed at LCLS (see Figure 12) [172,173,174], others have followed or are currently under commissioning at other sources [175,176,177,178].
For dynamics studies, both beams need to probe the same sample volume. This introduces several challenges, e.g., as both beams may experience different sizes or shapes, that have an impact on the measured speckle contrasts because of partially overlapping beams [179,180]. Furthermore, the pulses are reflected by several silicon mirrors with fixed bandwidth, resulting to large pulse-to-pulse intensity fluctuations as only few of the spectral spikes generated in the SASE process are transmitted through the split-and-delay unit [157]. Nevertheless, first experiments have been successfully performed using these devices. Roseker et al. demonstrated the application of a hard X-ray split-and-delay line at LCLS [57]. The authors measured diffusion dynamics of gold particles of 1 nm radius. Furthermore, they demonstrated the extraction of speckle contrast for different splitting ratios as well as the importance of measuring the single pulse contrast from static samples. Instead of probing different delay points, a fixed delay of 1.3 ns was used and the q-dependence of the intermediate scattering function was analyzed. As the scattered intensity was below 0.01 photons per seconds, a dedicated maximum-likelihood approach was introduced for data analysis.
Shinohara et al. applied the split-and-delay line of SACLA for studying the dynamics of liquid water [31]. By using self-seeded X-ray pulses, the spectral width was reduced and thus the pulse energy that passed the split-and-delay-line increased. This enabled the authors to study the atomic-scale dynamics of water up to 2 ps, see Figure 11b. The speckle contrast was found to depend on the delay time as expected from theory and inelastic X-ray scattering. Furthermore, fast heating of water by the first pulse was observed at high pulse fluences, which on the one hand did not allow measurement of equilibrium dynamics from such pulses, on the other hand demonstrates the usage of split-and-delay lines for pump-probe applications. Nevertheless, these studies promise to use split-and-delay techniques in a pump-probe or laser pump - X-ray probe-probe scheme for many other questions, e.g., tracking the kinetics of melting of different materials on femto- to picosecond time scales by laser or X-ray pulses [181,182,183].
5. Future Opportunities
The studies discussed above demonstrate access to dynamics below ms and up to several hours by means of XPCS at storage rings, on length scales from about 1 m down to molecular and atomic scales. On the other hand, fast time scales between ns and fs can be reached at FEL sources. The gap between both regimes will be closed soon with the start of XPCS experiments at diffraction-limited storage rings [7,8,184,185,186], and the availability of new fast detectors (see Section 3.2). The accessible time and length scales of XPCS (and XSVS) experiments are summarized in Figure 13 and compared to further techniques. In general, XPCS and XSVS will thus cover more than 18 orders of magnitude in time, ranging from femtoseconds up to more than 1000 s at different facilities.
New type of experiments will be enabled, in particular at diffraction-limited storage rings. Here, we will outline few directions.
5.1. Dynamics on Intrinsic Length and Time Scales
Dynamics of polymers or liquids are frequently probed indirectly using tracer particles in a microrheology approach [187,188,189,190]. As example, the glass transition of poly-propylene glycol (PPG) was studied revealing the temperature-dependent dynamics of silica nanoparticles dispersed in PPG [108]. At room temperature, the dynamics are diffusive, i.e., the relaxation rate shows a dependece as and the KWW exponent is . With decreasing temperature towards the glass transition, the viscosity of the PPG increases, resulting in a slowing down of the silica motion. Furthermore, the KWW exponent and q-dependence of changed, indicating collaborative dynamics due to formation of dynamic domains.
This study made use of two advantages of the microrheology approach: (1) due to the size of the tracer particles the relevant q is changed to the SAXS regime instead of larger q for the polymer and (2) the time scales are increased by several orders of magnitude. While the diffusion of the colloidal particles could be covered within 10 ms to 1000 s, the polymer dynamics are in the range of (sub-)s in the liquid and several 1000 s in the glassy state, unaccessibly in standard XPCS experiments. However, the tracer particle provide only limited information, the full dynamics, in particular on multiple length scales of the polymers, are hidden. These restrictions will not exist at future sources, allowing direct access to polymer dynamics on many length and time scales.
5.2. Water-Based Soft Matter
Besides the use of tracer particles, many experiments on water-based soft matter are challenging because of the comparably low viscosity of water and thus fast relaxation times. This is demonstrated in Figure 14a, where the q-dependence of the relaxation time is shown for colloidal particle showing Brownian motion in water. It is important to note, that the relaxation time at the intrinsic length scale scales with , resulting in times faster relaxation for 10 times smaller particles. Currently, diffusion dynamics and hydrodynamics in water are accessible in the USAXS regime probing small q-values [191,192] only, or using point detectors with limited spatial resolution and statistical accuracy [41,42,43,44]. The accessible times are marked by the repetition rate of detectors introduced above. In order to probe dynamics on length scales of few nm corresponding, faster detectors or different experimental schemes such as XSVS or event-based detection [193] will be needed for expanding towards nanosecond XPCS [35].
5.3. High-Energy XPCS
The coherent flux and coherence lengths at diffraction-limited storage rings will particularly be larger at higher X-ray intensities compared to third-generation synchrotron radiation sources. This will allow XPCS and XSVS experiments at high intensities for different applications. For instance, dynamics of samples in dedicated sample environments for experiments at extreme condition, such as diamond anvil cells for high-pressure research, will become accessible due to the lower absorption of X-rays at higher energies. Recent experiments demonstrated already XPCS on biopolymers at liquid–liquid interfaces [194] and the diffusion of colloidal particles on confined geometries [195,196] using an X-ray energy of 21 keV. Furthermore, growth processes at interfaces on atomic length scales have been recently demontrated [197,198]. As these take place at high temperatures—in this case up to above 950 K—high-energy XPCS provides more flexibility for the sample environment for such experiments.
Figure 14b shows the speckle contrast factor due to geometrical parameters (i.e., scattering geometry and detector pixel size) as a function of X-ray energy at some q-values. The speckle contrast drops significantly at large energies, basically because of the smaller speckle size (see Section 2.4). This will make experiments at energies beyond 30 keV challenging. Nevertheless, experiments in the range of 20 to 30 keV will become feasible, which is sufficient for studying buried interfaces or penetrating high-pressure chambers.
5.4. Biological Samples
With the extension of time scales, the dynamics of biological samples will become accessible. These samples will need to be studied in their native aqueous environments. The relevant length scales, e.g., the size of a protein, is usually in the range of few nm, thus, diffusion dynamics as fastest relevant process will extend to the sub-s regime. Radiation-induced damage has to be considered for such samples, leading to a modified signal-to-noise ratio [37,64]. First XPCS studies on protein diffusion have been demonstrated recently using fast detectors with access to s time scales [36,199,200]. In addition to storage-ring based XPCS, application of XSVS schemes will be applied to limit the radiation damage [65,140], as well as studies at FEL sources are foreseen using different pulse schemes [37]. Besides protein dynamics, XPCS will become possible for nanomedicine studies, such as probing nanoparticle-protein interaction which is important for drug release in cellular environments [201].
5.5. Structure-Dynamics Correlations
Understanding the correlation of structure and dynamics is crucial for many scientific question. For instance, the glass transition of many materials is governed by a marked slowing down while the ensemble-averaged structure remains unchanged [124,127]. Instead, the increase of the relaxation time is believed to be connected to higher-order structural correlation, such as bond ordering [202]. Such information can be obtained by X-ray cross correlation analysis (XCCA) [203,204,205], probing spatial correlation in speckle patterns. Similar to XPCS this technique will significantly benefit from the increased coherent flux at the next-generation X-ray sources. In particular, studies combining higher-order structure and dynamics will become feasible for many applications, down to resolution of few nm using nanofocused X-ray beams [206].
A recent example is given in [207], where the orientational order of colloidal hard spheres was studied in the vicinity of the glass transition. Here, a linear increase of structural higher-order correlations was observed while the static structure did not change. This was accompanied by an exponential slowing down close to the glass transition. Different from optical microscopy, a wide range of time scales can be probed in such experiments, which corresponds to different phases from liquid, supercooled liquid, to glasses and gel phases in such systems.
6. Conclusions
The investigation of sample dynamics by the coherent X-ray scattering techniques XPCS and XSVS has experienced an exceptional gain of performance during its short history. While first experiments in the early 1990s obtained dynamics with time resolutions of several 10 seconds, sub-ms are routinely studied nowadays at modern synchrotron radiation sources. The development of new detector generations already demonstrated access to s and below. On the other hand, the rise of FEL sources paved the way to ultrafast dynamics between femto- and nanoseconds. Dedicated beamlines at the next generation of storage rings such as ESRF-EBS and PETRA IV will close the time gap, enabling access to more than 18 order of magnitude in time. This will further extend the fields of application of XPCS and XSVS to, e.g., weakly scattering systems, such as biological samples. Furthermore, equilibrium and non-equilibrium dynamics will uniquely become accessible on their intrinsic length scales, from several m down to atomic dimensions, thus complementing many spectroscopy and microscopy methods.
Author Contributions
Conceptualization, F.L., W.R. and G.G.; Writing—Original Draft Preparation, F.L.; Writing—Review & Editing, F.L., W.R. and G.G. All authors have read and agreed to the published version of the manuscript.
Funding
This work is supported by the Cluster of Excellence ‘Advanced Imaging of Matter’ of the Deutsche Forschungsgemeinschaft (DFG)–EXC 2056–project ID 390715994.
Institutional Review Board Statement
Not applicable.
Informed Consent Statement
Not applicable.
Data Availability Statement
Acknowledgments
We acknowledge Francesco Dallari and Wonhyuk Jo for feedback and provision of original figures.
Conflicts of Interest
The authors declare no conflict of interest.
References
- Grübel, G.; Als-Nielsen, J.; Abernathy, D.; Vignaud, D.; Brauer, S.; Stephenson, G.B.; Mochrie, S.G.J.; Sutton, M.; Robinson, I.K.; Fleming, R.; et al. Scattering with Coherent X-rays. ESRF Newsl. 1994, 20, 14–15. [Google Scholar]
- Grübel, G.; Abernathy, D. Diffraction and correlation spectroscopy with coherent x-rays. In Coherent Electron Beam X-Ray Sources: Techniques and Applications; Freund, A.K., Freund, H.P., Howells, M.R., Eds.; Proceedings SPIE 3154: San Francisco, CA, USA, 1997. [Google Scholar] [CrossRef]
- Nugent, K.A. Coherent methods in the X-ray sciences. Adv. Phys. 2010, 59, 1–99. [Google Scholar] [CrossRef] [Green Version]
- Miao, J.; Sayre, D.; Chapman, H.N. Phase retrieval from the magnitude of the Fourier transforms of nonperiodic objects. J. Opt. Soc. Amer. A 1998, 15, 1662. [Google Scholar] [CrossRef]
- Robinson, I.K.; Vartanyants, I.A.; Williams, G.J.; Pfeifer, M.A.; Pitney, J.A. Reconstruction of the Shapes of Gold Nanocrystals Using Coherent X-ray Diffraction. Phys. Rev. Lett. 2001, 87, 195505. [Google Scholar] [CrossRef] [Green Version]
- Pfeiffer, F. X-ray ptychography. Nat. Photonics 2017, 12, 9–17. [Google Scholar] [CrossRef]
- Eriksson, M.; van der Veen, J.F.; Quitmann, C. Diffraction-limited storage rings—A window to the science of tomorrow. J. Synchrotron Radiat. 2014, 21, 837–842. [Google Scholar] [CrossRef]
- Hettel, R. DLSR design and plans: An international overview. J. Synchrotron Radiat. 2014, 21, 843–855. [Google Scholar] [CrossRef] [PubMed]
- Khubbutdinov, R.; Menushenkov, A.P.; Vartanyants, I.A. Coherence properties of the high-energy fourth-generation X-ray synchrotron sources. J. Synchrotron Radiat. 2019, 26, 1851–1862. [Google Scholar] [CrossRef] [PubMed] [Green Version]
- Grübel, G.; Zontone, F. Correlation spectroscopy with coherent X-rays. J. Alloys 2004, 362, 3–11. [Google Scholar] [CrossRef]
- Sutton, M. A review of X-ray intensity fluctuation spectroscopy. C. R. Phys. 2008, 9, 657–667. [Google Scholar] [CrossRef]
- Grübel, G.; Madsen, A.; Robert, A. X-ray Photon Correlation Spectroscopy (XPCS). In Soft Matter Characterization; Springer: Amsterdam, The Netherlands, 2008; pp. 953–995. [Google Scholar] [CrossRef]
- Shpyrko, O.G. X-ray photon correlation spectroscopy. J. Synchrotron Radiat. 2014, 21, 1057–1064. [Google Scholar] [CrossRef]
- Sinha, S.K.; Jiang, Z.; Lurio, L.B. X-ray Photon Correlation Spectroscopy Studies of Surfaces and Thin Films. Adv. Mater. 2014, 26, 7764–7785. [Google Scholar] [CrossRef]
- Leheny, R.L.; Rogers, M.C.; Chen, K.; Narayanan, S.; Harden, J.L. Rheo-XPCS. Curr. Opin. Colloid Interface Sci. 2015, 20, 261–271. [Google Scholar] [CrossRef] [Green Version]
- Nogales, A.; Fluerasu, A. X Ray Photon Correlation Spectroscopy for the study of polymer dynamics. Eur. Polym. J. 2016, 81, 494–504. [Google Scholar] [CrossRef] [Green Version]
- Zhang, Q.; Dufresne, E.M.; Sandy, A.R. Dynamics in hard condensed matter probed by X-ray photon correlation spectroscopy: Present and beyond. Curr. Opin. Solid State Mater. Sci. 2018, 22, 202–212. [Google Scholar] [CrossRef]
- Sandy, A.R.; Zhang, Q.; Lurio, L.B. Hard X-ray Photon Correlation Spectroscopy Methods for Materials Studies. Ann. Rev. Mater. Res. 2018, 48, 167–190. [Google Scholar] [CrossRef]
- Madsen, A.; Fluerasu, A.; Ruta, B. Structural Dynamics of Materials Probed by X-ray Photon Correlation Spectroscopy. In Synchrotron Light Sources and Free-Electron Lasers; Springer International Publishing: Berlin/Heidelberg, Germany, 2020; pp. 1989–2018. [Google Scholar] [CrossRef]
- Bruce, J. Berne, Robert Pecora, P. Dynamic Light Scattering: With Applications to Chemistry, Biology, and Physics; Dover Publications Inc.: New York, NY, USA, 2000. [Google Scholar]
- Brauer, S.; Stephenson, G.; Sutton, M.; Brüning, R.; Dufresne, E.; Mochrie, S.; Grübel, G.; Als-Nielsen, J.; Abernathy, D. X-ray Intensity Fluctuation Spectroscopy Observations of Critical Dynamics in Fe3Al. Phys. Rev. Lett. 1995, 74, 2010–2013. [Google Scholar] [CrossRef]
- Sutton, M.; Mochrie, S.G.J.; Greytak, T.; Nagler, S.E.; Berman, L.E.; Held, G.A.; Stephenson, G.B. Observation of speckle by diffraction with coherent X-rays. Nature 1991, 352, 608–610. [Google Scholar] [CrossRef]
- Grübel, G.; Als-Nielsen, J.; Freund, A.K. The TROIKA beamline at ESRF. J. Phys. IV 1994, 4, C9-27–C9-34. [Google Scholar] [CrossRef]
- Abernathy, D.L.; Grübel, G.; Brauer, S.; McNulty, I.; Stephenson, G.B.; Mochrie, S.G.J.; Sandy, A.R.; Mulders, N.; Sutton, M. Small-Angle X-ray Scattering Using Coherent Undulator Radiation at the ESRF. J. Synchrotron Radiat. 1998, 5, 37–47. [Google Scholar] [CrossRef]
- Sandy, A.R.; Lurio, L.B.; Mochrie, S.G.J.; Malik, A.; Stephenson, G.B.; Pelletier, J.F.; Sutton, M. Design and characterization of an undulator beamline optimized for small-angle coherent X-ray scattering at the Advanced Photon Source. J. Synchrotron Radiat. 1999, 6, 1174–1184. [Google Scholar] [CrossRef]
- Alonso-Mori, R.; Caronna, C.; Chollet, M.; Curtis, R.; Damiani, D.S.; Defever, J.; Feng, Y.; Flath, D.L.; Glownia, J.M.; Lee, S.; et al. The X-ray Correlation Spectroscopy instrument at the Linac Coherent Light Source. J. Synchrotron Radiat. 2015, 22, 508–513. [Google Scholar] [CrossRef] [PubMed] [Green Version]
- Madsen, A.; Hallmann, J.; Ansaldi, G.; Roth, T.; Lu, W.; Kim, C.; Boesenberg, U.; Zozulya, A.; Möller, J.; Shayduk, R.; et al. Materials Imaging and Dynamics (MID) instrument at the European X-ray Free-Electron Laser Facility. J. Synchrotron Radiat. 2021, 28. [Google Scholar] [CrossRef] [PubMed]
- Dierker, S.B.; Pindak, R.; Fleming, R.M.; Robinson, I.K.; Berman, L. X-ray Photon Correlation Spectroscopy Study of Brownian Motion of Gold Colloids in Glycerol. Phys. Rev. Lett. 1995, 75, 449–452. [Google Scholar] [CrossRef] [Green Version]
- Perakis, F.; Amann-Winkel, K.; Lehmkühler, F.; Sprung, M.; Mariedahl, D.; Sellberg, J.A.; Pathak, H.; Späh, A.; Cavalca, F.; Schlesinger, D.; et al. Diffusive dynamics during the high-to-low density transition in amorphous ice. Proc. Natl. Acad. Sci. USA 2017, 114, 8193–8198. [Google Scholar] [CrossRef] [PubMed] [Green Version]
- Perakis, F.; Camisasca, G.; Lane, T.J.; Späh, A.; Wikfeldt, K.T.; Sellberg, J.A.; Lehmkühler, F.; Pathak, H.; Kim, K.H.; Amann-Winkel, K.; et al. Coherent X-rays reveal the influence of cage effects on ultrafast water dynamics. Nat. Commun. 2018, 9, 1917. [Google Scholar] [CrossRef] [PubMed]
- Shinohara, Y.; Osaka, T.; Inoue, I.; Iwashita, T.; Dmowski, W.; Ryu, C.W.; Sarathchandran, Y.; Egami, T. Split-pulse X-ray photon correlation spectroscopy with seeded X-rays from X-ray laser to study atomic-level dynamics. Nat. Commun. 2020, 11, 6213. [Google Scholar] [CrossRef]
- Dallari, F.; Martinelli, A.; Caporaletti, F.; Sprung, M.; Grübel, G.; Monaco, G. Microscopic pathways for stress relaxation in repulsive colloidal glasses. Sci. Adv. 2020, 6, eaaz2982. [Google Scholar] [CrossRef] [Green Version]
- Steinrück, H.G.; Takacs, C.J.; Kim, H.K.; Mackanic, D.G.; Holladay, B.; Cao, C.; Narayanan, S.; Dufresne, E.M.; Chushkin, Y.; Ruta, B.; et al. Concentration and velocity profiles in a polymeric lithium-ion battery electrolyte. Energy Environ. Sci. 2020, 13, 4312–4321. [Google Scholar] [CrossRef]
- Lehmkühler, F.; Dallari, F.; Jain, A.; Sikorski, M.; Möller, J.; Frenzel, L.; Lokteva, I.; Mills, G.; Walther, M.; Sinn, H.; et al. Emergence of anomalous dynamics in soft matter probed at the European XFEL. Proc. Natl. Acad. Sci. USA 2020, 117, 24110–24116. [Google Scholar] [CrossRef]
- Jo, W.; Westermeier, F.; Rysov, R.; Leupold, O.; Schulz, F.; Tober, S.; Markmann, V.; Sprung, M.; Ricci, A.; Laurus, T.; et al. Nanosecond X-ray photon correlation spectroscopy using pulse time structure of a storage-ring source. IUCrJ 2021, 8, 124–130. [Google Scholar] [CrossRef] [PubMed]
- Vodnala, P.; Karunaratne, N.; Lurio, L.; Thurston, G.M.; Vega, M.; Gaillard, E.; Narayanan, S.; Sandy, A.; Zhang, Q.; Dufresne, E.M.; et al. Hard-sphere-like dynamics in highly concentrated alpha-crystallin suspensions. Phys. Rev. E 2018, 97, 020601. [Google Scholar] [CrossRef] [Green Version]
- Perakis, F.; Gutt, C. Towards molecular movies with X-ray photon correlation spectroscopy. Phys. Chem. Chem. Phys. 2020, 22, 19443–19453. [Google Scholar] [CrossRef] [PubMed]
- Begam, N.; Ragulskaya, A.; Girelli, A.; Rahmann, H.; Chandran, S.; Westermeier, F.; Reiser, M.; Sprung, M.; Zhang, F.; Gutt, C.; et al. Kinetics of Network Formation and Heterogeneous Dynamics of an Egg White Gel Revealed by Coherent X-ray Scattering. Phys. Rev. Lett. 2021, 126, 098001. [Google Scholar] [CrossRef] [PubMed]
- Girelli, A.; Rahmann, H.; Begam, N.; Ragulskaya, A.; Reiser, M.; Chandran, S.; Westermeier, F.; Sprung, M.; Zhang, F.; Gutt, C.; et al. Microscopic Dynamics of Liquid-Liquid Phase Separation and Domain Coarsening in a Protein Solution Revealed by X-ray Photon Correlation Spectroscopy. Phys. Rev. Lett. 2021, 126, 138004. [Google Scholar] [CrossRef] [PubMed]
- Ferreira, D.; Bachelard, R.; Guerin, W.; Kaiser, R.; Fouché, M. Connecting field and intensity correlations: The Siegert relation and how to test it. Amer. J. Phys. 2020, 88, 831–837. [Google Scholar] [CrossRef]
- Grübel, G.; Abernathy, D.L.; Riese, D.O.; Vos, W.L.; Wegdam, G.H. Dynamics of dense, charge-stabilized suspensions of colloidal silica studied by correlation spectroscopy with coherent X-rays. J. Appl. Crystallogr. 2000, 33, 424–427. [Google Scholar] [CrossRef] [Green Version]
- Riese, D.O.; Wegdam, G.H.; Vos, W.L.; Sprik, R.; Fenistein, D.; Bongaerts, J.H.H.; Grübel, G. Effective Screening of Hydrodynamic Interactions in Charged Colloidal Suspensions. Phys. Rev. Lett. 2000, 85, 5460–5463. [Google Scholar] [CrossRef] [Green Version]
- Robert, A.; Wagner, J.; Härtl, W.; Autenrieth, T.; Grübel, G. Dynamics in dense suspensions of charge-stabilized colloidal particles. Eur. Phys. J. E 2008, 25, 77–81. [Google Scholar] [CrossRef]
- Westermeier, F.; Fischer, B.; Roseker, W.; Grübel, G.; Nägele, G.; Heinen, M. Structure and short-time dynamics in concentrated suspensions of charged colloids. J. Chem. Phys. 2012, 137, 114504. [Google Scholar] [CrossRef] [Green Version]
- Madsen, A.; Leheny, R.L.; Guo, H.; Sprung, M.; Czakkel, O. Beyond simple exponential correlation functions and equilibrium dynamics in X-ray photon correlation spectroscopy. New J. Phys. 2010, 12, 055001. [Google Scholar] [CrossRef]
- Bikondoa, O. On the use of two-time correlation functions for X-ray photon correlation spectroscopy data analysis. J. Appl. Crystallogr. 2017, 50, 357–368. [Google Scholar] [CrossRef] [PubMed] [Green Version]
- Trappe, V.; Pitard, E.; Ramos, L.; Robert, A.; Bissig, H.; Cipelletti, L. Investigation of q-dependent dynamical heterogeneity in a colloidal gel by X-ray photon correlation spectroscopy. Phys. Rev. E 2007, 76, 051404. [Google Scholar] [CrossRef] [PubMed] [Green Version]
- Schroer, C.; Röhlsberger, R.; Weckert, E.; Wanzenberg, R.; Agapov, I.; Brinkmann, R.; Leemans, W. (Eds.) PETRA IV: Upgrade of PETRA III to the Ultimate 3D X-ray Microscope—Conceptual Design Reoprt (CDR); Deutsches Elektronen-Synchrotron, DESY: Hamburg, Germany, 2019. [Google Scholar] [CrossRef]
- Bandyopadhyay, R.; Gittings, A.S.; Suh, S.S.; Dixon, P.K.; Durian, D.J. Speckle-visibility spectroscopy: A tool to study time-varying dynamics. Rev. Sci. Instrum. 2005, 76, 093110. [Google Scholar] [CrossRef] [Green Version]
- Inoue, I.; Shinohara, Y.; Watanabe, A.; Amemiya, Y. Effect of shot noise on X-ray speckle visibility spectroscopy. Opt. Express 2012, 20, 26878. [Google Scholar] [CrossRef]
- DeCaro, C.; Karunaratne, V.N.; Bera, S.; Lurio, L.B.; Sandy, A.R.; Narayanan, S.; Sutton, M.; Winans, J.; Duffin, K.; Lehuta, J.; et al. X-ray speckle visibility spectroscopy in the single-photon limit. J. Synchrotron Radiat. 2013, 20, 332–338. [Google Scholar] [CrossRef]
- Li, L.; Kwaśniewski, P.; Orsi, D.; Wiegart, L.; Cristofolini, L.; Caronna, C.; Fluerasu, A. Photon statistics and speckle visibility spectroscopy with partially coherent X-rays. J. Synchrotron Radiat. 2014, 21, 1288–1295. [Google Scholar] [CrossRef]
- Düsterer, S.; Radcliffe, P.; Bostedt, C.; Bozek, J.; Cavalieri, A.L.; Coffee, R.; Costello, J.T.; Cubaynes, D.; DiMauro, L.F.; Ding, Y.; et al. Femtosecond X-ray pulse length characterization at the Linac Coherent Light Source free-electron laser. New J. Phys. 2011, 13, 093024. [Google Scholar] [CrossRef]
- Inubushi, Y.; Tono, K.; Togashi, T.; Sato, T.; Hatsui, T.; Kameshima, T.; Togawa, K.; Hara, T.; Tanaka, T.; Tanaka, H.; et al. Determination of the Pulse Duration of an X-ray Free Electron Laser Using Highly Resolved Single-Shot Spectra. Phys. Rev. Lett. 2012, 109, 144801. [Google Scholar] [CrossRef]
- Behrens, C.; Decker, F.J.; Ding, Y.; Dolgashev, V.A.; Frisch, J.; Huang, Z.; Krejcik, P.; Loos, H.; Lutman, A.; Maxwell, T.J.; et al. Few-femtosecond time-resolved measurements of X-ray free-electron lasers. Nat. Commun. 2014, 5, 3762. [Google Scholar] [CrossRef]
- Gutt, C.; Stadler, L.M.; Duri, A.; Autenrieth, T.; Leupold, O.; Chushkin, Y.; Grübel, G. Measuring temporal speckle correlations at ultrafast X-ray sources. Opt. Express 2009, 17, 55. [Google Scholar] [CrossRef] [Green Version]
- Roseker, W.; Hruszkewycz, S.O.; Lehmkühler, F.; Walther, M.; Schulte-Schrepping, H.; Lee, S.; Osaka, T.; Strüder, L.; Hartmann, R.; Sikorski, M.; et al. Towards ultrafast dynamics with split-pulse X-ray photon correlation spectroscopy at free electron laser sources. Nat. Commun. 2018, 9, 1704. [Google Scholar] [CrossRef] [PubMed]
- Lee, S.; Jo, W.; Wi, H.S.; Gutt, C.; Lee, G.W. Resolving high-speed colloidal dynamics beyond detector response time via two pulse speckle contrast correlation. Opt. Express 2014, 22, 21567. [Google Scholar] [CrossRef] [PubMed]
- Hruszkewycz, S.O.; Sutton, M.; Fuoss, P.H.; Adams, B.; Rosenkranz, S.; Ludwig, K.F.; Roseker, W.; Fritz, D.; Cammarata, M.; Zhu, D.; et al. High Contrast X-ray Speckle from Atomic-Scale Order in Liquids and Glasses. Phys. Rev. Lett. 2012, 109, 185502. [Google Scholar] [CrossRef] [PubMed]
- Vartanyants, I.A.; Singer, A.; Mancuso, A.P.; Yefanov, O.M.; Sakdinawat, A.; Liu, Y.; Bang, E.; Williams, G.J.; Cadenazzi, G.; Abbey, B.; et al. Coherence Properties of Individual Femtosecond Pulses of an X-ray Free-Electron Laser. Phys. Rev. Lett. 2011, 107, 144801. [Google Scholar] [CrossRef] [PubMed]
- Goodman, J. Speckle Phenomena in Optics: Theory and Applications; Roberts & Co: Englewood, CO, USA, 2007. [Google Scholar]
- Lumma, D.; Lurio, L.B.; Mochrie, S.G.J.; Sutton, M. Area detector based photon correlation in the regime of short data batches: Data reduction for dynamic X-ray scattering. Rev. Sci. Instrum. 2000, 71, 3274–3289. [Google Scholar] [CrossRef]
- Falus, P.; Lurio, L.B.; Mochrie, S.G.J. Optimizing the signal-to-noise ratio for X-ray photon correlation spectroscopy. J. Synchrotron Radiat. 2006, 13, 253–259. [Google Scholar] [CrossRef]
- Möller, J.; Sprung, M.; Madsen, A.; Gutt, C. X-ray photon correlation spectroscopy of protein dynamics at nearly diffraction-limited storage rings. IUCrJ 2019, 6, 794–803. [Google Scholar] [CrossRef]
- Verwohlt, J.; Reiser, M.; Randolph, L.; Matic, A.; Medina, L.A.; Madsen, A.; Sprung, M.; Zozulya, A.; Gutt, C. Low Dose X-ray Speckle Visibility Spectroscopy Reveals Nanoscale Dynamics in Radiation Sensitive Ionic Liquids. Phys. Rev. Lett. 2018, 120, 168001. [Google Scholar] [CrossRef] [Green Version]
- Bandyopadhyay, R.; Liang, D.; Yardimci, H.; Sessoms, D.A.; Borthwick, M.A.; Mochrie, S.G.J.; Harden, J.L.; Leheny, R.L. Evolution of Particle-Scale Dynamics in an Aging Clay Suspension. Phys. Rev. Lett. 2004, 93, 228302. [Google Scholar] [CrossRef] [Green Version]
- Fluerasu, A.; Moussaïd, A.; Madsen, A.; Schofield, A. Slow dynamics and aging in colloidal gels studied by X-ray photon correlation spectroscopy. Phys. Rev. E 2007, 76, 010401. [Google Scholar] [CrossRef] [Green Version]
- Akcora, P.; Kumar, S.K.; Moll, J.; Lewis, S.; Schadler, L.S.; Li, Y.; Benicewicz, B.C.; Sandy, A.; Narayanan, S.; Ilavsky, J.; et al. “Gel-like” Mechanical Reinforcement in Polymer Nanocomposite Melts. Macromolecules 2010, 43, 1003–1010. [Google Scholar] [CrossRef]
- Angelini, R.; Zaccarelli, E.; de Melo Marques, F.A.; Sztucki, M.; Fluerasu, A.; Ruocco, G.; Ruzicka, B. Glass–glass transition during aging of a colloidal clay. Nat. Commun. 2014, 5, 4049. [Google Scholar] [CrossRef] [Green Version]
- de Melo Marques, F.A.; Angelini, R.; Zaccarelli, E.; Farago, B.; Ruta, B.; Ruocco, G.; Ruzicka, B. Structural and microscopic relaxations in a colloidal glass. Soft Matter 2015, 11, 466–471. [Google Scholar] [CrossRef]
- Mangal, R.; Srivastava, S.; Narayanan, S.; Archer, L.A. Size-Dependent Particle Dynamics in Entangled Polymer Nanocomposites. Langmuir 2016, 32, 596–603. [Google Scholar] [CrossRef]
- Senses, E.; Narayanan, S.; Mao, Y.; Faraone, A. Nanoscale Particle Motion in Attractive Polymer Nanocomposites. Phys. Rev. Lett. 2017, 119, 237801. [Google Scholar] [CrossRef] [PubMed] [Green Version]
- Kim, H.; Rühm, A.; Lurio, L.B.; Basu, J.K.; Lal, J.; Lumma, D.; Mochrie, S.G.J.; Sinha, S.K. Surface Dynamics of Polymer Films. Phys. Rev. Lett. 2003, 90, 068302. [Google Scholar] [CrossRef]
- Sikharulidze, I.; Dolbnya, I.P.; Fera, A.; Madsen, A.; Ostrovskii, B.I.; de Jeu, W.H. Smectic Membranes in Motion: Approaching the Fast Limits of X-ray Photon Correlation Spectroscopy. Phys. Rev. Lett. 2002, 88, 115503. [Google Scholar] [CrossRef] [PubMed] [Green Version]
- Madsen, A.; Als-Nielsen, J.; Grübel, G. Viscosity of a Liquid Crystal near the Nematic–SmecticAPhase Transition. Phys. Rev. Lett. 2003, 90, 085701. [Google Scholar] [CrossRef] [PubMed]
- Madsen, A.; Seydel, T.; Sprung, M.; Gutt, C.; Tolan, M.; Grübel, G. Capillary Waves at the Transition from Propagating to Overdamped Behavior. Phys. Rev. Lett. 2004, 92, 096104. [Google Scholar] [CrossRef] [PubMed]
- Seydel, T.; Madsen, A.; Tolan, M.; Grübel, G.; Press, W. Capillary waves in slow motion. Phys. Rev. B 2001, 63, 073409. [Google Scholar] [CrossRef]
- Westermeier, F.; Autenrieth, T.; Gutt, C.; Leupold, O.; Duri, A.; Menzel, A.; Johnson, I.; Broennimann, C.; Grübel, G. Fast two-dimensional detection for X-ray photon correlation spectroscopy using the PILATUS detector. J. Synchrotron Radiat. 2009, 16, 687–689. [Google Scholar] [CrossRef] [Green Version]
- Rumaiz, A.K.; Siddons, D.P.; Deptuch, G.; Maj, P.; Kuczewski, A.J.; Carini, G.A.; Narayanan, S.; Dufresne, E.M.; Sandy, A.; Bradford, R.; et al. First experimental feasibility study of VIPIC: A custom-made detector for X-ray speckle measurements. J. Synchrotron Radiat. 2016, 23, 404–409. [Google Scholar] [CrossRef] [Green Version]
- Zhang, Q.; Dufresne, E.M.; Grybos, P.; Kmon, P.; Maj, P.; Narayanan, S.; Deptuch, G.W.; Szczygiel, R.; Sandy, A. Submillisecond X-ray photon correlation spectroscopy from a pixel array detector with fast dual gating and no readout dead-time. J. Synchrotron Radiat. 2016, 23, 679–684. [Google Scholar] [CrossRef] [PubMed] [Green Version]
- Zhang, Q.; Dufresne, E.M.; Narayanan, S.; Maj, P.; Koziol, A.; Szczygiel, R.; Grybos, P.; Sutton, M.; Sandy, A.R. Sub-microsecond-resolved multi-speckle X-ray photon correlation spectroscopy with a pixel array detector. J. Synchrotron Radiat. 2018, 25, 1408–1416. [Google Scholar] [CrossRef] [PubMed]
- Poikela, T.; Plosila, J.; Westerlund, T.; Campbell, M.; Gaspari, M.D.; Llopart, X.; Gromov, V.; Kluit, R.; van Beuzekom, M.; Zappon, F.; et al. Timepix3: A 65K channel hybrid pixel readout chip with simultaneous ToA/ToT and sparse readout. J. Instrum. 2014, 9, C05013. [Google Scholar] [CrossRef]
- Radicci, V.; Bergamaschi, A.; Dinapoli, R.; Greiffenberg, D.; Henrich, B.; Johnson, I.; Mozzanica, A.; Schmitt, B.; Shi, X. EIGERa new single photon counting detector for X-ray applications: Performance of the chip. J. Instrum. 2012, 7, C02019. [Google Scholar] [CrossRef] [Green Version]
- Johnson, I.; Bergamaschi, A.; Buitenhuis, J.; Dinapoli, R.; Greiffenberg, D.; Henrich, B.; Ikonen, T.; Meier, G.; Menzel, A.; Mozzanica, A.; et al. Capturing dynamics with Eiger, a fast-framing X-ray detector. J. Synchrotron Radiat. 2012, 19, 1001–1005. [Google Scholar] [CrossRef]
- Zinn, T.; Homs, A.; Sharpnack, L.; Tinti, G.; Fröjdh, E.; Douissard, P.A.; Kocsis, M.; Möller, J.; Chushkin, Y.; Narayanan, T. Ultra-small-angle X-ray photon correlation spectroscopy using the Eiger detector. J. Synchrotron Radiat. 2018, 25, 1753–1759. [Google Scholar] [CrossRef] [Green Version]
- Pennicard, D.; Lange, S.; Smoljanin, S.; Becker, J.; Hirsemann, H.; Epple, M.; Graafsma, H. Development of LAMBDA: Large Area Medipix-Based Detector Array. J. Instrum. 2011, 6, C11009. [Google Scholar] [CrossRef]
- Ponchut, C.; Rigal, J.M.; Clément, J.; Papillon, E.; Homs, A.; Petitdemange, S. MAXIPIX, a fast readout photon-counting X-ray area detector for synchrotron applications. J. Instrum. 2011, 6, C01069. [Google Scholar] [CrossRef] [Green Version]
- Schavkan, A.; Westermeier, F.; Zozulya, A.; Bondarenko, S.; Grübel, G.; Schroer, C.; Sprung, M. Using the MAXIPIX detector for coherent X-ray scattering applications. J. Phys. Conf. Ser. 2013, 425, 202004. [Google Scholar] [CrossRef] [Green Version]
- Zhang, Q.; Dufresne, E.M.; Nakaye, Y.; Jemian, P.R.; Sakumura, T.; Sakuma, Y.; Ferrara, J.D.; Maj, P.; Hassan, A.; Bahadur, D.; et al. 20 μs-resolved high-throughput X-ray photon correlation spectroscopy on a 500k pixel detector enabled by data-management workflow. J. Synchrotron Radiat. 2021, 28, 259–265. [Google Scholar] [CrossRef]
- Nakaye, Y.; Sakumura, T.; Sakuma, Y.; Mikusu, S.; Dawiec, A.; Orsini, F.; Grybos, P.; Szczygiel, R.; Maj, P.; Ferrara, J.D.; et al. Characterization and performance evaluation of the XSPA-500k detector using synchrotron radiation. J. Synchrotron Radiat. 2021, 28, 439–447. [Google Scholar] [CrossRef]
- Sydor Technologies. Keck-PAD Brochure. Available online: https://sydortechnologies.com/direct-detectors/sydor-keck-pad/ (accessed on 25 June 2021).
- X-Spectrum. SPARTA: The High-Speed AGIDP-Based X-ray Detector. Available online: https://x-spectrum.de/products/sparta/ (accessed on 25 June 2021).
- Allahgholi, A.; Becker, J.; Delfs, A.; Dinapoli, R.; Goettlicher, P.; Greiffenberg, D.; Henrich, B.; Hirsemann, H.; Kuhn, M.; Klanner, R.; et al. The Adaptive Gain Integrating Pixel Detector at the European XFEL. J. Synchrotron Radiat. 2019, 26, 74–82. [Google Scholar] [CrossRef] [PubMed] [Green Version]
- Sikorski, M.; Feng, Y.; Song, S.; Zhu, D.; Carini, G.; Herrmann, S.; Nishimura, K.; Hart, P.; Robert, A. Application of an ePix100 detector for coherent scattering using a hard X-ray free-electron laser. J. Synchrotron Radiat. 2016, 23, 1171–1179. [Google Scholar] [CrossRef] [PubMed]
- Kameshima, T.; Ono, S.; Kudo, T.; Ozaki, K.; Kirihara, Y.; Kobayashi, K.; Inubushi, Y.; Yabashi, M.; Horigome, T.; Holland, A.; et al. Development of an X-ray pixel detector with multi-port charge-coupled device for X-ray free-electron laser experiments. Rev. Sci. Instrum. 2014, 85, 033110. [Google Scholar] [CrossRef] [PubMed]
- Sandy, A.R.; Narayanan, S.; Sprung, M.; Su, J.D.; Evans-Lutterodt, K.; Isakovic, A.F.; Stein, A. Kinoform optics applied to X-ray photon correlation spectroscopy. J. Synchrotron Radiat. 2010, 17, 314–320. [Google Scholar] [CrossRef]
- Zozulya, A.V.; Bondarenko, S.; Schavkan, A.; Westermeier, F.; Grübel, G.; Sprung, M. Microfocusing transfocator for 1D and 2D compound refractive lenses. Opt. Express 2012, 20, 18967. [Google Scholar] [CrossRef] [Green Version]
- Jiang, Z.; Li, X.; Strzalka, J.; Sprung, M.; Sun, T.; Sandy, A.R.; Narayanan, S.; Lee, D.R.; Wang, J. The dedicated high-resolution grazing-incidence X-ray scattering beamline 8-ID-E at the Advanced Photon Source. J. Synchrotron Radiat. 2012, 19, 627–636. [Google Scholar] [CrossRef]
- Wiegart, L.; Chubar, O.; Fluerasu, A.; Rakitin, M.S. X-ray optical simulations supporting advanced commissioning of the coherent hard X-ray beamline at NSLS-II. In Advances in Computational Methods for X-ray Optics IV; Sawhney, K., Chubar, O., Eds.; Proceedings SPIE 10388: San Diego, CA, USA, 2017. [Google Scholar] [CrossRef]
- Möller, J.; Chushkin, Y.; Prevost, S.; Narayanan, T. Multi-speckle X-ray photon correlation spectroscopy in the ultra-small-angle X-ray scattering range. J. Synchrotron Radiat. 2016, 23, 929–936. [Google Scholar] [CrossRef] [PubMed] [Green Version]
- Shpyrko, O.G.; Isaacs, E.D.; Logan, J.M.; Feng, Y.; Aeppli, G.; Jaramillo, R.; Kim, H.C.; Rosenbaum, T.F.; Zschack, P.; Sprung, M.; et al. Direct measurement of antiferromagnetic domain fluctuations. Nature 2007, 447, 68–71. [Google Scholar] [CrossRef] [PubMed] [Green Version]
- Leitner, M.; Sepiol, B.; Stadler, L.M.; Pfau, B.; Vogl, G. Atomic diffusion studied with coherent X-rays. Nat. Mater. 2009, 8, 717–720. [Google Scholar] [CrossRef] [PubMed]
- Ruta, B.; Chushkin, Y.; Monaco, G.; Cipelletti, L.; Pineda, E.; Bruna, P.; Giordano, V.M.; Gonzalez-Silveira, M. Atomic-Scale Relaxation Dynamics and Aging in a Metallic Glass Probed by X-ray Photon Correlation Spectroscopy. Phys. Rev. Lett. 2012, 109, 165701. [Google Scholar] [CrossRef] [Green Version]
- Orsi, D.; Cristofolini, L.; Baldi, G.; Madsen, A. Heterogeneous and Anisotropic Dynamics of a 2D Gel. Phys. Rev. Lett. 2012, 108, 105701. [Google Scholar] [CrossRef] [PubMed] [Green Version]
- Jain, A.; Schulz, F.; Lokteva, I.; Frenzel, L.; Grübel, G.; Lehmkühler, F. Anisotropic and heterogeneous dynamics in an aging colloidal gel. Soft Matter 2020, 16, 2864–2872. [Google Scholar] [CrossRef]
- Ehrburger-Dolle, F.; Morfin, I.; Bley, F.; Livet, F.; Heinrich, G.; Chushkin, Y.; Sutton, M. Anisotropic and heterogeneous dynamics in stretched elastomer nanocomposites. Soft Matter 2019, 15, 3796–3806. [Google Scholar] [CrossRef]
- Kwaśniewski, P.; Fluerasu, A.; Madsen, A. Anomalous dynamics at the hard-sphere glass transition. Soft Matter 2014, 10, 8698–8704. [Google Scholar] [CrossRef]
- Conrad, H.; Lehmkühler, F.; Fischer, B.; Westermeier, F.; Schroer, M.A.; Chushkin, Y.; Gutt, C.; Sprung, M.; Grübel, G. Correlated heterogeneous dynamics in glass-forming polymers. Phys. Rev. E 2015, 91, 042309. [Google Scholar] [CrossRef] [Green Version]
- Hoshino, T.; Fujinami, S.; Nakatani, T.; Kohmura, Y. Dynamical Heterogeneity near Glass Transition Temperature under Shear Conditions. Phys. Rev. Lett. 2020, 124, 118004. [Google Scholar] [CrossRef]
- Xu, T.D.; Wang, X.D.; Cao, Q.P.; Zhang, D.X.; Jiang, J.Z. Aging Behaviors in a La-Based Metallic Glass Revealed by Two-Time Correlation Functions. J. Phys. Chem. C 2020, 124, 22753–22760. [Google Scholar] [CrossRef]
- Kim, K.H.; Späh, A.; Pathak, H.; Perakis, F.; Mariedahl, D.; Amann-Winkel, K.; Sellberg, J.A.; Lee, J.H.; Kim, S.; Park, J.; et al. Maxima in the thermodynamic response and correlation functions of deeply supercooled water. Science 2017, 358, 1589–1593. [Google Scholar] [CrossRef] [Green Version]
- Kim, K.H.; Amann-Winkel, K.; Giovambattista, N.; Späh, A.; Perakis, F.; Pathak, H.; Parada, M.L.; Yang, C.; Mariedahl, D.; Eklund, T.; et al. Experimental observation of the liquid–liquid transition in bulk supercooled water under pressure. Science 2020, 370, 978–982. [Google Scholar] [CrossRef] [PubMed]
- Pathak, H.; Späh, A.; Esmaeildoost, N.; Sellberg, J.A.; Kim, K.H.; Perakis, F.; Amann-Winkel, K.; Ladd-Parada, M.; Koliyadu, J.; Lane, T.J.; et al. Enhancement and maximum in the isobaric specific-heat capacity measurements of deeply supercooled water using ultrafast calorimetry. Proc. Natl. Acad. Sci. USA 2021, 118, e2018379118. [Google Scholar] [CrossRef] [PubMed]
- Johnson, K.J.; Wiegart, L.; Abbott, A.C.; Johnson, E.B.; Baur, J.W.; Koerner, H. In Operando Monitoring of Dynamic Recovery in 3D-Printed Thermoset Nanocomposites by XPCS. Langmuir 2019, 35, 8758–8768. [Google Scholar] [CrossRef] [PubMed]
- Yavitt, B.M.; Salatto, D.; Huang, Z.; Koga, Y.T.; Endoh, M.K.; Wiegart, L.; Poeller, S.; Petrash, S.; Koga, T. Revealing nanoscale dynamics during an epoxy curing reaction with X-ray photon correlation spectroscopy. J. Appl. Phys. 2020, 127, 114701. [Google Scholar] [CrossRef]
- Boucheron, L.S.; Stanley, J.T.; Dai, Y.; You, S.S.; Parzyck, C.T.; Narayanan, S.; Sandy, A.R.; Jiang, Z.; Meron, M.; Lin, B.; et al. Stress relaxation in quasi-two-dimensional self-assembled nanoparticle monolayers. Phys. Rev. E 2018, 97, 052803. [Google Scholar] [CrossRef] [PubMed] [Green Version]
- Chen, Y.; Rogers, S.A.; Narayanan, S.; Harden, J.L.; Leheny, R.L. Microscopic dynamics of stress relaxation in a nanocolloidal soft glass. Phys. Rev. Mater. 2020, 4, 035602. [Google Scholar] [CrossRef]
- Pal, A.; Zinn, T.; Kamal, M.A.; Narayanan, T.; Schurtenberger, P. Anomalous Dynamics of Magnetic Anisotropic Colloids Studied by XPCS. Small 2018, 14, 1802233. [Google Scholar] [CrossRef]
- Busch, S.; Jensen, T.H.; Chushkin, Y.; Fluerasu, A. Dynamics in shear flow studied by X-ray Photon Correlation Spectroscopy. Eur. Phys. J. E 2008, 26. [Google Scholar] [CrossRef] [Green Version]
- Möller, J.; Narayanan, T. Velocity Fluctuations in Sedimenting Brownian Particles. Phys. Rev. Lett. 2017, 118, 198001. [Google Scholar] [CrossRef]
- Lhermitte, J.R.M.; Rogers, M.C.; Manet, S.; Sutton, M. Velocity measurement by coherent X-ray heterodyning. Rev. Sci. Instrum. 2017, 88, 015112. [Google Scholar] [CrossRef]
- Harden, J.L.; Guo, H.; Bertrand, M.; Shendruk, T.N.; Ramakrishnan, S.; Leheny, R.L. Enhanced gel formation in binary mixtures of nanocolloids with short-range attraction. J. Chem. Phys. 2018, 148, 044902. [Google Scholar] [CrossRef] [Green Version]
- Lu, X.; Mochrie, S.G.J.; Narayanan, S.; Sandy, A.R.; Sprung, M. How a Liquid Becomes a Glass Both on Cooling and on Heating. Phys. Rev. Lett. 2008, 100, 045701. [Google Scholar] [CrossRef] [PubMed] [Green Version]
- Debenedetti, P.G.; Stillinger, F.H. Supercooled liquids and the glass transition. Nature 2001, 410, 259–267. [Google Scholar] [CrossRef] [PubMed]
- Zhang, Q.; Bahadur, D.; Dufresne, E.M.; Grybos, P.; Kmon, P.; Leheny, R.L.; Maj, P.; Narayanan, S.; Szczygiel, R.; Ramakrishnan, S.; et al. Dynamic Scaling of Colloidal Gel Formation at Intermediate Concentrations. Phys. Rev. Lett. 2017, 119, 178006. [Google Scholar] [CrossRef] [Green Version]
- Bahadur, D.; Zhang, Q.; Dufresne, E.M.; Grybos, P.; Kmon, P.; Leheny, R.L.; Maj, P.; Narayanan, S.; Szczygiel, R.; Swan, J.W.; et al. Evolution of structure and dynamics of thermo-reversible nanoparticle gels—A combined XPCS and rheology study. J. Chem. Phys. 2019, 151, 104902. [Google Scholar] [CrossRef]
- Hunter, G.L.; Weeks, E.R. The physics of the colloidal glass transition. Rep. Progr. Phys. 2012, 75, 066501. [Google Scholar] [CrossRef] [Green Version]
- Sirota, E.B.; Ou-Yang, H.D.; Sinha, S.K.; Chaikin, P.M.; Axe, J.D.; Fujii, Y. Complete phase diagram of a charged colloidal system: A synchrotron X-ray scattering study. Phys. Rev. Lett. 1989, 62, 1524–1527. [Google Scholar] [CrossRef] [PubMed]
- van Roij, R.; Dijkstra, M.; Hansen, J.P. Phase diagram of charge-stabilized colloidal suspensions: Van der Waals instability without attractive forces. Phys. Rev. E 1999, 59, 2010–2025. [Google Scholar] [CrossRef] [Green Version]
- Pàmies, J.C.; Cacciuto, A.; Frenkel, D. Phase diagram of Hertzian spheres. J. Chem. Phys. 2009, 131, 044514. [Google Scholar] [CrossRef] [PubMed] [Green Version]
- Yunker, P.J.; Chen, K.; Gratale, M.D.; Lohr, M.A.; Still, T.; Yodh, A.G. Physics in ordered and disordered colloidal matter composed of poly(N-isopropylacrylamide) microgel particles. Rep. Progr. Phys. 2014, 77, 056601. [Google Scholar] [CrossRef] [PubMed] [Green Version]
- Brijitta, J.; Schurtenberger, P. Responsive hydrogel colloids: Structure, interactions, phase behavior, and equilibrium and nonequilibrium transitions of microgel dispersions. Curr. Opin. Colloid Interface Sci. 2019, 40, 87–103. [Google Scholar] [CrossRef]
- Frenzel, L.; Lehmkühler, F.; Lokteva, I.; Narayanan, S.; Sprung, M.; Grübel, G. Anomalous Dynamics of Concentrated Silica-PNIPAm Nanogels. J. Phys. Chem. Lett. 2019, 10, 5231–5236. [Google Scholar] [CrossRef] [PubMed]
- Frenzel, L.; Lehmkühler, F.; Koof, M.; Lokteva, I.; Grübel, G. The phase diagram of colloidal silica–PNIPAm core–shell nanogels. Soft Matter 2020, 16, 466–475. [Google Scholar] [CrossRef]
- Frenzel, L.; Lokteva, I.; Koof, M.; Narayanan, S.; Grübel, G.; Lehmkühler, F. Influence of TMAO as co-solvent on the gelation of silica-PNIPAm core-shell nanogels at intermediate volume fractions. ChemPhysChem 2020, 21, 1318–1325. [Google Scholar] [CrossRef] [PubMed]
- Nigro, V.; Ruzicka, B.; Ruta, B.; Zontone, F.; Bertoldo, M.; Buratti, E.; Angelini, R. Relaxation Dynamics, Softness, and Fragility of Microgels with Interpenetrated Polymer Networks. Macromolecules 2020, 53, 1596–1603. [Google Scholar] [CrossRef]
- Nigro, V.; Angelini, R.; Bertoldo, M.; Ruzicka, B. Swelling of responsive-microgels: Experiments versus models. Colloids Surf. A 2017, 532, 389–396. [Google Scholar] [CrossRef] [Green Version]
- Mattsson, J.; Wyss, H.M.; Fernandez-Nieves, A.; Miyazaki, K.; Hu, Z.; Reichman, D.R.; Weitz, D.A. Soft colloids make strong glasses. Nature 2009, 462, 83–86. [Google Scholar] [CrossRef]
- Philippe, A.M.; Truzzolillo, D.; Galvan-Myoshi, J.; Dieudonné-George, P.; Trappe, V.; Berthier, L.; Cipelletti, L. Glass transition of soft colloids. Phys. Rev. E 2018, 97, 040601. [Google Scholar] [CrossRef] [Green Version]
- Möller, J.; Reiser, M.; Hallmann, J.; Boesenberg, U.; Zozulya, A.; Rahmann, H.; Becker, A.L.; Westermeier, F.; Zinn, T.; Zontone, F.; et al. Implications of disturbed photon-counting statistics of Eiger detectors for X-ray speckle visibility experiments. J. Synchrotron Radiat. 2019, 26, 1705–1715. [Google Scholar] [CrossRef] [PubMed]
- Chen, Y.; Rogers, S.A.; Narayanan, S.; Harden, J.L.; Leheny, R.L. Microscopic ergodicity breaking governs the emergence and evolution of elasticity in glass-forming nanoclay suspensions. Phys. Rev. E 2020, 102, 042619. [Google Scholar] [CrossRef]
- Sheyfer, D.; Zhang, Q.; Lal, J.; Loeffler, T.; Dufresne, E.; Sandy, A.; Narayanan, S.; Sankaranarayanan, S.; Szczygiel, R.; Maj, P.; et al. Nanoscale Critical Phenomena in a Complex Fluid Studied by X-ray Photon Correlation Spectroscopy. Phys. Rev. Lett. 2020, 125, 125504. [Google Scholar] [CrossRef] [PubMed]
- Emma, P.; Akre, R.; Arthur, J.; Bionta, R.; Bostedt, C.; Bozek, J.; Brachmann, A.; Bucksbaum, P.; Coffee, R.; Decker, F.J.; et al. First lasing and operation of an ångstrom-wavelength free-electron laser. Nat. Photonics 2010, 4, 641–647. [Google Scholar] [CrossRef]
- Bostedt, C.; Boutet, S.; Fritz, D.M.; Huang, Z.; Lee, H.J.; Lemke, H.T.; Robert, A.; Schlotter, W.F.; Turner, J.J.; Williams, G.J. Linac Coherent Light Source: The first five years. Rev. Modern Phys. 2016, 88, 015007. [Google Scholar] [CrossRef] [Green Version]
- Ishikawa, T.; Aoyagi, H.; Asaka, T.; Asano, Y.; Azumi, N.; Bizen, T.; Ego, H.; Fukami, K.; Fukui, T.; Furukawa, Y.; et al. A compact X-ray free-electron laser emitting in the sub-ångström region. Nat. Photonics 2012, 6, 540–544. [Google Scholar] [CrossRef]
- Kang, H.S.; Min, C.K.; Heo, H.; Kim, C.; Yang, H.; Kim, G.; Nam, I.; Baek, S.Y.; Choi, H.J.; Mun, G.; et al. Hard X-ray free-electron laser with femtosecond-scale timing jitter. Nat. Photonics 2017, 11, 708–713. [Google Scholar] [CrossRef]
- Prat, E.; Abela, R.; Aiba, M.; Alarcon, A.; Alex, J.; Arbelo, Y.; Arrell, C.; Arsov, V.; Bacellar, C.; Beard, C.; et al. A compact and cost-effective hard X-ray free-electron laser driven by a high-brightness and low-energy electron beam. Nat. Photonics 2020, 14, 748–754. [Google Scholar] [CrossRef]
- Decking, W.; Abeghyan, S.; Abramian, P.; Abramsky, A.; Aguirre, A.; Albrecht, C.; Alou, P.; Altarelli, M.; Altmann, P.; Amyan, K.; et al. A MHz-repetition-rate hard X-ray free-electron laser driven by a superconducting linear accelerator. Nat. Photonics 2020, 14, 391–397. [Google Scholar] [CrossRef]
- Singer, A.; Vartanyants, I.A.; Kuhlmann, M.; Duesterer, S.; Treusch, R.; Feldhaus, J. Transverse-Coherence Properties of the Free-Electron-Laser FLASH at DESY. Phys. Rev. Lett. 2008, 101, 254801. [Google Scholar] [CrossRef] [Green Version]
- Cho, D.; Yang, J.; soo Kim, S.; Nam, D.; Park, J.; Kim, S.; Tono, K.; Yabashi, M.; Ishikawa, T.; Song, C. Comparing the spatial coherence of the natural and focused X-rays from a free electron laser. Opt. Express 2019, 27, 19573. [Google Scholar] [CrossRef]
- Wodzinski, T.; Mehrjoo, M.; Ruiz-Lopez, M.; Keitel, B.; Kuhlmann, M.; Brachmanski, M.; Künzel, S.; Fajardo, M.; Plönjes, E. Single-shot transverse coherence measurements with Young’s double pinholes at FLASH2. J. Phys. Commun. 2020, 4, 075014. [Google Scholar] [CrossRef]
- Gutt, C.; Wochner, P.; Fischer, B.; Conrad, H.; Castro-Colin, M.; Lee, S.; Lehmkühler, F.; Steinke, I.; Sprung, M.; Roseker, W.; et al. Single Shot Spatial and Temporal Coherence Properties of the SLAC Linac Coherent Light Source in the Hard X-ray Regime. Phys. Rev. Lett. 2012, 108, 024801. [Google Scholar] [CrossRef] [Green Version]
- Lee, S.; Roseker, W.; Gutt, C.; Fischer, B.; Conrad, H.; Lehmkühler, F.; Steinke, I.; Zhu, D.; Lemke, H.; Cammarata, M.; et al. Single shot speckle and coherence analysis of the hard X-ray free electron laser LCLS. Opt. Express 2013, 21, 24647. [Google Scholar] [CrossRef] [PubMed] [Green Version]
- Lehmkühler, F.; Gutt, C.; Fischer, B.; Schroer, M.A.; Sikorski, M.; Song, S.; Roseker, W.; Glownia, J.; Chollet, M.; Nelson, S.; et al. Single Shot Coherence Properties of the Free-Electron Laser SACLA in the Hard X-ray Regime. Sci. Rep. 2014, 4, 5234. [Google Scholar] [CrossRef] [PubMed]
- Yun, K.; Kim, S.; Kim, D.; Chung, M.; Jo, W.; Hwang, H.; Nam, D.; Kim, S.; Kim, J.; Park, S.Y.; et al. Coherence and pulse duration characterization of the PAL-XFEL in the hard X-ray regime. Sci. Rep. 2019, 9, 3300. [Google Scholar] [CrossRef] [PubMed] [Green Version]
- Grübel, G.; Stephenson, G.; Gutt, C.; Sinn, H.; Tschentscher, T. XPCS at the European X-ray free electron laser facility. Nucl. Instrum. Methods Phys. Res. Sect. B Beam Interact. Mater. At. 2007, 262, 357–367. [Google Scholar] [CrossRef]
- Lee, S.; Roseker, W.; Gutt, C.; Huang, Z.; Ding, Y.; Grübel, G.; Robert, A. High wavevector temporal speckle correlations at the Linac Coherent Light Source. Opt. Express 2012, 20, 9790. [Google Scholar] [CrossRef] [PubMed]
- Cao, Y.; Sheyfer, D.; Jiang, Z.; Maddali, S.; You, H.; Wang, B.X.; Ye, Z.G.; Dufresne, E.M.; Zhou, H.; Stephenson, G.B.; et al. The Effect of Intensity Fluctuations on Sequential X-ray Photon Correlation Spectroscopy at the X-ray Free Electron Laser Facilities. Crystals 2020, 10, 1109. [Google Scholar] [CrossRef]
- Grübel, G. X-ray Photon Correlation Spectroscopy at the European X-ray Free-Electron Laser (XFEL) facility. C. R. Phys. 2008, 9, 668–680. [Google Scholar] [CrossRef]
- Carnis, J.; Cha, W.; Wingert, J.; Kang, J.; Jiang, Z.; Song, S.; Sikorski, M.; Robert, A.; Gutt, C.; Chen, S.W.; et al. Demonstration of Feasibility of X-ray Free Electron Laser Studies of Dynamics of Nanoparticles in Entangled Polymer Melts. Sci. Rep. 2014, 4, 6017. [Google Scholar] [CrossRef] [Green Version]
- Lehmkühler, F.; Kwaśniewski, P.; Roseker, W.; Fischer, B.; Schroer, M.A.; Tono, K.; Katayama, T.; Sprung, M.; Sikorski, M.; Song, S.; et al. Sequential Single Shot X-ray Photon Correlation Spectroscopy at the SACLA Free Electron Laser. Sci. Rep. 2015, 5, 17193. [Google Scholar] [CrossRef] [PubMed]
- Tono, K.; Togashi, T.; Inubushi, Y.; Sato, T.; Katayama, T.; Ogawa, K.; Ohashi, H.; Kimura, H.; Takahashi, S.; Takeshita, K.; et al. Beamline, experimental stations and photon beam diagnostics for the hard X-ray free electron laser of SACLA. New J. Phys. 2013, 15, 083035. [Google Scholar] [CrossRef]
- Lehmkühler, F.; Valerio, J.; Sheyfer, D.; Roseker, W.; Schroer, M.A.; Fischer, B.; Tono, K.; Yabashi, M.; Ishikawa, T.; Grübel, G. Dynamics of soft nanoparticle suspensions at hard X-ray FEL sources below the radiation-damage threshold. IUCrJ 2018, 5, 801–807. [Google Scholar] [CrossRef] [PubMed] [Green Version]
- Mancuso, A.P.; Aquila, A.; Batchelor, L.; Bean, R.J.; Bielecki, J.; Borchers, G.; Doerner, K.; Giewekemeyer, K.; Graceffa, R.; Kelsey, O.D.; et al. The Single Particles, Clusters and Biomolecules and Serial Femtosecond Crystallography instrument of the European XFEL: Initial installation. J. Synchrotron Radiat. 2019, 26, 660–676. [Google Scholar] [CrossRef] [PubMed]
- Rings, D.; Selmke, M.; Cichos, F.; Kroy, K. Theory of Hot Brownian Motion. Soft Matter 2011, 7, 3441. [Google Scholar] [CrossRef]
- Reddy, S.K.; Straight, S.C.; Bajaj, P.; Pham, C.H.; Riera, M.; Moberg, D.R.; Morales, M.A.; Knight, C.; Götz, A.W.; Paesani, F. On the accuracy of the MB-pol many-body potential for water: Interaction energies, vibrational frequencies, and classical thermodynamic and dynamical properties from clusters to liquid water and ice. J. Chem. Phys. 2016, 145, 194504. [Google Scholar] [CrossRef]
- Abascal, J.L.F.; Vega, C. A general purpose model for the condensed phases of water: TIP4P/2005. J. Chem. Phys. 2005, 123, 234505. [Google Scholar] [CrossRef] [PubMed]
- Sun, Y.; Zhu, D.; Song, S.; Decker, F.J.; Sutton, M.; Ludwig, K.; Roseker, W.; Grübel, G.; Hruszkewycz, S.O.; Stephenson, B.; et al. Characterization of the LCLS “nanosecond two-bunch” mode for X-ray speckle visibility spectroscopy experiments. In Advances in X-ray Free-Electron Lasers Instrumentation IV; Tschentscher, T., Patthey, L., Eds.; Proceedings SPIE 10237: Prag, Czech Republic, 2017. [Google Scholar] [CrossRef]
- Seaberg, M.; Holladay, B.; Lee, J.; Sikorski, M.; Reid, A.; Montoya, S.; Dakovski, G.; Koralek, J.; Coslovich, G.; Moeller, S.; et al. Nanosecond X-ray Photon Correlation Spectroscopy on Magnetic Skyrmions. Phys. Rev. Lett. 2017, 119, 067403. [Google Scholar] [CrossRef] [PubMed] [Green Version]
- Osaka, T.; Yabashi, M.; Sano, Y.; Tono, K.; Inubushi, Y.; Sato, T.; Matsuyama, S.; Ishikawa, T.; Yamauchi, K. A Bragg beam splitter for hard X-ray free-electron lasers. Opt. Express 2013, 21, 2823. [Google Scholar] [CrossRef]
- Roling, S.; Zacharias, H.; Samoylova, L.; Sinn, H.; Tschentscher, T.; Chubar, O.; Buzmakov, A.; Schneidmiller, E.; Yurkov, M.; Siewert, F.; et al. Time-dependent wave front propagation simulation of a hard X-ray split-and-delay unit: Towards a measurement of the temporal coherence properties of X-ray free electron lasers. Phys. Rev. Spec. Top. Accel. Beams 2014, 17, 110705. [Google Scholar] [CrossRef] [Green Version]
- Roseker, W.; Franz, H.; Schulte-Schrepping, H.; Ehnes, A.; Leupold, O.; Zontone, F.; Robert, A.; Grübel, G. Performance of a picosecond X-ray delay line unit at 839 keV. Opt. Lett. 2009, 34, 1768. [Google Scholar] [CrossRef]
- Roseker, W.; Franz, H.; Schulte-Schrepping, H.; Ehnes, A.; Leupold, O.; Zontone, F.; Lee, S.; Robert, A.; Grübel, G. Development of a hard X-ray delay line for X-ray photon correlation spectroscopy and jitter-free pump–probe experiments at X-ray free-electron laser sources. J. Synchrotron Radiat. 2011, 18, 481–491. [Google Scholar] [CrossRef]
- Roseker, W.; Lee, S.; Walther, M.; Schulte-Schrepping, H.; Franz, H.; Gray, A.; Sikorski, M.; Fuoss, P.H.; Stephenson, G.B.; Robert, A.; et al. Hard X-ray delay line for X-ray photon correlation spectroscopy and jitter-free pump-probe experiments at LCLS. In X-ray Free-Electron Lasers: Beam Diagnostics, Beamline Instrumentation, and Applications; Moeller, S.P., Yabashi, M., Hau-Riege, S.P., Eds.; Proceedings SPIE 8504: San Diego, CA, USA, 2012. [Google Scholar] [CrossRef]
- Hirano, T.; Osaka, T.; Morioka, Y.; Sano, Y.; Inubushi, Y.; Togashi, T.; Inoue, I.; Matsuyama, S.; Tono, K.; Robert, A.; et al. Performance of a hard X-ray split-and-delay optical system with a wavefront division. J. Synchrotron Radiat. 2018, 25, 20–25. [Google Scholar] [CrossRef] [PubMed] [Green Version]
- Lu, W.; Friedrich, B.; Noll, T.; Zhou, K.; Hallmann, J.; Ansaldi, G.; Roth, T.; Serkez, S.; Geloni, G.; Madsen, A.; et al. Development of a hard X-ray split-and-delay line and performance simulations for two-color pump-probe experiments at the European XFEL. Rev. Sci. Instrum. 2018, 89, 063121. [Google Scholar] [CrossRef] [PubMed]
- Sun, Y.; Wang, N.; Song, S.; Sun, P.; Chollet, M.; Sato, T.; van Driel, T.B.; Nelson, S.; Plumley, R.; Montana-Lopez, J.; et al. Compact hard X-ray split-delay system based on variable-gap channel-cut crystals. Opt. Lett. 2019, 44, 2582. [Google Scholar] [CrossRef] [PubMed]
- Rysov, R.; Roseker, W.; Walther, M.; Grübel, G. Compact hard X-ray split-and-delay line for studying ultrafast dynamics at free-electron laser sources. J. Synchrotron Radiat. 2019, 26, 1052–1057. [Google Scholar] [CrossRef] [PubMed]
- Hua, N.; Zaluzhnyy, I.A.; Hrkac, S.B.; Shabalin, A.G.; Shpyrko, O.G. Extracting contrast in an X-ray speckle visibility spectroscopy experiment under imperfect conditions. J. Synchrotron Radiat. 2020, 27, 1626–1632. [Google Scholar] [CrossRef] [PubMed]
- Sun, Y.; Montana-Lopez, J.; Fuoss, P.; Sutton, M.; Zhu, D. Accurate contrast determination for X-ray speckle visibility spectroscopy. J. Synchrotron Radiat. 2020, 27, 999–1007. [Google Scholar] [CrossRef]
- Ihm, Y.; Cho, D.H.; Sung, D.; Nam, D.; Jung, C.; Sato, T.; Kim, S.; Park, J.; Kim, S.; Gallagher-Jones, M.; et al. Direct observation of picosecond melting and disintegration of metallic nanoparticles. Nat. Commun. 2019, 10, 2411. [Google Scholar] [CrossRef] [Green Version]
- Inoue, I.; Deguchi, Y.; Ziaja, B.; Osaka, T.; Abdullah, M.; Jurek, Z.; Medvedev, N.; Tkachenko, V.; Inubushi, Y.; Kasai, H.; et al. Atomic-Scale Visualization of Ultrafast Bond Breaking in X-ray-Excited Diamond. Phys. Rev. Lett. 2021, 126, 117403. [Google Scholar] [CrossRef] [PubMed]
- Husband, R.J.; McWilliams, R.S.; Pace, E.J.; Coleman, A.L.; Hwang, H.; Choi, J.; Kim, T.; Hwang, G.C.; Ball, O.B.; Chun, S.H.; et al. X-ray free electron laser heating of water and gold at high static pressure. Commun. Mater. 2021, 2, 61. [Google Scholar] [CrossRef]
- Weckert, E. The potential of future light sources to explore the structure and function of matter. IUCrJ 2015, 2, 230–245. [Google Scholar] [CrossRef] [PubMed] [Green Version]
- Raimondi, P. ESRF-EBS: The Extremely Brilliant Source Project. Synchrotron Radiat. News 2016, 29, 8–15. [Google Scholar] [CrossRef]
- Schroer, C.G.; Agapov, I.; Brefeld, W.; Brinkmann, R.; Chae, Y.C.; Chao, H.C.; Eriksson, M.; Keil, J.; Gavaldà, X.N.; Röhlsberger, R.; et al. PETRA IV: The ultralow-emittance source project at DESY. J. Synchrotron Radiat. 2018, 25, 1277–1290. [Google Scholar] [CrossRef] [Green Version]
- Caronna, C.; Chushkin, Y.; Madsen, A.; Cupane, A. Dynamics of Nanoparticles in a Supercooled Liquid. Phys. Rev. Lett. 2008, 100, 055702. [Google Scholar] [CrossRef] [Green Version]
- Guo, H.; Bourret, G.; Corbierre, M.K.; Rucareanu, S.; Lennox, R.B.; Laaziri, K.; Piche, L.; Sutton, M.; Harden, J.L.; Leheny, R.L. Nanoparticle Motion within Glassy Polymer Melts. Phys. Rev. Lett. 2009, 102, 075702. [Google Scholar] [CrossRef]
- Koga, T.; Jiang, N.; Gin, P.; Endoh, M.K.; Narayanan, S.; Lurio, L.B.; Sinha, S.K. Impact of an Irreversibly Adsorbed Layer on Local Viscosity of Nanoconfined Polymer Melts. Phys. Rev. Lett. 2011, 107, 225901. [Google Scholar] [CrossRef]
- Ruta, B.; Czakkel, O.; Chushkin, Y.; Pignon, F.; Nervo, R.; Zontone, F.; Rinaudo, M. Silica nanoparticles as tracers of the gelation dynamics of a natural biopolymer physical gel. Soft Matter 2014, 10, 4547. [Google Scholar] [CrossRef]
- Dattani, R.; Semeraro, E.F.; Narayanan, T. Phoretic motion of colloids in a phase separating medium. Soft Matter 2017, 13, 2817–2822. [Google Scholar] [CrossRef]
- Semeraro, E.F.; Dattani, R.; Narayanan, T. Microstructure and dynamics of Janus particles in a phase separating medium. J. Chem. Phys. 2018, 148, 014904. [Google Scholar] [CrossRef] [PubMed]
- Llopart, X.; Ballabriga, R.; Campbell, M.; Tlustos, L.; Wong, W. Timepix, a 65k programmable pixel readout chip for arrival time, energy and/or photon counting measurements. Nucl. Instruments Methods Phys. Res. Sect. 2007, 581, 485–494. [Google Scholar] [CrossRef]
- Amadei, F.; Thoma, J.; Czajor, J.; Kimmle, E.; Yamamoto, A.; Abuillan, W.; Konovalov, O.V.; Chushkin, Y.; Tanaka, M. Ion-Mediated Cross-linking of Biopolymers Confined at Liquid/Liquid Interfaces Probed by In Situ High-Energy Grazing Incidence X-ray Photon Correlation Spectroscopy. J. Phys. Chem. B 2020, 124, 8937–8942. [Google Scholar] [CrossRef] [PubMed]
- Nygård, K.; Buitenhuis, J.; Kagias, M.; Jefimovs, K.; Zontone, F.; Chushkin, Y. Anisotropic de Gennes Narrowing in Confined Fluids. Phys. Rev. Lett. 2016, 116, 167801. [Google Scholar] [CrossRef] [PubMed] [Green Version]
- Nygård, K.; Buitenhuis, J.; Kagias, M.; Jefimovs, K.; Zontone, F.; Chushkin, Y. Anisotropic hydrodynamic function of dense confined colloids. Phys. Rev. E 2017, 95, 062601. [Google Scholar] [CrossRef] [PubMed] [Green Version]
- Headrick, R.L.; Ulbrandt, J.G.; Myint, P.; Wan, J.; Li, Y.; Fluerasu, A.; Zhang, Y.; Wiegart, L.; Ludwig, K.F. Coherent X-ray measurement of step-flow propagation during growth on polycrystalline thin film surfaces. Nat. Commun. 2019, 10, 2638. [Google Scholar] [CrossRef] [PubMed]
- Ju, G.; Xu, D.; Highland, M.J.; Thompson, C.; Zhou, H.; Eastman, J.A.; Fuoss, P.H.; Zapol, P.; Kim, H.; Stephenson, G.B. Coherent X-ray spectroscopy reveals the persistence of island arrangements during layer-by-layer growth. Nat. Phys. 2019, 15, 589–594. [Google Scholar] [CrossRef]
- Lurio, L.B.; Thurston, G.M.; Zhang, Q.; Narayanan, S.; Dufresne, E.M. Use of continuous sample translation to reduce radiation damage for XPCS studies of protein diffusion. J. Synchrotron Radiat. 2021, 28. [Google Scholar] [CrossRef]
- Vodnala, P.; Karunaratne, N.; Bera, S.; Lurio, L.; Thurston, G.M.; Karonis, N.; Winans, J.; Sandy, A.; Narayanan, S.; Yasui, L.; et al. Radiation damage limits to XPCS studies of protein dynamics. Aip Conf. Proc. 2016, 1741, 050026. [Google Scholar] [CrossRef] [Green Version]
- Sanchez-Cano, C.; Alvarez-Puebla, R.A.; Abendroth, J.M.; Beck, T.; Blick, R.; Cao, Y.; Caruso, F.; Chakraborty, I.; Chapman, H.N.; Chen, C.; et al. X-ray-Based Techniques to Study the Nano–Bio Interface. ACS Nano 2021. [Google Scholar] [CrossRef]
- Tanaka, H.; Tong, H.; Shi, R.; Russo, J. Revealing key structural features hidden in liquids and glasses. Nat. Rev. Phys. 2019, 1, 333–348. [Google Scholar] [CrossRef]
- Wochner, P.; Gutt, C.; Autenrieth, T.; Demmer, T.; Bugaev, V.; Ortiz, A.D.; Duri, A.; Zontone, F.; Grübel, G.; Dosch, H. X-ray cross correlation analysis uncovers hidden local symmetries in disordered matter. Proc. Natl. Acad. Sci. USA 2009, 106, 11511–11514. [Google Scholar] [CrossRef] [PubMed] [Green Version]
- Lehmkühler, F.; Grübel, G.; Gutt, C. Detecting orientational order in model systems by X-ray cross-correlation methods. J. Appl. Cryst. 2014, 47, 1315–1323. [Google Scholar] [CrossRef] [Green Version]
- Zaluzhnyy, I.; Kurta, R.; Scheele, M.; Schreiber, F.; Ostrovskii, B.; Vartanyants, I. Angular X-ray Cross-Correlation Analysis (AXCCA): Basic Concepts and Recent Applications to Soft Matter and Nanomaterials. Materials 2019, 12, 3464. [Google Scholar] [CrossRef] [Green Version]
- Bikondoa, O.; Carbone, D. X-ray Photon Correlation Spectroscopy with Coherent Nanobeams: A Numerical Study. Crystals 2020, 10, 766. [Google Scholar] [CrossRef]
- Lehmkühler, F.; Hankiewicz, B.; Schroer, M.A.; Müller, L.; Ruta, B.; Sheyfer, D.; Sprung, M.; Tono, K.; Katayama, T.; Yabashi, M.; et al. Slowing down of dynamics and orientational order preceding crystallization in hard-sphere systems. Sci. Adv. 2020, 6, eabc5916. [Google Scholar] [CrossRef]
Figure 1.
(a) Airy fringes from Fraunhofer diffraction from slits of different sizes as indicated. Data has been measured in the commissioning of the ID10 beamtime at ESRF, the first dedicated beamline for coherence applications [1]. Figure reproduced from [2]. Copyright 1997 Society of Photo-Optical Instrumentation Engineers (SPIE). (b) functions from FeAl at the superlattice reflection measured at ID10 [21] showing fluctuations above the order-disorder transition temperature of K.

Figure 2.
(a) Publications mentioning X-ray photon correlation spectroscopy (XPCS), X-ray speckle visibility spectroscopy (XSVS) or X-ray intensity fluctuation spectroscopy (XIFS) as keyword, in the title or abstract. The solid line models a linear increase of the SCOPUS data between 1998 and 2020 with an increase rate of 1.62 publications per year. The dashed lines mark the years where new beamlines with XPCS dedication became online. (b) Distribution of subject areas of XPCS publications from 1995 to 2020. For each publication multiple areas are possible.

Figure 4.
(a) Two-time correlation matrix modelled for an aging system that continuously slows down during the measurement. (b) Cuts through C at given as indicated in (a). The lines are exponential fits up to , afterwards the modelling fails because of the aging. (c) Variance from (a). The maximum is found at about and marked by the dashed line.

Figure 5.
(a) Speckle patterns calculated from diffusing disks with different exposure times ranging from from 1 to 100. The contrast calculated for the q-value marked by the dashed black circle drops from 1 to 0.48. (b) compared to the XSVS function using the same intermediate scattering function.
Figure 5.
(a) Speckle patterns calculated from diffusing disks with different exposure times ranging from from 1 to 100. The contrast calculated for the q-value marked by the dashed black circle drops from 1 to 0.48. (b) compared to the XSVS function using the same intermediate scattering function.

Figure 6.
(a) Geometrical speckle contrast as a function of q for different sample thicknesses . The beam size was set to 5 m, the dashed line marks a typical q-value for intermolecular distances. (b) Geometrical speckle contrast as function of beam size at different q values at m. The dashed line marks a beam size of m as used in the left side. In both parts the bandwidth was set to , the sample-detector distance to 5 m, X-ray energy was 10 keV, and the pixel size 75 m.

Figure 7.
(A) Two-time correlation matrix computed at the peak of in horizontal direction. Fluctuations are clearly visible as a sign of heterogeneous dynamics. (B) (here named ) and the corresponding normalized intensity autocorrelation function at . (C) Peak value of compared to . Both functions show a maximum at . Multiplying the maximum of and the total number of particles in the scattering volume an estimate of the number of particles participating in a correlated ballistic motion is found to . Figure from [32] reproduced under CC BY-NC 4.0.

Figure 8.
(a) functions from interpenetrating networks of microgel particles at K and nm at different concentrations. The inset shows the temperature dependence of the hydrodynamic radius measured by DLS at low concentrations. (b) Exponent n showing the q-dependence of the relaxation rate (). The inset shows the relaxation times as a function of q for selected concentrations. Reprinted with permission from Nigro et al. Macromolecules 2020, 53, 1596–1603 (2020) [136]. Copyright 2020 American Chemical Society.

Figure 9.
MHz XPCS from diffusion of silica nanoparticles in water at (a) beamline 8-ID of APS using a prototype of the XSPA detector [81] and (b) beamline P10 of PETRA III using AGIPD [35]. The inset in panel a shows the relaxation time as function of q, the solid line is a fit with the slope of . Figure from [81] reproduced with permission of the International Union of Crystallography, figure from [35] reproduced under CC-BY 4.0.

Figure 10.
(a) Scattering pattern measured with AGIPD at SPB/SFX averaged over 500 trains (Top) and single-shot speckle pattern (Bottom). White parts are masked pixels and blind regions between the AGIPD modules. The intensity scale is given in analog-to-digital unit (ADU) values, one photon corresponds to 65 ADU. (b) Intermediate scattering functions measured from diffusing silica nanoparticles in water from as single train of 120 X-ray pulses. Figures adapted from [34].

Figure 11.
Dynamics of liquid water measured at FEL facilities. (a) By changing the pulse width, the speckle contrast obtained by XSVS follows expectations from molecular dynamics simulations [30]. (b) Longer times are achieved using a split-and-delay device at SACLA, where the speckle contrast depends on the pulse intensity suggesting radiation-induced dynamics [31]. Figures are reprinted from [30,31] under CC-BY 4.0.

Figure 12.
Top: Photograph of the first split-and-delay line [174] installed at the XCS instrument of LCLS. The incident FEL beam comes from left and is denoted by the yellow line. The beam is split at the beam splitter position into two parts that propagate inside the delay line defined by Bragg crystals of the upper branch (yellow line) and lower branch (red line). Fine adjustment of the overlap between the split beam is done by the heat stage mounted in the lower branch. Each branch is equipped with the beam stop allowing to switch promptly between the beams. To reduce the X-ray absorption in air the setup can operate in He environment thanks to the plexiglass enclosure. The inset shows the closed box that is flushed with helium to reduce parasitic scattering.

Figure 13.
Length-time scale map of different scattering techniques. Raman, Brillouin and dynamic light scattering use optical lasers as source. IXS refers to inelastic X-ray scattering whose time resolution is given by the energy resolution. PETRA III and PETRA IV are exemplary used as storage ring sources. With PETRA IV, the brilliance is supposed to be increase by a factor of 500, leading to access of faster time scales compared to PETRA III [48].

Figure 14.
(a) q-dependence of relaxation time as a function of q for nanoparticles of 1 nm, 10 nm, and 100 nm radius undergoing Brownian motion in water. The solid black line marks the relaxation time at the intrinsic length scale , the dashed line marks the repetition rate of three detectors listed in Table 1. (b) Geometrical speckle contrast as function of X-ray energy for some q-values. The parameters used for the calculation are: 75 m detector pixel size, 5 m sample-detector distance, 10 m beamsize, 1 mm sample thickness, and a bandwidth of a Si(111) monochromator. Contrasts are highlighted for nm for 8 keV, 24 keV, and 40 keV.


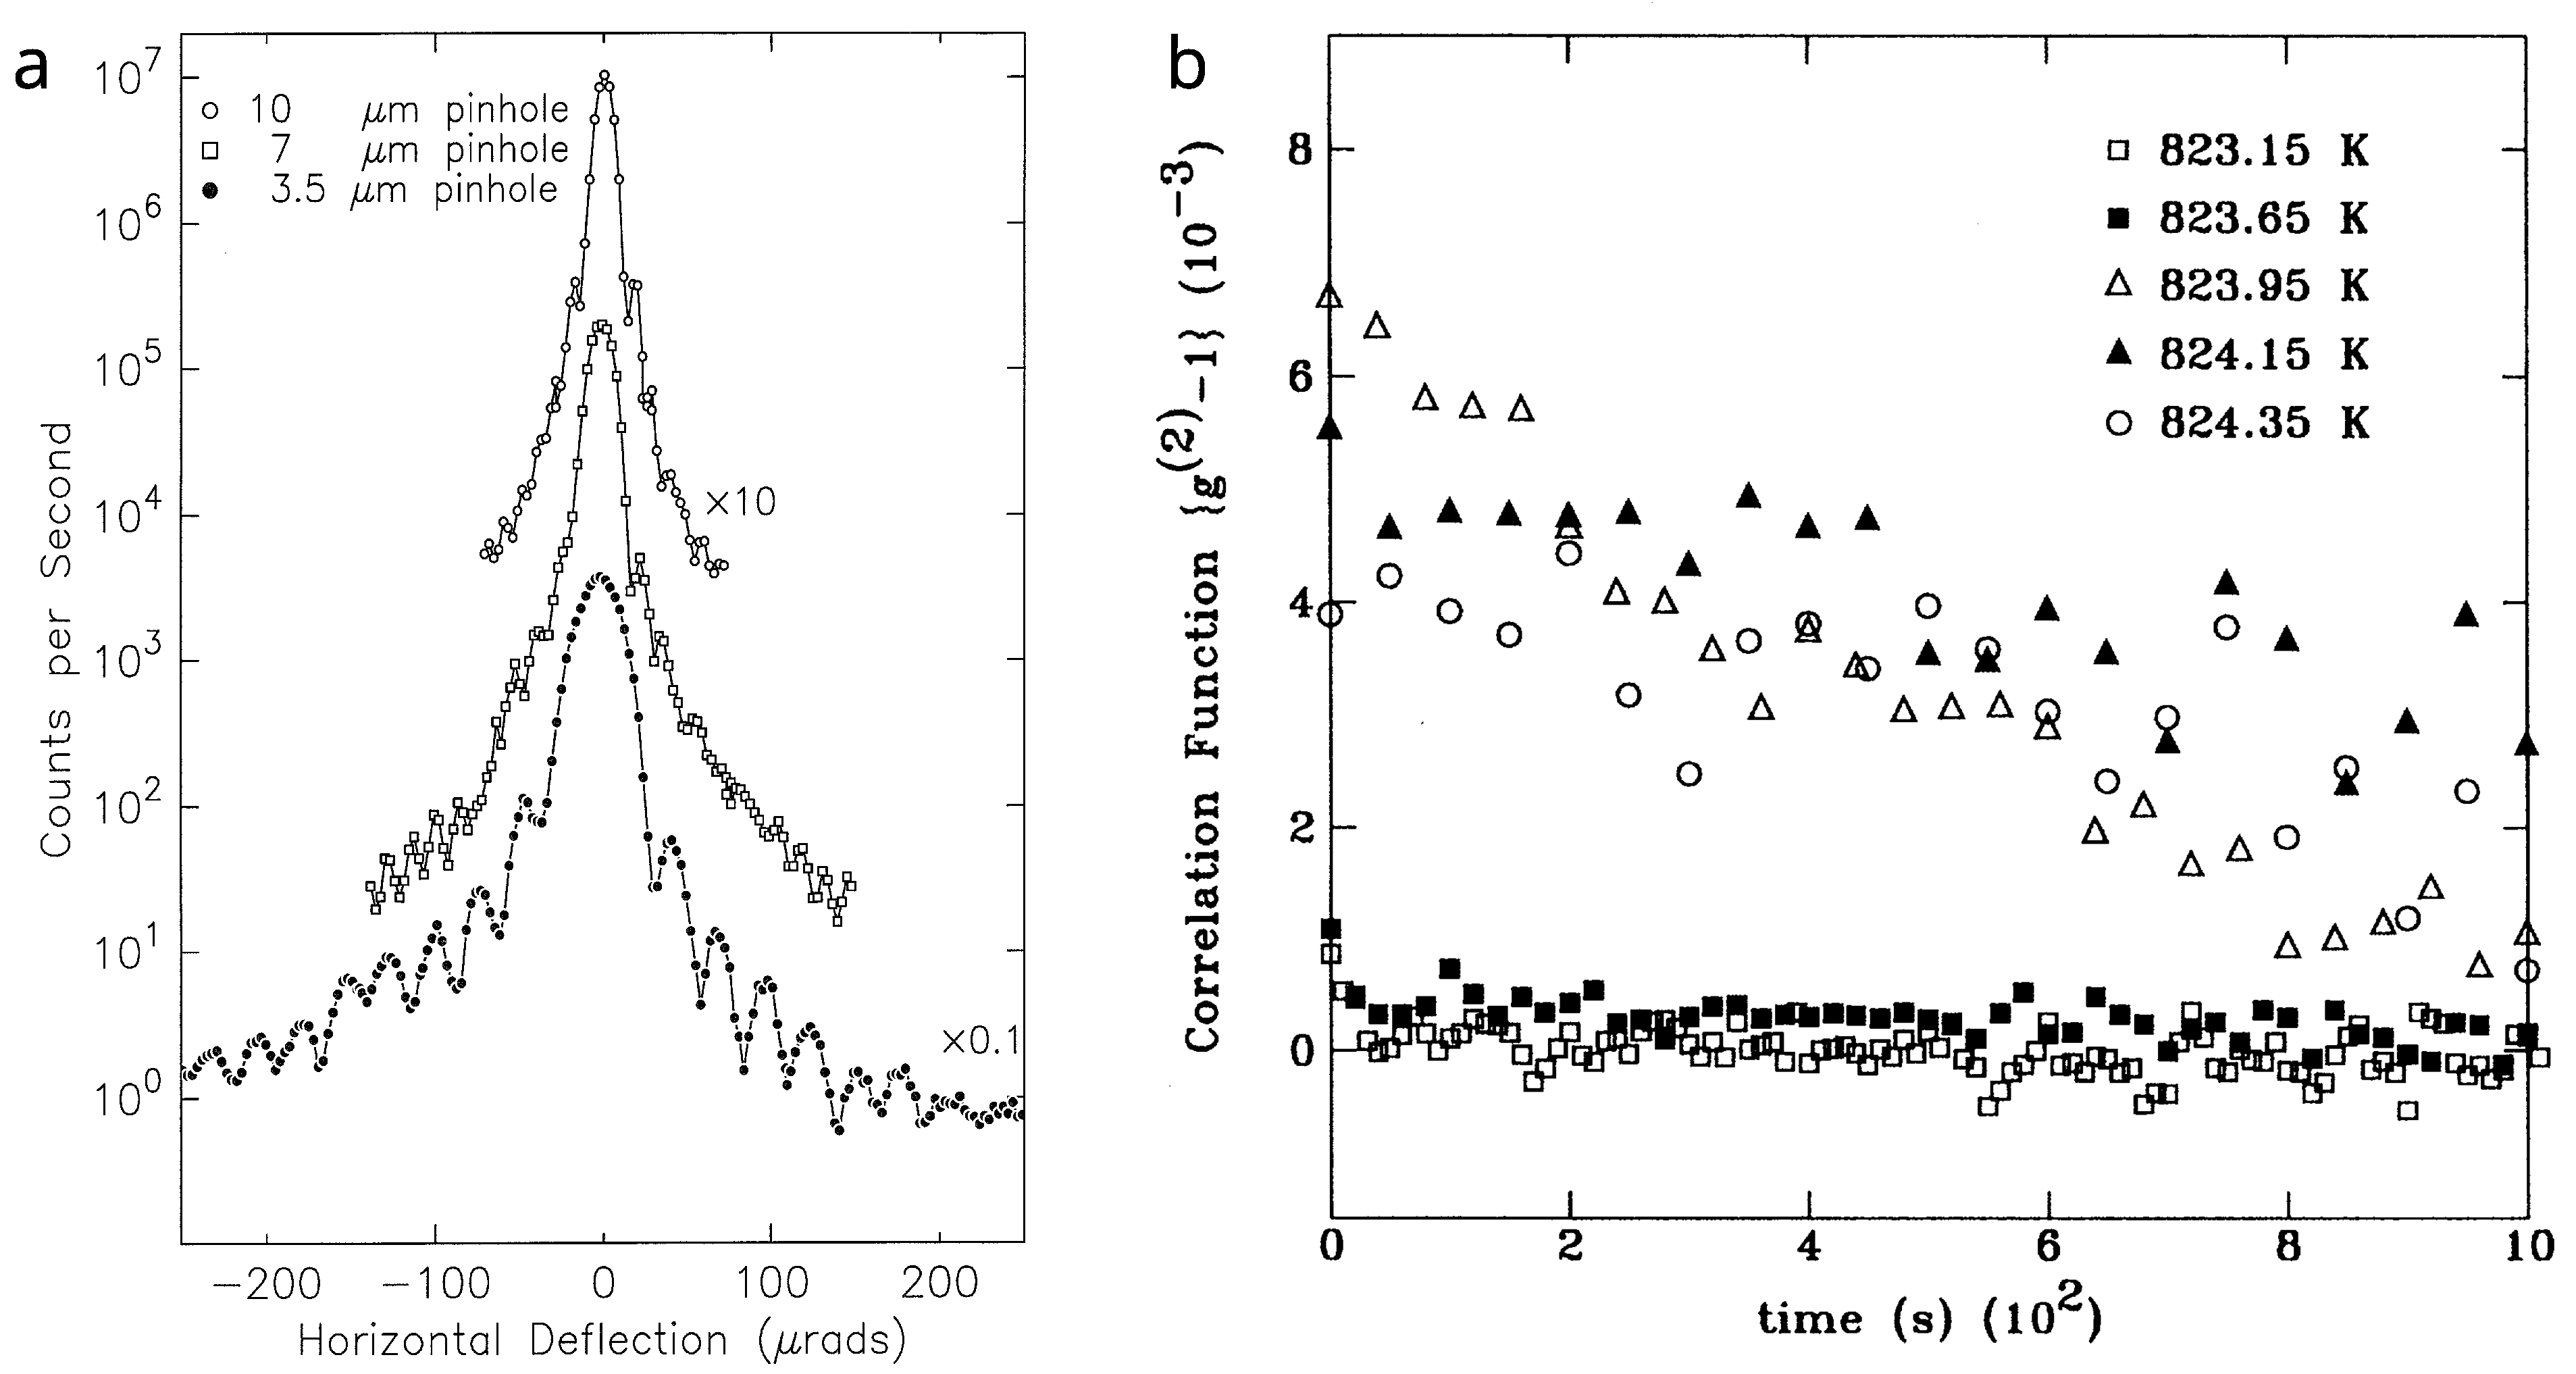
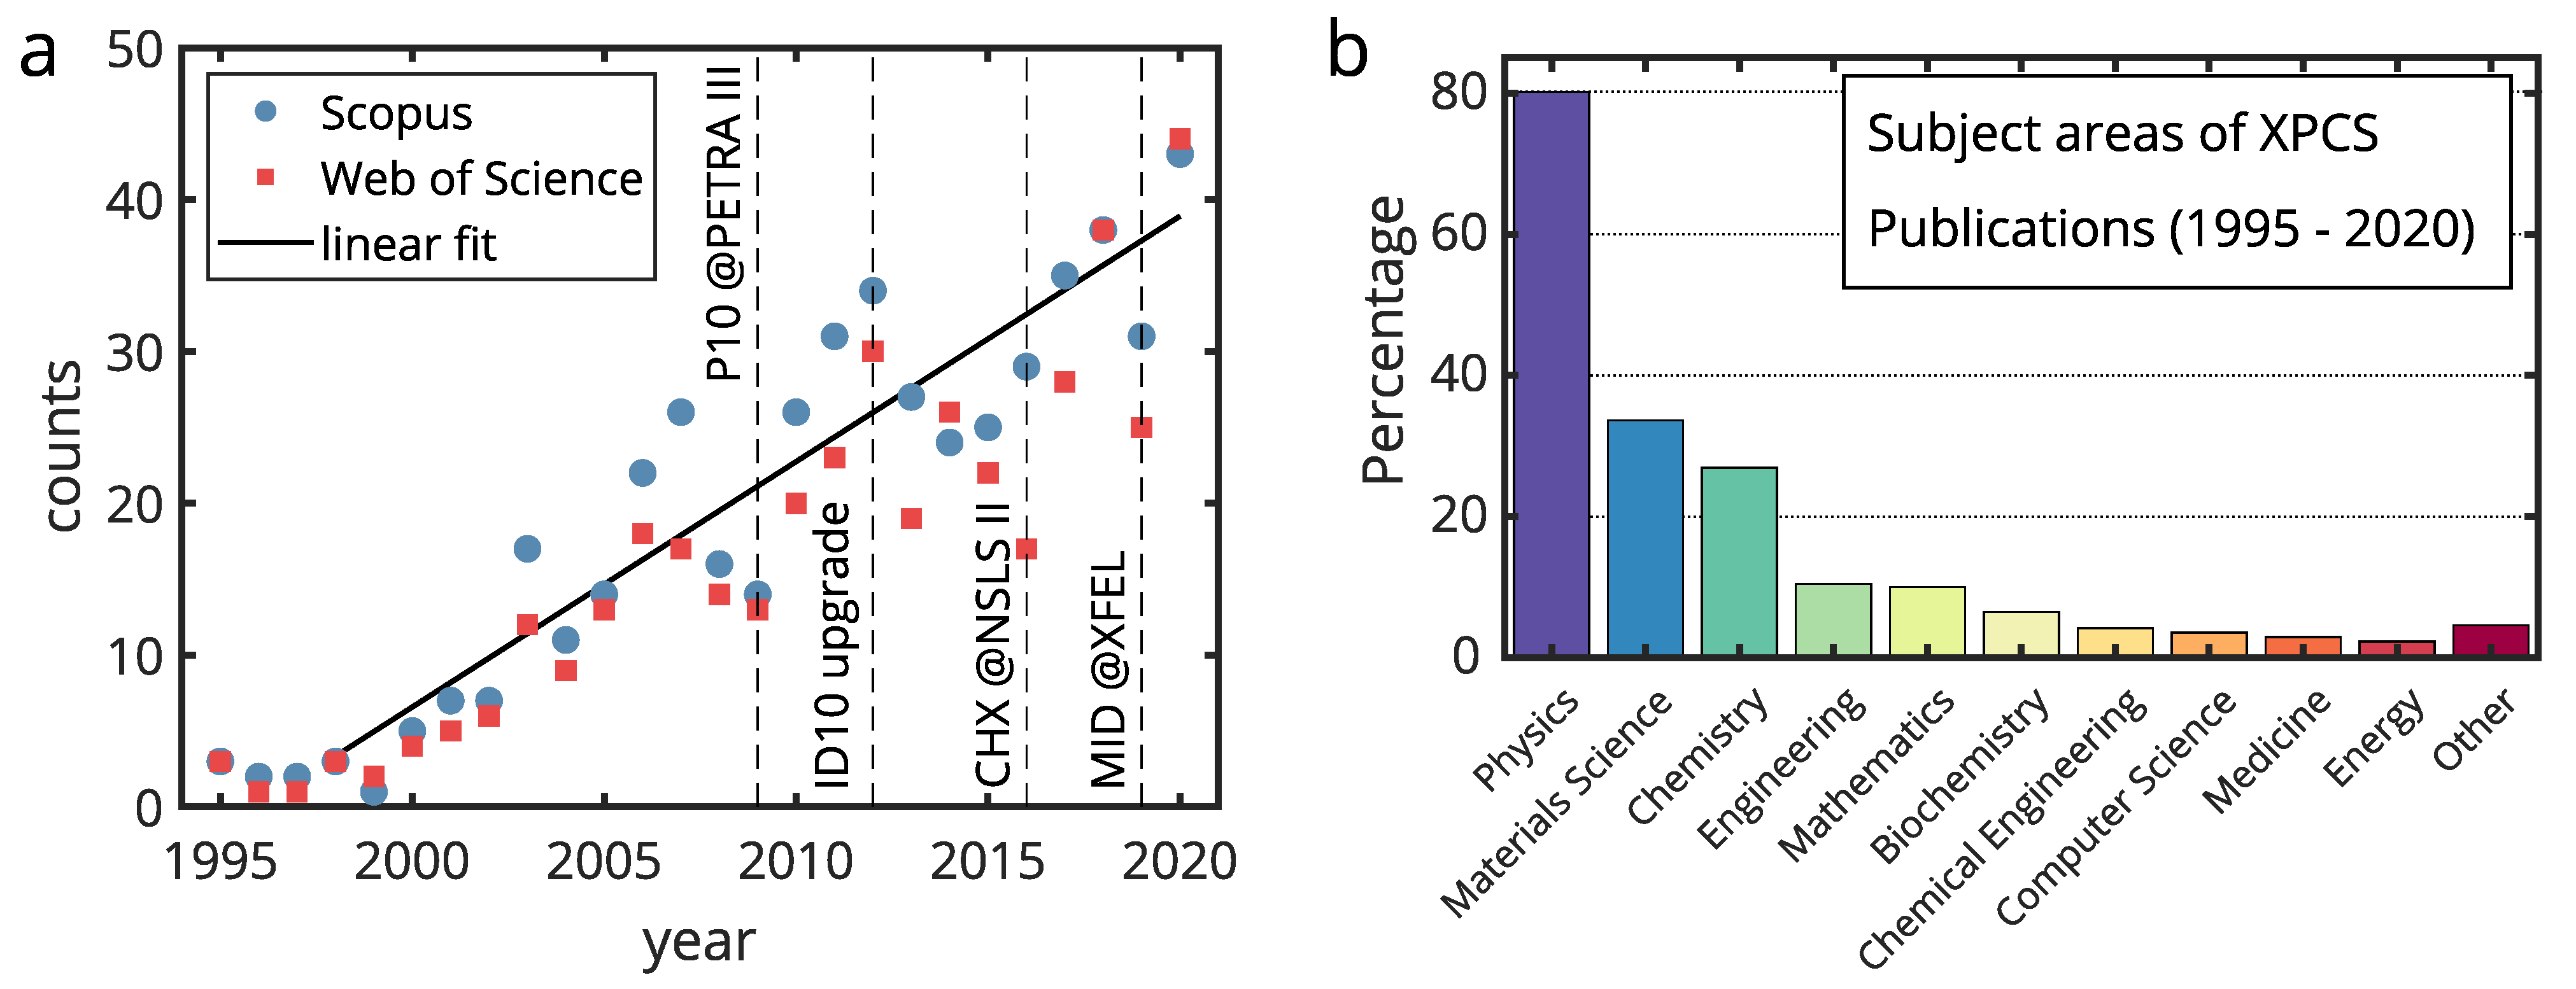
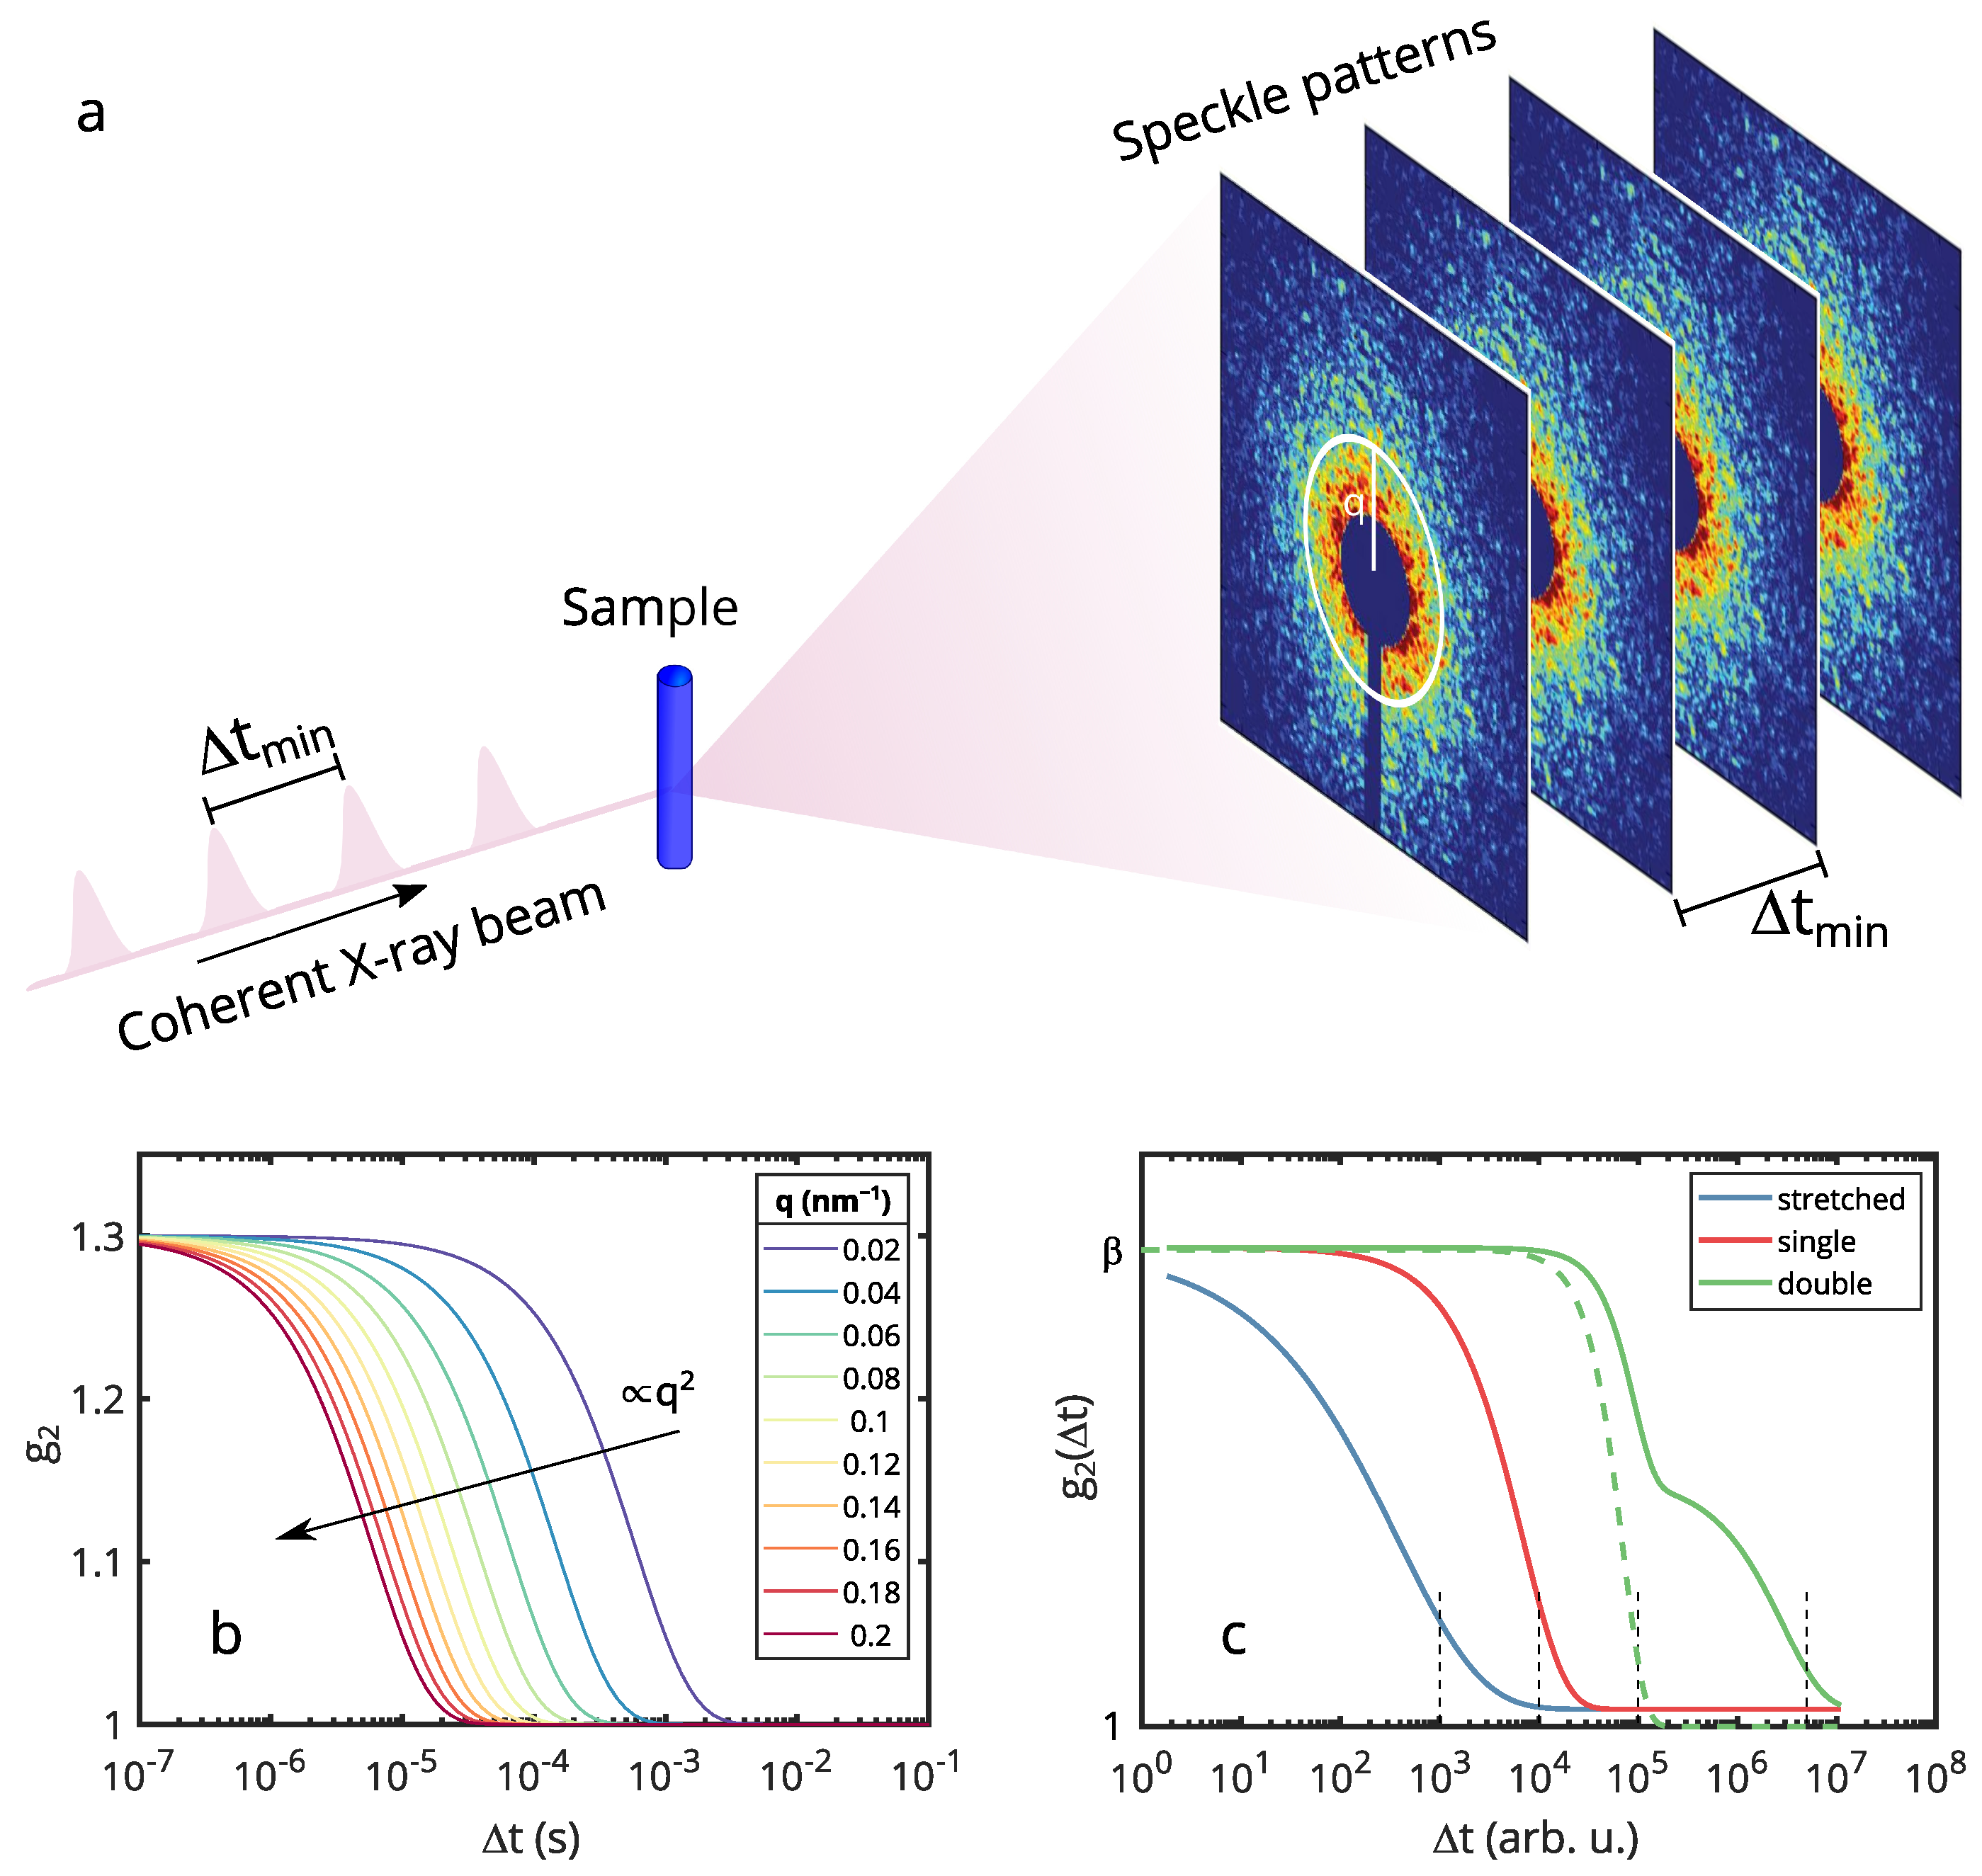
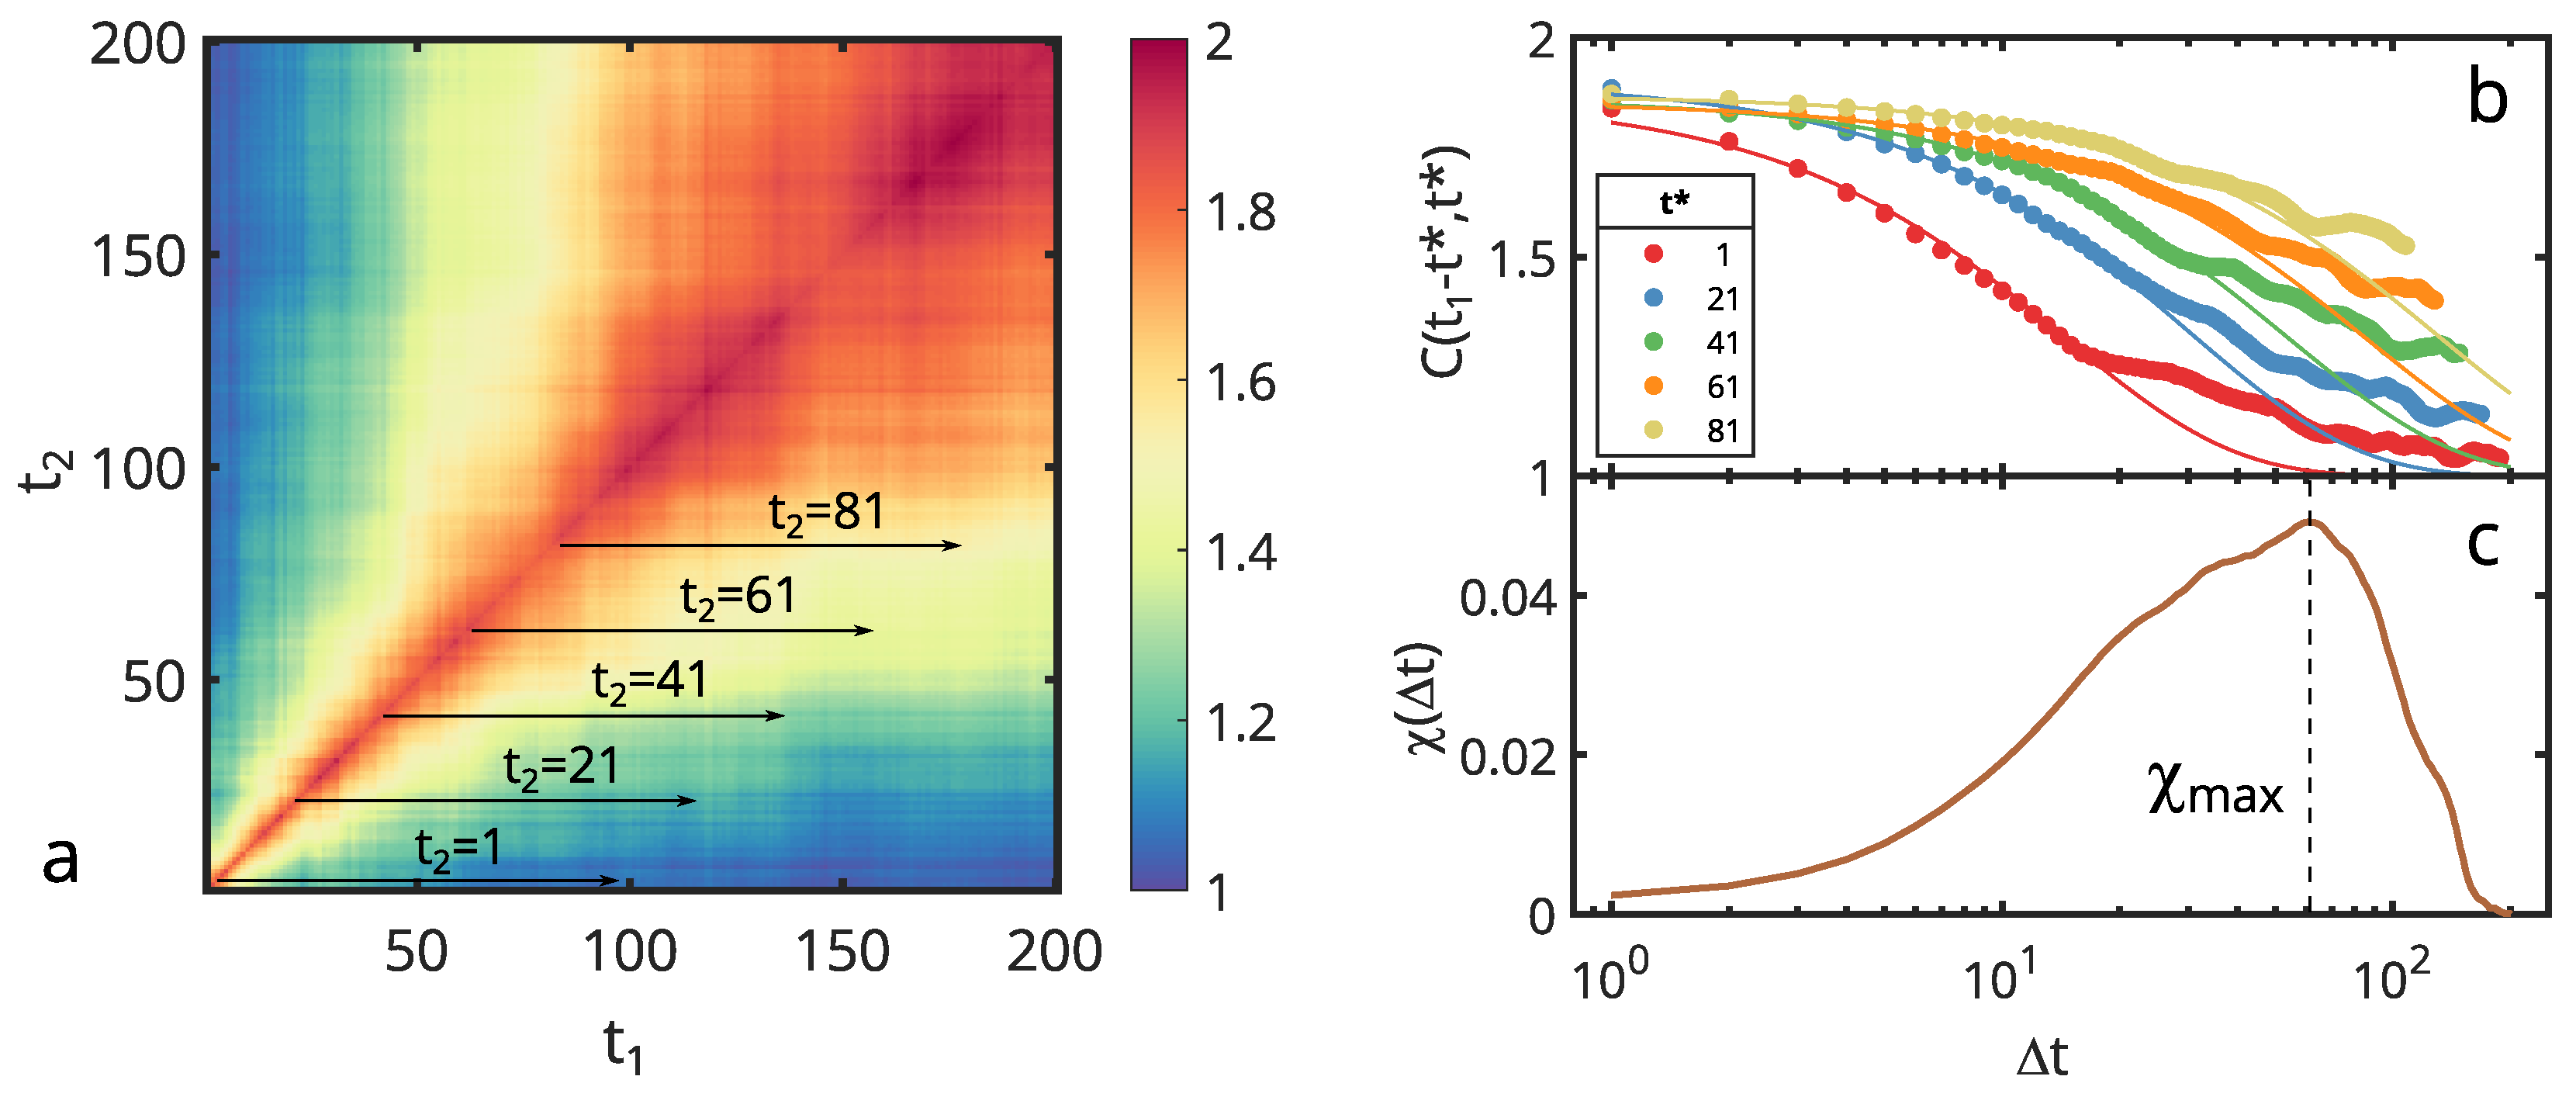
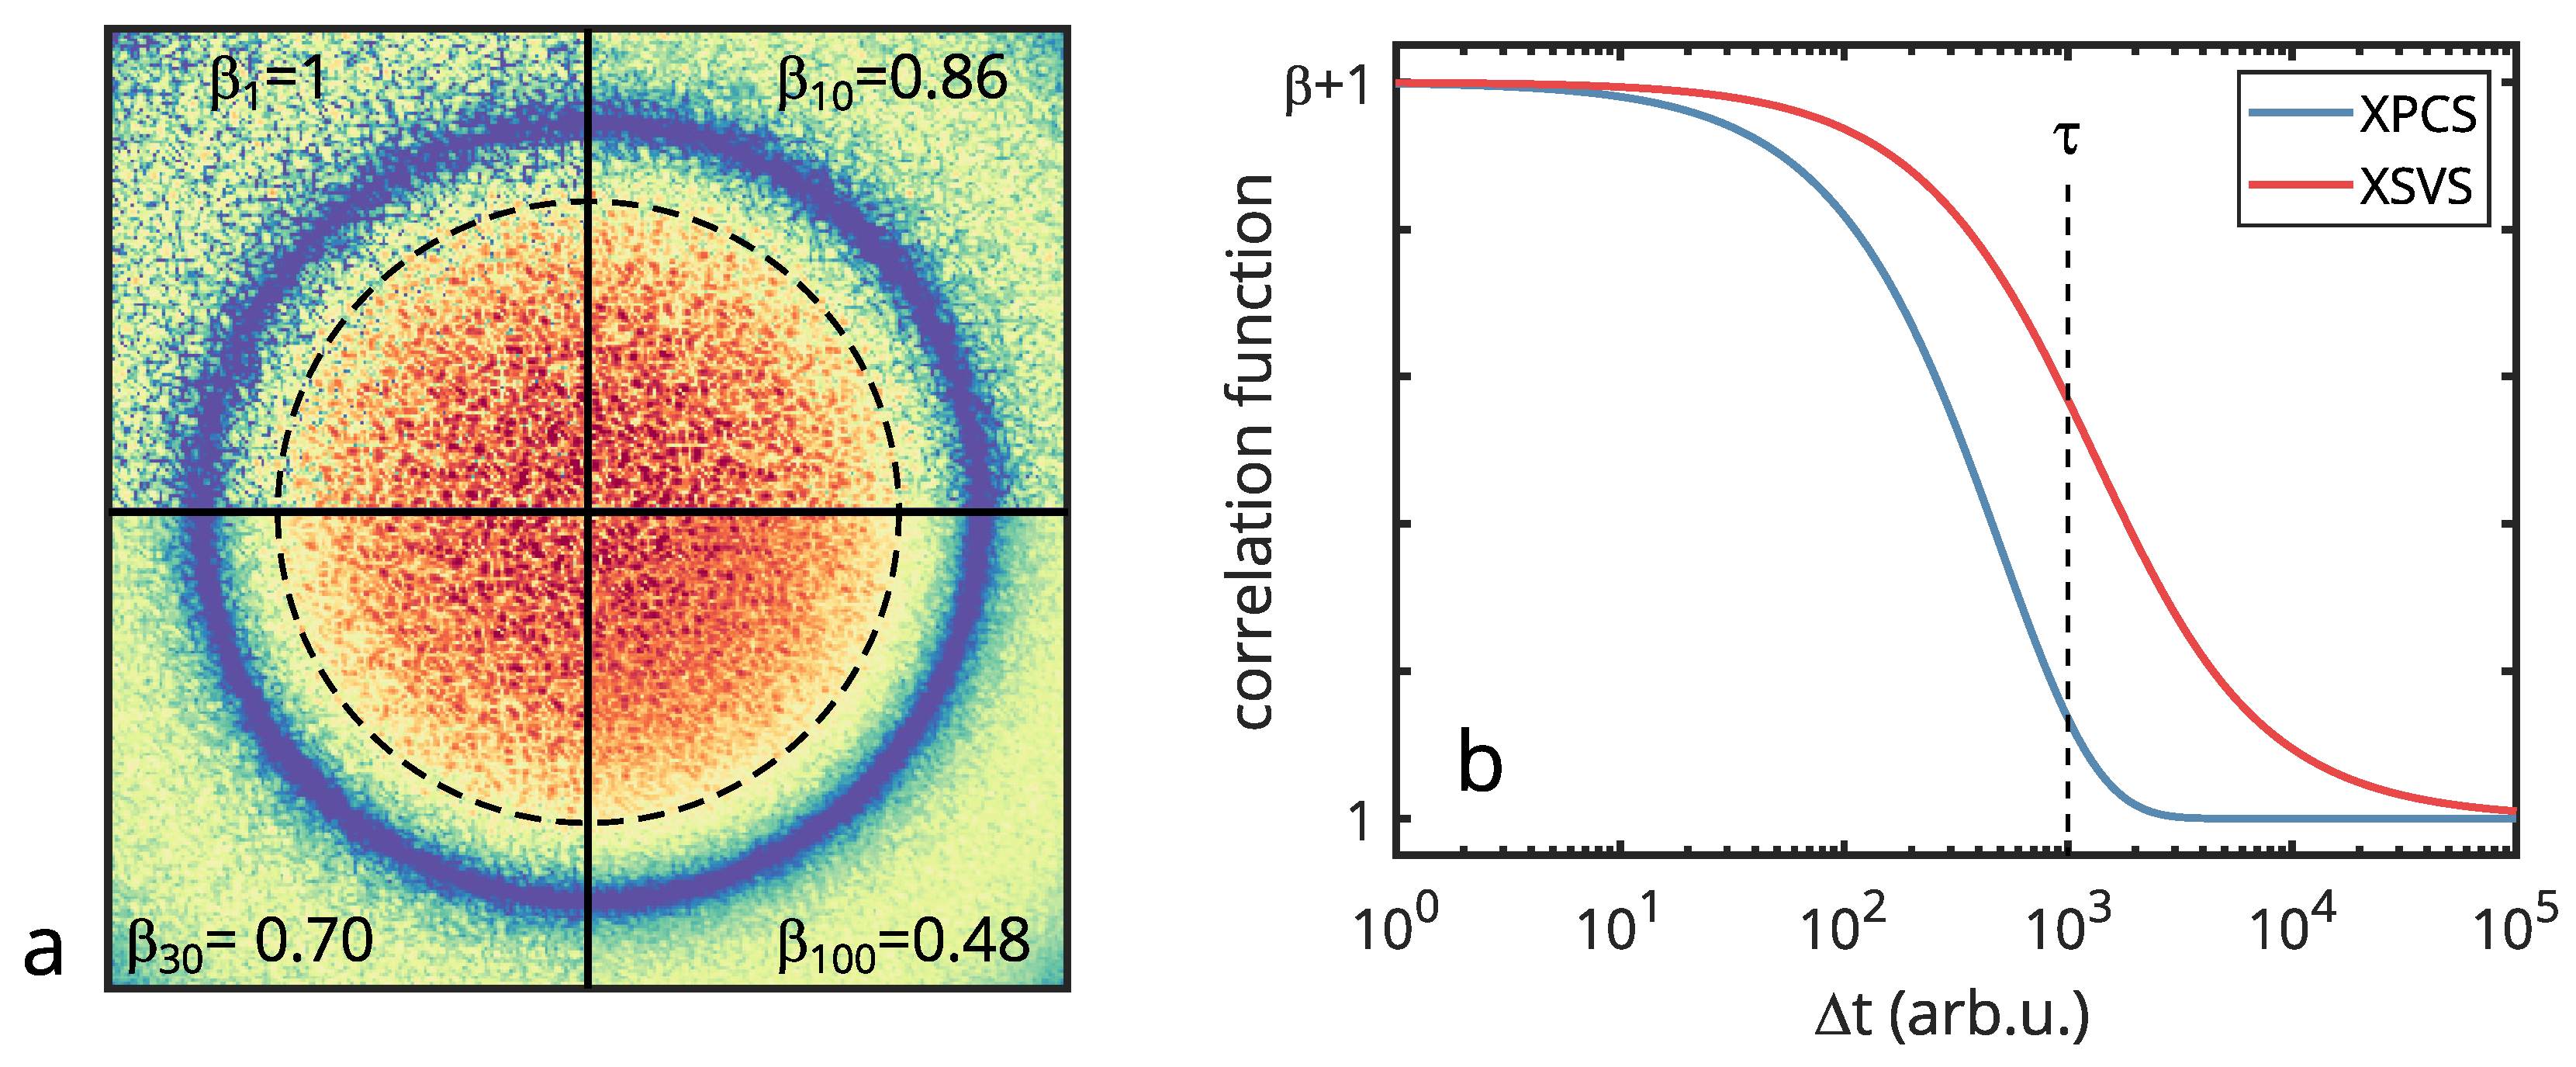
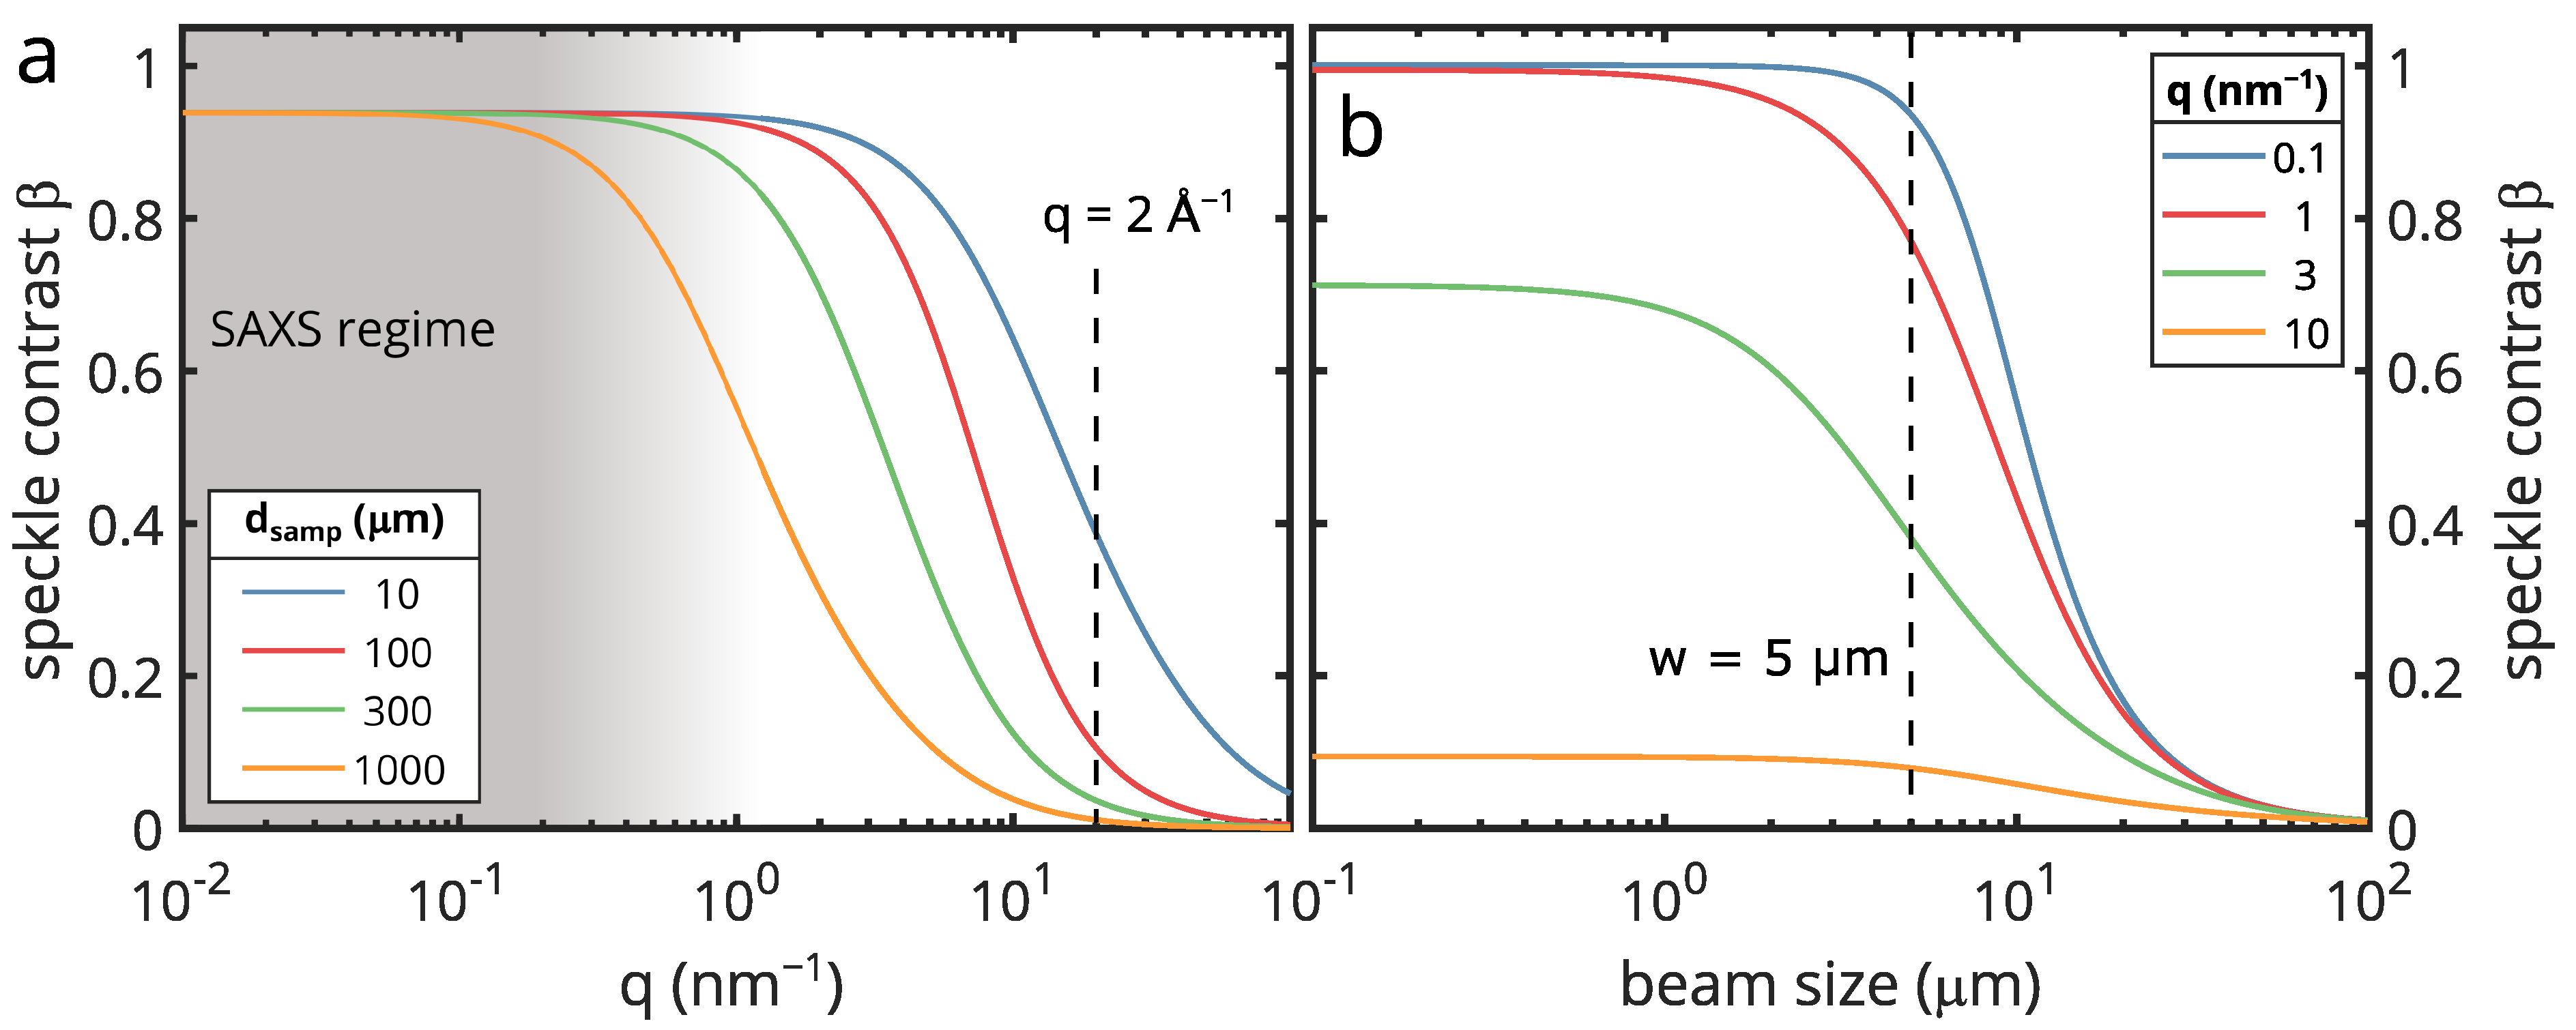
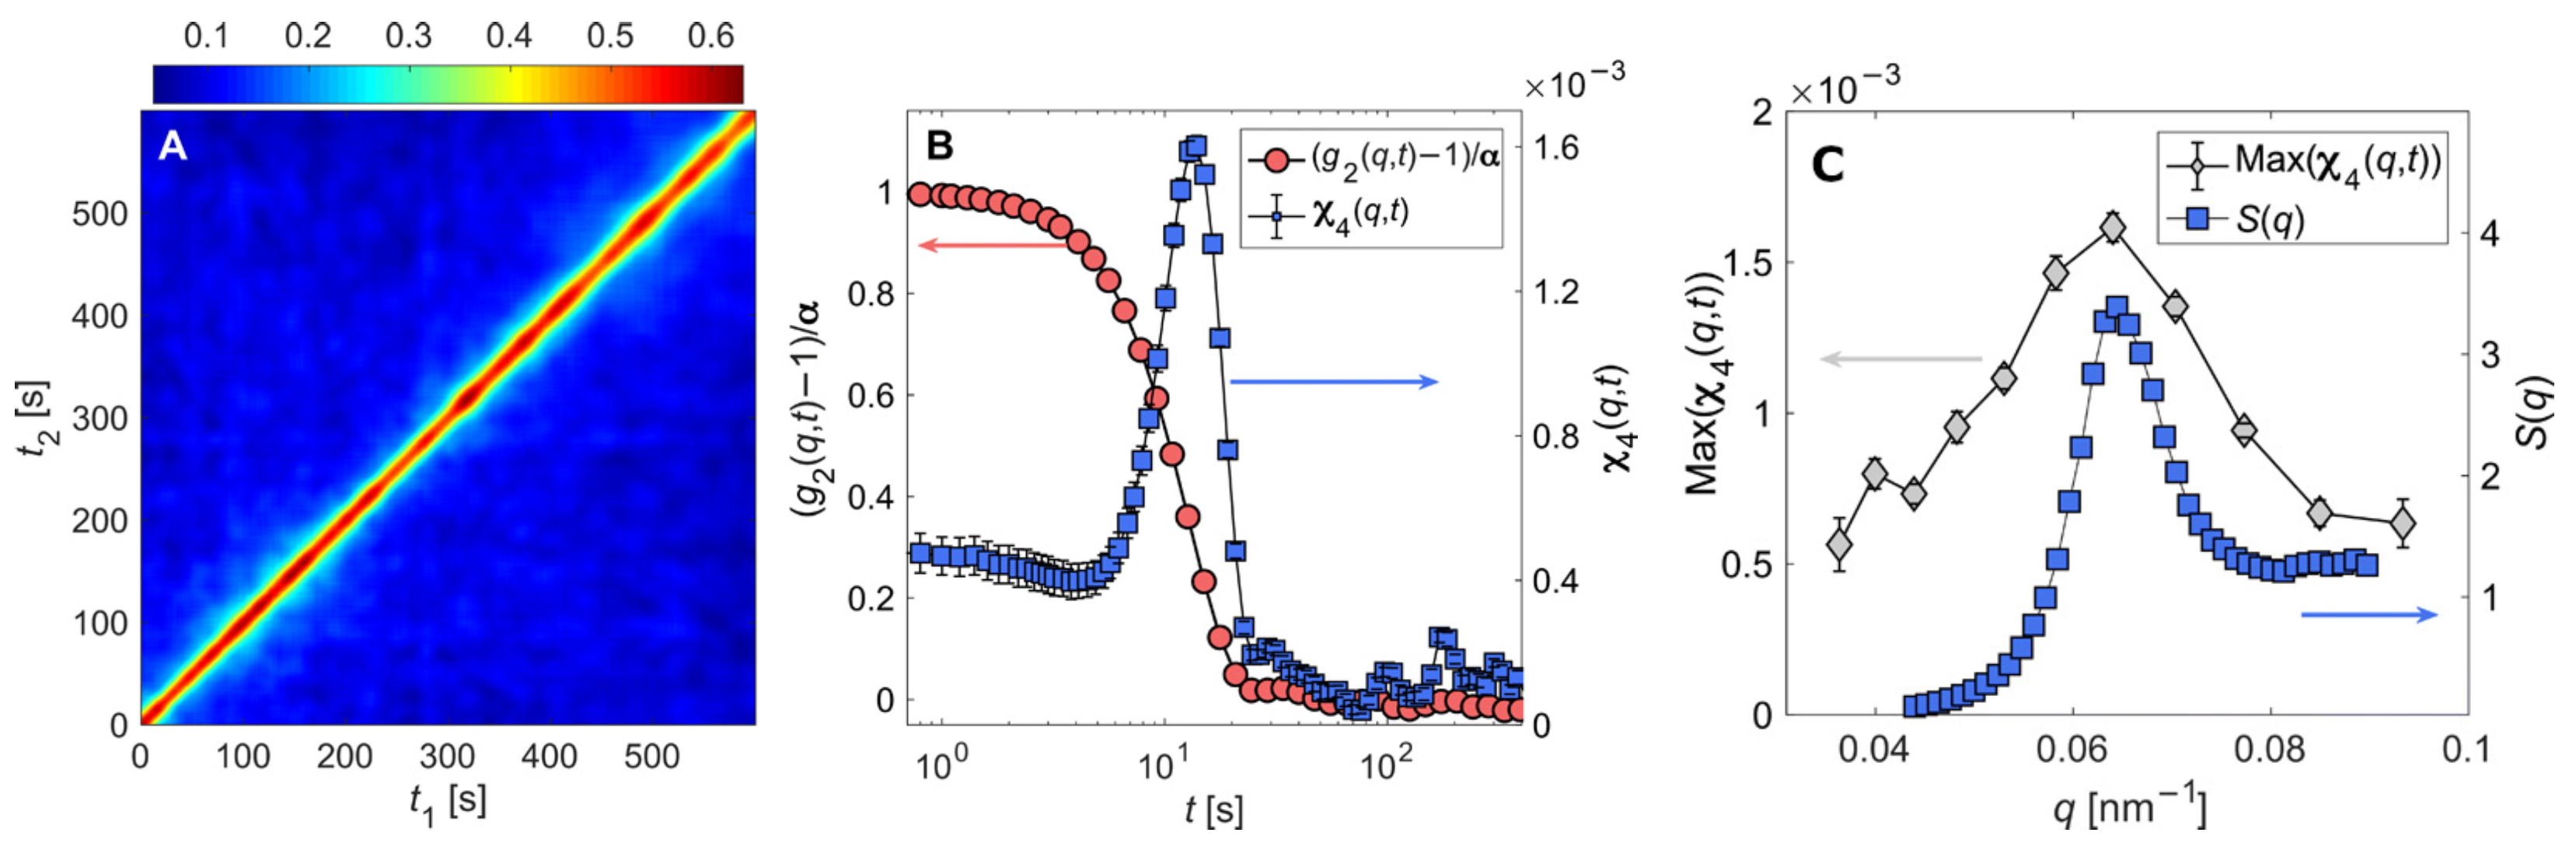
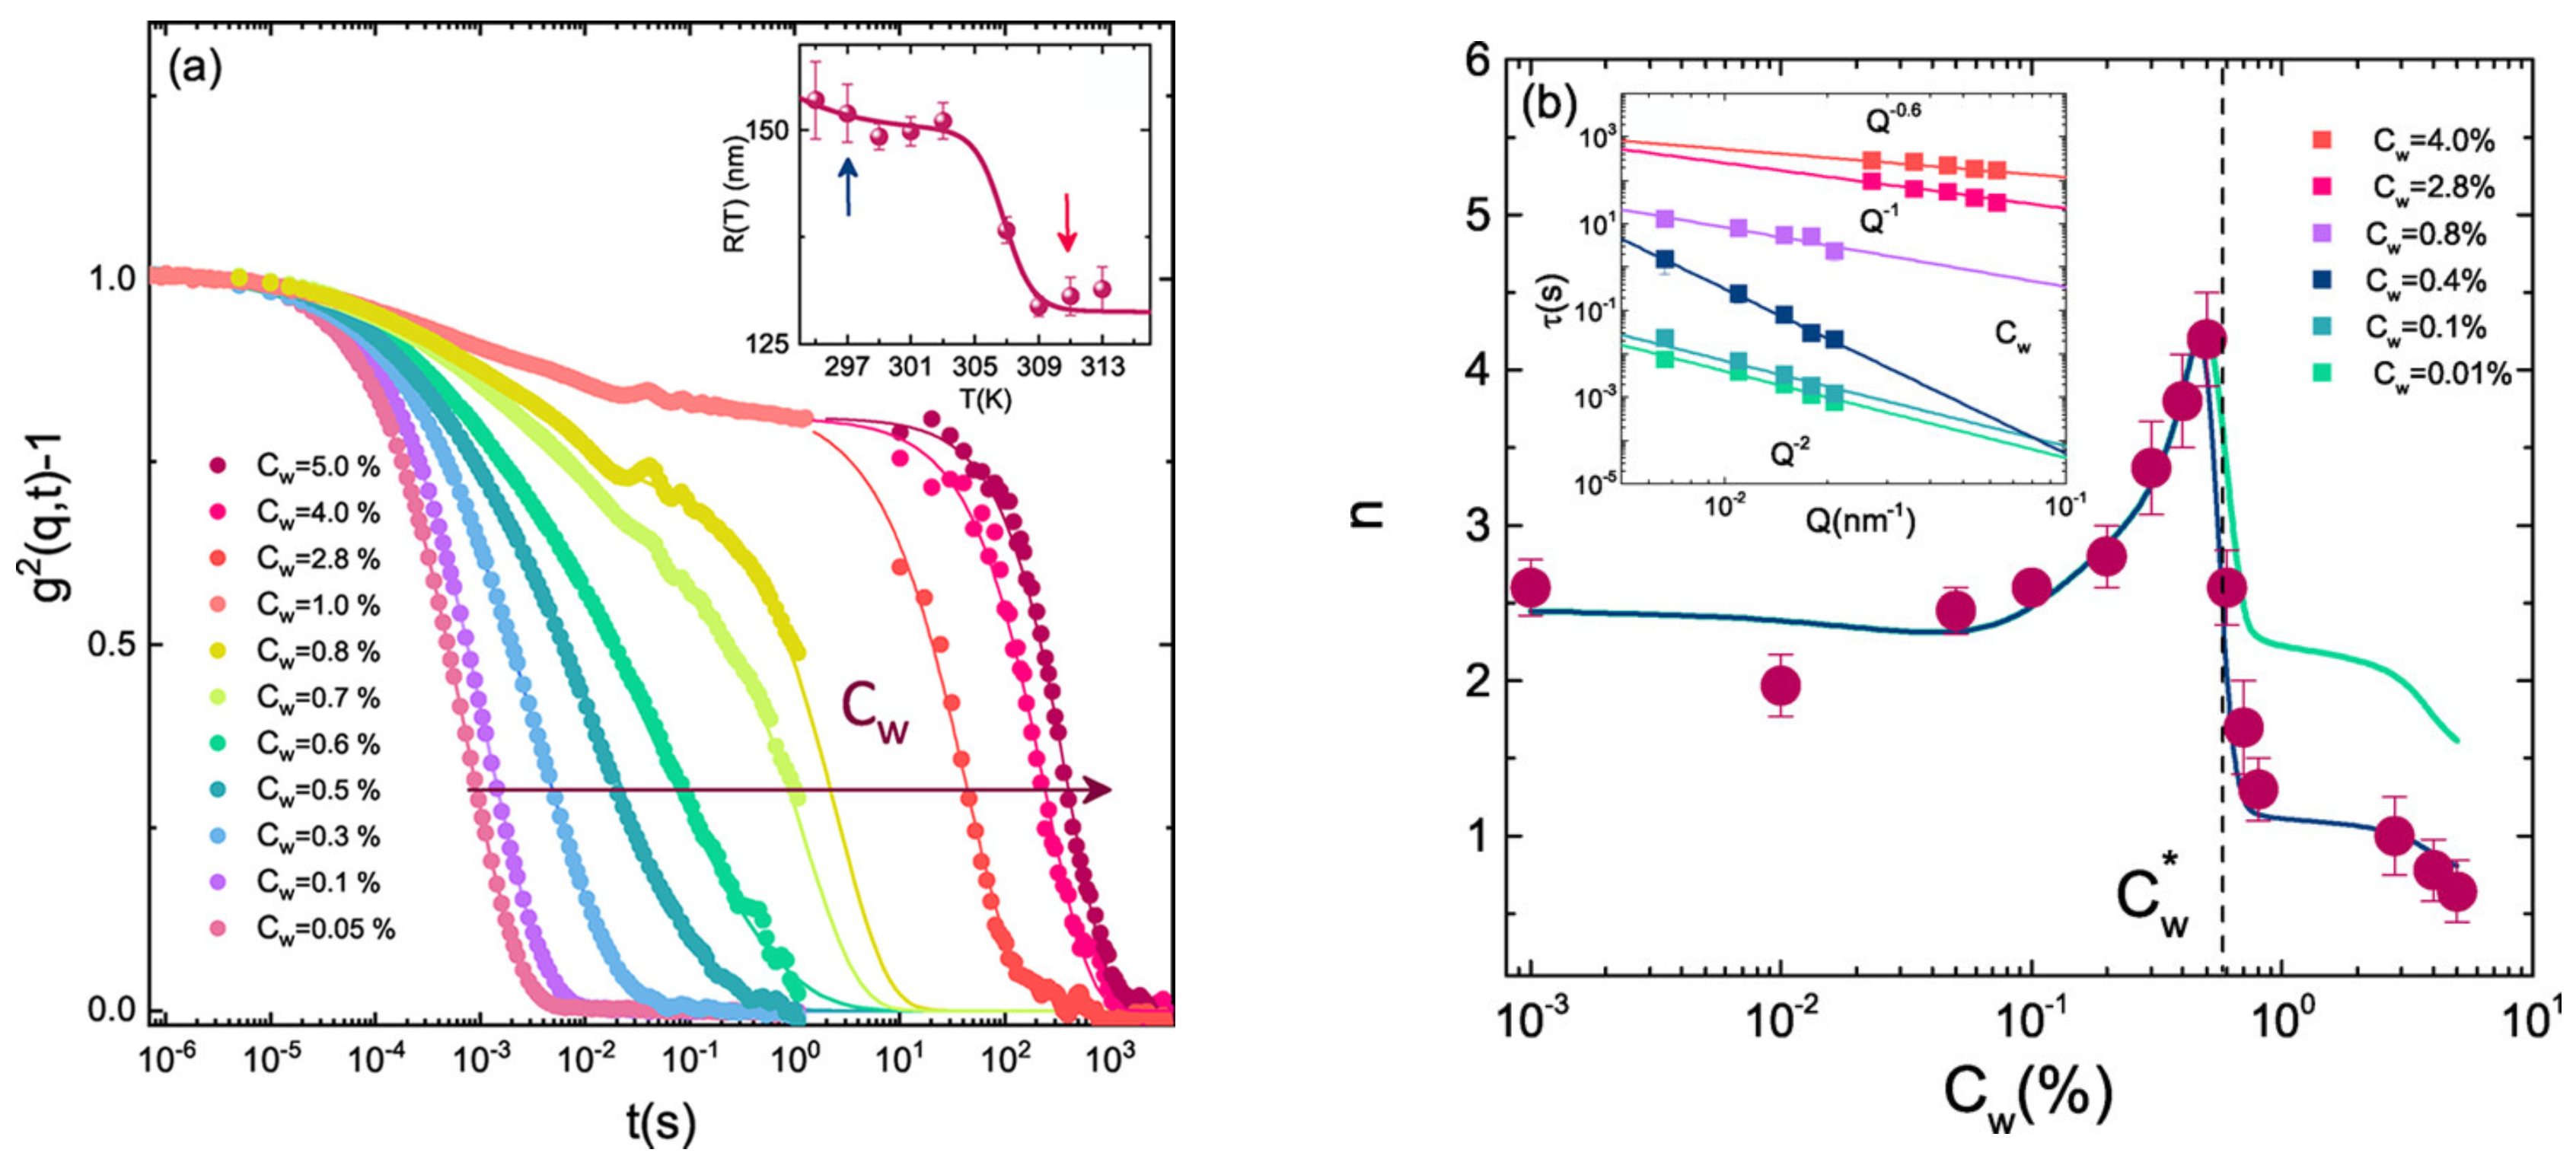
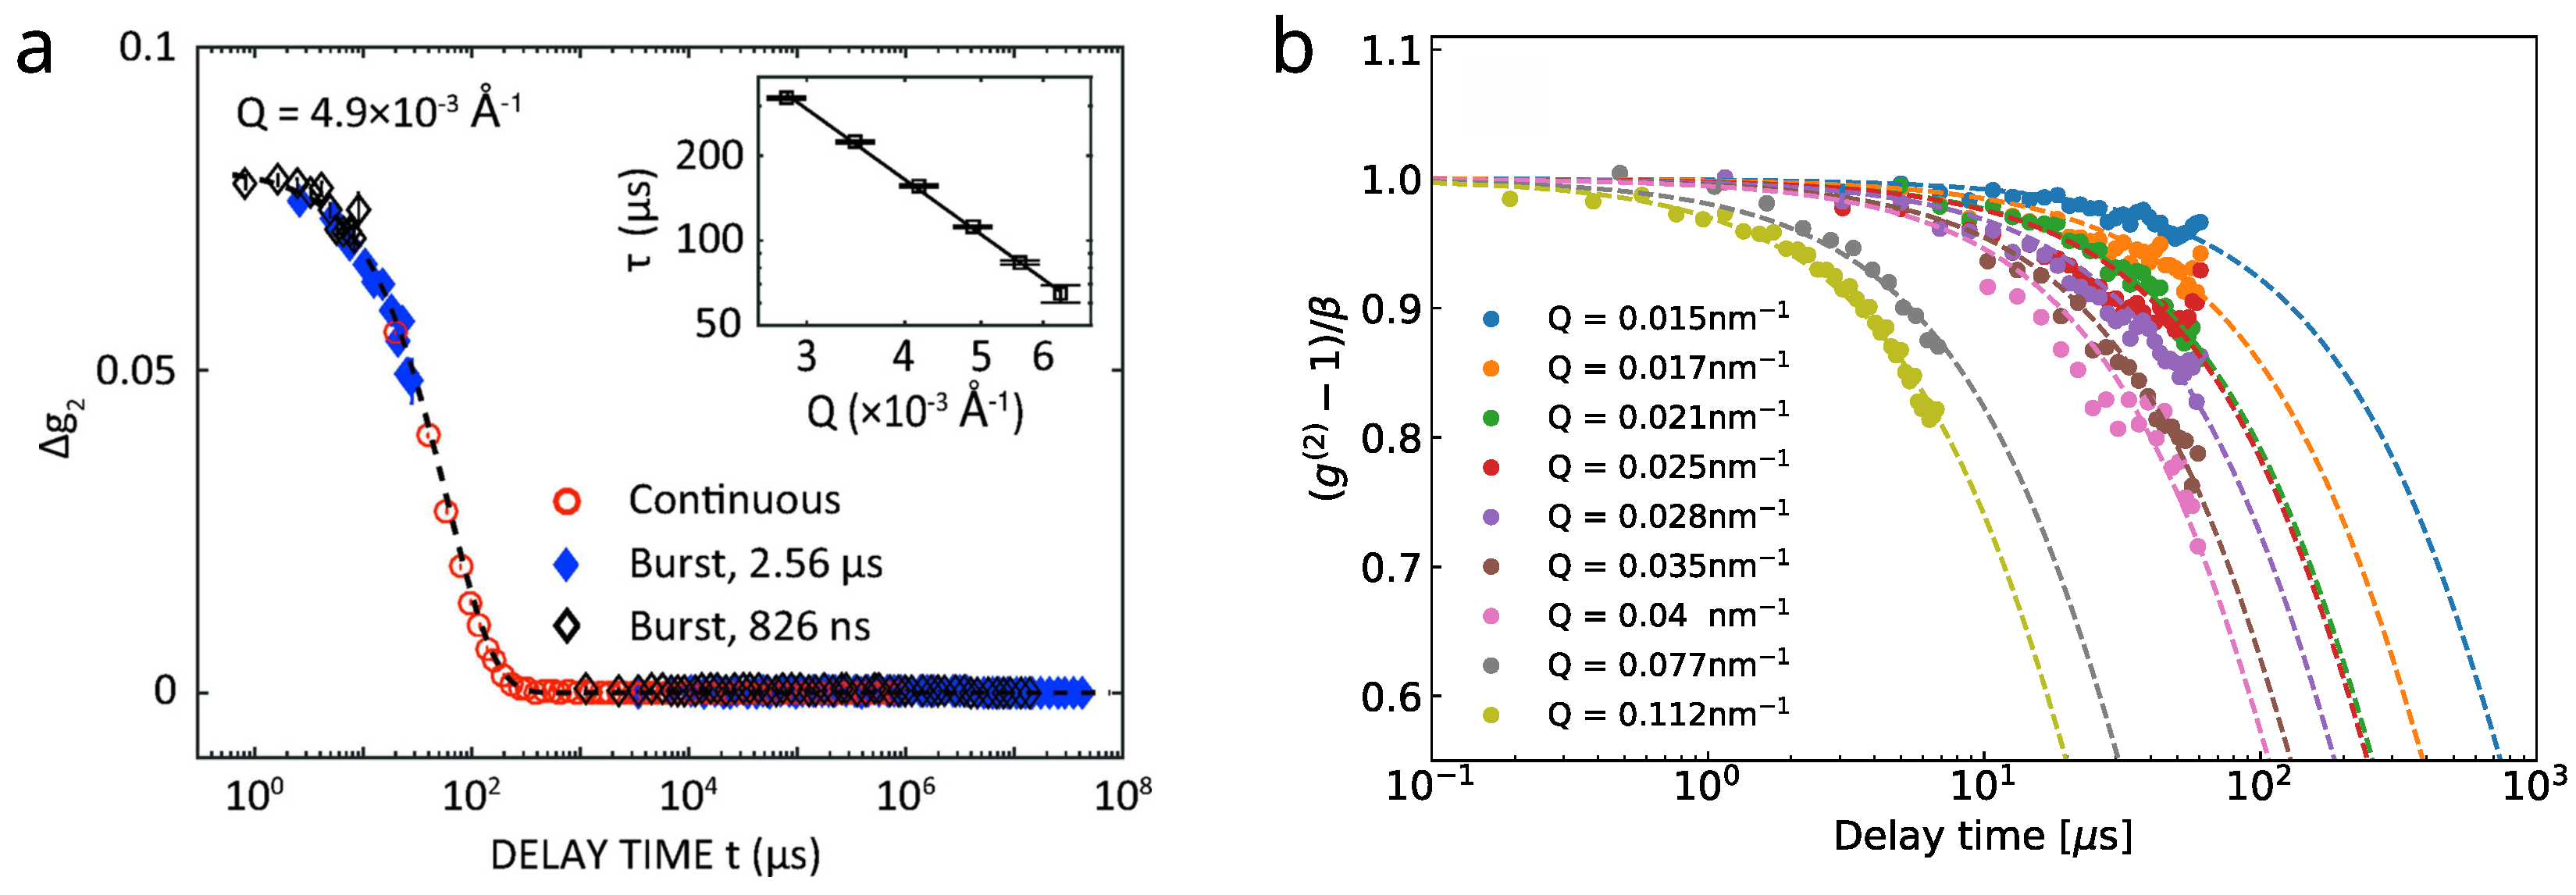
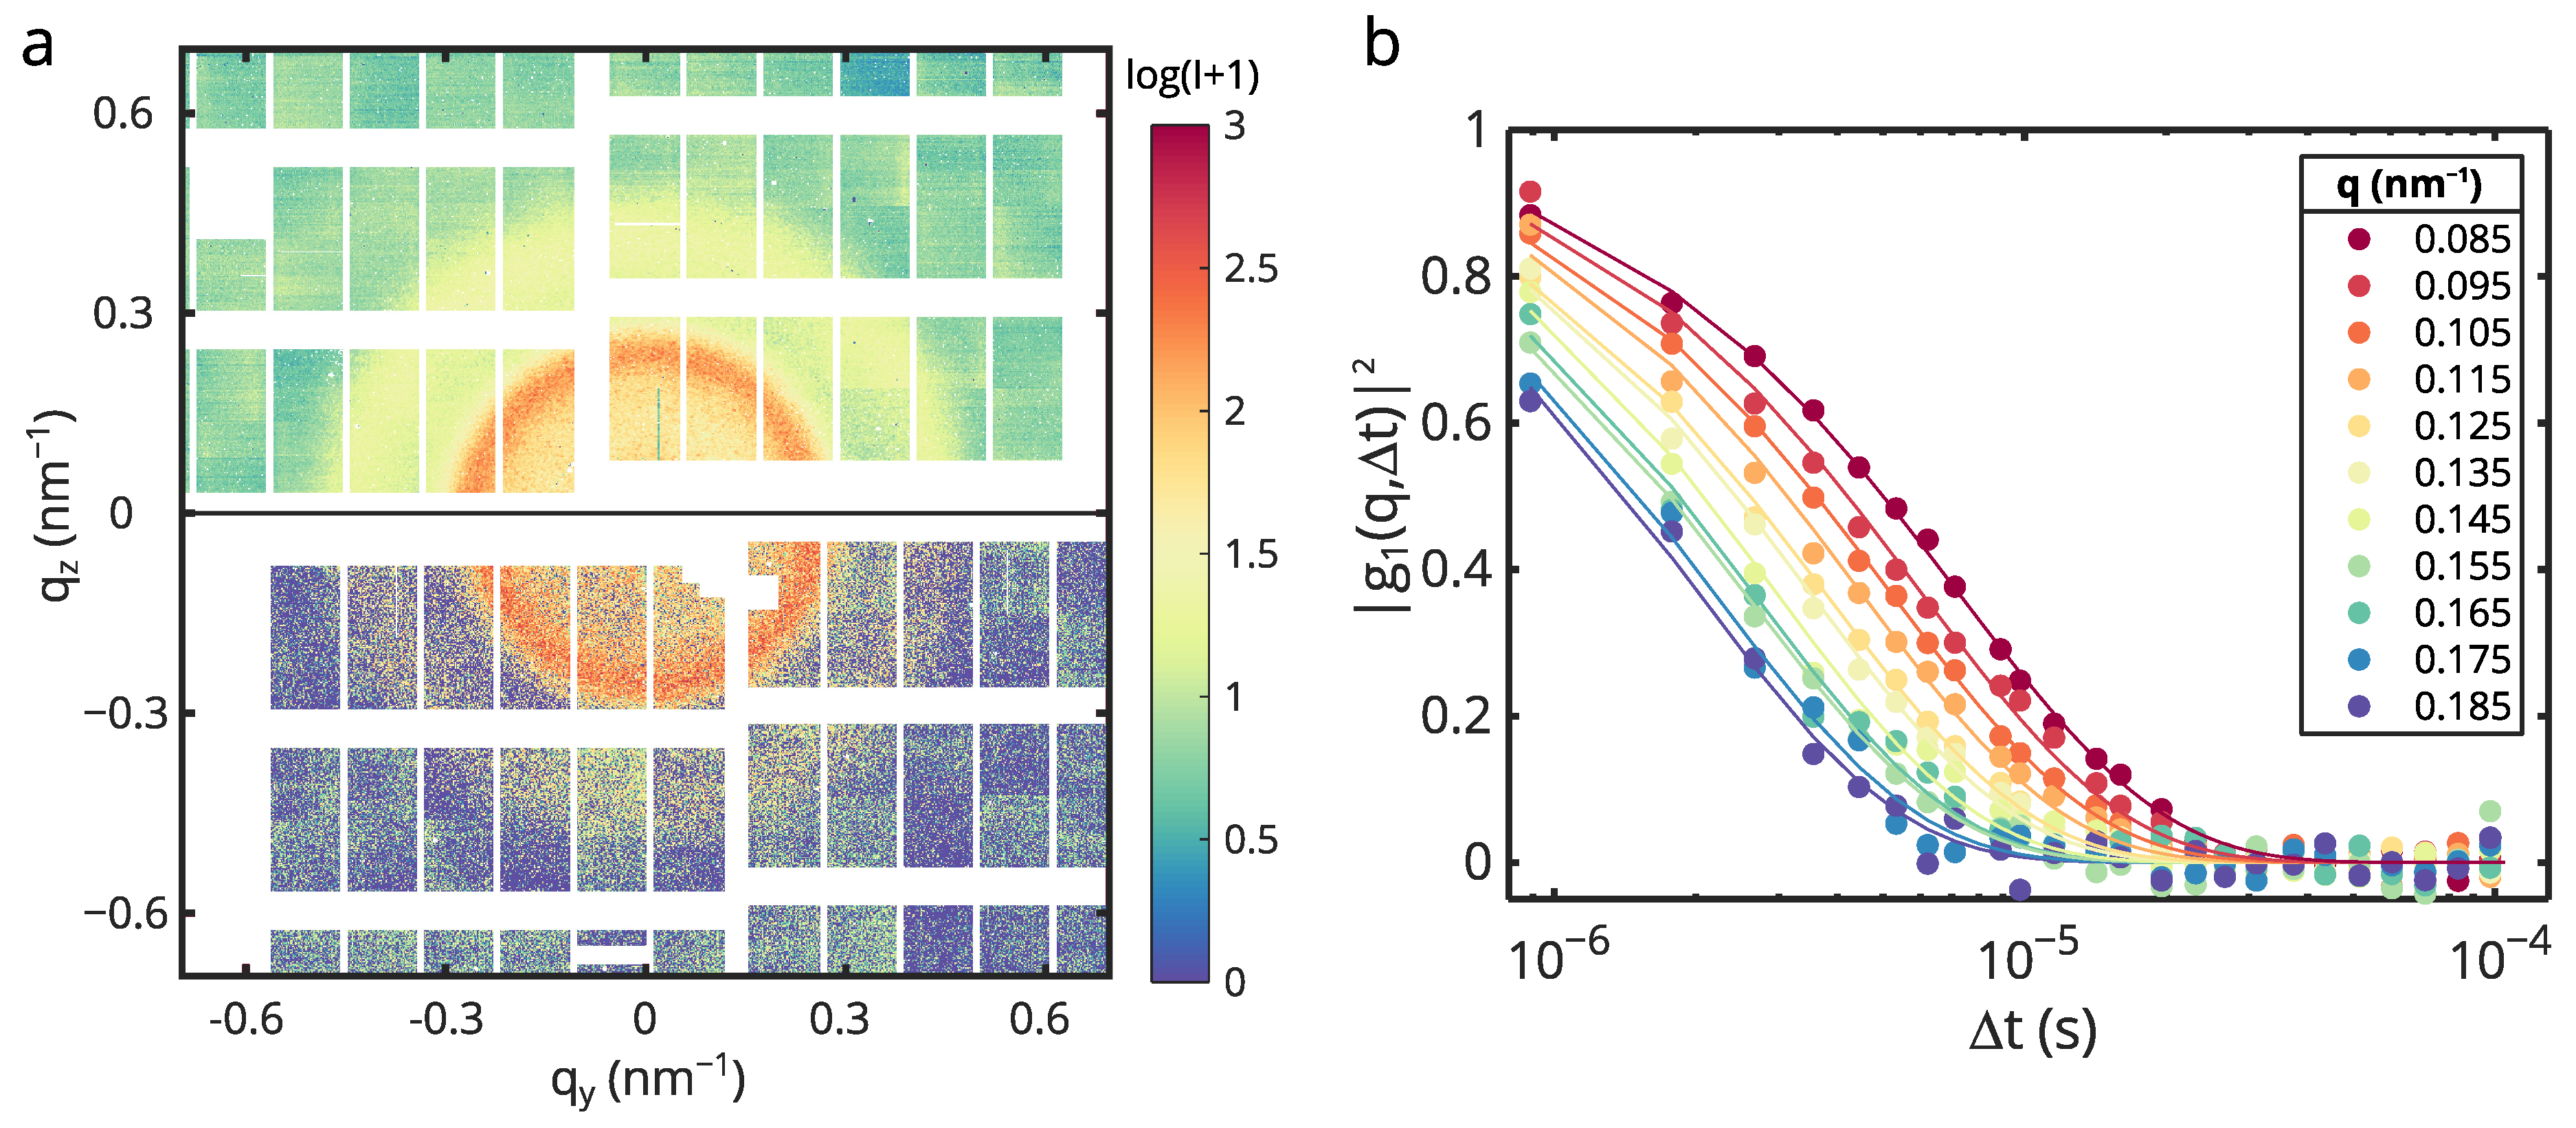
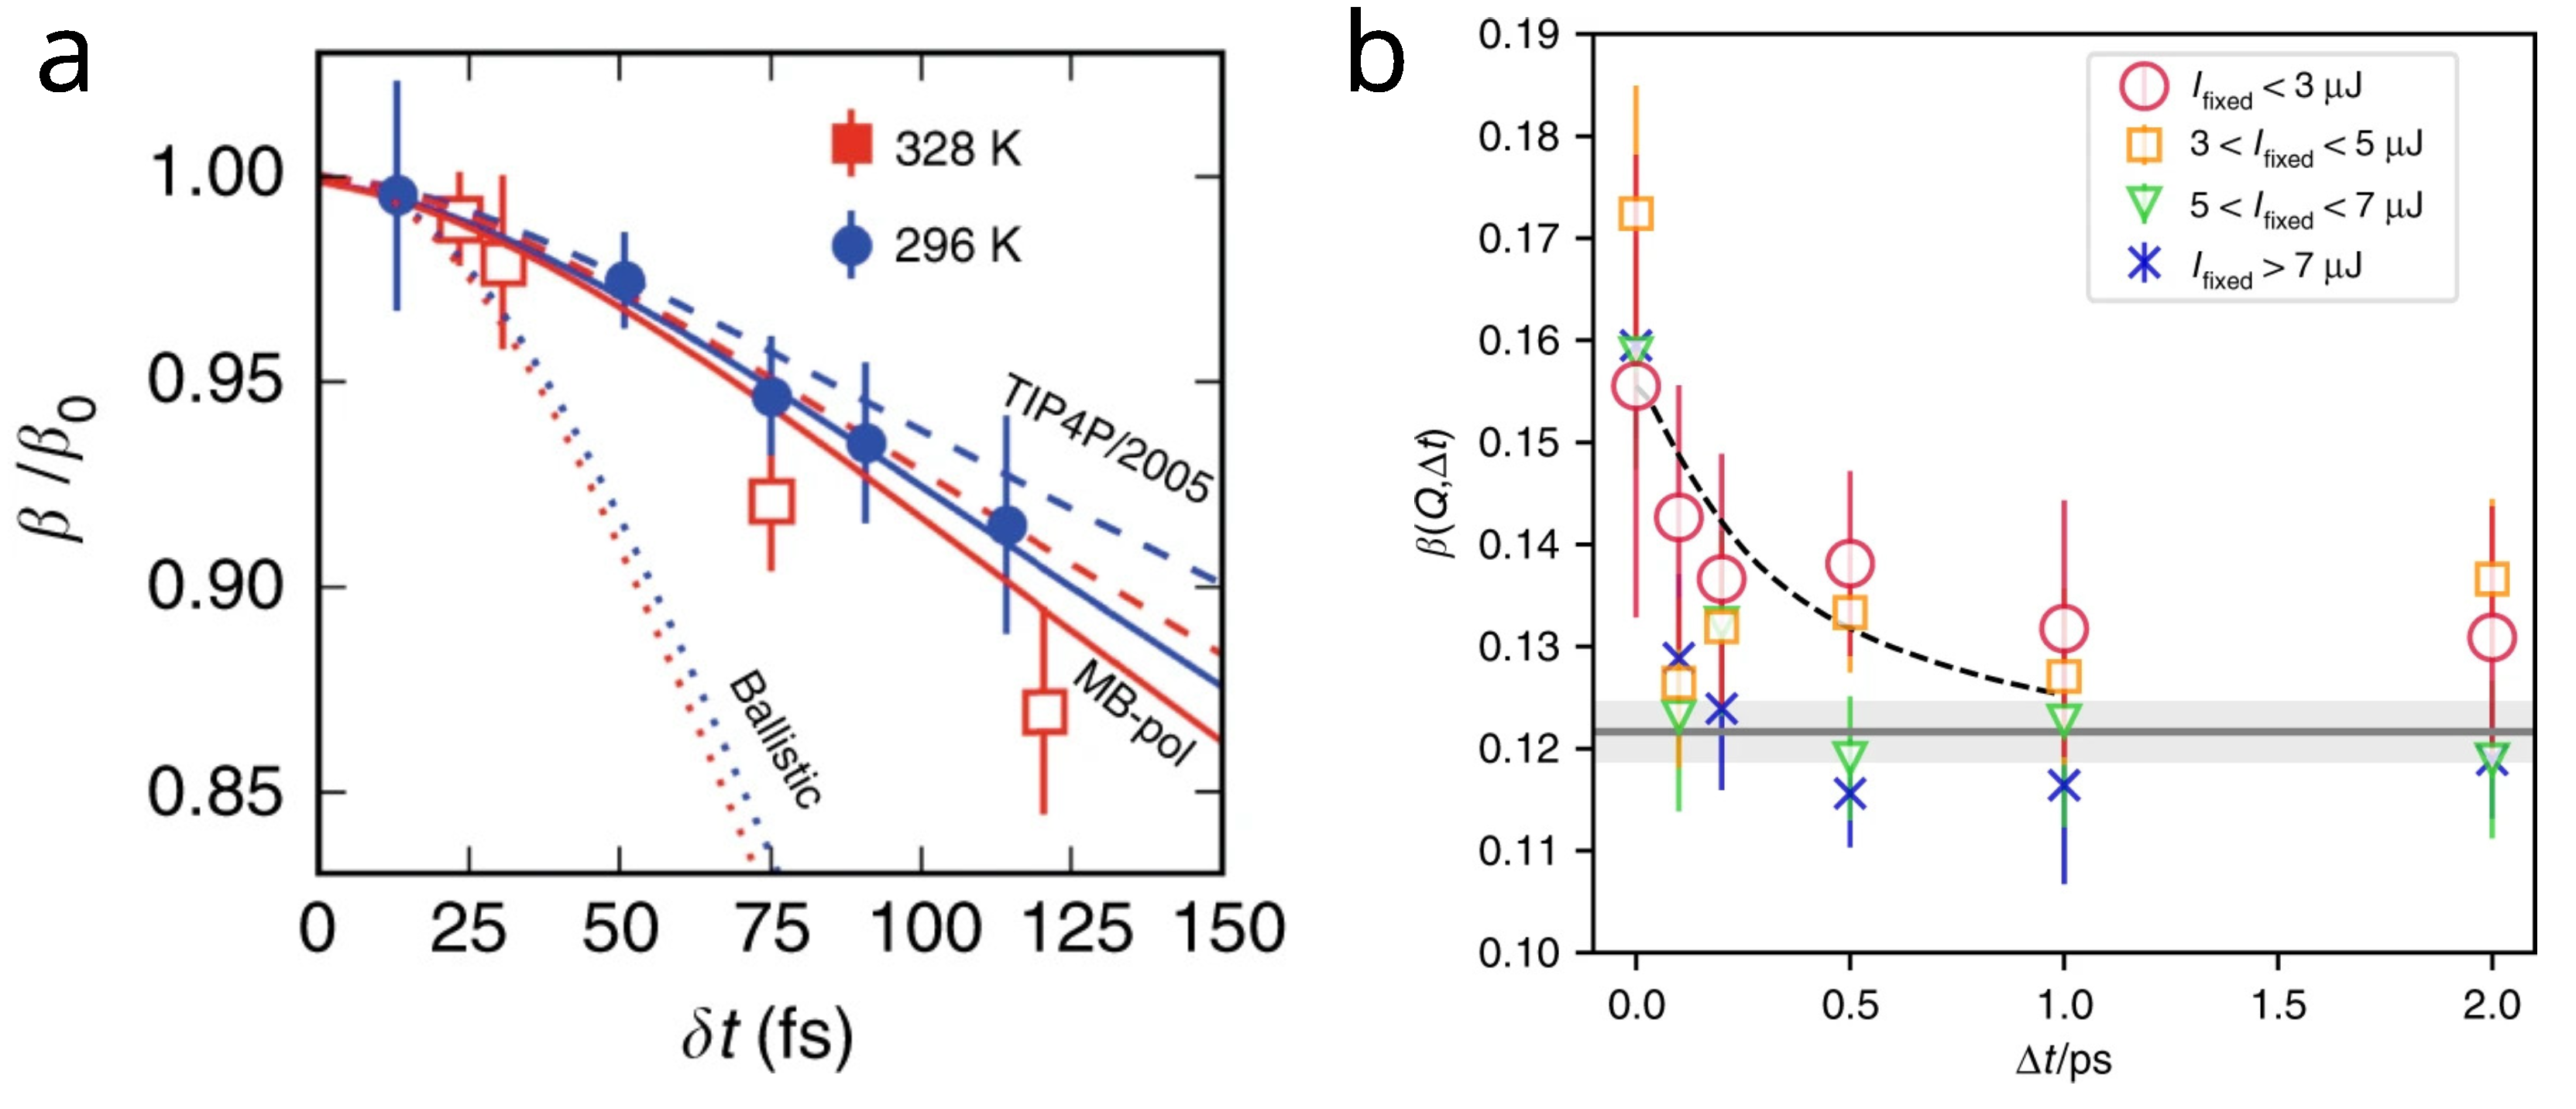
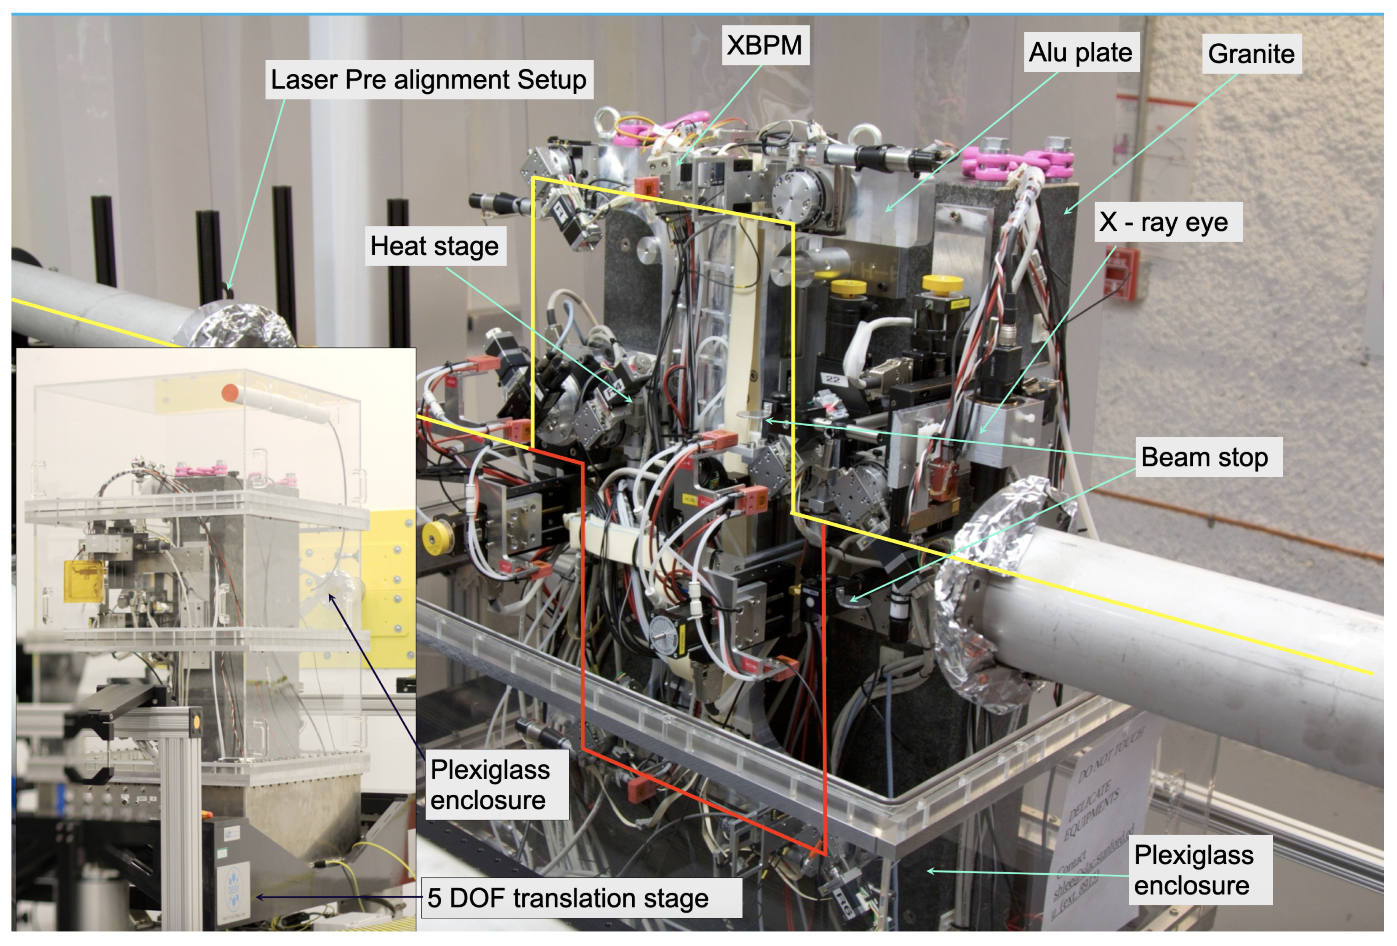
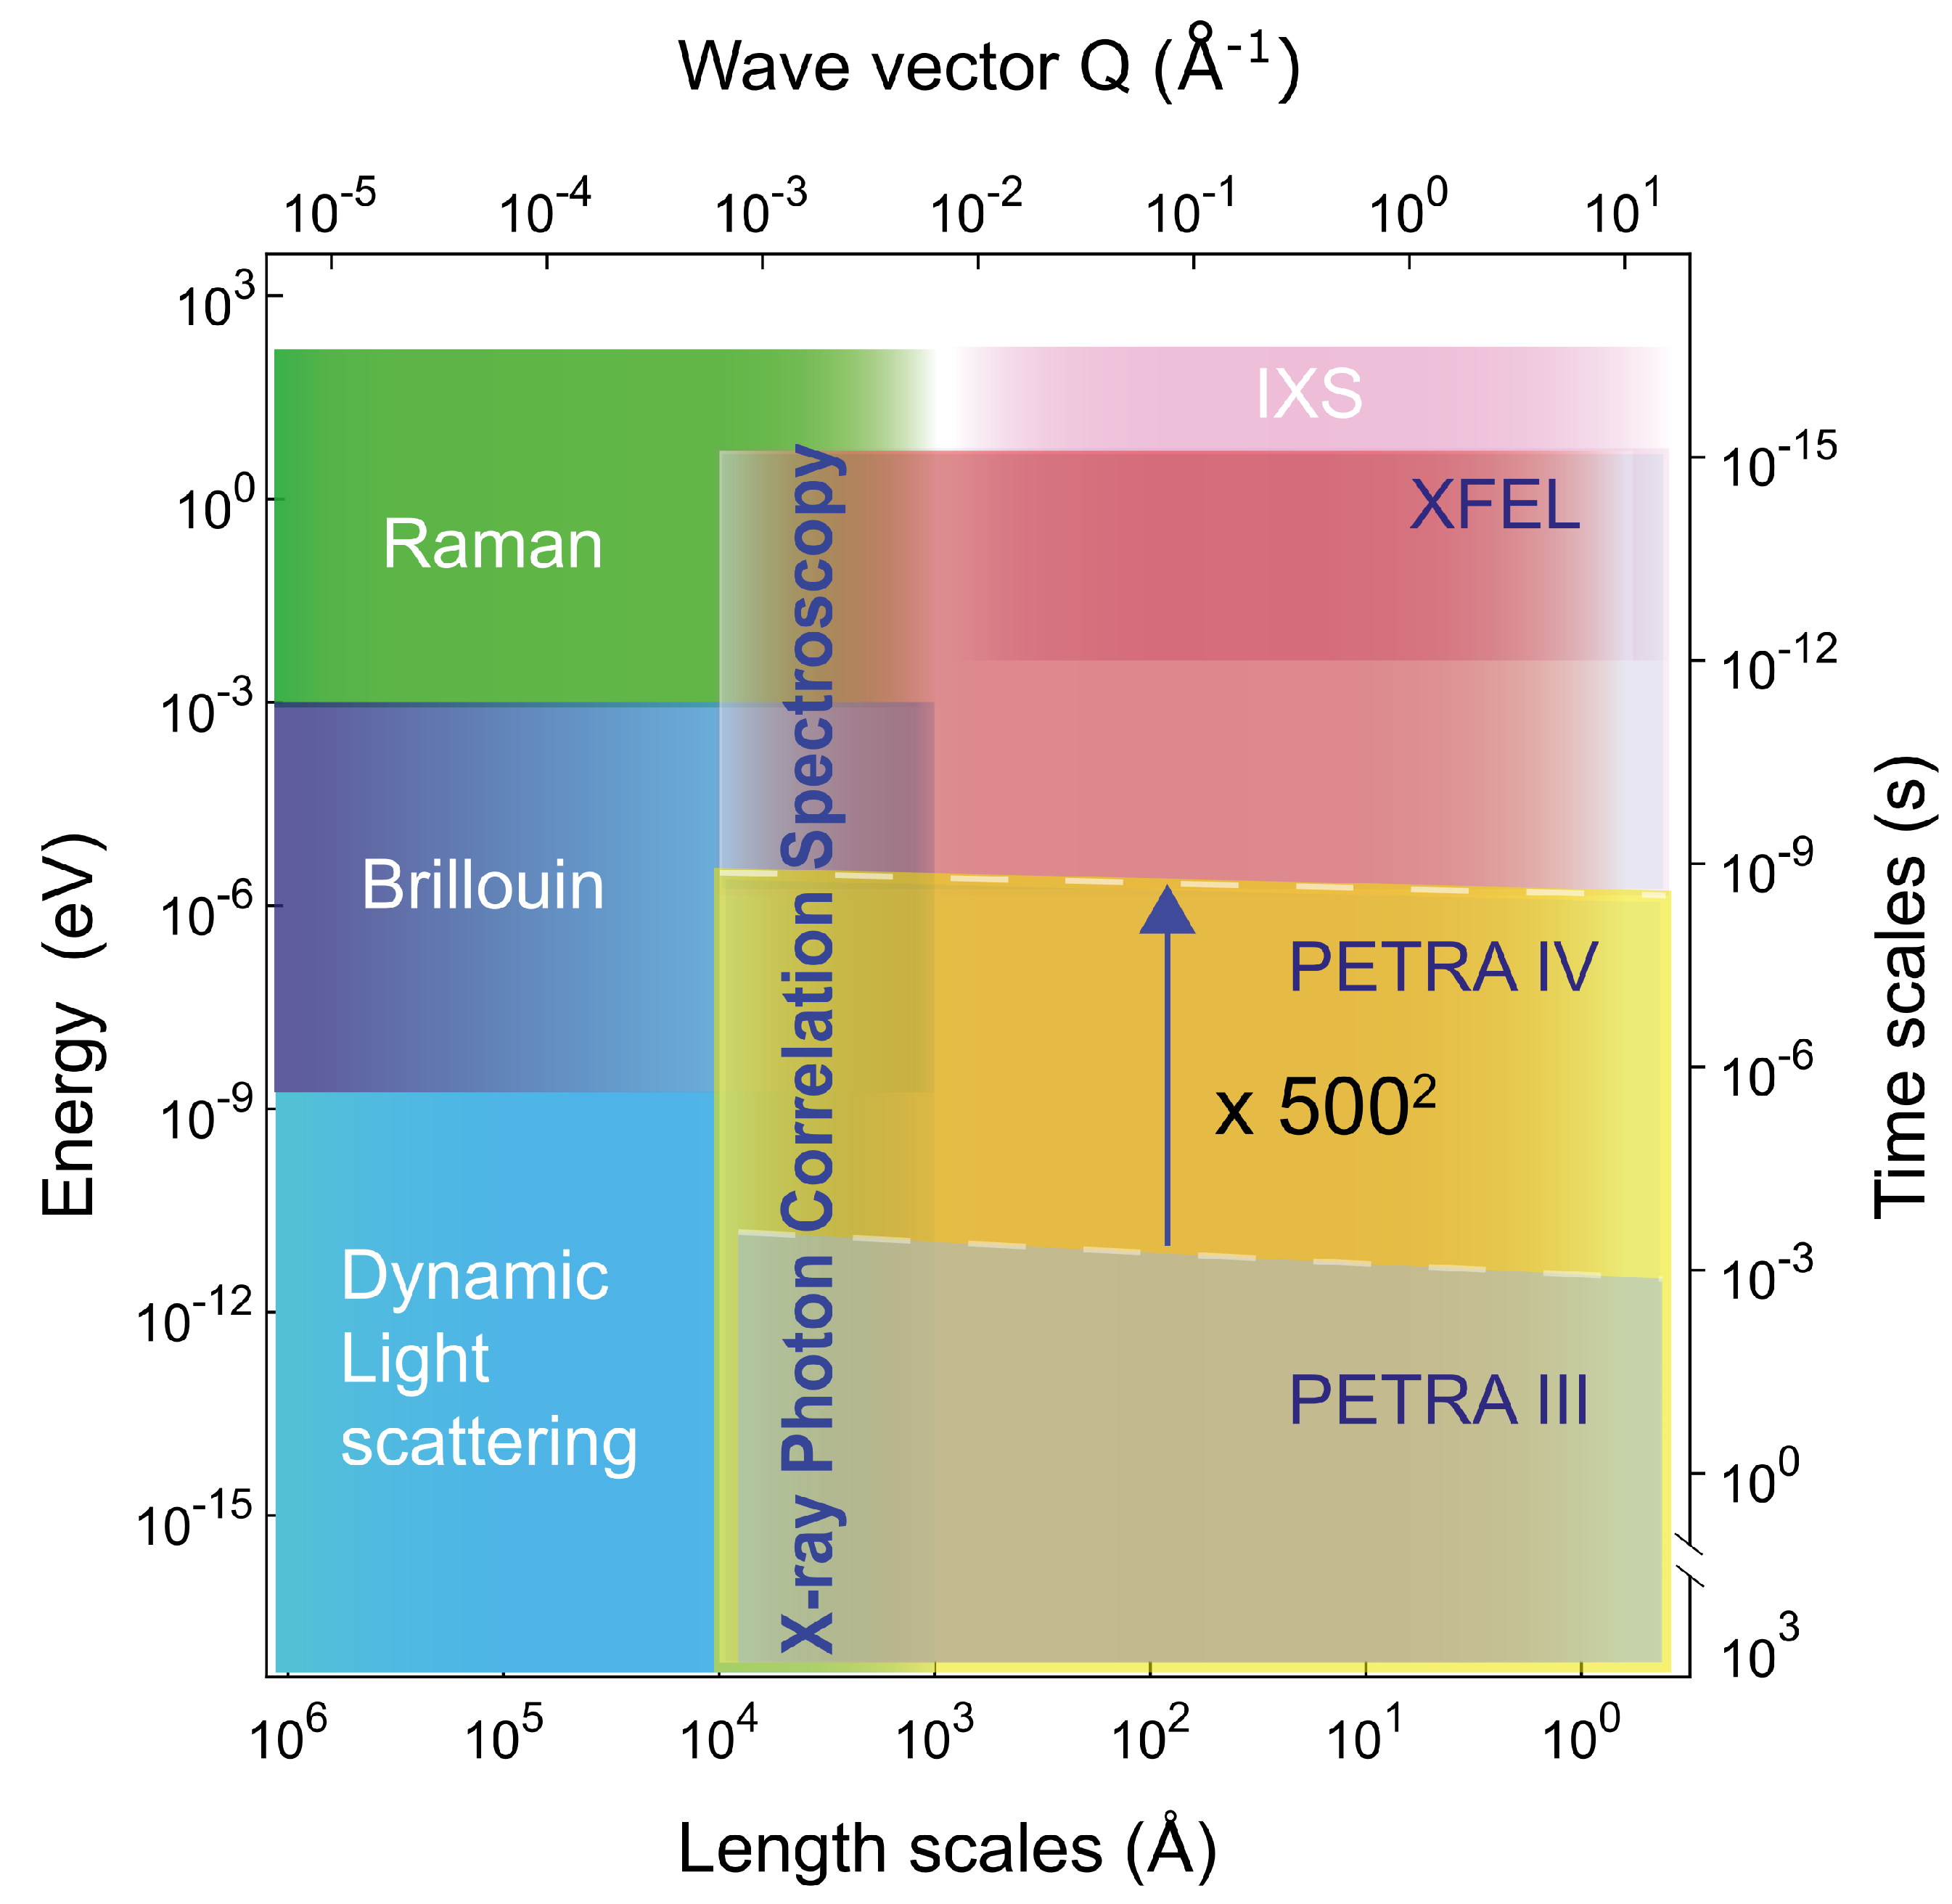
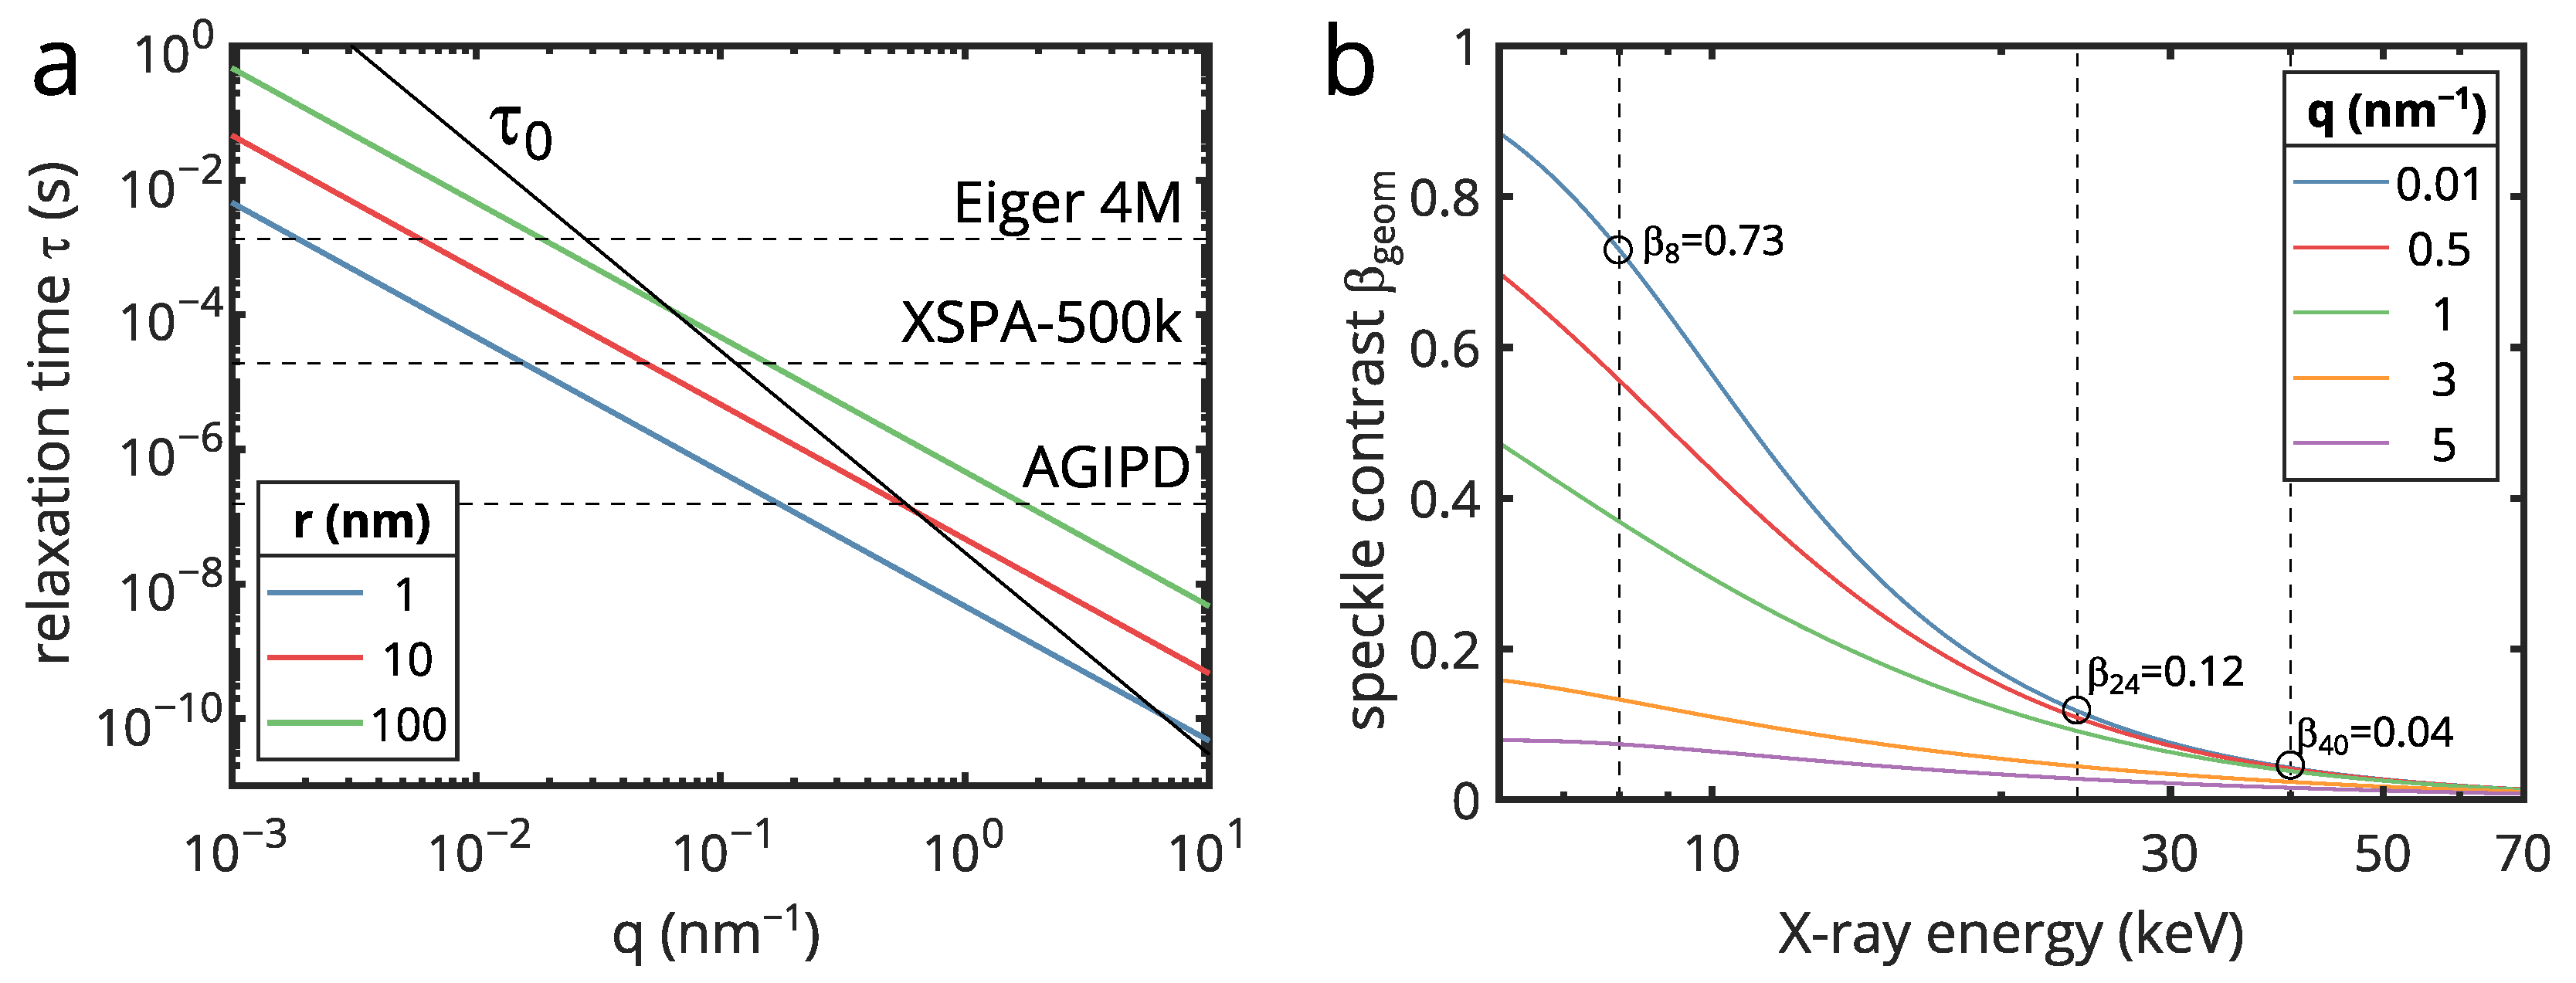
Table 1.
Detectors used for XPCS experiments. Here, p is the pixel size in one dimension, and f the maximum frame rate. Note that different versions may exist, e.g., the data for the dual MPCCD and a single module of ePix are given. Different frame rates are connected to different operation modes or detector versions. Notes: a Different versions with various sizes and frame rates available. b Continuous and burst-mode operation. c In burst modes with different number of frames. d Full-frame repetition rate. Faster times can be accessed with the event-driven read-out offering a time resolution of 1.56 ns per single event.
| Detector | Size (Pixels) | p (m) | f (kHz) | Beamlines | References |
|---|---|---|---|---|---|
| PI PIXIS | 1300 × 1340 | 20 | 0.001 | P10, XCS | |
| PILATUS 2M a | 1475 × 1679 | 172 | 0.01 / 0.1 | cSAXS (SLS) | [78] |
| Eiger 4M a | 2167 × 2070 | 75 | 0.75 | P10, CHX | [83,84] |
| Eiger 500k | 1030 × 514 | 75 | 9 / 22 | ID10, P10, ID02 | [83,84,85] |
| Lambda 750k a | 1536 × 512 | 55 | 1–23 | P10, 8-ID | [86] |
| Maxipix 2 × 2 a | 512 × 512 | 55 | 0.3 | ID10, P10 | [87,88] |
| XSPA-500k | 1024 × 512 | 76 | 56 / 1200 b | 8-ID | [81,89,90] |
| Keck-PAD | 512 × 512 | 150 | up to 10,000 c | [91] | |
| SPARTA | 128 × 512 | 200 | up to 6500 c | [92] | |
| Timepix3 | 256 × 256 | 55 | 2 d | [82] | |
| AGIPD 1M | 1024 × 1024 | 200 | 6500 | MID, SPB/SFX | [93] |
| ePix | 352 × 384 | 50 | 1 | XCS, XPP | [94] |
| MPCCD a | 1024 × 1024 | 50 | 0.06 | SACLA | [95] |
Publisher’s Note: MDPI stays neutral with regard to jurisdictional claims in published maps and institutional affiliations. |
© 2021 by the authors. Licensee MDPI, Basel, Switzerland. This article is an open access article distributed under the terms and conditions of the Creative Commons Attribution (CC BY) license (https://creativecommons.org/licenses/by/4.0/).
Share and Cite
MDPI and ACS Style
Lehmkühler, F.; Roseker, W.; Grübel, G. From Femtoseconds to Hours—Measuring Dynamics over 18 Orders of Magnitude with Coherent X-rays. Appl. Sci. 2021, 11, 6179. https://doi.org/10.3390/app11136179
AMA Style
Lehmkühler F, Roseker W, Grübel G. From Femtoseconds to Hours—Measuring Dynamics over 18 Orders of Magnitude with Coherent X-rays. Applied Sciences. 2021; 11(13):6179. https://doi.org/10.3390/app11136179
Chicago/Turabian StyleLehmkühler, Felix, Wojciech Roseker, and Gerhard Grübel. 2021. "From Femtoseconds to Hours—Measuring Dynamics over 18 Orders of Magnitude with Coherent X-rays" Applied Sciences 11, no. 13: 6179. https://doi.org/10.3390/app11136179
Note that from the first issue of 2016, this journal uses article numbers instead of page numbers. See further details here.