
Measurement of Circadian Effectiveness in Lighting for Office Applications
by
 , , , , and
Sebastian Babilon
1,2,* ,
,
Sebastian Beck
1 ,
,
Julian Kunkel
1,
Julian Klabes
1,
Paul Myland
1,
Simon Benkner
1 and
Tran Quoc Khanh
1 1
Laboratory of Lighting Technology, Technical University of Darmstadt, Hochschulstr. 4a, 64289 Darmstadt, Germany
2
Light and Health Research Center, Department of Population Health Science and Policy, Icahn School of Medicine at Mount Sinai, One Gustave L. Levy Place, New York, NY 10029, USA
*
Author to whom correspondence should be addressed.
Appl. Sci. 2021, 11(15), 6936; https://doi.org/10.3390/app11156936
Submission received: 7 July 2021
/
Revised: 23 July 2021
/
Accepted: 23 July 2021
/
Published: 28 July 2021
(This article belongs to the Special Issue Advances in Human-Centric Lighting)
Abstract
:Featured Application
In-field spatially resolved light measurements for the characterization of non-visual effects and proper prediction of the circadian effectiveness for human-centric lighting design.
Abstract
As one factor among others, circadian effectiveness depends on the spatial light distribution of the prevalent lighting conditions. In a typical office context focusing on computer work, the light that is experienced by the office workers is usually composed of a direct component emitted by the room luminaires and the computer monitors as well as by an indirect component reflected from the walls, surfaces, and ceiling. Due to this multi-directional light pattern, spatially resolved light measurements are required for an adequate prediction of non-visual light-induced effects. In this work, we therefore propose a novel methodological framework for spatially resolved light measurements that allows for an estimate of the circadian effectiveness of a lighting situation for variable field of view (FOV) definitions. Results of exemplary in-field office light measurements are reported and compared to those obtained from standard spectral radiometry to validate the accuracy of the proposed approach. The corresponding relative error is found to be of the order of 3–6%, which denotes an acceptable range for most practical applications. In addition, the impact of different FOVs as well as non-zero measurement angles will be investigated.
1. Introduction
Circadian effectiveness is often used as a synonym for the potency of light to provoke positive, non-visual outcomes in humans. Here, the term ’non-visual’ collectively encompasses circadian [1,2], neuroendocrine [3,4], and neurobehavioral [5,6,7] responses mediated by signals from the retinal photoreceptors, i.e., from circuits of rods, cones, and intrinsically photosensitive retinal ganglion cells (ipRGCs). In recent years, lighting practitioners and engineers have particularly shown an increased interest in these kinds of light-induced, non-visual effects. One of the goals they pursue is to develop indoor lighting solutions that dynamically adapt to the physiological and biological needs of the occupants in support of positive human outcomes, such as a better sleep, health, and well-being [8], while still acknowledging the traditional, vision-related aspects of lighting quality [9]. This approach, also known as integrative or human-centric lighting (HCL) [10,11,12], implies the use of light for the benefit of people by taking into account the full range of its visual and non-visual effects.
When designing lighting solutions for the built environment, practitioners usually have to deal with lighting parameters that can be assigned to either of the following four categories [11,13]: (i) Light intensity, which represents the amount of light received by the occupants; (ii) Light spectrum, which determines the color quality, perceived chromaticity, and correlated color temperature (CCT) of an illumination; (iii) Temporal pattern, which includes the timing and duration of the light exposure; and (iv) Spatial light distribution, which is basically understood as the luminance pattern constituting the occupants’ field of view.
While at least a basic consensus among researchers and practitioners has been achieved regarding the impact of the first three categories on the human organism culminating in a number of acknowledged recommendations and standards for good lighting practice, see, e.g., Refs. [14,15,16,17,18,19,20,21], the literature on how nonuniform light distributions affect non-visual outcome measures is rather sparse and shows some inconsistencies between published studies. While Visser et al. [22] and Rüger et al. [23] both found that the circadian response in terms of nocturnal melatonin suppression is maximal when the nasal part of the retina is illuminated, Lasko et al. [24] and Glickman et al. [25] reported that a light exposure of the lower part of the retina (≙light from the upper visual field) is more effective in suppressing melatonin in humans compared to an exposure of the upper part of the retina (≙light from the lower visual field). In an earlier study conducted by Gaddy et al. [26], it was found that applying a 90 light pulse to only the inferior retina yielded a smaller melatonin suppression response than an on-axis full-field illumination of equal corneal illuminance. On the contrary, Smith et al. [27], who examined nocturnal melatonin suppression in older adults (>60 years) after 2 of light exposure to 1000 , reported no significant differences for an upper versus middle visual field stimulation. In a recently published study, Rea et al. [28] systematically investigated the relative light sensitivities of the four retinal hemi-fields (i.e., nasal, temporal, superior, and inferior) in terms of suppressing nocturnal melatonin secretion after 1 of corresponding blue light exposure (, 100 at the cornea, monocular vision). In accordance with the conclusions drawn by Visser et al. [22] and Rüger et al. [23], they found that the nasal part of the human retina produced an approximately 15% greater response to circadian-effective light exposure than any of the other three retinal hemi-fields, where basically no significant differences occurred between temporal, superior, and inferior stimulation. In addition, Rea et al. showed that the level of nocturnal melatonin suppression caused by a homogeneous full-field illumination of the same 100 photopic lux at the cornea was not significantly different from what would be expected when averaging over the four hemi-fields. Finally, Knoop et al. [29,30] based on theoretical considerations showed that, by assuming a nonuniform distribution of the retinal photoreceptors contributing to non-visual effects, lighting conditions of equal vertical illuminance and equal melanopic irradiance at the cornea may still cause very different integrated receptor signals that eventually result in distinct non-visual outcomes.
Even though the literature provides clear evidence that information on the spatial light distribution is crucial for a proper prediction and comprehensive modeling of non-visual light-induced effects, it is still unknown how light contributions from different directions and with different incident angles should be weighted to come up with a reliable overall estimate of the circadian effectiveness in practical lighting applications. Despite this lack of knowledge, it seems expedient, though, to think about how to perform spatially resolved light measurements that may account for this kind of information. As a first step, the purpose of the present work therefore is to provide a novel methodological framework for in-field light measurements that allows for an estimate of the circadian effectiveness of a lighting situation for variable viewing angles and different field of view definitions. At a later stage, i.e., once the ongoing research on how to specifically weight light contributions from different directions has made significant progress, the proposed framework can easily be extended and adapted accordingly to comply with the latest findings.
2. Materials and Methods
The following sections are intended to give an overview of the proposed methodology and discuss the in-field light measurements performed in the office context to be used for its validation. For this purpose, Section 2.1 introduces the circadian stimulus (CS) metric as a physiologically relevant measure of circadian effectiveness in lighting and provides a dedicated approximation formalism to be applied for its estimation in the lit environment using a spatially-resolved imaging photometer. Section 2.2 describes the lighting scenarios used to validate the proposed measurement framework and provides further details on the measurement devices and experimental setup. The corresponding evaluation scheme for a spatially resolved estimation of CS for different viewing angles and field of view definitions is summarized in Section 2.3. A report on the validation results and a general discussion with regard to future improvements eventually follow in Section 3 and Section 4, respectively.
2.1. Circadian Stimulus
Much of the evidence on how light affects the human circadian system relates to studies dealing with nocturnal melatonin suppression and phase resetting [22,28,31,32,33,34,35,36,37,38,39,40,41,42,43,44,45,46,47,48,49,50,51,52,53,54,55,56,57,58,59,60,61,62,63,64,65]. In two seminal studies, Brainard et al. [40] and Thapan et al. [41] exposed pupil-dilated human subjects to different monochromatic stimuli in the late evening hours and measured their resulting melatonin levels after 90 (Brainard et al.) and 30 (Thapan et al.) of light exposure using blood samples. Depending on the light intensity, melatonin suppression rates of up to about 70% could be observed. Using probe stimuli with corresponding peak wavelengths within the range from 420 to 600 (Brainard et al.) and from 424 to 548 (Thapan et al.), they consistently found that short-wavelength blue light shows a larger efficiency in suppressing nocturnal melatonin than long-wavelength red light. By pooling the reported results of both studies, Rea et al. [66,67,68] were able to develop a semi-empirical model of the spectral sensitivity of the human circadian system with a maximum peaking at about 460 and an approximately 110 wide absorption band at half-maximum sensitivity, which explicitly considers the physiology and neural mechanisms of circadian phototransduction [69,70]. Applying a constant half-saturation criterion methodology, Rea et al. determined for each test wavelength the relative amount of energy required to obtain 35% nocturnal melatonin suppression. For this purpose, they first converted the corresponding photon density rates at half-saturation extracted from both studies to the reciprocals of their respective corneal irradiance equivalents. Subsequent normalization to the maximum value (≙least amount of energy to reach half-saturation) yielded the final sample of data points used for model fitting. Based on the resulting spectral sensitivity approximation, Rea et al. eventually introduced a new measure of circadian light which basically gives the flux per unit area spectrally weighted by the sensitivity of the circadian system as derived from the nocturnal melatonin suppression experiments. The corresponding mathematical model reads
where
represents the above threshold cone responses to light as a spectral opponent blue versus yellow (b–y) mechanism, which is additionally controlled by rod bleaching modeled as
Here, is the spectral sensitivity of melanopsin [71] corrected for crystalline lens transmittance [72,73], is the corneal spectral irradiance of the light source measured vertically at eye level, is the S-cone fundamental as defined by Smith and Pokorny [74], is the macular pigment transmittance [75], is the photopic luminous efficiency function [76] determined by the sum of L- and M-cone responses, and is the scotopic luminous function [76].
Note that all known photoreceptors contribute to Equation (1). For , i.e., when the output of the b–y mechanism signals ’yellow’ because of the spectral nature of the perceived light source or generates no response in case of a unique green stimulus of 507 , the spectral sensitivity of the circadian system is determined by the melanopsin-containing ipRGCs only. If, on the other hand, the b–y mechanism signals ’blue’, i.e., when , the respective output from the cone network, which, from Equation (2), is given by the difference between macular-corrected S-cone responses and the likewise macular-corrected function (≙the sum of L- and M-cone responses), adds to the output of the ipRGCs. This overall circadian response is further modified by a rod-dominated shunting inhibition of the dendrites of the depolarizing ipRGCs that is mediated through aII amacrine cells and expressed by Equation (3).
To obtain a reliable estimate for the circadian effectiveness of an arbitrary light source, Rea and Figueiro [68] defined the circadian stimulus (CS) metric, which gives the functional relationship between the light source’s model-weighted irradiance of Equation (1) and its theoretically provoked melatonin suppression in percent with regard to a 1 light exposure. The corresponding equation reads
As further shown by Truong et al. [77], the CS value of white light sources can be approximated with sufficient accuracy from measurements of the photopic illuminance in lux and the colorimetric 2 chromaticity coordinate z by using
The approximation of Equation (5) is valid for white light sources in the range from 10 to 10,000 lx, with both z and being captured vertically at eye level using standard measurement equipment. This, in particular, facilitates field measurements as the determination of CS according to Rea et al.’s model definition of Equations (1)–(4) requires either an expensive spectroradiometer or at least a very specific measurement device, a so-called Daisymeter [78,79], both of which must be considered as non-standard equipment in lighting practice. Compared to the original CS calculation, Truong et al.’s approximation showed a maximal prediction error of less than 0.058, as validated on a large database of measured absolute light spectra () of various white light sources including LED lamps and luminaires, conventional incandescent and fluorescent emitters, and daylight (mixed-)illumination conditions.
Even though the CS metric has successfully been applied in various laboratory and field studies to quantify lighting interventions and to explore the correlations between the lighting conditions and different choices of physiologically and clinically relevant outcome measures [80,81,82,83,84,85], it must be stated that the underlying model still shows some fundamental limitations that, for the sake of completeness, should not remain unmentioned here.
First of all, the model framework proposed by Rea et al. pools two different sets of nocturnal melatonin suppression data collected under distinct experimental conditions without explicitly accounting and correcting for potential idiosyncrasies that can be expected due to the different timing, duration, and intensities of light exposure used by the respective study protocols and, thus, are likely to have a non-negligible impact on the model fit. Second, the resulting circadian light definition and with it the CS metric both show a discontinuity at . Despite the evidence provided from literature that the discontinuity approximates the experimentally observed spectral opponency effect that requires a subadditive component to be an essential feature of the corresponding spectral sensitivity function [45,46,56], it appears to be physiologically and biologically implausible that a minimal change in the lighting conditions may cause such a massive difference in the output. Third, the impact of pupil area is not considered by the CS definition. A systematic investigation of circadian phototransduction for different pupil sizes—independent of the luminous stimulus—would therefore be required to achieve a more comprehensive and adequate modeling [70]. Fourth, the current model is not capable of predicting effects of temporal dynamics, for example caused by intermittent light exposures (c.f., [86,87]) or, more generally speaking, by dynamically changing lighting conditions. Fifth, the CS metric is solely based on melatonin suppression data collected during the nighttime hours. Even though it is constraint by the neuroanatomy, neurophysiology, and operating characteristics of the human circadian system [68] and, thus, capable of describing certain light-induced effects reasonably well, it does not address the wide range of potential biological responses that could be measured as a result of suitable light exposure (e.g., phase shifting, core body temperature, alertness, etc.) [69]. Finally, preliminary evidence from literature suggests that the short-term history of light exposure affects the sensitivity of the circadian system to light [43,88,89], an important feature which so far is not covered by the CS metric definition.
Despite this relatively long list of limitations, which certainly emphasizes the need for significant model improvements, the CS metric still provides the most accurate and complete available model of the spectral sensitivity of the human circadian system, with its physiological relevance having been validated in many field studies [81,84,90,91,92,93,94,95,96]. This previous research basically emphasizes the suitability and biological meaningfulness of the CS metric to be used in the present work for assessing the circadian effectiveness of the indoor lighting conditions in the office context, where the following thresholds can be established from literature [81,83,84,90,92,93,94,96,97]: For , representing a large circadian stimulus, positive effects on the office workers’ sleep quality, mood, and stress perception are expected; for moderate stimuli with there are likely neither positive nor severe negative effects to be reported; for , an insufficient circadian stimulation must be concluded, which may lead to progressive circadian disruptions and severe negative effects on the office workers’ well-being, sleep quality, and after-work recovery abilities.
2.2. Light Measurements
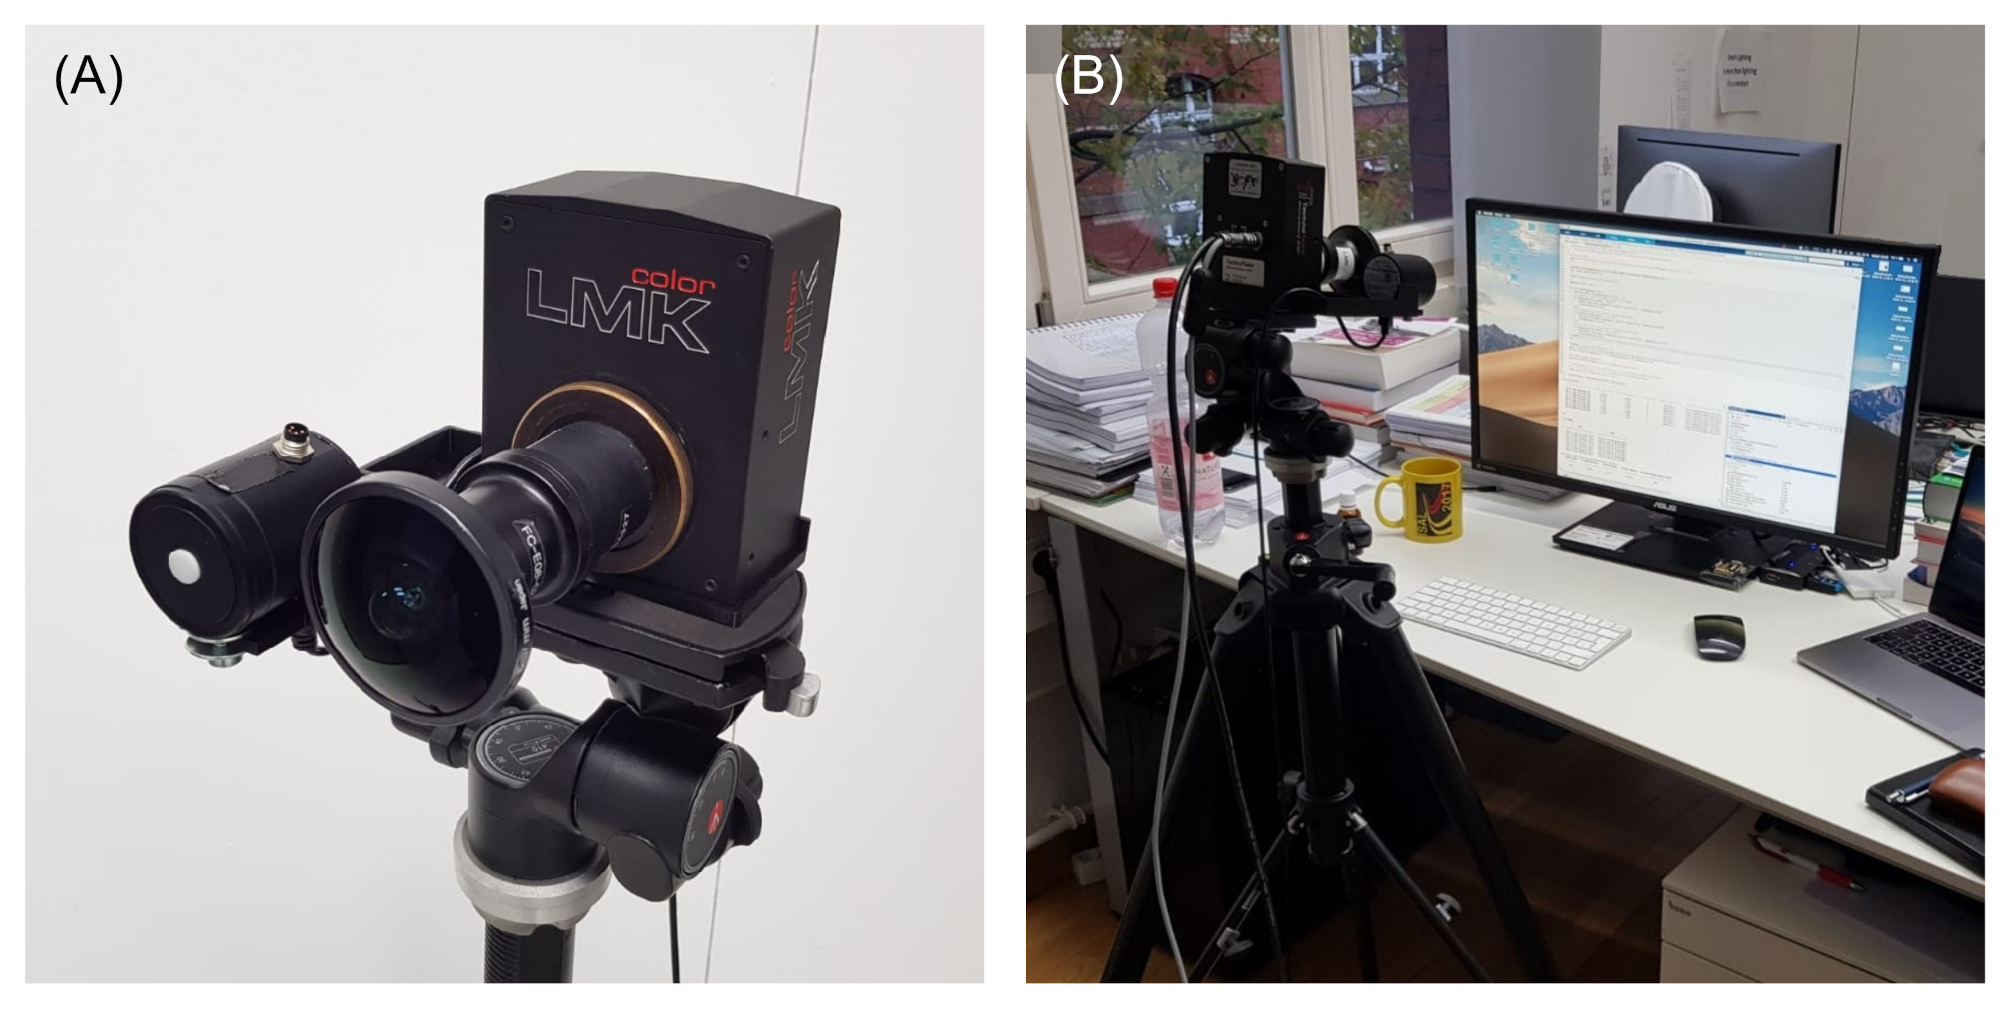
To evaluate the circadian effectiveness of typical workplace lighting conditions, suitable light measurements are required. In this work, a spatially resolving luminance imaging photometer LMK-5 color (TechnoTeam Bildverarbeitung GmbH, Ilmenau, Germany) was used to measure the luminance distribution in the visual field of office workers while doing typical computer work. Besides providing spatially resolved luminance data, the imaging photometer system is also capable of acquiring corresponding color information. A combination of built-in filters intended to approximate the CIE 2 color matching functions [98] allows for a pixelwise estimation of the tristimulus values of the image content, or more precisely of the light-reflecting objects in the visual field. These colorimetric data in conjunction with the vertical illuminance per pixel calculated from the respective luminance matrix can be used to obtain an estimate for the CS values experienced by the office workers based on Truong et al.’s approximation method (see also Section 2.3). As can be seen from Figure 1A,B, the imaging photometer is equipped with a fisheye lens enabling to capture the complete half space to assess the non-image-forming (NIF) effects of the illumination of the workplace (incl. self-luminous displays) and its surroundings. For evaluation purposes, an additional spectral radiometer sensor CSS-45 (Gigahertz Optik GmbH, Türkenfeld, Germany) is mounted next to the imaging photometer on a standard camera tripod and is used to measure the spectral irradiance integrated over the complete half space with a proper cosine correction. These measurements are eventually used to calculate CS according to Rea et al.’s original model formalism and allow for a direct comparison between model predictions and approximation results.
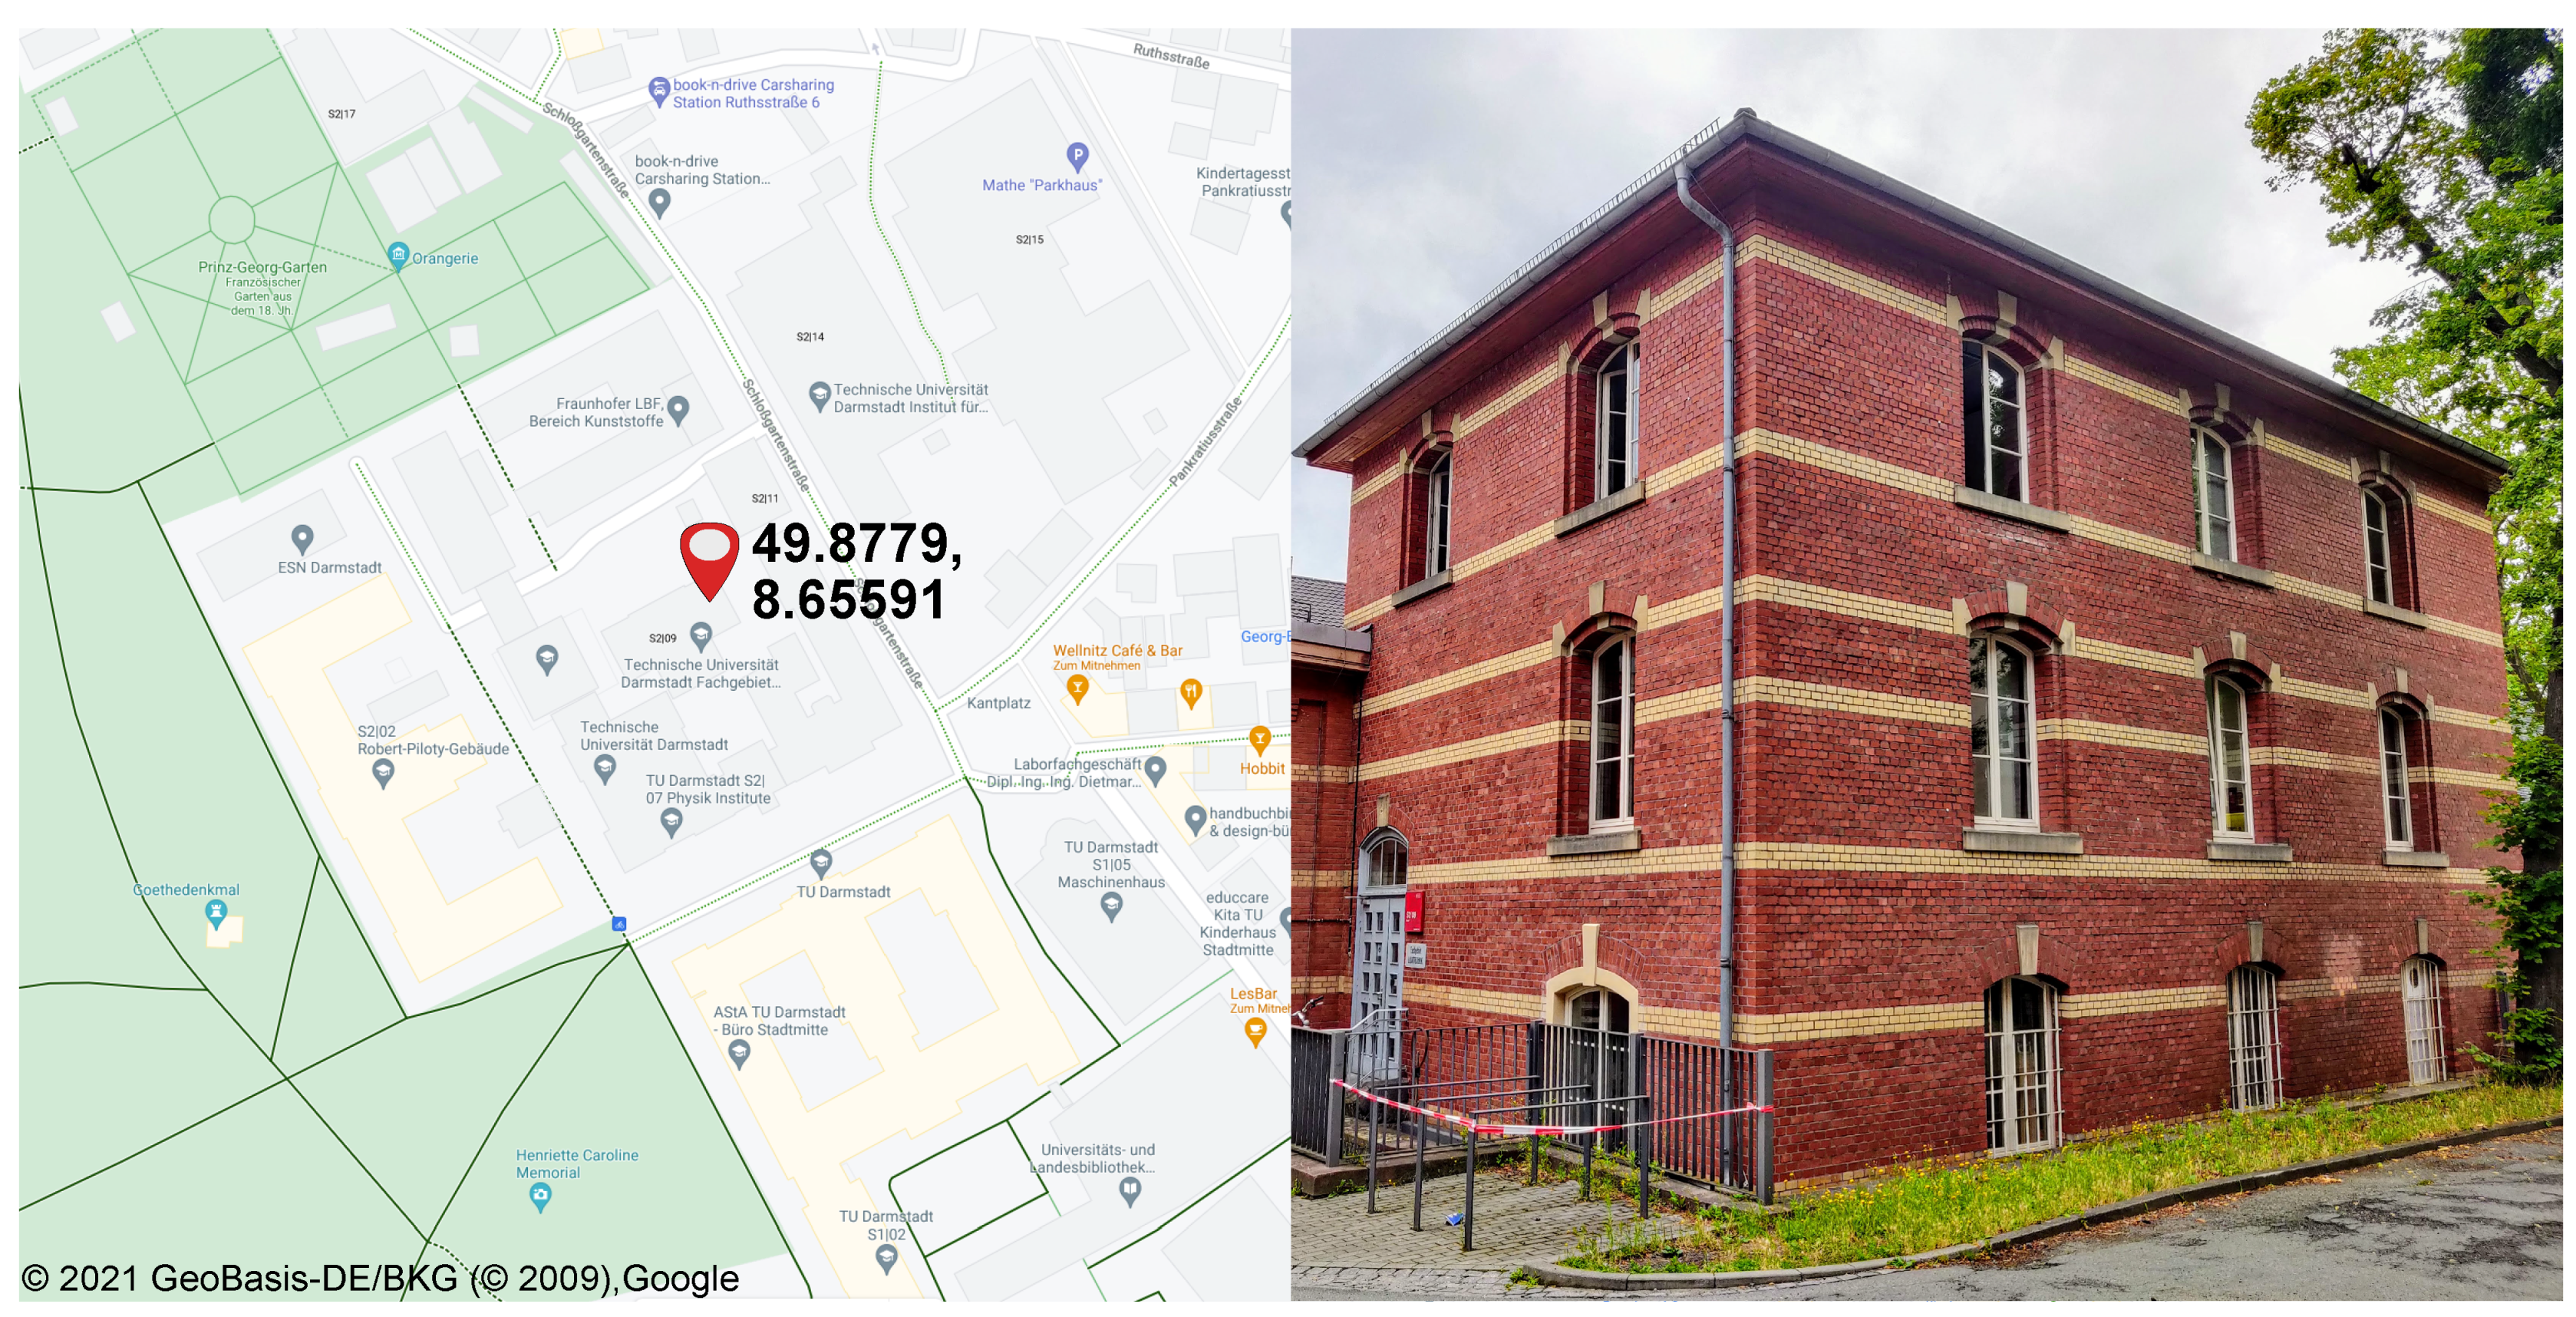
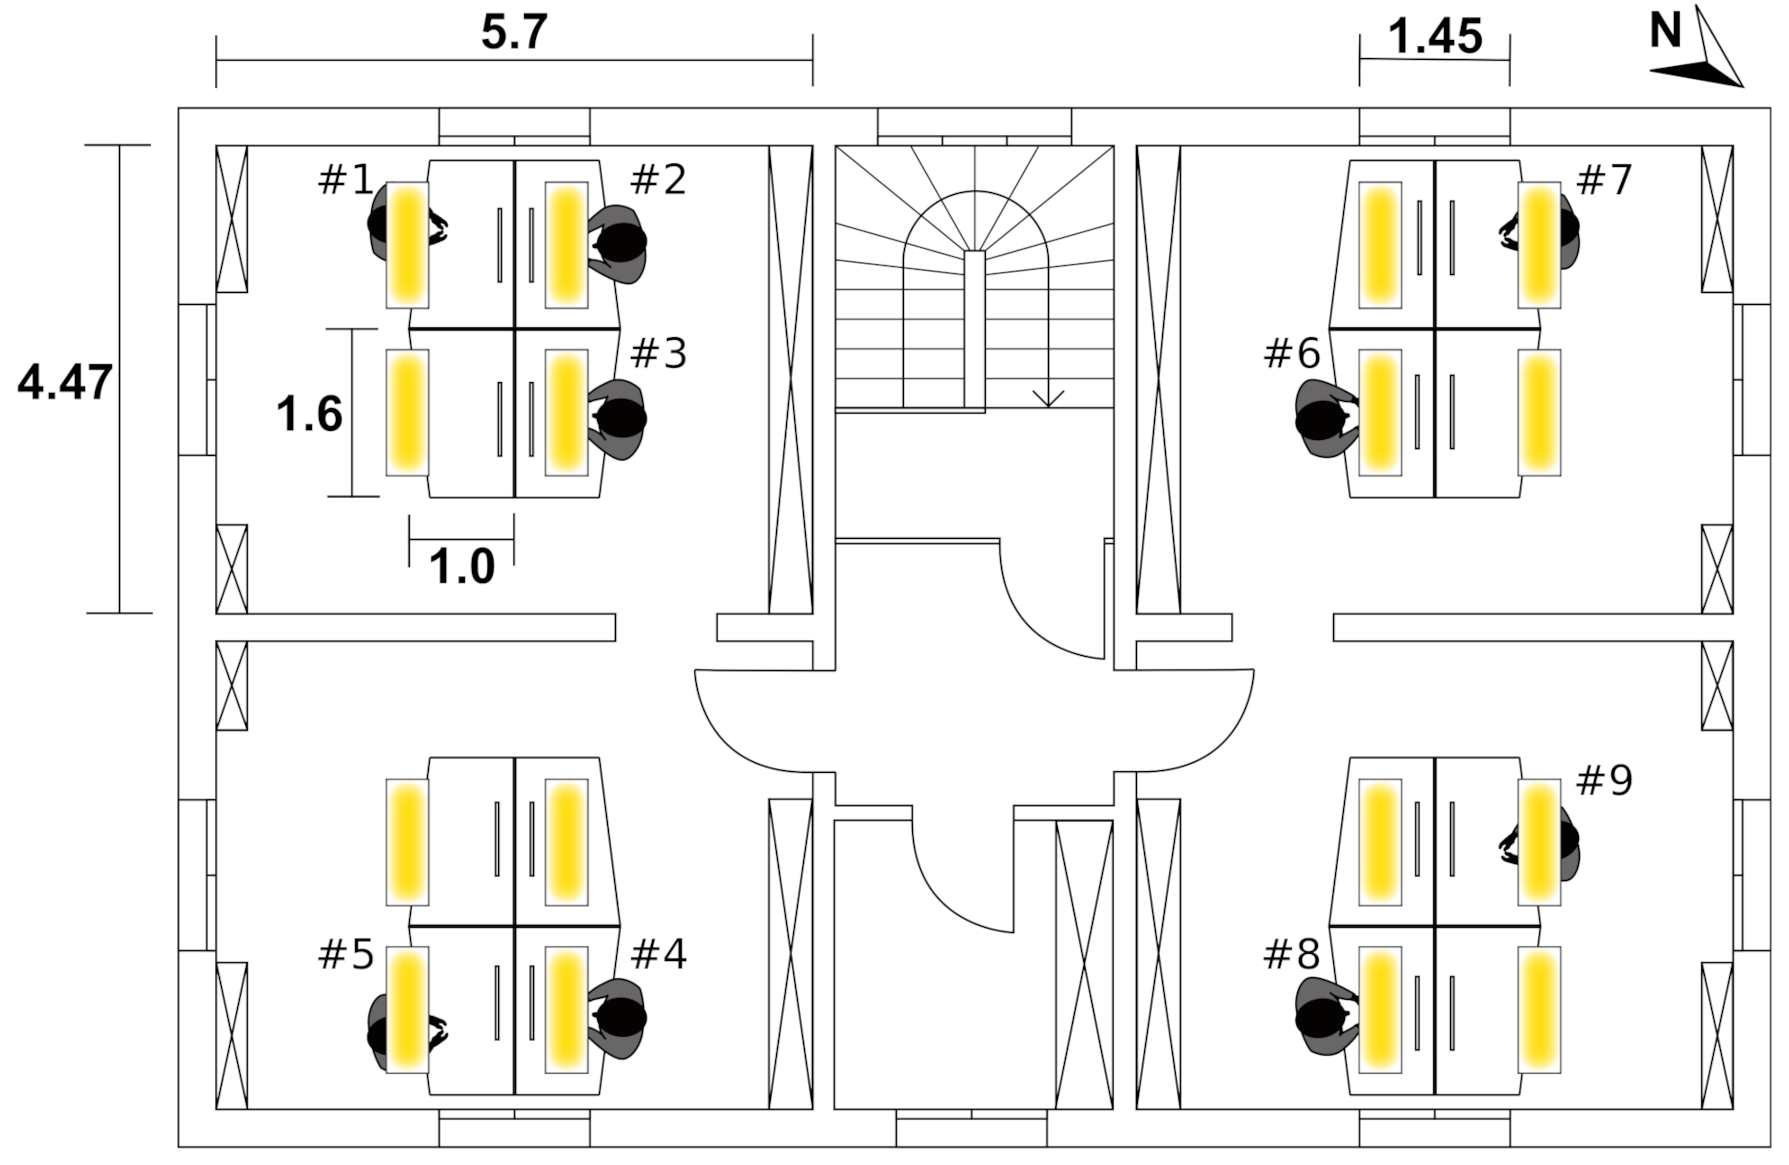
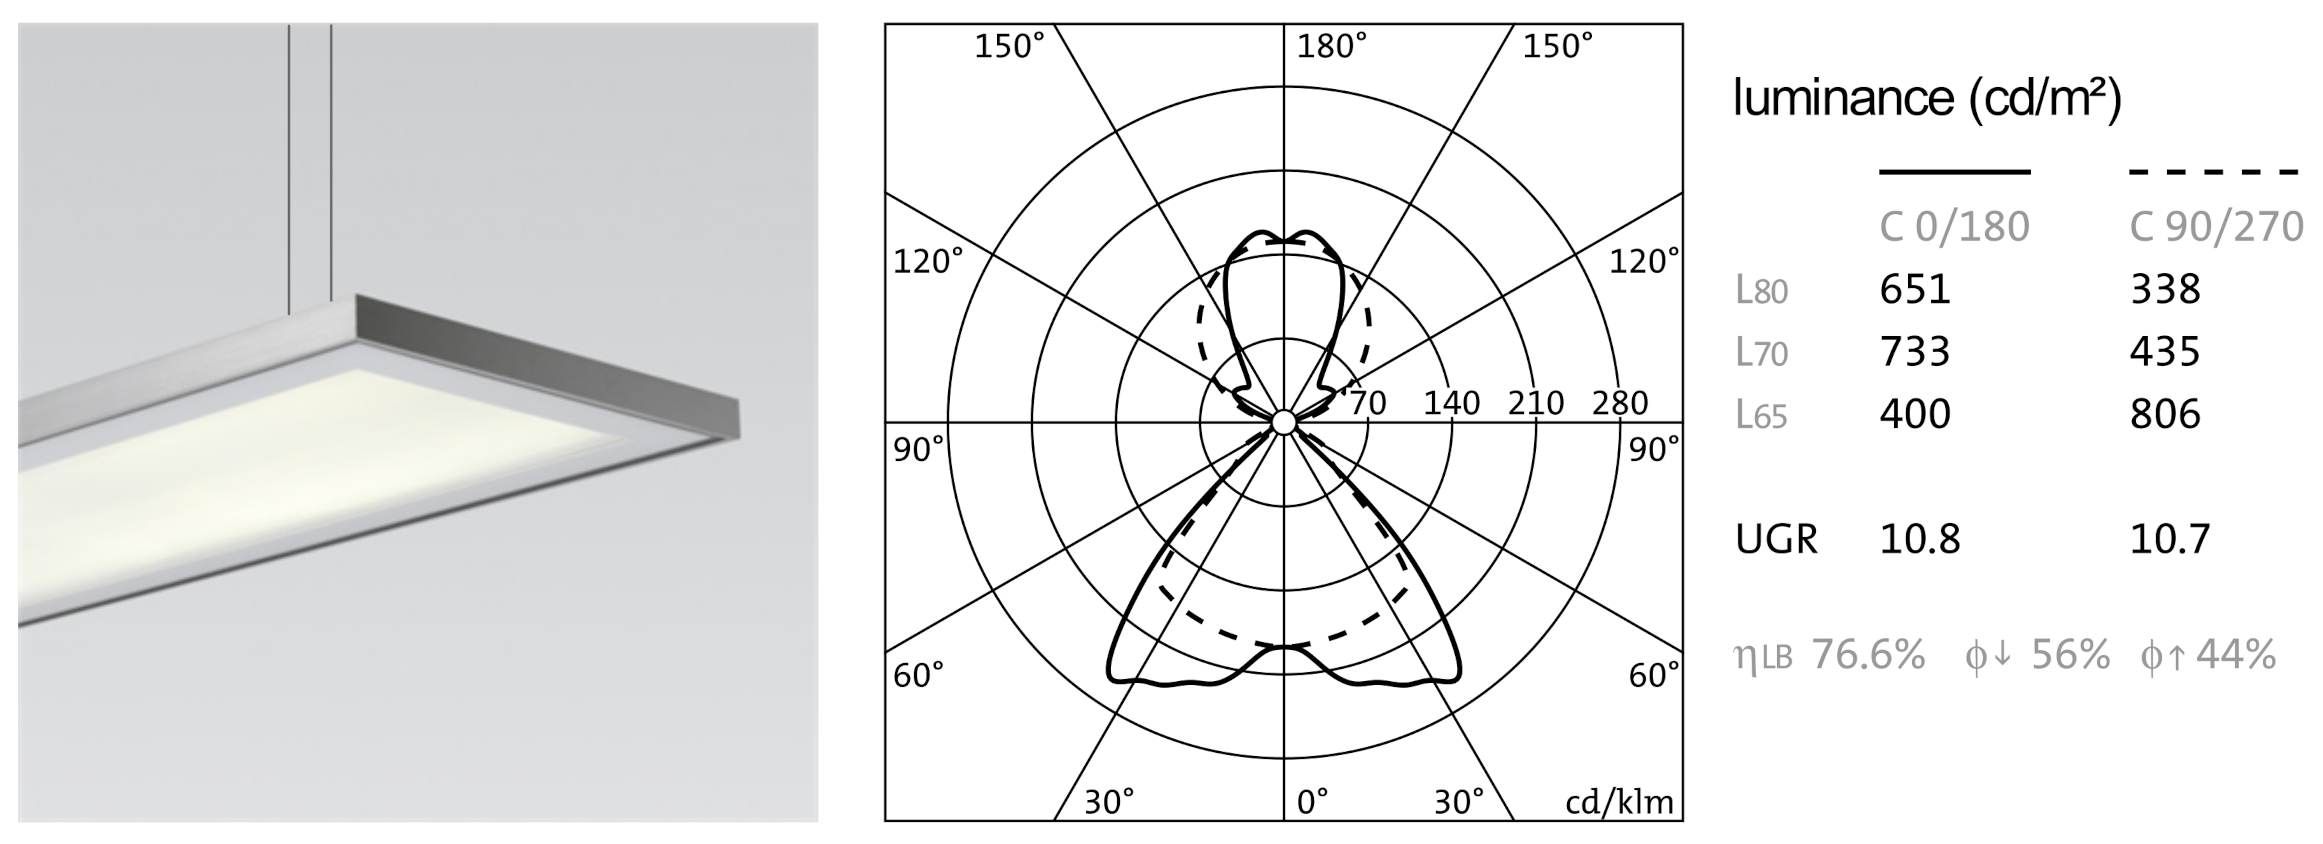
In total, nine different office workplaces at the Laboratory of Lighting Technology at the Technical University of Darmstadt, Germany have been selected for this study to serve as generic examples of typical office environments. Corresponding light measurements are performed with regard to the circadian effectiveness of the prevalent lighting conditions including daylight entry through windows. The workplaces are all located on the 2nd floor of the institute’s building shown in Figure 2 and are distributed over four different medium-sized, white-painted office rooms with an approximately layout and a height of . As illustrated in Figure 3, each room comprises two window areas for natural daylight entry. In each case, the artificial room illumination is realized by four Quadrature 5MQ238D2H pendant office luminaires (SITECO GmbH, Traunreut, Germany) suspended from the ceiling at a height of . Each luminaire offers a direct-indirect light emission characteristic, see Figure 4, provided by two LT T5 54W/958 NARVA BIO vital 5800 fluorescent tubes (NARVA Lichtquellen GmbH & Co. KG, Brand-Erbisdorf, Germany), one for the up- and the other for the downlight component, which are mounted to a slim linear housing with micro-prismatic optics to ensure a homogeneous, glare-free room illumination. Each workplace is equipped with a laptop that is connected to a 24-inch computer monitor. As can be seen from Figure 1B, the monitor is centrally aligned to the office desk, whereas the laptop is accordingly placed on either its left- or right-hand side depending on the preference of the user. Additional objects available in the visual field, such as textbooks, coffee pots, keyboards, etc., as well as the image content displayed on the computer monitor are also user-dependent and not controlled by the experimenters in order to obtain a more realistic cross-sectional representation of the actual working conditions.
To perform the corresponding light measurements, the luminance imaging photometer is positioned in such a way that the image acquisition concurs with the typical viewing range of an average sized person sitting at the office desk and being engaged in display/computer work. Thus, as can be seen from Figure 1B, the tripod with the measurement devices is placed centrally in front of the office desk and adjusted to a height of 120 , which, according to DIN EN 12464-1 [99], corresponds to the average viewing height of a seated person. The lens aperture of the imaging photometer and the light diffuser of the radiometric sensor are aligned to the front edge of the office desk, both pointing perpendicularly towards the plane of the workplace’s computer monitor so that the corresponding tilt angle of the tripod initially equals zero. In a second step, the impact of a non-zero tilt angle on the reported measurement results will be explored and compared to those obtained for the initial setting (see Section 3). In all cases, the average ± standard deviation (SD) distance between the measurement devices and the respective computer monitor is 75 ± 2 .
2.3. Measurement Analysis
As discussed in the previous section, the measurement setup used in this work permits the spatially resolved estimation of CS as a measure for the circadian effectiveness of the lighting conditions encountered for a sample of typical office workplaces. For this purpose, the luminance matrix obtained as output from the imaging photometer must first be converted into a illuminance matrix , where corresponds to the pixel resolution of the measurement device, which, in the present case of the LMK-5 color, is effective pixels. For an arbitrary pixel position (), where and , the partial illuminance can be calculated using
where the matrix summarizes the solid angles associated with each of the different pixel locations, while the matrix gives the angles between an arbitrary pixel position and the imaging photometer’s center of view. Note that both matrices are fixed characteristics of the used camera lens system to be determined by calibration and, basically, do not change across measurements.
By summing over all pixel values, an estimate of the vertical illuminance at the position of the imaging photometer can thus be determined and is given by
The average tristimulus values , , and are obtained in a similar manner by summing over all measured pixel values , , and , respectively, and dividing each of these sums by the total number of pixels:
The chromaticity coordinate required for estimating the circadian stimulus from the image capture is then obtained from
Inserting Equations (7) and (9) into Equation (5) eventually yields
as an estimate for the circadian effectiveness of the captured lighting conditions as experienced by an office worker, obtained by applying Truong et al.’s approximation method to the measurement output of the imaging photometer.
In addition to the spatially resolved image capture of the luminance photometer, the measurement setup discussed in Section 2.2 also allows for a direct calculation of CS using the original model formalism of Equations (1)–(4) and the spectral irradiance obtained from the CSS-45 measurements. The model predictions can thus be compared to the approximation results by calculating the corresponding error estimate defined by
where the superscript circle next to symbolizes that the respective pixel summations of Equations (7) and (8), like the CSS-45 measurements, should cover the complete half space. Similarly, the relative deviation between the measured illuminances can be calculated using
where
gives the illuminance as derived from the CSS-45 measurements. The goal is to show that both ways of measuring and estimating CS essentially yield the same result.
An advantage of working with the spatially resolved luminance data rather than using integrative measures of fixed half-space geometry is that the former, in contrast to the latter, basically allows for selecting relevant light directions and weighting them accordingly to account for the nonuniform distribution of the different types of retinal receptors contributing to NIF effects. As discussed in the Introduction of this paper, evidence from literature on light-induced melatonin suppression and circadian phase shifting suggests that the circadian effectiveness of a light stimulus depends on its spatial distribution. However, studies that systematically investigated such NIF effects as a function of the direction of light exposure are still sparse and even show some inconsistencies between their reported conclusions. This largely explains the fact that, up to the present day, there are no standardized guidelines or recommendations on how to properly weight lighting contributions from different directions of the half-space with regard to their relevance for stimulating the circadian system, in particular since the relevance of specific retinal regions and their respective sensitivity weighting have not been fully elucidated yet.
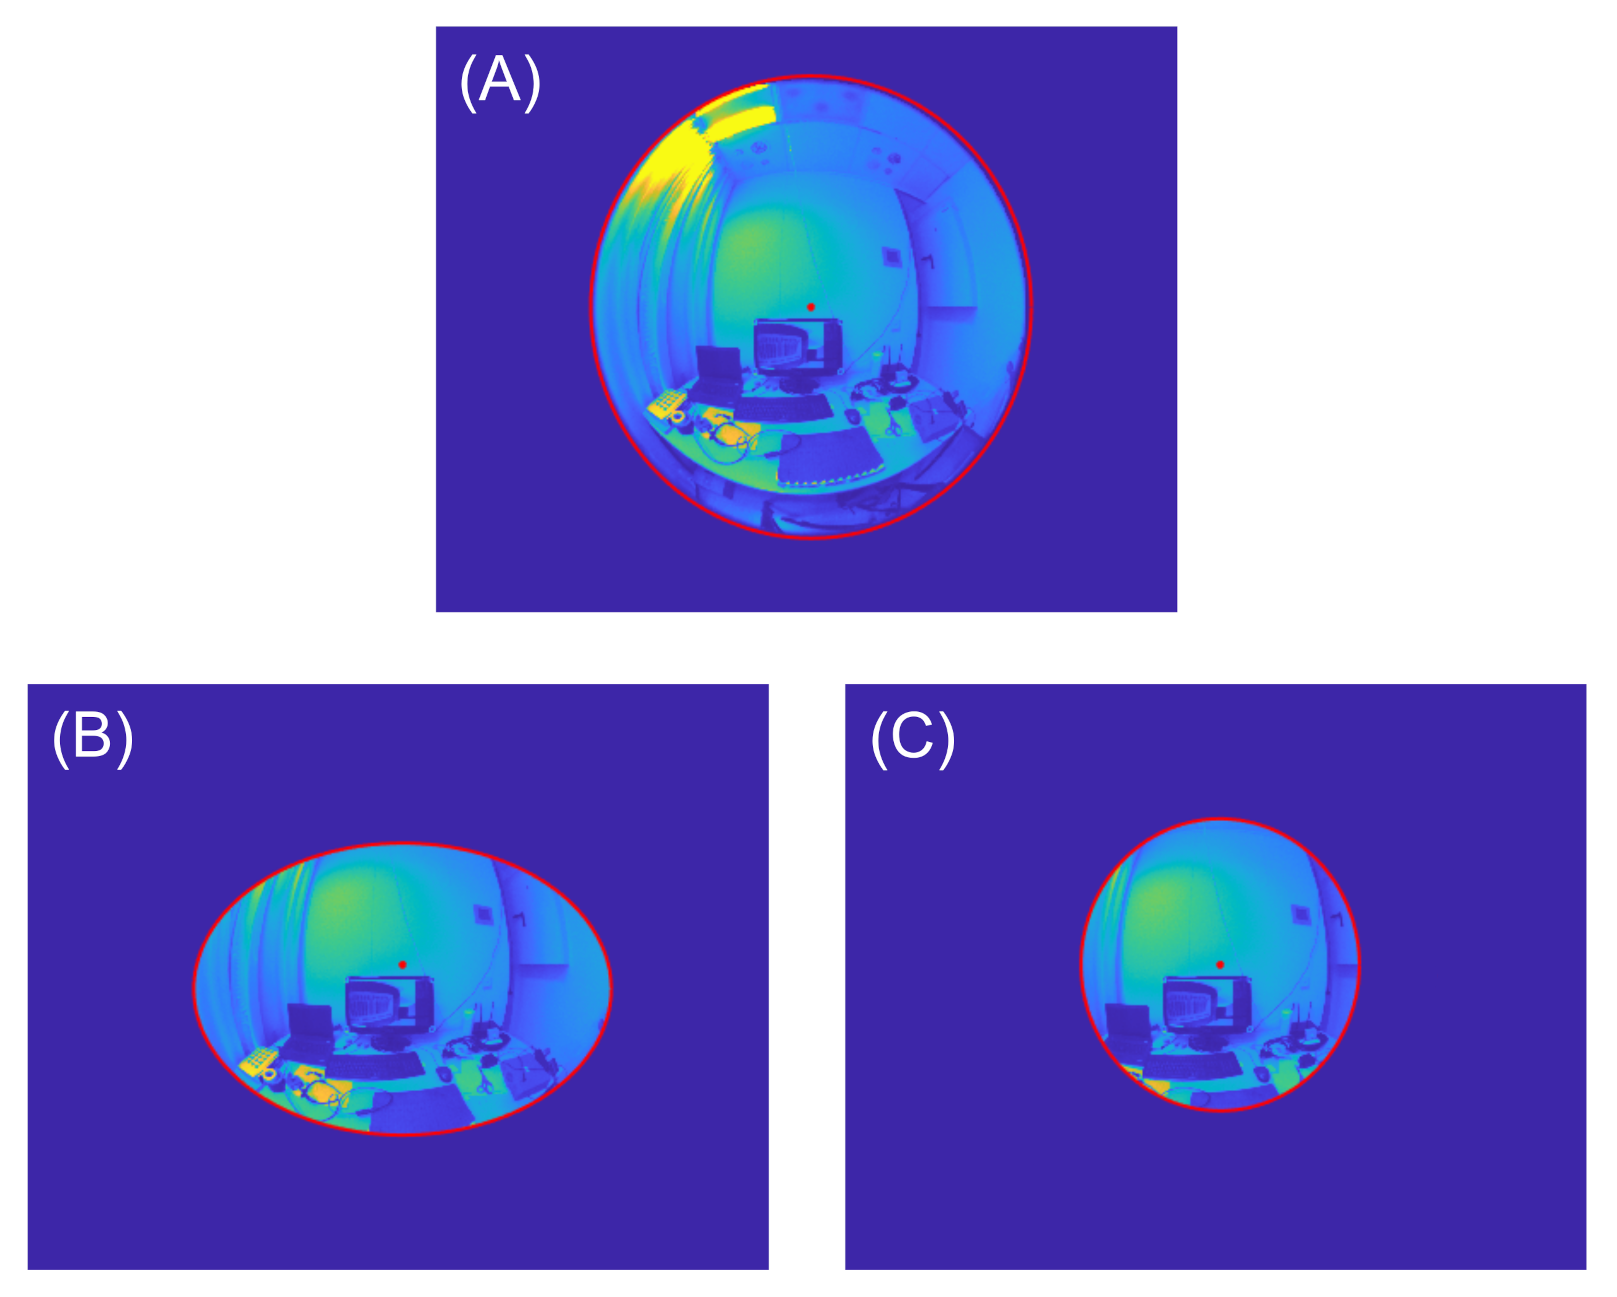
In the present work, we therefore limit our considerations to three exemplary viewing angle/field of view (FOV) definitions obtained by geometrically masking the data output of the luminance imaging photometer using an ellipse equation of the form
where and denote the pixel positions and and the extents of the ellipse in x- and y-directions, while and are the respective coordinates of the central focus point and ellipse center. The three different pixel maskings considered in this work are shown in Figure 5 and represent (a) a half-space geometry, (b) the FOV definition of CIE S 026:2018 [15], and (c) the FOV of an assumed 120 observer. Again, it should be emphasized that there are no official recommendations or standards yet that could guide through the process of adequately weighting light contributions originating from different directions of the half space for a proper modeling of the overall circadian effectiveness of the illumination and/or the lit environment. Nevertheless, the general methodology of the spatially resolved approximation strategy discussed in this should also be noted, and the preceding sections can easily be adapted to any suitable masking or light-direction weighting scheme once it has been established based on scientific evidence.
3. Results
This section summarizes the results of the exemplary in-field office light measurements performed at the Laboratory of Lighting Technology, TU Darmstadt, where the proposed methodology discussed in the previous sections was applied. In order to evaluate the accuracy of this novel approach, Table 1 shows the circadian stimulus and illuminance half-space estimates as calculated from the spatially resolved output of the LMK-5 color imaging photometer for each of the nine different office workplaces considered in this study and compares them to the CSS-45 measurement results serving as the corresponding reference values. Additionally tabulated are the error estimates and , which were calculated from Equations (11) and (12), respectively. As can be seen, the deviations between the reported LMK-5 color and CSS-45 measurement results are negligibly small from a practical point of view (≙no statistically significant differences between mean values). In all cases, the relative illuminance error is less than % (⌀ = %), while a maximal absolute deviation of only 0.016 (⌀ = 0.011) is observed for the CS values. In summary, these results suggest a relative estimation error of the spatially resolved measurement approach of 3–6%, which denotes an acceptable range for most practical applications. In the present case, the largest and errors are observed for the workplaces #3 and #9. In comparison to the other measurements, these results can be explained by the greater amount of chromatic information constituting the FOV at these specific workplaces, which can be attributed to the greater number of personalized colored items (textbooks, coffee pots, photographs, etc.) that were present in these cases and the more colorful image content displayed on the respective monitors. As the approximation formula of Equation (5) was developed for white light sources/emitters only, any chromatic content predominating the FOV above a certain degree may result in larger estimation errors. Likewise, the luminance error in Equation (6), from which is calculated, increases for chromatic content leading to a larger error in cases where the amount of colored, non-achromatic information is predominant in the respective FOV.
In order to illustrate how different FOV definitions may alter the measurement results, Table 2 summarizes the vertical illuminance and CS values for each of the nine office workplaces as obtained by applying the different exemplary data maskings introduced in Section 2.3. As can be seen, the average half-space estimates were significantly larger than the corresponding mean values observed for both alternative evaluation schemes. Compared to the results determined for the entire half-space, average reductions in vertical illuminance of 43% and 39% can be observed for the CIE and the 120 masking, respectively. A similar behavior must be reported for the mean CS results, where the 120 masking gives a 26% smaller value than the half-space evaluation, while an even larger decrease of 29% is obtained for the CIE masking scheme. Even though the latter, due to its elliptical shape, covers a larger area than, for example, the 120 observer, it still yields the smallest overall mean values. This finding can be explained by the fact that the corresponding ellipsis only extends up to 50 in the upward direction so that, compared to the other two evaluation schemes, larger parts of the light coming from the upper visual field (i.e., the ceiling) are excluded as non-relevant for calculating the respective outcome measures.
Sufficiently high CS values (>0.3) are only observed when integrating over the complete half-space, where an overall mean of 0.340 is obtained. Significantly smaller values of 0.253 and 0.241 must be reported for the 120 and CIE maskings, respectively. The considerably lowest circadian effectiveness of all workplaces is observed for workplace #9 showing a CS value of 0.232 for the full half-space evaluation, of 0.136 for the 120 masking, and of 0.138 calculated from the FOV definition of the CIE. Compared to the workplaces #1–8, which were measured on a cloudy day between 12:00 p.m. and 1:00 p.m., workplace #9 was assessed in the evening, where natural daylight entry through windows was significantly reduced, leading to less circadian-effective overall room light conditions in the latter case than reported for the remaining workplaces.
Thus far, the reported measurement results of circadian effectiveness at the various office workplaces were obtained for a tilt angle of the measurement devices of at a height of 120 derived from DIN EN 12464-1. However, with the standard desk orientation of a computer monitor being slightly below the horizontal viewing axis of a seated office worker, see Figure 5, it seems to be expedient to also discuss how a non-zero tilt angle may affect the measurement results. Assuming a typical computer work scenario, it can be expected that the office worker’s gaze is primarily attracted by the displayed information in front of them and, as a result of the computer monitor’s off-axis position, leads to a different overall circadian stimulation than estimated from a horizontal on-axis measurement. Table 3 therefore summarizes for each of the nine different office workplaces considered in this work the respective measurement results obtained for a non-zero tilt angle of the spatially resolved imaging photometer of so that its optical axis is aligned to the center of the computer monitor’s display. As can be seen, the reported illuminance and CS values decreased considerably. Compared to the horizontal on-axis results shown in Table 2, the average illuminance (CS) values obtained for the half-space evaluation, the 120 masking, and the FOV definition of the CIE are reduced by 17% (10%), 20% (13%), and 16% (11%), respectively. This decrease in circadian effectiveness complies with the reduced amount of ceiling light that is expected to arrive at the observers’ eyes when their gaze is focused slightly downward in order to be in line with the computer monitor’s orientation on the office desk.
4. Discussion
In this work, a novel methodological framework for the performance of in-field light measurements has been proposed and validated that allows for a spatially resolved approximation of the circadian effectiveness of a lighting situation in terms of the physiologically relevant CS measure using an imaging photometer. As it has been shown, this framework can easily be adapted to comply with arbitrary FOV definitions and, at a later stage, extended accordingly to enable the directional weighting of lighting contributions emerging from different parts of the lit environment. The latter, in particular, constitutes an open field of ongoing research with still a lot of unknowns so that, at present, no specific recommendations on how to weight light contributions from different directions to come up with a reliable estimate of the circadian effectiveness of a lighting condition do exist or can be made yet. Nonetheless, the current work clearly shows the flexibility and accuracy of the proposed approach in evaluating spatially resolved in-field light measurements with regard to the determination of an overall circadian effectiveness of the prevalent lighting conditions by reporting results for different exemplary FOV definitions in the office context.
In particular, it could be shown that the resulting vertical illuminance-at-eye and CS measures not only strongly depend on the specifically applied FOV masking but also on the angle of measurement, although the horizontal illuminance and with it the luminance distribution on the office desk do not change. Assuming a standard layout of the lighting design for office environments, i.e., light is primarily coming from above the observers/from the ceiling, a declination of the measurement angle towards the computer monitor’s position on the office desk yields a significant reduction of the respective outcome measures, which complies with the reduced amount of (ceiling) light supposed to arrive at the observers’ eyes when their gaze is fixated to the computer monitor. For a reliable estimate of the true circadian effectiveness that can be expected in the field, it is therefore not only crucial to know how light contributions from different directions must be weighted but also to know where exactly and for how long an office worker is gazing. Of course, this kind of information seems to be unrealistic to be obtained on an individual level; however, the goal should be to develop representative statistical probability models of gaze behavior that, in addition to the future introduction of a weighting scheme for directional light contributions, can be used to obtain a true and reliable prediction of the circadian effectiveness of the lit environment from corresponding in-field measurements.
As for example described by Kobbert [101] for the automotive context, the required data to develop this kind of statistical models can be obtained by combining in situ eye-tracking [102] with state-of-the-art object recognition algorithms in order to determine characteristic gaze behavior distributions of office workers for a typical office day, e.g., like in the present case, with a focus on display work. The availability of such context-dependent eye-tracking based gaze behavior models does not only help to perform more reliable and meaningful estimates of the circadian effectiveness of the lit working environment adopting the novel measurement approach proposed in this work, but may also contribute to the optimization of the respective luminaires’ light distributions to match the specific, task-related visual needs of the office workers [13]. Their development will be part of our future research efforts.
Regarding the specific metric used for estimating circadian effectiveness in the lighting context, it would certainly be beneficial to also consider alternative measures alongside CS, which for practical reasons was within the focus of the present work. The Commission Internationale de l’Éclairage (CIE) recently published the new CIE S 026/E:2018 standard [15], which defines the basic metrology to describe the ability of optical radiation to stimulate each of the five photoreceptor types that can contribute via the ipRGCs to retina-mediated non-visual effects of light in humans. In this context, the melanopic equivalent daylight (D65) illuminance (melanopic EDI) has been proposed—similar to CS—as a metric for the prediction of the circadian impact of the environmental illumination, in particular to guide future health-related lighting design [103,104]. However, in contrast to the CS metric, for which Truong et al. developed the approximation method of Equation (5), no such simplification using standard photometric and colorimetric quantities has yet been established for the melanopic EDI measure, which, in its current form, is therefore unsuitable for being used within the new spatially-resolved light measurement framework proposed in this work. Nonetheless, future research to describe the circadian effectiveness of lighting should also focus on such CS alternatives that show a comparable predictive performance over a wide range of conditions [103].
Current restrictions of the proposed methodology can mainly be attributed to the fact that there is no applicable and validated recommendation on how to properly weight light contributions from different directions to obtain a truly reliable estimate of the overall circadian effectiveness of a lighting condition. As long as such a weighting scheme has not been fully established, the present work still appears to be limited in its practical relevance. However, it should again be stressed that the proposed framework can easily be extended and adapted accordingly to comply with any desired weighting scheme. A further limitation of the proposed approach can yet be identified in the increase of the model uncertainties for chromatic content. As discussed in Section 3, corresponding error estimates rise considerably when the amount of colored, non-achromatic information becomes predominant in the illuminated scene to be captured. Thus, a systematic and accurate characterization of these errors to delineate the worst-case scenario seems to be indicated and should be performed as part of future research. In addition, working towards an improvement of Truong et al.’s approximation method of Equation (5) to achieve an adequate modeling of not only white light sources but also monochromatic or colored emitters may in general lead to a better overall model performance.
Finally, it should be noted that, for an accurate prediction of non-visual effects on human outcome measures from in-field light measurements, the timing and duration of light exposure also need to be considered. As it was confirmed empirically in the past [44,65], circadian effectiveness is not only a matter of spatial light distribution, spectral composition, and intensity but also determined by the time people are exposed to a certain illumination or light condition. For that reason, future developments for an improved validity and interpretability of light measurements in the non-visual domain must account for the possibility of including temporal light exposure profiles that predict the timing and duration an individual is expected to be exposed to a certain lighting condition. Wearable, sensor-based light tracking over longer duration periods that allows for a time-resolved collection of light information can thus be a valuable tool for the derivation of such characteristic, context-dependent temporal light exposure patterns. By complementing the concepts of a directional and gaze-dependent weighting of lighting contributions, the explicit inclusion of temporal information may allow for a better and more comprehensive prediction of the non-visual effects that can be expected from in-field light measurements using the spatially resolved measurement framework proposed in this work.
Author Contributions
Conceptualization, S.B. (Sebastian Babilon), S.B. (Sebastian Beck), J.K. (Julian Klabes), and P.M.; Data curation, S.B. (Sebastian Beck), J.K. (Julian Kunkel) and S.B. (Simon Benkner); Formal analysis, J.K. (Julian Kunkel), S.B. (Sebastian Babilon), S.B. (Sebastian Beck), J.K. (Julian Klabes), and P.M.; Methodology, S.B. (Sebastian Beck), S.B. (Sebastian Babilon), and T.Q.K.; Software, J.K. (Julian Kunkel), S.B. (Sebastian Beck), and S.B. (Simon Benkner); Supervision, T.Q.K.; Validation, S.B. (Sebastian Babilon), J.K. (Julian Klabes), P.M., and S.B. (Simon Benkner); Visualization, J.K. (Julian Kunkel), S.B. (Sebastian Beck), and J.K. (Julian Klabes); Writing—original draft, S.B. (Sebastian Babilon), S.B. (Sebastian Beck), and J.K. (Julian Kunkel); Writing—review and editing, S.B. (Sebastian Babilon), S.B. (Sebastian Beck), J.K. (Julian Kunkel), J.K. (Julian Klabes), P.M., S.B. (Simon Benkner), and T.Q.K.; Project administration, S.B. (Sebastian Beck), S.B. (Sebastian Babilon); Funding acquisition, S.B. (Sebastian Babilon), and T.Q.K. All authors have read and agreed to the published version of the manuscript.
Funding
This work was funded by the Deutsche Forschungsgemeinschaft (DFG, German Research Foundation) under Grant No. 445336968 and by the Open Access Publishing Fund of Technical University of Darmstadt. S.B. (Sebastian Babilon) received personal funding by the Ernst Ludwig Mobility Grant of the Technical University of Darmstadt.
Institutional Review Board Statement
Not applicable.
Informed Consent Statement
Not applicable.
Data Availability Statement
All data generated or analyzed to support the findings of the present study are included this article. The raw data can be obtained from the authors, upon reasonable request.
Conflicts of Interest
The authors declare no conflict of interest.
References
- Gooley, J.J. Light-induced resetting of circadian rhythms in humans. J. Sci. Technol. Light. 2018, 41, 69–76. [Google Scholar] [CrossRef]
- Blume, C.; Garbazza, C.; Spitschan, M. Effects of light on human circadian rhythms, sleep and mood. Somnologie 2019, 23, 147–156. [Google Scholar] [CrossRef] [Green Version]
- Gotlieb, N.; Moeller, J.; Kriegsfeld, L.J. Circadian control of neuroendocrine function: Implications for health and disease. Curr. Opin. Physiol. 2018, 5, 133–140. [Google Scholar] [CrossRef] [PubMed]
- Paul, S.; Brown, T.M. Direct effects of the light environment on daily neuroendocrine control. J. Endocrinol. 2019, 243, R1–R18. [Google Scholar] [CrossRef] [PubMed] [Green Version]
- Cajochen, C. Alerting effects of light. Sleep Med. Rev. 2007, 11, 453–464. [Google Scholar] [CrossRef]
- Souman, J.L.; Tinga, A.M.; te Pas, S.F.; van Ee, R.; Vlaskamp, B.N.S. Acute alerting effects of light: A systematic literature review. Behav. Brain Res. 2018, 337, 228–239. [Google Scholar] [CrossRef] [PubMed]
- Lok, R.; Smolders, K.C.H.J.; Beersma, D.G.M.; de Kort, Y.A.W. Light, alertness, and alerting effects of white light: A literature overview. J. Biol. Rhythm. 2018, 33, 589–601. [Google Scholar] [CrossRef] [PubMed] [Green Version]
- van Bommel, W.J.M. Non-visual biological effect of lighting and the practical meaning for lighting for work. Appl. Ergon. 2006, 37, 461–466. [Google Scholar] [CrossRef]
- Khanh, T.Q.; Bodrogi, P.; Guo, X.; Anh, P.Q. Towards a user preference model for interior lighting Part 1: Concept of the user preference model and experimental method. Light. Res. Technol. 2019, 51, 1014–1029. [Google Scholar] [CrossRef]
- Lledó, R. Human centric lighting, a new reality in healthcare environments. In Health and Social Care Systems of the Future: Demographic Changes, Digital Age and Human Factors, Advances in Intelligent Systems and Computing; Springer: Cham, Switzerland, 2019; Volume 1012, pp. 23–26. [Google Scholar] [CrossRef]
- Houser, K.W.; Boyce, P.R.; Zeitzer, J.M.; Herf, M. Human-centric lighting: Myth, magic or metaphor? Light. Res. Technol. 2021, 53, 97–118. [Google Scholar] [CrossRef]
- Houser, K.W.; Esposito, T. Human-centric lighting: Foundational considerations and a five-step design process. Front. Neurol. 2021, 12, 630553. [Google Scholar] [CrossRef] [PubMed]
- Babilon, S.; Lenz, J.; Beck, S.; Myland, P.; Klabes, J.; Klir, S.; Khanh, T.Q. Task-related Luminance Distributions for Office Lighting Scenarios. Light Eng. 2021, 29, 115–128. [Google Scholar] [CrossRef]
- International WELL Building Institute pbc. The WELL Building Standard, Version 2; International WELL Building Institute: New York, NY, USA, 2020; Available online: https://v2.wellcertified.com/wellv2/en/overview (accessed on 19 June 2021).
- CIE Central Bureau. CIE S 026:2018—CIE system for metrology of optical radiation for ipRGC-influenced responses to light. Int. Stand. 2018. [Google Scholar] [CrossRef]
- Veitch, J.A.; Knoop, M. CIE TN 011:2020—What to document and report in studies of ipRGC-influenced responses to light. Tech. Note 2020. [Google Scholar] [CrossRef]
- Vetter, C.; Pattison, P.M.; Houser, K.; Herf, M.; Phillips, A.J.K.; Wright, K.P.; Skene, D.J.; Brainard, G.C.; Boivin, D.B.; Glickman, G. A review of human physiological responses to light: Implications for the development of integrative lighting solutions. Leukos 2021. [Google Scholar] [CrossRef]
- Hou, D.; He, S.; Dai, C.; Chen, S.; Chen, H.; Lin, Y. Lighting scheme recommendation for interior workplace to adjust the phase-advance jet lag. Build. Environ. 2021, 198, 107913. [Google Scholar] [CrossRef]
- Xiao, H.; Cai, H.; Li, X. Non-visual effects of indoor light environment on humans: A review. Physiol. Behav. 2021, 228, 113195. [Google Scholar] [CrossRef]
- Schlangen, L.J.M.; Price, L.L.A. The lighting environment, its metrology, and non-visual responses. Front. Neurol. 2021, 12, 235. [Google Scholar] [CrossRef]
- Stefani, O.; Cajochen, C. Should we re-think regulations and standards for lighting at workplaces? A practice review on existing lighting recommendations. Front. Psychiatry 2021, 12, 671. [Google Scholar] [CrossRef] [PubMed]
- Visser, E.K.; Beersma, D.G.M.; Daan, S. Melatonin suppression by light in humans is maximal when the nasal part of the retina is illuminated. J. Biol. Rhythm. 1999, 14, 116–121. [Google Scholar] [CrossRef] [Green Version]
- Ruger, M.; Gordijn, M.C.M.; Beersma, D.G.M.; de Vries, B.; Daan, S. Nasal versus Temporal Illumination of the Human Retina: Effects on Core Body Temperature, Melatonin, and Circadian Phase. J. Biol. Rhythm. 2005, 20, 60–70. [Google Scholar] [CrossRef] [PubMed] [Green Version]
- Lasko, T.A.; Kripke, D.F.; Elliot, J.A. Melatonin suppression by illumination of upper and lower visual fields. J. Biol. Rhythm. 1999, 14, 122–125. [Google Scholar] [CrossRef] [PubMed]
- Glickman, G.; Hanifin, J.P.; Rollag, M.D.; Wang, J.; Cooper, H.; Brainard, G.C. Inferior retinal light exposure is more effective than superior retinal exposure in suppressing melatonin in humans. J. Biol. Rhythm. 2003, 18, 71–79. [Google Scholar] [CrossRef]
- Gaddy, J.R.; Edelson, M.; Stewart, K.; Brainard, G.C.; Rollag, M.D. Possible retinal spatial summation in melatonin suppression. In Biologic Effects of Light; De Gruyter: New York, NY, USA, 1992; pp. 196–204. [Google Scholar] [CrossRef]
- Smith, J.S.; Kripke, D.F.; Elliott, J.A.; Youngstedt, S.D. Illumination of upper and middle visual fields produces equivalent suppression of melatonin in older volunteers. Chronobiol. Int. 2002, 19, 883–891. [Google Scholar] [CrossRef]
- Rea, M.S.; Nagare, R.; Figueiro, M.G. Relative light sensitivities of four retinal hemi-fields for suppressing the synthesis of melatonin at night. Neurobiol. Sleep Circadian Rhythm. 2021, 10, 100066. [Google Scholar] [CrossRef] [PubMed]
- Broszio, K.; Knoop, M.; Niedling, M.; Volker, S. Effective radiant flux for non-image forming effects—Is the illuminance and the melanopic irradiance at the eye really the right measure? Light Eng. 2018, 26, 68–74. [Google Scholar] [CrossRef]
- Knoop, M.; Broszio, K.; Diakite, A.; Liedtke, C.; Niedling, M.; Rothert, I.; Rudawski, F.; Weber, N. Methods to describe and measure lighting conditions in experiments on non-image-forming aspects. Leukos 2019, 15, 163–179. [Google Scholar] [CrossRef]
- Brainard, G.C.; Lewy, A.J.; Menaker, M.; Fredrickson, R.H.; Miller, L.S.; Weleber, R.G.; Cassone, V.; Hudson, D. Effect of light wavelength on the suppression of nocturnal plasma melatonin in normal volunteers. Ann. N. Y. Acad. Sci. 1985, 453, 376–378. [Google Scholar] [CrossRef]
- Mclntyre, I.M.; Norman, T.R.; Burrows, G.D.; Armstrong, S.M. Human melatonin suppression by light is intensity dependent. J. Pineal Res. 1989, 6, 149–156. [Google Scholar] [CrossRef] [PubMed]
- Dollins, A.B.; Lynch, H.J.; Wurtman, R.J.; Deng, M.H.; Lieberman, H.R. Effects of illumination on human nocturnal serum melatonin levels and performance. Physiol. Behav. 1993, 53, 153–160. [Google Scholar] [CrossRef]
- Monteleone, P.; Esposito, G.; La Rocca, A.; Maj, M. Does bright light suppress nocturnal melatonin secretion more in women than men? J. Neural Transm. 1995, 102, 75–80. [Google Scholar] [CrossRef] [PubMed]
- Hashimoto, S.; Nakamura, K.; Honma, S.; Tokura, H.; Honma, K. Melatonin rhythm is not shifted by lights that suppress nocturnal melatonin in humans under entrainment. Am. J. Physiol. Regul. Integr. Comp. Physiol. 1996, 270, R1073–R1077. [Google Scholar] [CrossRef] [PubMed]
- Nathan, P.J.; Burrows, G.D.; Norman, T.R. The effect of dim light on suppression of nocturnal melatonin in healthy women and men. J. Neural Transm. 1997, 104, 643–648. [Google Scholar] [CrossRef] [PubMed]
- Aoki, H.; Yamada, N.; Ozeki, Y.; Yamane, H.; Kato, N. Minimum light intensity required to suppress nocturnal melatonin concentration in human saliva. Neurosci. Lett. 1998, 252, 91–94. [Google Scholar] [CrossRef]
- Nathan, P.J.; Wyndham, E.L.; Burrows, G.D.; Norman, T.R. The effect of gender on the melatonin suppression by light: A dose response relationship. J. Neural Transm. 2000, 107, 271–279. [Google Scholar] [CrossRef] [PubMed]
- Zeitzer, J.M.; Dijk, D.; Kronauer, R.E.; Brown, E.N.; Czeisler, C.A. Sensitivity of the human circadian pacemaker to nocturnal light: Melatonin phase resetting and suppression. J. Physiol. 2000, 526, 695–702. [Google Scholar] [CrossRef] [PubMed]
- Brainard, G.C.; Hanifin, J.P.; Greeson, J.M.; Byrne, B.; Glickman, G.; Gerner, E.; Rollag, M.D. Action spectrum for melatonin regulation in humans: Evidence for a novel circadian photoreceptor. J. Neurosci. 2001, 21, 6405–6412. [Google Scholar] [CrossRef] [Green Version]
- Thapan, K.; Arendt, J.; Skene, D.J. An action spectrum for melatonin suppression: Evidence for a novel non-rod, non-cone photoreceptor system in humans. J. Physiol. 2001, 535, 261–267. [Google Scholar] [CrossRef]
- Wright, H.R.; Lack, L.C. Effect of light wavelength on suppression and phase delay of the melatonin rhythm. Chronobiol. Int. 2001, 18, 801–808. [Google Scholar] [CrossRef]
- Hébert, M.; Martin, S.K.; Lee, C.; Eastman, C.I. The effects of prior light history on the suppression of melatonin by light in humans. J. Pineal Res. 2002, 33, 198–203. [Google Scholar] [CrossRef] [Green Version]
- Khalsa, S.B.S.; Jewett, M.E.; Cajochen, C.; Czeisler, C.A. A phase response curve to single bright light pulses in human subjects. J. Physiol. 2003, 549, 945–952. [Google Scholar] [CrossRef]
- Figueiro, M.G.; Bullough, J.D.; Parsons, R.H.; Rea, M.S. Preliminary evidence for spectral opponency in the suppression of melatonin by light in humans. Neuroreport 2004, 15, 313–316. [Google Scholar] [CrossRef]
- Figueiro, M.G.; Bullough, J.D.; Bierman, A.; Rea, M.S. Demonstration of additivity failure in human circadian phototransduction. Neuroendocrinol. Lett. 2005, 26, 493–498. [Google Scholar]
- Figueiro, M.G.; Bullough, J.D.; Parsons, R.H.; Rea, M.S. Preliminary evidence for a change in spectral sensitivity of the circadian system at night. J. Circadian Rhythm. 2005, 3, 14. [Google Scholar] [CrossRef] [Green Version]
- Kayumov, L.; Casper, R.F.; Hawa, R.J.; Perelman, B.; Chung, S.A.; Sokalsky, S.; Shapiro, C.M. Blocking low-wavelength light prevents nocturnal melatonin suppression with no adverse effect on performance during simulated shift work. J. Clin. Endocrinol. Metab. 2005, 90, 2755–2761. [Google Scholar] [CrossRef] [PubMed] [Green Version]
- Herljevic, M.; Middleton, B.; Thapan, K.; Skene, D.J. Light-induced melatonin suppression: Age-related reduction in response to short wavelength light. Exp. Gerontol. 2005, 40, 237–242. [Google Scholar] [CrossRef] [PubMed] [Green Version]
- Cajochen, C.; Münch, M.; Kobialka, S.; Kräuchi, K.; Steiner, R.; Oelhafen, P.; Orgül, S.; Wirz-Justice, A. High sensitivity of human melatonin, alertness, thermoregulation, and heart rate to short wavelength light. J. Clin. Endocrinol. Metab. 2005, 90, 1311–1316. [Google Scholar] [CrossRef] [Green Version]
- Jasser, S.A.; Hanifin, J.P.; Rollag, M.D.; Brainard, G.C. Dim light adaptation attenuates acute melatonin suppression in humans. J. Biol. Rhythm. 2006, 21, 394–404. [Google Scholar] [CrossRef]
- Figueiro, M.G.; Rea, M.S.; Bullough, J.D. Circadian effectiveness of two polychromatic lights in suppressing human nocturnal melatonin. Neurosci. Lett. 2006, 406, 293–297. [Google Scholar] [CrossRef]
- Revell, V.L.; Skene, D.J. Light-induced melatonin suppression in humans with polychromatic and monochromatic light. Chronobiol. Int. 2007, 24, 1125–1137. [Google Scholar] [CrossRef] [PubMed]
- Brainard, G.C.; Sliney, D.; Hanifin, J.P.; Glickman, G.; Byrne, B.; Greeson, J.M.; Jasser, S.; Gerner, E.; Rollag, M.D. Sensitivity of the human circadian system to short-wavelength (420-nm) light. J. Biol. Rhythm. 2008, 23, 379–386. [Google Scholar] [CrossRef] [Green Version]
- Bullough, J.D.; Bierman, A.; Figueiro, M.G.; Rea, M.S. On melatonin suppression from polychromatic and narrowband light. Chronobiol. Int. 2008, 25, 653–656. [Google Scholar] [CrossRef]
- Figueiro, M.G.; Bierman, A.; Rea, M.S. Retinal mechanisms determine the subadditive response to polychromatic light by the human circadian system. Neurosci. Lett. 2008, 438, 242–245. [Google Scholar] [CrossRef] [PubMed]
- Kozaki, T.; Koga, S.; Toda, N.; Noguchi, H.; Yasukouchi, A. Effects of short wavelength control in polychromatic light sources on nocturnal melatonin secretion. Neurosci. Lett. 2008, 439, 256–259. [Google Scholar] [CrossRef]
- Smith, M.R.; Revell, V.L.; Eastman, C.I. Phase advancing the human circadian clock with blue-enriched polychromatic light. Sleep Med. 2009, 10, 287–294. [Google Scholar] [CrossRef] [Green Version]
- Revell, V.L.; Barrett, D.C.G.; Schlangen, L.J.M.; Skene, D.J. Predicting human nocturnal nonvisual responses to monochromatic and polychromatic light with a melanopsin photosensitivity function. Chronobiol. Int. 2010, 27, 1762–1777. [Google Scholar] [CrossRef] [Green Version]
- West, K.E.; Jablonski, M.R.; Warfield, B.; Cecil, K.S.; James, M.; Ayers, M.A.; Maida, J.; Bowen, C.; Sliney, D.H.; Rollag, M.D.; et al. Blue light from light-emitting diodes elicits a dose-dependent suppression of melatonin in humans. J. Appl. Physiol. 2011, 110, 619–626. [Google Scholar] [CrossRef] [Green Version]
- Brainard, G.C.; Hanifin, J.P.; Warfield, B.; Stone, M.K.; James, M.E.; Ayers, M.; Kubey, A.; Byrne, B.; Rollag, M. Short-wavelength enrichment of polychromatic light enhances human melatonin suppression potency. J. Pineal Res. 2015, 58, 352–361. [Google Scholar] [CrossRef] [PubMed] [Green Version]
- Nagare, R.; Rea, M.S.; Plitnick, B.; Figueiro, M.G. Nocturnal melatonin suppression by adolescents and adults for different levels, spectra, and durations of light exposure. J. Biol. Rhythm. 2019, 34, 178–194. [Google Scholar] [CrossRef] [PubMed]
- Nagare, R.; Plitnick, B.; Figueiro, M.G. Effect of exposure duration and light spectra on nighttime melatonin suppression in adolescents and adults. Light. Res. Technol. 2019, 51, 530–543. [Google Scholar] [CrossRef] [PubMed]
- Nagare, R.; Rea, M.S.; Plitnick, B.; Figueiro, M.G. Effect of white light devoid of “cyan” spectrum radiation on nighttime melatonin suppression over a 1-h exposure duration. J. Biol. Rhythm. 2019, 34, 195–204. [Google Scholar] [CrossRef]
- Rea, M.S.; Nagare, R.; Figueiro, M.G. Predictions of melatonin suppression during the early biological night and their implications for residential light exposures prior to sleeping. Sci. Rep. 2020, 10, 14114. [Google Scholar] [CrossRef] [PubMed]
- Rea, M.S. Toward a definition of circadian light. J. Light Vis. Environ. 2011, 35, 250–254. [Google Scholar] [CrossRef] [Green Version]
- Rea, M.S.; Figueiro, M.G.; Bierman, A.; Hamner, R. Modelling the spectral sensitivity of the human circadian system. Light. Res. Technol. 2012, 44, 386–396. [Google Scholar] [CrossRef]
- Rea, M.S.; Figueiro, M.G. Light as a circadian stimulus for architectural lighting. Light. Res. Technol. 2018, 50, 497–510. [Google Scholar] [CrossRef]
- Rea, M.S.; Figueiro, M.G.; Bullough, J.D.; Bierman, A. A model of phototransduction by the human circadian system. Brain Res. Rev. 2005, 50, 213–228. [Google Scholar] [CrossRef] [PubMed]
- Rea, M.S.; Nagare, R.; Figueiro, M.G. Modeling circadian phototransduction: Quantitative predictions of psychophysical data. Front. Neurosci. 2021, 15, 615322. [Google Scholar] [CrossRef] [PubMed]
- Smith, V.C.; Pokorny, J.; Gamlin, P.D.; Packer, O.S.; Peterson, B.B.; Dacey, D.M. Functional Architecture of the Photoreceptive Ganglion Cell in Primate Retina: Spectral Sensitivity and Dynamics of the Intrinsic Response. Investig. Ophthalmol. Vis. Sci. 2003, 44, 5185. [Google Scholar]
- Wyszecki, G.; Stiles, W.S. Color Science: Concepts and Methods, Quantitative Data and Formulae, 2nd ed.; John Wiley & Sons: New York, NY, USA, 1982. [Google Scholar]
- Rea, M.S.; Figueiro, M.G.; Bierman, A.; Hamner, R. Corrigendum to “Modelling the spectral sensitivity of the human circadian system”. Light. Res. Technol. 2012, 44, 516. [Google Scholar] [CrossRef]
- Smith, V.C.; Pokorny, J. Spectral sensitivity of the foveal cone photopigments between 400 and 500 nm. Vis. Res. 1975, 15, 161–171. [Google Scholar] [CrossRef]
- Snodderly, D.M.; Brown, P.K.; Delori, F.C.; Auran, J.D. The macular pigment. I. Absorbance spectra, localization, and discrimination from other yellow pigments in primate retinas. Investig. Ophthalmol. Vis. Sci. 1984, 25, 660–673. [Google Scholar]
- CIE 041-1978. Light as a True Visual Quantity: Principles of Measurement; Technical report; Bureau Central de la CIE: Paris, France, 1978. [Google Scholar]
- Truong, W.; Trinh, V.; Khanh, T.Q. Circadian stimulus—A computation model with photometric and colorimetric quantities. Light. Res. Technol. 2020, 52, 751–762. [Google Scholar] [CrossRef]
- Figueiro, M.G.; Hamner, R.; Bierman, A.; Rea, M.S. Comparisons of three practical field devices used to measure personal light exposures and activity levels. Light. Res. Technol. 2013, 45, 421–434. [Google Scholar] [CrossRef]
- Bierman, A.; Klein, T.R.; Rea, M.S. The Daysimeter: A device for measuring optical radiation as a stimulus for the human circadian system. Meas. Sci. Technol. 2005, 16, 2292–2299. [Google Scholar] [CrossRef]
- Wood, B.; Rea, M.S.; Plitnick, B.; Figueiro, M.G. Light level and duration of exposure determine the impact of self-luminous tablets on melatonin suppression. Appl. Ergon. 2013, 44, 237–240. [Google Scholar] [CrossRef] [PubMed]
- Figueiro, M.G.; Plitnick, B.A.; Lok, A.; Jones, G.E.; Higgins, P.; Hornick, T.R.; Rea, M.S. Tailored lighting intervention improves measures of sleep, depression, and agitation in persons with Alzheimer’s disease and related dementia living in long-term care facilities. Clin. Interv. Aging 2014, 9, 1527–1537. [Google Scholar] [CrossRef] [PubMed] [Green Version]
- Young, C.R.; Jones, G.E.; Figueiro, M.G.; Soutière, S.E.; Keller, M.W.; Richardson, A.M.; Lehmann, B.J.; Rea, M.S. At-sea trial of 24-h-based submarine watchstanding schedules with high and low correlated color temperature light sources. J. Biol. Rhythm. 2015, 30, 144–154. [Google Scholar] [CrossRef] [PubMed]
- Figueiro, M.G.; Hunter, C.M.; Higgins, P.; Hornick, T.; Jones, G.E.; Plitnick, B.; Brons, J.; Rea, M.S. Tailored lighting intervention for persons with dementia and caregivers living at home. Sleep Health 2015, 1, 322–330. [Google Scholar] [CrossRef] [PubMed] [Green Version]
- Figueiro, M.G.; Rea, M.S. Office lighting and personal light exposures in two seasons: Impact on sleep and mood. Light. Res. Technol. 2016, 48, 352–364. [Google Scholar] [CrossRef]
- Figueiro, M.G. Biological effects of light: Can self-luminous displays play a role? Inf. Disp. 2018, 34, 6–20. [Google Scholar] [CrossRef] [Green Version]
- Gronfier, C.; Wright, K.P.; Kronauer, R.E.; Jewett, M.E.; Czeisler, C.A. Efficacy of a single sequence of intermittent bright light pulses for delaying circadian phase in humans. Am. J. Physiol. Endocrinol. Metab. 2004, 287, E174–E181. [Google Scholar] [CrossRef] [PubMed] [Green Version]
- Najjar, R.P.; Zeitzer, J.M. Temporal integration of light flashes by the human circadian system. J. Clin. Investig. 2016, 126, 938–947. [Google Scholar] [CrossRef]
- Figueiro, M.G. Delayed sleep phase disorder: Clinical perspective with a focus on light therapy. Nat. Sci. Sleep 2016, 8, 91–106. [Google Scholar] [CrossRef] [Green Version]
- Figueiro, M.G. Disruption of circadian rhythms by light during day and night. Curr. Sleep Med. Rep. 2017, 3, 76–84. [Google Scholar] [CrossRef] [PubMed]
- Figueiro, M.G.; Sahin, L.; Roohan, C.; Kalsher, M.; Plitnick, B.; Rea, M.S. Effects of red light on sleep inertia. Nat. Sci. Sleep 2019, 11, 45–57. [Google Scholar] [CrossRef] [Green Version]
- Figueiro, M.G.; Pedler, D. Red light: A novel, non-pharmacological intervention to promote alertness in shift workers. J. Saf. Res. 2020, 74, 169–177. [Google Scholar] [CrossRef] [PubMed]
- Figueiro, M.G.; Steverson, B.; Heerwagen, J.; Kampschroer, K.; Hunter, C.M.; Gonzales, K.; Plitnick, B.; Rea, M.S. The impact of daytime light exposure on sleep and mood in office workers. Sleep Health 2017, 3, 204–215. [Google Scholar] [CrossRef] [PubMed]
- Figueiro, M.G.; Kalsher, M.; Steverson, B.C.; Heerwagen, J.; Kampschroer, K.; Rea, M.S. Circadian-effective light and its impact on alertness in office workers. Light. Res. Technol. 2019, 51, 171–183. [Google Scholar] [CrossRef]
- Figueiro, M.G.; Gonzales, K.; Pedler, D.R. Designing with circadian stimulus. Light. Des. Appl. (LD+A) 2016, 8, 30–34. [Google Scholar]
- Figueiro, M.G.; Sahin, L.; Wood, B.; Plitnick, B. Light at night and measures of alertness and performance: Implications for shift workers. Biol. Res. Nurs. 2015, 18, 90–100. [Google Scholar] [CrossRef]
- Sahin, L.; Wood, B.M.; Plitnick, B.; Figueiro, M.G. Daytime light exposure: Effects on biomarkers, measures of alertness, and performance. Behav. Brain Res. 2014, 274, 176–185. [Google Scholar] [CrossRef] [PubMed]
- Figueiro, M.G.; Sahin, L.; Kalsher, M.; Plitnick, B.; Rea, M.S. Long-term, all-day exposure to circadian-effective light improves sleep, mood, and behavior in persons with dementia. J. Alzheimer’s Dis. Rep. 2020, 4, 297–312. [Google Scholar] [CrossRef] [PubMed]
- CIE 015:2018. Colorimetry, 4th ed.; CIE Central Bureau: Vienna, Austria, 2018; Technical report. [Google Scholar] [CrossRef]
- DIN EN 12464-1. Licht und Beleuchtung—Beleuchtung von Arbeitsstätten—Teil 1: Arbeitsstätten in Innenräumen; Deutsches Institut für Normung e. V. (DIN): Berlin, Germany, 2011; Standard. [Google Scholar]
- SITECO GmbH. Interior Luminaires—Chapter 2: Linear Luminaires | Pendant Luminaires; SITECO: Traunreut, Germany, 2011; Available online: https://www2.siteco.de/fileadmin/downloads/catalogues/Austria/IL_02_LF_Pendelleuchten.pdf (accessed on 6 July 2021).
- Kobbert, J. Optimization of Automotive Light Distributions for Different Real Life Traffic Situations. Ph.D. Thesis, Technische Universität Darmstadt, Darmstadt, Germany, 2019. Available online: https://tuprints.ulb.tu-darmstadt.de/id/eprint/8382 (accessed on 30 June 2021).
- Zandi, B.; Lode, M.; Herzog, A.; Sakas, G.; Khanh, T.Q. PupilEXT: Flexible open-source platform for high-resolution pupillometry in vision research. Front. Neurosci. 2021, 15, 603. [Google Scholar] [CrossRef] [PubMed]
- Brown, T.M. Melanopic illuminance defines the magnitude of human circadian light responses under a wide range of conditions. J. Pineal Res. 2020, 69, e12655. [Google Scholar] [CrossRef] [PubMed] [Green Version]
- Kolberg, E.; Pallesen, S.; Hjetland, G.J.; Nordhus, I.H.; Thun, E.; Flo-Groeneboom, E. Insufficient melanopic equivalent daylight illuminance in nursing home dementia units across seasons and gaze directions. Light. Res. Technol. 2021. [Google Scholar] [CrossRef]
Figure 1.
Measurement setup. (A) Luminance imaging photometer LMK-5 color with fisheye lens (right) and CSS-45 radiometer sensor (left) mounted both to the same camera tripod; (B) alignment of the measurement setup for assessing the NIF impact of the illumination of a typical display workplace and its surroundings.

Figure 2.
Geolocation (left) and image representation (right) of the institutional building. The various office workplaces serving as examples to evaluate the proposed methodology for spatially-resolved light measurements are all located on the 2nd floor given by the uppermost row of windows shown on the right.

Figure 3.
Room layout and luminaire positions (yellow-shaded rectangles) of the 2nd floor offices of the Laboratory of Lighting Technology at TU Darmstadt. Nine different workplaces were selected to perform the spatially resolved light measurements as proposed in this work. Workplaces #1–8 were measured on a cloudy day between 12:00 p.m. and 1:00 p.m., whereas workplace #9 was measured in the evening of the same day at 6:00 p.m.

Figure 4.
Image representation and light emission characteristics expressed in terms of a polar luminous intensity graph of the Quadrature 5MQ238D2H pendant office luminaires installed in the test offices. Additionally tabulated are the expected luminance values for different viewing angles, Unified Glare Rating (UGR) estimates, as well as the luminaire efficiency including a breakdown of direct/indirect contributions [100].

Figure 5.
Masking possibilities for the calculation considered in this work. (A) Half-space geometry; (B) field of view definition of CIE S 026:2018 [15]; (C) field of view of an assumed 120 observer.
Figure 5.
Masking possibilities for the calculation considered in this work. (A) Half-space geometry; (B) field of view definition of CIE S 026:2018 [15]; (C) field of view of an assumed 120 observer.


Table 1.
Illuminance and CS half-space estimates calculated from the CSS-45 spectroradiometric measurements and the spatially resolved output of the LMK-5 color imaging photometer. Additionally tabulated are the corresponding error estimates and .
Table 1.
Illuminance and CS half-space estimates calculated from the CSS-45 spectroradiometric measurements and the spatially resolved output of the LMK-5 color imaging photometer. Additionally tabulated are the corresponding error estimates and .
| CSS-45 | LMK 5 Color | |||||
|---|---|---|---|---|---|---|
| Workplace | in lux | in lux | in % | |||
| #1 | 372.4 | 0.359 | 373.9 | 0.351 | 0.40 | 0.008 |
| #2 | 414.3 | 0.379 | 418.8 | 0.373 | 1.09 | 0.006 |
| #3 | 372.7 | 0.342 | 362.8 | 0.326 | 2.66 | 0.016 |
| #4 | 370.0 | 0.343 | 371.1 | 0.331 | 0.30 | 0.012 |
| #5 | 387.0 | 0.360 | 380.6 | 0.350 | 1.65 | 0.010 |
| #6 | 399.4 | 0.370 | 394.9 | 0.358 | 1.13 | 0.012 |
| #7 | 421.8 | 0.372 | 414.4 | 0.364 | 1.75 | 0.008 |
| #8 | 389.7 | 0.350 | 384.9 | 0.339 | 1.23 | 0.011 |
| #9 | 257.3 | 0.247 | 268.3 | 0.232 | 4.28 | 0.015 |
| average | 383.7 | 0.351 | 381.7 | 0.340 | 1.61 | 0.011 |
| SD | 39.9 | 0.032 | 36.5 | 0.034 | 1.23 | 0.003 |
Table 2.
Comparison of the illuminance and CS values calculated from the spatially resolved light measurements for the different FOV definitions, i.e., a half-space geometry, an assumed 120 observer, and the FOV definition of CIE S 026:2018.
Table 2.
Comparison of the illuminance and CS values calculated from the spatially resolved light measurements for the different FOV definitions, i.e., a half-space geometry, an assumed 120 observer, and the FOV definition of CIE S 026:2018.
| Workplace | in lux | in lux | in lux | |||
|---|---|---|---|---|---|---|
| #1 | 373.9 | 223.1 | 229.9 | 0.351 | 0.267 | 0.271 |
| #2 | 418.8 | 256.0 | 245.6 | 0.373 | 0.289 | 0.285 |
| #3 | 362.8 | 218.6 | 203.4 | 0.326 | 0.239 | 0.225 |
| #4 | 371.1 | 235.5 | 189.2 | 0.331 | 0.256 | 0.221 |
| #5 | 380.6 | 242.1 | 217.5 | 0.350 | 0.269 | 0.254 |
| #6 | 394.9 | 244.0 | 240.9 | 0.358 | 0.271 | 0.269 |
| #7 | 414.4 | 241.5 | 235.0 | 0.364 | 0.268 | 0.264 |
| #8 | 384.9 | 200.1 | 202.1 | 0.339 | 0.223 | 0.224 |
| #9 | 268.3 | 155.0 | 158.6 | 0.232 | 0.136 | 0.138 |
| average | 381.6 | 232.1 | 216.4 | 0.340 | 0.253 | 0.241 |
| SD | 36.5 | 27.4 | 23.3 | 0.034 | 0.037 | 0.036 |
Table 3.
Comparison of the illuminance and CS values calculated from the spatially resolved light measurements for the different FOV definitions and a non-zero tilt angle .
Table 3.
Comparison of the illuminance and CS values calculated from the spatially resolved light measurements for the different FOV definitions and a non-zero tilt angle .
| Workplace | in lux | in lux | in lux | |||
|---|---|---|---|---|---|---|
| #1 | 324.4 | 192.0 | 185.7 | 0.325 | 0.242 | 0.237 |
| #2 | 353.8 | 223.7 | 212.5 | 0.342 | 0.270 | 0.262 |
| #3 | 306.3 | 178.0 | 191.4 | 0.293 | 0.206 | 0.211 |
| #4 | 314.7 | 169.0 | 190.7 | 0.301 | 0.210 | 0.222 |
| #5 | 317.4 | 195.7 | 186.6 | 0.316 | 0.238 | 0.230 |
| #6 | 334.6 | 205.3 | 185.3 | 0.326 | 0.246 | 0.229 |
| #7 | 338.7 | 203.0 | 188.5 | 0.324 | 0.242 | 0.229 |
| #8 | 305.8 | 158.8 | 151.4 | 0.295 | 0.193 | 0.183 |
| #9 | 269.9 | 148.6 | 149.1 | 0.234 | 0.129 | 0.127 |
| average | 318.4 | 186.0 | 182.4 | 0.306 | 0.220 | 0.214 |
| SD | 22.7 | 22.9 | 18.9 | 0.030 | 0.039 | 0.037 |
Publisher’s Note: MDPI stays neutral with regard to jurisdictional claims in published maps and institutional affiliations. |
© 2021 by the authors. Licensee MDPI, Basel, Switzerland. This article is an open access article distributed under the terms and conditions of the Creative Commons Attribution (CC BY) license (https://creativecommons.org/licenses/by/4.0/).
Share and Cite
MDPI and ACS Style
Babilon, S.; Beck, S.; Kunkel, J.; Klabes, J.; Myland, P.; Benkner, S.; Khanh, T.Q. Measurement of Circadian Effectiveness in Lighting for Office Applications. Appl. Sci. 2021, 11, 6936. https://doi.org/10.3390/app11156936
AMA Style
Babilon S, Beck S, Kunkel J, Klabes J, Myland P, Benkner S, Khanh TQ. Measurement of Circadian Effectiveness in Lighting for Office Applications. Applied Sciences. 2021; 11(15):6936. https://doi.org/10.3390/app11156936
Chicago/Turabian StyleBabilon, Sebastian, Sebastian Beck, Julian Kunkel, Julian Klabes, Paul Myland, Simon Benkner, and Tran Quoc Khanh. 2021. "Measurement of Circadian Effectiveness in Lighting for Office Applications" Applied Sciences 11, no. 15: 6936. https://doi.org/10.3390/app11156936
Note that from the first issue of 2016, this journal uses article numbers instead of page numbers. See further details here.