
A Randomized Controlled Trail for Comparing LED Color Temperature and Color Rendering Attributes in Different Illuminance Environments for Human-Centric Office Lighting

Abstract
:1. Introduction
2. Methods
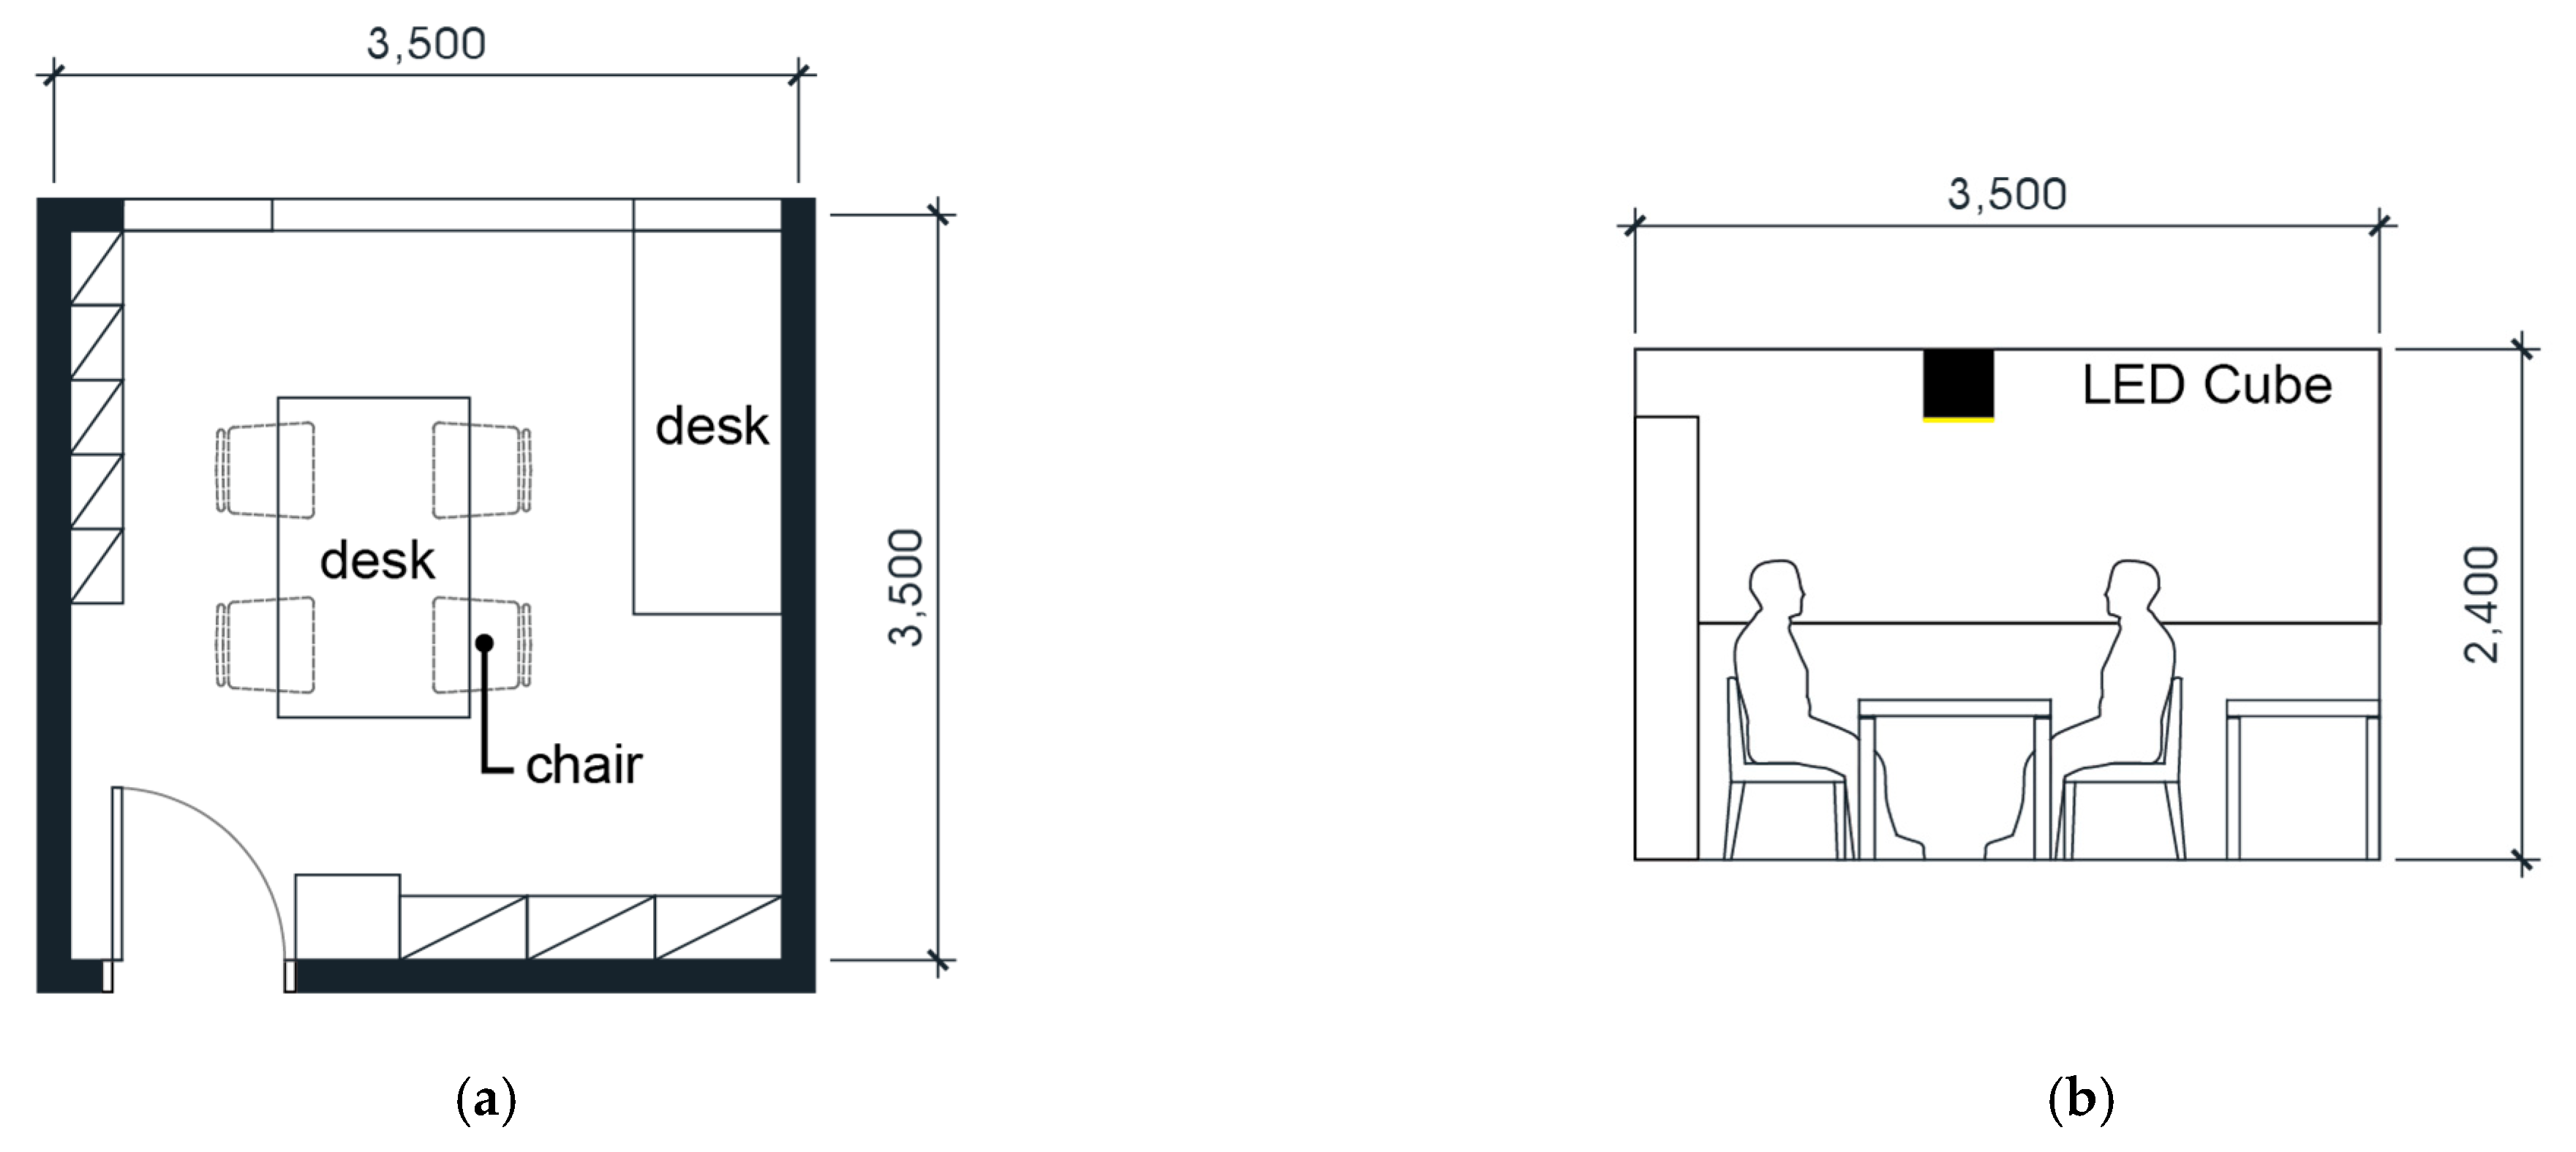
2.1. Experimental Setup
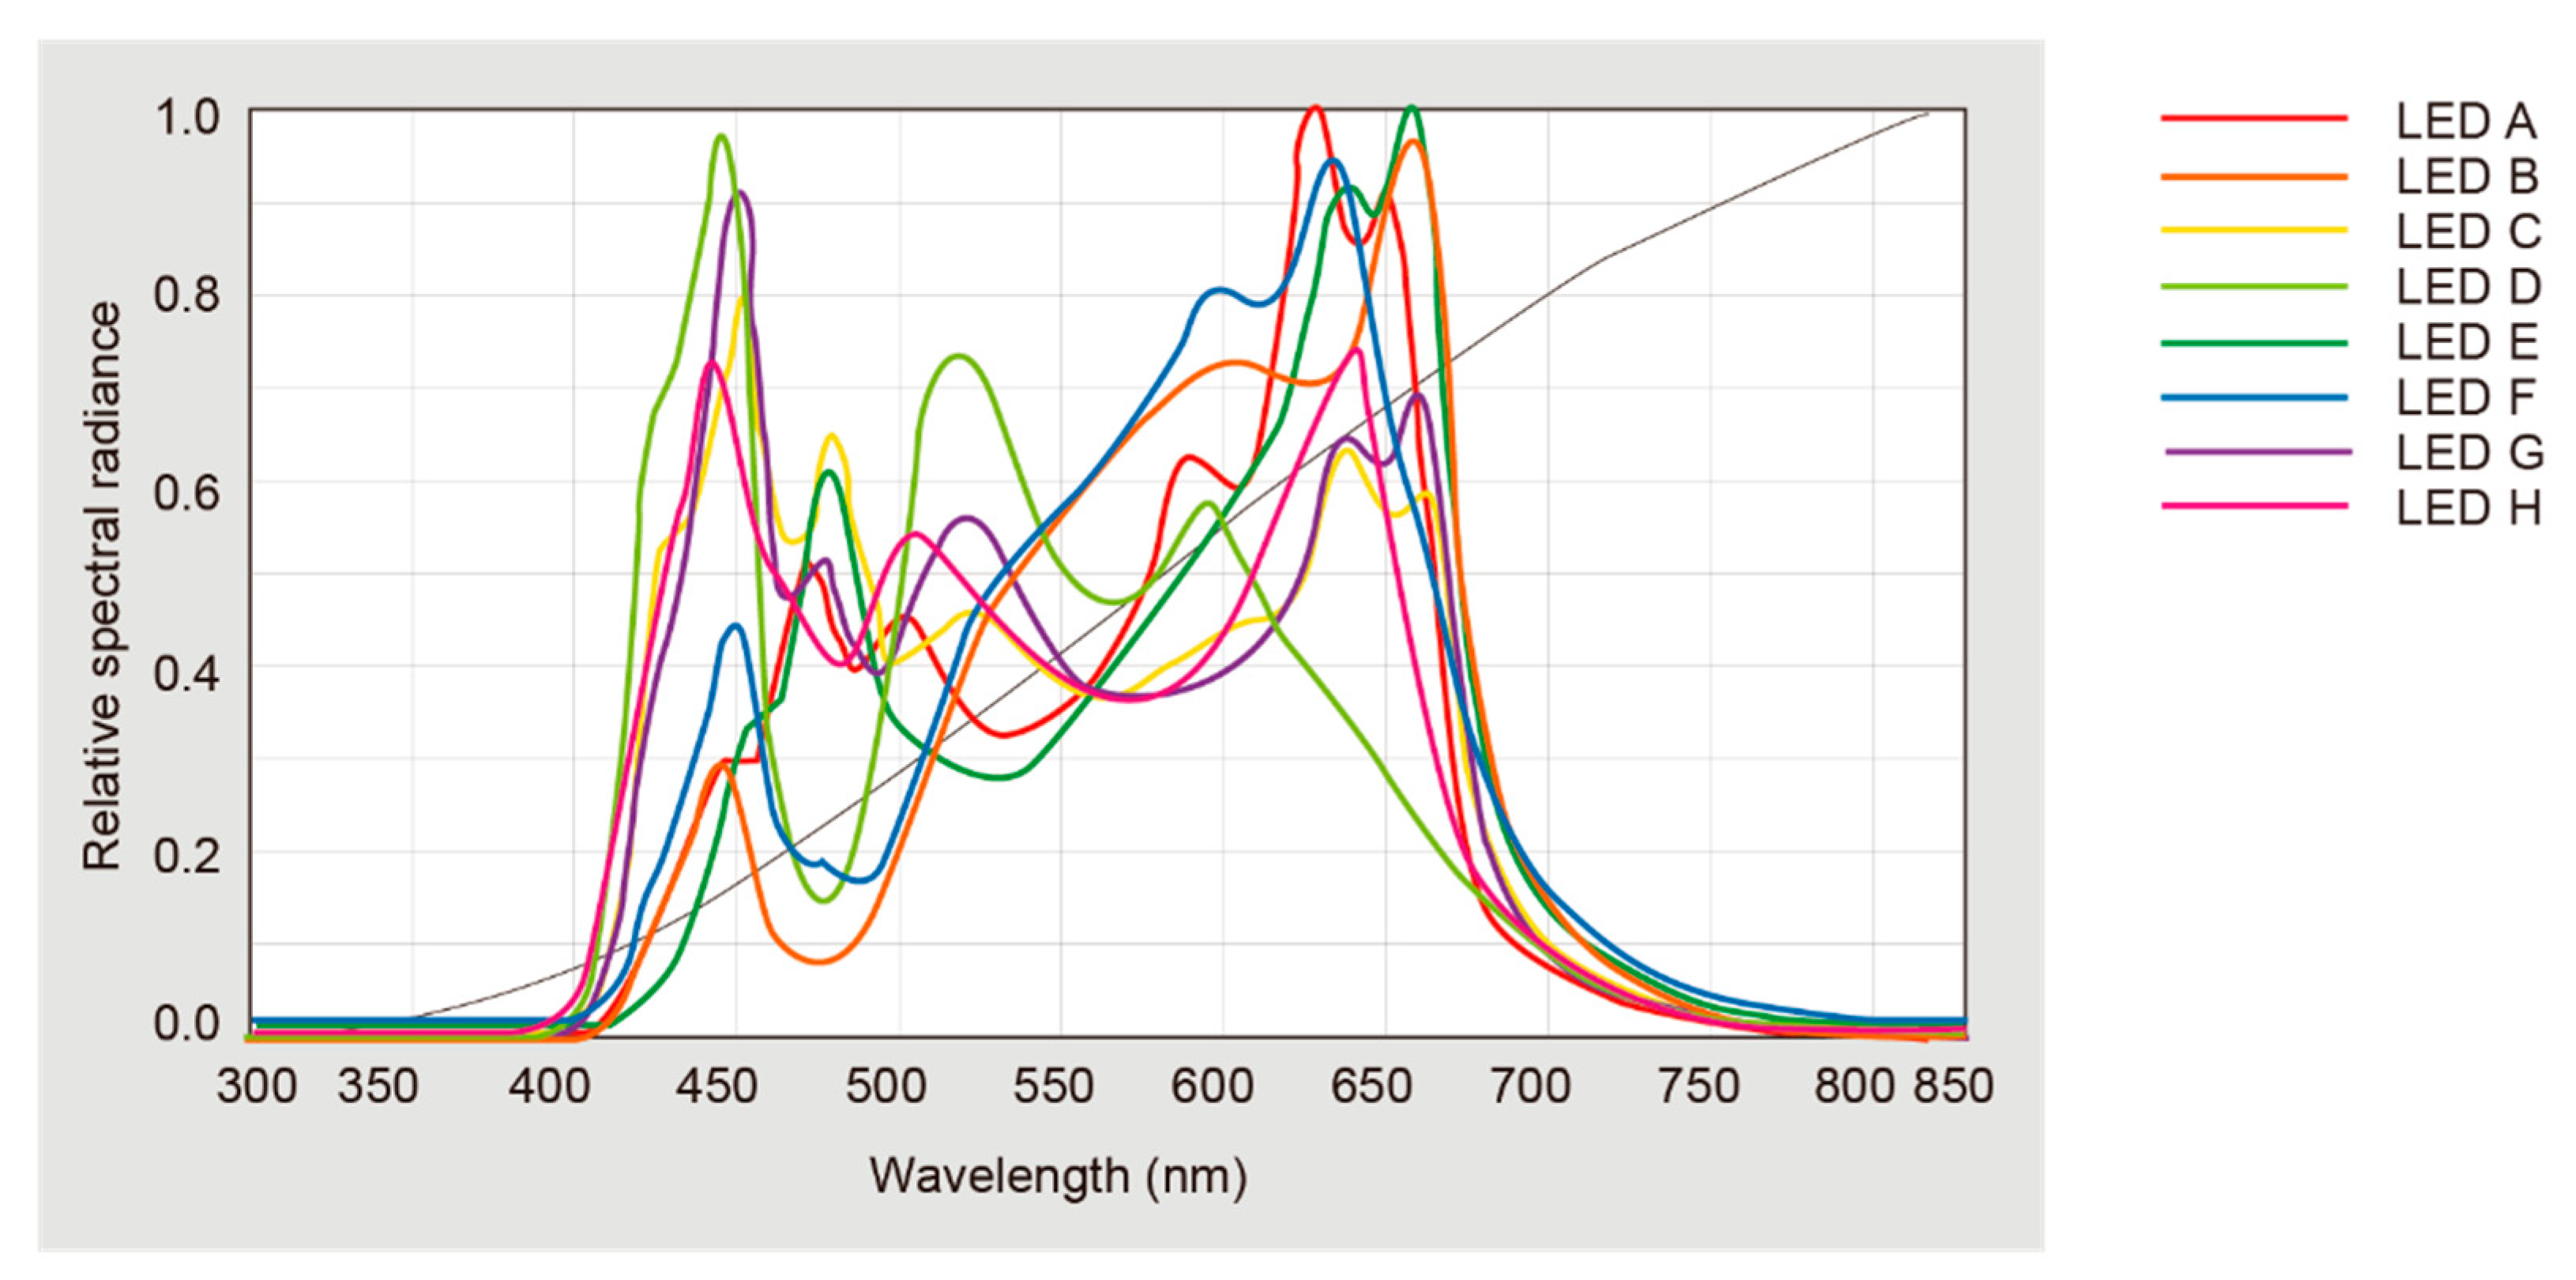
2.2. Lighting Settings
2.3. Participants
2.4. Reading Task
2.5. Questionnaire
2.6. Procedure
3. Results
3.1. Experiment 1: Illuminance 300 Lux
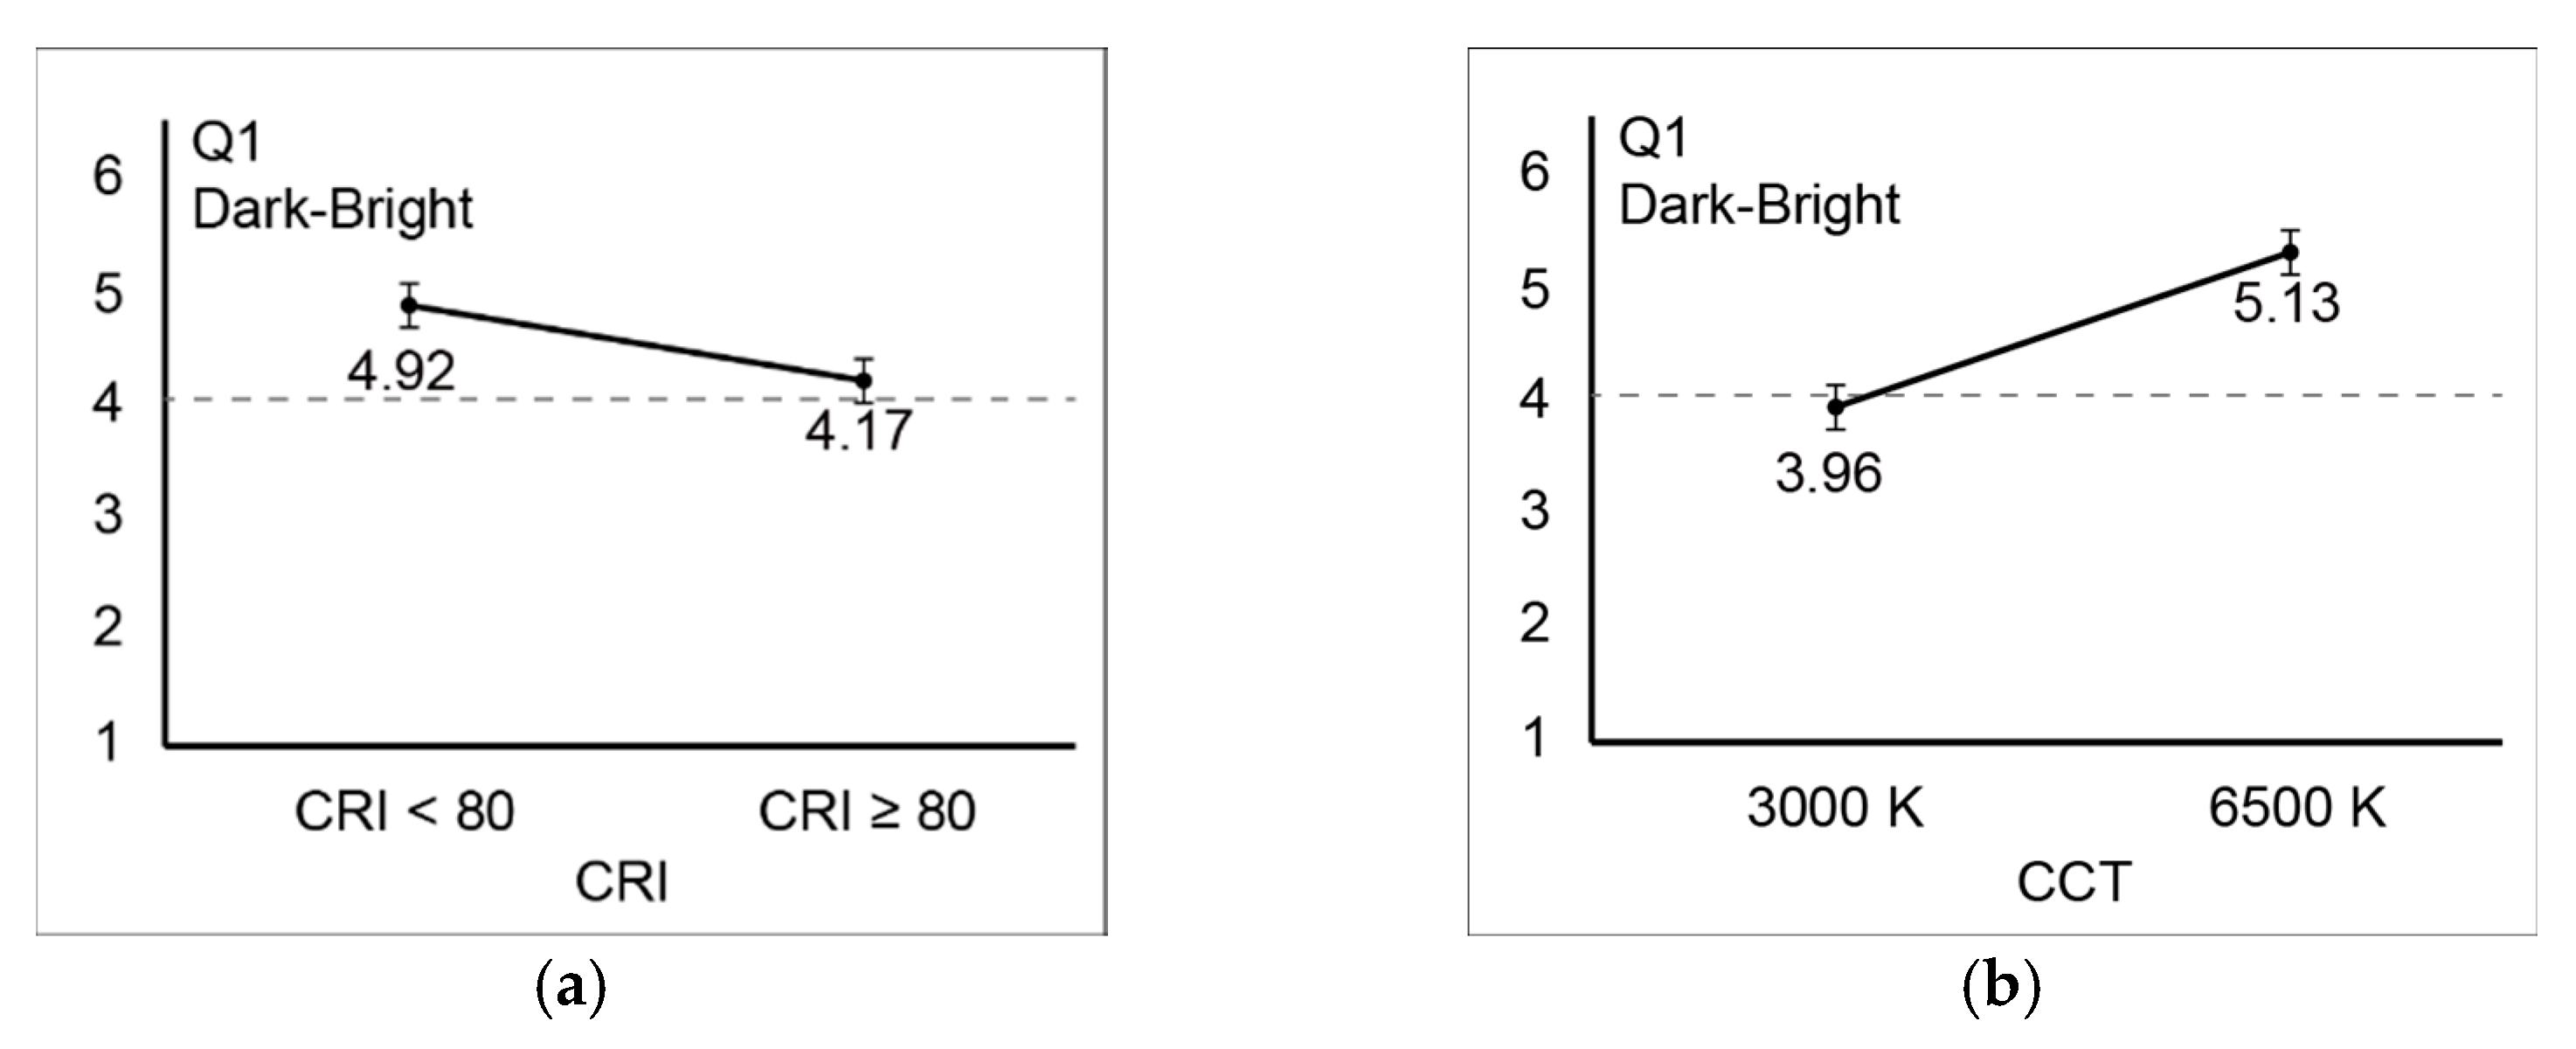
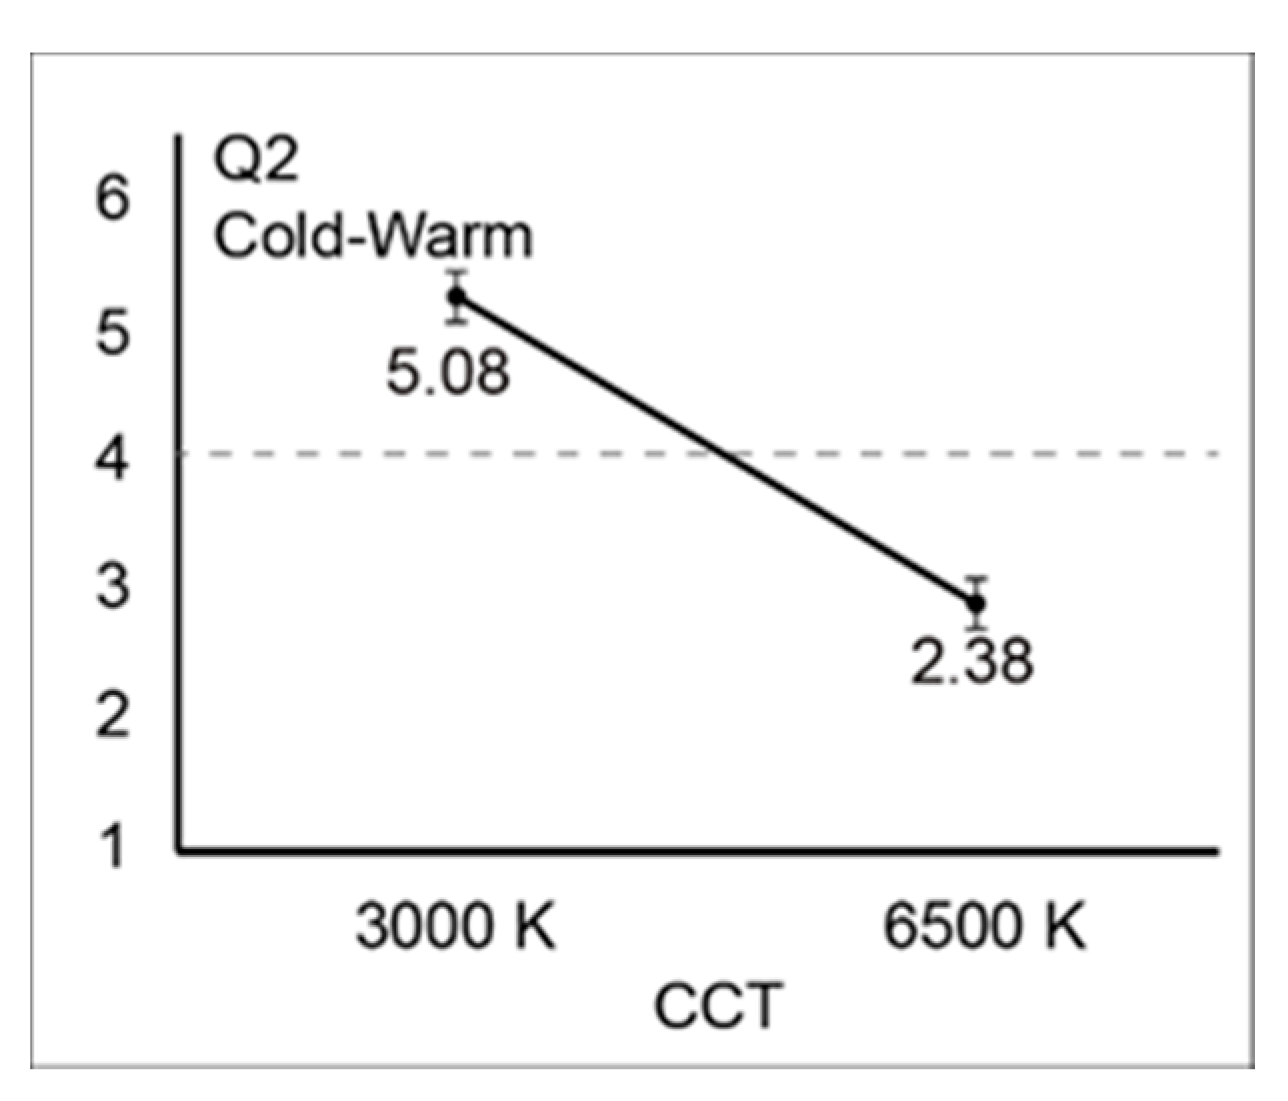
3.1.1. Light Appearance
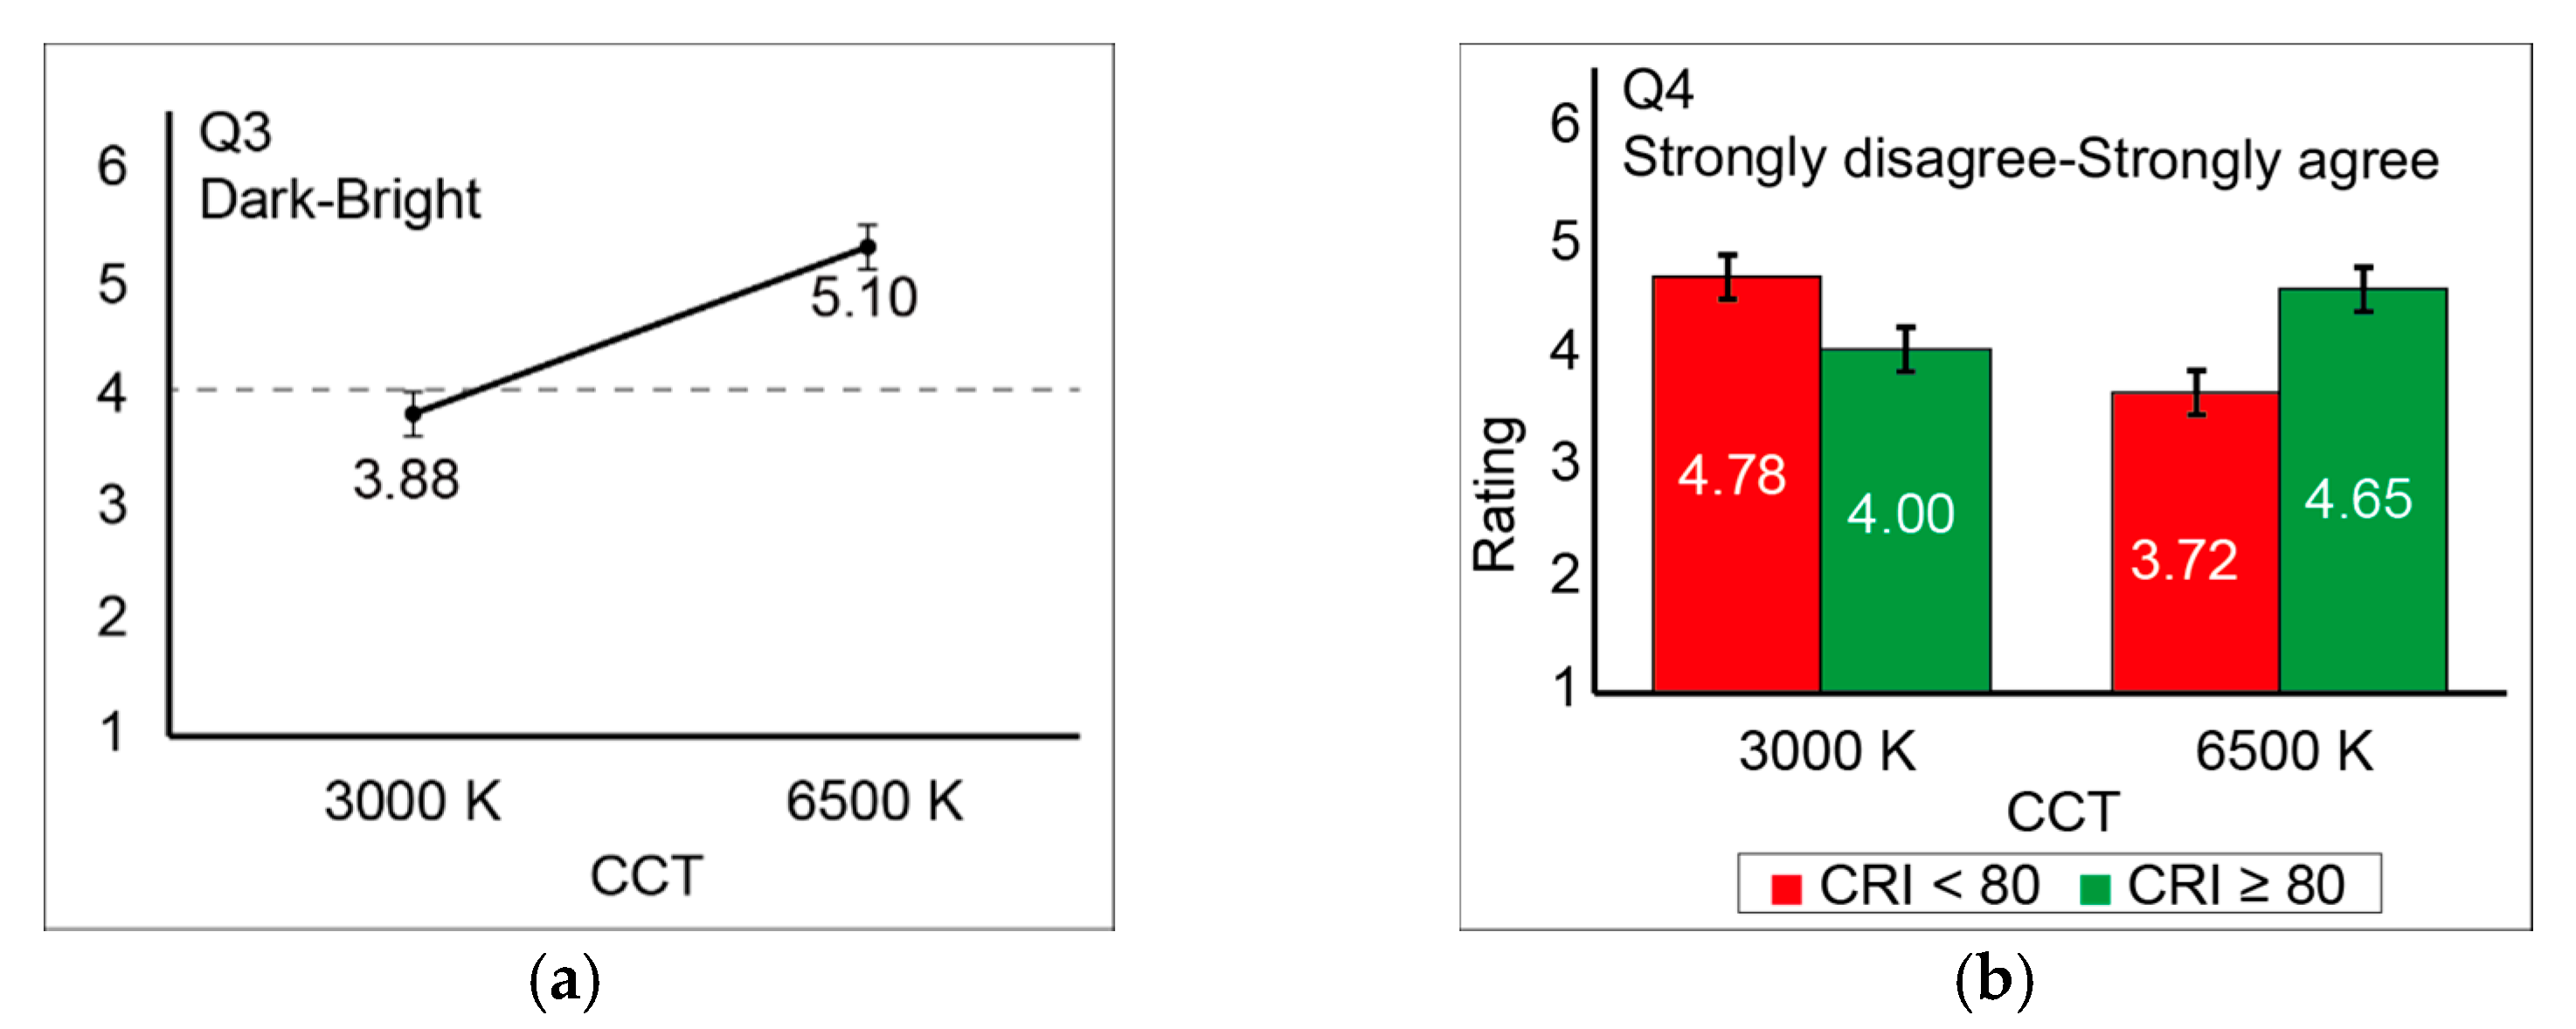
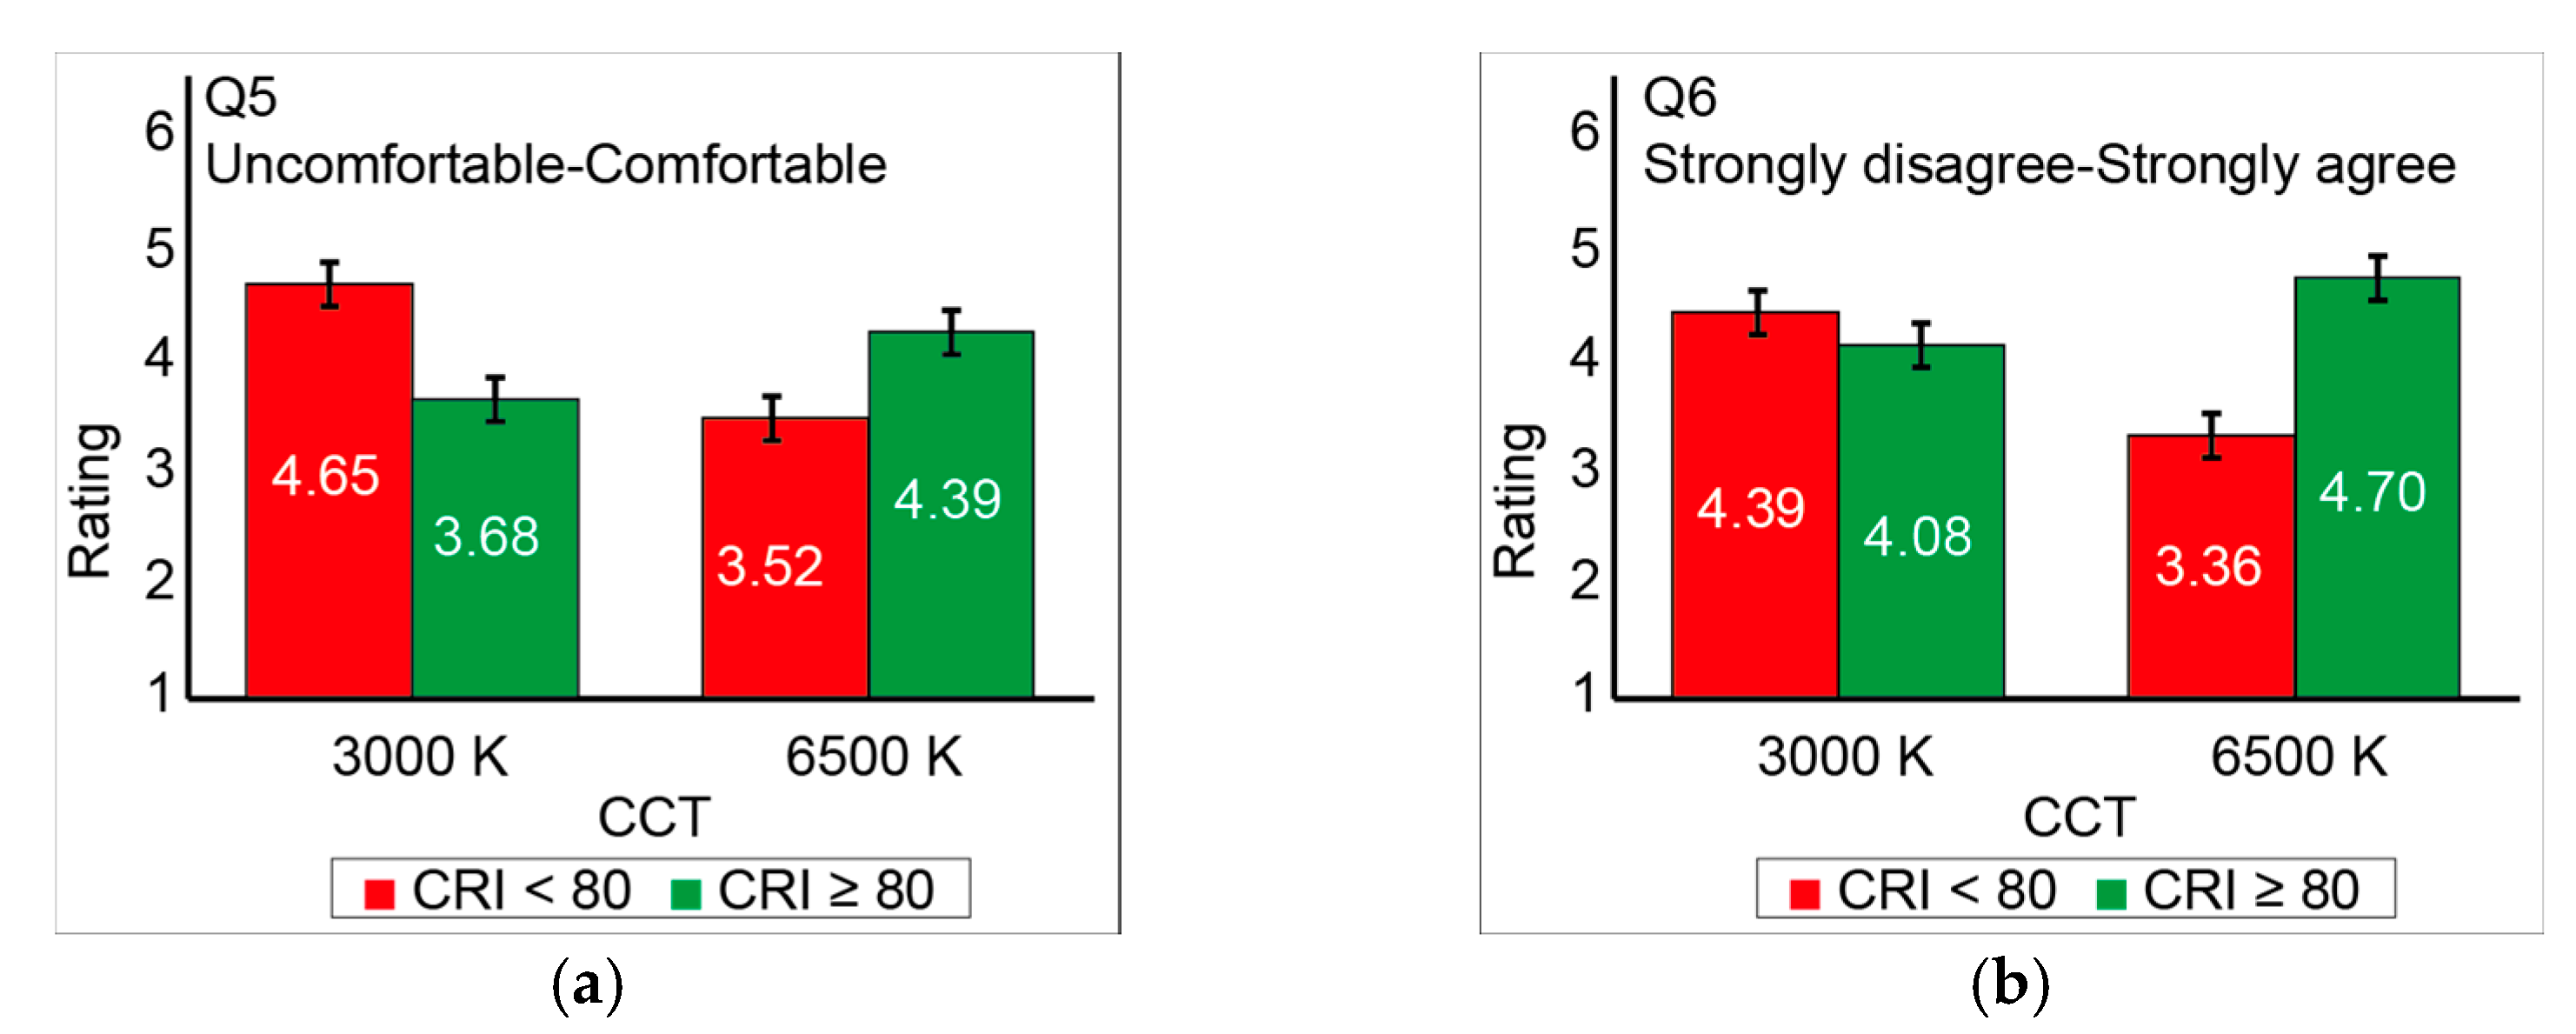
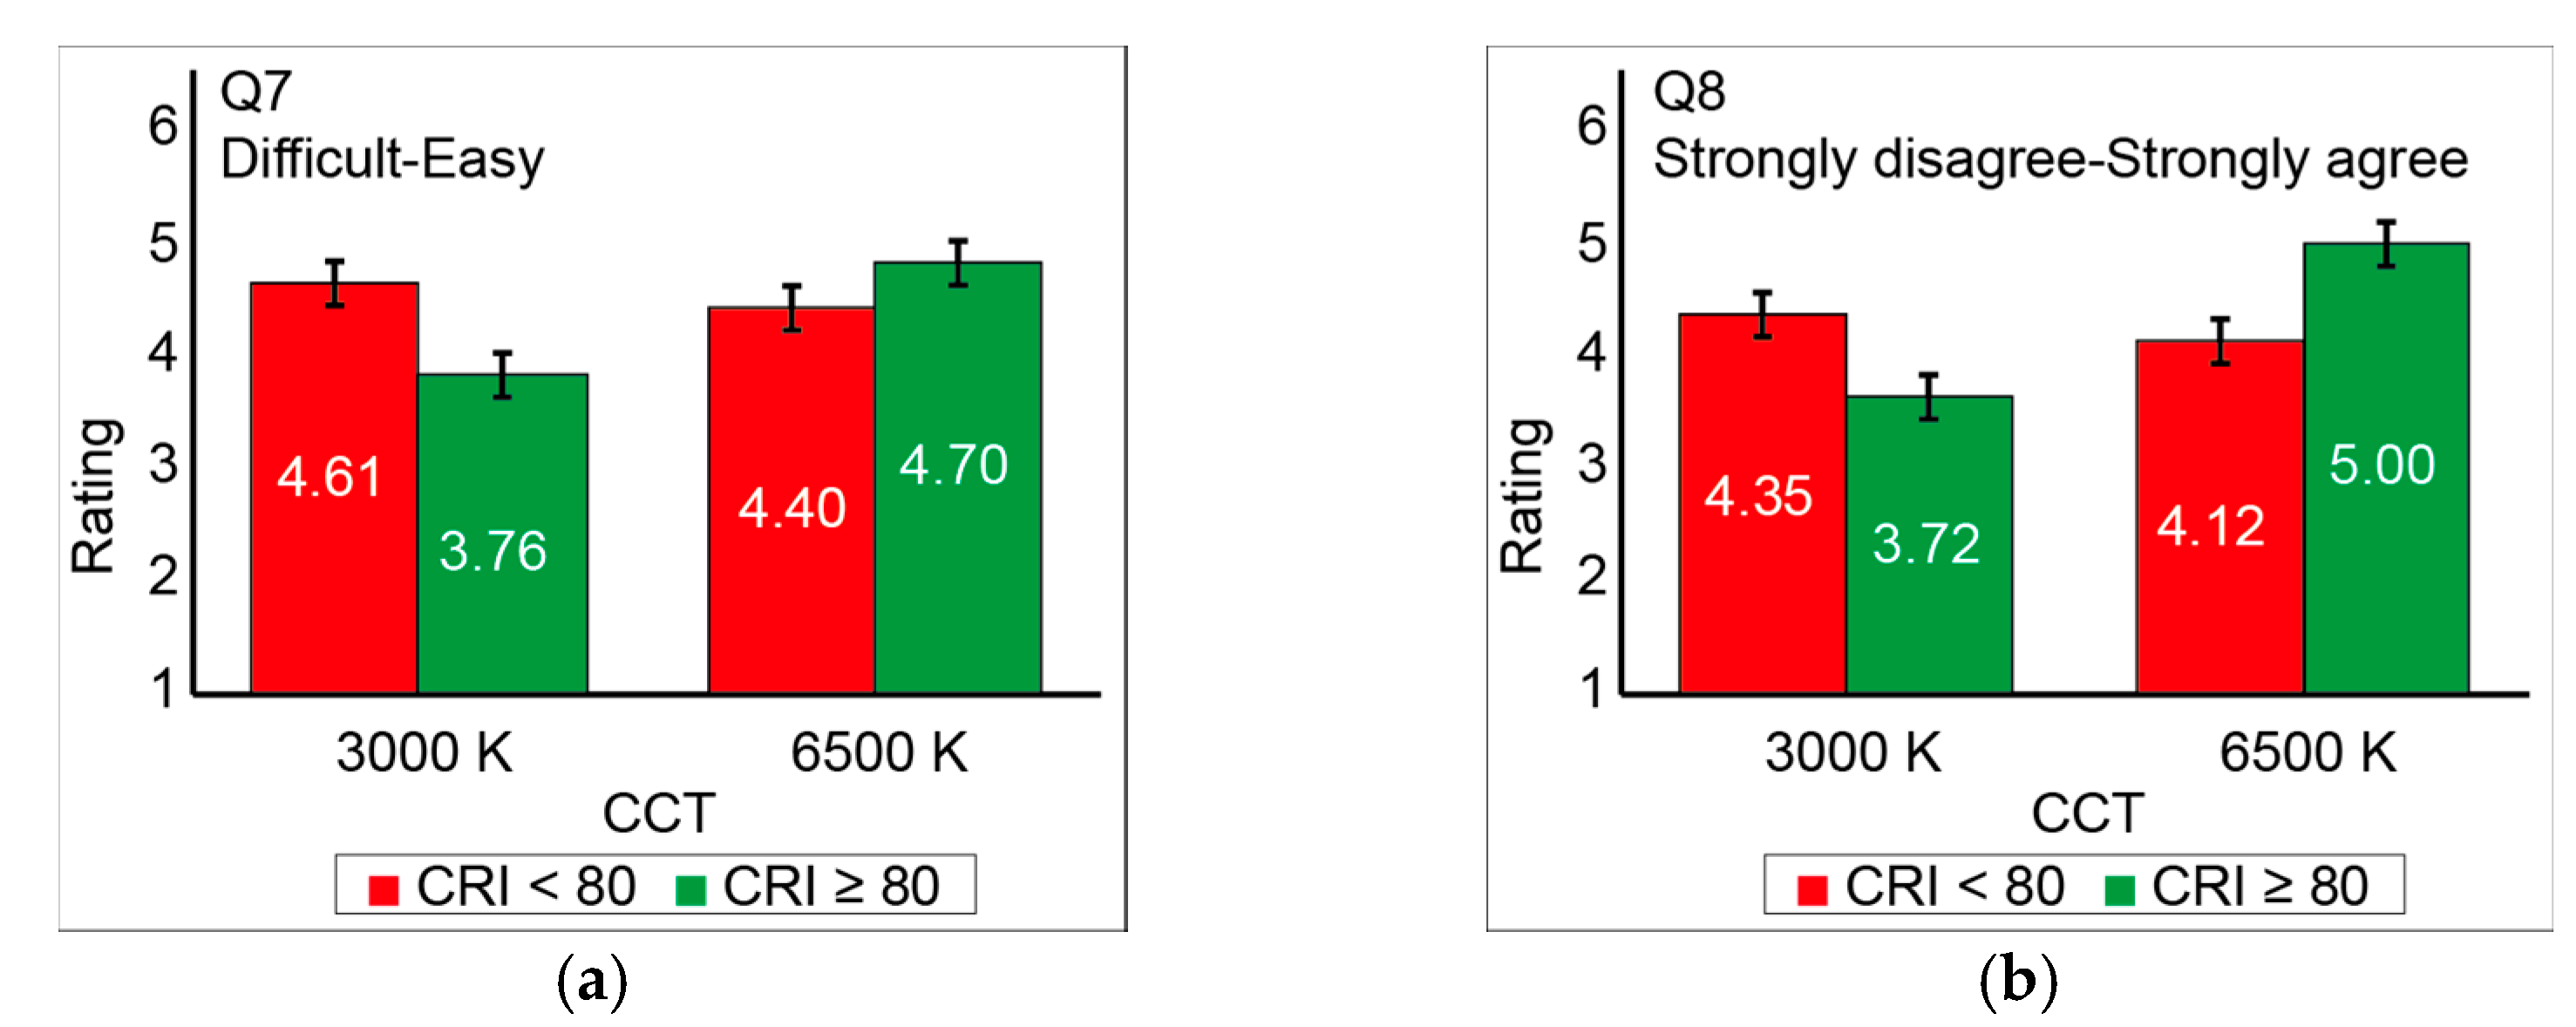
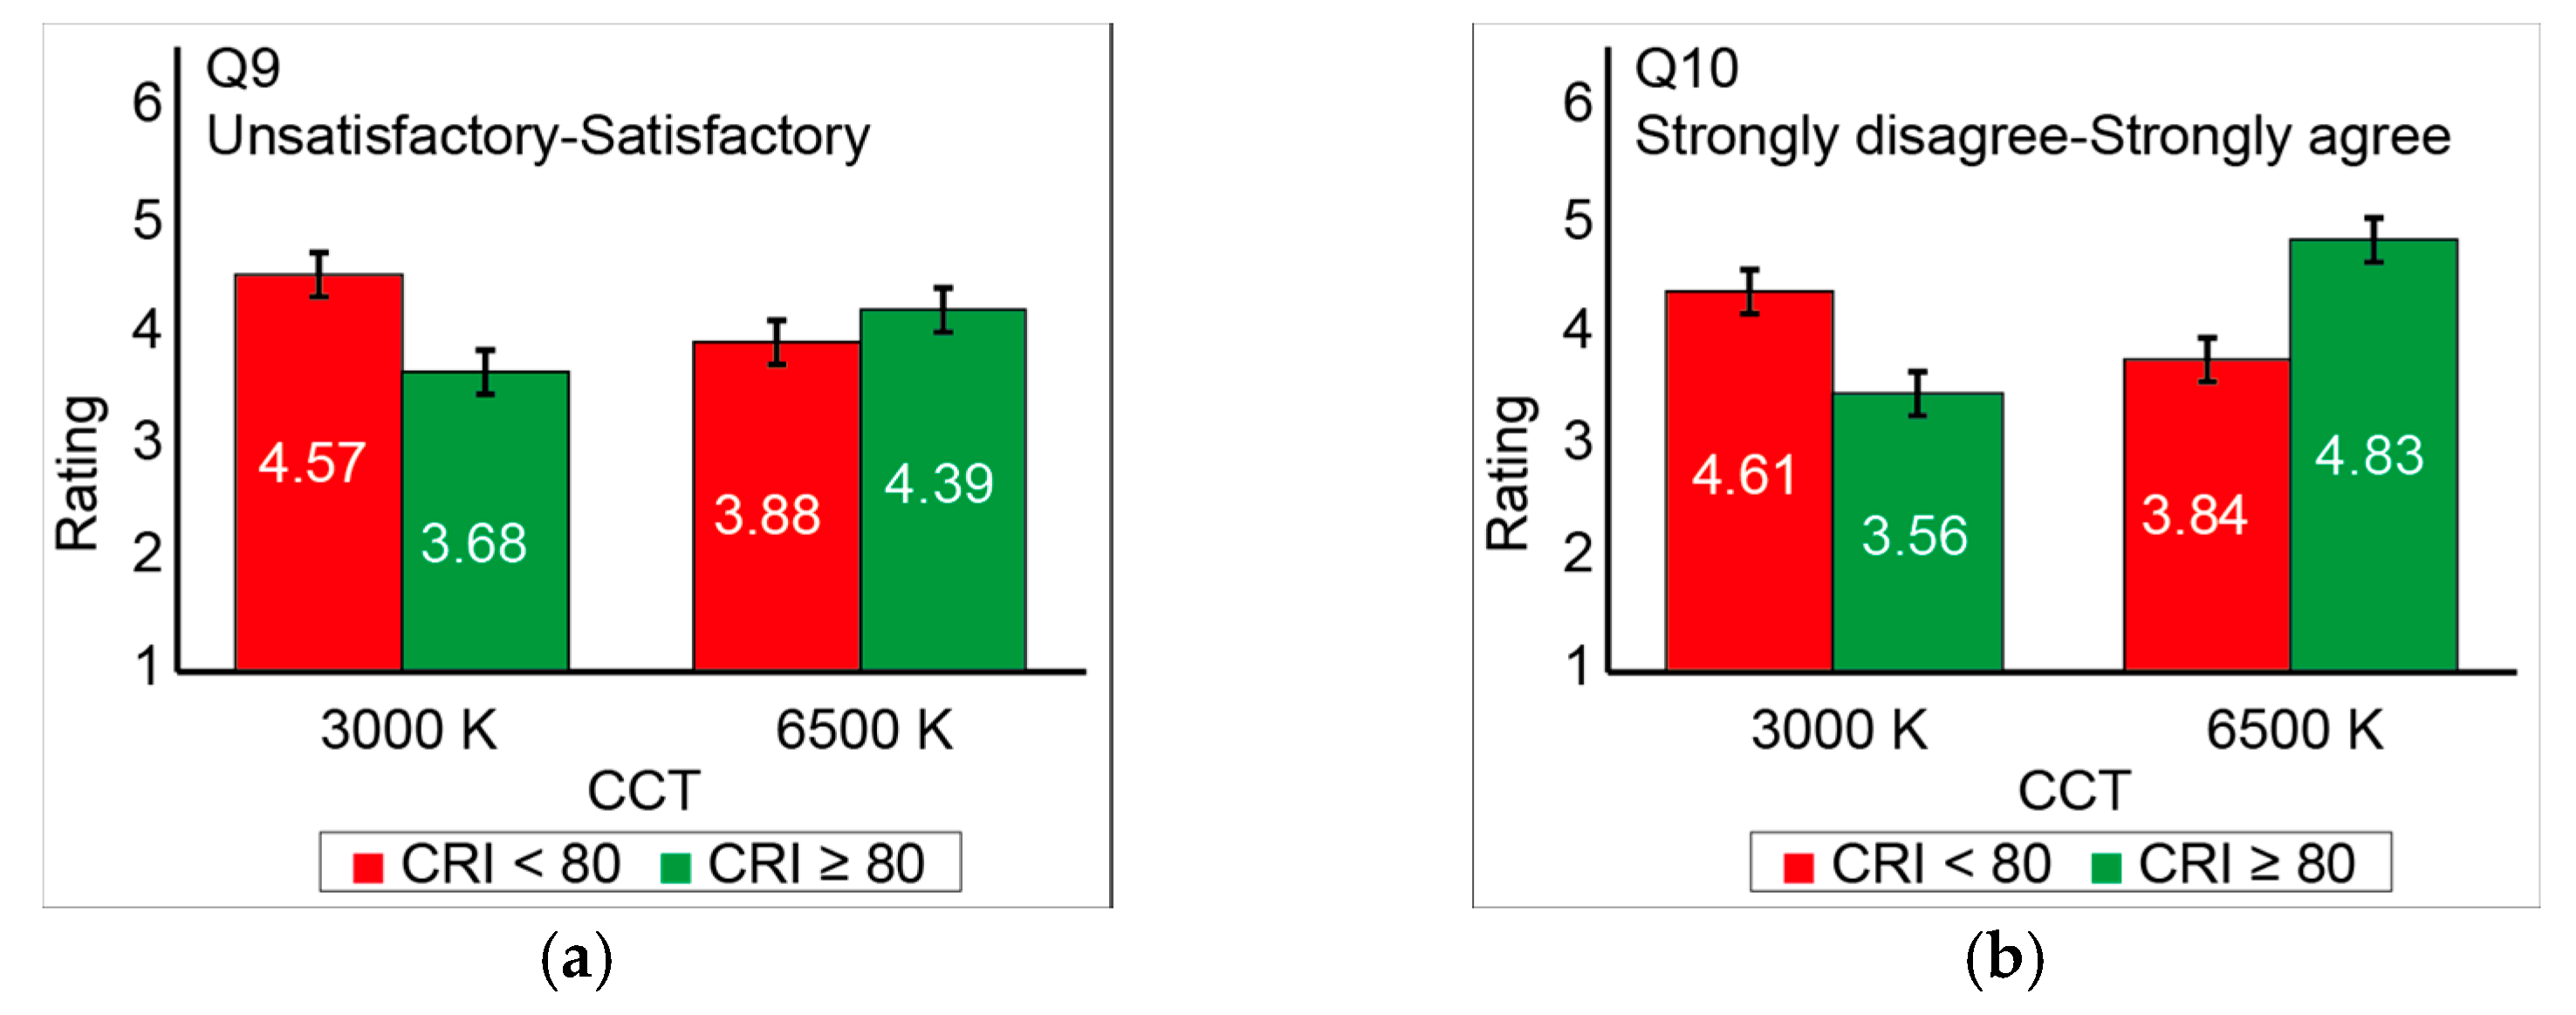
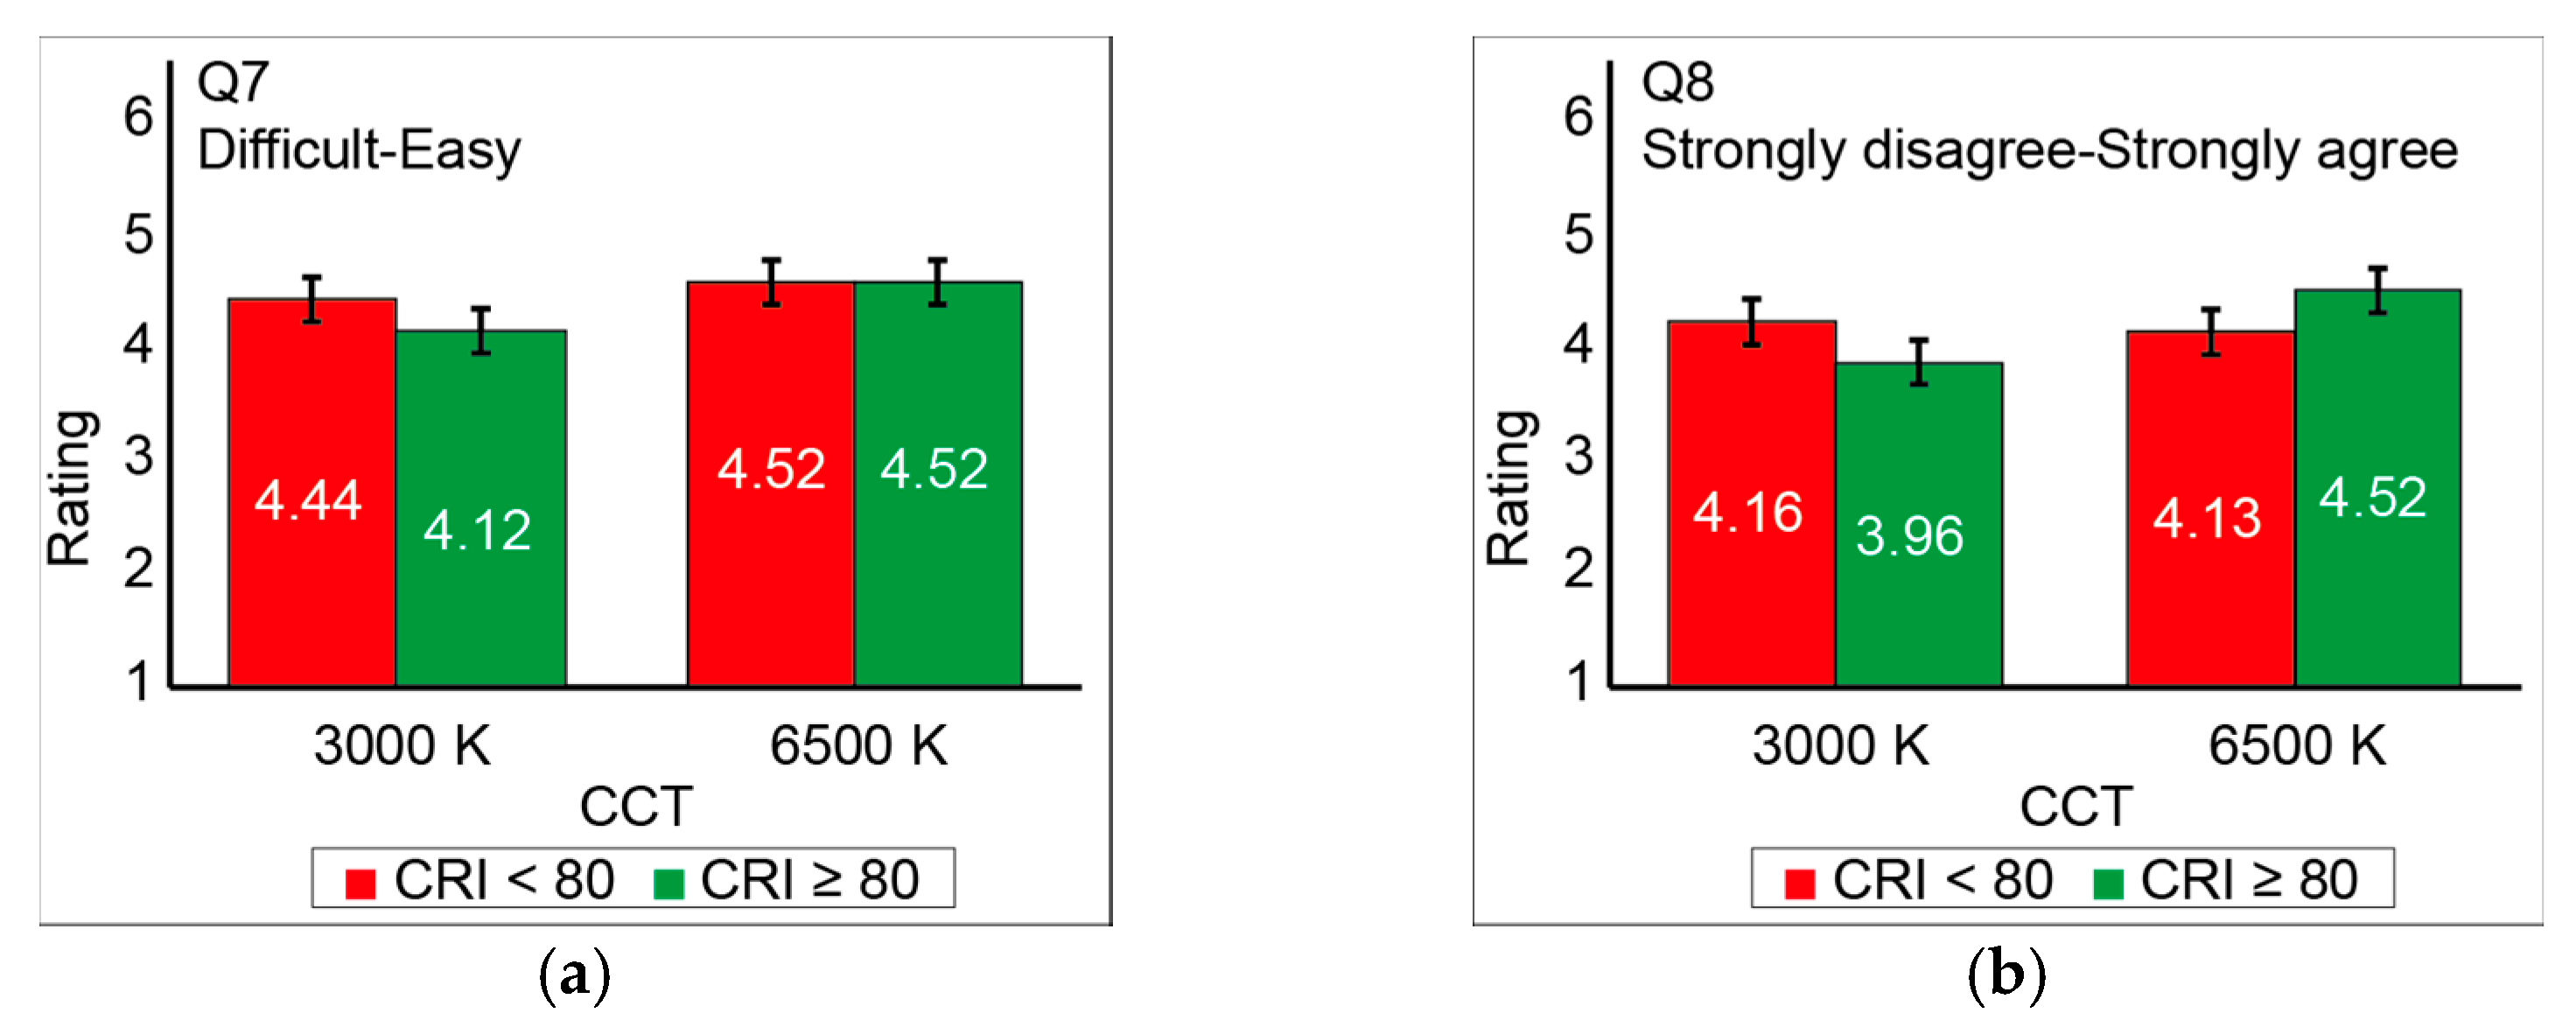
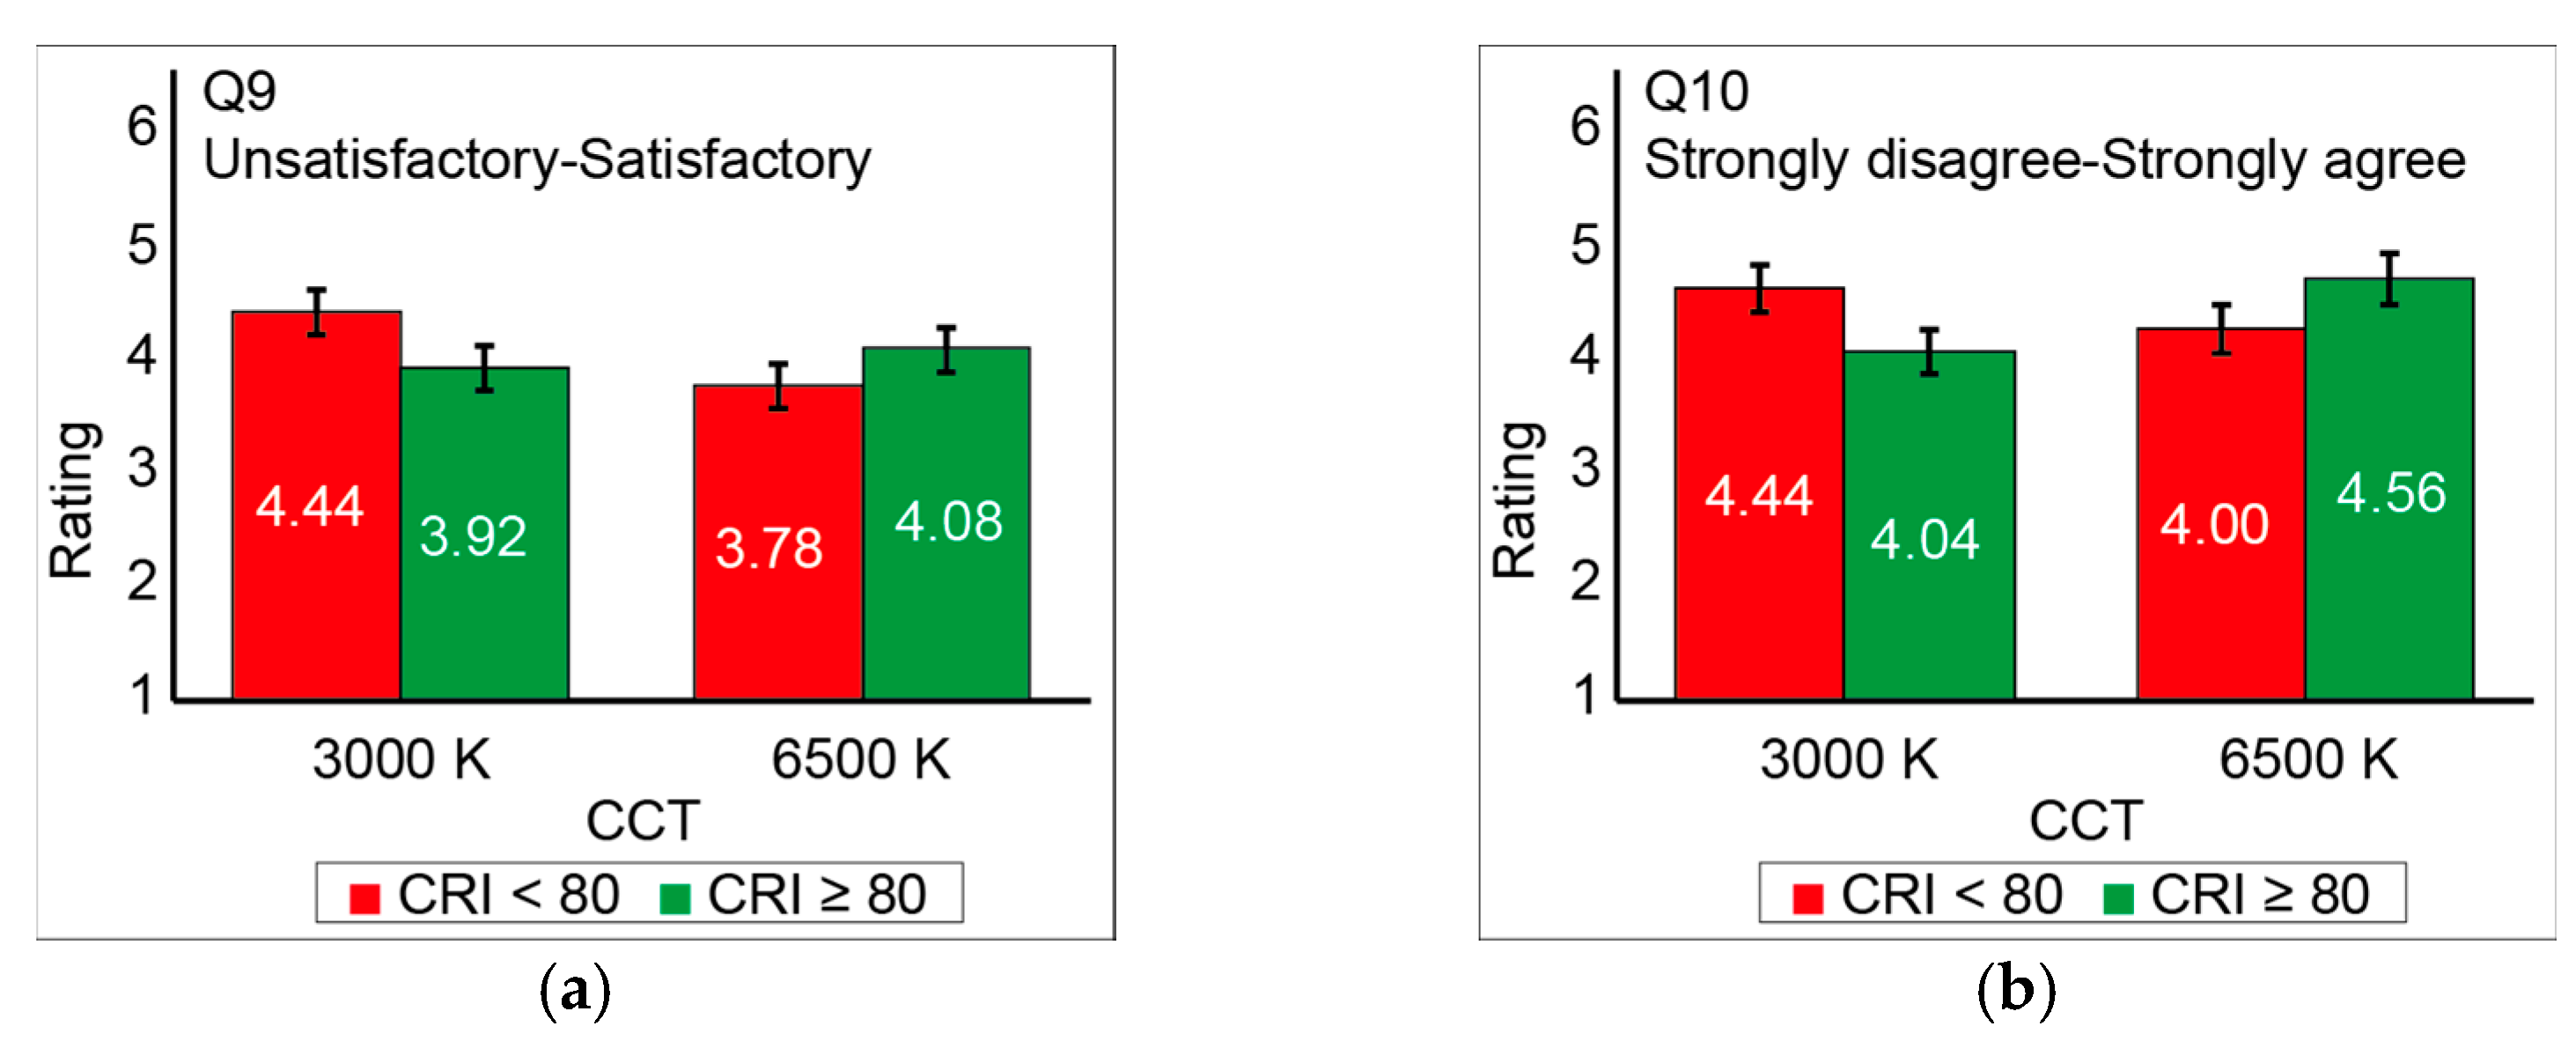
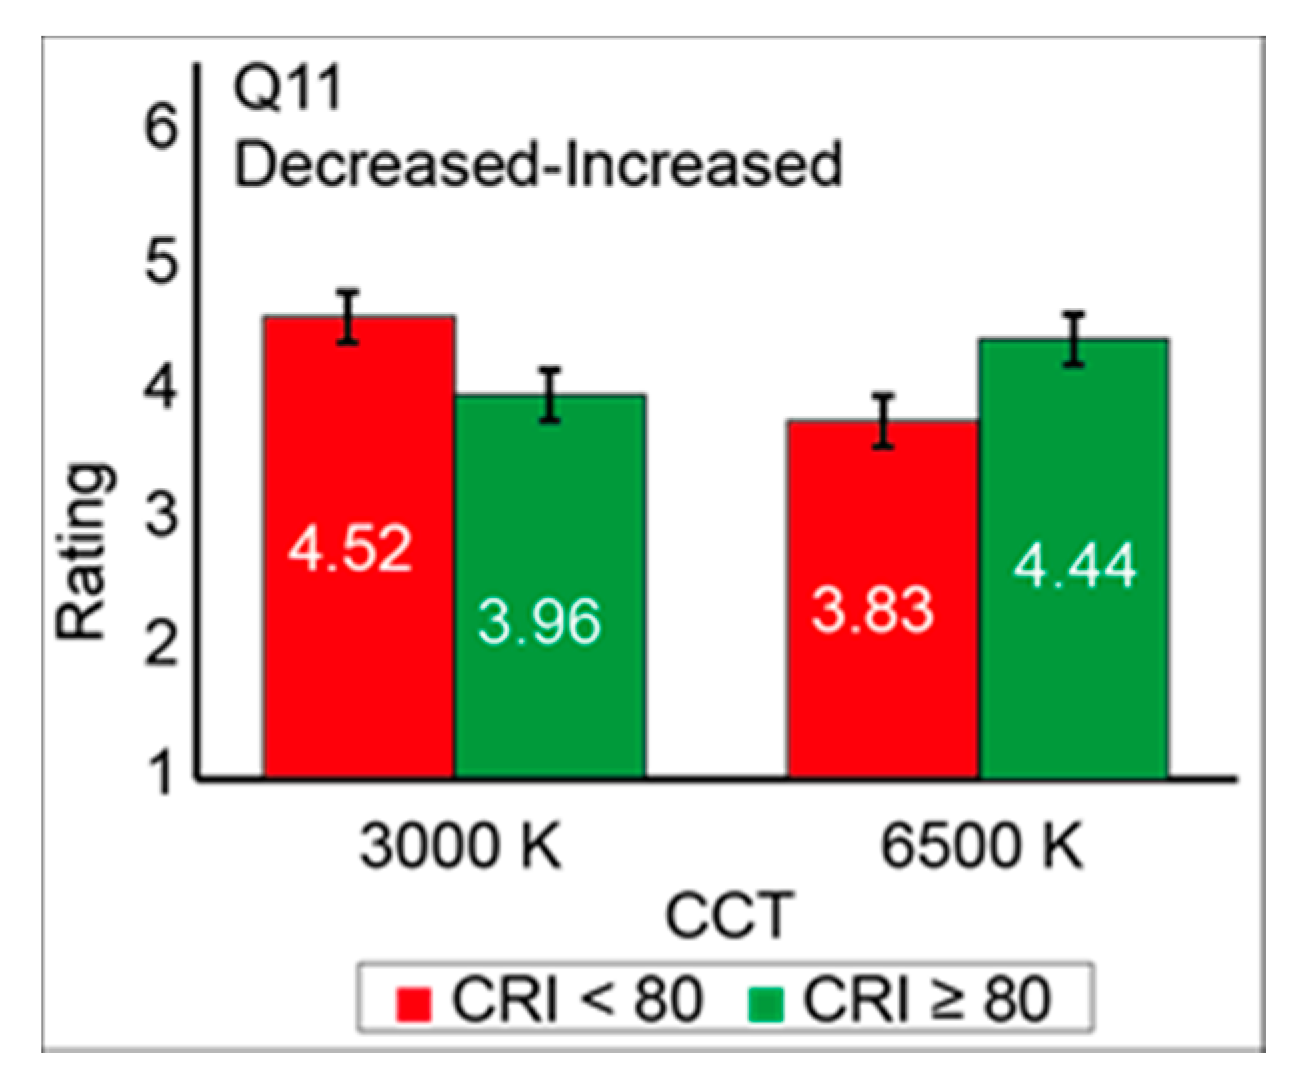
3.1.2. Brightness, Preference, Visual Comfort, Readability, Satisfaction, and Self-Reported Productivity
3.2. Experiment 2: Illuminance 500 Lux
3.2.1. Light Appearance
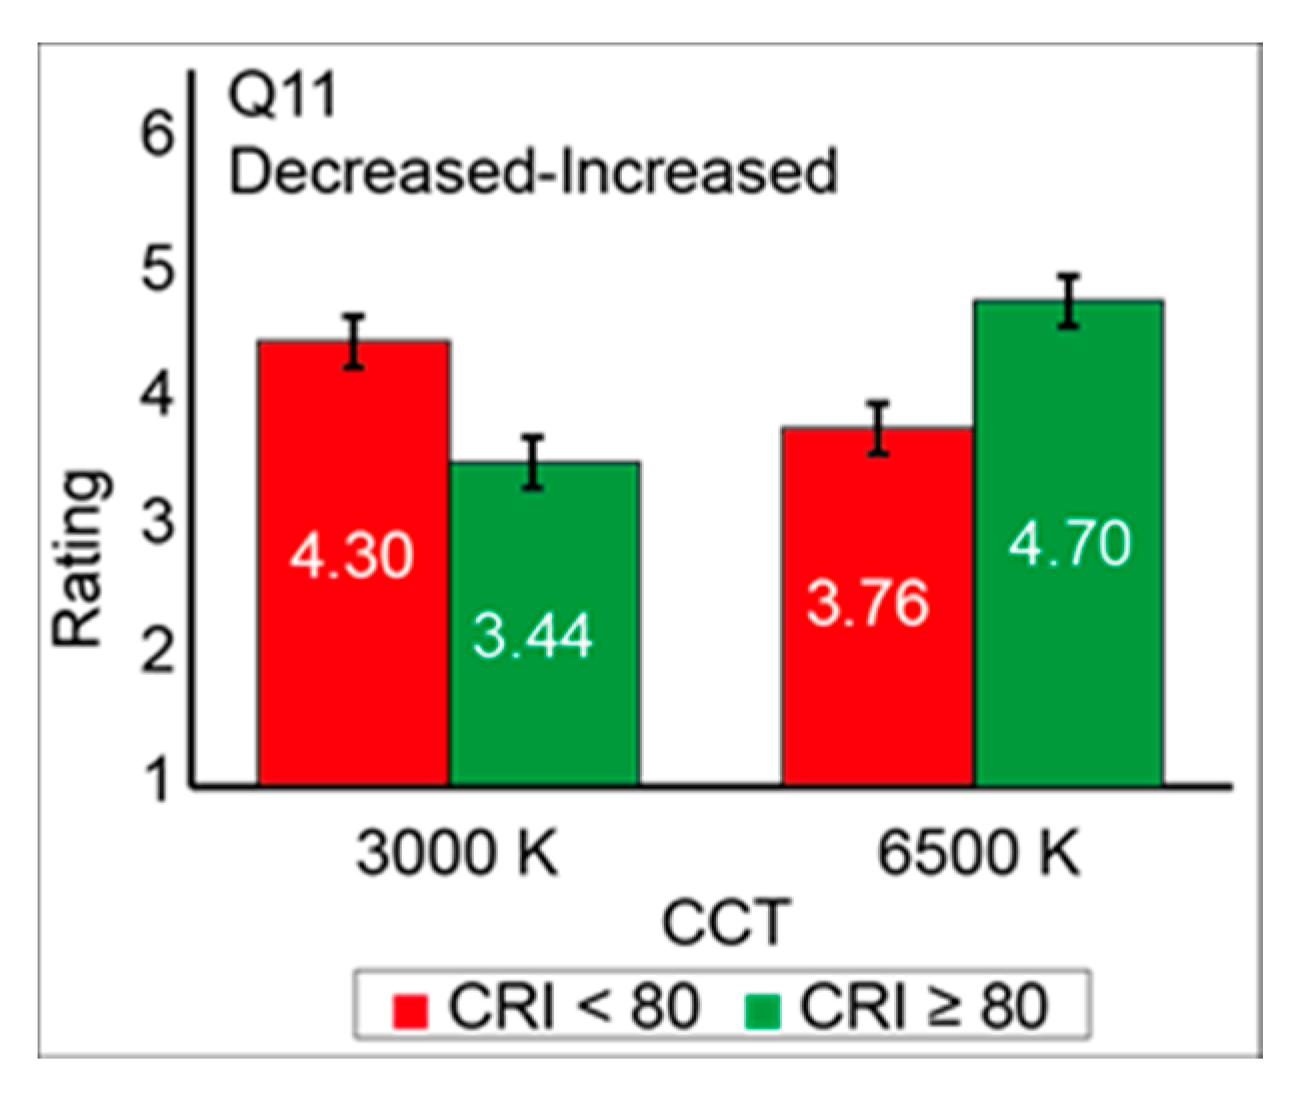
3.2.2. Brightness, Preference, Visual Comfort, Readability, Satisfaction, and Self-Reported Productivity
4. Discussion
5. Conclusions
Author Contributions
Funding
Data Availability Statement
Conflicts of Interest
References
- CIE. Position Statement on Non-Visual Effects of Light—Recommending Proper Light at the Proper Time, 2nd ed.; CIE Central Bureau: Vienna, Austria, 2019. [Google Scholar]
- Houser, K.; Boyce, P.; Zeitzer, J.; Herf, M. Human-centric lighting: Myth, magic or metaphor? Light. Res. Technol. 2020, 53, 97–118. [Google Scholar] [CrossRef]
- Berson, D.M.; Dunn, F.A.; Takao, M. Phototransduction by retinal ganglion cells that set the circadian clock. Science 2002, 295, 1070–1073. [Google Scholar] [CrossRef] [PubMed] [Green Version]
- Berson, D.M. Strange vision: Ganglion cells as circadian photoreceptors. Trends Neurosci. 2003, 26, 314–320. [Google Scholar] [CrossRef]
- IES. TM-18-18-Light and Human Health: An Overview of the Impact of Optical Radiation on Visual, Circadian, Neuroendocrine and Neurobehavioral Responses; IES: New York, NY, USA, 2018. [Google Scholar]
- Lucas, R.J.; Peirson, S.N.; Berson, D.M.; Brown, T.M.; Cooper, H.M.; Czeisler, C.A.; Figueiro, M.G.; Gamlin, P.D.; Lockley, S.W.; O’Hagan, J.B.; et al. Measuring and using light in the melanopsin age. Trends Neurosci. 2014, 37, 1–9. [Google Scholar] [CrossRef] [PubMed]
- CIE Central Bureau. CIE S 026:2018-CIE System for Metrology of Optical Radiation for ipRGC—Influenced Responses to Light; CIE Central Bureau: Vienna, Austria, 2018. [Google Scholar]
- Rea, M.S.; Figueiro, M.G.; Bierman, A.; Bullough, J.D. Circadian light. J. Circadian Rhythm. 2010, 8, 2. [Google Scholar] [CrossRef] [PubMed] [Green Version]
- Rea, M.S.; Figueiro, M.G.; Bierman, A.; Hamner, R. Modelling the spectral sensitivity of the human circadian system. Light. Res. Technol. 2012, 44, 386–396. [Google Scholar] [CrossRef]
- Neberich, M.; Opferkuch, F. Standardizing Melanopic Effects of Ocular Light for Ecological Lighting Design of Nonresidential Buildings—An Overview of Current Legislation and Accompanying Scientific Studies. Sustainability 2021, 13, 5131. [Google Scholar] [CrossRef]
- German Institute for Standardisation. DIN/TS 5031-100:2021, Optical Radiation Physics and Illuminating Engineering—Melanopic Effects of Ocular Light on Human Beings—Quantities, Symbols and Action Spectra; German Institute for Standardisation: Berlin, Germany, 2021. [Google Scholar]
- IWBI. WELL Building Standard. LIGHT. WELL v2. Q2 2021. Available online: https://standard.wellcertified.com/well (accessed on 27 August 2021).
- UL. Design Guidelines for Promoting Circadian Entrainment with Light for Day-Active People, 1st ed.; UL: Northbrook, IL, USA, 2020. [Google Scholar]
- Babilon, S.; Beck, S.; Kunkel, J.; Klabes, J.; Myland, P.; Benkner, S.; Khanh, T.Q. Measurement of Circadian Effectiveness in Lighting for Office Applications. Appl. Sci. 2021, 11, 6936. [Google Scholar] [CrossRef]
- Smolders, K.C.H.J.; De Kort, Y.A.W.; Cluitmans, P.J.M. Higher light intensity induces modulations in brain activity even during regular daytime working hours. Lighting Res. Technol. 2016, 48, 433–448. [Google Scholar] [CrossRef]
- Islam, M.S.; Dangol, R.; Hyvärinen, M.; Bhusal, P.; Puolakka, M.; Halonen, L. User acceptance studies for LED office lighting: Lamp spectrum, spatial brightness and illuminance. Lighting Res. Technol. 2015, 47, 54–79. [Google Scholar] [CrossRef]
- Dangol, R.; Islam, M.S.; Hyvärinen, M.; Bhushal, P.; Puolakka, M.; Halonen, L. User acceptance studies for LED office lighting: Preference, naturalness and colourfulness. Lighting Res. Technol. 2015, 47, 36–53. [Google Scholar] [CrossRef]
- ISO. ISO 8995-1: 2002-Lighting of Indoor Work Places—Part 1; ISO: Geneva, Switerland, 2002. [Google Scholar]
- CIE. CIE 13.3: 1995-Method of Measuring and Specifying Colour Rendering Properties of Light Sources; CIE: Vienna, Austria, 1995. [Google Scholar]
- CIE. CIE 15:2004-Colorimetry, 3rd ed.; CIE: Vienna, Austria, 2004. [Google Scholar]
- IESNA. The Lighting Handbook: Reference and Application, 10th ed.; IESNA: New York, NY, USA, 2011. [Google Scholar]
- BAuA. ASR A3.4 Beleuchtung-Technische Regel für Arbeitsstätten. Available online: https://www.baua.de/DE/Angebote/Rechtstexte-und-Technische-Regeln/Regelwerk/ASR/ASR-A3-4.html (accessed on 5 September 2021).
- Juslén, H. Influence of the colour temperature of the preferred lighting level in an industrial work area devoid of daylight. Ingineria Iluminatului 2006, 8, 25–36. [Google Scholar]
- Manav, B. An experimental study on the appraisal of the visual environment at offices in relation to colour temperature and illuminance. Build. Environ. 2007, 42, 979–983. [Google Scholar] [CrossRef]
- Wang, Q.; Xu, H.; Zhang, F.; Wang, Z. Influence of color temperature on comfort and preference for LED indoor lighting. Optik 2017, 129, 21–29. [Google Scholar] [CrossRef]
- CIE. CIE 224: 2017-Colour Fidelity Index for Accurate Scientific Use; CIE: Vienna, Austria, 2017. [Google Scholar]
- IES. ANSI/IES TM-30-20-IES Method for Evaluating Light Source Color Rendition; IES: New York, NY, USA, 2020. [Google Scholar]
- Wei, M.; Houser, K.W.; Allen, G.R.; Beers, W.W. Color preference under LEDs with diminished yellow emission. J. Illum. Eng. Soc. 2014, 10, 119–131. [Google Scholar] [CrossRef]
- Houser, K.W.; Fotios, S.A.; Royer, M.P. A test of the S/P ratio as a correlate for brightness perception using rapid-sequential and side-by-side experimental protocols. J. Illum. Eng. Soc. 2009, 6, 119–137. [Google Scholar] [CrossRef]
- Fotios, S.A. Lamp colour properties and apparent brightness: A review. Light. Res. Technol. 2001, 33, 163–178. [Google Scholar] [CrossRef]
- Ohno, Y. Practical use and calculation of CCT and Duv. J. Illum. Eng. Soc. 2014, 10, 47–55. [Google Scholar] [CrossRef]
- Ju, J.; Chen, D.; Lin, Y. Effects of correlated color temperature on spatial brightness perception. Color. Res. Appl. 2012, 37, 450–454. [Google Scholar] [CrossRef]
- Kim, I.T.; Jang, I.H.; Choi, A.S.; Sung, M. Brightness perception of white LED lights with different correlated colour temperatures. Indoor Built Environ. 2015, 24, 500–513. [Google Scholar] [CrossRef]
- Dikel, E.E.; Burns, G.J.; Veitch, J.A.; Mancini, S.; Newsham, G.R. Preferred chromaticity of color-tunable LED lighting. J. Illum. Eng. Soc. 2014, 10, 101–115. [Google Scholar] [CrossRef]
- Royer, M.P.; Houser, K.W. Spatial brightness perception of trichromatic stimuli. J. Illum. Eng. Soc. 2013, 9, 89–108. [Google Scholar] [CrossRef]
- KSA. KSA 3011-2018-Recommended Levels of Illumination; KSA: Seoul, Korea, 1998. [Google Scholar]
- Chraibi, S.; Crommentuijn, L.; van Loenen, E.; Rosemann, A. Influence of wall luminance and uniformity on preferred task illuminance. Build. Environ. 2017, 117, 24–35. [Google Scholar] [CrossRef]
- Chraibi, S.; Creemers, P.; Rosenkötter, C.; van Loenen, E.J.; Aries, M.B.; Rosemann, A.L. Dimming strategies for open office lighting: User experience and acceptance. Lighting Res. Technol. 2019, 51, 513–529. [Google Scholar] [CrossRef] [Green Version]
- Royer, M.P.; Wilkerson, A.; Wei, M. Human perceptions of colour rendition at different chromaticities. Lighting Res. Technol. 2018, 50, 965–994. [Google Scholar] [CrossRef]
- Royer, M.P.; Wilkerson, A.; Wei, M.; Houser, K.; Davis, R. Human perceptions of colour rendition vary with average fidelity, average gamut, and gamut shape. Lighting Res. Technol. 2017, 49, 966–991. [Google Scholar] [CrossRef]
- Esposito, T.; Houser, K. Models of colour quality over a wide range of spectral power distributions. Lighting Res. Technol. 2019, 51, 331–352. [Google Scholar] [CrossRef]
- NEMA. C78.377-2015-American National Standard for Electric Lamps—Specifications for the Chromaticity of Solid State Lighting (SSL) Products; NEMA: Arlington, VA, USA, 2015. [Google Scholar]
- Lee, J.H.; Moon, J.W.; Kim, S. Analysis of occupants’ visual perception to refine indoor lighting environment for office tasks. Energies 2014, 7, 4116–4139. [Google Scholar] [CrossRef]
- Hamedani, Z.; Solgi, E.; Hine, T.; Skates, H.; Isoardi, G.; Fernando, R. Lighting for work: A study of the relationships among discomfort glare, physiological responses and visual performance. Build. Environ. 2020, 167, 106478. [Google Scholar] [CrossRef]
- Kim, H.J.; Baik, J.K. Psychological consideration of legibility on the typeface and line spacing. Arch. Des. Res. 2009, 22, 105–114. [Google Scholar]
- Kim, S.; Lee, K.E.; Lee, H.W. The effect of hangul font on reading speed in the computer environment. J. Ergon. Soc. Korea 2013, 32, 449–457. [Google Scholar] [CrossRef]
- Wei, M.; Houser, K.W.; Orland, B.; Lang, D.H.; Ram, N.; Sliwinski, M.J.; Bose, M. Field study of office worker responses to fluorescent lighting of different CCT and lumen output. J. Environ. Psychol. 2014, 39, 62–76. [Google Scholar] [CrossRef]
- Veitch, J.A.; Newsham, G.R. Lighting quality and energy-efficiency effects on task performance, mood, health, satisfaction, and comfort. J. Illum. Eng. Soc. 1998, 27, 107–129. [Google Scholar] [CrossRef]
- Wang, M.L.; Luo, M.R. Effects of LED lighting on office work performance. In Proceedings of the 2016 13th China International Forum on Solid State Lighting, Beijing, China, 15–17 November 2016; pp. 119–122. [Google Scholar]
- Mills, P.R.; Tomkins, S.C.; Schlangen, L.J. The effect of high correlated colour temperature office lighting on employee wellbeing and work performance. J. Circadian Rhythm. 2007, 5, 2. [Google Scholar] [CrossRef] [PubMed] [Green Version]


| LED | CRI 1 | CCT 2 | Illuminance | Duv | |||
|---|---|---|---|---|---|---|---|
| Lighting Condition | (Ra) | (Rf) | (Rg) | (K) | (lux) | ||
| Experiment 1 | A | 79 | 83 | 103 | 3007 | 300 | −0.0149 |
| B | 83 | 83 | 100 | 3000 | 300 | 0.0066 | |
| C | 76 | 83 | 112 | 6495 | 300 | −0.0227 | |
| D | 84 | 83 | 103 | 6490 | 300 | 0.0059 | |
| Experiment 2 | E | 78 | 83 | 103 | 2995 | 500 | −0.0214 |
| F | 87 | 83 | 102 | 3010 | 500 | −0.0027 | |
| G | 78 | 83 | 114 | 6505 | 500 | −0.0199 | |
| H | 83 | 83 | 107 | 6487 | 500 | 0.0181 |
| Category | Question | Statement Prompt | Response |
|---|---|---|---|
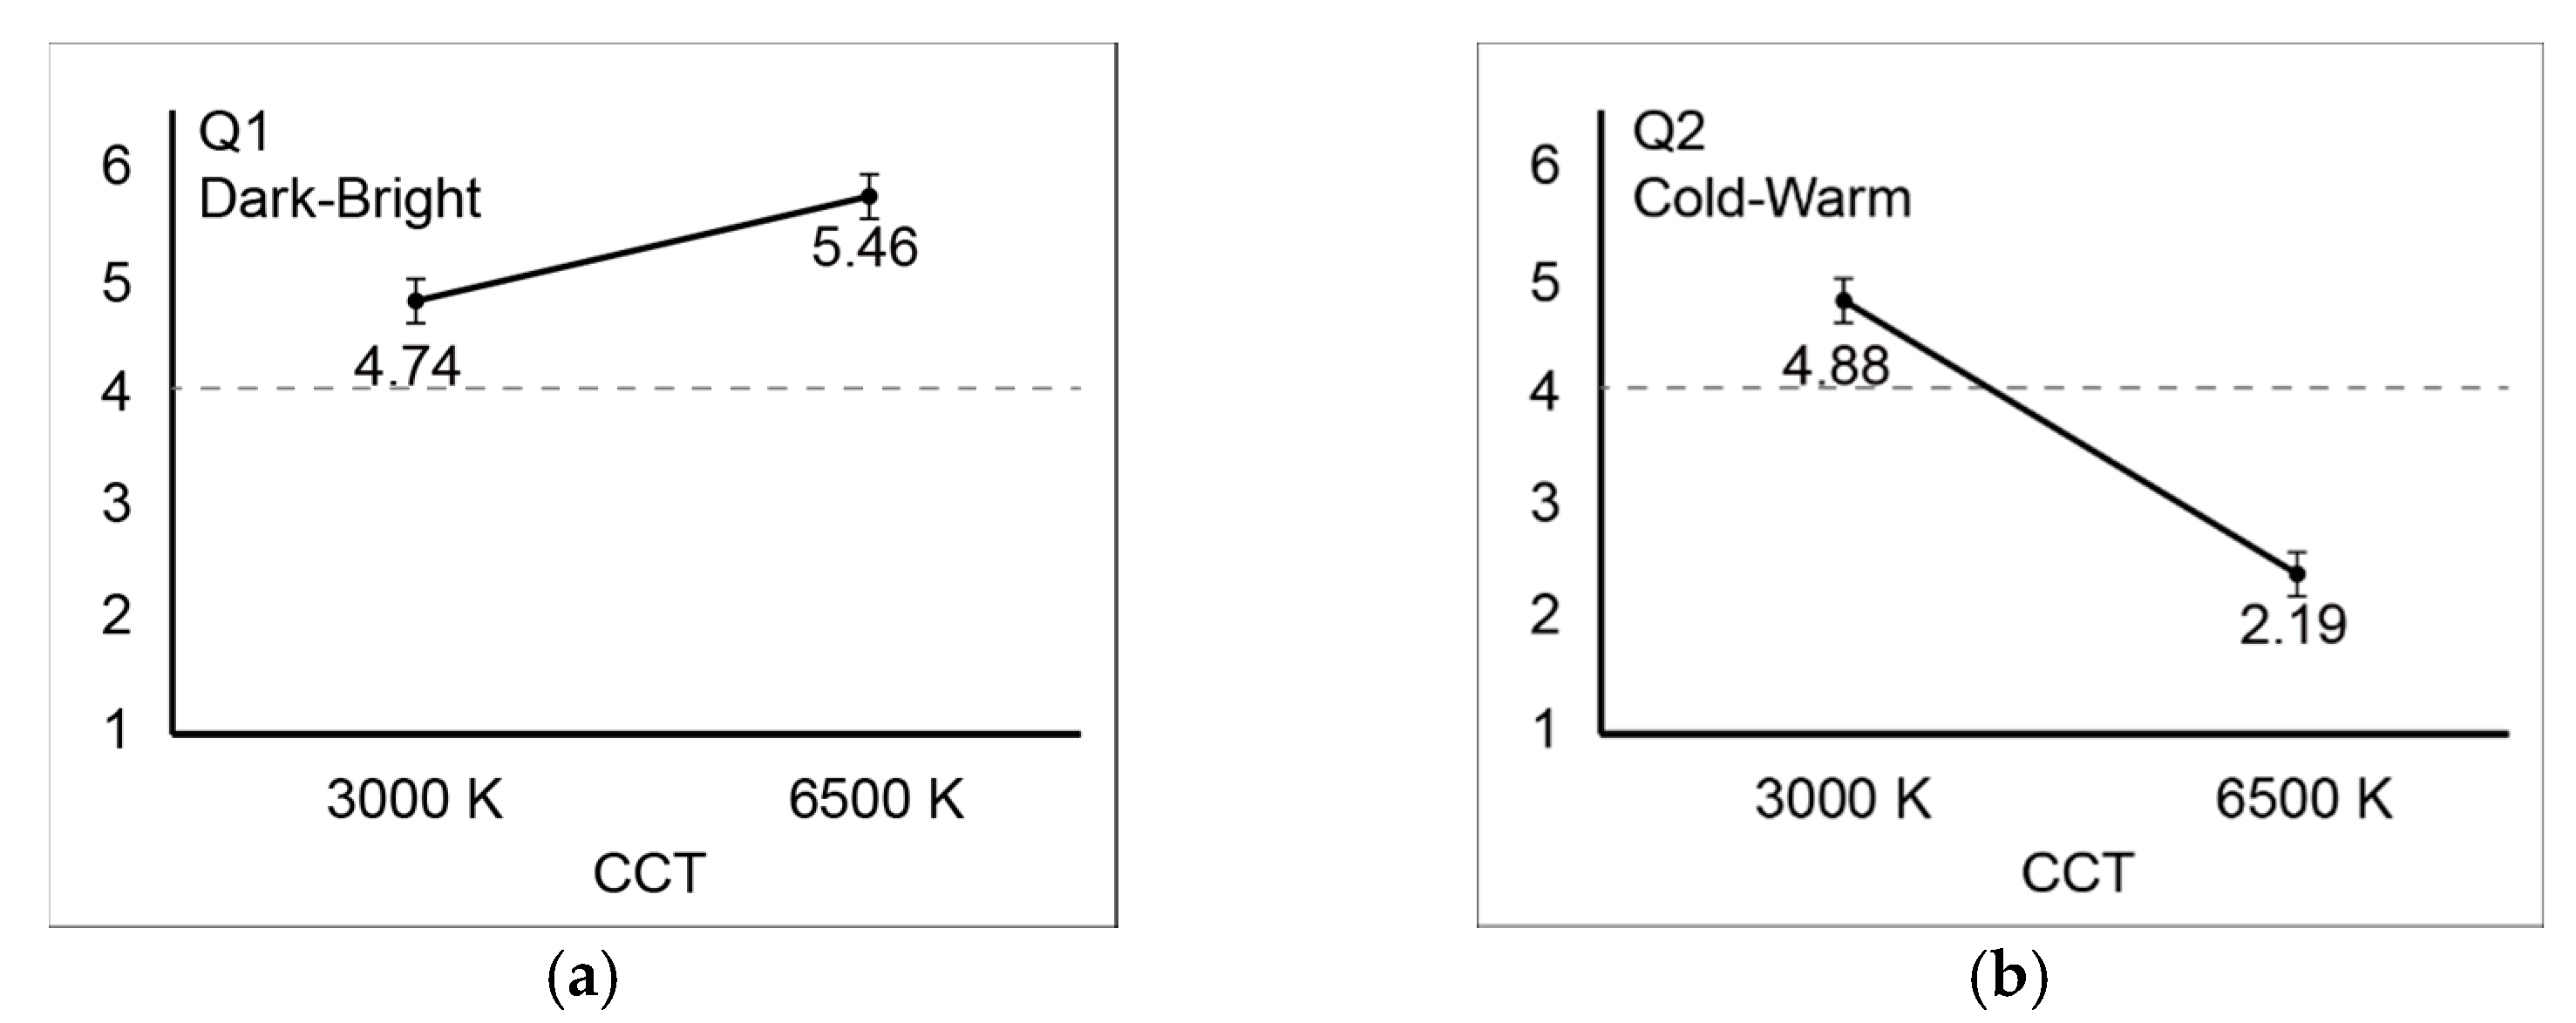
| Light appearance | Q1 | Lighting in this room is… | Dark–bright |
| Q2 | Lighting in this room feels… | Cold–warm | |
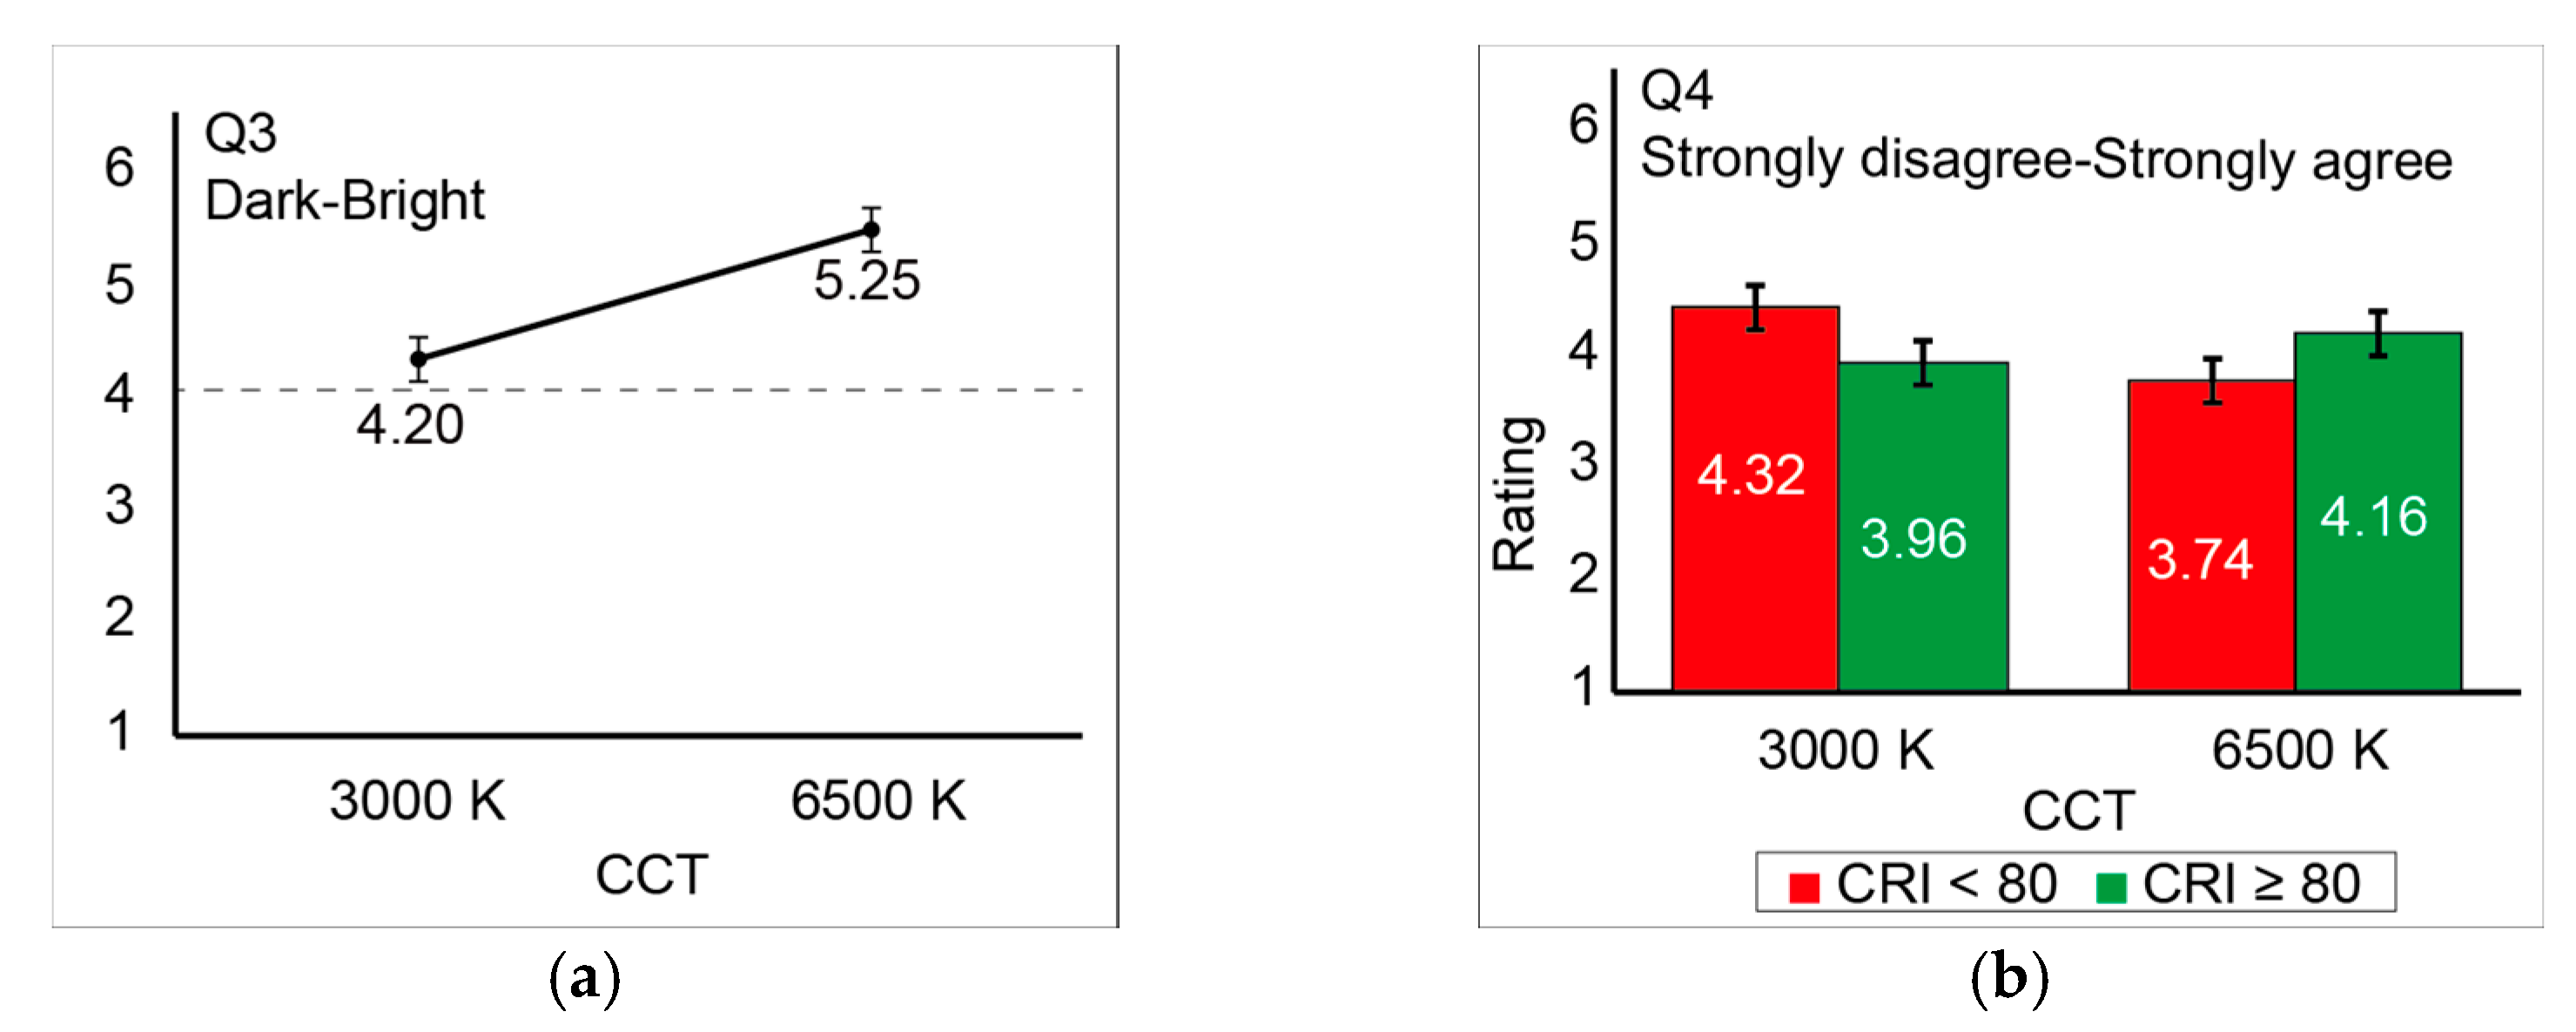
| Spatial brightness | Q3 | Reading text under this lighting was… | Dark–bright |
| Preference | Q4 | I preferred reading text under this lighting. | Strongly disagree–strongly agree |
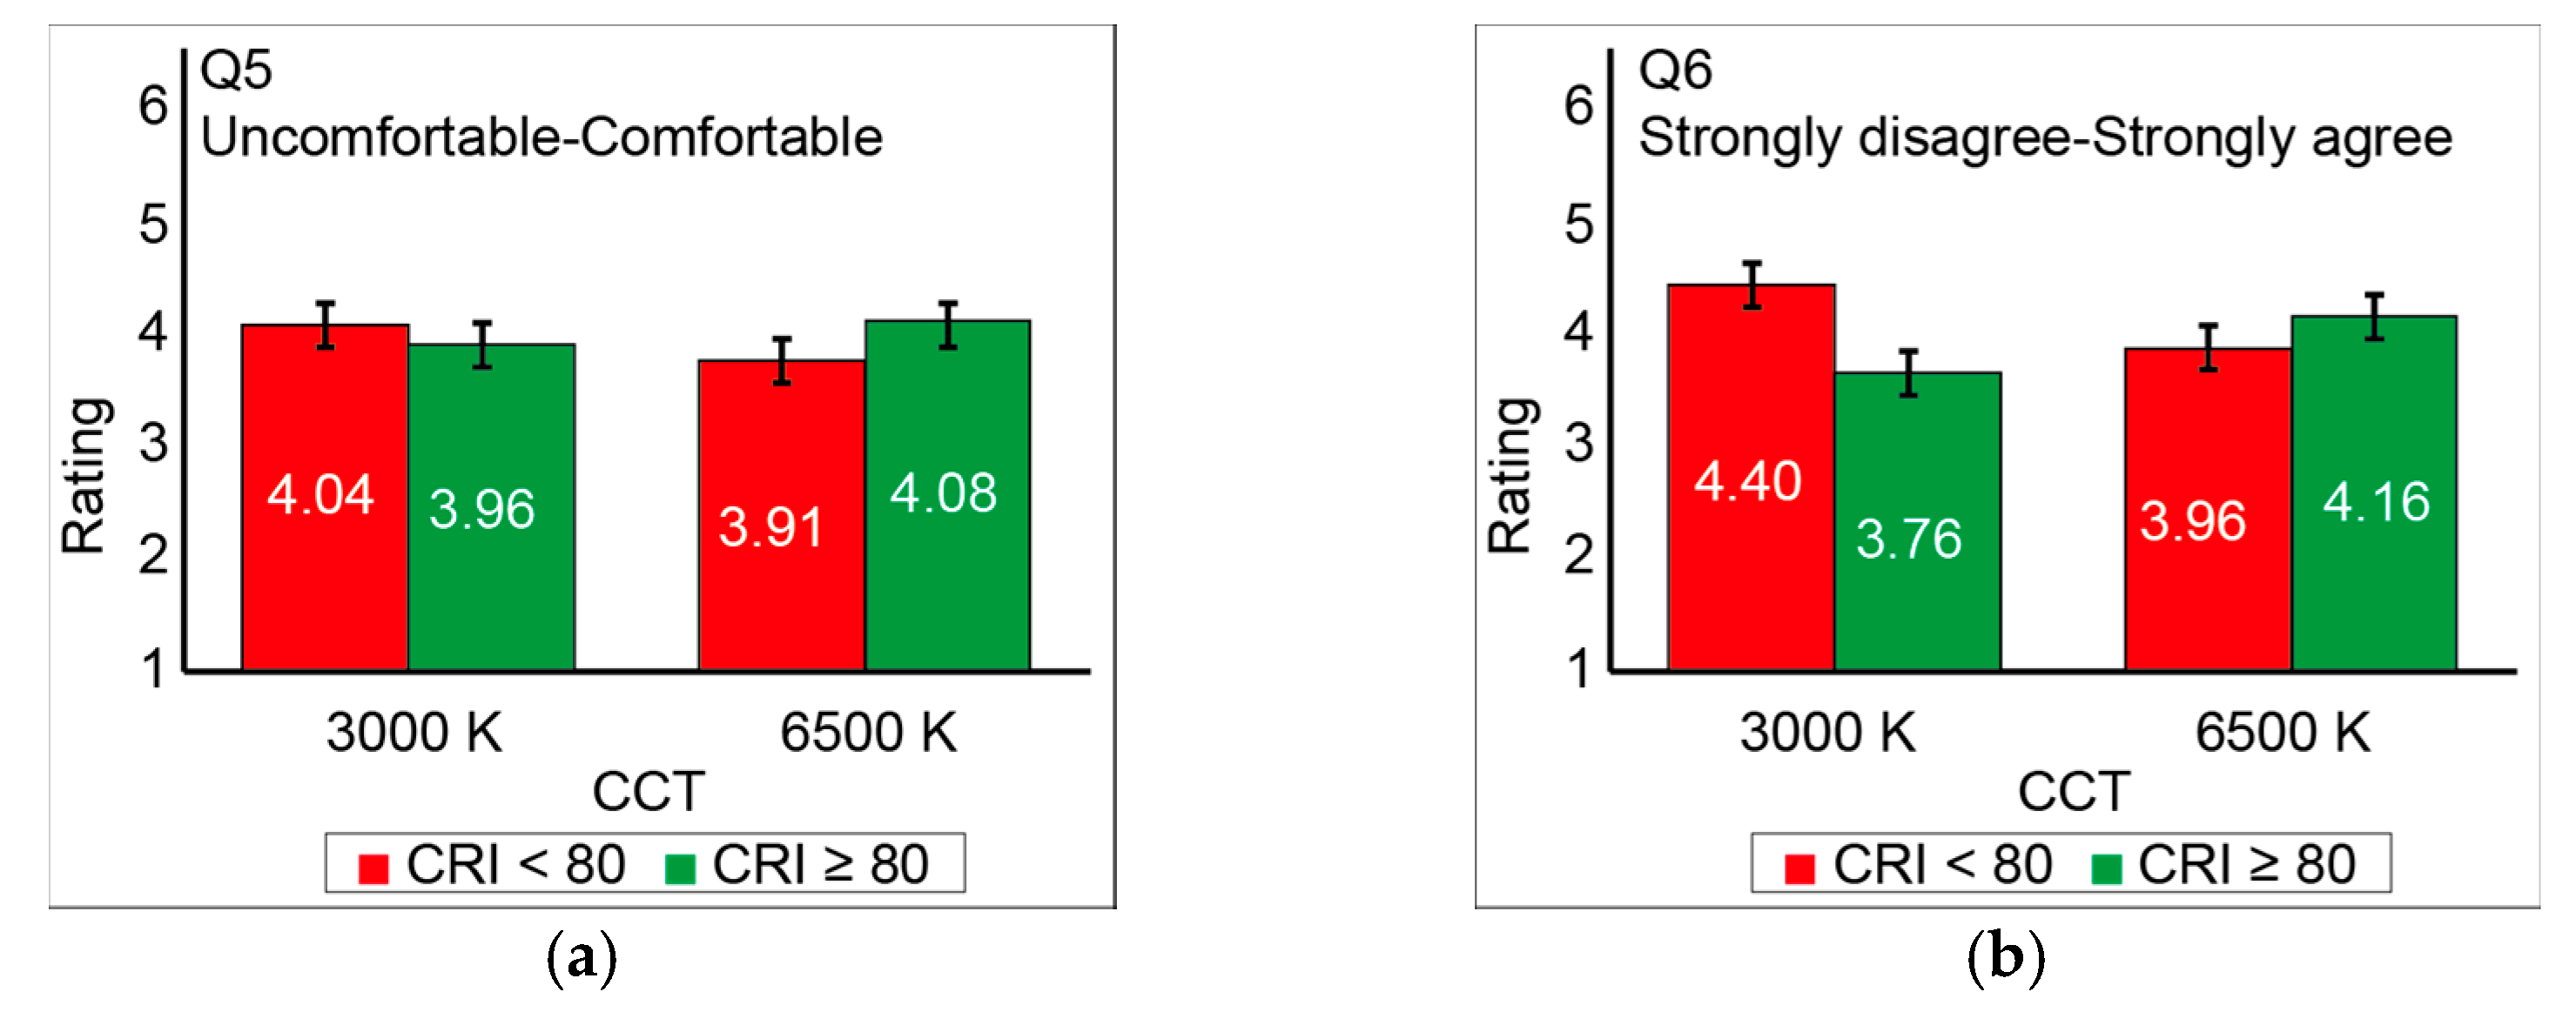
| Visual comfort | Q5 | Reading text under this lighting was… | Uncomfortable–comfortable |
| Q6 | I feel comfortable reading text under this lighting. | Strongly disagree–strongly agree | |
| Readability | Q7 | Reading text under this lighting was… | Difficult–easy |
| Q8 | Reading comprehension under this lighting was effortless. | Strongly disagree–strongly agree | |
| Satisfaction | Q9 | Reading text under this lighting was… | Unsatisfactory–satisfactory |
| Q10 | I am satisfied with reading text under this lighting. | Strongly disagree–strongly agree | |
| Self-reported productivity | Q11 | For problem-solving under this lighting, my productivity was… | Decreased–increased |
| Category | Question | Response | Main | Two-Way | |
|---|---|---|---|---|---|
| CRI | CCT | CRI × CCT | |||
| Light appearance | Q1 | Dark–bright | 0.011 * | 0.000 * | 0.451 |
| Q2 | Cold–warm | 0.284 | 0.000 * | 0.931 | |
| Spatial brightness | Q3 | Dark–bright | 0.352 | 0.000 * | 0.406 |
| Preference | Q4 | Strongly disagree–strongly agree | 0.847 | 0.513 | 0.004 * |
| Visual comfort | Q5 | Uncomfortable–comfortable | 0.876 | 0.515 | 0.005 * |
| Q6 | Strongly disagree–strongly agree | 0.141 | 0.548 | 0.019 * | |
| Readability | Q7 | Difficult–easy | 0.389 | 0.258 | 0.077 |
| Q8 | Strongly disagree–strongly agree | 0.691 | 0.100 | 0.019 * | |
| Satisfaction | Q9 | Unsatisfactory–satisfactory | 0.555 | 0.967 | 0.029 * |
| Q10 | Strongly disagree–strongly agree | 0.925 | 0.457 | 0.003 * | |
| Productivity | Q11 | Decreased–increased | 0.901 | 0.217 | 0.002 * |
| Category | Question | Response | Main | Two-Way | |
|---|---|---|---|---|---|
| CRI | CCT | CRI × CCT | |||
| Light appearance | Q1 | Dark–bright | 0.488 | 0.002 * | 0.866 |
| Q2 | Cold–warm | 0.061 | 0.000 * | 0.077 | |
| Spatial brightness | Q3 | Dark–bright | 0.430 | 0.000 * | 0.923 |
| Preference | Q4 | Strongly disagree–strongly agree | 0.892 | 0.395 | 0.083 |
| Visual comfort | Q5 | Uncomfortable–comfortable | 0.876 | 0.990 | 0.658 |
| Q6 | Strongly disagree–strongly agree | 0.428 | 0.937 | 0.127 | |
| Readability | Q7 | Difficult–easy | 0.591 | 0.422 | 0.595 |
| Q8 | Strongly disagree–strongly agree | 0.746 | 0.365 | 0.314 | |
| Satisfaction | Q9 | Unsatisfactory–satisfactory | 0.657 | 0.322 | 0.105 |
| Q10 | Strongly disagree–strongly agree | 0.788 | 0.893 | 0.110 | |
| Productivity | Q11 | Decreased–increased | 0.918 | 0.685 | 0.028 * |
Publisher’s Note: MDPI stays neutral with regard to jurisdictional claims in published maps and institutional affiliations. |
© 2021 by the authors. Licensee MDPI, Basel, Switzerland. This article is an open access article distributed under the terms and conditions of the Creative Commons Attribution (CC BY) license (https://creativecommons.org/licenses/by/4.0/).
Share and Cite
Lee, S.; Yoon, H.C. A Randomized Controlled Trail for Comparing LED Color Temperature and Color Rendering Attributes in Different Illuminance Environments for Human-Centric Office Lighting. Appl. Sci. 2021, 11, 8313. https://doi.org/10.3390/app11188313
Lee S, Yoon HC. A Randomized Controlled Trail for Comparing LED Color Temperature and Color Rendering Attributes in Different Illuminance Environments for Human-Centric Office Lighting. Applied Sciences. 2021; 11(18):8313. https://doi.org/10.3390/app11188313
Chicago/Turabian StyleLee, Sujung, and Heakyung C. Yoon. 2021. "A Randomized Controlled Trail for Comparing LED Color Temperature and Color Rendering Attributes in Different Illuminance Environments for Human-Centric Office Lighting" Applied Sciences 11, no. 18: 8313. https://doi.org/10.3390/app11188313