
Effects of Neglecting PCM Hysteresis While Making Simulation Calculations of a Building Located in Polish Climatic Conditions


Faculty of Civil Engineering, Cracow University of Technology, 31-155 Cracow, Poland
*
Author to whom correspondence should be addressed.
Appl. Sci. 2021, 11(19), 9166; https://doi.org/10.3390/app11199166
Submission received: 30 July 2021
/
Revised: 19 September 2021
/
Accepted: 21 September 2021
/
Published: 2 October 2021
(This article belongs to the Special Issue Advances in Thermal Energy Storage in Buildings Incorporating Phase-Change Materials)
Abstract
:The use of phase change materials (PCM) in different building applications is a hot topic in today’s research and development activities. Numerous experimental tests confirmed that the hysteresis of the phase change process has a noticeable effect on heat accumulation in PCM. The authors are trying to answer the question of whether the neglecting of hysteresis or the impact of the speed of phase transformation processes reduce the accuracy of the simulation. The analysis was performed for a model building, created to validate the energy calculations. It was also important to conduct simulations for the polish climatic conditions. The calculations were conducted for three variants of materials. In addition, in the case of models containing layers with PCM, calculations were made both taking into account, as well as excluding material hysteresis in the calculations. In the analyzed examples, after taking into account hysteresis in the calculations, the period of time when surface temperature is below the phase change temperature of the materials decreased by 10.6% and 29.4% between 01 June to 30 September, for the options with PCM boards and Dupont boards, respectively. Significant differences in surface temperature were also observed. The effects of neglecting, even relatively small hysteresis, in the calculations are noticeable and can lead to significant errors in the calculation.
1. Introduction
Contemporary building structures are characterized with improving thermal insulation of partitions and solutions focusing on minimizing energy demand.
The inability to counteract significant fluctuations in air temperature in rooms has a very negative impact on the microclimate and the perceptibility of people being inside, as well as on the effectiveness of using the available heat gains.
The heat capacity of the building is primarily determined by the heat capacity of its partitions. The ability to store excess heat energy and release it when the room cools down, gives the possibility of better usage of solar radiation in winter and reduces the risk of overheating the interior in winter and summer.
The lack of convergent in time between demand and possible supply of thermal energy contributes to the development of research on passive heat and cold stores. One of the effective methods of accumulation of thermal energy in buildings is the use of materials that change the state of aggregation. In this case, the heat of the phase transition is used to accumulate energy.)
The authors Moreles et al. [1] remind and emphasise that a key component in buildings to reduce their energy consumption and improve their thermal performance is the envelope [2,3,4]. The latent heat energy storage through the use of phase change materials (PCMs) placed in the building envelope has become an interesting alternative to achieve these goals [3,4,5]. A successful implementation of PCMs requires that their melting temperature, thickness and location within the constructive system are selected according to the climate and use condition (air-conditioning or non-air-conditioning). One of the first and most important works on the thermal performance of specific PCM-constructive-systems and searching optimal values were melting temperature [6,7,8], thickness [9], location and melting temperature and thickness [10,11].
Storage of energy in the form of latent heat has become the subject of interest in the last decade, which is clearly visible in the number of publications which increases every year. Most of the publications come from China and the United States [12], which means that the conclusions from the field research taking into account climatic conditions are so different from Poland, that they are useful only partially in our conditions. All simulation and research results contained in the analyzed publications indicate a high potential for the use of PCM in partitions of buildings.
Schossing et al. [13] carried out the first tests with the use of prefabricated gypsum boards with the addition of PCM in the form of microcapsules. The test results show a large impact of external blinds and the method of ventilation of the room on the effectiveness of protection against overheating with the use of PCM.
Y. Konuklu [14] used a material with two different melting points (23 °C and 26 °C) for the tests. The phase-change material was place in an aluminum foil located on the thermal insulation layer. In summer conditions, the reduction of the maximum air temperature in the tested room was 2.5 °C. Modification of the lightweight partition, by adding PCM-containing plates from the inside, resulted in a significant reduction in energy demand for cooling in summer and a reduction in the load on the heating system during the winter period.
Extensive research and analysis of the use of various phase-changing materials, both in laboratory conditions and in real objects, were carried out by the team of Jan Kośny [3,15,16]. The research proposes solutions for the use of PCM in finishing layers of internal partitions, as a filling inside the partition and as an external layer [17] or in window with one cavity filled with phase change material paraffin [18].
However, one the drawbacks of pure PCMs is their relatively poor thermal conductivities that results in an unacceptably slow heat transfer rate in some applications [19]. Therefore, introducing a promising and affordable technique for enhancing the thermal conductivity of PCMs can play a key role in improving their performance. Various techniques have been reported to date by different researchers to address the low thermal conductivity problem of PCMs. These included the addition of high-conductivity particles, using fins or extended surfaces, employing metal foams, using multiple PCMs and embedding heat pipes [20,21,22]. The addition of high-conductivity additives to PCMs, is one of the promising methods tried to date for improving their effective thermal conductivity.
In modern building design, particularly in predicting energy performance of buildings, simulation programs are the basic tools. In case of planning the use of phase-variable materials, the correctness of the model selection is very important due to their variable properties.
Presented in ref. [23], empirical research validates and compares six PCM models implemented in different building energy and hygrothermal software (EnergyPlus, ESP-r and WUFI). In addition, a 2D model developed in COMSOL and another PCM model developed in MATLAB (CSMPCM model) are also validated and compared using data from two independent experimental studies with Nano-PCM embedded in drywall and shape-stabilized PCM behind the drywall construction material.
Measurements of the thermal properties of internal cladding containing phase change material (PCM) [24,25,26] confirmed the occurrence of hysteresis during the processes of heating and cooling materials, when PCM melts and freezes. Further analysis of this phenomenon as well as the impact of its omission in the calculations included full-scale tests of partitions (our articles) and modifications to the calculation algorithm in the Energy Plus program [26]. The calculation results using the modified algorithm showed a high degree of compliance with the measurement results, which allows it to be used to analyze the possible effects of neglecting hysteresis while making simulation calculations of buildings.
However, an important feature of PCMs, the thermal hysteresis phenomenon, has hardly been studied and included in building thermal simulations. Refs. [27,28,29] showed the importance of considering hysteresis in the numerical simulations to describe accurately the temperature evolution of PCMs.
However, accurate control of the phase change of PCM is not easy to predict, for example, neglecting hysteresis or the speed of phase change processes reduces the accuracy of the simulation.
In the last few years, many research centers have been working on the selection and adaptation of the model to take into account the hysteresis of phase-variable materials in numerical models. For instance, a research paper by ref. [1] presents a numerical study of the combined effects of the hysteresis temperature difference, peak melting temperature and thickness of a building envelope PCM-wall on its thermal performance in air-conditioning and non-air-conditioning conditions. The study was carried out considering complete melting-freezing daily cycles of the PCM in a climate exhibiting both hot and cold thermal discomfort.)
In ref. [26], the authors propose a new software module for EnergyPlus™ that aims to simulate the hysteresis of PCMs during the phase change. The new module is tested by comparing simulation results with experimental tests done in a climatic chamber. A strong consistency between experimental and simulation results was obtained, with a discrepancy error of less than 1%.
An original algorithm including hysteresis effects and the results from simulations were compared against experimental data and described in paper [30]. The algorithm was implemented in EnergyPlus TM and makes use of the energy management system (EMS) group, one of the high-level control methods available in EnergyPlus TM. The algorithm enables the replication of PCM’s different heating/cooling enthalpy curves in this BPS (building performance simulation) tool, which just recently was equipped with an integrated module for the replication of the effects of thermal hysteresis.).
The research conducted by Ali Al-Janabi and Miroslava Kavgic [31] was aimed at: comparison a recently developed hysteresis method against its precursor enthalpy temperature method, performing local sensitivity analysis on hysteresis input parameters and investigating the feasibility of integrating PCMs within a suspended ceiling using the hysteresis method in EnergyPlus 8.9. Therefore, it provides new knowledge and information required for better comprehension and implementation of the hysteresis object in EnergyPlus. A building at the University of Manitoba is used as a case study because of its curtain-wall façade system, which is becoming popular worldwide despite increasing concerns over its lack of thermal storage properties. The results show a discrepancy between the hysteresis and enthalpy-temperature methods, which may vary considerably with the intensity and duration of the transmitted solar radiation.
In ref. [32] authors presented a combined experimental and numerical procedure, developed to test the thermophysical behavior of a real scale PCM wallboard, aiming at providing reliable data for the validation of building energy performance simulation tools.
The study shows that the more refined modelling of the phase change allows results to be consistent with the thermo-physics phenomena of composite PCM under real conditions and achieve more reliable results.
2. Materials and Methods
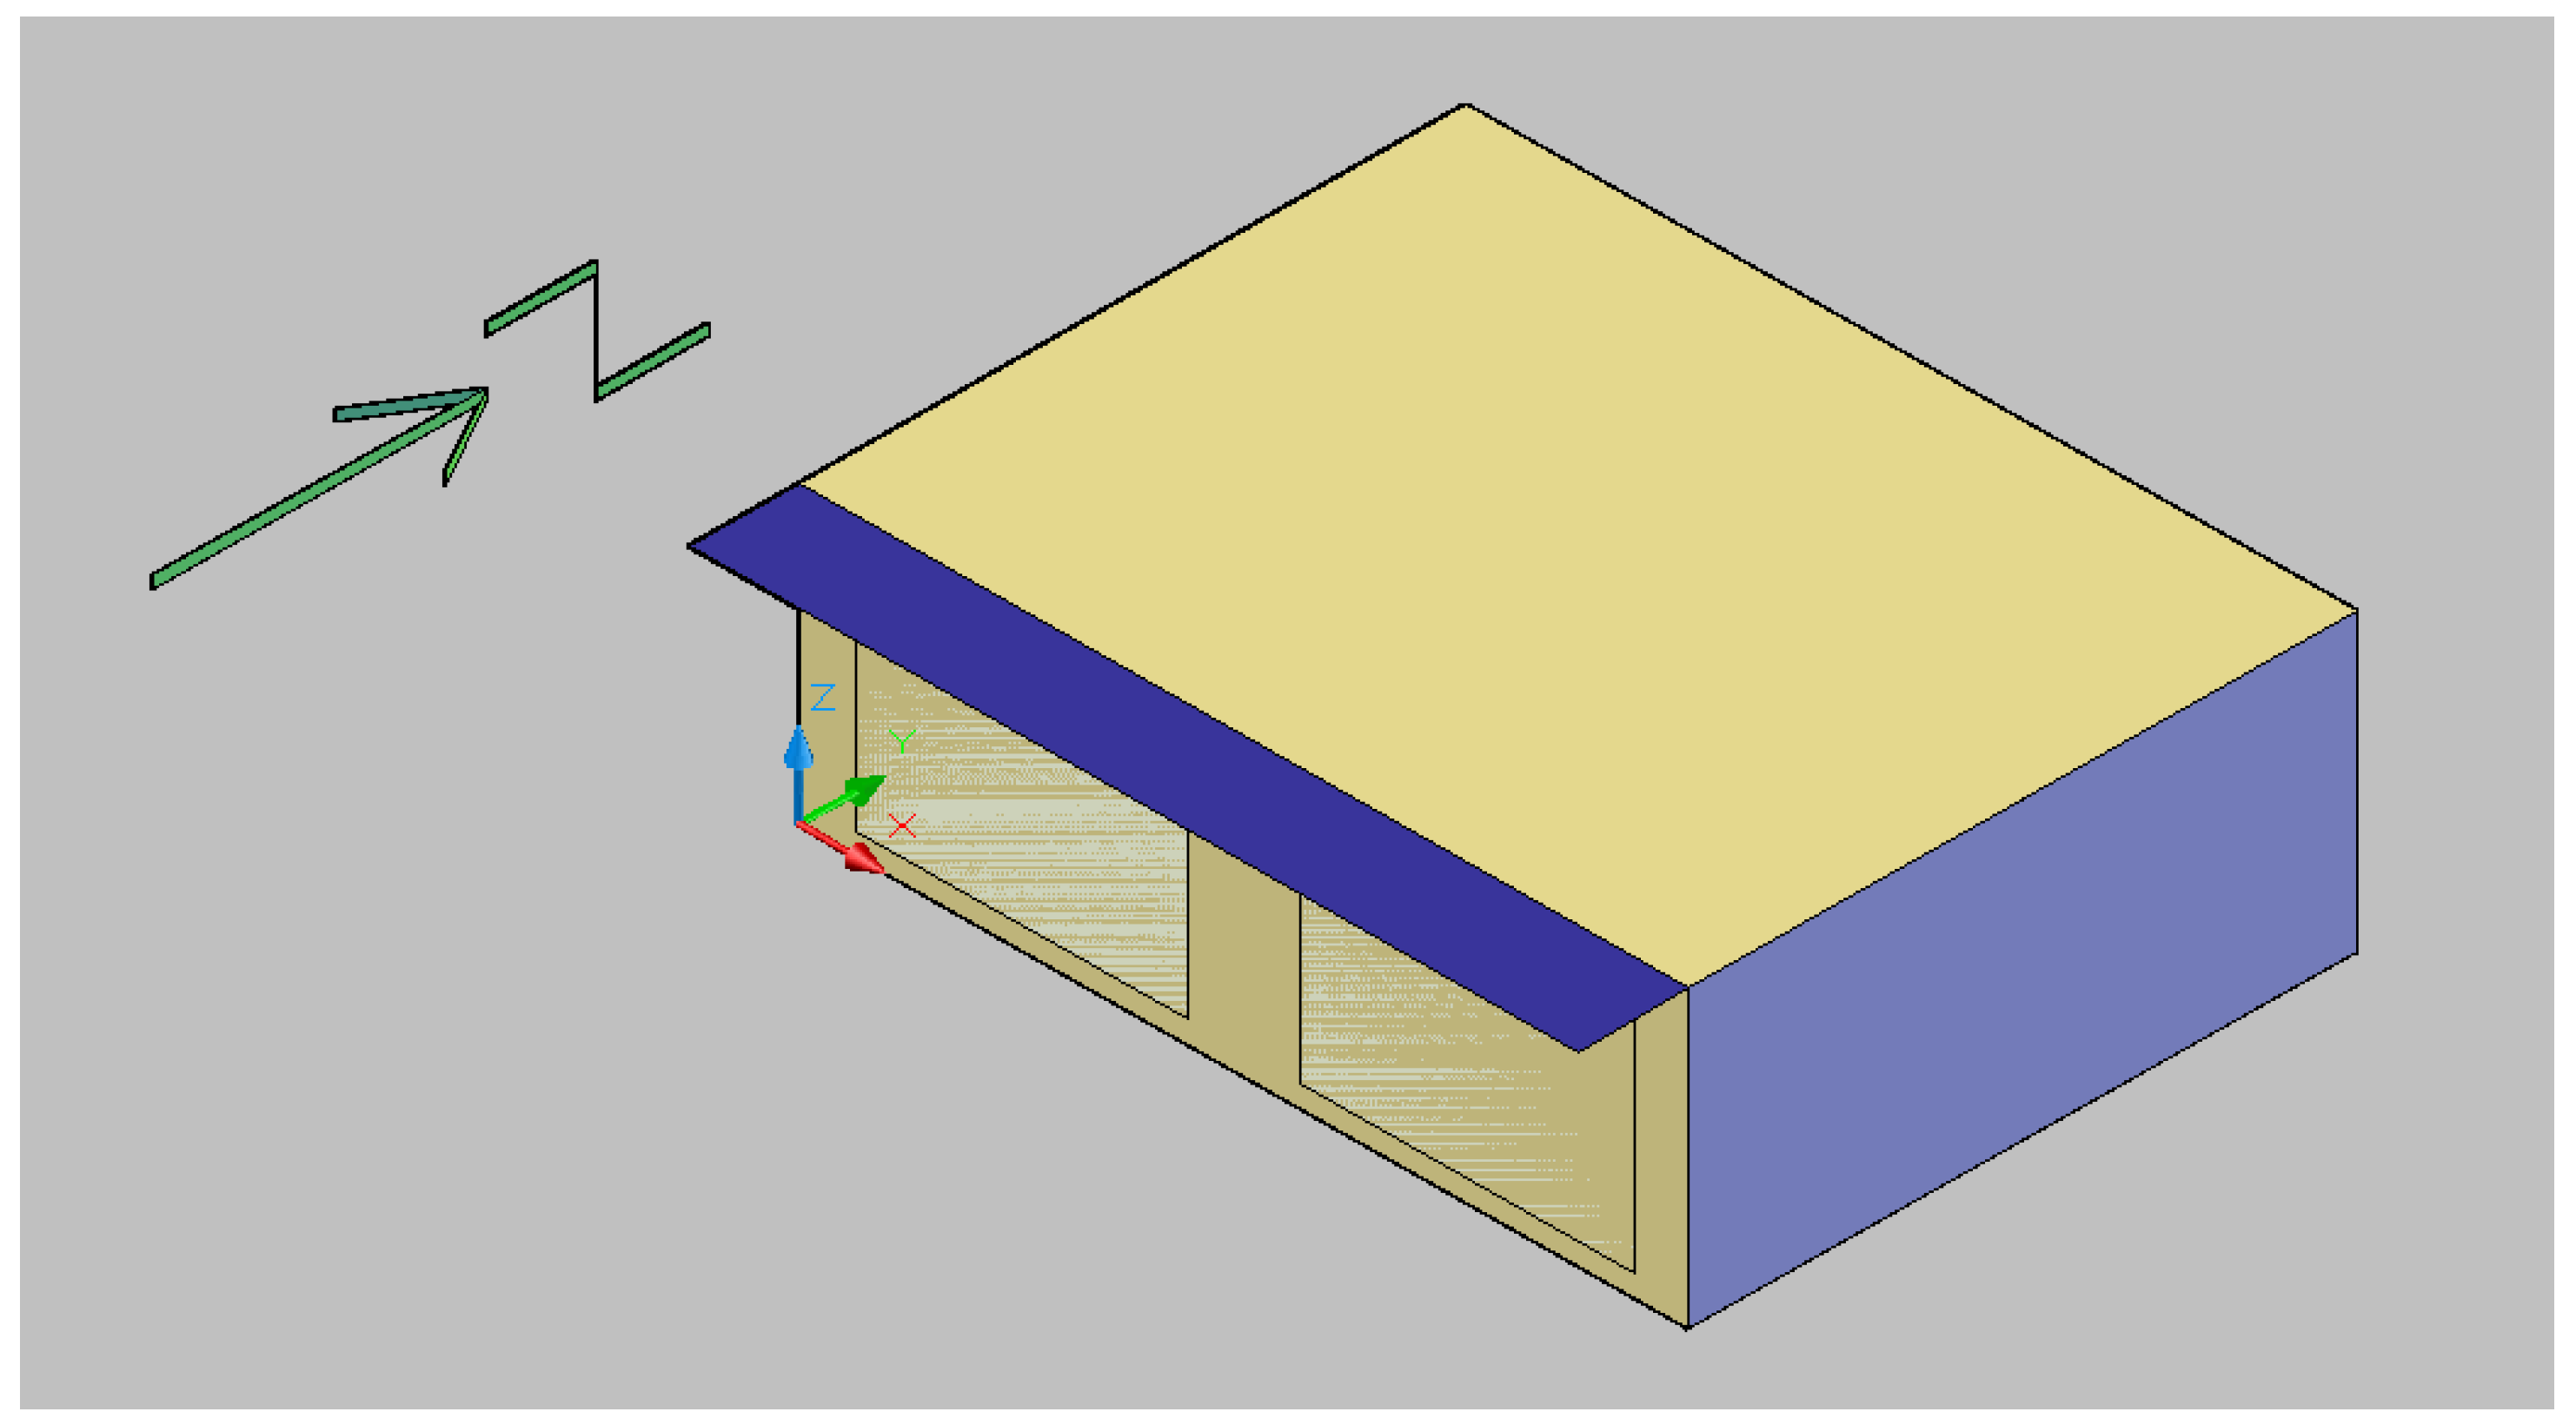
One of the reference numerical models designed to test the energy calculations of buildings, Figure 1, was used to assess the effects of neglecting the phase change hysteresis in a full-scale facility. The specification of this very simple reference facility is included in the ANSI/ASHRAE Standard 140 Building Thermal guidelines.
An object with the symbol 650FF was selected for the calculations, designed in accordance with the recommendations of energy-efficient construction. The selected object is characterized by a glazing area on the southern side which is enlarged compared to standard solutions. It is equipped with passive elements that reduce the risk of overheating in the form of roof overhangs, causing periodic shading of large, glazed areas. Intensive nighttime ventilation was put in place, but there is no mechanical interior cooling system in this building.
The tested object is a simple cuboid-shaped building with a light structure and low thermal capacity of the building envelope. The dimensions of the building are: length 8 m, width 6 m and height 2.7 m. The building contains only one room, without any internal walls. Glazing consists of 2 windows each with an area of 6 m2 located on the south side. Above the windows, there is solar shading in the form of a bracket with a projection of 1 m. As before, the simulation calculations were made in the Energy Plus 8.4.0 program.
The material data adopted for the basic variant (without layers containing PCM) are presented in Table 1. All data, except for the thickness of the thermal insulation, comply with the technical specification of the original standard [33]. The thickness of the thermal insulation was adjusted to the applicable requirements in Poland [34]. It was assumed that the building would be located in Krakow, which determined the adopted climatic conditions.
In subsequent calculation variants, the model was modified by replacing the standard plasterboard with PCM-containing materials: Dupont boards and PCM plasterboards.
The DuPont™ Energain® thermal mass panel is laminated to aluminum protective foils, the core material is a mix of a copolymer and a paraffin wax ‘phase change’ material, which provides the panel’s functionality. Some key technical data include: thickness 5.26 mm, width 1 m, length 1.2 m, area weight 4.5 kg/m2, melting point 21.7 °C, heat storage 515 kJ/m2 (18–24 °C). Knauf Comfortboard Properties: board thickness 12.5 mm, board weight 11 kg/m2, latent heat capacity 200 kJ/m2, specific heat capacity 13 kJ/m2K, phase change temperature 23 °C. The course of the curve (Figure 2) of Temperature Dependence of Enthalpy was adopted based on the results of calorimetric tests and the literature [35]. On the other hand, for a plasterboard containing 30% phase-change material in the form of microcapsules, the curve shown in Figure 3 was determined on the basis of the results of calorimetric tests performed separately for pure PCM and the plasterboard matrix and then calibrated [36]. Due to the expected high degree of overheating of the interior of the building, the use of two layers of boards containing phase-change material was assumed.
The assumption of the 650FF standard is the lack of mechanical cooling and heating systems in the summer. Air exchange during the day (from 8 am to 6 pm) takes place only through infiltration, while in the evening and night hours (i.e., from 6 pm to 8 am), the room is intensively ventilated. Air exchange during the day is 64.8 m3/h, while night ventilation is 1768 m3/h.
The 650FF standard specifications also assumed internal heat gains of 200 W–60% through long-wave radiation and 40% through convection, infiltration: 0.5 air change/h, 100% sensible Mechanical System: 100% convective air system, 100% efficient with no duct losses and no capacity limitation, no latent heat extraction, soil Temperature: 10 °C continuous.
Most PCM materials are characterized by hysteresis resulting from the interaction between the processes taking place inside the material. The complexity of the processes that influence the hysteresis effect means that this phenomenon is not fully explained yet and, thus, difficult to model. There are often significant differences, up to 15% [37,38], between the amount of energy required to melt the material and consolidate it. This fact is difficult to explain from the perspective of the law of conservation of energy. The report [38] contains a hypothesis that energy is stored mechanically through deformation of the matrix, which is a consequence of the formation of dilatations in the PCM structure. The need for more theoretical and experimental research in this area is commonly emphasized.
The Energy Plus program, in which the model was made, has open access to the source code (written in C++). This allows user intervention and adjusting the program to your own needs. The source code of the program has been modified to enable the extension of the application functionality in terms of PCM hysteresis. Modification of the algorithm introduces only one change in the interface with data to the program—in the place of entering the coordinates of one curve (temperature and the corresponding enthalpy value); the second, alternative enthalpy value is also entered.
The modified algorithm takes into account the hysteresis of materials by predicting the behavior of PCM during material heating and cooling. In the basic variant, it is assumed that the phase changes took place in the entire volume of the material (Figure 4).
The actual course of the phase changes is more complicated and is based on the transition from “Cooling curve state” to “heating curve state”, defined as an occurrence of the third type a condition called “transition curve state”. The states are represented by the following colors: blue—cooling curve; red—heating curve; violet—transition curve.
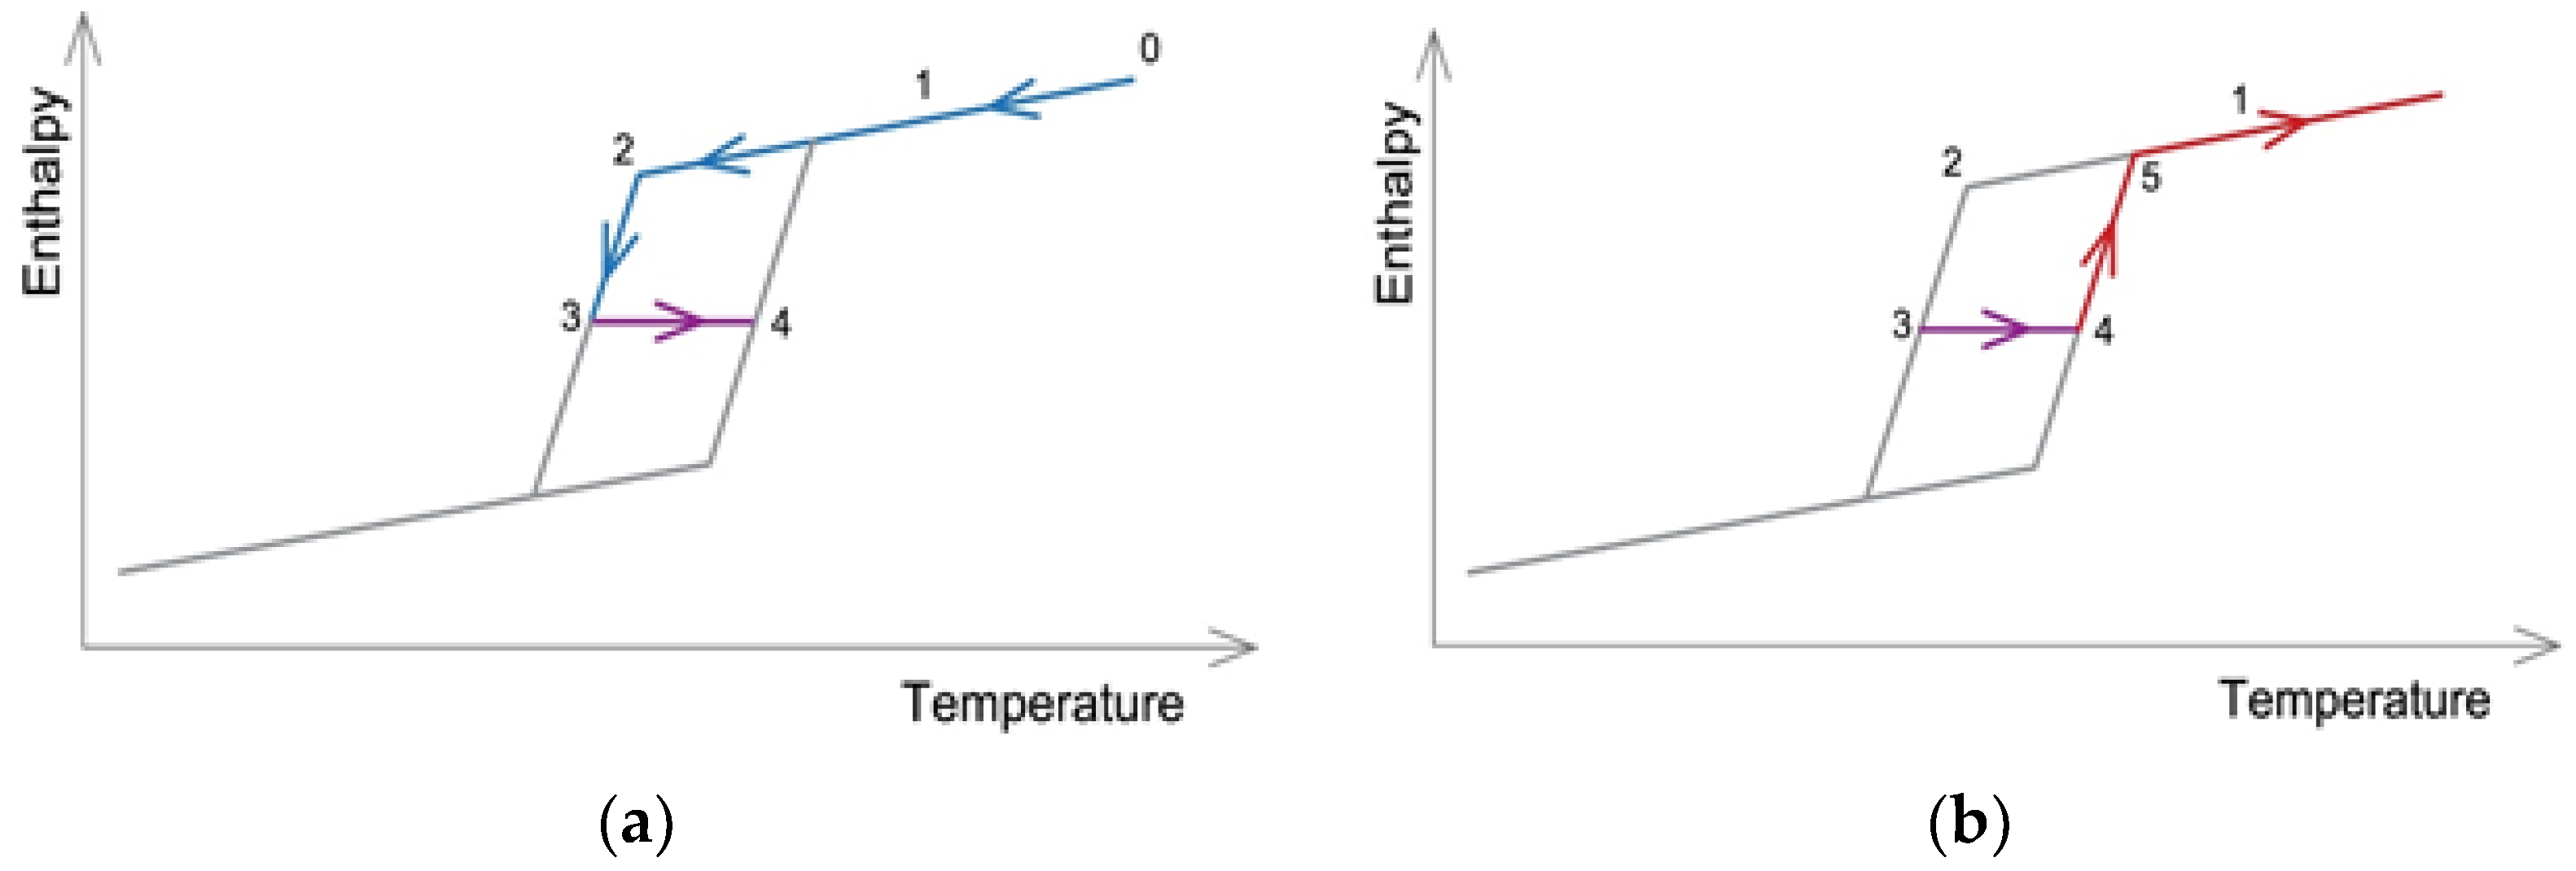
When the cooling phase of the completely melted material has begun (curve 0–1–2, Figure 5a) and before the phase change starts (point 2), the heat is released in a sensible way. After the phase change process has started, the energy is released in both latent and sensible ways (curve 2–3). At this point (point 3), the heating of the material begins again. Thus far, the enthalpy value follows the cooling curve state. The re-start of heating results in the termination of the cooling curve state and the start of the transition curve state (curve 3–4). For the transition curve, the enthalpy value is determined from either the heating curve or the cooling curve. At point 4, the process of melting of the partially solidified material restarts. At this moment, the transition curve state ends and the heating curve state will restart (curve 4–5 in Figure 5b). After the completion of the phase change, the material again accumulates heat only in a sensible way (curve 5–1) while remaining in the heating curve state.
The equivalent specific heat of a PCM in case of the heating curve is calculated in the following way:
where -heating enthalpy of a discrete node ‘i’ at a time-step ‘j’ (and respectively ‘j − 1’) [J/kg]. In the same way for the cooling curve (2):
where is cooling enthalpy of a discrete node ‘i’ at a time-step ‘j’ (and respectively ‘j − 1’) [J/kg]. For the transition from cooling to heating curve 3–4 Equations (3) or (4), if then:
where is transition enthalpy, taken from transition curve and
If then
For the transition from heating to cooling curve 4–3 Equations (5) or (6),
If then:
and
If then:
3. Results
The calculations were made for the three variants of materials as described above. In addition, in the case of models containing layers with PCM, calculations were made both taking into account and excluding material hysteresis in the calculations.
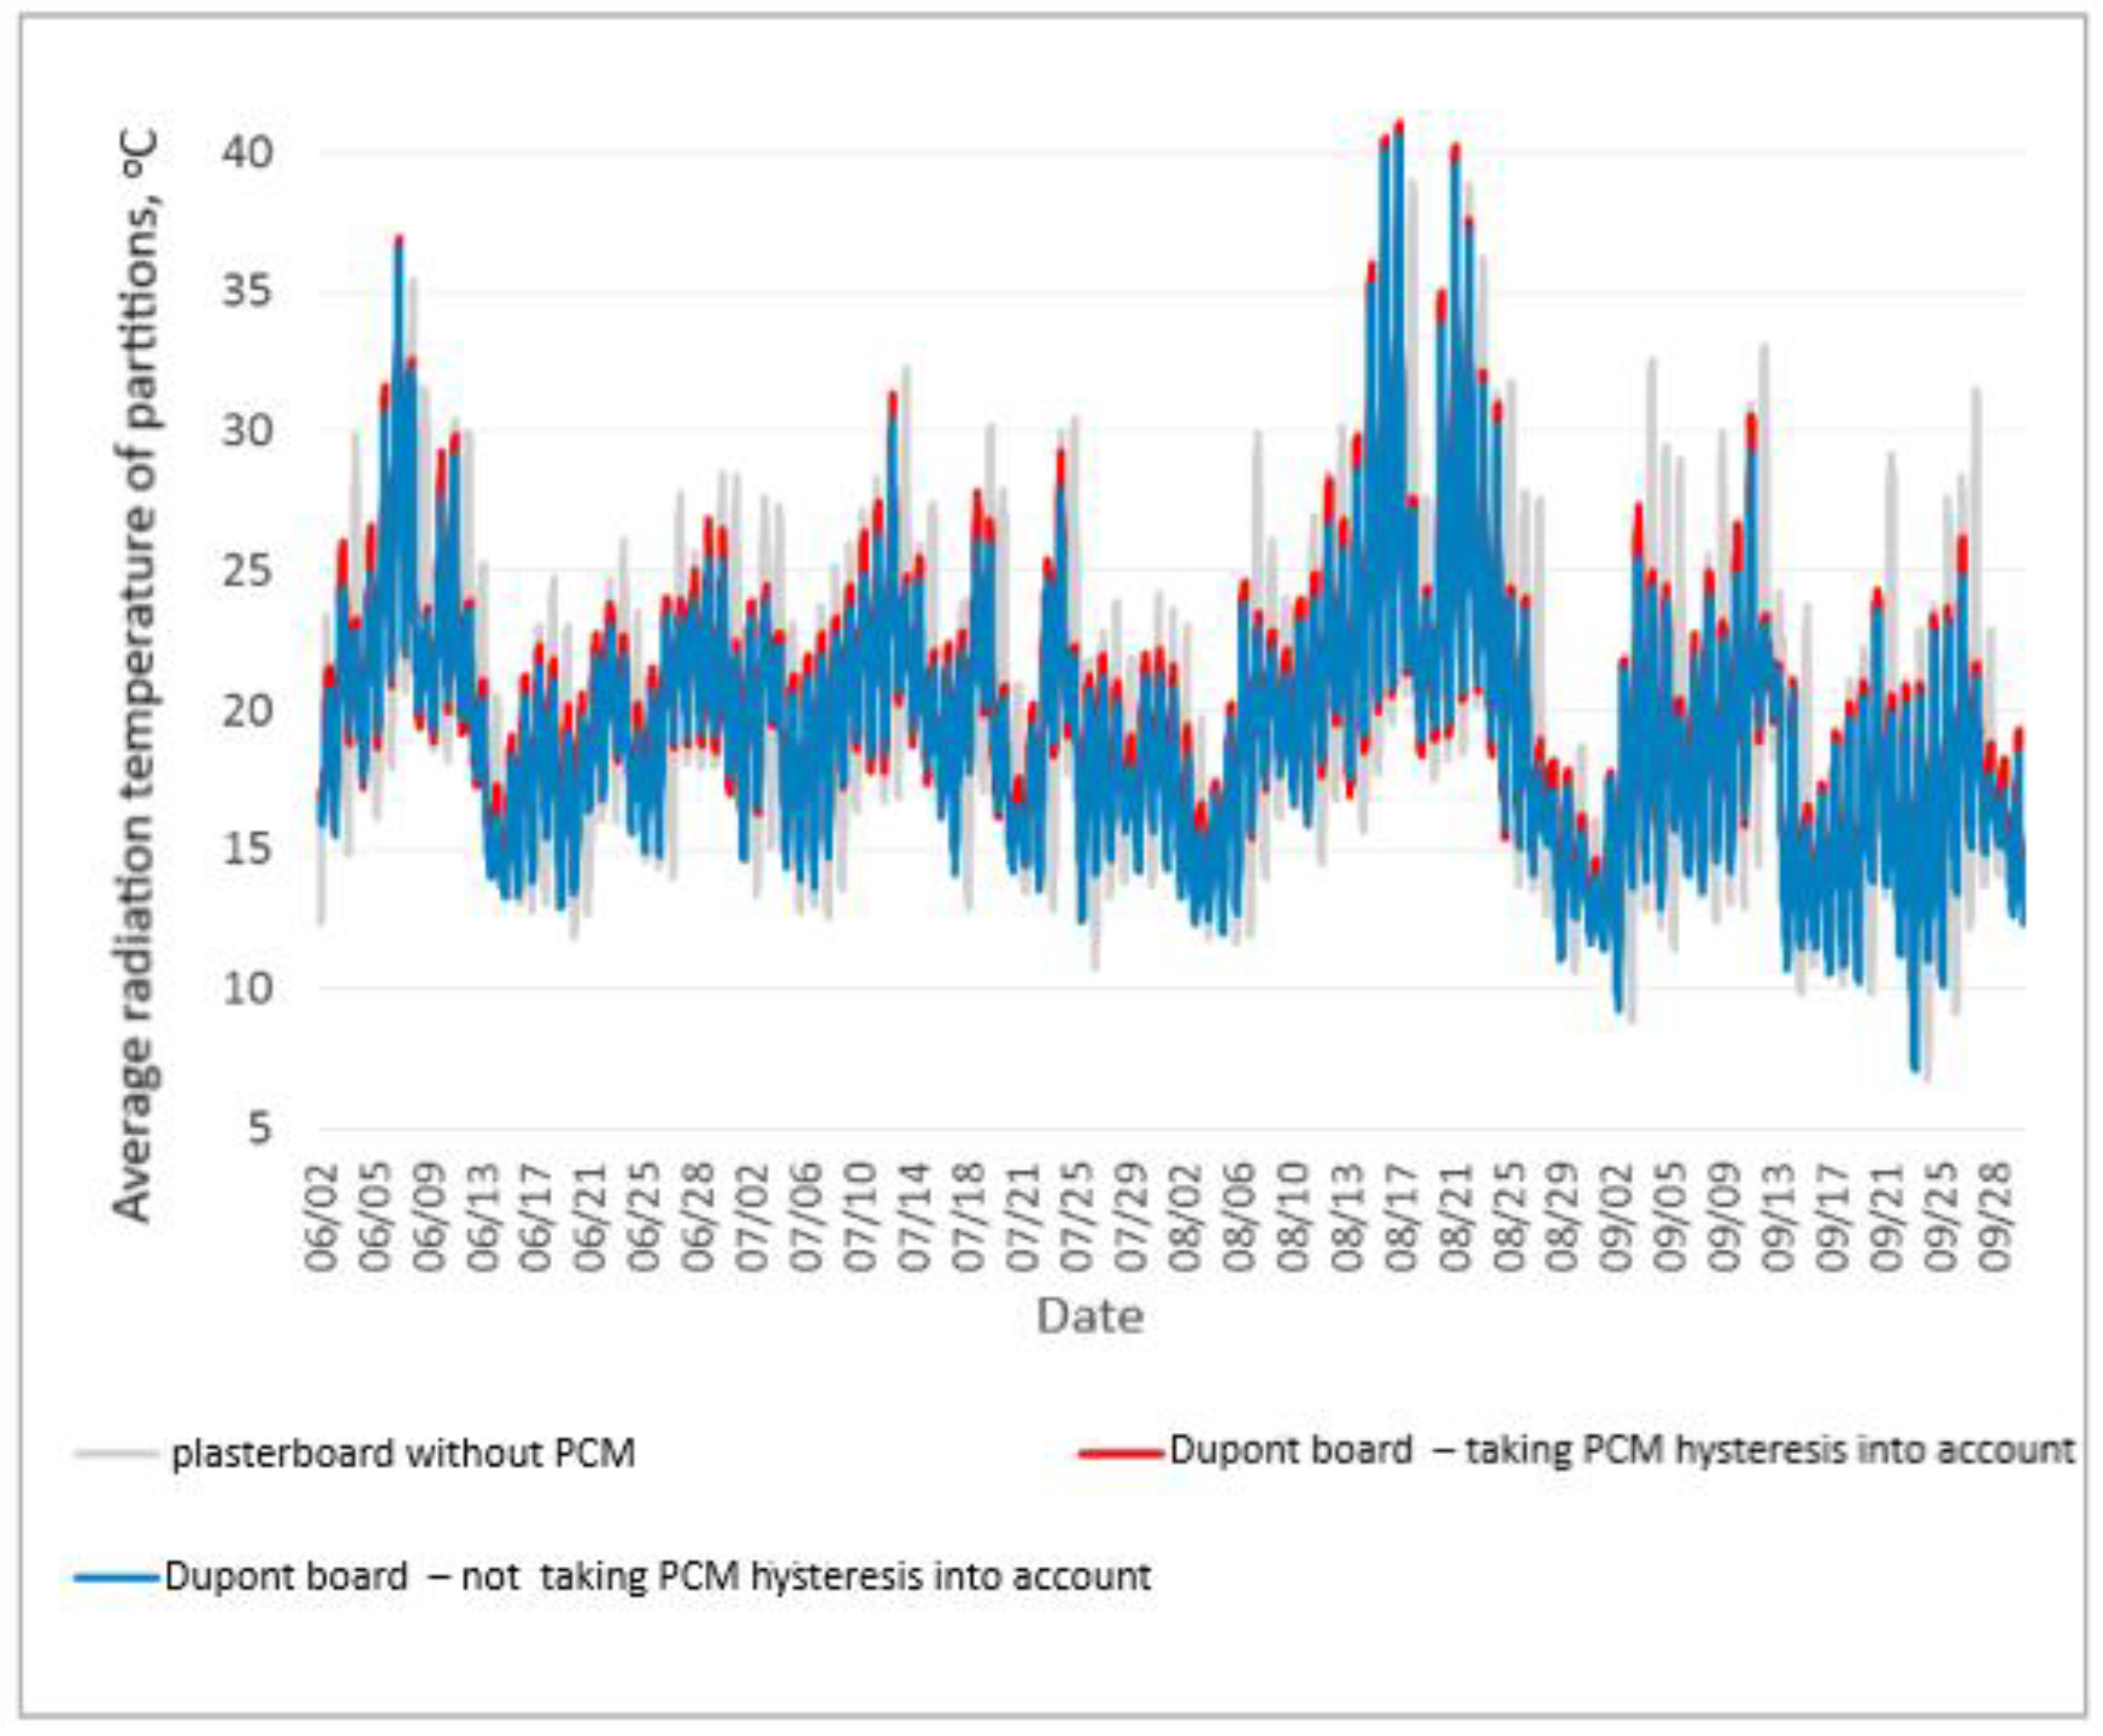
Figure 6 and Figure 7 show the values of the average radiation temperature of the internal surfaces of partitions in the period from 1 July to 30 September for the model with the phase-change material contained in the plasterboard and the Dupont board respectively. In both graphs, there is a noticeable tendency for the occurrence of lower values of the average radiation temperature of the partitions for models in which hysteresis has not been taken into account. The results of the calculations according to this algorithm could, therefore, be treated as more favorable in terms of reducing the risk of overheating of the building analyzed.
Figure 6 and Figure 7 also show a significant difference in the course of the temperature inside the building containing PCM compared to that of the building made of traditional materials, which generally proves the high efficiency of the phase-change materials used in the building analyzed. Good use of the heat capacity of phase changes is, to a large extent, the result of very intensive ventilation during the night period, which increases the probability of complete discharge of the heat energy stored in the partitions during the day.
In the event that the air temperature in the room drops below 20/21 °C during the day, obviously, there are no visible effects of phase-change materials (the temperature on the surface of the boards is almost the same for all three variants). In such cases, the intensity of the night cooling can be reduced.
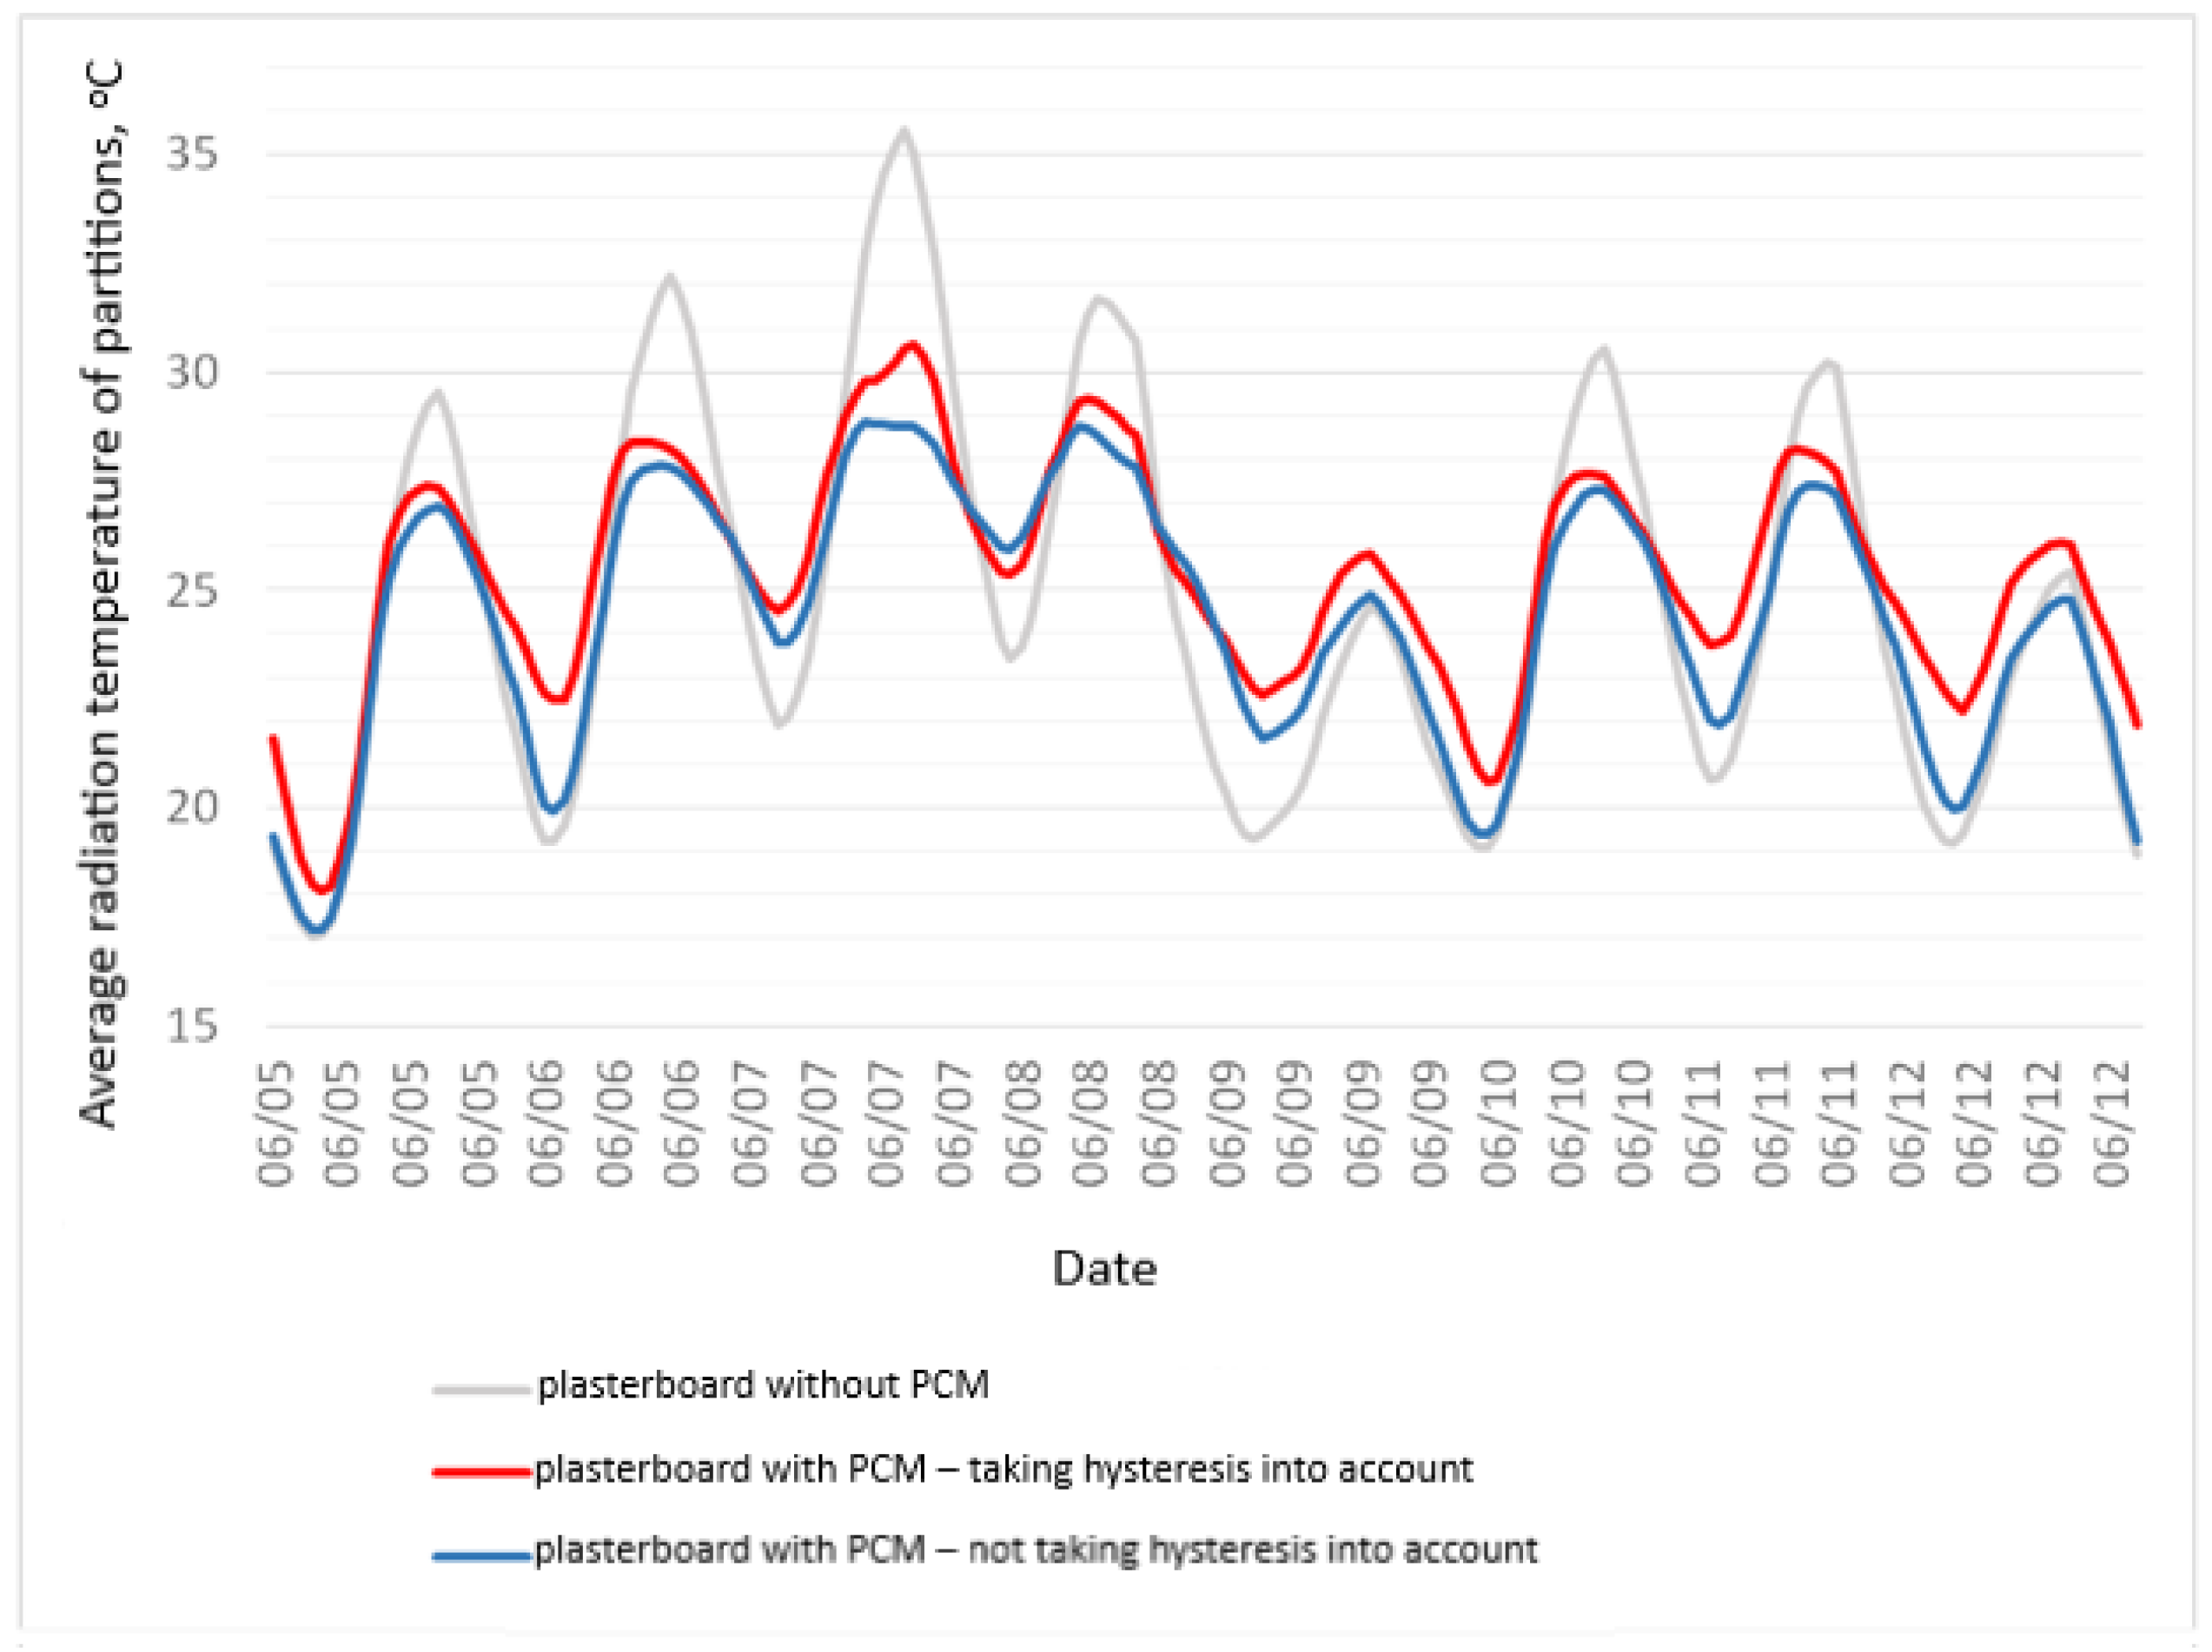
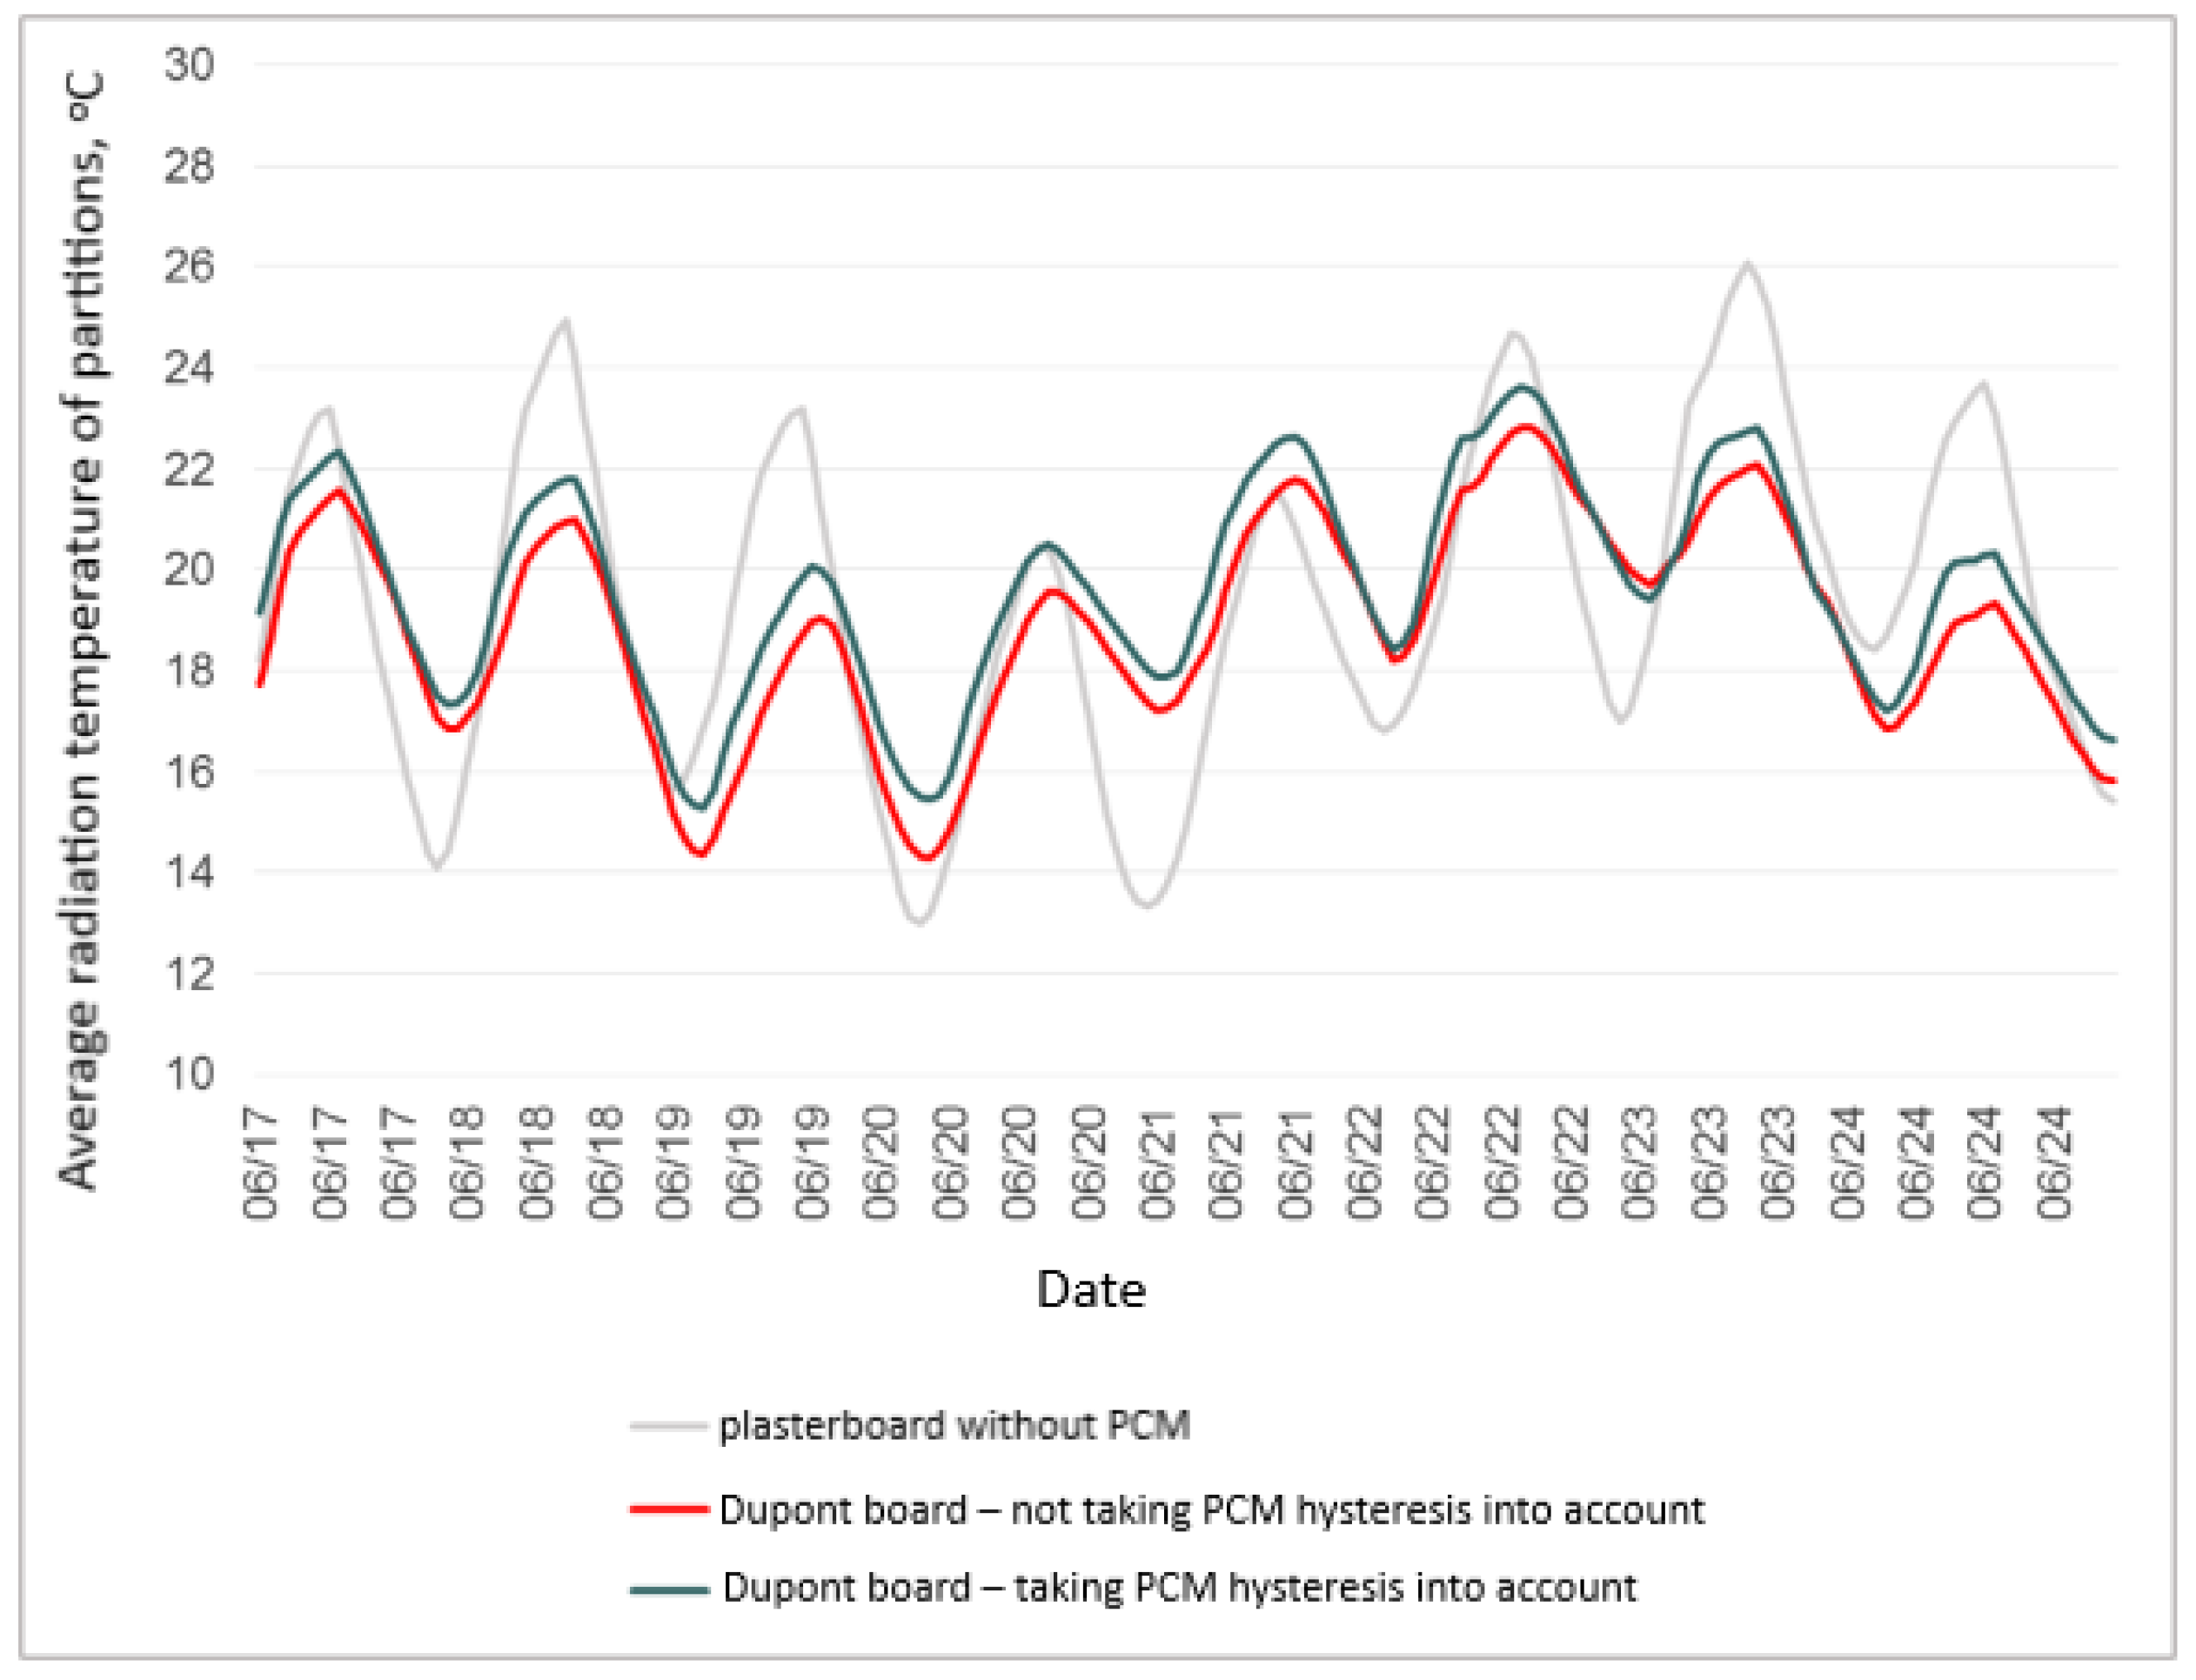
The following figures show the graphs of the average hourly radiation temperature of partitions during the selected week of June for the variants of a building with plasterboards (Figure 8) as well as Dupont board (Figure 9). Here, one can notice much clearer than before the strong influence of the phase-change material on the conditions inside and a large discrepancy in the course of the curves obtained on the basis of the standard algorithm compared to the algorithm modified with hysteresis. Temporary differences resulting from the use of PCM are from −0.98 °C to 3.49 °C for the variant using a plasterboard with PCM and from −0.88 K to 2.51 K for the variant with a Dupont board.
4. Discussion
Table 2 summarizes the number of hours when the surface temperature of PCM materials is lower than the phase change temperature for the period from 1 June to 30 September. Two material variants were analyzed—with a plasterboard containing PCM and a Dupont board—and two calculation variants were analyzed—with and without PCM hysteresis. In both material variants, the frequency distribution is similar—the number of h with the surface temperature below the phase change temperature is greater than the calculations without hysteresis, by 10.6% for the variant with plasterboards and by as much as 29.4% for the variant with Dupont boards, respectively. This may lead to an erroneous conclusion regarding the possibility of releasing the energy stored in PCM. According to the calculations without hysteresis, the solidification of liquid PCM may occur more often, which in turn determines the effectiveness of PCM in subsequent cycles. Depending on the algorithm, the difference in the time when the temperature enables the phase change is 212 h for a plasterboard with PCM and 341 h for a Dupont board.
Calculations of the average surface temperature of materials are presented in Table 3. The results confirm the lower surface temperature in the calculations without taking hysteresis into account. The average temperature of the plasterboard with PCM is lower by 0.62 °C for the variant without hysteresis. In the case of the Dupont board, the difference is 0.49 °C. It should be noted here that the errors mentioned are averages for the entire course of the presented graph-including the periods in which no phase change occurs. The maximum errors mentioned earlier are much larger. The above result shows a tendency to lower the surface temperature when hysteresis is not taken into account, which results in the generation of erroneous information on the discharge of the material. Increasing the accuracy of the simulation influences the possibility of selecting the material better.
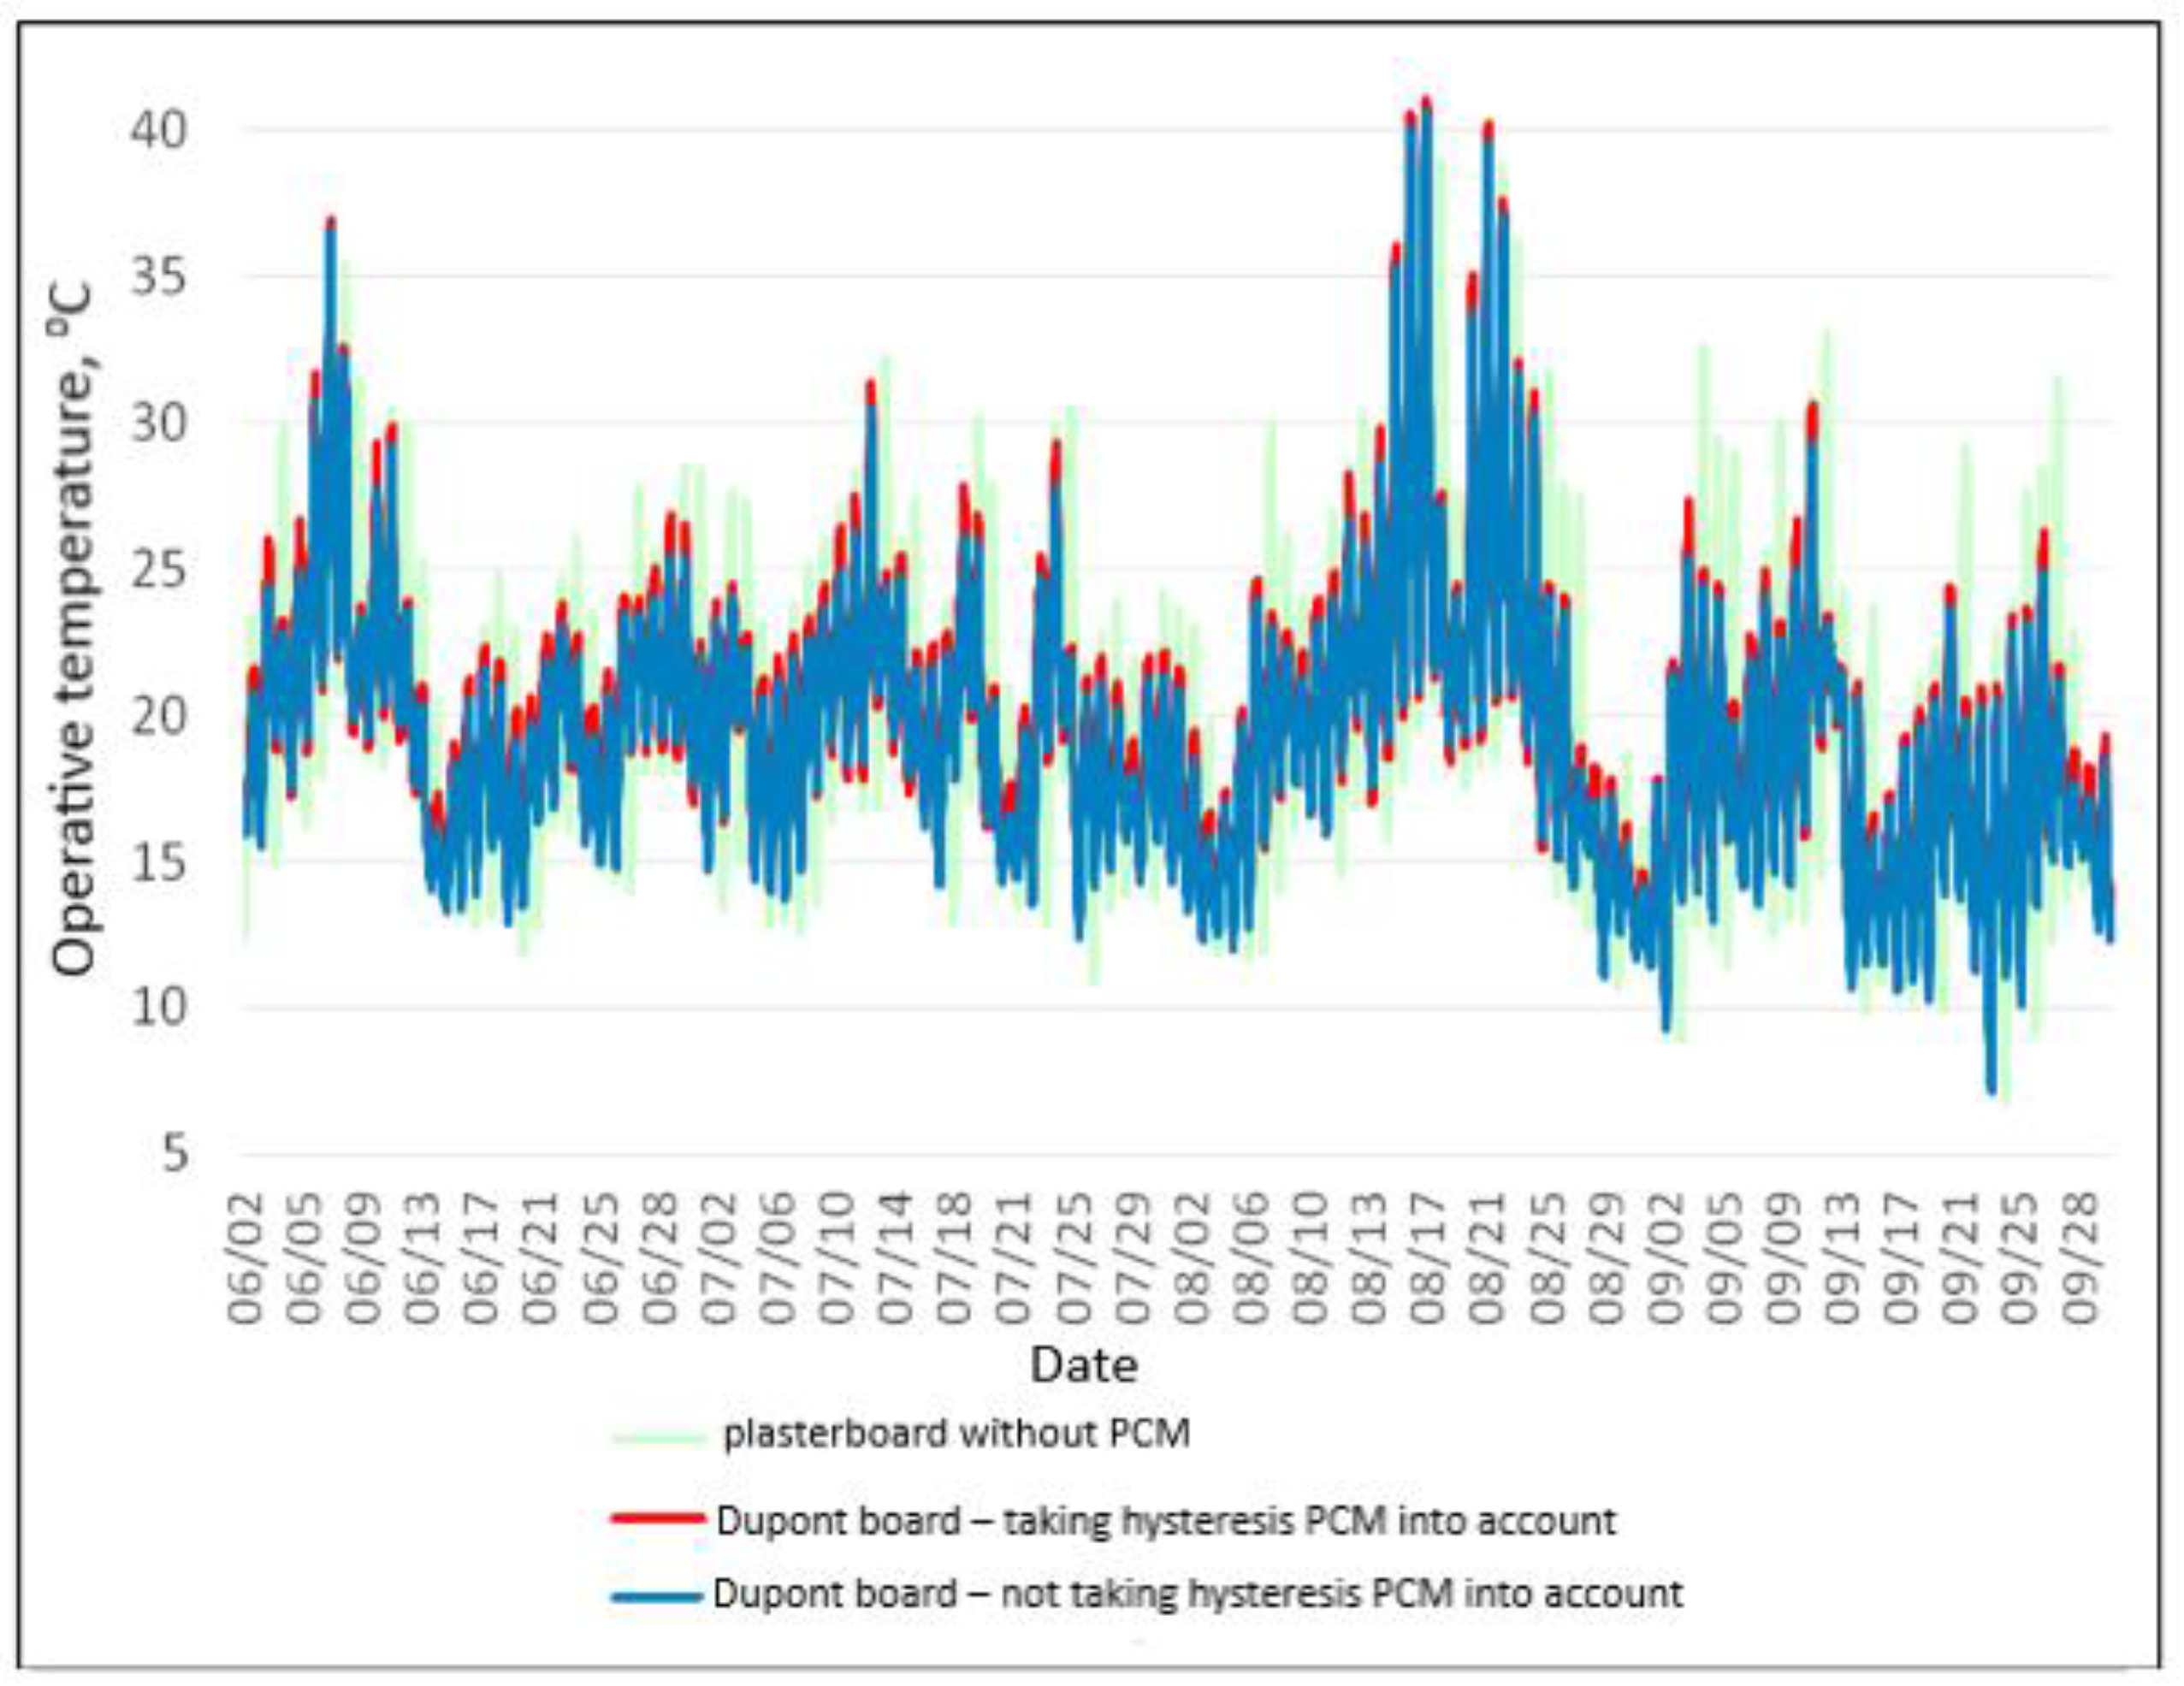
Figure 10 and Figure 11 present the values of the operative temperature inside the building analyzed. The results obtained confirm the observations based on the analysis of the average radiation temperature of the partitions. The use of a modified algorithm results in a higher operative temperature inside the building compared to the calculation results according to the standard algorithm, which does not take into account the hysteresis of the materials. The differences between the results of the operative temperature obtained from different algorithms are in the following ranges: from −0.92 °C to 2.43 °C in the case of plasterboard with PCM, while in the case of Dupont board from −0.65 °C to 2.42 °C.
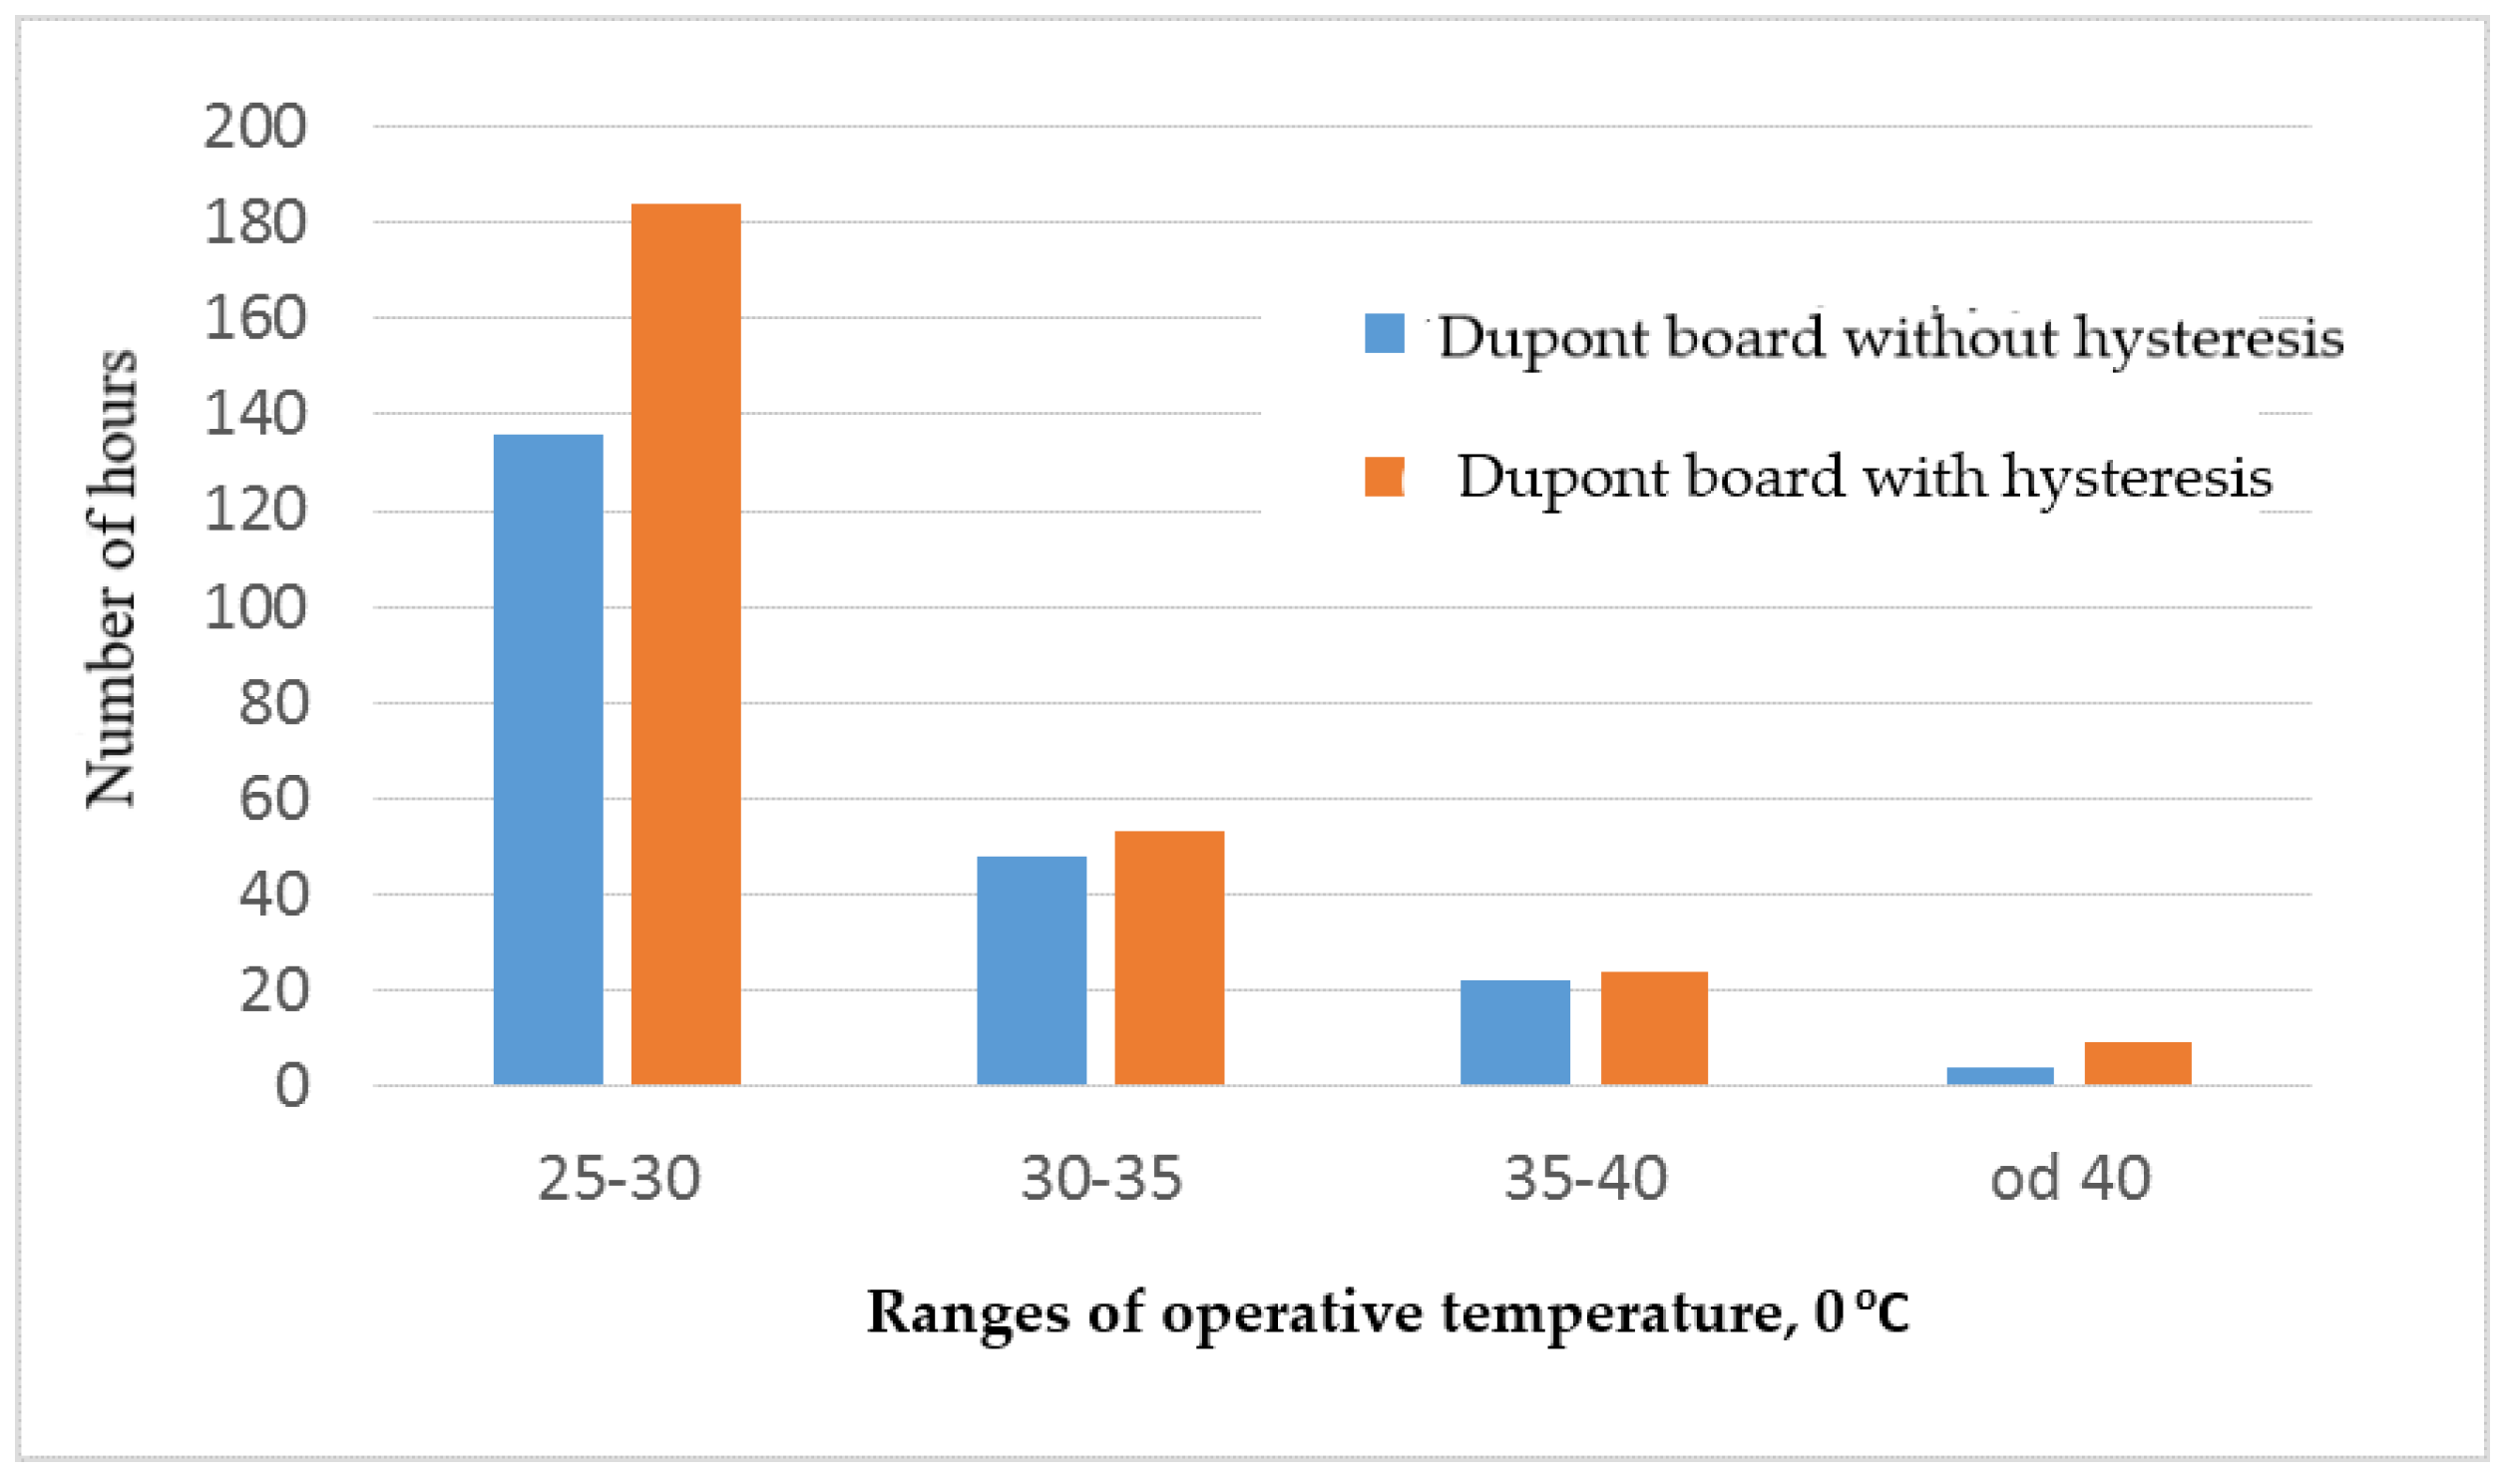
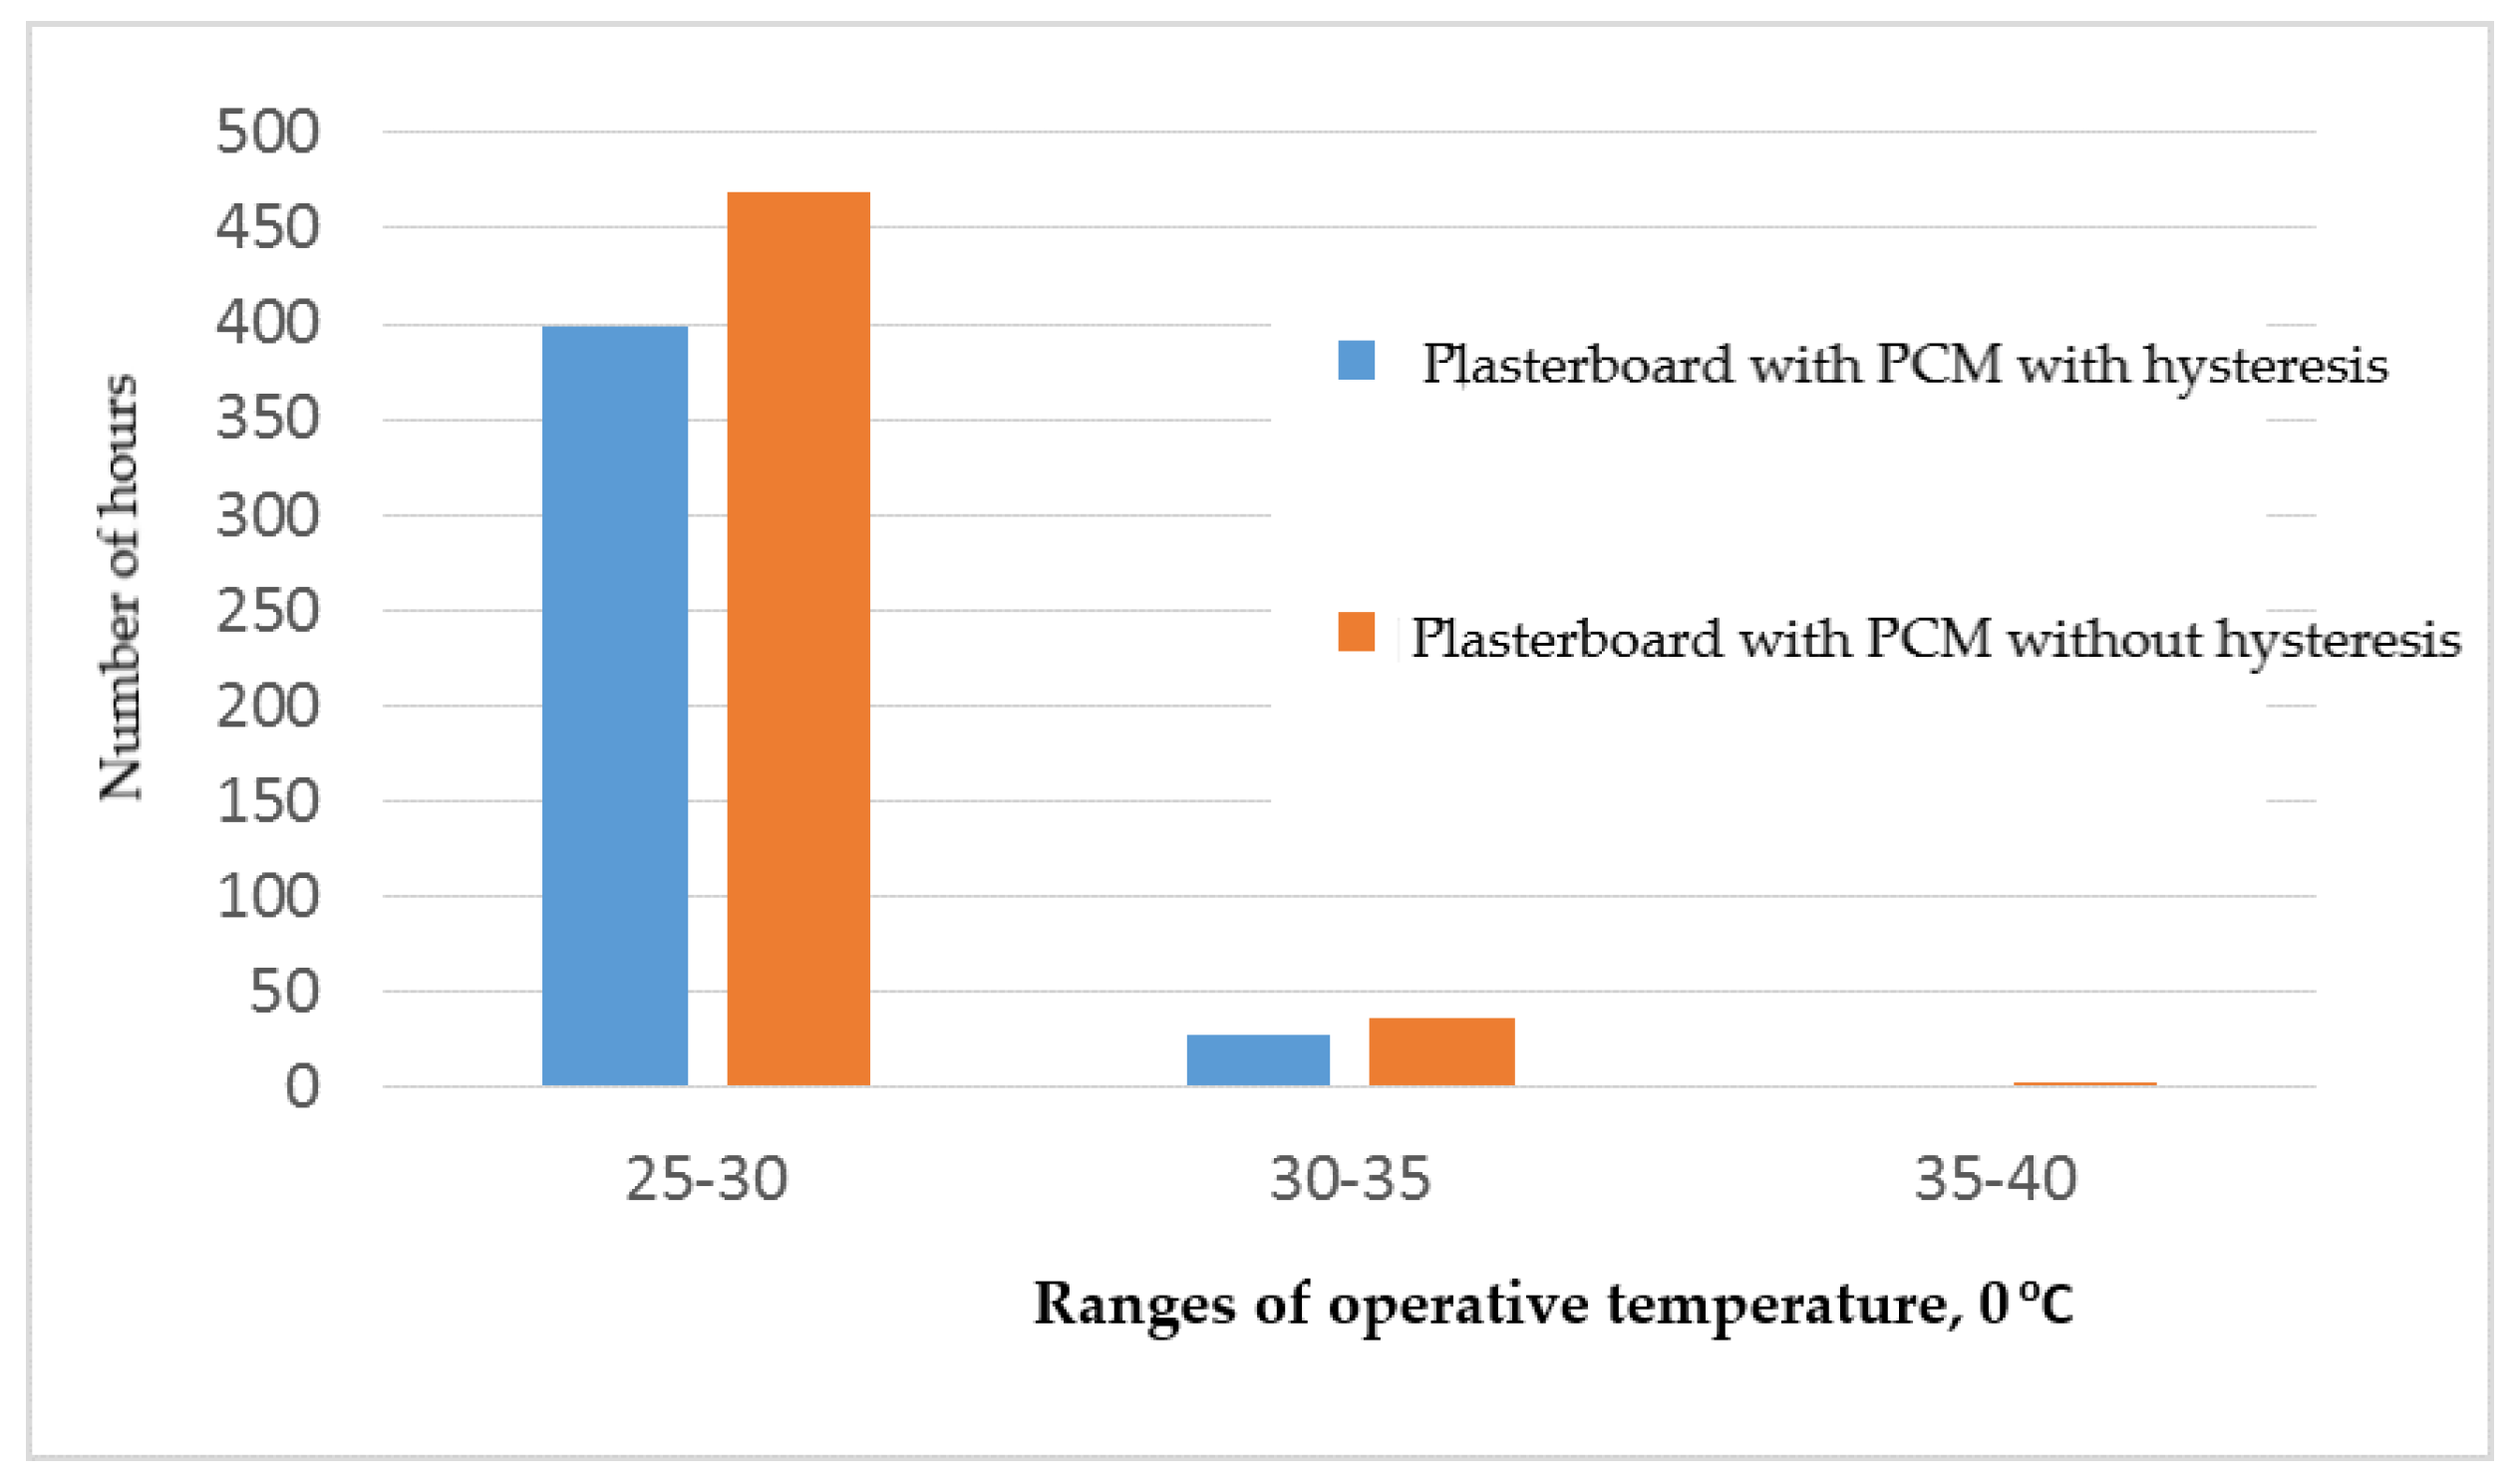
The graphs in Figure 12 and Figure 13 show a comparison of the time of occurrence of individual ranges of operating temperature. Figure 12 is for the Dupont variant and Figure 13 for the PCM plasterboard. The calculation results according to the hysteresis algorithm indicate a higher risk of overheating the building in both material variants. The operating temperature exceeding 25 °C in the case of plasterboards with PCM occurs for a longer period of 82 h, while for Dupont boards, it is longer by 60 h compared to the variant without hysteresis (this corresponds to over 19% and 22.22% of the total time, respectively, with a temperature above 25 °C). At the same time, if hysteresis is taken into account, higher maximum temperatures are obtained. This is due to the previously described consequence of neglecting hysteresis, i.e., underestimating the surface temperature of the materials. According to the calculations, in this case, the material has the ability to release previously stored energy more often. This is of key importance for the possibility of accumulating excessive heat gains in subsequent cycles and, thus, for the proper selection of PCM.
5. Conclusions
In the computer simulations of the object with the phase-change material, organic materials were used, characterized by a relatively low hysteresis of the material, compared to, e.g., inorganic materials. However, the effects of not taking into account even this relatively small hysteresis in the calculations are significant and can lead to significant errors in the calculation (differences in surface temperature values in individual time steps can reach up to 3.49 °C for PCM plasterboards and 2.51 °C for Dupont boards). In the analyzed examples, after taking into account hysteresis in the calculations, the period of surface temperature below the phase change temperature of the materials decreased by 212 and 341 h in the period from 1.06 to 30.09, for the options with PCM boards and Dupont boards, respectively. The average surface temperature for the entire analyzed period increased by 0.62 °C for PCM boards and by 0.49 °C for Dupont boards. Disregarding the hysteresis effect and adopting the same curves of Temperature Dependence of Enthalpy both during the heating and cooling process resulted in generating more favorable results in terms of reducing the risk of overheating of the interior of the analyzed building. Taking hysteresis into account, the period with an operating temperature higher than 25 °C increased by 82 h (19%) for the variant with PCM boards and by 60 h (22.22%) for the variant with Dupont boards. Therefore, neglecting hysteresis in the calculations may lead to overly optimistic forecasts regarding the effectiveness of phase-change materials inside buildings.
Author Contributions
Conceptualization, A.Z.-R. and K.N.; software, A.Z.-R.; writing—review and editing, A.Z.-R. and K.N.; supervision, K.N. All authors have read and agreed to the published version of the manuscript.
Funding
This research received no external funding.
Institutional Review Board Statement
Not applicable.
Informed Consent Statement
Not applicable.
Data Availability Statement
Not applicable.
Conflicts of Interest
The authors declare no conflict of interest.
References
- Moreles, E.; Huelsz, G.; Barrios, G. Hysteresis effects on the thermal performance of building envelope PCM-walls. Build. Simul. 2018, 11, 519–531. [Google Scholar] [CrossRef]
- Zastawna-Rumin, A. The Analysis of the Application Efficiency of Phase Change Materials in Partitions of Polish Low-Energy Buildings. Ph.D. Thesis, Cracow University of Technology, Krakow, Poland, 2018. [Google Scholar]
- Kośny, J. PCM-Enhanced Building Components—An Application of Phase Change Materials in Building Envelopes and Internal Structures; Springer International Publishing: Cham, Switzerland, 2015. [Google Scholar]
- Akeiber, H.; Nejat, P.; Majid, M.Z.A.; Wahid, M.A.; Jomehzadeh, F.; Famileh, I.Z.; Calautit, J.K.; Hughes, B.R.; Zaki, S.A. A review on phase change material (PCM) for sustainable passive cooling in building envelopes. Renew. Sustain. Energy Rev. 2016, 60, 1470–1497. [Google Scholar] [CrossRef]
- Lee, K.O.; Medina, M.A.; Raith, E.; Sun, X. Assessing the integration of a thin phase change material (PCM) layer in a residential building wall for heat transfer reduction and management. Appl. Energy 2015, 137, 699–706. [Google Scholar] [CrossRef]
- Neeper, D.A. Thermal dynamics of wallboard with latent heat storage. Sol. Energy 2000, 68, 393–403. [Google Scholar] [CrossRef]
- Heim, D.; Clarke, J.A. Numerical modelling and thermal simulation of PCM-gypsum composites with ESP-r. Energy Build. 2004, 36, 795–805. [Google Scholar] [CrossRef]
- Jiang, F.; Wang, X.; Zhang, Y. A new method to estimate optimal phase change material characteristics in a passive solar room. Energy Convers. Manag. 2011, 52, 2437–2441. [Google Scholar] [CrossRef]
- Chen, C.; Guo, H.; Liu, Y.; Yue, H.; Wang, C. A new kind of phase change material (PCM) for energy-storing wallboard. Energy Build. 2008, 40, 882–890. [Google Scholar] [CrossRef]
- Soares, N.; Gaspar, A.R.; Santos, P.; Costa, J.J. Multi-dimensional optimization of the incorporation of PCM-drywalls in lightweight steel-framed residential buildings in different climates. Energy Build. 2014, 70, 411–421. [Google Scholar] [CrossRef]
- Ascione, F.; Bianco, N.; de Masi, R.F.; de Rossi, F.; Vanoli, G.P. Energy refurbishment of existing buildings through the use of phase change materials: Energy savings and indoor comfort in the cooling season. Appl. Energy 2014, 113, 990–1007. [Google Scholar] [CrossRef]
- Kuznik, F.; David, D.; Johannes, K.; Roux, J.-J. A review on phase change materials integrated in building walls. Renew. Sustain. Energy Rev. 2011, 15, 379–391. [Google Scholar] [CrossRef] [Green Version]
- Schossing, P.; Henning, H.-M.; Gschwander, S.; Haussmann, T. Micro-encapsulated phase-change materials integrated into construction materials. Sol. Energy Mater. Sol. Cells 2005, 89, 297–306. [Google Scholar] [CrossRef]
- Konuklu, Y.; Paksoy, H. Phase change material sandwich panels for managing solar gain in buildings. J. Sol. Energy Eng. 2009, 131, 41012. [Google Scholar] [CrossRef]
- Kośny, J.; Biswas, K.; Miller, W.; Kriner, S. Field thermal performance of naturally ventilated solar roof with PCM heat sink. Sol. Energy 2012, 86, 2504–2514. [Google Scholar] [CrossRef]
- Kośny, J.; Shukla, N.; Fallahi, A. Cost Analysis of Simple Phase Change Material-Enhanced Building Envelopes in Southern U.S. Climates, Technical Report; National Renewable Energy Lab. (NREL): Golden, CO, USA, 2013. [Google Scholar] [CrossRef] [Green Version]
- Heim, D.; Wieprzkowicz, A. Attenuation of Temperature Fluctuations on an External Surface of the Wall by a Phase Change, Material-Activated Layer. Appl. Sci. 2018, 8, 11. [Google Scholar] [CrossRef] [Green Version]
- Kułakowski, T.; Krempski-Smejda, M.; Heim, D. Heat Transfer with Phase Change in a Multilayer Construction: Simulation versus Experiment. Energies 2021, 14, 4390. [Google Scholar] [CrossRef]
- Singh, R.; Sadeghi, S.; Shabani, B. Thermal Conductivity Enhancement of Phase Change Materials for Low-Temperature Thermal Energy Storage Applications. Energies 2018, 12, 75. [Google Scholar] [CrossRef] [Green Version]
- Iasiello, M.; Mameli, M.; Filippeschi, S.; Bianco, N. Metal foam/PCM melting evolution analysis: Orientation and morphology effects. Appl. Therm. Eng. 2021, 187, 116572. [Google Scholar] [CrossRef]
- Arshad, A.; Jabbal, M.; Sardari, P.T.; Bashir, M.A.; Faraji, H.; Yan, Y. Transient simulation of finned heat sinks embedded with PCM for electronics cooling. Therm. Sci. Eng. Prog. 2020, 18, 100520. [Google Scholar] [CrossRef]
- Ibrahim, N.I.; Al-Sulaiman, F.A.; Rahman, S.; Yilbas, B.S.; Sahin, A.Z. Heat transfer enhancement of phase change materials for thermal energy storage applications: A critical review. Renew. Sustain. Energy Rev. 2017, 74, 26–50. [Google Scholar] [CrossRef]
- Wijesuriya, S.; Tabares-Velasco, P.C.; Biswas, K.; Heim, D. Empirical validation and comparison of PCM modeling algorithms commonly used in building energy and hygrothermal software. Build. Environ. 2020, 173, 106750. [Google Scholar] [CrossRef]
- Serikawa, M.; Mabuchi, K.; Satoh, M.; Nozue, Y.; Hayashi, Y.; Yokoyama, M. Measurement of full-scale phase change material products considering hysteresis. Appl. Therm. Eng. 2021, 192, 116895. [Google Scholar] [CrossRef]
- Mehling, H.; Barreneche, C.; Solé, A.; Cabeza, L.F. The connection between the heat storage capability of PCM as a material property and their performance in real scale applications. J. Energy Storage 2017, 13, 35–39. [Google Scholar] [CrossRef] [Green Version]
- Zastawna-Rumin, A.; Kisilewicz, T.; Berardi, U. Novel Simulation Algorithm for Modeling the Hysteresis of Phase Change Materials. Energies 2020, 13, 1200. [Google Scholar] [CrossRef] [Green Version]
- Kuznik, F.; Virgone, J. Experimental investigation of wallboard containing phase change material: Data for validation of numerical modelling. Energy Build. 2009, 41, 561–570. [Google Scholar] [CrossRef]
- Gowreesunker, B.L.; Tassou, S.A.; Kolokotroni, M. Improved simulation of phase change processes in applications where conduction is the dominant heat transfer mode. Energy Build. 2012, 47, 353–359. [Google Scholar] [CrossRef] [Green Version]
- Barz, T.; Sommer, A. Modeling hysteresis in the phase transition of industrial-grade solid/liquid PCM for thermal energy storages. Int. J. Heat Mass Transf. 2018, 127, 701–713. [Google Scholar] [CrossRef]
- Goia, F.; Chaudhary, G.; Fantucci, S. Modelling and experimental validation of an algorithm for simulation of hysteresis effects in phase change materials for building components. Energy Build. 2018, 174, 54–67. [Google Scholar] [CrossRef]
- Al-Janabi, A.; Kavgic, M. Application and sensitivity analysis of the phase change material hysteresis method in EnergyPlus: A case study. Appl. Therm. Eng. 2019, 162, 114222. [Google Scholar] [CrossRef]
- Buonomano, A.; Guarinoc, F. The impact of thermophysical properties and hysteresis effects on the energy performance simulation of PCM wallboards: Experimental studies, modelling, and validation. Renew. Sustain. Energy Rev. 2020, 126, 109807. [Google Scholar] [CrossRef]
- Judkoff, R.D.; Neymark, J.; Beausoleil-morrison, I.; Crawley, D.B.; Knebel, D.E.; Rees, S.J.; Walton, G.N.; Wilcox, B.A.; Dougherty, B.P.; Hogan, J.F.; et al. Standard Method of Test for the Evaluation of Building Energy Analysis Computer Programs; Approved by the ASHRAE Standards Committee on June; American Society of Heating, Refrigerating and Air-Conditioning Engineers, Inc.: Atlanta, GA, USA, 2016. [Google Scholar]
- Rozporządzenie Ministra Infrastruktury i Budownictwa z Dnia 14 Listopada 2017 r. Zmieniające Rozporządzenie w Sprawie Warunków Technicznych, Jakim Powinny Odpowiadać Budynki i Ich Usytuowanie. Available online: http://isap.sejm.gov.pl/isap.nsf/DocDetails.xsp?id=WDU20170002285 (accessed on 31 August 2021).
- Tabares-Velasco, P.C.; Christensen, C.; Bianchi, M. Verification and validation of EnergyPlus phase change material model for opaque wall assemblies. Build. Environ. 2012, 54, 186–196. [Google Scholar] [CrossRef]
- Zastawna-Rumin, A.; Nowak, K. The utilization rate of potential heat accumulation capabilities using latent heat of phase-change materials. In Proceedings of the 10th International Conference IAQVEC 2019: Indoor Air Quality, Ventilation and Energy Conservation in Buildings, Bari, Italy, 5–7 September 2019; Volume 609, p. 62021. Available online: https://iopscience.iop.org/article/10.1088/1757-899X/609/6/062021/pdf (accessed on 31 July 2021).
- Dutil, Y.; Rousse, D.; Lassue, S.; Zalewski, L.; Joulin, A.; Virgone, J.; Kuznik, F.; Johannes, K.; Dumas, J.-P.; Bédécarrats, J.-P.; et al. Modeling phase change materials behavior in building applications: Comments on material characterization and model validation. Renew. Energy 2014, 61, 132–135. [Google Scholar] [CrossRef] [Green Version]
- Haghighat, F.; Yu, Z.; Inard, C.; Michaux, G.; Kuznik, F.; Johannes, K.; Virgone, J.; Barzin, R.; Farid, M.; Bastani, A.; et al. Annex 23: Energy Storage in Buildings of the Future—Applying Energy Storage in Ultra-Low Energy Buildings; International Energy Agency: Paris, France, 2013; pp. 1–314. [Google Scholar]
Figure 1.
Model of the building used for simulation calculations.

Figure 2.
Temperature dependence of enthalpy for Dupont boards.

Figure 3.
Enthalpy curves for the heating and cooling processes of PCM contained in a plasterboard [2].
Figure 3.
Enthalpy curves for the heating and cooling processes of PCM contained in a plasterboard [2].

Figure 4.
Phase change hysteresis process represented as a function of temperature [26].
Figure 4.
Phase change hysteresis process represented as a function of temperature [26].

Figure 5.
Intermediate transition curve between solidification (a) and melting (b) curves [26].
Figure 5.
Intermediate transition curve between solidification (a) and melting (b) curves [26].

Figure 6.
Average hourly values of radiation temperature of partitions in a building with plasterboards.
Figure 6.
Average hourly values of radiation temperature of partitions in a building with plasterboards.

Figure 7.
Average hourly values of radiation temperature of partitions in a building with Dupont boards.
Figure 7.
Average hourly values of radiation temperature of partitions in a building with Dupont boards.

Figure 8.
Average hourly values of radiation temperature of partitions inside a building with plasterboards in the period 5 June–12 June.
Figure 8.
Average hourly values of radiation temperature of partitions inside a building with plasterboards in the period 5 June–12 June.

Figure 9.
Average hourly values of radiation temperature of partitions inside a building with Dupont boards in the period 17 June–24 June.
Figure 9.
Average hourly values of radiation temperature of partitions inside a building with Dupont boards in the period 17 June–24 June.

Figure 10.
Operative temperature inside the analyzed building with Dupont boards.

Figure 11.
Operative temperature inside the analyzed building with plasterboards.

Figure 12.
The time of occurrence of the operative temperature in individual ranges in the variant with a Dupont board.
Figure 12.
The time of occurrence of the operative temperature in individual ranges in the variant with a Dupont board.

Figure 13.
The time of occurrence of the operative temperature in individual ranges in the variant with a plasterboard with PCM.
Figure 13.
The time of occurrence of the operative temperature in individual ranges in the variant with a plasterboard with PCM.


Table 1.
Material data of the basic variant of the building.
| Type of Partition | Material | Thermal Conductivity, W/m·K | Thickness, m | Density, kg/m3 | Specific Heat, J/kg K |
|---|---|---|---|---|---|
| Walls | plasterboard | 0.16 | 0.012 | 950 | 840 |
| thermal insulation | 0.04 | 0.2 | 12 | 840 | |
| wooden panels | 0.14 | 0.009 | 530 | 900 | |
| Roof | plasterboard | 0.16 | 0.01 | 950 | 840 |
| thermal insulation | 0.04 | 0.25 | 12 | 840 | |
| wooden panels | 0.14 | 0019 | 530 | 900 | |
| Floor | wooden floor | 0.16 | 0.01 | 950 | 840 |
| thermal insulation | 0.04 | 0.25 | 12 | 840 |
Table 2.
Frequency of occurrence of the surface temperature of PCM below the phase change temperature in individual material variants and calculation variants.
Table 2.
Frequency of occurrence of the surface temperature of PCM below the phase change temperature in individual material variants and calculation variants.
| Material Variants | Number of Hours of Surface Temperature below the Phase Change Temperature, h | ||
|---|---|---|---|
| Variant | Difference, h | ||
| Without Hysteresis | With Hysteresis | ||
| Plasterboard with PCM | 1993 | 1781 | 212 |
| Dupont board | 1161 | 820 | 341 |
Table 3.
Average surface temperature of materials for individual material variants and calculation variants.
Table 3.
Average surface temperature of materials for individual material variants and calculation variants.
| Material Variants | Average Surface Temperature of PCM, °C | ||
|---|---|---|---|
| Variant | Difference, h | ||
| Without Hysteresis | With Hysteresis | ||
| Plasterboard with PCM | 20.31 | 20.93 | –0.62 |
| Dupont board | 20.10 | 20.59 | –0.49 |
Publisher’s Note: MDPI stays neutral with regard to jurisdictional claims in published maps and institutional affiliations. |
© 2021 by the authors. Licensee MDPI, Basel, Switzerland. This article is an open access article distributed under the terms and conditions of the Creative Commons Attribution (CC BY) license (https://creativecommons.org/licenses/by/4.0/).
Share and Cite
MDPI and ACS Style
Zastawna-Rumin, A.; Nowak, K. Effects of Neglecting PCM Hysteresis While Making Simulation Calculations of a Building Located in Polish Climatic Conditions. Appl. Sci. 2021, 11, 9166. https://doi.org/10.3390/app11199166
AMA Style
Zastawna-Rumin A, Nowak K. Effects of Neglecting PCM Hysteresis While Making Simulation Calculations of a Building Located in Polish Climatic Conditions. Applied Sciences. 2021; 11(19):9166. https://doi.org/10.3390/app11199166
Chicago/Turabian StyleZastawna-Rumin, Anna, and Katarzyna Nowak. 2021. "Effects of Neglecting PCM Hysteresis While Making Simulation Calculations of a Building Located in Polish Climatic Conditions" Applied Sciences 11, no. 19: 9166. https://doi.org/10.3390/app11199166
Note that from the first issue of 2016, this journal uses article numbers instead of page numbers. See further details here.