
Strength Analysis of Real-Life Passwords Using Markov Models


Faculty of Electrical Engineering and Computer Science, University of Maribor, 2000 Maribor, Slovenia
*
Author to whom correspondence should be addressed.
†
Current address: Koroška cesta 46, 2000 Maribor, Slovenia.
‡
These authors contributed equally to this work.
Appl. Sci. 2021, 11(20), 9406; https://doi.org/10.3390/app11209406
Submission received: 20 August 2021
/
Revised: 23 September 2021
/
Accepted: 30 September 2021
/
Published: 11 October 2021
(This article belongs to the Special Issue Advances in Information Security and Privacy)
Abstract
:Recent literature proposes the use of a proactive password checker as method for preventing users from creating easy-to-guess passwords. Markov models can help us create a more effective password checker that would be able to check the probability of a given password to be chosen by an attacker. We investigate the ability of different Markov models to calculate a variety of passwords from different topics, in order to find out whether one Markov model is sufficient for creating a more effective password checker. The results of our study show that multiple models are required in order to be able to do strength calculations for a wide range of passwords. To the best of our knowledge, this is the first password strength study where the effect of the training password datasets on the success of the model is investigated.
1. Introduction
Authentication is the core of today’s Web experience. The online services, social networks (e.g., Facebook, Twitter etc.) and websites require an authentication so that users can create a profile, post messages and comments, and tailor the website’s content so it can match their interests. In an information security sense, authentication is the process of verifying someone’s identity and typically it can be classified into three main categories: knowledge-based authentication-“what you know” (e.g., textual or graphical passwords), biometrics authentication-“what you are” (e.g., retina, iris, voice, and fingerprint scans), and token-based authentication-“what you have” (e.g., smart cards, mobile phones or other tokens). Lately, another alternative authentication method is becoming more available-the two-step verification. We focus on the first category and in particular, on the textual passwords and their security simply because the username-password combination used to be [1,2] and still is the most widely used method for authentication [3], due to their simplicity and cost effectiveness. The problems related to textual passwords and password security are not new. Morris and Thompson [4] were first to identify textual passwords as a weak point in information system’s security. More than three decades ago, they conducted experiments about typical users’ habits about how they choose their passwords. They reported that many UNIX-users have chosen passwords that were very weak: short, contained only lower-case letters or digits, or appeared in various dictionaries. The aforementioned problems still exist today and are still being made to solve them. However, users fail to implement the behaviours necessary to stay safe and secure, even though they are aware of the security issues. They create the easiest-to-remember passwords regardless of any recommendations or instructions and tend to trade security for memorability. Some important literature [5,6,7,8,9] proposes the use of a proactive password checker as a method (beyond simple dictionary lookup and composition rules) for preventing users from entering simple and easy-to-guess passwords into a computer system. The core property of a proactive password checker to be more effective and more prudent is the ability to check the probability of a given password to be chosen by the user and hence the probability to be chosen by an attacker. Some passwords are more likely to be chosen than others since certain letters and combinations of letters in any given language occur with varying frequencies.
1.1. Motivation
Some relevant literature [10,11,12,13] suggests that Markov models can be used as a tool that can aid the development of such a proactive checker since they can estimate the strength of a password by estimating the probability of the n-grams that compose the password. The estimation can be better if the model is trained on actual password datasets. However, a recent study in this area [14] suggests that state-of-the-art strength meters from academia, that are based on probabilistic context-free grammar (PCFG) and Markov models, are not enough competent at scoring weak passwords (which is basically their primary goal). They further argue (based on experimental comparison) that Markov models are no longer suitable for password scoring since they underperform compared to the PCFG technique. The authors present an explanation for this invalidation of commonly accepted belief that Markov models could be used to create better proactive password strength meters/checkers (than probabilistic context-free grammar). The provided rational states that smoothing techniques (e.g., backoff, Laplace and Good-Turing [13]) used in Markov models make them better at cracking passwords (i.e., predicting more unseen passwords), yet this, in turn, makes Markov-based strength meters subject to the sparsity problem and worse at measuring weak passwords.
Our motivation for this study is based on the weaknesses of Markov models stated and presented in [14], and the commonly known issues related to Markov models-sparsity and overfitting [9,13]. As stated in [9,14] at some point the performance of the Markov model is reduced because the model overfits the data and is not able to properly score weak passwords anymore. One possible reason (besides the ones stated in [14]) for this issue could be due to the fact that datasets used for training differ in terms of size, password types, localization etc. Furthermore, as it is clear from the literature ([9,12,15]), these models are mostly trained only on one training dataset or, at most, on a few datasets ([16]). This could limit the performance of the model in terms of properly scoring weak or very strong passwords. Since training datasets are core in developing the models, it is clear that they will have some effect in the final password scoring that the Markov model produces, which is also clearly suggested in [16]. Therefore, what we explore in our study is how significant is this effect and how other characteristics (e.g., size of the dataset, average password length, number of unique passwords etc.) affect the final password scoring.
We primarily focus on investigating the effect of different, but similar, training datasets on strength estimation. For the purpose of our study we analyse publicly available datasets of “common passwords” and process them regarding the frequency distribution of letters these passwords contain. Based on these datasets and the frequency distributions, we built different Markov models. This would help us find out if one Markov model is sufficient, or if multiple models are needed for the password checker to be effective for a wide range of passwords. To the best of our knowledge, this is the first time where the effects of the training dataset on the final password score are investigated in detail.
1.2. Goals
The goals of this paper are: (i) to find out if different Markov models (trained on different password datasets) will provide statistically different results when tested on the same password dataset, (ii) to find out if one model (that is trained on one big dataset, composed of multiple different datasets) is sufficient for creating an effective password checker, and (iii) to find out if Markov models of different orders (specifically of first and second order) will produce statistically different results. We address these goals by focusing on investigating whether there is a statistically significant difference in the scores from different models, trained on different training datasets. Furthermore, we investigate whether the order of the model has some significant effect on the success of the model.
1.3. Contributions
We make three contributions in this area. The first, and also the novelty in this research field, lies in training the models on a variety of datasets (12 in total), each with different characteristics, and testing them on the same password dataset in order to investigate the effect of the dataset on the success of the model. In particular, we show that the dataset has a significant effect on the final scoring of the passwords. The fact that different training datasets can lead to statistically different password scores, leads us to the conclusion that it is very important what kind of dataset is used to train the Markov models. We argue that one universal dataset should not be used to train one Markov model if we want to have an effective password scoring tool. The second contribution is the confirmation of our previous statement: the use of multiple different Markov models is better for efficient estimation of password strength rather than using one universal model, which is trained on one big dataset that combines multiple different datasets. Finally, the third contribution is that we showed that the difference in outputs between two Markov models with different orders (1st and 2nd) is, in most cases, not statistically significantly different. Therefore, the general conclusion here is that, without a doubt, it is important to analyse the dataset before selecting the order of the model.
Overall, we show that if we want to have an effective password scoring tool for calculating the strength of a wide range of passwords, it would be required to use multiple different Markov models, which should be constructed and trained on a particular dataset of passwords so that they can be more efficiently used on that particular password group.
1.4. Organization
The rest of the paper is organized as follows: we present and review the related work in Section 2, and we provide some background of Markov models in Section 3. In Section 4 we describe our experimental methodologies, the construction of our models, the datasets, and the processing of the datasets we used, including the choice of training/testing datasets. Next, we present the results of our study in Section 5. We discuss the results and the ethical considerations of the study in Section 6. In Section 7 we present our final conclusions.
2. Related Work
In this section, we provide a short review of relevant previous studies that deal with calculating the password strength or password cracking process and are closely related to Markov models.
The strength analysis of users’ passwords has been one active research area since passwords were exposed as the weakest link in information system’s security in 1979 by Morris and Thompson. There are various techniques that have been used for both calculating the strength of the password and enhancing the password cracking process.
2.1. Basic Password Strength Calculation
The basic password strength calculation is done by a simple password policy or, as it is also called-a password rule system. Such a system has the ability to estimate the strength of a given password by analysing its structure i.e., the number of upper case, lower case, or whether it contains numbers or special characters. The estimation is a binary result which tells whether the passwords meets the requirements of the policy or not. One major weakness of a password rule system is that users and their textual passwords are still considered “the weakest link”. Users tend to choose weak passwords and passwords that are easy-to-guess and can be found in a dictionary [17]. Because of this, such a password rule system fails when it comes to preventing weak passwords from entering the system. For example, a password “Password1!” may be acceptable for the password rule system (it contains an upper case, a number and a special character), but it is still the most common and one of the easiest passwords to be cracked (with the use of a personal computer it can be cracked within seconds). We need more advanced password rules that can additionally check the possibility that a given password can be chosen by the attacker. This is where Markov models come to the rescue since they can be used as an aid to brute-force or dictionary password cracking.
2.2. Entropy
One of the earliest method for password scoring is entropy. In information theory, entropy is the expected value of the information contained in a message. Authors in [18] attempt to determine the effectiveness of using information entropy (more specifically, Shannon entropy) as a measurement of the security of various password policies. They accomplish this by analysing the success rate of standard password cracking techniques against multiple sets of real-life passwords. Their experiments show that password entropy does not provide a valid metric for measuring the security provided by password creation policies. Furthermore, they found that the most common password creation policies remain vulnerable to online attacks, since users are using easy-to-guess passwords that still comply with the requested policy (e.g., ”Password1!”).
2.3. Probabilistic Context-Free Grammars
Another tool for password cracking are probabilistic context-free grammars as an aid in the creation of word-mangling rules, proposed by Weir et al. in [19]. Probabilistic password cracking is based on the assumption that not all guesses have the same probability of cracking a password (i.e., some passwords are more probable to be guessed than others). Probabilistic context-free grammars are based on a probability distribution of user’s passwords and measure the frequencies of certain patterns associated with the password strings. Authors trained this method on different sets of previously disclosed passwords. They used some of the sets for training and others for testing the solution and calculating password probabilities. As a comparison against the PCFG password cracking technique, authors use John the Ripper’s default word-mangling rules. The results of the study show that this technique performed better than John the Ripper by cracking 28–129% more passwords, given the same number of guesses.
A study by Houshmand et al. [20] presents an improved PCFG for password cracking by systematically adding keyboard patterns and multi-word patterns to the context-free grammars used in probabilistic password cracking. They state that while their probabilistic password cracking approach shows consistent effectiveness, at one point it gets “stuck” in a dead end. Authors suggest that maybe at that point it is better to support Markov or brute force guessing.
2.4. Markov Models
One of the earliest use of Markov models as a password cracking tool was by Narayanan and Shmatikov in [10]. They used them as an improvement of rainbow table cracking, by training Markov models to general rules that passwords follow. They show that Markov models might have an important application for distributed password cracking. This work also is the first to hint that Markov models can be used as a tool for calculating password strength and shows that they can perform better than the Rainbow attack by recovering 96% of the passwords over the 39% recovered by the Rainbow attack.
Later, a survey of the most common techniques used in public and private tools for enhancing the password cracking process was made by Marechal [11]. The paper is mainly focused on using Markov models as a powerful tool for password cracking and as a password generator, for generating the most common passwords used as a supplement for the dictionary or the brute-force attack. The findings in this paper show that the Markov password generator, despite it being slower than John the Ripper [21] was actually performing better. According to this study, Markov tools can be included in a password-checking policy so it can be more effective than those that only check the structural content of the password.
Different password cracking techniques (attacks) were analysed by Dell’ Amico et al. in [9] in order to find out what is the probability of breaking a given password. The authors compared the search space against a number of cracked passwords for guessing techniques like dictionary attacks, brute force, dictionary mangling, probabilistic context-free grammars, and Markov models. These password cracking techniques were tested on three different large datasets of passwords. Their findings show that no single cracking strategy prevails over the others: dictionary attacks are most effective in discovering weak passwords, dictionary mangling is useful when the base dictionaries are exhausted and Markov-model techniques are powerful in breaking strong passwords. The authors of the study believe that proactive password checking is a better approach in persuading the users to put more effort into choosing their password.
Markov models as a tool for calculating password strength were already mentioned in [11] where the authors showed that password crackers based on Markov models can outperform existing cracking techniques. In [12] Markov models are used as a concept for adaptive password strength meters that can estimate the password strength. Password checkers have a very important role in providing security of computer systems since they are the mechanism that should prevent bad passwords from getting into the system. This study focuses on building adaptive password strength meters based on Markov models. They measured the accuracy of their construction by comparing the scores of the meter to the scores of other meters (Google, Microsoft etc.) as well as to the ideal password strength meter. The results of the study show that their Markov-based password strength meter achieves higher accuracy and outperforms commonly used password meters.
A similar probabilistic framework for estimation of password strength is proposed in [15]. The proposed framework is based on a very large public dataset containing 75,000,000 unique passwords. As part of the framework, two different Markov models are considered and tested: simple Markov model, where the transition probability from one character to another depends only on the previous state, and layered Markov model, where the transition probability also takes into account the position of the character in the given password. Both models are analysed and tested using different independent datasets simulating a conventional password guessing attack. The authors argue, based on the results of the study, that such a probabilistic framework may be capable of providing a better estimation of the strength (i.e., the resistance to attacks) of a password. In [13] Markov models were also proven to perform slightly better than the PCFG proposed by Weir et al. in [19]. Through a systematic evaluation of many different password models using 6 real-world plaintext password datasets, with about 60 million passwords, they show that the model based on PCFG does not perform as well as the Markov model.
A related study presents results regarding the performance of Markov models that counteract with the previous ones. Authors in [14] performed an experiment where they tested existing password scoring meters from the industry (e.g., Zxcvbn, KeePSM and NIST PSM) and academia (PCFG-based ones and Markov-based ones). Their results show PCFG-based meter performs best among existing password scoring meters. Their conclusion is that the PCFG-based model is better at measuring passwords, and the Markov-based model is better at cracking passwords. Furthermore, the authors present a novel password strength meter based on a fuzzy probabilistic context-free grammar. It can react dynamically to changes in how users choose passwords.
A recent study [16] performs an extensive and empirical analysis of Chinese web passwords where the authors evaluate the security of these passwords by employing two state-of-the art cracking techniques: PCFG and Markov models. Their results show that Chinese passwords are more prone to online guessing than English passwords. Furthermore, this study explores how password scoring meters measure the password strength, which leads the authors to the claim that in order for a PSM to be accurate, its training set should be representative of the password base of the target site and that there is no single training set that can fit all PSMs. This claim is what we explore further in our study.
2.5. Neural Networks
Neural networks can be considered as a statistical technique in pattern recognition. They implement non-linear mappings from several input variables to several output variables, where the form of the mapping is governed by a number of adjustable parameters. A neural network learns how to compute a mapping by trial and error, through a certain parameter optimization algorithm. Such an algorithm, due to the biological premises of the theory of neural networks, is called a learning algorithm. During the learning process (also called training), the network receives a sequence of examples and adapts its internal parameters to match the desired input-output functionality. The knowledge to compute the mapping is therefore acquired during this learning process and it is stored in the modified values of the internal parameters. It is known that neural networks have been used for generating the probability of the next element in a string based on the preceding elements [22,23] (e.g., in generating the string password, a neural network might be given passwor and output that d has a high probability of occurring next).
Since password creation is conceptually similar to text generation, it was somehow inevitable for neural networks to become more commonly used as a tool for password scoring and password generation. Their main advantage over other password scoring methods is their speed and lightweight regarding memory requirements. One of the first times where neural networks have been fully and successfully applied to designing proactive password checkers is presented in [24]. This study presents a way of using neural networks in a password checker solution. The authors applied SLP (Single Layer Perceptrons) and MLP (Multilayer Perceptron) networks to the design of proactive password checking. They have evaluated the performance of several network topologies and compared the MLP networks with kernel-based and fuzzy-based neural network models. Their comparison of classification rates obtained by their solutions with previous proactive password checkers showed that proactive password checkers based on this technology have high efficiency and efficacy.
Another study [25] describes how to use neural networks to model human-chosen passwords and measure password strength. In their study authors comprehensively test the impact of varying the neural networks model size, model architecture, training data, and training technique on the network’s ability to guess different types of passwords. Furthermore, this study compares the implementation of neural networks to state-of-the-art password-guessing models, like probabilistic context-free grammars and Markov models. This comparison shows that in general neural networks at high guesses outperform other models, with some exceptions which are related to the training dataset (in this case authors used a combination of datasets-one of which is the Rockyou training dataset used also in our experiment). The main contribution of this study is the client-side implementation of a proactive password checker based on neural networks. It is implemented in JavaScript and light-weighted (requires only 60 MB of disk space).
2.6. Summary of the Related Work
Based on the reviewed related work regarding Markov models, we can say that Markov models can be used as an efficient tool for successful cracking of difficult passwords, even though they have some setbacks (like overfitting). We argue that they can be used as a framework for estimating password strength in a proactive password checker, as long as they are properly trained and properly developed (see Section 1.1). Our approach has a similar background as some of the related work that we described. In this work, we inspect the possibility of using one universal Markov model, or multiple different models, as a mechanism for password checking, by analysing publicly available datasets of passwords that we used to train and test our Markov models on.
3. Background
Markov model is a stochastic process where the next state of the system depends only on the present state and not on preceding states [26]. That is, only on the single present state and not the history of the states. Markov models are commonly used as a language processing tool in speech recognition systems, like in [26], but they can also be used in other fields, particularly in the context of passwords. Such Markov models have already been used before (see Section 2) as an aid to brute-force or dictionary password cracking. These models are based on the fact that particular characters or sub-strings in a particular language area have a higher frequency of occurrence than others (e.g., the string “the” is much more likely to occur than “tqe” and the letter e is very likely to follow “th”). This approach can be used to calculate the strength of the password, by defining a probability distribution over a sequence of characters, which constitutes the password. Such constructed Markov model assigns each password a probability P, which is calculated differently based on the order of the Markov model. The general equation for calculating this probability is [12]:
and can be applied to every order of the Markov models.
The models used by Narayanan and Shmatikov are zero-order model and first-order model.
Zero-order Markov model is a Markov model, where the characters are independent of each other i.e., each character’s probability is calculated according to the underlying frequency distribution and independently of the previous characters.
On the other hand, first-order Markov model is a Markov model, where each 2-gram (i.e., diagram, ordered pair, or a sub-string of length 2) of characters is assigned a probability by looking at the previous character. The probability assigned to a password in the case of a first-order Markov model would be ([13]):
The probabilities are called conditional transitional probabilities and denote the probability of a transition to state when the automata is in state . In the context of passwords that would be the probability of a character following the character . The conditional probabilities can be easily computed with the following formula ([13]):
where presents the number of occurrences of the sub-string and denotes the number of occurrences of when followed by another character x. This character x is part of the password’s alphabet A, i.e., the set of distinct characters that are identified in a particular password dataset, which is also the number of possible states of the Markov model. The number of sub-strings in a particular dataset is by definition equal to: . By using this substitution, the above Equation (3) takes the form:
The transitional probabilities () between the states of the model ( being the current state and being the previous state) are described by a matrix called transition probability matrix or simply transition matrix. Each value denotes the probability that, given the model is currently in state , it will be in state in the next step.
The power of Markov models lies in the ability to use the transition matrix for determining the probability of the model being in a certain state after a certain number of steps (more than one). For e.g., if we have a transition matrix with probabilities for the various kinds of weather, we can denote the probability for the weather being rainy, sunny or snowy two, three or four days from now. This probability is denoted by , where:
- denotes the current state of the model
- denotes the next state of the model
- n denotes the number of steps
The probabilities are calculated by setting the transition matrix to power n-the number of steps.
When the above statements are applied to the passwords, the transitional probabilities simply represent the probability of a character appearing after a character in a certain position in the password, which corresponds with the number of steps . Having this in mind we can transform Equation (2) into:
From the above equations, we can see that the probability P basically represents the probability of occurrence of a sequence of characters and the order of the characters in the password. This probability is obtained by analysing the frequency distribution (the number of occurrences) of these characters in a suitable training dataset.
It is important to note that the probabilities of the first characters are represented by an initialization vector. The initialization vector basically holds the probabilities of every character occurring in the first position in a password.
The final score assigned to the password is a number that is computed by using the following equation [15]:
So that the less likely it is to produce the password, the stronger it is according to the model.
Needless to say, the frequency distributions of the characters used in keyspace compression via Markovian filtering is language-specific, and the distribution used in this paper applies only to passwords chosen by English-speaking users (presumably, similar distributions can be found for other alphabet-based languages).
4. Materials and Methods
In this section we justify our decision on using first-order Markov models, we describe our method, the development of the models, give a description of the datasets we use, and present the selection of training/testing datasets.
4.1. Constructing the Model(s)
We used Equations (2) and (4) for building our models and Equation (6) for calculating the Markov scores for the passwords from the testing dataset. Our constructed models are Markov models of first order (the model is applied to sub-strings of length two), which means that the model keeps track only of the previous state of the system-i.e., the probability distribution of the current character depends only on the previous character in the password.
In our practical case, the number of states i.e., the number of distinct characters that we search in the datasets and used in our models is , coinciding with the set of ASCII characters from character code 32 to 255. This character set includes all characters from the extended ASCII table, except for the initial 32 characters which are basically unprintable control codes and are used to control peripherals such as printers. To the best of our knowledge, such a large number of possible states of a Markov model hasn’t been explored and used for password scoring yet [10,12,13,15].
The output of the model is a real number indicating the password strength. Following the approach in [15], in the case of passwords that are assigned a probability of occurrence of 0 by the model, the final password strength is assigned 4000, which represents a very high strength (so we can avoid infinite values). The value 4000 was selected because the highest values that models otherwise achieved were only over three thousand (maximum value is never over 4000). Further in the paper, we refer to this situation as the model was unable to calculate the password strength.
For calculating the password strength we used Equation (5), which represents the probability of a character (or a character sequence) occurring after a certain number of steps of the model (i.e., a certain position in the password) and Equation (6), which represents the final score of the password.
The initialization vectors are also trained on the same database subsets as the respective models. They represent the probability that a password initiates with each of the 224 characters.
To create the model and calculate the scores for the test passwords, we first need to train the Markov model over a known distribution. This distribution can simply be a publicly available set of passwords from a previously attacked dataset. These datasets are further described in the following subsection.
4.2. Data Collections
We used 12 datasets that contain real user passwords in plaintext that were leaked and are publicly available for research purposes. These password datasets represent real user passwords, which were compromised by hackers and subsequently publicly disclosed on the Internet. We used only the password information in the datasets and we removed all additional information like user names and/or email addresses included in some datasets.
The “RockYou” dataset [27] contains over 14 million passwords leaked from the social application site RockYou in December 2009. The “10 million combos” dataset [28] contains 10 million passwords collected and cracked by Mark Burnett for research purposes. The dataset also contained user names that are connected to the passwords. In order to maintain the anonymity of these informations, we removed the related user names and focused only on the released passwords. The “PhpBB” dataset [27] contains about 180.000 passwords cracked from MD5 hashes by Brandon Enright leaked from Phpbb.com in January 2009. The “MySpace” dataset [27] includes 37.000 passwords that were obtained via phishing attack in October 2006. The “faithwriters” dataset contains 8K passwords stolen from the religious forum Faithwriters. The basic information and the sources of the rest of the datasets are presented in Table 1. For additional details, readers are referred to original works.
4.3. Data Processing
Since our goal is to create multiple Markov models and test them on the same testing dataset, we decided not to merge all datasets into one big dataset and then partitioning it into training and testing. Such an approach can also cause some frequent passwords or passwords with similar length, or some pattern distributions, to appear both in training and testing, thus introducing bias. Furthermore, since the datasets differ from each other in terms of scope, size, password security policies under which passwords were constructed etc., we were not able to decide which datasets will be used for training and which for testing, because our results could easily be biased based on the selection of the training datasets. Therefore, we decided to partition the datasets in the way that is shown in Figure 1. Before the partitioning took place, we first randomized our datasets. Then, half of the passwords in each dataset were used as a training dataset for building a Markov model and the other half was added to our common testing dataset. In the end, we have 12 different models that are trained on 12 different datasets, and a common dataset for testing the models.
After we partitioned our datasets into training and testing datasets and constructed our models, we run every model on the same testing dataset, which contains over 14 million passwords. The input of each Markov models is the testing dataset, while the output is a set of calculated scores appropriately for each of the passwords from the testing dataset. The process is presented in Figure 2.
5. Results
In this section, we present the results of our study. First, we analyse the datasets and the frequency distribution of the characters inside the datasets. Then we analyse the passwords in the datasets regarding their construction like length, numerical, upper case, lower case, alphanumerical, the containment of special characters etc. Finally, we present our main results regarding our analysis of the connection between the models and the scores of the testing passwords.
5.1. Character Frequency Analysis
The character frequency distribution is the basis for constructing a Markov model for the purposes of either cracking passwords or computing its Markov score i.e., its strength. We performed character frequency analysis on our datasets of disclosed real-life passwords (see Appendix A).
Since the datasets are acquired from different sources, we expect them to differ in terms of character frequency distribution, which is important for our research, since we are trying to create different independent models. We present a couple of findings that point to this assumption. First, in almost all of the datasets, the most frequent characters are numbers, lower-case letters and upper-case letters, but the 10k_most_common and uniqpass_preview lack upper-case letters. Likewise, special characters from the basic ASCII table are not present in all the datasets. Second, the RockYou dataset contains characters from the extended ASCII table, which other datasets do not, so we expect this dataset to produce significantly different password scores from the testing dataset.
In order to confirm our assumption about the statistically significant difference between the datasets in terms of character frequency distribution, we performed a statistical analysis of the character frequency for all datasets. We used the nonparametric Friedman’s ANOVA statistical test for multiple repeated measures since the Shapiro-Wilk test for normality showed that all of the differences between pairs of datasets do not conform to a normal distribution (p < 0.05 in all cases). The Friedman’s ANOVA test did find that there are statistically significant differences (2(11) = 259, p < 0.001). This confirms our assumption and gives us the ability to continue with our experiment and analysis since this meets the condition for diversity; this condition is met when at least one dataset is different from the others.
5.2. Data Collections Characteristics
Before we present our main results, we present some summary statistics about our datasets, regarding the characteristics of the passwords they contain. We are interested in passwords characteristics like the average length, uniqueness, the percentage of passwords that were only numerical, only lower-case letters, only upper-case letters, mixed-case letters, alphanumerical, and that contain at least one special character.
Table 2 shows a summary of the distributions of passwords and the average password length in each dataset. As we can observe, the most common passwords in every dataset are alphanumeric passwords.
Table 3 shows the percentages of passwords that appear 1–5 or more times in every dataset. As we can observe from the table, out of all 12 dataset only three (10_million_passwords, passwords, and scribd) do not contain a 100% unique passwords. The high percentage of uniqueness of the datasets goes in hand with our experiment, since it allows us to train our models over a wide variety of passwords.
5.3. Main Results
Each model produced 11,924,618 results. Table 5 shows the descriptive statistics for the results of all 12 models. From it we can quickly notice some distinguishable differences between the models. The mean values range from 132.99 to 3003.56, medians are between 120.22 and 4000.00, and standard deviations range from 95.21 to 1895.30. All of these differences are very big and at least one reason for this can be seen in the mode statistic. The mode of all models is 4000. This is not surprising as the models assign this value to passwords for which they are unable to calculate the strength. As the passwords that could not have their strength calculated are considered to be stronger than the rest we assigned them the highest value. In our case the value 4000 acts similarly to a ceiling value, resulting in a distribution with a ceiling effect (which, in turn, compromises the normal distribution of the models).
An example of this can be seen in Figure 3. Figure 3 shows the distribution of myspace model. In the right part of the graph, we can see the large increase in the frequency of the ceiling value.
All models produce such an effect to a greater or lesser degree. Even though the mode of all the models is 4000 it might pay to take a closer look at the frequency of this value in different models. After all the scribd model has a median that is the same as the ceiling value, meaning more than half the results outputted by this model were 4000. High frequencies of such values could also mean a bad training dataset that was not able to accurately measure the strength of passwords from the testing dataset.
Many ceiling values would inflate the average statistics and the standard deviation. We can see this is in Figure 4, where the number of ceiling values that each model produces is shown. Comparison between Table 5 and Figure 4 indicates that the size of the mean is connected with the number of ceiling values each model produces–the order of models, sorted by their mean size is the same as the order of models when sorted by the number of ceiling values. This will probably be the most important defining characteristic of successful models, because of the way we define a good password checking model. The best model is the one that is the most severe with the passwords it is checking (i.e., it produces the smallest values) because when dealing with the security we should always be prepared for the worst-case scenario. An excessively stringent model promotes the use of safer passwords, while an overly mild model gives good marks to less desirable passwords and creates false confidence in those passwords. Models with more ceiling values will on average and when compared, value by value, to another model be more prone to show higher password strengths and will therefore be determined to be less desirable for evaluation of password strengths.
When comparing models by their frequency of ceiling values (Figure 4), we can notice large differences between them. The most successful model at avoiding ceiling values and therefore the most successful at calculating the strength for any password turned out to be the model created from the biggest password dataset—rockyou. It was unable to calculate only 5417 passwords (0.045%), while on the other hand scribd failed to calculate the strength of almost 8.9 million passwords (74.2%).
Figure 5 shows how many models were unable to calculate individual passwords. For approximately half a million of passwords used in the testing dataset, every single model was able to successfully calculate their strength. Those are most likely the very weakest of passwords, constructed from very common characters. Of the approximate 12 million passwords used in the testing dataset, almost 2.55 million passwords failed to be calculated by one model, 4 million by two models, etc. (see Figure 5). The strength of the most complex passwords was impossible to calculate for up to nine models. This means that for every single password at the very least three models were able to compute its strength. As we have seen in the previous graph every single model had difficulties calculating the strength of some passwords. However, we have now seen that every password could be processed by at least a few models. This gives us the first indication that the use of multiple models is required in order to be able to do strength calculations for a wide range of passwords.
Friedman’s ANOVA test is a non-parametric statistical test used for one-way repeated measures analysis of variance by ranks. The Friedman test was selected, because as is clear that the model outputs are not normally distributed. Considering the sample size, the significance level was set at 0.001. Test results show statistically significant differences between the distributions of Markov models trained on different datasets, with 2(11) = 14,629,394.673 and p < 0.0001. Consequently, we reject the null hypothesis, stating that the distribution of scores in all models are the same and accept the alternative hypothesis confirming that at least two of the models’ distributions differ.
For post hoc testing the Sign test was used, to compare every possible pair of models. When looking at the difference between all 66 model pairs none had a normal distribution and the majority of them were also nowhere close to symmetrically distributed. Because other statistical tests assume that one of the two distributions is a normal distribution, the Sign test, which makes no assumptions about the distribution, was used.
For post hoc testing the Wilcoxon Sign test was used, to compare every possible pair of models. The Sign test was selected because the data meet all the required assumptions (explained below). Figure 6 contains a selection of four differences between models with normality curves. Graph a in Figure 6, for example, shows the distribution of 10_million_passwords model results subtracted from the results of the rockyou model. Here the distribution is fairly symmetrical, but as we map the differences of more diverse models the distributions become more and more skewed. When looking at the difference between all 66 model pairs none had a normal distribution and the majority of them were also nowhere close to symmetrically distributed (Figure 6a,b graphs are the closest). Because other statistical tests assume that one of the two distributions is a normal distribution, the Sign test, which makes no assumptions about the distribution, was used.
Pairwise comparisons were performed with a Bonferroni correction for multiple comparisons. Statistical significance was therefore accepted at the p < 0.000015 level. The results for all 66 pairs can be seen in Table A1. Based on the results we reject the null hypothesis (the median of the differences between two models is 0) for all 66 pairs and accept the alternative, stating that the median of the differences between two models is not equal to 0. This was, because the sample size and nature of data, somewhat expected. For this reason, we also included effect size [33]. Effect size is a measure of magnitude or size of an effect (the observed phenomenon). Effect size is calculated with the following formula:
where r is the effect size, Z is the z-value produced in the sign test, and N is the number of observations. Bigger r value means a more substantial difference between the results of the two models. Using Cohen criteria, we interpret the size of the effect. Effect size between 0.1 and 0.3 is considered to be small, but definitely not trivial or something to be ignored. Bigger values that are smaller than 0.5 are said to have a medium effect, while r values over 0.5 represent a large effect. To simplify and make the effect size more understandable we also calculate the common language effect size (CL), also called probability of superiority. CL gives the probability that a random score from one model will be higher than its matching pair in the second model. CL is calculated by dividing the positive differences by the number of comparisons. The number of comparisons excludes ties (pairs where both models produce the same value). Effect size, its effect classification and CL can all be found in Table A1.
Each row in the table represents a pair of models (Model 1 and Model 2). Next two columns are the Z and the p-value results of the sign test. Following are the metrics for the effect size. Let us for example take the first pair in Table A1. For the pair 10K_most_common and 10_million_passwords the effect size was calculated to be 0.1092. This result is higher than 0.1 and is therefore not insignificant, however, it is not especially high, so we mark the effect as small. CL is calculated by subtracting the model 2 results from model 1. The end percentage, therefore, tells us the probability of model 1 producing a higher strength evaluation than model 2 for a random password. Looking back at the previous example, the CL is 57.73%. This means 10K_most_common produced higher strength estimations in 57.73% of the cases, while 10_million_passwords only had the higher value in 42.27% of the results (excluding the ties). This brings us back to the definition of a more successful model. Generally, the model consistently producing smaller password strength estimations would be better. From the example, we can see that model 10_million_passwords more rarely generates the higher strength value of the two and for that reason, we would consider this model to be the better one. Because of the way the models are sorted into model 1 and 2 columns, the ones in the second column are always considered better. As a result, to find the best models we can simply just count the number of times a single model is written in the second column (higher the count, better the model). Following this rule, we find that 10_million_passwords is the best model, followed by rockyou, phpbb, tuscl, uniqpass, hotmail, singles_org, 10k_most_common, myspace, faithwriters, passwords, and the worst of the tested models scribd. We summarise this and order the models in Table 6.
Ordering the models from the best to the worst is not very difficult, however, it should be noted that the differences between models are not even remotely the same. For this reason, we join models with similar results into groups. As stated before 10_million_passwords produces the best results, but rockyou does not lag far behind. The effect size shows that they do in fact produce very similar results. Additionally, as was shown in Figure 4 rockyou is the most likely to calculate the strength of any passwords. These two models we would therefore classify as very good. Not so good but still very decent are the models phpbb, tuscl, uniqpass_preview, hotmail, and singles_org. All of these are very similar to each other, as can be seen from effect sizes. While their dissimilarity to the two best models is not big enough to be of small effect, they are quite close. The same cannot be said for 10K_most_common and myspace, which have a meaningful difference to the two best models. Consequently, these two models are considered not good, although they are still much better than the last group. Models faithwriters, passwords, and scribd are significantly different from any preceding model. This is especially true for the scribd model, which is the only one that has medium and large differences from other models (including faithwriters and passwords).
Table 7 is a summary of the big Table A1 (see Appendix B) that includes all the results mentioned and can be found in the appendix. Of the 66 comparisons between the models, in 35 cases the difference was determined to be too small to be of any importance. The remaining differences are large enough to not be ignored. Of those, 20 were classified as small, 9 as medium and 2 as large differences. The table also shows the difference in CL between classes.
6. Discussion
Now that we have all the data, we can look for the possible reasons, why some password datasets might be better for constructing a good Markov model.
The first dataset property that could cause differences is its size. Intuitively one might assume, bigger learning set of passwords would produce a better end result. Considering the two biggest password datasets (rockyou and 10_million_passwords) managed to construct the two best models this might look very plausible. However, the rockyou model, even though it was constructed from more than 40% bigger dataset, is still not better than the 10_million_passwords model. Furthermore, the third best model (phpbb), which was only marginally worse than the two best, was constructed from a dataset more than fifty times smaller than the 10_million_passwords and was only fifth in the overall size, while the third largest dataset (passwords) created the second worst model. This leads us to believe that while the size is important, the quality of the dataset is also important. The increase in dataset size also seems to have a diminishing return on the final quality of the model. This would mean that the biggest datasets do not necessarily make a better model, while on the other hand, smaller datasets have a stronger possibility to build a weaker model. In our case, this is seen from the fact that none of the models built from the four smallest datasets is amongst the five best models. The only considerably larger datasets that performed worse have other major problems.
When looking at the password composition of models some additional reasons for the success or failure of models can be found. The easiest password property to look at is the mean length (Table 2). Password length does not appear to have any effect on the model’s success. Models constructed from datasets with higher average password length can be found among the best and worst. For example, the 10_million_passwords model, which was shown to be the best, has the fifth shortest average password length, while rockyou the second best model was constructed from a dataset with the second highest average password length.
The composition of the passwords themselves is somewhat more difficult to compare, but with the help of the frequency distribution of characters in datasets (see Section 5.1) and the table on password information (Table 2) some distinct differences between datasets and the resulting models become clear.
A quick overview of character frequencies shows that numerical characters are very common in the majority of datasets, while upper-case letters are fairly uncommon. This could be an added reason why datasets with proportionally smaller amount of numerical characters perform reasonably badly (10K_most_common, faithwriters, scribd and partially singles_org) and why datasets with no upper-case letters can do reasonably well (i.e., uniqpass_preview).
Uniqpass_preview is the third biggest dataset by the number of characters (passwords dataset has more passwords but they are shorter). It has decent amounts of lower-case letters, numbers and compared to other datasets it has proportionally more special characters (more than 15% of all passwords contain a special character). Even though it has zero upper-case letters the constructed model was the fifth best. This means that the model cannot calculate the strength of any password with any number of upper-case letters. As a consequence, the model cannot calculate the strength of a fair amount of passwords (7th place overall). More ceiling values would normally mean a bad result, but a healthy number of lower-case, numeric and special characters gives this model the ability to rigidly asses all other passwords. Uniqpass_preview is the best model built from a dataset that is completely missing a major group of characters. A helping factor for this is no doubt also the fact that the dataset was constructed for password cracking (although here we use only a part of it) and is not just a collection of random passwords.
The four datasets that were the best have one thing in common. Frequency distributions of characters show that they all have reasonable amounts (enough for the Markov model to make connections between the majority of characters) of all types of characters. The most variety in the character set definitely belongs to the rockyou dataset. This is the most likely reason that this dataset is the most reliable at being able to calculate the strength of any password. The 10_million_passwords dataset is similar to rockyou in the distribution of characters, but it does not have such a wide range of characters. Consequently, it is better at measuring more common passwords (constructed from more commonly used characters), while it somewhat lags behind the rockyou in the ability to calculate the strength of any password. Third (phpbb) and fourth (tuscl) best models were constructed from a lot smaller datasets and therefore cannot compare with the first two in the number of characters, but the amount of characters here is still enough for Markov models to not have problems building connections between them and from the frequency distributions of characters it is visible that proportions between different types of character are still very similar. The built Markov models are therefore probably also very similar, resulting in password strength estimation very much alike to those of 10_million_passwords and rockyou even though they were built from considerably smaller datasets.
Hotmail and singles_org datasets both have a good amount of lower-case letters and comparable, although a small, number of upper-case letters. Hotmail also has proportionally more numeric characters and it has some special characters while singles_org has none. As a result, hotmail is better at calculating the password strength for any password and is also marginally better overall. Hotmail model is in 6th place, while single_org is in 7th.
10K_most_common is the 3rd smallest dataset, but with the shortest average password length, it contains an even smaller amount of characters than the smallest dataset-faithwriters. It has no upper-case letters, practically no special characters and the proportion of numeric characters is small when compared to the best models. More than 83% of all passwords in 10K_most_common consist exclusively of lower-case letters. Frequency analysis of characters would suggest faithwriters to be a better dataset because it contains upper-case letters and more numeric characters, however, the end results do not support this presumption. Contents of the two datasets reveal that faithwrites has many passwords with religious motives (the dataset was obtained from a religious forum) consequently suffering from a large number of very similar passwords. A dataset consisting of related passwords creates a Markov model that is not good at estimating the strength of any other passwords. The 10K_most_common dataset on the other hand is a collection of common passwords. The dataset is filtered and does not contain recurrence of any passwords. Because it contains the most likely passwords it also contains at least some of the most likely combinations of letters. As a result, the 10K_most_common model is very successful despite its size and absence of upper-case letters.
The myspace dataset contains a varied collection of characters, but the special characters and the upper-case letters are sparse. The constructed model is therefore fairly successful in estimating the strength of any passwords (5th best), but passwords containing any of the special characters or the upper-case letters, have their strength rated fairly high because based on the dataset they are very uncommon. These high values cause the model to be ranked fairly low (9th place). This phenomenon can also be seen in descriptive statistics (Table 5). Myspace results have a small mean value (because results do not contain many 4000) but a relatively high median (because on average the calculated password strength is larger).
Passwords dataset looks, on the basis of all the metrics that we have measured like it should produce a good model. The only metric where it slightly stands out is the number of numeric characters. More than 31% all characters in the dataset are numeric, but this is not far from the 25% in rockyou and 10_million_passwords. Nevertheless, the results of the statistics test show that the model is the second worst model of them all. To find a reason for this we had to look at the passwords themselves. Although the dataset is fairly big, we have found that the variety of passwords in the dataset is very low. Many of the passwords are just a variation of the same password or they share a word root. As a result, the Markov model learns that those character combinations are very common (because they are often repeated in the dataset), which would be a good thing, if there was not for many other valid combinations of characters that the model never sees, and therefore cannot calculate the strength for. Passwords is a very good example of a dataset that on paper looks as it should perform well, but in reality, is not good at all.
In our research, the worst dataset to construct a Markov model from was scribd. From the frequency distribution of the characters, we can see why. Upper case, numeric, and special characters are all very rare in the dataset, especially considering that the dataset is not small. As a result, the model could not estimate the strength for almost three-quarters of the passwords in the testing dataset.
As we have seen with multiple modes the model’s ability to calculate the password’s strength for any password and its quality rating (how good did the model turn out to be) seem to be strongly connected. Models that were able to calculate more password strengths (Figure 4) ended up being marked as better models. It is self-evident that good models should be able to calculate the strength of any password, while the models that struggle to estimate the strength of the majority of passwords are not good. This only further substantiates our claim that multiple Markov models are needed in order to construct a proper password checker.
6.1. Solidity of the Experiment
The first-order Markov model is commonly used for password cracking [10] since it is the most easier to implement and requires less computational power. Higher order models require more computational power, depending on the level of the model (i.e., the level of history that the model keeps track of). One could argue that Markov models of higher order can be more accurate at calculating probabilities since they take into account previous states of the model, which in turn could lead to a more accurate calculation of password strength [9,16]. The counterargument to a such statement would be the fact that selecting the order of the model is a more challenging issue than it may seem. Markov models of higher order can give us a greater accuracy as long as we have enough data. Every order we add to the Markov model gives us A times more parameters, where A is the number of states (in first-order Markov model A is basically the set of distinct characters identified in the training dataset), i.e., an exponential explosion in a number of parameters. This means, roughly, that we need exponentially greater amounts of data to properly train the model. At some point, the model will overfit the data and it will run the risk of sparsity [14]. Sparsity means that transition probabilities are being computed from very small count numbers, which may be noisy [13]. So, the proper order of the model would be the one that fits the data. Furthermore, creating a higher order model can be more difficult and expensive. In the worst-case scenario, where the order k is exceeding the maximum password length, the model would explicitly list the probability of occurrence of each possible password [9]. This would require a larger training set and more storage capabilities since the required space is of the order of , where is the size of the character set [9].
For the purposes of our study, we used first-order Markov model mainly because of the above arguments-the possibility of data sparsity or data overfit if we use the wrong order of the model. In order to back up our decision, we conducted a short experiment where we compared first-order and second-order Markov models. We were interested in the differences in the outcome of the first-order and the second-order Markov model. The models were trained on the same password datasets in order to provide consistency and statistical conditions. We used Equation (1) for calculating the probabilities of the passwords. The models were trained on datasets described in Section 4.2 and then tested on the same testing dataset (containing randomly selected passwords that do not appear in the training datasets).
Wilcoxon Signed Rank was used for testing the differences between the results from the first-order and the second-order Markov model. Wilcoxon Signed Rank test is a non-parametric statistical test that is used to compare two sets of scores that come from the same participants. This test was selected, because the outputs of both models are not normally distributed (Kolmogorov-Smirnov test indicated that the differences in the scores from both models do not follow a normal distribution, , ).
In only five out of twelve cases test results show statistically significant differences between the median of differences between the two models, with , . In these cases we reject the null hypothesis, stating that “the median of differences between first-order and second-order equals 0” confirming that there are statistical differences between the medians of differences provided by both models. Consequently, in the other seven cases, we retain the null hypotheses (i.e., seven out of twelve cases showed no statistically significant differences).
The above tests show that the difference in outputs between the two Markov models with different orders is, in most cases, not statistically significantly different. Therefore, we argue that it is, without a doubt, important to analyse the dataset before selecting the order of the model. As long as one is not limited by the hardware and one is not facing data sparsity, one can use a higher order Markov model when necessary. Since our study is not directly related to what order of the model we use and the statistical tests showed no statistical differences in most of the cases, we decided on using first-order Markov model for our experiments.
6.2. Effectiveness of the Approach
So far we have analysed the output scores of the models and compared them with each other. Based on the statistical analysis of these scores we argued that multiple Markov models are needed in order to create an effective password checker for a wide range of passwords and that one universal dataset should not be used to train one Markov model if we want to have an effective password scoring tool. In this section, we test and prove the effectiveness of different models specified for scoring different groups of passwords. For that purpose, we performed an additional experiment as a continuation of our main experiment. The goal is to prove the effectiveness of our models for scoring passwords that are strong, medium, or weak. Furthermore, the universal Markov model was trained on one “ultimate” password dataset, which consists of multiple different password datasets put together. We then tested the cracking resistance of the passwords that our models and the universal model identified as strong, medium, or weak. We define the term cracking resistance as the ability of a password to resist the cracking attack-the longer the password resists the attack, the higher the password strength score.
6.2.1. Environment Setting
We tested the cracking resistance for 1500 of the best-ranked passwords from our testing dataset. We selected these passwords based on the score given by three of our models. We classified these passwords in the categories of strong, medium and weak in the following way: 500 of the best ranked passwords scored by our best-ranked model 10_million_passwords were classified as strong passwords, 500 of the best ranked passwords scored by our middle-ranked model hotmail were classified as medium passwords, and 500 of the best ranked passwords scored by our worst-ranked model scribd were classified as weak passwords. We did a similar selection for the universal model: we selected the top 500 passwords that were scored by the universal model as strong, 500 that were scored as medium, and 500 that were scored as weak.
For testing the cracking resistance of the selected passwords we used Hashcat [34] and its abilities. Hashcat is an open-source tool (MIT License) and its functionalities are generally available. It can also be used in Markov mode for cracking passwords which is useful for our efficiency testing since the password guesses in Markov modes are built with the use of Markov models.
Since Hashcat works only on hashed data, we hashed the selected passwords with MD5 hashing algorithm, before we ran them through Hashcat. We performed three password cracking cycles-one for every category of passwords. In every cycle we ran the same sequence of password cracking techniques: (1) dictionary attack, (2) dictionary attack with additional mangling rules, and (3) Markov mode attack. The first password cracking technique is a basic dictionary attack, the second is a dictionary attack with additional mangling rules that are already implemented in Hashcat, while the third is a technique that is based on Markov models. It is important to note that for the dictionary-based password cracking techniques we used all our training files that we used to train our Markov models on.
We expected to crack all the weak and most of the medium passwords in a relatively short time, but for the strong passwords, we expected it would take a much longer time. For the purpose of this experiment we only need to prove that the passwords that our models identified as weak passwords can be cracked in a lot shorter period of time regarding the passwords that were identified as strong. Considering this, we decided to run all cracking techniques for the same amount of time-2 weeks for every password cracking technique-and count the number of cracked passwords from every password category. By analysing the number of cracked passwords from every category, within the same period of time, we can confirm whether those passwords are weak, medium or strong.
The last password cracking technique based on Markov models took more time to complete since the Markov model needs to be trained first. For training the model we used our best training dataset-10_million_passwords. Because of space and memory sparsity (the size of the final Markov file with password suggestions has grown to almost 350 GB), we let Hashcat work for 2 days and build the Markov model. We piped the generated results from the Markov model into Hashcat and performed the password cracking technique.
It is important to note that all parts (cycles) of the experiment were performed with the same technical equipment and in the same time period in order to preserve the continuity and the soundness of the experiment. We used Intel(R) Core(TM) i5-3550 processor on 3.30 GHz and 24 GB of RAM with 64-bit Windows 10 operating system.
6.2.2. Results
We started every password cracking cycle by running the passwords through Hashcat’s dictionary attack process. The results of the cracking process for every cycle for the three different models are shown in Table 8.
Table 9 shows the results of the cracking process for the universal Markov model.
Multiple different models Expectedly, in the category of weak passwords we managed to crack almost all of the passwords. With the first dictionary attack, we managed to crack 462 weak passwords or 92.4%. Following, we used a dictionary attack with additional rules (these were mostly basic mangling rules) where we managed to crack additional 4 passwords (0.8%). Surprisingly, with the Markov mode, we didn’t manage to crack any passwords. The first cracking cycle took one day to complete i.e., we managed to crack 466 (96.4%) weak passwords in just one day.
The second cycle of cracking passwords from the category of medium passwords gave even more promising results. With the basic dictionary attack we managed to crack only 96 medium passwords (19.2%) and with the second attack with additional mangling rules, we cracked additional 150 passwords (30%). In the second cycle we ended up with a total of 246 (49.2%) cracked medium passwords.
In the third and final cycle, we managed to crack 155 (31%) passwords that were identified as strong. We cracked the passwords with the dictionary attack followed by additional more complex mangling rules. The Markov mode attack did not manage to crack any of the strong passwords.
In the scope of this additional experiment with multiple different Markov models, we managed to crack overall 466 passwords from the weak category, 246 from the medium, and 155 from the category of strong passwords. As evident from the descriptive statistics of the results, our Markov models are able to distinguish between at least three different categories of passwords (i.e., strong, medium, or weak).
Universal model The situation with the universal Markov model was completely different. As we can see from Table 9 we managed to crack only 11.8% of the weak passwords. In the second and third cycle we cracked even fewer passwords: only 5.4% of the medium and 5.2% of the strong passwords. Most of the passwords were cracked with the dictionary attack with additional mangling rules. Surprisingly, with the Markov mode, we also didn’t manage to crack any passwords. Overall, we cracked a total of 112 passwords out of 1500 selected. The number of cracked passwords with this approach is far lower than the other approach where we used three different Markov models. Even more, the number of cracked passwords between each category is almost the same, especially between the category of medium and strong passwords (27 and 26 accordingly). This gives the indication that the ultimate model has difficulties with categorizing medium and strong passwords and probably undergoes the “overfitting” process, where it can no longer distinguish between new passwords that are supposed to be strong and already known ones that are supposed to be weaker.
6.3. Ethical Considerations
Our results are from our Markov models that were trained on password datasets that are publicly and widely available. These datasets were originally collected through illegal cracking and phishing attacks. Some argue that such data should not be used by researchers because it can compromise the accounts and data of the users whose passwords were stolen. The passwords that we used were anonymised and did not contain any other data that could connect the password to its user and/or account. We use these datasets only to train our Markov models and not to use them as cracking datasets, for they do not contain any other information about the passwords (e.g., usernames or email addresses). We do strength analysis of plaintext passwords, not cracking hashed passwords which we could publish later and compromise the users and their accounts. Furthermore, since these password datasets have already been used in other research studies [9,10,11,12,15,18,19] and have been made public and easily available, using them in our research does not increase the harm to the victims. Still, there is a possibility that attackers will use these datasets as training sets for their cracking mechanisms, but since we use the datasets and our statistical analysis to improve the way password checkers work and to better assess the passwords’ strength entered by the users, our use of them to assess passwords’ strength and our results are more likely to be of practical use for the security and for the system administrators.
6.4. Limitations
When performing the experiments, we limit the number of states, i.e., the number of distinct characters that we search in the datasets and use in our models, to 224, coinciding with the set of ASCII characters from character code 32 to 255. This character set includes all characters from the extended ASCII table, except for the initial 32 characters which are basically unprintable control codes and are used to control peripherals such as printers.
It is necessary to note that when Markov models are used for password cracking they are usually used as an aid when dictionaries are exhausted and when the search space becomes very large. We assume that an average attacker would have access to password training sets that are as good and effective as the best of all our training sets. If Markov models are used the other way around (as a password scoring tool), one should do an analysis of the datasets similar to ours, in order to find the right way to combine the datasets and to create a more effective password scoring tool.
Furthermore, the datasets that we used in our research are publicly available datasets of passwords that were illegally collected. This increases the doubt that these datasets are partial (only a part of larger datasets that also contain stronger passwords) and biased datasets that contain only the most common and weaker passwords that are easy to predict. Since these are publicly available datasets of previously compromised accounts, we can argue that future attackers can also use only the datasets that are available online in order to build their tool and strategy for an attack. This implies that a solution for password restriction based on multiple Markov models should be able to recognize and prevent the weak passwords from entering the system. The problem in information security are not strong passwords that are not yet cracked and leaked, but weak passwords that are publicly available. A good password checker should not let weak passwords through. Hence, our models should be able to recognize and assess these passwords as weak. This implies that our models should be trained on weak, biased and similar passwords that are available for most of the attackers.
6.5. Practical Use of the Approach
Our approach can be used in a typical Web-based password-protected service. A practical example of our approach follows:
The Markov model is represented by a Markov matrix that contains the conditional transitional probabilities (see Section 3) needed for calculating the password score. This matrix is stored and available on the server-side, while the actual password checker is available on the website (i.e., the client-side). On the client-side, the user enters the password in the password field. The password entered in plain text is then sent through a secure connection (HTTPS) to the server-side. On the server-side, the Markov matrix is used to calculate the score of the password. If the password is assessed as strong or very strong, the password is hashed, salted and stored in the database. Otherwise, a warning is presented to the user, stating that the password is too weak to be accepted by the system and it requires a change. Additional instructions on how to create a secure and strong password are displayed. The levels of password strength are defined on the basis of the scores of all the passwords in all training datasets. Basically, the solution can be used as an additional step at the server-side and there is no need for additional modification of the existing user interface (i.e., the website).
7. Conclusions
In this study, we explored the possibility of using Markov models as a basis for creating a more effective password checker. The idea itself brought out the question of whether one model is sufficient if we want our password checker to be able to properly calculate the strength of a variety of passwords with different characteristics. Successively, the objective of this study was to compare different Markov models and find out whether there are significant differences between them. Our goal was to find out whether different Markov models will provide statistically different results when tested on the same password dataset, which would lead us to the answer to our main question. We used publicly available password datasets that we randomized and divided into training and testing datasets. We explored the results of every model and compared them with each other in order to investigate the statistical significance in the scores from different models. We also explored the effect of the datasets size, the average password length and other characteristics on the success of the model.
We find that of the approximate 12 million passwords used in the testing dataset, almost 2.55 million passwords failed to be calculated by at least one model. We also find that every single model had difficulties calculating the strength of some passwords and that every password could be processed by at least a few models. Hence our assumption that the use of multiple models is required in order to be able to do strength calculations for a wide range of passwords.
Overall, the results and the statistical tests demonstrate that there are significant differences in medians between all models. Size of dataset seems to be a big determining factor in the final quality of the model, up to a certain point-increasing the dataset size (number of characters) afterwards has a diminishing return. The size itself will do no good, without the right composition, the right and sufficient amount of numbers, lower and upper-case letters, and special characters.
Based on the presented results, we came to a few major conclusions:
- different Markov models (trained on different password datasets) provided statistically different results when tested on the same password dataset,
- more diverse datasets are needed to be able to calculate the strength of as many passwords as possible, since one “universal” model, trained on one “universal” dataset is less effective at classifying passwords in different categories (i.e., weak, medium, strong),
- the passwords in the dataset are also important. They should be diverse and should not repeat in any significant way,
- different Markov models of 1st and 2nd order, in most cases, give no statistically different results,
- overall, Markov models can be used as a basis for constructing a more effective password checker that uses multiple different and specific Markov models, which could be more effective if we want to cover a wider range of passwords.
The fact that different training datasets can lead to statistically different password scores, leads us to the conclusion that it is very important what kind of dataset is used to train the Markov models. We argue that one universal dataset should not be used to train one Markov model if we want to have an effective password scoring tool. Our results give the indication that the use of multiple models is required in order to be able to do strength calculations for a wide range of passwords. We further argue that if a Markov model would be used for assessing password strength, then it should be constructed and trained on a particular dataset of passwords, so it can be more efficient for that particular password group. For this manner, multiple different Markov models can be used in combination (depending on the type of the password), so the password scoring tool can effectively cover a wider range of passwords. In other words, we select the one model that is trained on a dataset of passwords that closely resembles the password creation policy.
We believe that the results of this study can be of certain aid for future password checkers, that would be based on multiple Markov models, where each is tailored for a particular password group(s). Such a password checker can easily and more effectively check the probability of a given password to be chosen by the user.
Author Contributions
Conceptualization, V.T. and B.B.; Formal analysis, M.K.; Methodology, V.T.; Resources, M.H.; Software, V.T.; Supervision, B.B.; Validation, M.H. and B.B.; Writing—original draft, V.T.; Writing—review and editing, M.K., M.H. and B.B. All authors have read and agreed to the published version of the manuscript.
Funding
The authors acknowledge the financial support from the Slovenian Research Agency (Research Core funding No. P2-0057) and the European Union’s Horizon 2020 Research and Innovation Program under the CyberSec4Europe project (Grant Agreement No. 830929).
Institutional Review Board Statement
Not applicable.
Informed Consent Statement
Not applicable.
Data Availability Statement
No new data were created or analysed in this study. Data sharing is not applicable to this article.
Conflicts of Interest
The authors declare no conflict of interest.
Abbreviations
The following abbreviations are used in this manuscript:
| PCFG | Probabilistic Context-Free Grammars |
| PSM | Password Strength Meter |
| SLP | Single Layer Perceptrons |
| MLP | Multy Layer Perceptrons |
Appendix A. Character Frequency Distribution
Figure A1.
Frequency Distribution of Characters-Dataset: 10_million_passwords.

Figure A2.
Frequency Distribution of Characters-Dataset: 10k_most_common.

Figure A3.
Frequency Distribution of Characters-Dataset: faithwriters.

Figure A4.
Frequency Distribution of Characters-Dataset: hotmail.

Figure A5.
Frequency Distribution of Characters-Dataset: myspace.

Figure A6.
Frequency Distribution of Characters-Dataset: passwords.

Figure A7.
Frequency Distribution of Characters-Dataset: phpbb.

Figure A8.
Frequency Distribution of Characters-Dataset: rockyou.

Figure A9.
Frequency Distribution of Characters-Dataset: SCRIBD.

Figure A10.
Frequency Distribution of Characters-Dataset: singles_org.

Figure A11.
Frequency Distribution of Characters-Dataset: tuscl.

Figure A12.
Frequency Distribution of Characters-Dataset: uniqpass_preview.

Appendix B. Pairwise Comparison of the Models

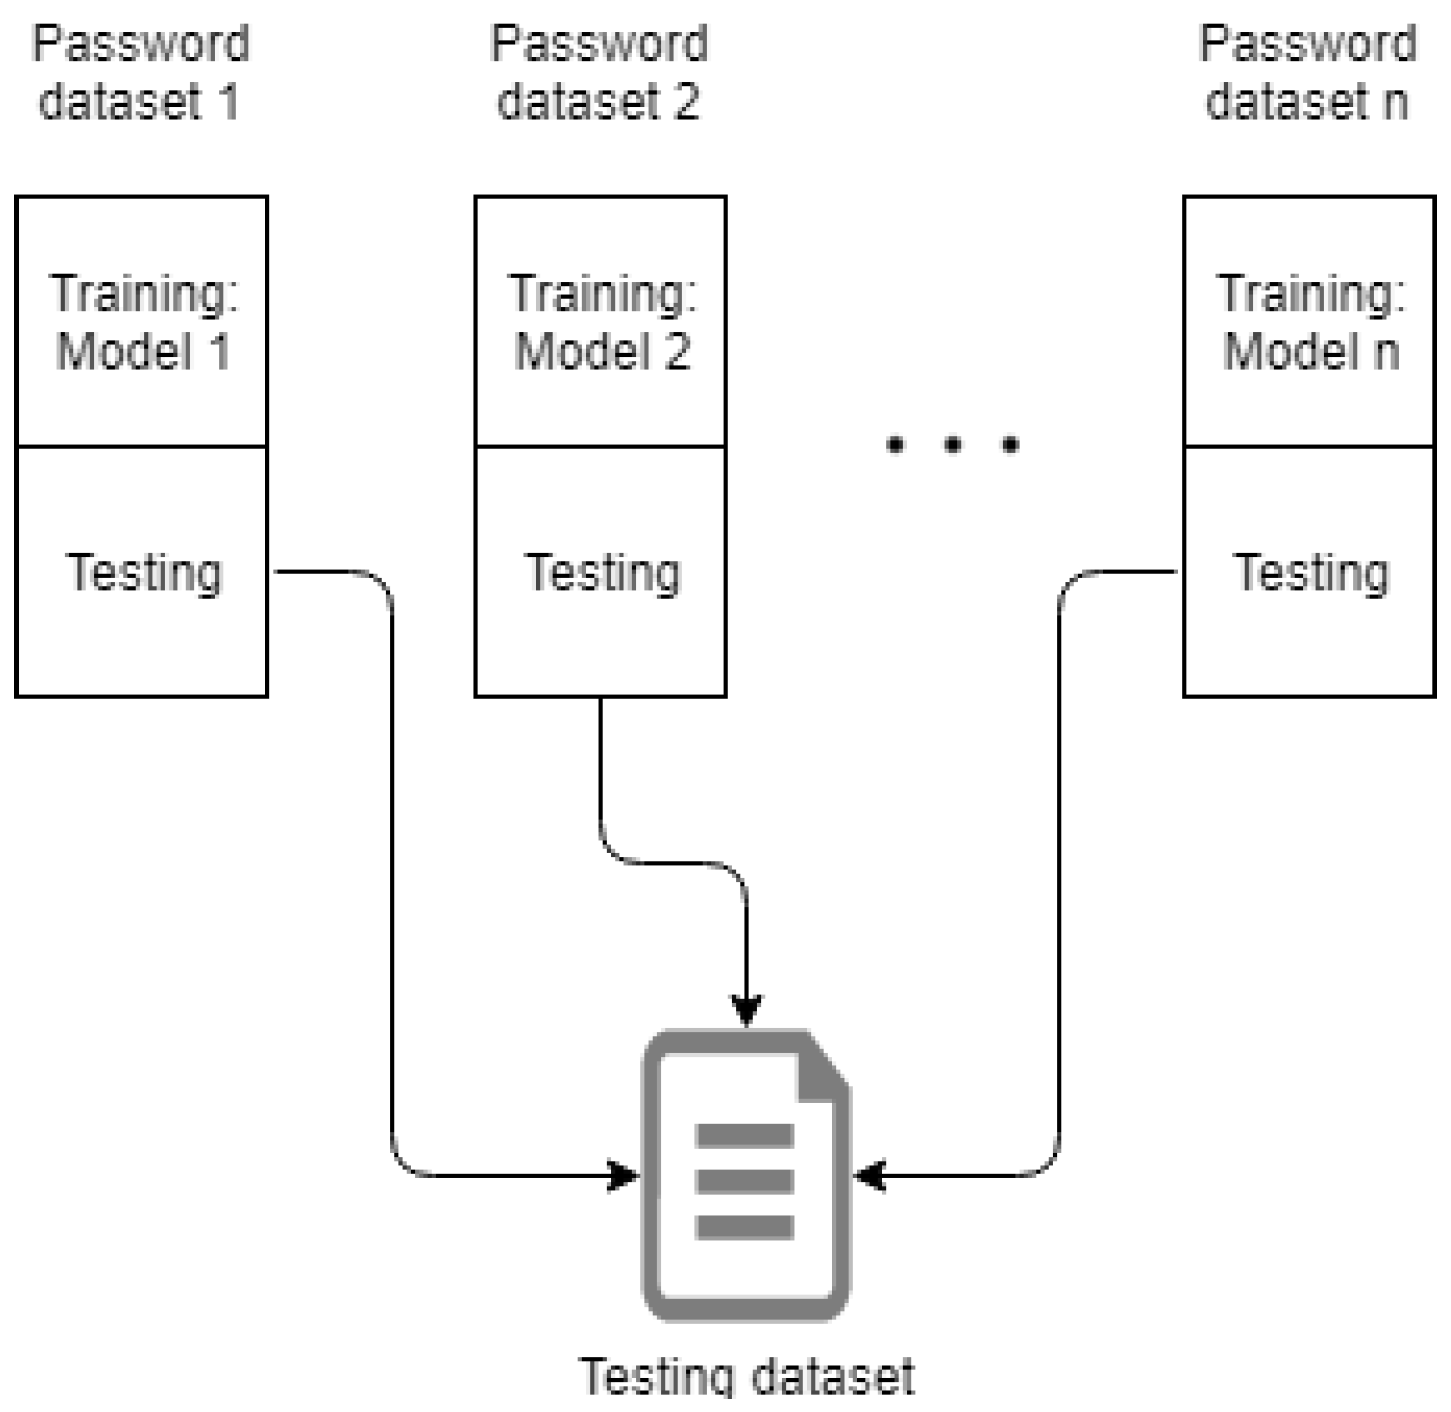
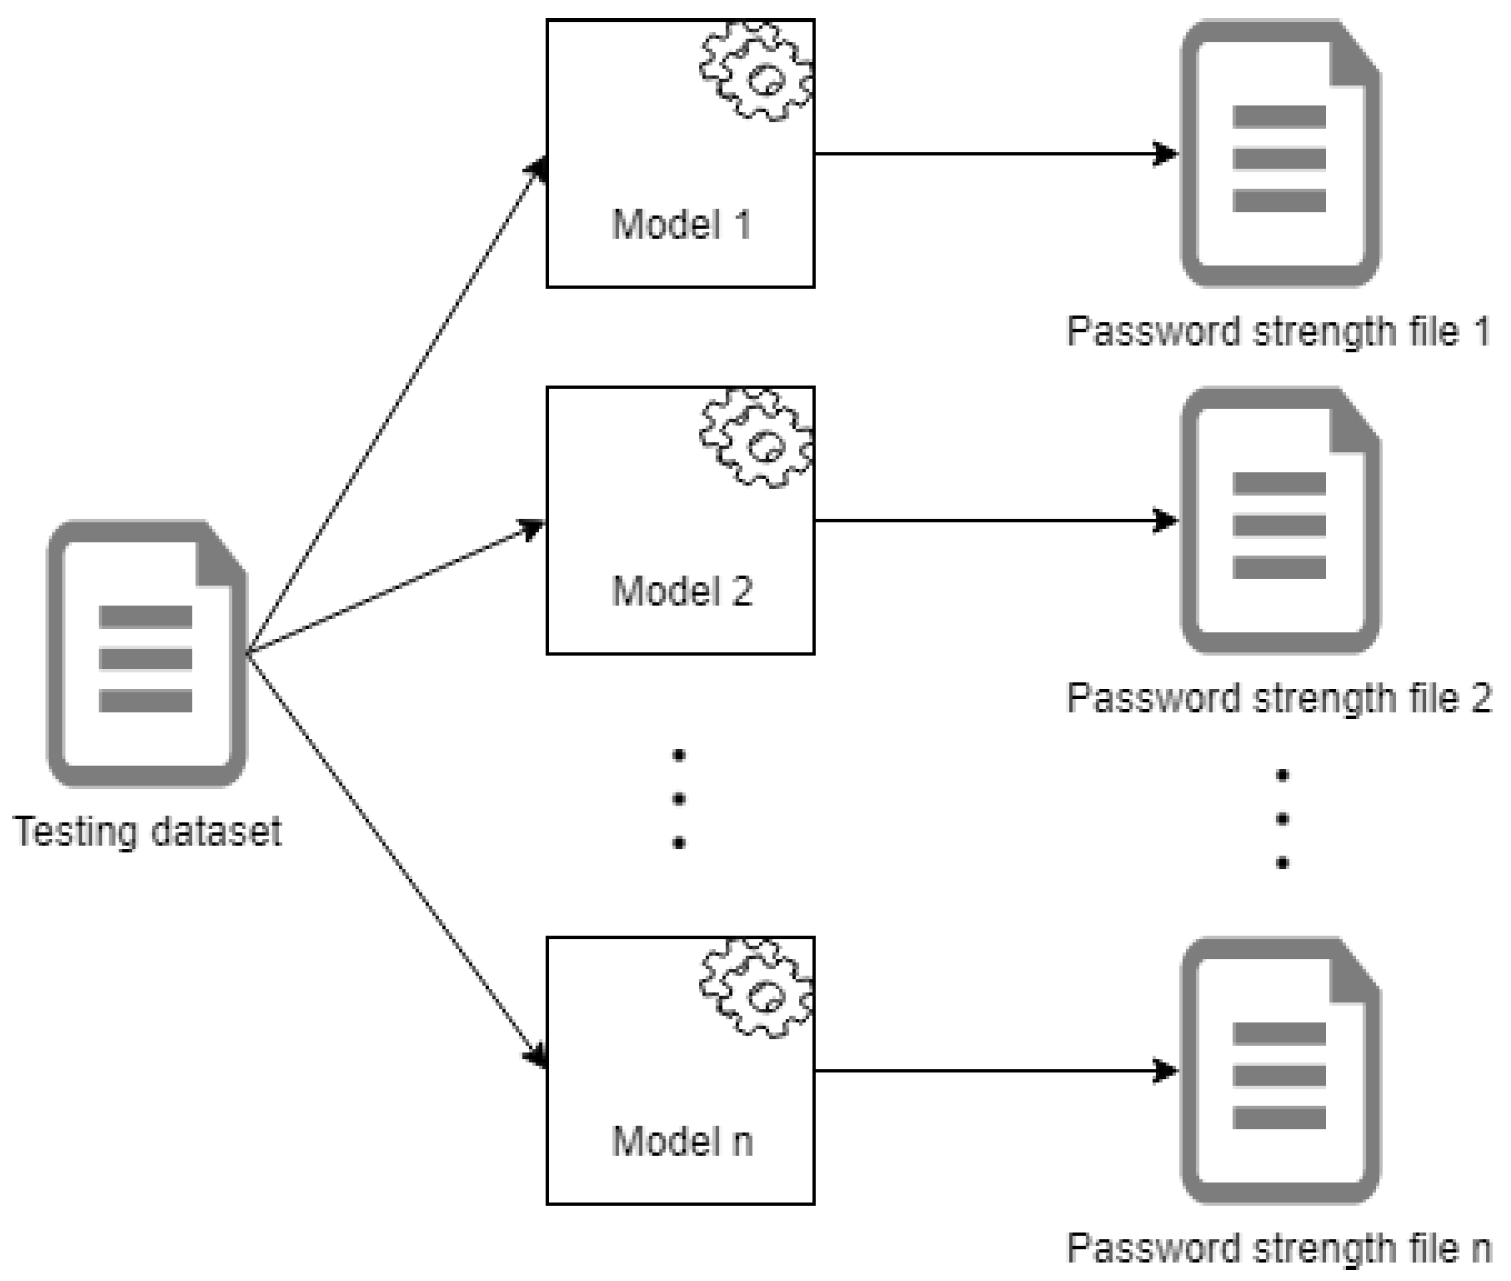
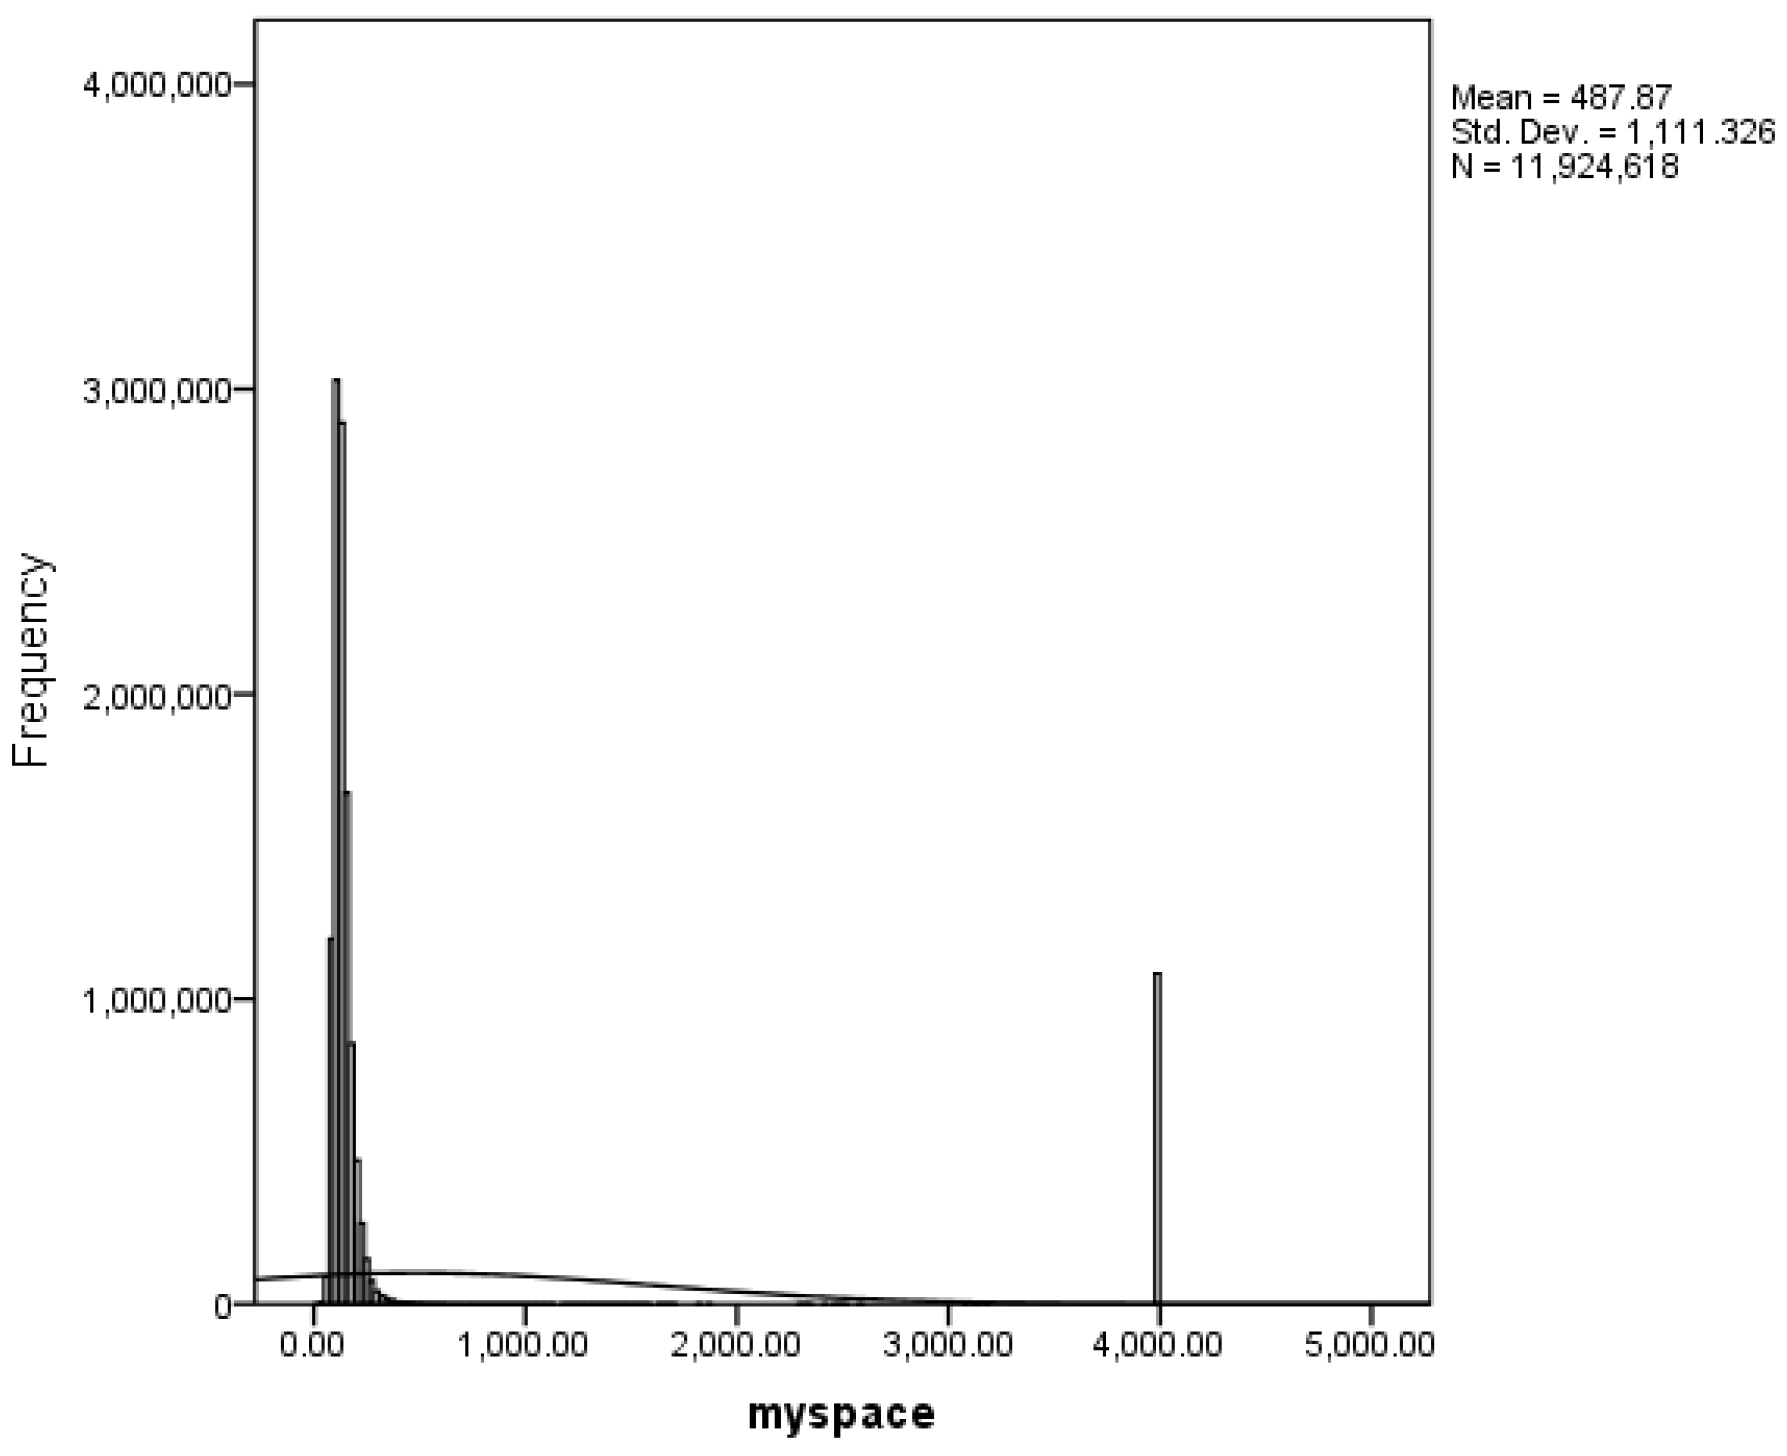
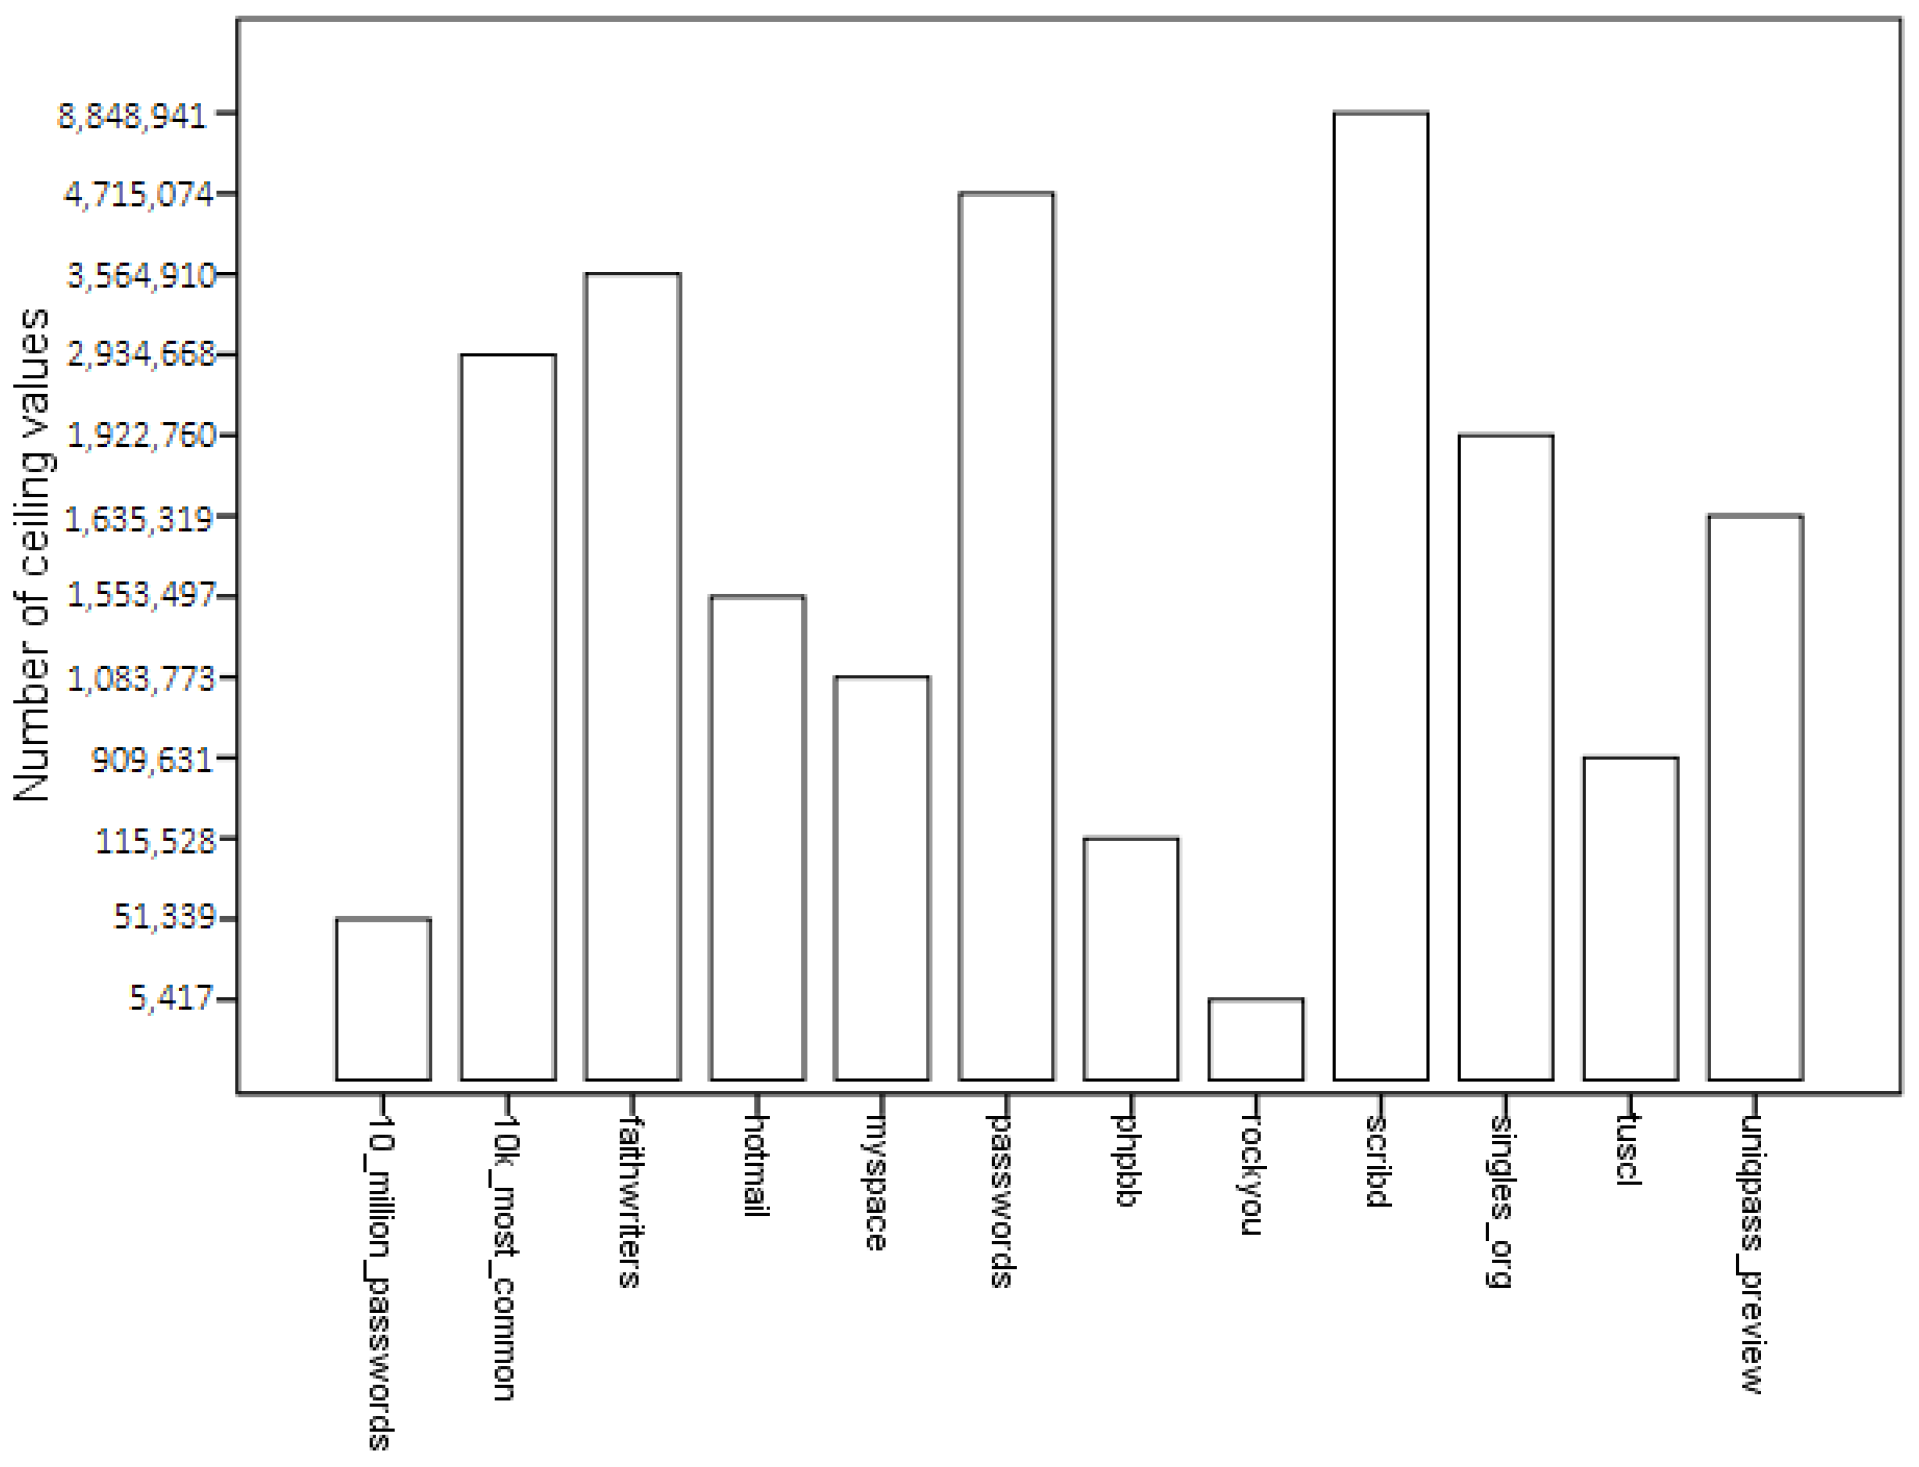
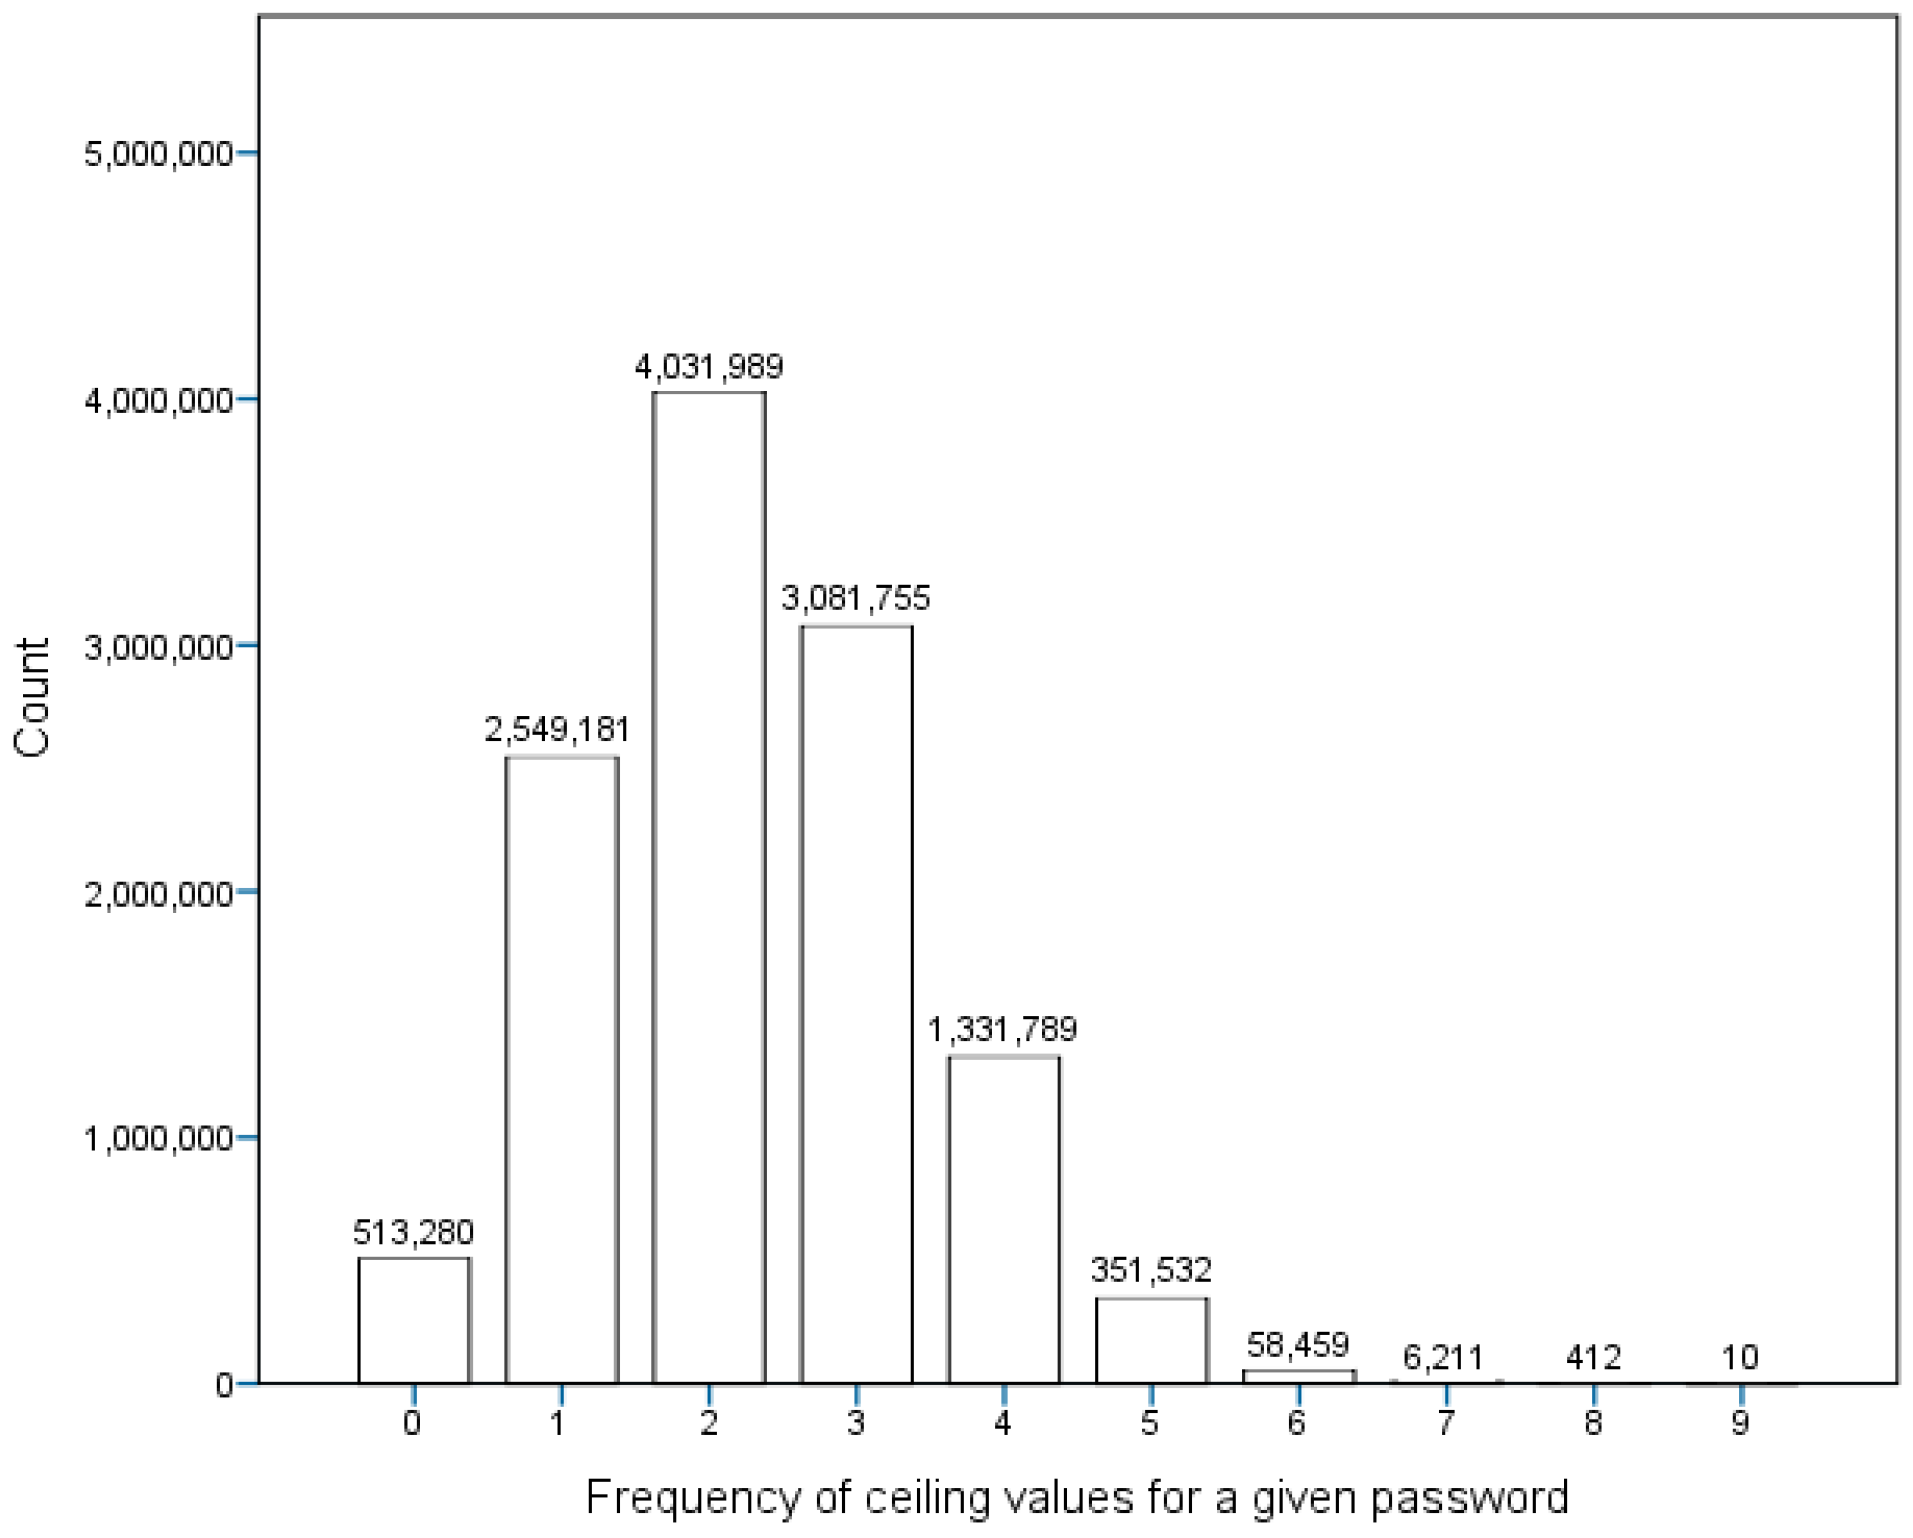
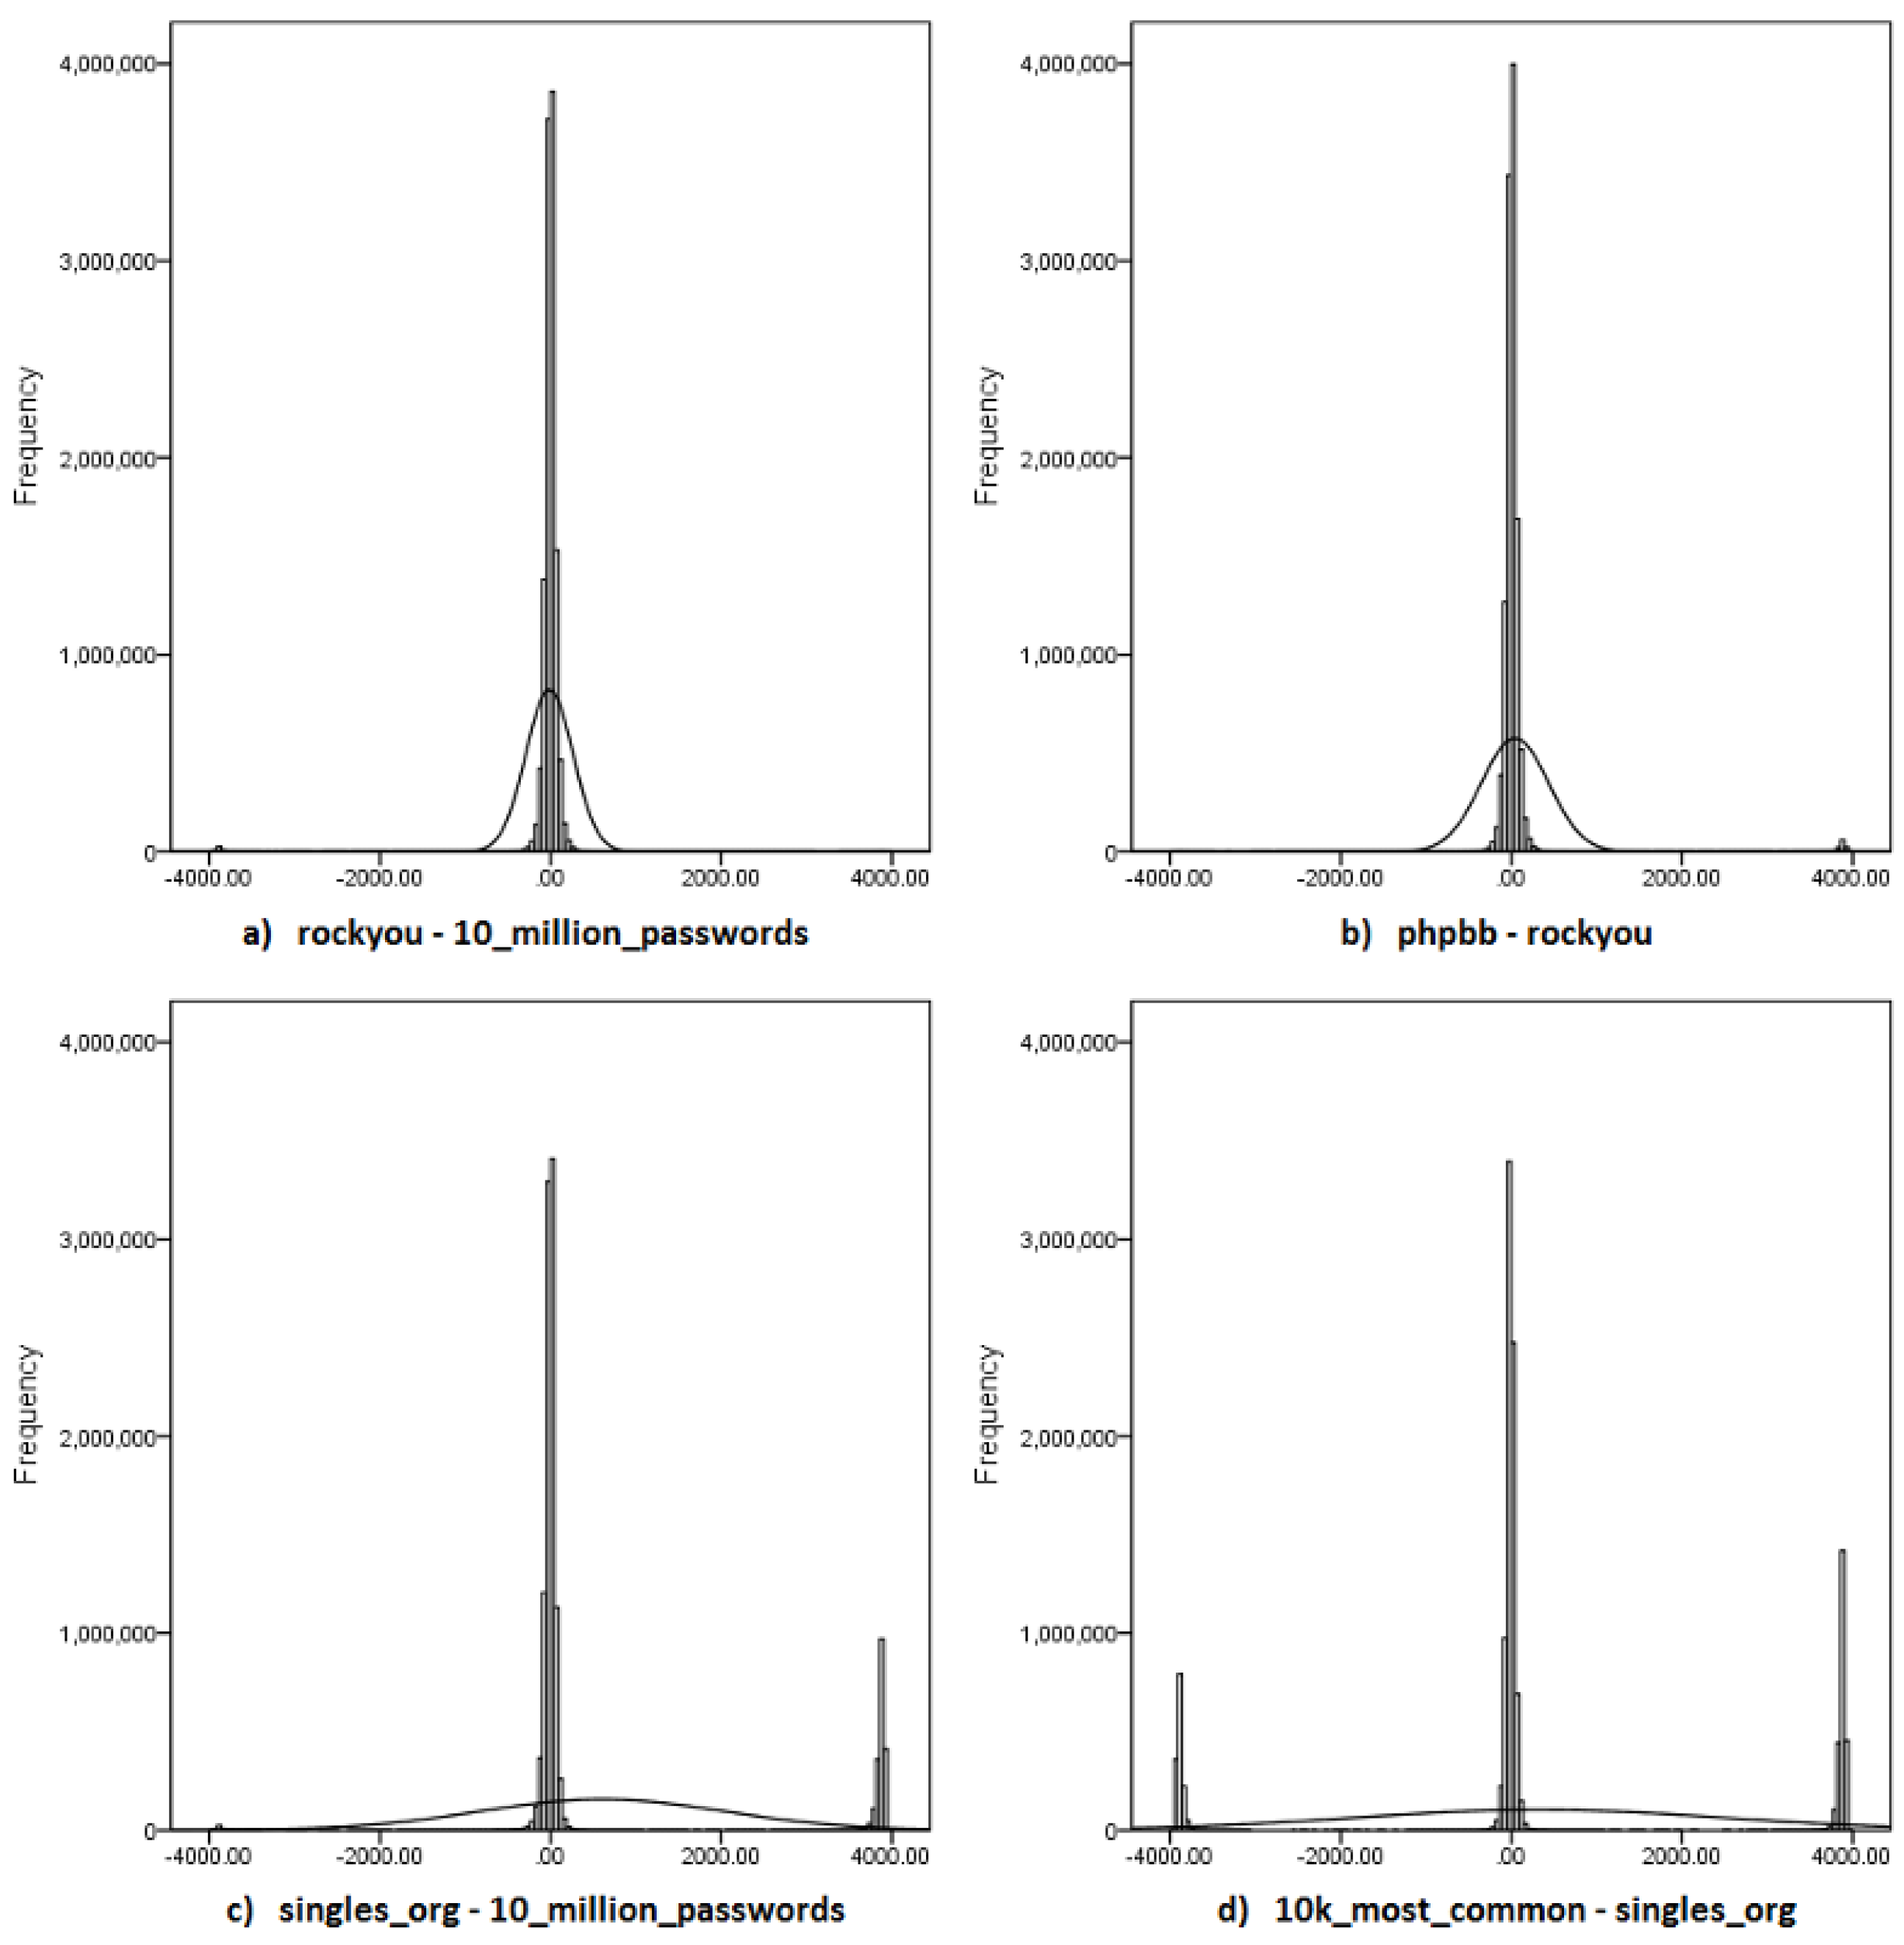
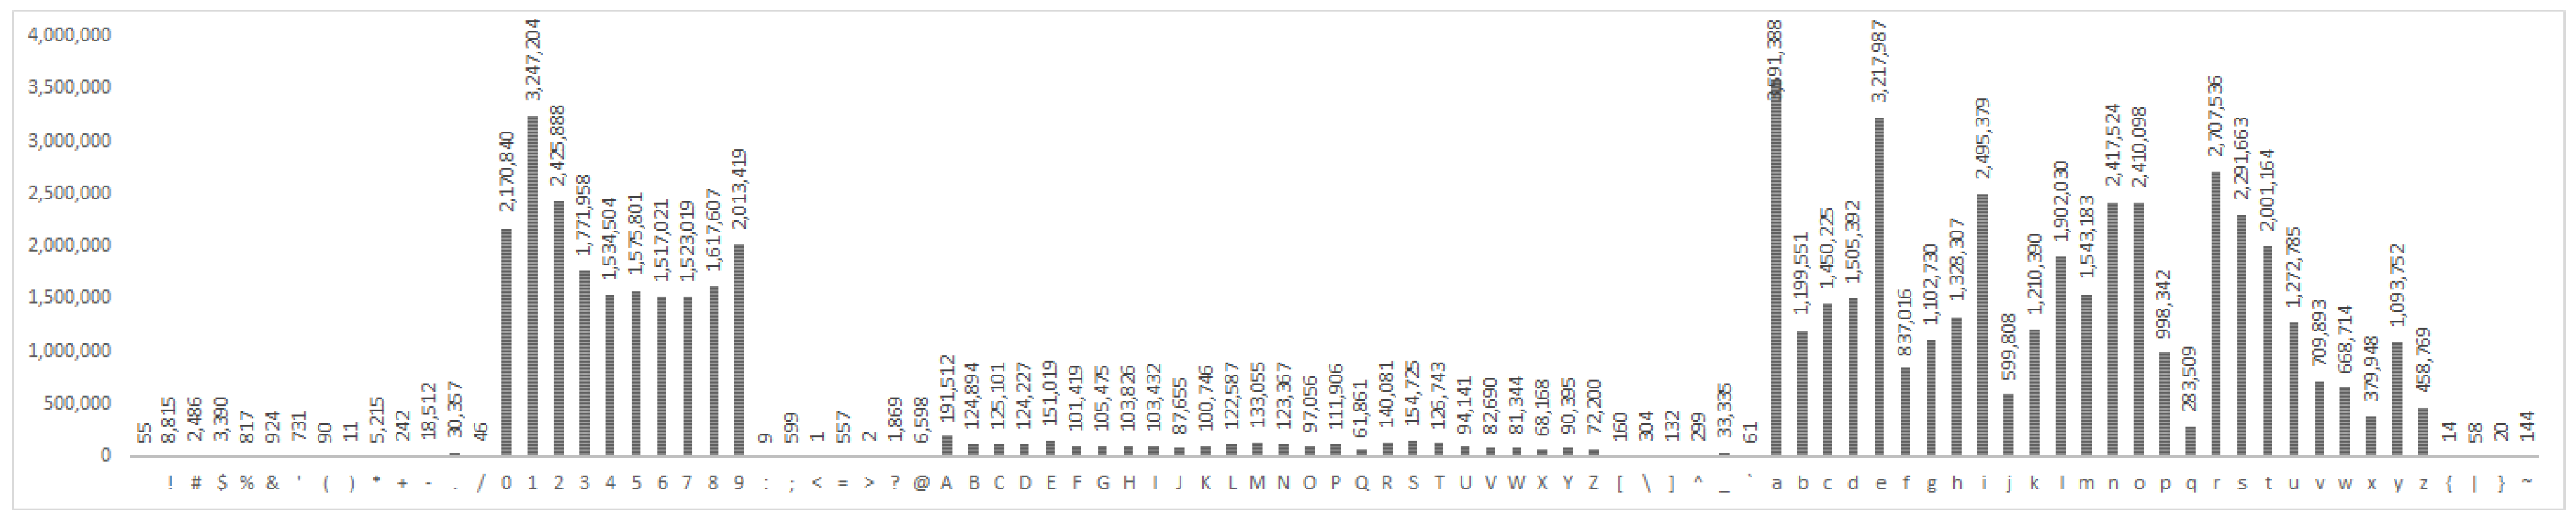
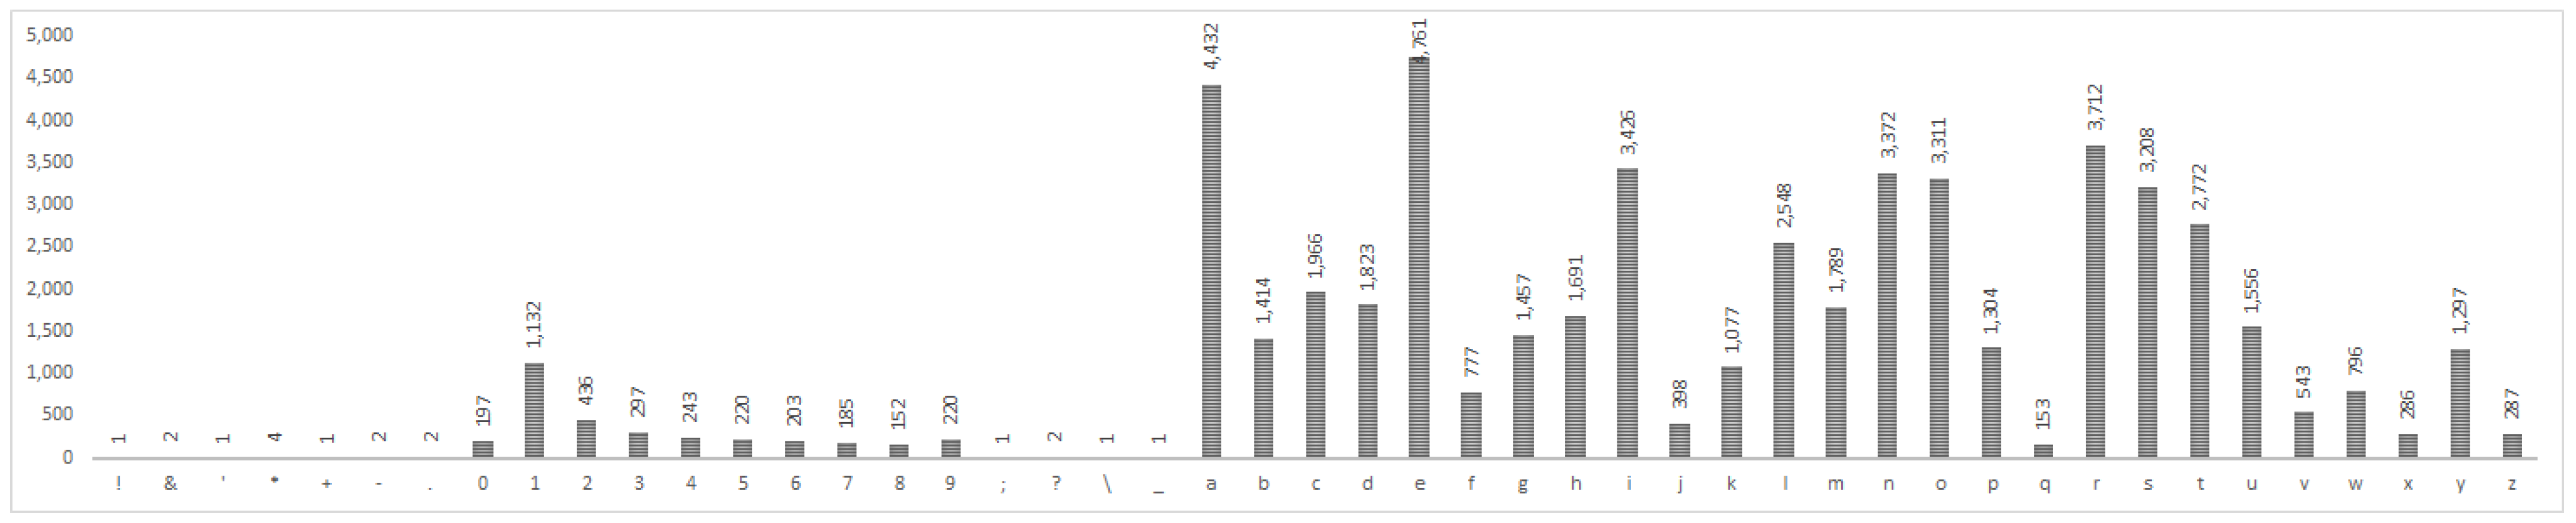
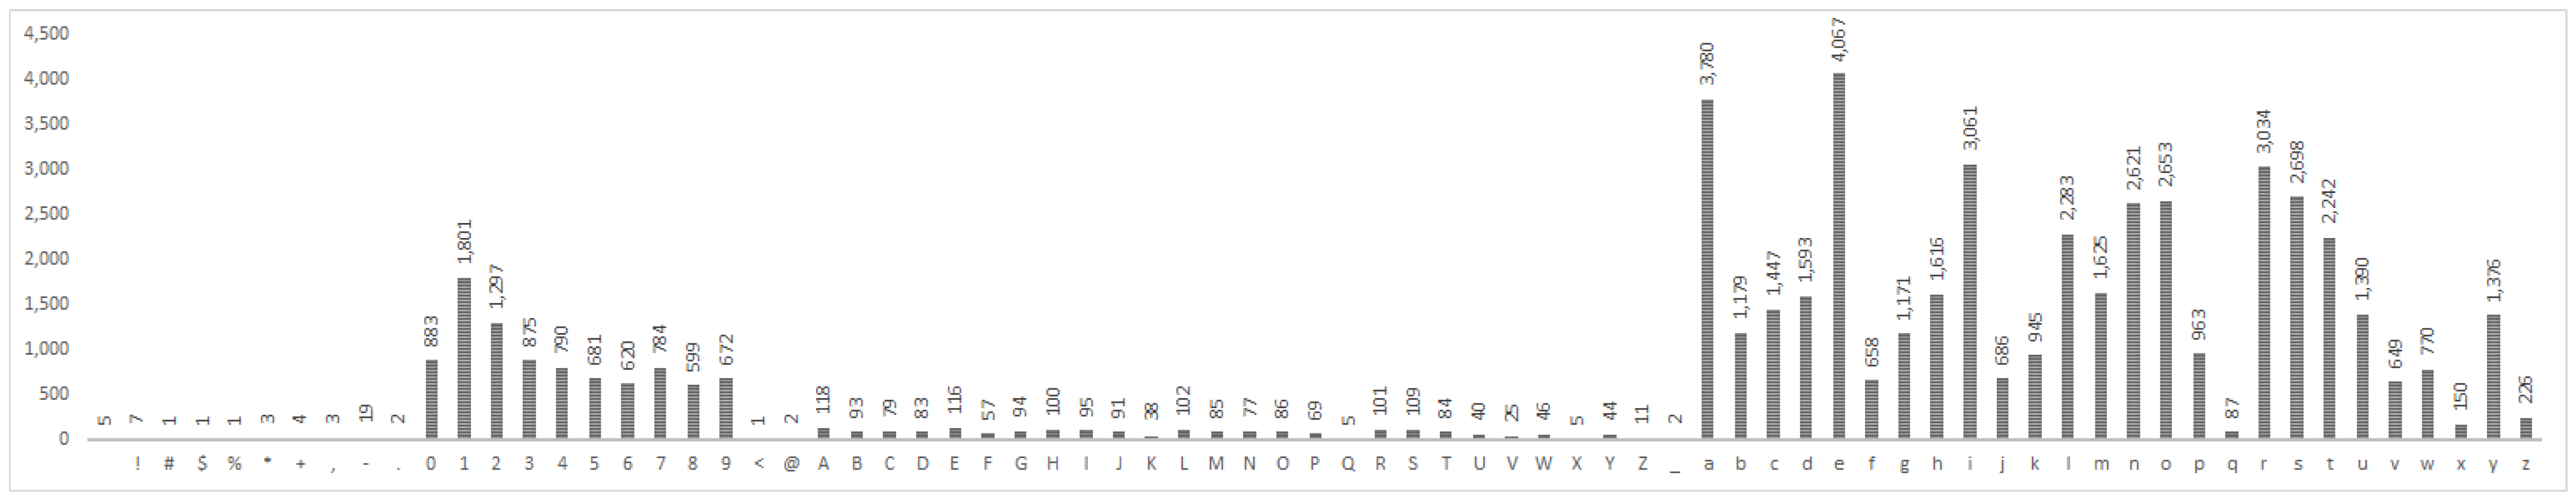
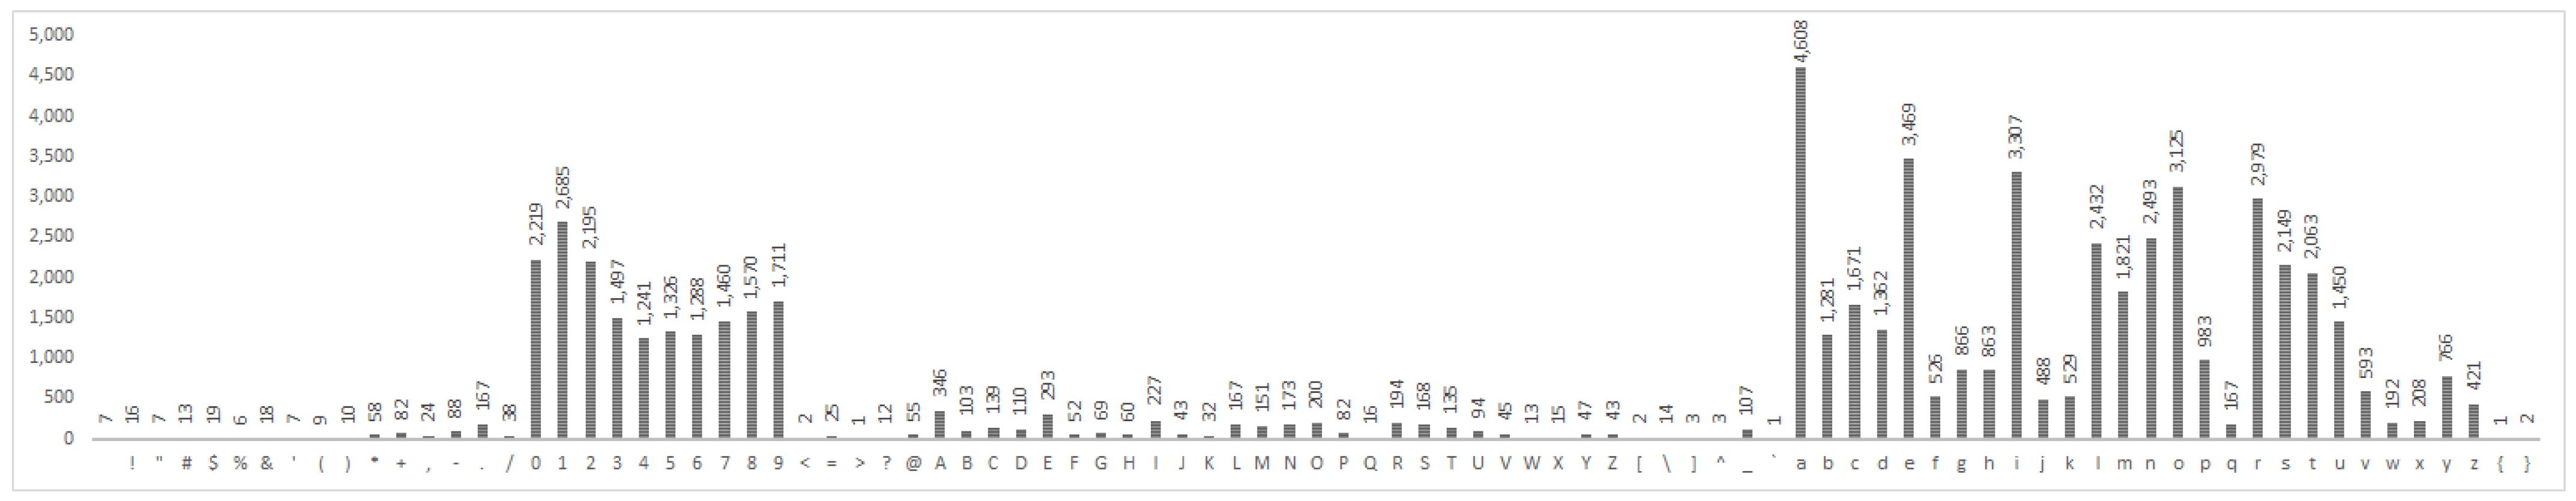
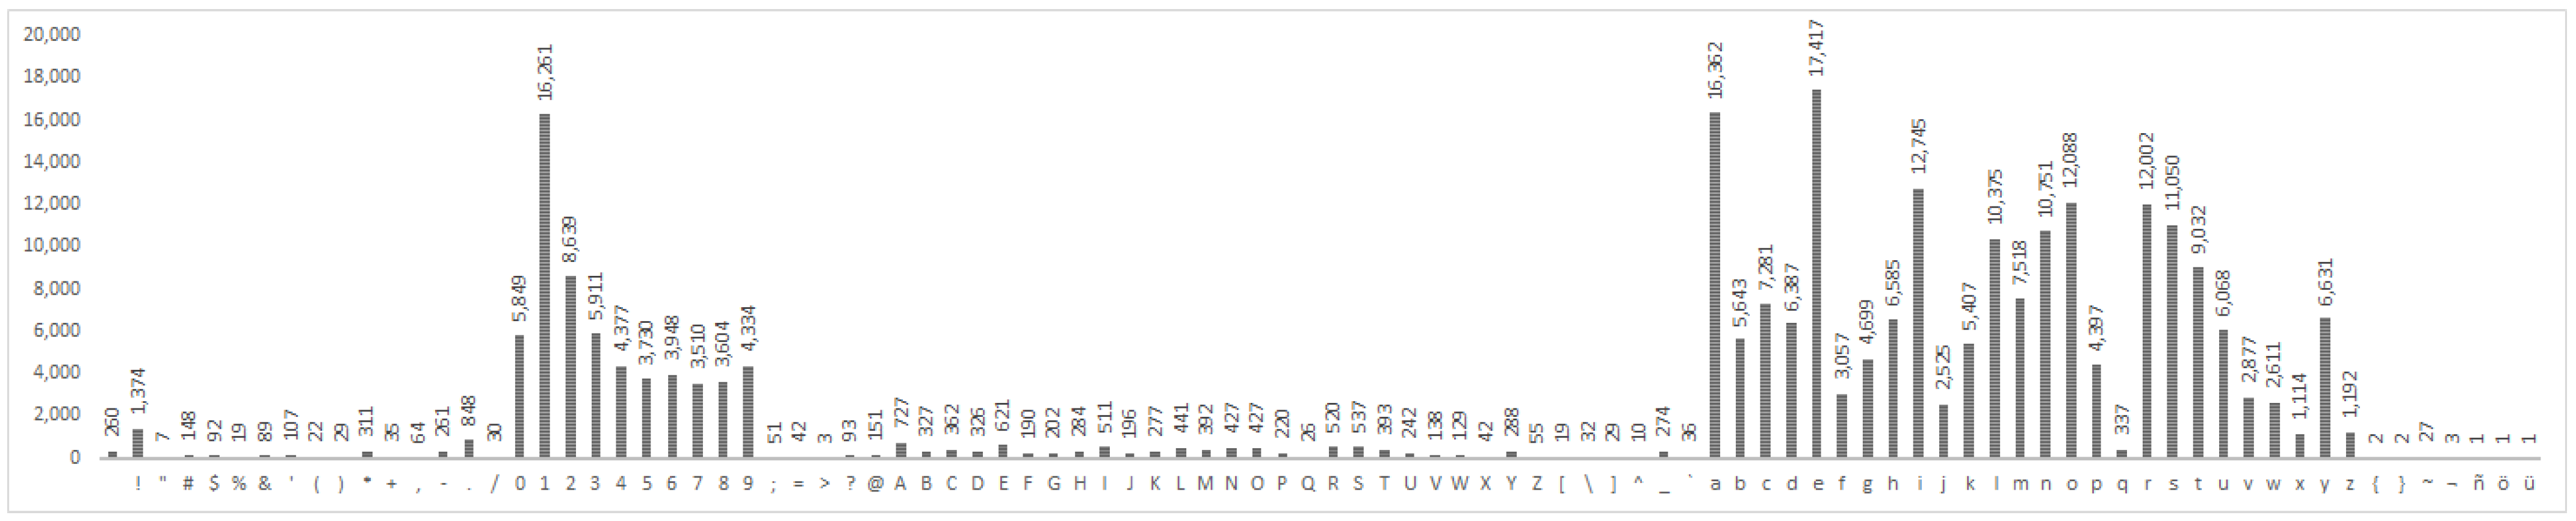
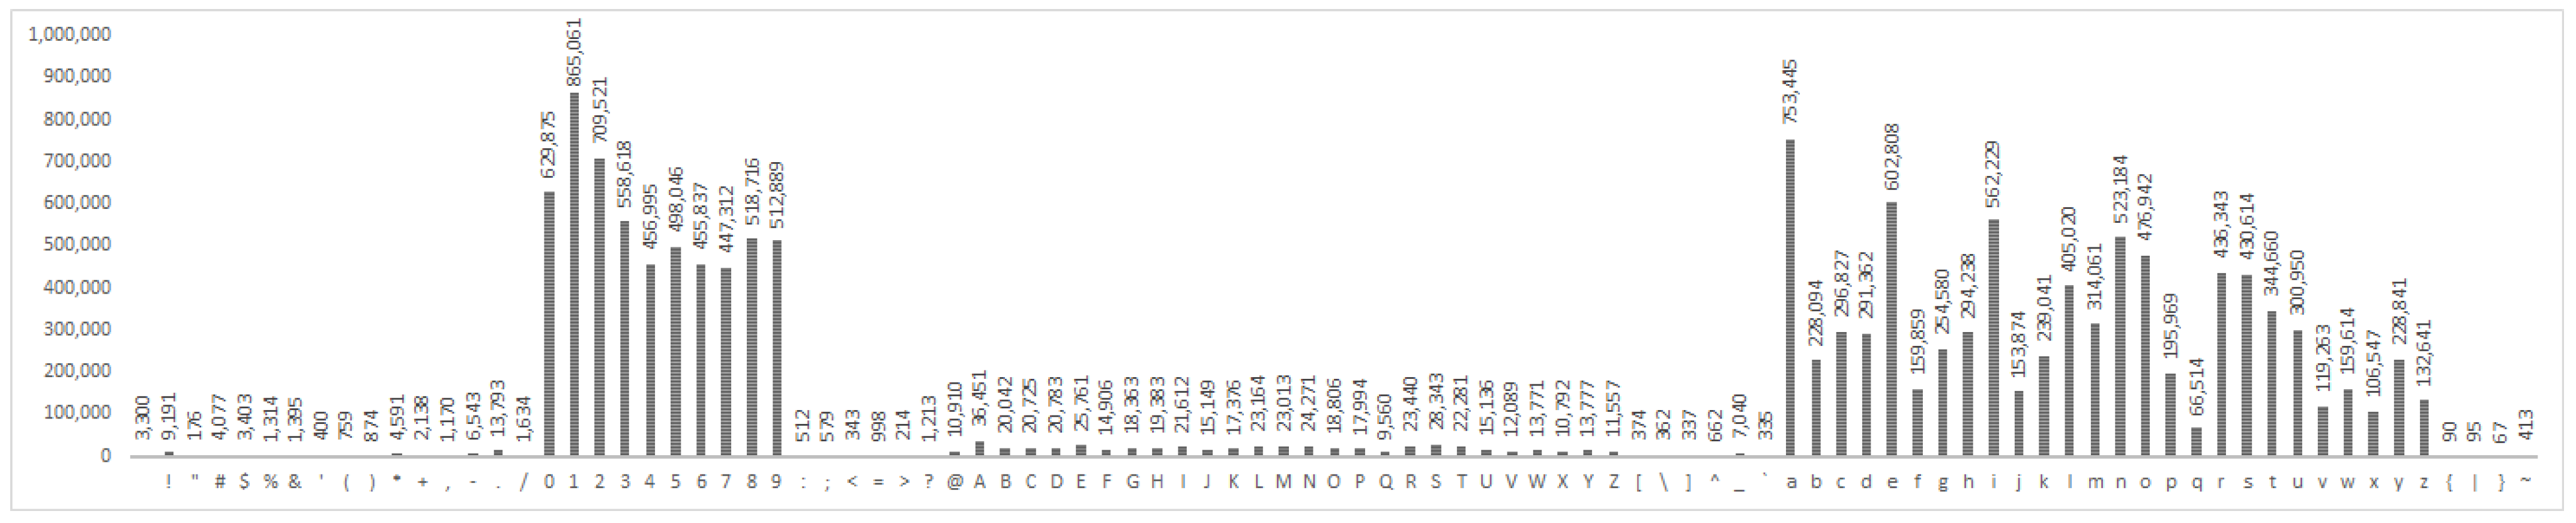
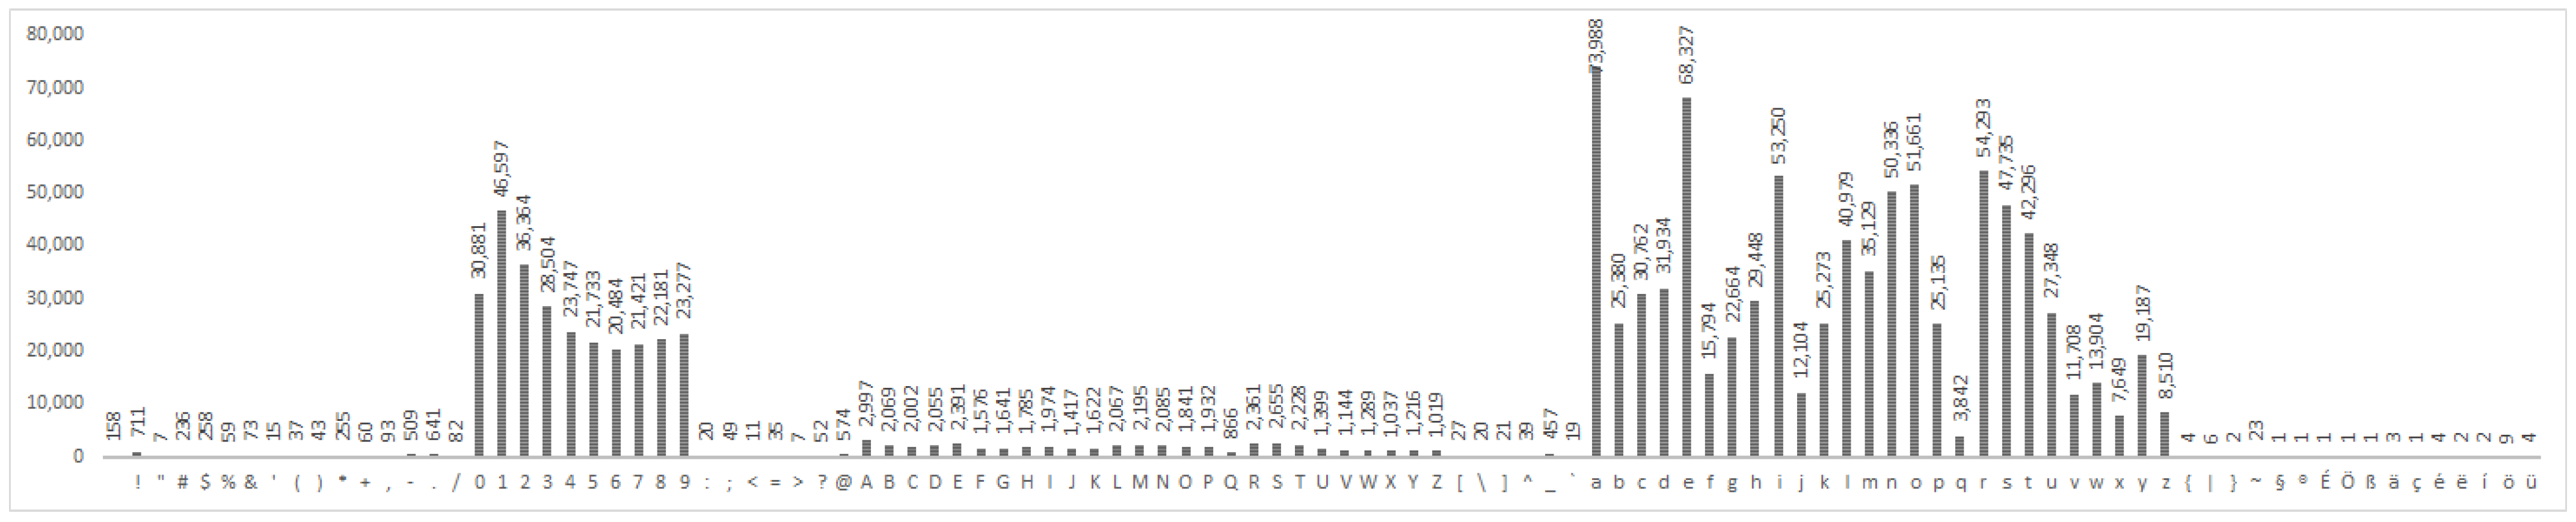
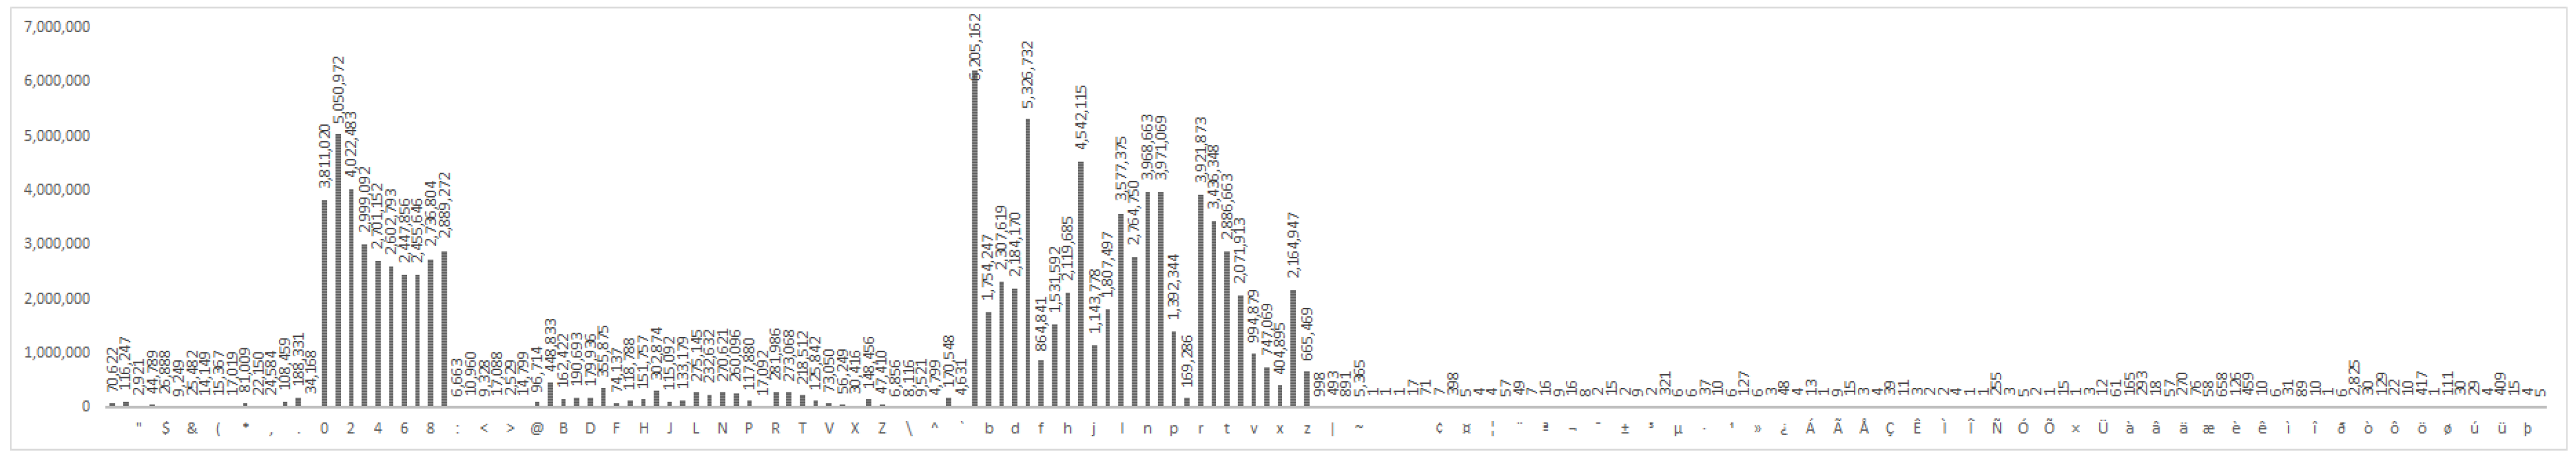
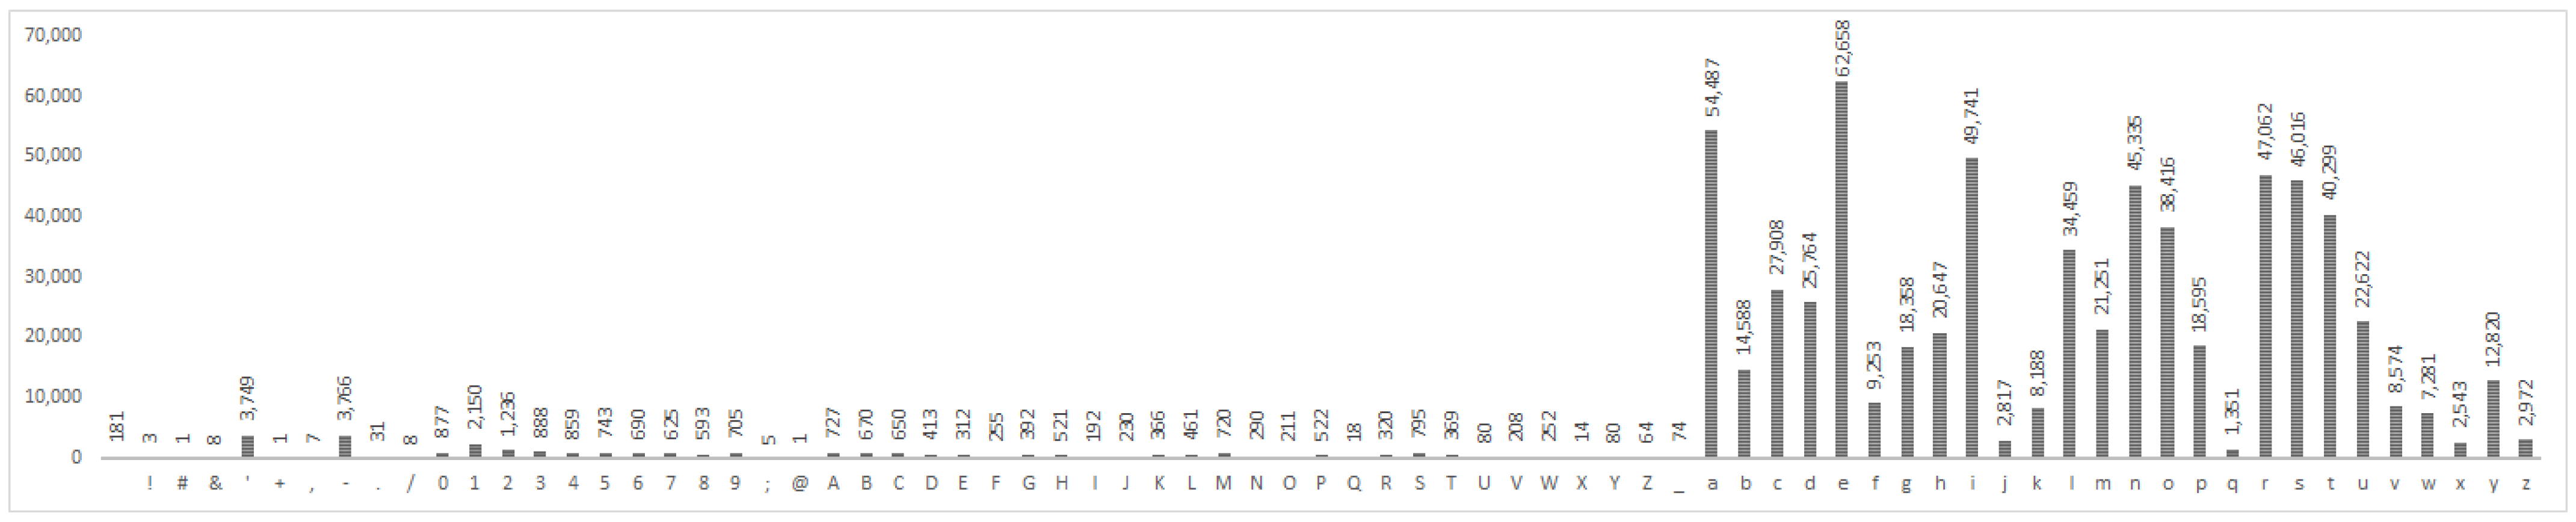
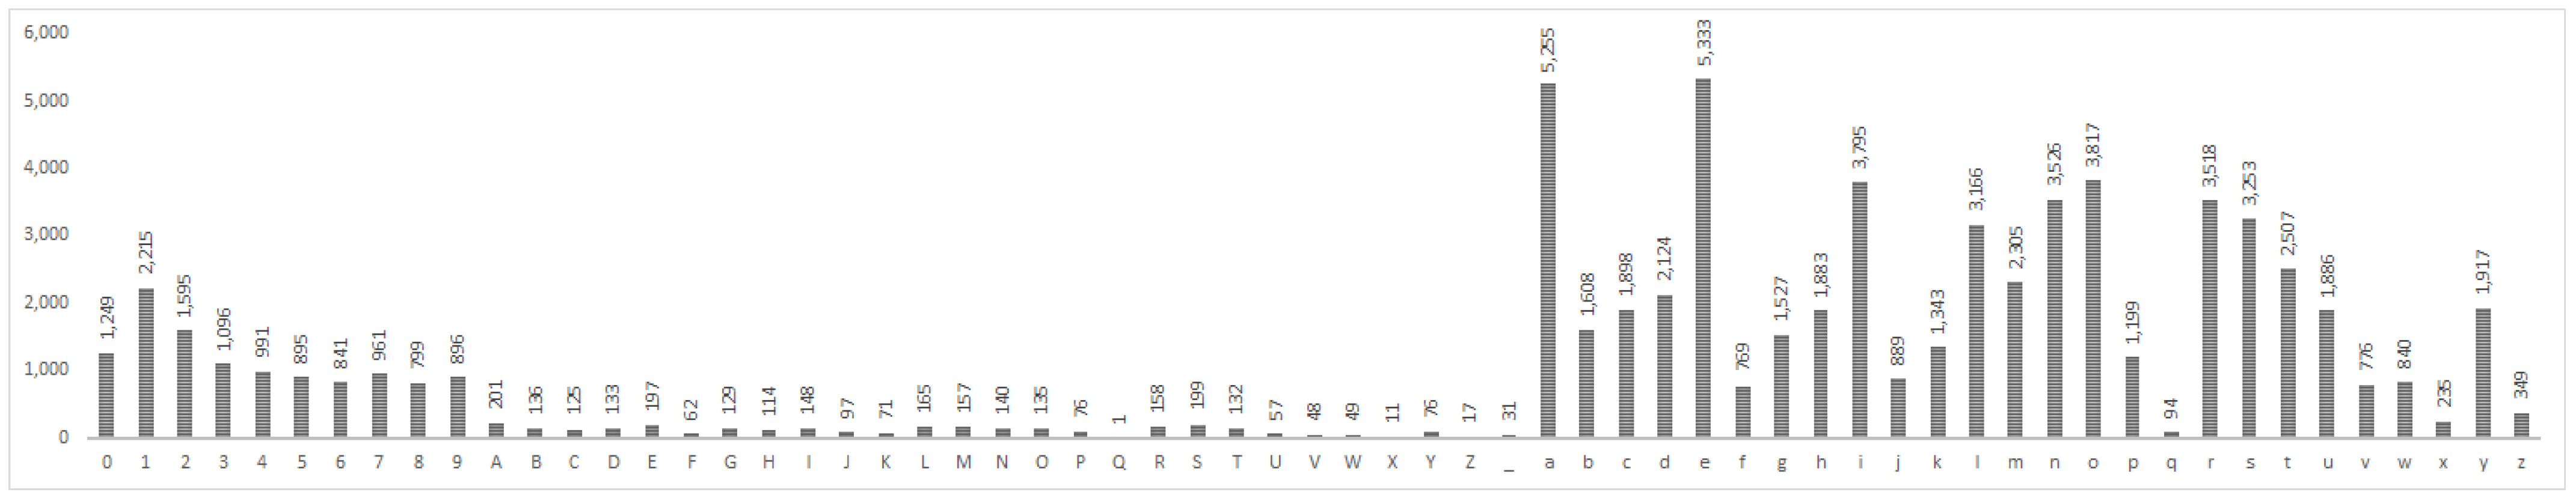
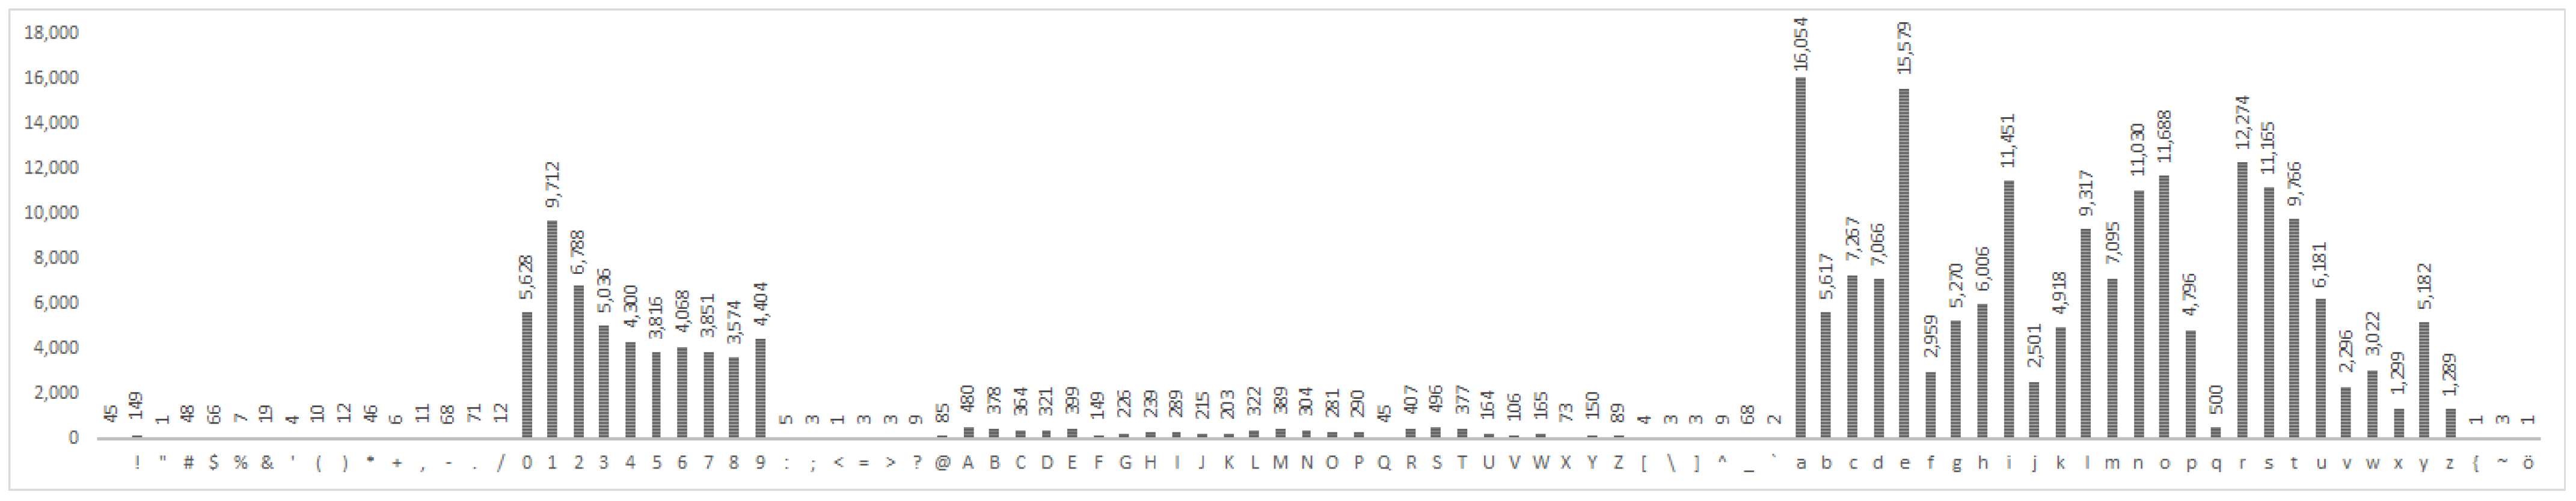
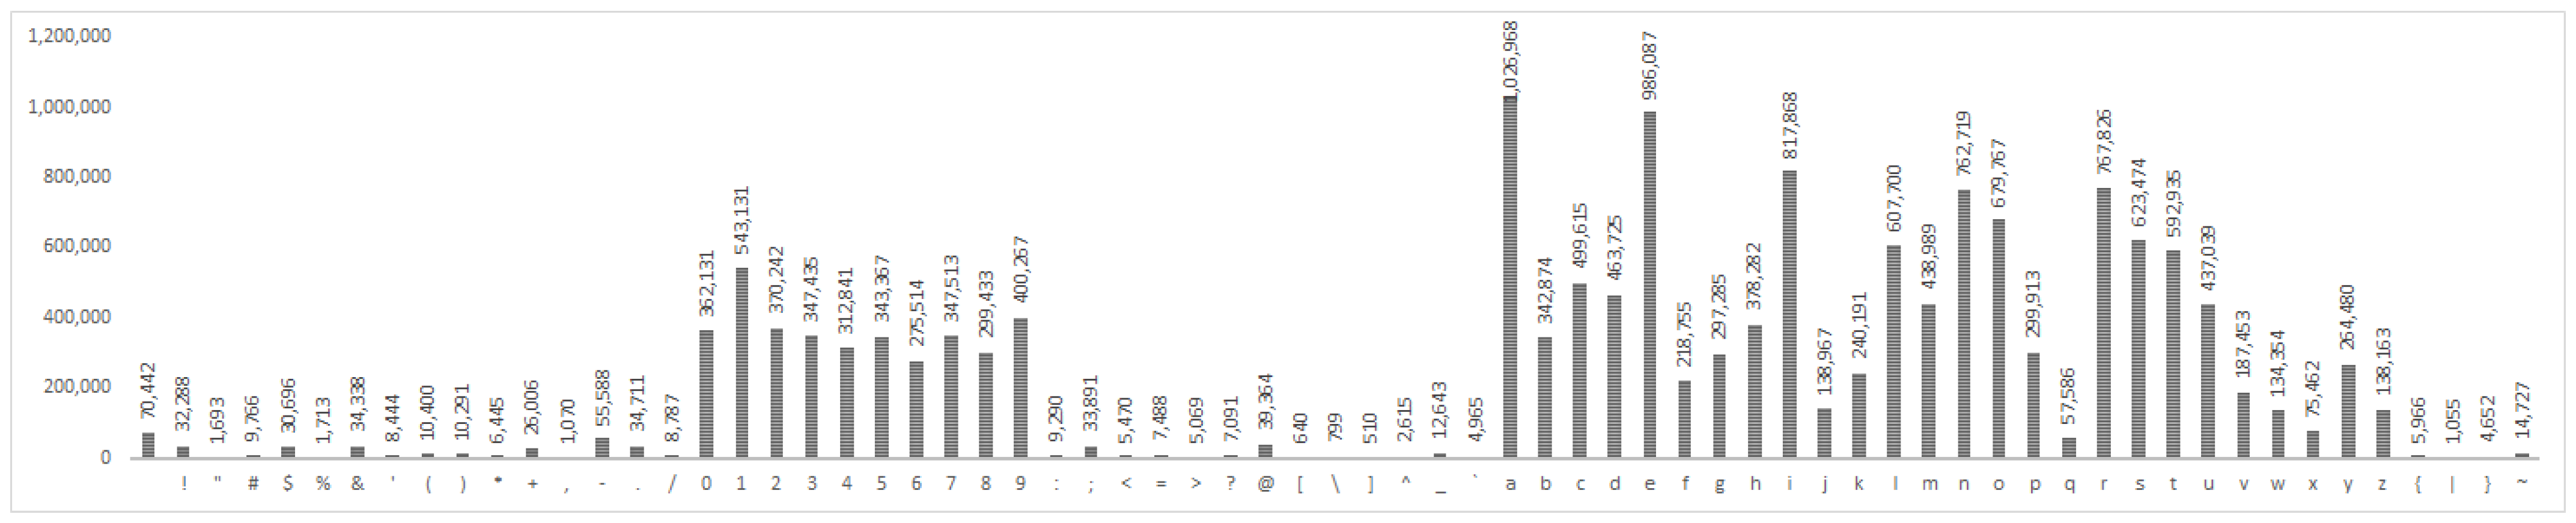
Table A1.
Pairwise Comparison of the Models.
| Model 1 | Model 2 | Z | p-Value | r | Effect | CL |
|---|---|---|---|---|---|---|
| 10k_most_common | 10_million_passwords | −533.29 | <0.000005 | 0.1092 | Small | 57.73% |
| 10k_most_common | hotmail | −97.42 | <0.000005 | 0.0199 | Trivial | 51.43% |
| 10k_most_common | phpbb | −170.25 | <0.000005 | 0.0349 | Trivial | 52.47% |
| 10k_most_common | rockyou | −466.12 | <0.000005 | 0.0954 | Trivial | 56.75% |
| 10k_most_common | singles_org | −54.90 | <0.000005 | 0.0112 | Trivial | 50.81% |
| 10k_most_common | tuscl | −135.87 | <0.000005 | 0.0278 | Trivial | 51.99% |
| 10k_most_common | uniqpass | −117.42 | <0.000005 | 0.0240 | Trivial | 51.73% |
| faithwriters | 10_million_passwords | −1075.77 | <0.000005 | 0.2203 | Small | 65.59% |
| faithwriters | 10k_most_common | −474.36 | <0.000005 | 0.0971 | Trivial | 57.15% |
| faithwriters | hotmail | −641.63 | <0.000005 | 0.1314 | Small | 59.47% |
| faithwriters | myspace | −493.29 | <0.000005 | 0.1010 | Small | 57.25% |
| faithwriters | phpbb | −757.29 | <0.000005 | 0.1551 | Small | 60.98% |
| faithwriters | rockyou | −1026.99 | <0.000005 | 0.2103 | Small | 64.87% |
| faithwriters | singles_org | −579.74 | <0.000005 | 0.1187 | Small | 58.61% |
| faithwriters | tuscl | −690.55 | <0.000005 | 0.1414 | Small | 60.13% |
| faithwriters | uniqpass | −645.65 | <0.000005 | 0.1322 | Small | 59.54% |
| hotmail | 10_million_passwords | −473.38 | <0.000005 | 0.0969 | Trivial | 56.86% |
| hotmail | phpbb | −44.39 | <0.000005 | 0.0091 | Trivial | 50.64% |
| hotmail | rockyou | −397.70 | <0.000005 | 0.0814 | Trivial | 55.76% |
| hotmail | tuscl | −32.67 | <0.000005 | 0.0067 | Trivial | 50.48% |
| hotmail | uniqpass | −26.93 | <0.000005 | 0.0055 | Trivial | 50.39% |
| myspace | 10_million_passwords | −685.35 | <0.000005 | 0.1403 | Small | 59.93% |
| myspace | 10k_most_common | −64.28 | <0.000005 | 0.0132 | Trivial | 50.94% |
| myspace | hotmail | −210.92 | <0.000005 | 0.0432 | Trivial | 53.07% |
| myspace | phpbb | −284.03 | <0.000005 | 0.0582 | Trivial | 54.11% |
| myspace | rockyou | −624.40 | <0.000005 | 0.1279 | Small | 59.04% |
| myspace | singles_org | −173.66 | <0.000005 | 0.0356 | Trivial | 52.53% |
| myspace | tuscl | −255.10 | <0.000005 | 0.0522 | Trivial | 53.71% |
| myspace | uniqpass | −232.11 | <0.000005 | 0.0475 | Trivial | 53.38% |
| passwords | 10_million_passwords | −1154.46 | <0.000005 | 0.2364 | Small | 66.73% |
| passwords | 10k_most_common | −552.33 | <0.000005 | 0.1131 | Small | 58.42% |
| passwords | faithwriters | −142.85 | <0.000005 | 0.0293 | Trivial | 52.20% |
| passwords | hotmail | −739.00 | <0.000005 | 0.1513 | Small | 60.99% |
| passwords | myspace | −631.29 | <0.000005 | 0.1293 | Small | 59.29% |
| passwords | phpbb | −883.09 | <0.000005 | 0.1808 | Small | 62.81% |
| passwords | rockyou | −1106.78 | <0.000005 | 0.2266 | Small | 66.03% |
| passwords | singles_org | −680.09 | <0.000005 | 0.1393 | Small | 60.18% |
| passwords | tuscl | −783.45 | <0.000005 | 0.1604 | Small | 61.52% |
| passwords | uniqpass | −749.46 | <0.000005 | 0.1535 | Small | 61.15% |
| phpbb | 10_million_passwords | −452.18 | <0.000005 | 0.0926 | Trivial | 56.55% |
| phpbb | rockyou | −374.77 | <0.000005 | 0.0767 | Trivial | 55.43% |
| rockyou | 10_million_passwords | −85.05 | <0.000005 | 0.0174 | Trivial | 51.23% |
| scribd | 10_million_passwords | −2563.90 | <0.000005 | 0.5250 | Large | 87.18% |
| scribd | 10k_most_common | −1978.05 | <0.000005 | 0.4050 | Medium | 81.69% |
| scribd | faithwriters | −1719.88 | <0.000005 | 0.3522 | Medium | 78.20% |
| scribd | hotmail | −2214.09 | <0.000005 | 0.4534 | Medium | 83.74% |
| scribd | myspace | −2228.82 | <0.000005 | 0.4564 | Medium | 83.38% |
| scribd | passwords | −1469.32 | <0.000005 | 0.3009 | Medium | 75.33% |
| scribd | phpbb | −2430.38 | <0.000005 | 0.4977 | Medium | 85.32% |
| scribd | rockyou | −2542.95 | <0.000005 | 0.5207 | Large | 86.83% |
| scribd | singles_org | −2149.37 | <0.000005 | 0.4401 | Medium | 83.17% |
| scribd | tuscl | −2314.10 | <0.000005 | 0.4739 | Medium | 84.46% |
| scribd | uniqpass | −2213.08 | <0.000005 | 0.4532 | Medium | 83.81% |
| singles_org | 10_million_passwords | −488.33 | <0.000005 | 0.0999 | Trivial | 57.07% |
| singles_org | hotmail | −29.83 | <0.000005 | 0.0061 | Trivial | 50.44% |
| singles_org | phpbb | −82.63 | <0.000005 | 0.0169 | Trivial | 51.20% |
| singles_org | rockyou | −414.37 | <0.000005 | 0.0849 | Trivial | 56.00% |
| singles_org | tuscl | −55.45 | <0.000005 | 0.0114 | Trivial | 50.81% |
| singles_org | uniqpass | −52.65 | <0.000005 | 0.0108 | Trivial | 50.77% |
| tuscl | 10_million_passwords | −425.79 | <0.000005 | 0.0872 | Trivial | 56.17% |
| tuscl | phpbb | −22.96 | <0.000005 | 0.0047 | Trivial | 50.33% |
| tuscl | rockyou | −363.60 | <0.000005 | 0.0745 | Trivial | 55.26% |
| uniqpass | 10_million_passwords | −434.23 | <0.000005 | 0.0889 | Trivial | 56.29% |
| uniqpass | phpbb | −26.70 | <0.000005 | 0.0055 | Trivial | 50.39% |
| uniqpass | rockyou | −362.49 | <0.000005 | 0.0742 | Trivial | 55.25% |
| uniqpass | tuscl | −13.70 | <0.000005 | 0.0028 | Trivial | 50.20% |
References
- Loch, K.D.; Carr, H.H.; Warkentin, M.E. Threats to Information Systems: Today’s Reality, Yesterday’s Understanding. MIS Q. 1992, 16, 173–186. [Google Scholar] [CrossRef] [Green Version]
- Tzong-Chen, W.; Hung-Sung, S. Authenticating passwords over an insecure channel. Comput. Secur. 1996, 15, 431–439. [Google Scholar] [CrossRef]
- Creese, S.; Hodges, D.; Jamison-Powell, S.; Whitty, M. Relationships between Password Choices, Perceptions of Risk and Security Expertise. In Human Aspects of Information Security, Privacy, and Trust; Lecture Notes in Computer Science; Marinos, L., Askoxylakis, I., Eds.; Springer: Berlin/Heidelberg, Germany, 2013; Volume 8030, pp. 80–89. [Google Scholar]
- Morris, R.; Thompson, K. Password Security: A Case History. Commun. ACM 1979, 22, 594–597. [Google Scholar] [CrossRef]
- Bishop, M.; Klein, D.V. Improving system security via proactive password checking. Comput. Secur. 1995, 14, 233–249. [Google Scholar] [CrossRef]
- Yan, J.J. A Note on Proactive Password Checking. In Proceedings of the 2001 Workshop on New Security Paradigms, Cloudcroft, NM, USA, 10 September 2001; pp. 127–135. [Google Scholar]
- Proctor, R.W.; Lien, M.C.; Vu, K.P.L.; Schultz, E.E.; Salvendy, G. Improving computer security for authentication of users: Influence of proactive password restrictions. Behav. Res. Methods Instrum. Comput. 2002, 34, 163–169. [Google Scholar] [CrossRef] [PubMed] [Green Version]
- Vu, K.P.L.; Proctor, R.W.; Bhargav-Spantzel, A.; Tai, B.L.B.; Cook, J.; Eugene Schultz, E. Improving Password Security and Memorability to Protect Personal and Organizational Information. Int. J. Hum.-Comput. Stud. 2007, 65, 744–757. [Google Scholar] [CrossRef]
- Dell’ Amico, M.; Michiardi, P.; Roudier, Y. Password Strength: An Empirical Analysis. In Proceedings of the 2010 Proceedings IEEE INFOCOM, San Diego, CA, USA, 14–19 March 2010; pp. 1–9. [Google Scholar]
- Narayanan, A.; Shmatikov, V. Fast Dictionary Attacks on Passwords Using Time-space Tradeoff. In Proceedings of the 12th ACM Conference on Computer and Communications Security CCS ’05, Alexandria, VA, USA, 7–11 November 2005; pp. 364–372. [Google Scholar]
- Marechal, S. Advances in password cracking. J. Comput. Virol. 2008, 4, 73–81. [Google Scholar] [CrossRef]
- Castelluccia, C.; Dürmuth, M.; Perito, D. Adaptive password-strength meters from Markov models. In Proceedings of the 19th Annual Network and Distributed System Security Symposium, Hilton, San Diego, CA, USA, 5–8 February 2012; Volume 2012. [Google Scholar]
- Ma, J.; Yang, W.; Luo, M.; Li, N. A Study of Probabilistic Password Models. In Proceedings of the 2014 IEEE Symposium on Security and Privacy, Berkeley, CA, USA, 18–21 May 2014; IEEE Computer Society: Washington, DC, USA, 2014; pp. 689–704. [Google Scholar]
- Wang, D.; He, D.; Cheng, H.; Wang, P. fuzzyPSM: A New Password Strength Meter Using Fuzzy Probabilistic Context-Free Grammars. In Proceedings of the 2016 46th Annual IEEE/IFIP International Conference on Dependable Systems and Networks (DSN), Toulouse, France, 28 June–1 July 2016; pp. 595–606. [Google Scholar]
- Galbally, J.; Coisel, I.; Sanchez, I. A probabilistic framework for improved password strength metrics. In Proceedings of the 2014 International Carnahan Conference on Security Technology (ICCST), Rome, Italy, 13–16 October 2014; pp. 1–6. [Google Scholar]
- Wang, D.; Wang, P.; He, D.; Tian, Y. Birthday, Name and Bifacial-Security: Understanding Passwords of Chinese Web Users. In Proceedings of the 28th USENIX Conference on Security Symposium (USENIX Security 19); USENIX Association: Santa Clara, CA, USA, 2019; pp. 1537–1554. [Google Scholar]
- Egelman, S.; Sotirakopoulos, A.; Muslukhov, I.; Beznosov, K.; Herley, C. Does My Password Go Up to Eleven?: The Impact of Password Meters on Password Selection. In Proceedings of the SIGCHI Conference on Human Factors in Computing Systems, Paris, France, 27 April–2 May 2013; pp. 2379–2388. [Google Scholar]
- Weir, M.; Aggarwal, S.; Collins, M.; Stern, H. Testing metrics for password creation policies by attacking large sets of revealed passwords. In Proceedings of the 17th ACM Conference on Computer and Communications Security-CCS ’10, Chicago, IL, USA, 4–8 October 2010; ACM: New York, NY, USA, 2010; p. 162. [Google Scholar]
- Weir, M.; Aggarwal, S.; de Medeiros, B.; Glodek, B. Password Cracking Using Probabilistic Context-Free Grammars. In Proceedings of the 2009 30th IEEE Symposium on Security and Privacy, Oakland, CA, USA, 17–20 May 2009; pp. 391–405. [Google Scholar]
- Houshmand, S.; Aggarwal, S.; Flood, R. Next Gen PCFG Password Cracking. IEEE Trans. Inf. Forensics Secur. 2015, 10, 1776–1791. [Google Scholar] [CrossRef]
- John the Ripper Password Cracker. Available online: https://www.openwall.com/john/ (accessed on 16 April 2019).
- Sutskever, I.; Martens, J.; Hinton, G. Generating Text with Recurrent Neural Networks. In Proceedings of the 28th International Conference on International Conference on Machine Learning Omnipress ICML’11, Washington, DC, USA, 28 June–2 July 2011; pp. 1017–1024. [Google Scholar]
- Graves, A. Generating Sequences With Recurrent Neural Networks. arXiv 2013, arXiv:cs.NE/1308.0850. [Google Scholar]
- Ciaramella, A.; D’Arco, P.; Santis, A.D.; Galdi, C.; Tagliaferri, R. Neural Network Techniques for Proactive Password Checking. IEEE Trans. Dependable Secur. Comput. 2006, 3, 327–339. [Google Scholar] [CrossRef]
- Melicher, W.; Ur, B.; Segreti, S.M.; Komanduri, S.; Bauer, L.; Christin, N.; Cranor, L.F. Fast, Lean, and Accurate: Modeling Password Guessability Using Neural Networks. In Proceedings of the 25th USENIX Security Symposium (USENIX Security 16). USENIX Association, Austin, TX, USA, 10–12 August 2016; pp. 175–191. [Google Scholar]
- Rabiner, L.R. A tutorial on hidden Markov models and selected applications in speech recognition. Proc. IEEE 1989, 77, 257–286. [Google Scholar] [CrossRef]
- Passwords. 2015. Available online: https://wiki.skullsecurity.org/Passwords/ (accessed on 10 March 2019).
- Today I Am Releasing Ten Million Passwords. 2015. Available online: https://xato.net/today-i-am-releasing-ten-million-passwords-b6278bbe7495 (accessed on 15 March 2019).
- Large Password List: Free Download Dictionary File for Password Cracking. 2011. Available online: https://breakthesecurity.cysecurity.org/2011/12/large-password-list-free-download-dictionary-file-for-password-cracking.html (accessed on 16 March 2019).
- 10,000 Top Passwords. 2011. Available online: https://xato.net/10-000-top-passwords-6d6380716fe0 (accessed on 16 March 2019).
- Voyiatzis, A.G.; Fidas, C.A.; Serpanos, D.N.; Avouris, N.M. An Empirical Study on the Web Password Strength in Greece. In Proceedings of the 2011 15th Panhellenic Conference on Informatics, Kastoria, Greece, 30 September–2 October 2011. [Google Scholar]
- Zezschwitz, E.; Luca, A.; Hussmann, H. Survival of the Shortest: A Retrospective Analysis of Influencing Factors on Password Composition. In Human-Computer Interaction—INTERACT 2013 SE-28; Lecture Notes in Computer Science; Kotzé, P., Marsden, G., Lindgaard, G., Wesson, J., Winckler, M., Eds.; Springer: Berlin/Heidelberg, Germany, 2013; Volume 8119, pp. 460–467. [Google Scholar]
- Cohen, J. {CHAPTER} 1-The Concepts of Power Analysis. In Statistical Power Analysis for the Behavioral Sciences (Revised Edition), Revised Edition ed.; Cohen, J., Ed.; Academic Press: Cambridge, MA, USA, 1977; pp. 1–17. [Google Scholar]
- Hashcat, Advanced Password Recovery. Available online: https://hashcat.net/wiki/ (accessed on 20 April 2019).
Figure 1.
Graphical presentation of the process of dividing datasets and combining them into one dataset for testing.
Figure 1.
Graphical presentation of the process of dividing datasets and combining them into one dataset for testing.

Figure 2.
Graphical presentation of the process of calculating the passwords’ strength with different models.
Figure 2.
Graphical presentation of the process of calculating the passwords’ strength with different models.

Figure 3.
Distribution histogram for the myspace model.

Figure 4.
Frequency of ceiling values for each model.

Figure 5.
The number of times models were unable to calculate each passwords strength.

Figure 6.
Four examples for the distribution of differences between two models.

Table 1.
Basic information of datasets.
| Dataset | Size | Date Obtained | Source |
|---|---|---|---|
| rockyou | 14,344,390 | 12-2009 | [27] |
| 10_million_passwords | 10,000,000 | 02-2015 | [28] |
| passwords | 2,151,220 | 12-2011 | [29] |
| uniqpass_preview | 1,999,984 | 12-2011 | [29] |
| phpbb | 184,389 | 01-2009 | [27] |
| scribd | 106,358 | Unknown | Source unknown |
| tuscl | 38,820 | Unknown | [27] |
| myspace | 37,139 | 10-2006 | [27] |
| singles_org | 12,233 | 10-2010 | [27] |
| 10k_most_common | 10,000 | 06-2011 | [30] |
| hotmail | 8930 | Unknown | [27] |
| faithwriters | 8347 | 03-2009 | [27] |
Table 2.
Passwords information.
| Dataset | Digits Only | Lowercase Only | Uppercase Only | Mixedcase | Alphanumeric | A special Character * |
|---|---|---|---|---|---|---|
| 1. rockyou | 16.36% | 26.06% | 1.61% | 1.12% | 47.51% | 6.82% |
| 2. 10 million passwords | 20.36% | 38.25% | 1.09% | 2.52% | 35.90% | 1.10% |
| 3. passwords | 23.22% | 23.85% | 0.75% | 1.56% | 47.08% | 3.02% |
| 4. uniqpass preview | 6.70% | 28.96% | 0.00% | 0.00% | 48.86% | 15.48% |
| 5. phpbb | 11.24% | 41.25% | 0.93% | 2.69% | 41.19% | 2.13% |
| 6. scribd | 0.27% | 81.71% | 0.18% | 7.57% | 2.94% | 7.32% |
| 7. tuscl | 8.70% | 42.36% | 0.94% | 2.38% | 43.17% | 1.72% |
| 8. myspace | 0.72% | 6.75% | 0.29% | 0.18% | 80.43% | 10.66% |
| 9. singles_org | 8.37% | 55.11% | 2.26% | 4.37% | 29.00% | 0.24% |
| 10. 10k most common | 5.54% | 83.10% | 0.00% | 0.00% | 11.20% | 0.16% |
| 11. hotmail | 18.52% | 41.59% | 2.21% | 1.05% | 29.50% | 6.93% |
| 12. faithwriters | 6.27% | 50.15% | 1.32% | 3.83% | 37.14% | 0.53% |
* the password contains at least one special character.
Table 3.
Passwords frequency information.
| Dataset | Size | Unique | Twice | 3 times | 4 times | 5+ times |
|---|---|---|---|---|---|---|
| 1. rockyou | 14,344,390 | 100% | 0% | 0% | 0% | 0% |
| 2. 10_million_passwords | 10,000,000 | 44.34% | 3.86% | 1.21% | 0.6% | 1.89% |
| 3. passwords | 2,151,220 | 99.96% | 0.02% | 0% | 0% | 0% |
| 4. uniqpasss_preview | 1,999,984 | 100% | 0% | 0% | 0% | 0% |
| 5. phpbb | 184,389 | 100% | 0% | 0% | 0% | 0% |
| 6. scribd | 106,358 | 75.68% | 12.12% | 0.03% | 0% | 0% |
| 7. tuscl | 38,820 | 100% | 0% | 0% | 0% | 0% |
| 8. myspace | 37,139 | 100% | 0% | 0% | 0% | 0% |
| 9. singles_org | 12,233 | 100% | 0% | 0% | 0% | 0% |
| 10. 10k_most_common | 10,000 | 100% | 0% | 0% | 0% | 0% |
| 11. hotmail | 8930 | 100% | 0% | 0% | 0% | 0% |
| 12. faithwriters | 8347 | 100% | 0% | 0% | 0% | 0% |
Table 4.
Password length.
| Dataset | Size | Password Length | |
|---|---|---|---|
| Mean | Standard Deviation | ||
| rockyou | 14,344,390 | 8.75 | 2.898 |
| 10_million_passwords | 10,000,000 | 7.59 | 2.15 |
| passwords | 2,151,220 | 8.37 | 1.995 |
| uniqpass_preview | 1,999,984 | 9.92 | 3.51 |
| phpbb | 184,389 | 7.54 | 1.75 |
| scribd | 106,358 | 7.51 | 2.6 |
| tuscl | 38,820 | 7.37 | 1.75 |
| myspace | 37,139 | 8.23 | 2.6 |
| singles_org | 12,233 | 6.74 | 1.19 |
| 10k_most_common | 10,000 | 6.30 | 1.3 |
| hotmail | 8930 | 8.79 | 2.89 |
| faithwriters | 8347 | 7.71 | 1.86 |
| Simple average | 7.9 | ||
| Weighted average | 8.38 | ||
Table 5.
Descriptive statistics for the password strengths produced by the 12 models.
| Dataset | Mean | Median | Mode | Std. Deviation | Maximum |
|---|---|---|---|---|---|
| 10_million_passwords | 146.26 | 120.22 | 4000 | 257.99 | 4000 |
| 10k_most_common | 1074.47 | 126.20 | 4000 | 1671.79 | 4000 |
| faithwriters | 1286.00 | 141.36 | 4000 | 1772.61 | 4000 |
| hotmail | 632.37 | 127.12 | 4000 | 1303.92 | 4000 |
| myspace | 487.87 | 132.53 | 4000 | 1111.33 | 4000 |
| passwords | 1656.88 | 161.35 | 4000 | 1895.30 | 4000 |
| phpbb | 174.87 | 128.49 | 4000 | 381.38 | 4000 |
| rockyou | 132.99 | 120.69 | 4000 | 95.21 | 4000 |
| scribd | 3003.56 | 4000.00 | 4000 | 1690.55 | 4000 |
| singles_org | 750.01 | 127.06 | 4000 | 1425.36 | 4000 |
| tuscl | 427.66 | 127.33 | 4000 | 1027.52 | 4000 |
| uniqpass | 657.80 | 126.40 | 4000 | 1332.94 | 4000 |
Table 6.
Ordering the models.
| Order Number | Dataset | Size | Freq. of Ceiling Values | % * |
|---|---|---|---|---|
| 1 | 10_million | 10,000,000 | 51,339 | 0.43 |
| 2 | rockyou | 14,344,390 | 5417 | 0.05 |
| 3 | phpbb | 184,389 | 115,528 | 0.97 |
| 4 | tuscl | 38,820 | 909,631 | 7.63 |
| 5 | uniqpasss_preview | 1,999,984 | 1,635,319 | 13.71 |
| 6 | hotmail | 8930 | 1,553,497 | 13.03 |
| 7 | singles_org | 12,233 | 1,922,760 | 16.12 |
| 8 | 10k_most_common | 10,000 | 2,934,668 | 24.61 |
| 9 | myspace | 37,139 | 1,083,773 | 9.09 |
| 10 | faithwriters | 8347 | 3,564,910 | 29.90 |
| 11 | passwords | 2,151,220 | 4,715,074 | 39.54 |
| 12 | scribe | 106,358 | 8,848,941 | 74.21 |
* percents from the testing dataset.
Table 7.
Summary of Pairwise Comparison.
| Effect | # | Mean r Value | Mean CL |
|---|---|---|---|
| Trivial | 35 | 0.044 | 53.14% |
| Small | 20 | 0.154 | 61.01% |
| Medium | 9 | 0.426 | 82.12% |
| Large | 2 | 0.523 | 87.01% |
Table 8.
Password cracking results for the three different Markov models.
| Password Category | Attacking Technique | Total | ||
|---|---|---|---|---|
| Dictionary | Dictionary + Rules | Markov Mode | ||
| Weak | 462 (92.4%) | 4 (0.8%) | / | 466 (93.2%) |
| Medium | 96 (19.2%) | 150 (30%) | / | 246 (49.2%) |
| Strong | 2 (0.4%) | 153 (30.6%) | / | 155 (31%) |
Table 9.
Password cracking results for the universal Markov model.
| Password Category | Attacking Technique | Total | ||
|---|---|---|---|---|
| Dictionary | Dictionary + Rules | Markov Mode | ||
| Weak | 10 (2%) | 49 (4.8%) | / | 59 (11.8%) |
| Medium | 2 (0.4%) | 25 (5%) | / | 27 (5.4%) |
| Strong | 1 (0.2%) | 25 (5%) | / | 26 (5.2%) |
Publisher’s Note: MDPI stays neutral with regard to jurisdictional claims in published maps and institutional affiliations. |
© 2021 by the authors. Licensee MDPI, Basel, Switzerland. This article is an open access article distributed under the terms and conditions of the Creative Commons Attribution (CC BY) license (https://creativecommons.org/licenses/by/4.0/).
Share and Cite
MDPI and ACS Style
Taneski, V.; Kompara, M.; Heričko, M.; Brumen, B. Strength Analysis of Real-Life Passwords Using Markov Models. Appl. Sci. 2021, 11, 9406. https://doi.org/10.3390/app11209406
AMA Style
Taneski V, Kompara M, Heričko M, Brumen B. Strength Analysis of Real-Life Passwords Using Markov Models. Applied Sciences. 2021; 11(20):9406. https://doi.org/10.3390/app11209406
Chicago/Turabian StyleTaneski, Viktor, Marko Kompara, Marjan Heričko, and Boštjan Brumen. 2021. "Strength Analysis of Real-Life Passwords Using Markov Models" Applied Sciences 11, no. 20: 9406. https://doi.org/10.3390/app11209406
Note that from the first issue of 2016, this journal uses article numbers instead of page numbers. See further details here.