Article

Assessment and Evaluation of Force–Velocity Variables in Flywheel Squats: Validity and Reliability of Force Plates, a Linear Encoder Sensor, and a Rotary Encoder Sensor

1
Faculty of Sport, University of Ljubljana, 1000 Ljubljana, Slovenia
2
Faculty of Computer and Information Science, University of Ljubljana, 1000 Ljubljana, Slovenia
3
Faculty of Health Sciences, University of Primorska, 6310 Izola, Slovenia
4
InnoRenew CoE, 6310 Izola, Slovenia
5
Laboratory for Motor Control and Motor Behaviour, S2P, Science to Practice, Ltd., 1000 Ljubljana, Slovenia
6
Andrej Marušič Institute, University of Primorska, 6000 Koper, Slovenia
*
Author to whom correspondence should be addressed.
Appl. Sci. 2021, 11(22), 10541; https://doi.org/10.3390/app112210541
Submission received: 8 October 2021 / Revised: 6 November 2021 / Accepted: 7 November 2021 / Published: 9 November 2021
(This article belongs to the Special Issue Applied Biomechanics for Injury Prevention and Performance)

Abstract

:
Research into flywheel (FW) resistance training and force–velocity–power (FvP) profiling has recently gained attention. Ground reaction force (GRF) and velocity (v) during FW squats can be predicted from shaft rotational data. Our study aimed to compare the inter-set reliability of GRF, v, and FvP relationship output variables calculated from force plates and linear encoder (presumed gold-standard) and rotary encoder data. Fifty participants performed two sets of FW squats at four inertias. Peak and mean concentric and eccentric GRF, v, and FvP outcomes from mean variables during the concentric phase of the squat were calculated. Good to excellent reliability was found for GRF and v (ICC > 0.85), regardless of the measure and the variable type. The FvP outcomes showed moderate to good reliability (ICC > 0.74). Inter-measure bias (p < 0.05) was found in the majority of GRF and v variables, as well as for all the calculated FvP outcomes (trivial to large TEs) with very large to perfect correlations for v (r 0.797–0.948), GRF (r 0.712–0.959), and, finally, FvP outcomes (ICC 0.737–0.943). Rotary encoder overestimated the force plates and linear encoder variables, and the differences were dependent on the level of inertia. Despite high reliability, FW device users should be aware of the discrepancy between the measures.

1. Introduction

Flywheel (FW) inertial resistance training has gained attention in recent years due to all the positive acute [1,2] and short-term [3] neuromuscular performance effects, and long-term effects derived from FW training interventions on strength, power (P), performance-related variables [4,5,6,7,8,9,10,11], and clinical outcomes [12,13,14]. There are many different FW devices on the market, all of which follow the same principle—by accelerating and then consequently braking the mass moment of inertia (I) of the FW. Various systems are used to provide feedback on exercise execution [15] and to track training adaptations using FW devices. However, different FW shaft types and the lack of an objective inertia denominator make it difficult to compare feedback among different software and exercises.
FW resistance exercise is independent of gravity when the exercise is performed in the horizontal plane rather than the vertical plane. In the latter, the gravity acceleration of the body mass contributes to a common loading condition (e.g., squat). The intensity of the exercise is dependent on the tempo of the exercise execution. The faster the pull of the rope/strap, the higher the angular acceleration of the FW and the higher the FW pulling force. Furthermore, recent studies of the FW squat have found near-perfect linear regression fits between incremental inertias and velocity (v) [16] and between ground reaction force (GRF) and v [17] under incremental inertial conditions. This is in agreement with weight-based exercises—squat jumps and countermovement jumps [18,19,20]. The force–velocity (Fv) relationship calculated from GRF and v provides us with valuable information about the current characteristics of the athlete’s lower extremities in the wide range of exercise intensities. The applicability of training based on the change in Fv curve properties has also been validated [21], but not by using FW loads.
Producing high power in sport-specific situations maximizes the effectiveness of the movement. For example, jumping and sprinting performance is highly dependent on peak power production of the lower extremities [22] and, in more detail, the optimal balance between force (F) and v capabilities contributing to a common peak power production [21,23,24]. Further on, it was found that the subject’s own body mass provides the optimal load for producing maximum mechanical output in vertical jumping [22,25]. While it has been shown that FW inertial squat training can be an effective tool to improve muscular power [7], and based on the findings supporting the link between power production and dynamic athletic performance [26], it is logical that performance in sport activities can be improved after FW inertial resistance training [27]. Moreover, different adaptations of pennation angle, fascicle length, lean mass, change of direction, squat jump and sprint performance, and hamstring/quadriceps strength ratio have been previously reported following body mass and weighted jump squat training protocols [28]. Based on the aforementioned findings, the calculation of the Fv relationship in the FW squats should incorporate the individual’s mass to mimic the sport-specific individual biomechanical demands.
Strain gauges [15,29], force plates [17,30], rotary [31,32] or linear encoders (including draw wire encoders) [17,29], accelerometers [30], and 3D motion capture [16] were used to measure F and v during FW squats. Recently, using interrupt sensors (encoders and optocouplers) has increased because they are inexpensive, easy to adjust, and portable. They are mounted on the FW shaft. Based on the analogy between rotational and linear motion and considering Newton’s laws, several mechanical variables can be calculated from the rotational frequency of the FW shaft, most commonly F and v. In addition, if the mass moment of inertia (I) of the FW and the athlete’s mass are known, GRF can be predicted as the sum of F calculated from the rotational acceleration of the shaft (FW pulling force) and F calculated from the linear acceleration of the athlete’s m. In contrast to the use of force plates and linear encoders (which are the gold standard in the acquisition of GRF and linear v data), when using rotary encoders, the characteristics of the shaft (shape of cone or shape of cylinder and its radius) should be taken into account as they, together with the I, determine the calculated mechanical output [33]. In view of this, care should be taken when using calculated kinetic measures for research purposes and for generalizing the results [34]. Therefore, it seems important to determine the possible differences between these measurement methods considering the magnitude of the GRF and v obtained under different inertias, as well as their influence on the FvP relationship.
When quantifying neuromuscular performance in athletes, an accurate and credible description of the mechanical variables is of great importance. No study aimed to investigate the concurrent validity of the outcome variables of the FvP relationship in FW squats using different inertias and sensory systems. Therefore, we conducted a validation study using a synchronized dual force plate and a linear position encoder as criterion measures for calculating GRF and linear v, with a shaft-integrated rotary encoder used as a direct measure. In the first step, the aim of our study was to evaluate the inter-set reliability of different sensory systems (force plates, linear encoder, and rotary encoder) for the calculation of GRF and v variables. In the second step, we aimed to compare the GRF and v variables calculated from the rotary encoder data with the variables calculated from force plates and linear encoder data. Step one and two led us to the third, the main objective of our study, which was to compare the calculated FvP relationship outcomes between the criterion and direct measures (force plates and linear encoder vs. rotary encoder). We hypothesized that due to the indirect expression of GRF and v from rotary encoder data, the latter would provide us with lower inter-set reliability and statistically significant differences in the outcome variables of the FvP relationship.

2. Materials and Methods

2.1. Experimental Design

The study was designed as a criterion-related validation study. Participants performed FW squats on a custom-made FW device (Figure 1). A synchronized dual force plate and incremental linear position encoder were used as the criterion measure for calculating GRF and v. The FW shaft-integrated absolute rotary encoder served as the direct measure. Participants undertook three familiarization sessions on separate laboratory visits to achieve the correct tempo and amplitude of squat execution under a range of various inertias. These sessions were performed two weeks prior to the testing session and involved an experienced investigator verbally describing and demonstrating the correct FW squat technique before the participant performed three sets at different inertias. During these familiarization sessions, feedback regarding the correct tempo and squat amplitude was provided by an investigator. Before the testing, participants performed a standardized 10 min warm-up procedure. This consisted of two minutes of jogging, arm, hip, knee, and ankle mobility exercises (10 repetitions each); dynamic stretches of hip flexors, knee extensors, knee flexors, and ankle extensors (10 repetitions each); and heel raise, squat, and crunch resistance exercises (10 repetitions each). After the general warm-up, each participant performed an introductory set of five FW squats using a medium inertia (0.125 kg∙m2). At the second laboratory visit, participants underwent unilateral knee extension maximal isometric voluntary contraction measurements in the 60° knee angle position, following the protocol and using the equipment described by Šarabon et al. (2013) [35]. Body mass normalized values of the strength level of the participants are provided to facilitate greater comparison between studies in the specific field of research.

2.2. Participants

Fifty physically active volunteers experienced in strength training participated in the study—see Table 1 for details. The inclusion criterion was strength training experience defined by a training history that included strength exercises at least twice per week in the past year. The International Physical Activity Questionnaire (IPAQ) [36] was performed to measure physical activity in the last seven days before the testing session. The exclusion criteria were: knee injuries (e.g., ligament, meniscus, or cartilage damage), chronic medical conditions (systemic, cardiac, and/or respiratory diseases, and neuromuscular disorders), a history of low back pain, or an acute injury in the past 6 months that could negatively affect squat performance. The study was approved by the National Medical Ethics Committee (No. 0120-690/2017/8) and adhered to the principles of Oviedo Convention and the Declaration of Helsinki. Participants were informed about the testing procedures before signing an informed consent form. They were instructed to avoid any strenuous exercise at least two days before the test.

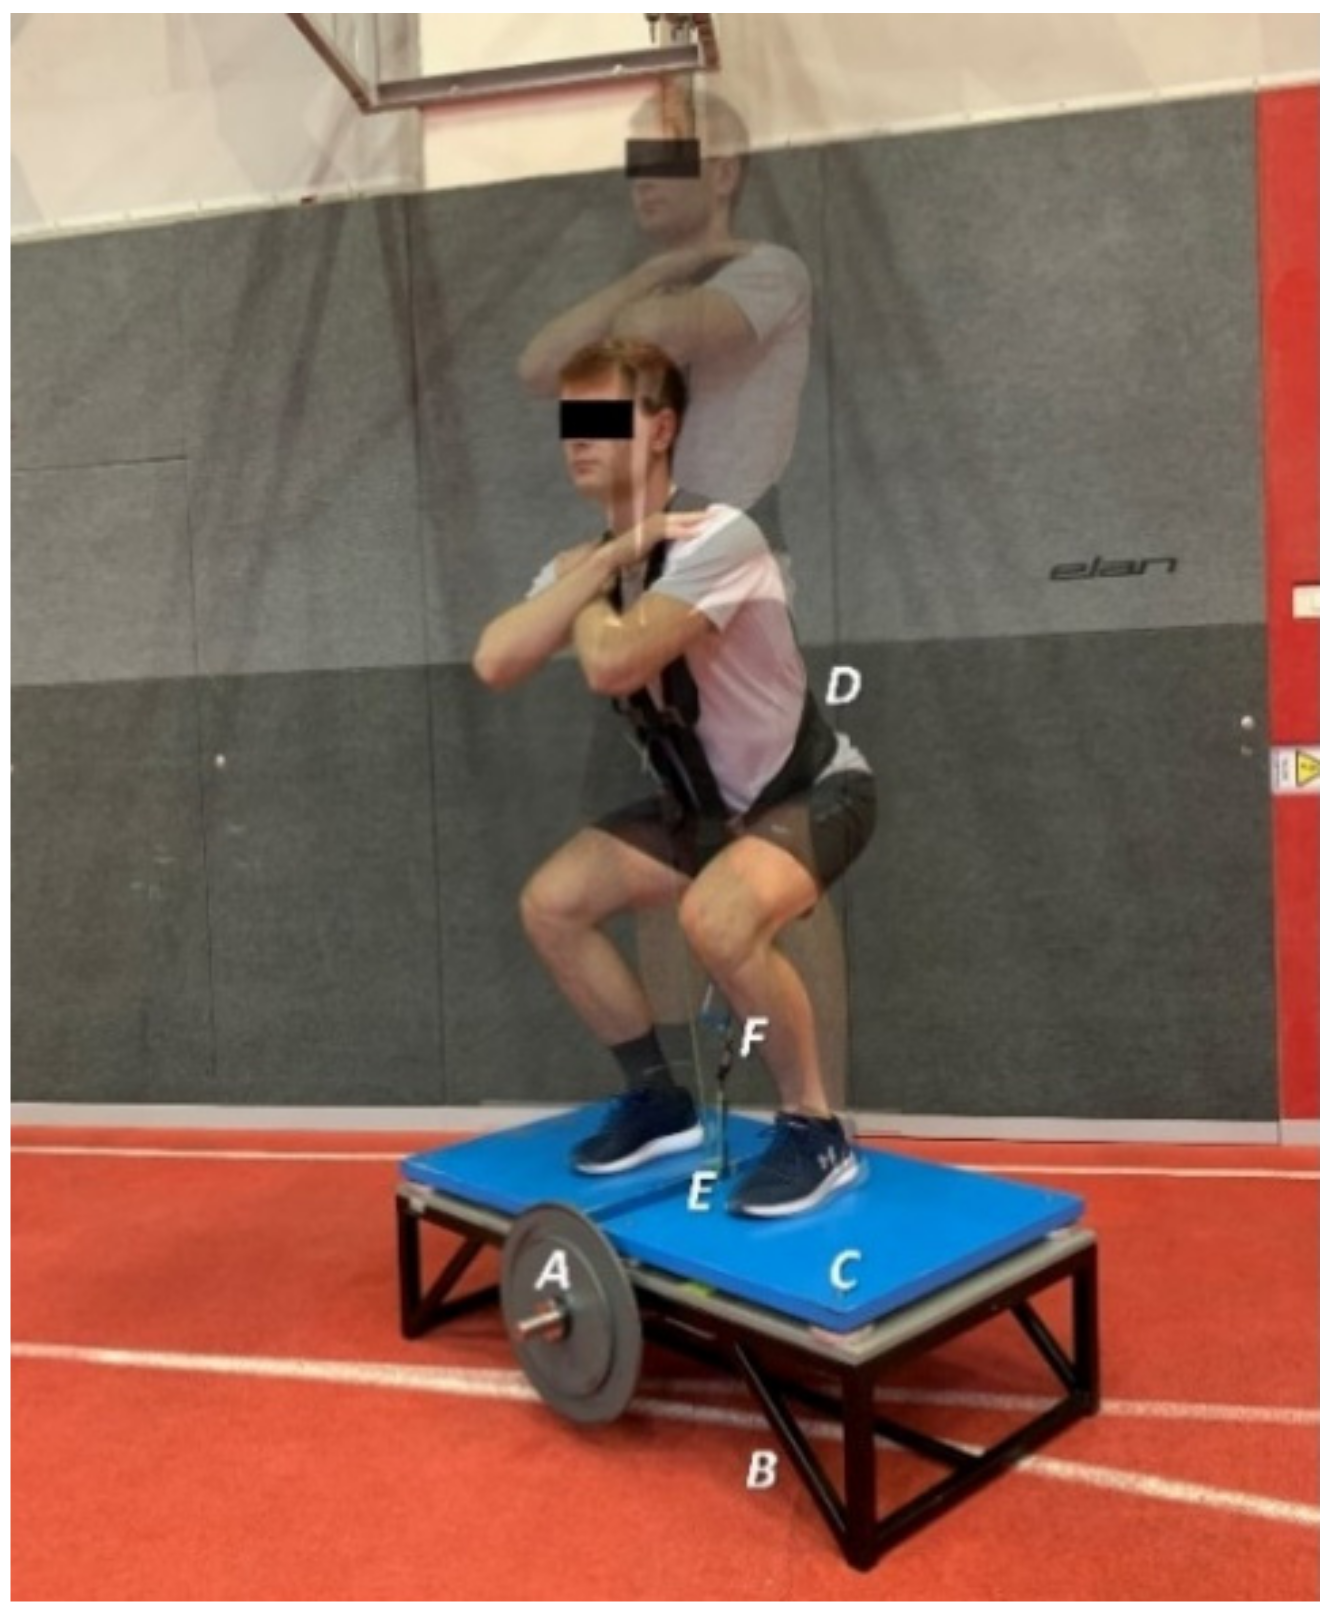
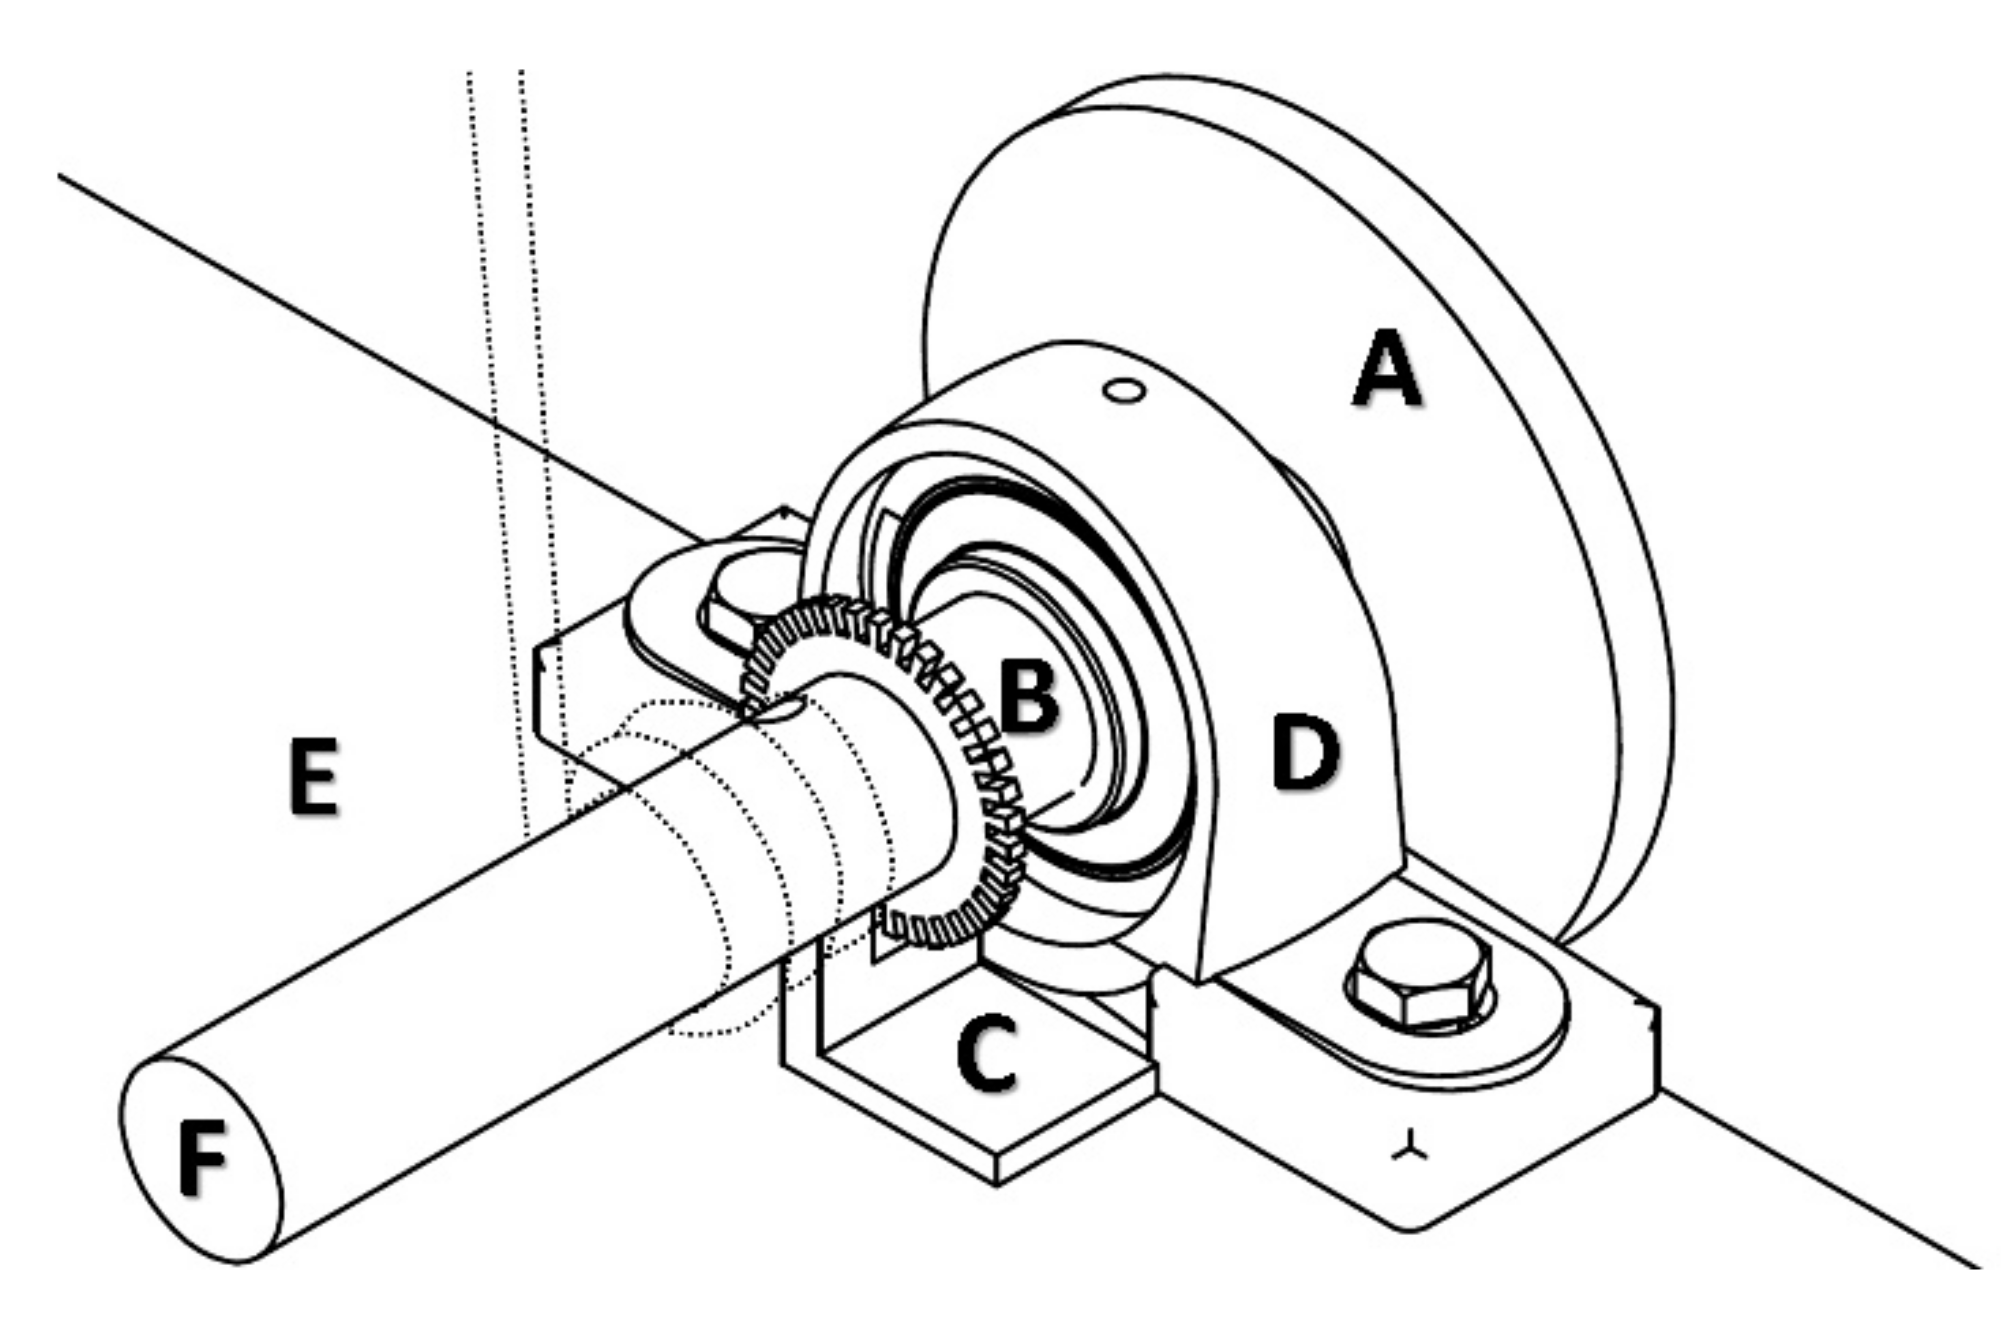
2.3. Testing Procedures

After warming up, participants performed FW squats on a custom-made FW device (Figure 1). Based on the results of a previous study [17] two sets of 10 consecutive squats were performed at four inertias (0.025, 0.075, 0.225, and 0.25 kg∙m2). To avoid any systematic inter-load effect of fatigue, inertias were administered in a random order. The first two repetitions were used to achieve correct squat execution (tempo and amplitude) and the last two to safely decelerate the spinning FW. For repetitions three through eight, participants were instructed to perform the concentric phase as quickly as possible and to delay deceleration during the first third of the eccentric phase and to make the transition from the eccentric to the concentric phase as short as possible. The execution of the squat was determined from the bottom position (approximately 90° knee angle) to full extension of the knees (approximately 0° knee angle). The arms were crossed with hands on opposite shoulders, and lifting the heels off the ground was not allowed. Participants were verbally encouraged loudly during all test sessions. To standardize the depth of the squat, vertical displacement was monitored, and real-time feedback was displayed on the screen in front of the subject. Rest periods between different inertias were at least 2 min long [37], allowing participants to maintain maximal power under the different exercise intensities.
The linear position encoder, force platform, and shaft-integrated rotary encoder were used simultaneously. A low-range draw-wire sensor up to 1250 mm with a linearity of ± 0.02% (Way-Con SX-50, Taufkirchen, Germany) was mounted perpendicular to the FW device below the standing platform and a draw-wire was attached to the sling (between the legs). The sensor assembly provided position-time data for the concentric phase of the squat. A bilateral force plate system (type 9260AA, Kistler Instruments AG, Winterthur, Switzerland) with Kistler MARS software was used to collect GRF data (Figure 1).
The latter two sensory systems were synchronised in time and acquired using a USB Data Acquisition System (type 5695B, Kistler Instrumente AG, Winterthur, Switzerland). Rotary encoder data were collected using the shaft rotation sensor (slot type Optocoupler Module Speed Measuring Sensor for Arduino/51/AVR/PICCG, JingJiang, China), which records FW angular frequency data based on angular displacement (Figure 2). The sensor detects the holes in a sprocket-wheel mounted on the FW axis at a rate of 1 pulse per 7.5°. This method of data acquisition allows for greater data sampling at high speeds.

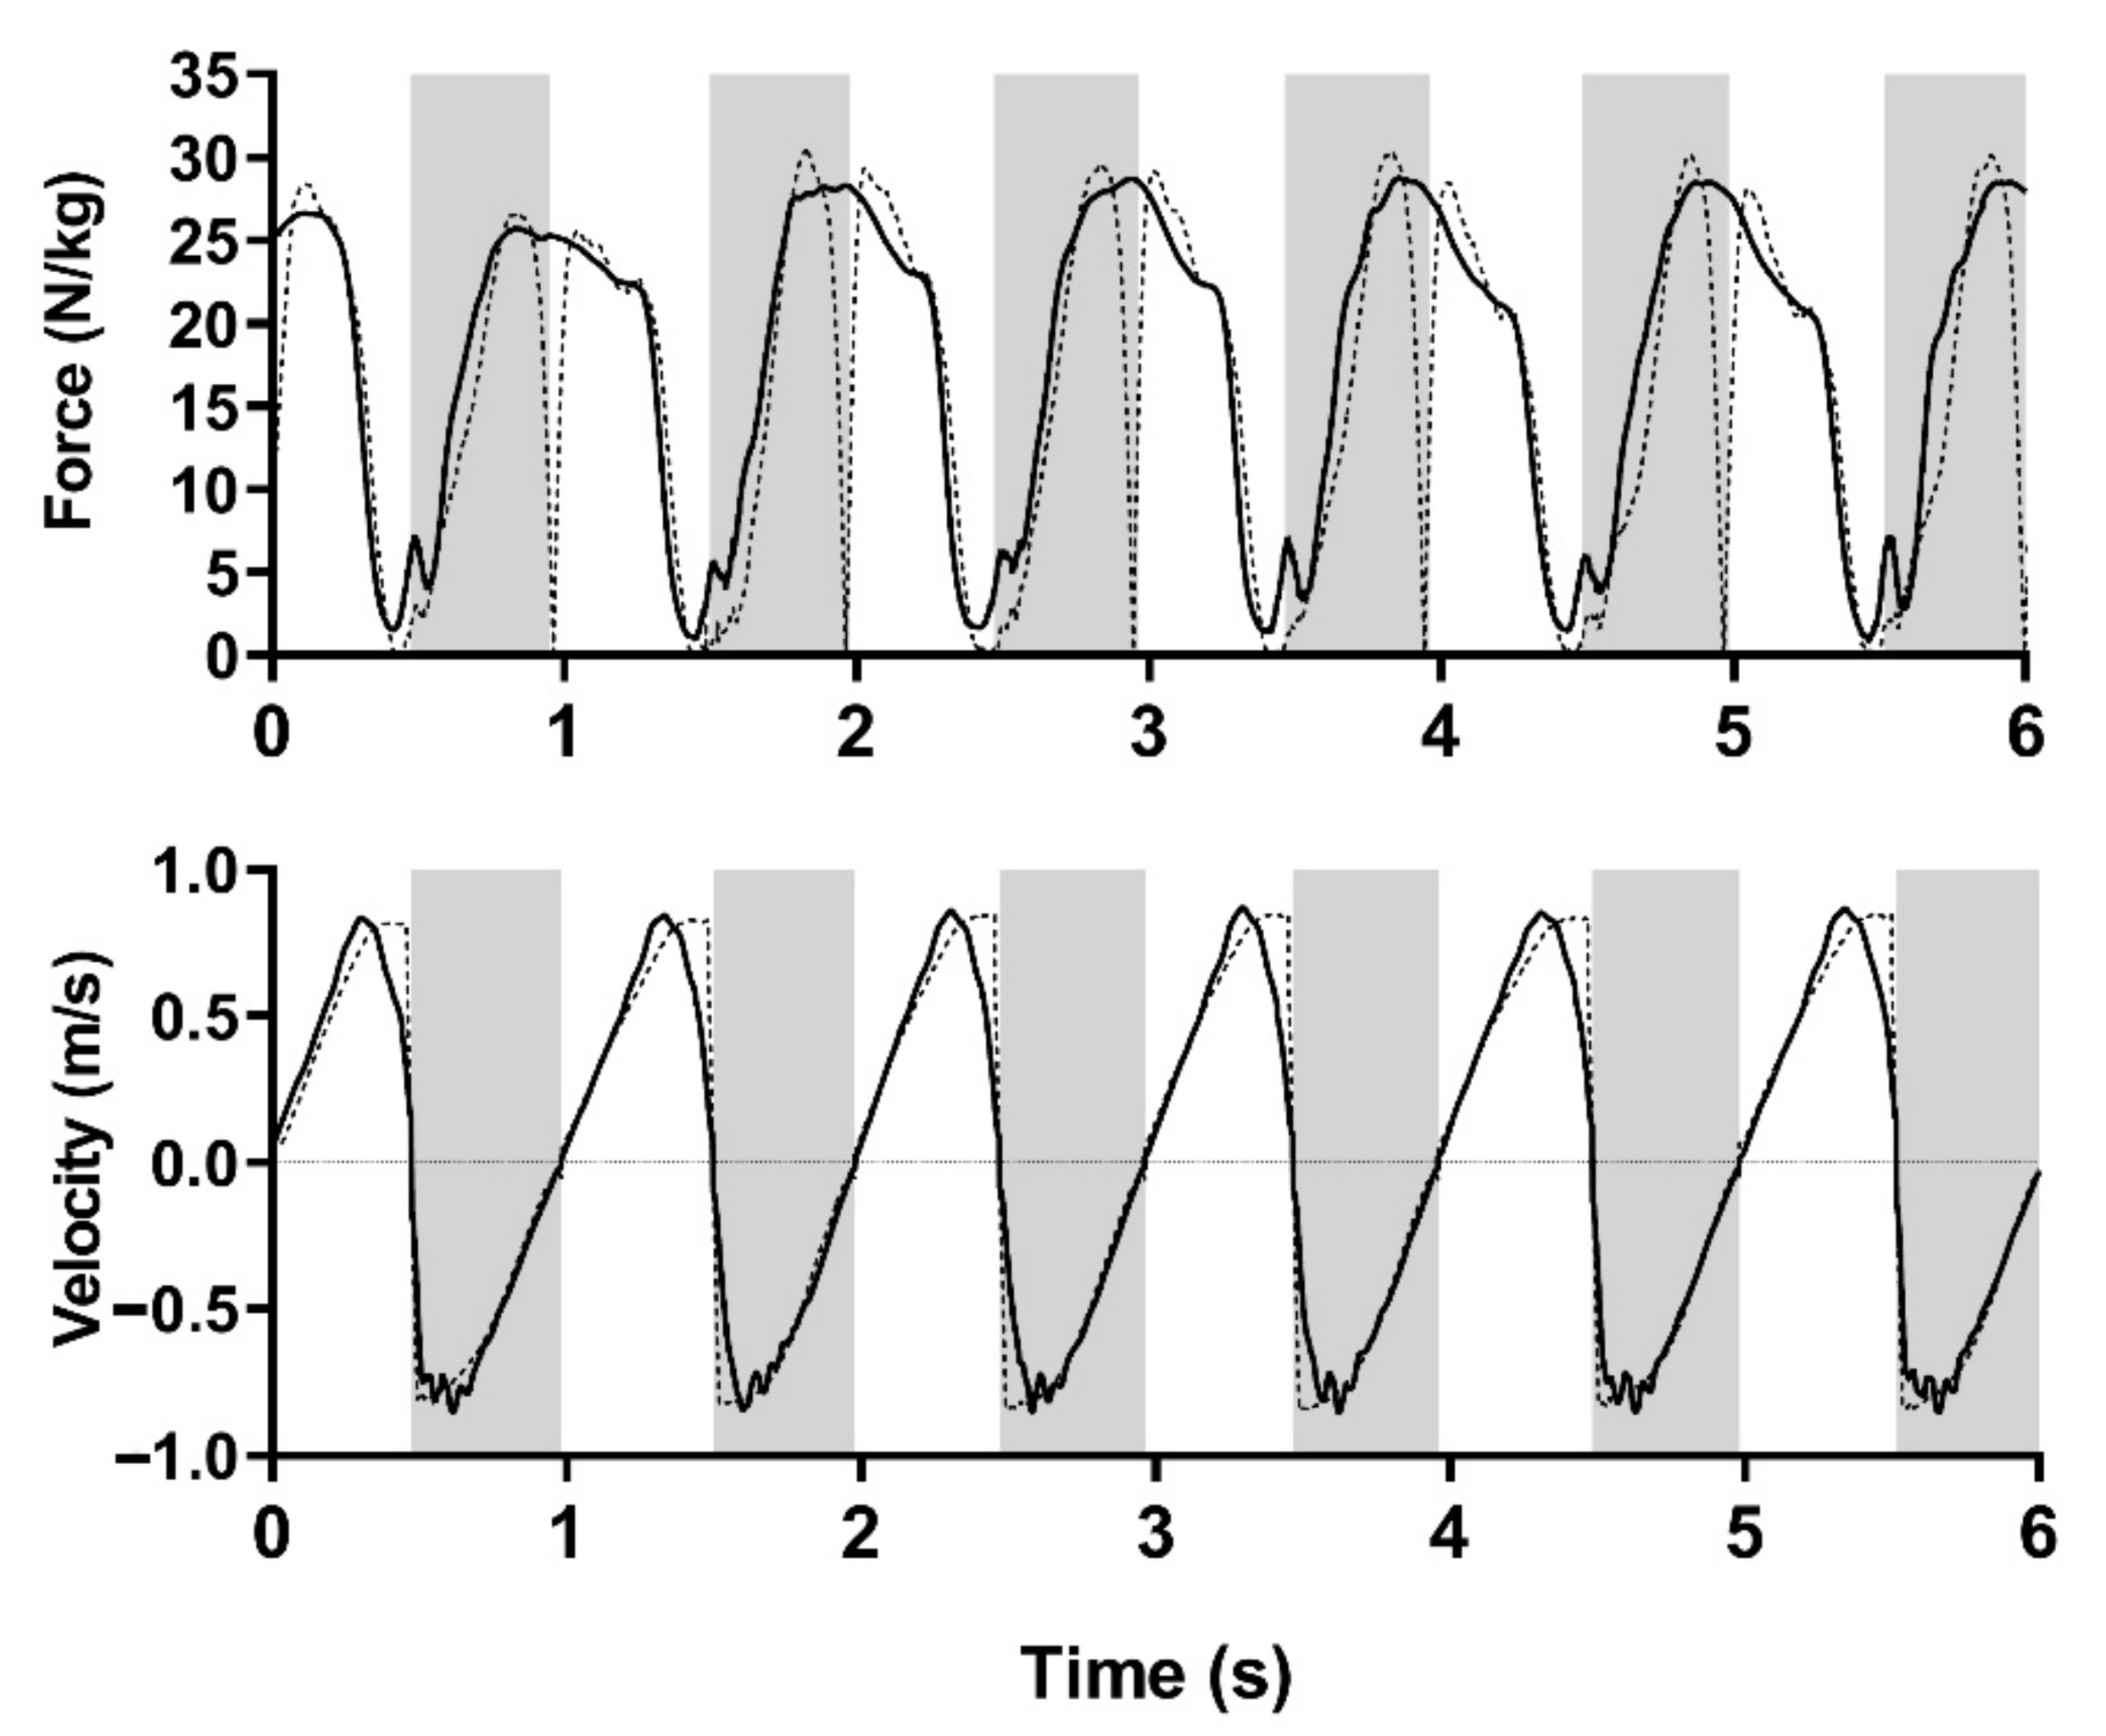
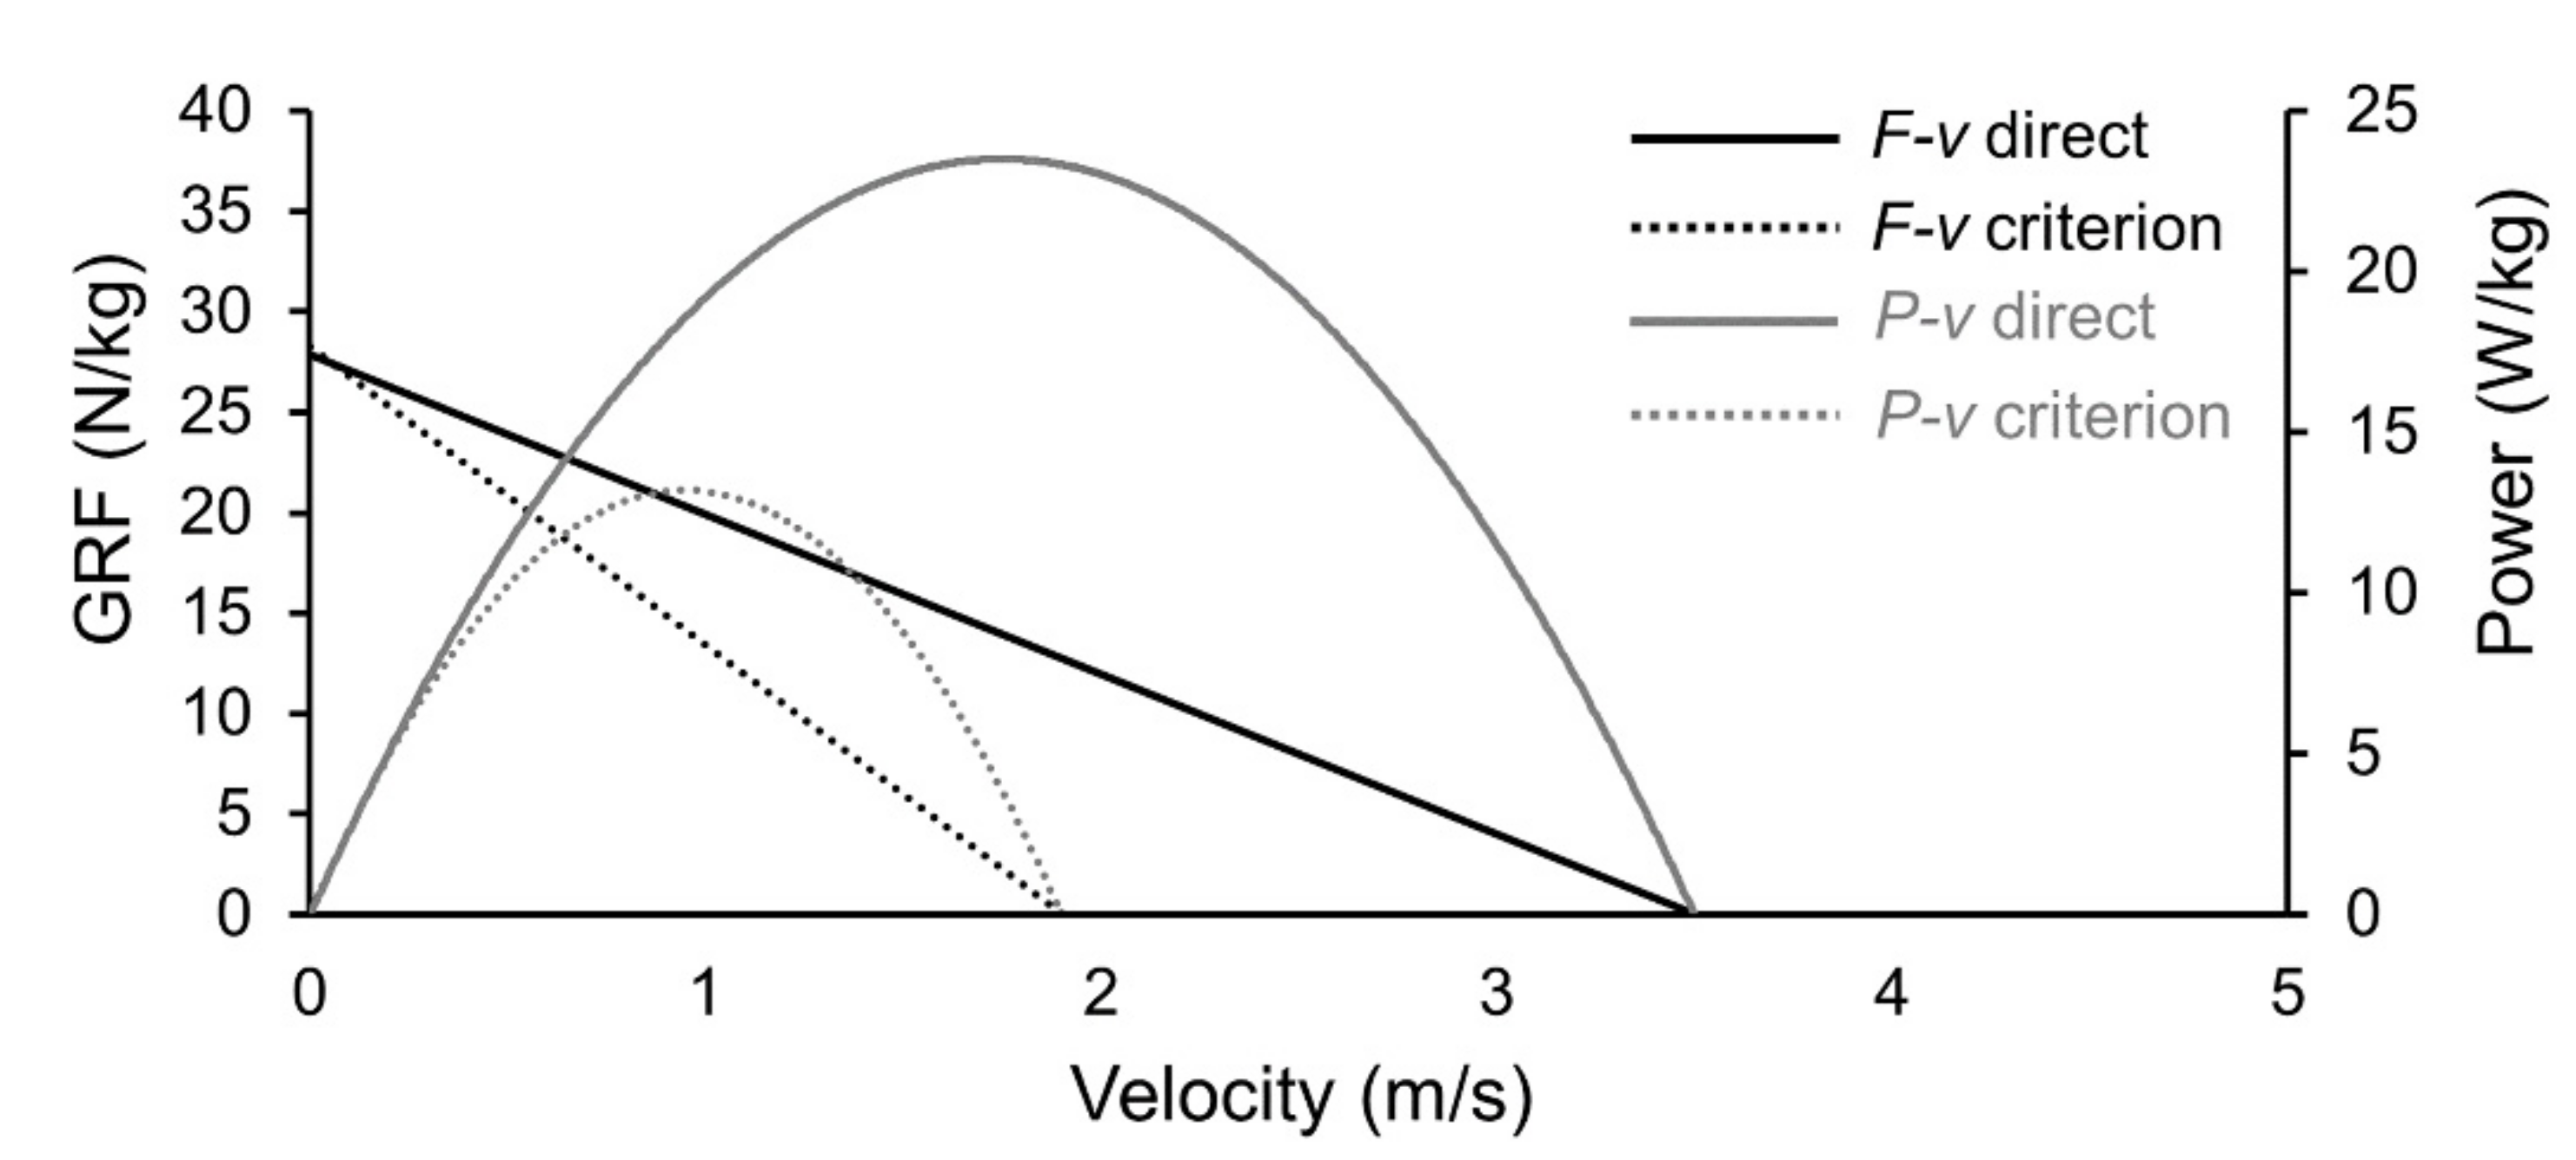
2.4. Data Processing

The position data from the linear encoder and the GRF data from the force plates were acquired simultaneously at a frequency of 1000 Hz and filtered using a 50 ms moving average filter [17,38]. The rotary encoder signals were first interpolated (1000 Hz) and then smoothed using a moving average filter with a 50 ms window; this allowed us to compare the signals between the systems. Variables from the shaft rotation were calculated from the angular frequency (f) of the shaft using basic Newton’s laws (known as the inverse dynamic approach), as described further on. Due to the analogy between angular and linear motion, the linear velocity (v) of the squat was calculated as the product of the angular velocity (ω = 2π × f) and the radius of the shaft (r = 0.015 m). Then, the angular acceleration (α) was calculated as the rate of change of ω in each time interval of 1 ms (t) (α = Δωt). The instantaneous torque required to accelerate the FW was calculated as the product of the mass moment of inertia and the angular acceleration (τ = I × α). Finally, the linear FW pulling force was expressed as the quotient of torque and radius of the shaft (FW pulling force = τ/r).
To account for the change in GRF due to acceleration of the body mass, the vertical acceleration (a) was calculated from α (a = α × r). Then, GRF was calculated as the sum of the FW pulling force, the subject’s weight, and the GRF due to the acceleration of the lifting body mass (m)—according to the Equation (1):
GRF = FW pulling force + (m × g) + (m × a).
In the equation, “g” stands for gravitational acceleration, i.e., 9.81 m/s2. Moreover, to accurately match the mean and peak values between the direct and criterion measure, the scaling factor was expressed, as a proportion of total body mass, following the Equation (2):
scaling factor = (GRF from force plates − (FW pulling force + m × g)) / (m × a).
Both the linear v and GRF signals were calculated for each 1 ms time segment (Figure 3) in the eccentric and concentric phase of the squat. The criterion and direct measure mean and peak values of v and GRF were calculated as the average of six consecutive squat repetitions, as previously suggested [17]. FvP analysis was performed using the mean concentric GRF and v variables from the criterion and direct measure variables. Based on four inertias, a linear regression model (F[v] = F0-kv) was used to determine the four outcome measures of the FvP relationships, where F0 represents the F-intercept and k is the slope of the Fv relationship. The use of Equations (3) and (4) allowed for the calculation of V0 and Pmax [39]:
V0 = F0/k
Pmax = (F0∙V0)/4.

2.5. Statistical Analyses

The six repetitions averaged values are presented as means (standard deviations). Normal distribution of the data was confirmed using the Shapiro–Wilk test (p > 0.05). The inter-set reliability of the results was assessed using mean bias and limits of agreement (LoA) [40], the intra-class correlation coefficient (ICC2.k) [41] with 95% confidence intervals (CI), the coefficient of variation (CV) [42] and paired-samples t-test statistics. Heteroscedasticity was visually inspected by plotting the absolute differences between devices against the mean of both for each individual. CV values < 10% were deemed acceptable [43]. The values of the ICC were interpreted according to recent guidelines (ranges): ICC < 0.5 indicates poor reliability, ICC 0.5–0.75 indicates moderate reliability, 0.75 < ICC ≤ 0.9 indicates good reliability, and ICC > 0.90 indicates excellent reliability [41]. Concurrent validity bias with LoA was calculated as mean difference between direct and criterion measures values. Agreement between the GRF, v, and between FvP outcomes was assessed with Pearson correlation coefficient (r), typical error of estimate (TE; SDdiff/r−2) and two-way repeated measures analysis of variance (ANOVA) with factors inertia (0.025, 0.075, 0.225, and 0.25 kg∙m2) and measure (criterion, direct), separately for peak and mean variables. Each ANOVA was performed after checking equality of variance with Mauchly’s test. In the case of violation of the assumption of sphericity the Greenhouse–Geisser’s correction was applied. Simple main effects with Bonferroni correction were used to highlight significant differences between measures at each inertia. The TE was additionally standardized (TEs) using the SD of the criterion to allow for qualitative rating. The standardized TE was rated as trivial < 0.10, 0.10 ≤ small ≤ 0.29, 0.30 ≤ moderate ≤ 0.59, or 0.59 < large [42]. The magnitude of correlation was rated as trivial < 0.10, 0.10 ≤ small ≤ 0.29, moderate 0.30 ≤ moderate ≤ 0.49, 0.50 ≤ large ≤ 0.69, 0.70 ≤ very large ≤ 0.89, or nearly perfect > 0.90. Coefficient of determination (R2) values assessed goodness of fit of the GRFv relationship and were interpreted as: very high ≥ 0.81, 0.81 > high ≥ 0.49, 0.49 > moderate ≥ 0.25, 0.25 ≥ low > 0.09, or negligible < 0.09 [44]. Data were visually inspected using Orange: Data Mining Toolbox in Python [45]. Statistical analyses were performed in SPSS (Version 26, IBM, Armonk, NY, USA) and RStudio (Version 1.3.1073; RStudio, Inc., Boston, MA, USA) using the repeated measures correlation (rmcorr) package [46]. For all analyses, the level of significance was set at p < 0.05.

3. Results

3.1. Intra-Session Reliability

Average values and standard deviations of peak and mean GRF and v variables at four different inertias can be found in Appendix A (rotary encoder) and Appendix B (force plates and linear encoder). The analysis of the rotary encoder variables revealed statistically significant bias (p < 0.05) between sets for the following variables: concentric mean GRF at 0.225 and 0.25 kg∙m2; eccentric mean GRF at 0.075, 0.225 and 0.25 kg∙m2; eccentric peak GRF for all inertias; concentric mean v at 0.225 kg∙m2, concentric peak v 0.225 and 0.25 kg∙m2, and eccentric mean and peak v at 0.225 and 0.25 kg∙m2. The analysis of the force plates and linear encoder variables (Appendix B) showed statistically significant inter-set bias for mean concentric GRF at 0.075, 0.225, and 0.25 kg∙m2; peak concentric GRF at 0.225 and 0.25 kg∙m2; mean and peak eccentric GRF at 0.025, 0.075 and 0.225 kg∙m2; concentric and eccentric peak v at 0.025 and 0.25 kg∙m2, and eccentric mean v at 0.075, 0.225 and 0.25 kg∙m2. ICC values for both criterion and direct measures showed excellent reliability with the exception of criterion measure eccentric mean GRF at 0.025 and 225 kg∙m2 and peak GRF at 0.025 kg∙m2 (good reliability) and direct measure eccentric peak at 0.025 and 0.225 kg∙m2 (good reliability). CV variables were acceptable (CV < 10%) for all variables.
Inter-set reliability of the FvP variables (Table 2) showed statistically significant bias considering V0 (direct measure) and F0, V0, and Slope (criterion measure) (p < 0.05). ICC values for criterion variables ranged from good (V0, Pmax, slope) to excellent (F0), and for direct measure variables from moderate (V0, Pmax, slope) to excellent (F0). Unacceptable CV values (>10%) were found for all the calculated variables, except for F0, regardless of the measure.

3.2. Concurrent Validity

The two-way ANOVA with repeated measures testing the effect of inertia and measure on concentric mean v showed a main effect of load (F = 1505.4, p < 0.001), measure (F = 56.4, p < 0.001) and load × measure interaction (F = 30.8, p < 0.001). Main effect of load (F = 1078.2, p < 0.001), measure (F = 2.1, p < 0.001), but no interaction load × measure (F = 2.194, p = 0.093) was found for concentric peak v. Effect of inertia and measure on eccentric mean v showed a main effect of load (F = 1251.3, p < 0.001), measure (F = 85.9, p < 0.001) and load × measure interaction (F = 5.07, p = 0.003). Effect of inertia and measure on eccentric peak v showed a main effect of load (F = 767.1, p < 0.001), measure (F = 291.4, p < 0.001) and load × measure interaction (F = 22.9, p < 0.001). Simple main effects revealed significant differences (p < 0.001) between the measures at all inertias, with rotary encoder variables overestimating the linear encoder variables (Table 3). The differences in v between measures were lower at higher inertias except for concentric peak v, where marginal statistical significance of interaction was found.
The two-way ANOVA with repeated measures testing the effect of inertia and measure on concentric mean GRF showed a main effect of load (F = 200.8, p < 0.001), measure (F = 1145.7, p < 0.001) and load × measure interaction (F = 109.9, p < 0.001). Effect of inertia and measure on concentric peak GRF showed a main effect of load (F = 36.2, p < 0.001), measure (F = 103.3, p < 0.001) and load × measure interaction (F = 37.6, p < 0.000). Main effect of load (F = 249.9, p < 0.001), measure (F = 761.1, p < 0.001) and load × measure interaction (F = 15.9, p < 0.001) was found for eccentric peak GRF. Effect of inertia and measure on eccentric peak GRF showed a main effect of load (F = 43.5, p < 0.001), measure (F = 236.1, p < 0.001) and load × measure interaction (F = 17.8, p < 0.001). Simple main effects revealed significant differences (p < 0.001) between the measures for all inertias, except for concentric peak GRF at 0.025 kg∙m2 (p = 0.759) (Table 4). Rotary encoder variables overestimated the force plates variables, and the differences were dependent on the level of inertia. In the concentric part of the squat, a higher inertia resulted in a greater difference. Conversely, the higher the inertia in the eccentric part of the squat, the greater the difference between the criterion and the direct measure (Table 3 and Table 4).
Systematic bias among the variables corresponded to trivial to large TEs values (Table 3 and Table 4). Very large to nearly perfect correlations were found between direct and criterion v variables (ranged from eccentric mean at 0.075 kg∙m2; r = 0.790 to concentric peak at 0.225 kg∙m2; r = 0.948). Finally, very large to nearly perfect correlations were found between direct and criterion GRF variables (ranged from eccentric peak at 0.025 kg∙m2; r = 0.712 to concentric mean at 0.225 and 0.25 kg∙m2; r = 0.959).
Entering the FvP analysis, mean variables showed very high goodness of fit of the linear regression line between concentric GRF and v (mean and 95% CI of the R2 calculated with the help of rmcorr were 0.85 (0.80; 0.89) for criterion and 0.83 (0.73; 0.90) for direct measure) and for eccentric GRF and v (mean and 95% CI were 0.79 (0.71; 0.84) for criterion and 0.83 (0.77; 0.88) for direct measure). In contrast, peak concentric GRF and v variables showed a moderate linear relationship (mean and 95% CI were 0.28 (0.16; 0.41) for criterion and 0.52 (0.40; 0.63) for direct measure). Moreover, peak eccentric GRF and v showed a moderate linear relationship (mean and 95% CI were 0.38 (0.25; 0.50) for criterion and 0.47 (0.34; 0.58) for direct measure). Consequently, FvP outcomes from peak values were not calculated due to the lack of the results credibility. Comparison between the criterion and direct obtained FvP variables showed systematic bias among all the variables (p < 0.05) (Table 5) and very large (Pmax, r = 0.737) to nearly perfect (F0, r = 0.943) between-measures correlations (Table 5, Figure 4). TEs was the lowest in the case of F0, and the highest in the case of V0, trivial (0.05), and moderate (0.46), respectively. The differences did not depend on the size of the variables’ mean of the two measures.

4. Discussion

The aim of our study was to compare the inter-set reliability and agreement of GRF, v and FvP outcome variables between the force plates and the linear encoder (used as a criterion measure), and the low-cost FW-shaft integrated rotary encoder (used as a direct measure) in FW squats. To our knowledge, this was the first validation study in FW squats analyzing GRF, v, and especially FvP relationship outcome variables. Contrary to our hypothesis, the results show similar intra-session reliability of GRF and v (good to excellent) obtained from criterion and direct measures, regardless of the inertia and type of variable (mean or peak). In contrast, lower reliability of FvP variables (V0, Pmax, and Slope) (moderate to good) was obtained from the direct measure. In agreement with our hypothesis, statistically significant differences and very high to nearly perfect intra-measures correlations were found for the GRF, v, and FvP outcome variables.
The main finding of our study is that GRF and v variables at different inertias and FvP relationship variables can be calculated from the rotational data of the FW shaft. The predicted variables have similar intra-session reliability as variables obtained with force plates and linear encoder (assumed to be the gold standard). Therefore, they can be used for longitudinal monitoring of athletic performance, but not interchangeably. Due to significant overestimation of the direct measure variables as compared to the criterion, caution should be taken when using the calculated kinetic measures for research and training purposes and especially when generalizing the results to different FW devices.
It has been previously explored that the optimal external load that maximizes the mechanical P output of a neuromusculoskeletal system during jumping corresponds to a certain percentage of the maximum strength [22]. Furthermore, it has been illustrated that the optimal load during maximal vertical jumps is the athlete’s own m, regardless of the strength of the lower limb muscles [22]. The phenomenon could be a consequence of the long-term adaptation of the muscular Fv relationship ratio to body weight and body weight inertia, changes in jumping technique, load-specific muscle activation, and jumping skills [47]. In addition, the optimal contribution of GRF and v components to a common peak P generated under body mass conditions also influences jumping and sprinting performance [21,23,24]. Therefore, we believed that adding mass component to a common P production under FW conditions (in our case FW squat) is crucial for further research on FvP variables, especially when collecting reference values and ensuring external validity of results. Furthermore, it is of practical importance to determine the possible differences between a gold standard laboratory method (criterion measure set-up) and a low-cost everyday use sensory system (direct measure set-up), in particular to obtain a valid and representative insight into GRF exerted during squatting with the FW device when, for example, only the encoder sensory system is used.
Based on previous research [17], four different inertias were used at different parts of the Fv curve, which fit well with our study purpose while allowing us to compare results from a wide range of velocities in FW squats. The results show excellent inter-set reliability of GRF and v variables, which is in line with the results of previous research [15,34,48]. Moreover, only minor inter-measures reliability differences in GRF and v variables were observed, regardless of the type of variable (mean or peak) and phase of the squat. In contrast, the calculated FvP output variables showed lower reliability than the variables calculated in the first step of the analysis (GRF and v). The lowest ICC and the highest CV values were found for V0 and Slope in the case of direct measure. The higher variability can be explained by independent differences in the GRF and v variables between sets (especially at low inertias) that determine the x-intercept (V0 variable) and consequently the inclination of the regression line (Slope variable).
It is worth noting that the peak GRF and v variables fitted the linear regression line poorly (mean rmcorr R2 was 0.28 (0.41; 0.16) for criterion and 0.52 (0.40; 0.63) for direct measure), so we decided to exclude the peak variables from further FvP analysis due to lack of credibility. Based on this finding, we believe that peak parameters should not be used in further calculation of FvP output variables in FW squats, regardless of the sensory system used. Interestingly, these results are in contrast to the results of García-Ramos and coauthors [49], who suggest using peak over mean variables due to both a stronger linearity of the Fv relationship and a higher reliability of the FvP variables in squat jumps with additional weights. Moreover, FW inertial resistance training has often been used with the aim of achieving an eccentric overload [33,50]. Interestingly, we found a very high goodness of fit of the mean eccentric GRF and v. The eccentric portion of the closed-kinetic chain Fv relationship has not been studied as extensively as the concentric part. Controversial results have been previously reported regarding the eccentric part of the muscles’ Fv relationship in the open chain exercises [51]. Our study therefore raises some new questions regarding the evaluation of lower-extremity eccentric closed-chain characteristics across the spectrum of different inertias that are beyond the scope of our study. While the variables of the eccentric phase of the FW squat have shown moderate external validity in assessing lower extremity performance (change of direction, squat jump, countermovement jump, and isokinetic strength) [9] and therefore provide valuable information about athletes’ lower extremity characteristics, they should be considered in future research.
The concurrent validity results from our study are in line with the previous research on comparing GRF, v, P, or FvP outcome variables between force plates and linear velocity encoder during jumps [52]. It was found that despite high inter-methods correlations, linear velocity encoder overestimated the mechanical output as compared to the force plates in counter-movement jumps [53] and squat jumps with additional weights [54], especially under light loading conditions [53,54,55]. Consequently, the Fv slope obtained by the linear encoder differed with respect to the other methods due to a larger V0 (for 72.3%), providing a more velocity-oriented Fv profile [53]. Custom-made rotary encoder sensor used in our study generally works similarly to a linear encoder; however, it measures the rotational position, rather than in a straight line [38]. This could be one of the important system disadvantages because the successive manipulation of the raw data magnifies the measurement error. Consequently, inter-measure differences found in our study could be a consequence of several factors involving data collection, the calculation of the variables, and also the technique of the squat execution described in further detail in the next sections.
The overestimation of the v (mean and peak) of a direct measure was more prominent under light inertias. Regarding the calculation of the variables in the concentric phase of the squat, the “active phase” and the “relaxed phase” must be highlighted. It is clear that in order to prevent the push-off in FW squats, the athlete must accelerate rapidly from the bottom of the squat (active phase) and then start decelerating before full leg extension (relaxed phase). Both the linear encoder and rotary encoder sensor can detect the drop in velocity during the relaxed portion of the concentric phase. The main difference is that the FW shaft continues to rotate and does not stop at the transition from the concentric to the eccentric part of the squat, whereas the linear motion recorded by the linear encoder stops (note the v drop represented by the black curve at the transition from the concentric to the eccentric part of the squat in Figure 3, lower part). Therefore, the average of the calculated v (and consequently GRF) from each repetition is higher. One of the general reasons for the higher values of linear v could also be a multi-step variables calculation (see data processing). Despite the theoretical integrity according to Newton’s laws, there are also some mechanical factors that could have altered the results, such as the vertical angle of the rope pull, the compliance of the harness, and the rope tension in the initial position (standing) of the squat which, can cause the differences in the measured squat vertical distance between the systems. It is clear that lower inertias require faster transitions from the concentric to the eccentric phase and consequently less control over the timing of the transitions. Consequently, the initial setting of the rope is crucial. While too tight an adjustment will limit smooth transitions at low inertias, the same tight adjustment is desirable at higher inertias because the transitions are slower and more controlled. Consequently, a longer relaxed phase (when the rope is loose) at low inertias/high velocities could have increased inter-measure differences. The results could also stem from the fact that light inertia/high velocity conditions could influence squat trajectory, especially by intensifying non-vertical movement, as discussed by Giroux et al. (2015) [54], when using linear encoder data during squats with additional weights. Additionally, it has already been mentioned in the literature that the mean variables from position time data with the linear position encoder [56,57], especially when calculating Fv outcomes [58], may be compromised because they cannot accurately determine the end of the concentric phase of the jump. In the case of FW squat without flight phase, we believe that absolute linear encoder gave us valid results defining the lowest and the highest squat amplitude. In contrast, it is only arbitrarily possible to define the end of the concentric phase from the incremental rotary encoder signal. In our case the concentric phase was calculated as half of the amplitude of the squat for each repetition, which could have caused minor errors. We believe they were minimized by averaging the results over six consecutive repetitions.
Overestimation of GRF results from direct measure could be a consequence of the mechanism of information acquisition by the rotary encoder sensor, which can be explained in the following few steps. First, these differences could have occurred due to the fact that the rotary encoder evaluates the harness-rope attachment displacement (Figure 1F), whereas the force plate measures the body center of mass displacement. Therefore, the differences should mainly originate from the recorded harness-rope attachment acceleration that is inevitably higher than the acceleration of the center of mass recorded by the force plates, similarly to the previous study [59] on using jumps with additional weights. We can assume that a considerable portion of the center of mass is displaced at a vertical distance that is significantly shorter than the vertical distance covered by the harness-rope attachment during FW squat performance. Second, it was found in jumps with additional weights that higher weight inevitably moves the system’s center of mass closer to the bar, thereby minimizing the gap distance between the center of mass and the bar. Therefore, the difference in predicted GRF using linear encoder and measured GRF using force plates decreases with an increase in the added weight [60]. In our case, no additional weight was added, and the center of mass position has not changed. We believe that the higher overestimation of mean GRF differences at lower inertias (high v) is due to the execution of the squat (more horizontal movement and loose rope adjustment in comparison to high inertias, where the repetitions are slower and more controlled, and the rope adjustment is tighter). This premise could be partially confirmed by muscle coordination sequencing in FW squats, which is not constant among different inertias [61]. At high inertias (low v), the participant accelerates the FW through a relatively longer interval of the concentric part of the squat than at high v (low inertias), i.e., the abovementioned active phase of the squat is longer while the v is lower and there is no need for slowing down the movement to prevent the push-off phase. The third possible reason for unequal differences between measures among inertias is the relative contribution of mass to a common GRF. In high v (low inertia) squats, a proportionally smaller part of the GRF originates from the FW pulling force and a bigger part from the mass acceleration; in low v (high inertia) squats, a proportionally larger part of the GRF originates from the FW pulling force and lower part of the mass acceleration (for details see Equation (2)). Therefore, mass multiplied by linear acceleration of the movement (predicted from rotary encoder data) added to an FW pulling force (Equation (2)) does not equally contribute to a common GRF among different inertias. This phenomenon is particularly evident in the differences in the peak values of GRF, which are generally independent of the “active phase” (as mentioned above) but are directly proportional to the peak acceleration data. Higher differences in GRF and v at low inertias were emphasized in the calculation of F0 and V0, especially—as outcome variables of the regression analysis.
Our research has many important and useful applications, but it also has limitations that must be considered. First, we used a custom-made rotary encoder system and a custom-made FW device [17]. With the custom-made sensory system, we tried to mimic the cheapest type of sensor used in practice to collect F and v data from FW rotation. In doing so, we overcame some potential conflicts of interest with commercially available FW devices and associated feedback systems. The custom-made sensor provided reliable data; however, we can assume that the results would be more generalizable if an industrial rotary encoder mounted longitudinally on the FW axis was used. Our custom-made device features a cylindrically shaped shaft, which allowed us to avoid bias when calculating variables that appear due to the rope wrapping around the shaft. It is clear that the cone-shaped shafts bias the validity of the indirectly calculated variables from the rotational data, while the radius of the shaft changes inversely proportional to the vertical squat displacement. Likewise, by not using a strap, a constant wrapping radius was ensured. Unlike the rope, it wraps around itself more than once and therefore changes the radius of the shaft. A pulley, which is also commonly used in commercial devices, was also avoided as it reduces (presumably halves) the v of vertical movement at a given inertia. This is because only one side of the strap wraps around the shaft and the other is attached to the FW device. Despite the clear physics of pulley systems, additional manipulation of the data was avoided to reduce measurement errors. Nevertheless, the results of our study are limited to the FW devices with cylindrical FW shafts so FW device characteristics should be considered when generalizing the results of our study. It is worth noting that the distance between the start of the linear encoder (draw-wire sensor) and the rope to the FW shaft attachment point could be included in the calculations to ensure that solely the vertical, not the resultant v, is the criterion measure. However, the intra-individual variations in horizontal displacement during a squat would make this calculation unlikely to be valid and therefore applicable in practice. Despite recent criticisms of the use of the Fv profile as a tool for assessing lower extremity strength (e.g., use of scalar rather than vector variables, small number of paired measurements and sample sizes in previous studies, the assumption of a continuous linear trend in both directions of the Fv spectrum to estimate F0 and V0) [62], we believe that the theory of Samozino and colleagues [63] has some major advantages. Namely, its applicability to various movements involving multiple joints, the relative simplicity of its assessment, and the ability to provide specific exercise instructions. From sports practitioners’ perspectives, we believe that models with “higher degrees of freedom” should not be preferred when simpler models are equally supported by experimental and statistical evidence. To the authors’ knowledge, Fv profiling provides the most comprehensive assessment of lower extremity characteristics using FW inertial resistance. Nevertheless, future studies should focus on exploring even more informative testing procedures, especially with regard to the external validity of the results. Furthermore, by calculating the scaling factor, we aimed to express the exact proportion of participants’ body mass that contributes to a force plate GRF as a consequence of body mass inertia during squatting (Equation (2); m × a). Our results suggest that adding body mass inertia to a calculated FW pulling force potentiates the differences between the measures. In other words, the overestimation of GRF from the rotary encoder data is due to angular acceleration, which is the only variable of change in the equation. Furthermore, the mass of interest that theoretically contributes to a change in GRF during vertical acceleration is not precisely known. It could be suspected that using the total body mass when calculating the proportion of GRF due to body mass inertia (Equation (2); m × a) overestimates the true value while the linear squatting motion is a consequence of segmental dynamics and the fact that some body parts do not move (e.g., the foot). According to the recent findings, future research should focus on determining the proportion of the mass component to a common GRF under different inertias and, subsequently, the use of mass proportions in prediction of GRF in more detail. Our results suggest that there is no uniform scaling factor among different inertias and that scaling factors vary greatly between participants, which could be a consequence of squat execution technique and athletes’ lower extremity abilities. Future studies should focus on matching the entire time series of the GRF signal between the measures, starting with an angular acceleration, and defining the most appropriate scaling factor (e.g., for interval variables such as the mean and the lower, middle, and upper part of the squat, and for local variables such as the peak GRF and peak rate of force development). Moreover, our results would have been more applicable in practice if we had used the whole specter of inertias (from 0.025 to 0.25 kg∙m2). We used a minimal number of inertias to avoid negative effects of fatigue accumulation while still credibly evaluating the FvP outcomes [17].

5. Conclusions

Our results show that rotary encoder, force plates, and a linear encoder can be reliably used to measure the same neuromuscular system property in FW squats. They can be used when defining an athlete’s physical abilities at a particular inertia or, more comprehensively, over a spectre of inertias with the help of FvP profile and by using mean variables, not peak GRF and v. Although both measurements have been shown to be highly reliable, sports practitioners and researchers should be aware of the discrepancy between the rotary encoder and gold standard values and interpret the results carefully. Future research is necessary to match the values between the measures by selecting an appropriate scaling factor.

Author Contributions

Conceptualization, D.S., N.Š. and R.C.; methodology, D.S., N.Š.; software, R.C. and N.Š.; validation, D.S., N.Š. and R.C.; formal analysis, D.S. and N.Š.; investigation, D.S.; resources, N.Š.; data curation, D.S., N.Š. and R.C.; writing—original draft preparation, D.S.; writing—review and editing, N.Š. and R.C.; visualization, N.Š.; supervision, N.Š.; project administration, D.S.; funding acquisition, N.Š. All authors have read and agreed to the published version of the manuscript.

Funding

The Slovenian Research Agency provided authors D.S. and N.Š. with support in the form of salary through the programme ‘Kinesiology of monostructural, polystructural and conventional sports’ [P5-0147]. The author N.Š. was supported by the project TELASI-PREVENT [L5-1845] (body asymmetries as a risk factor in musculoskeletal injury development: studying etiological mechanisms and designing corrective interventions for primary and tertiary preventive care).

Institutional Review Board Statement

The study was conducted according to the guidelines of the Declaration of Helsinki and approved by the National Medical Ethics Committee (no. 0120-690/2017/8).

Informed Consent Statement

Informed consent was obtained from all subjects involved in the study.

Data Availability Statement

The data presented in this study are available on request from the corresponding author.

Acknowledgments

The authors would like to thank the participants for their cooperation.

Conflicts of Interest

The authors declare no conflict of interest. The funders had no role in the design of the study; in the collection, analyses, or interpretation of data; in the writing of the manuscript, or in the decision to publish the results.

Appendix A

Table A1. Descriptive statistics and inter-set reliability of the observed rotary encoder variables.
MeanPeak
VariableInertia
(kg∙m2)
Set 1
Avg (SD)
Set 2
Avg (SD)
Set 1–Set 2Set 1
Avg (SD)
Set 2
Avg (SD)
Set 1–Set 2
Bias
Avg (LoA)
pICC2.k
(95% CI)
CV
(%)
Bias
Avg (LoA)
pICC2.k
(95% CI)
CV
(%)
Concentric
GRF
[N/Kg]
0.02518.83 (1.51)18.85 (1.48)−0.02
(−0.24; 0.22)
0.8980.923
(0.864; 0.956)
4.325.2 (2.64)25.15 (2.8)0.05
(−0.35; 0.44)
0.8140.931
(0.879; 0.961)
5.5
0.07520.38 (1.90)20.64 (1.98)−0.26
(−0.53; 0.01)
0.0570.944
(0.895; 0.97)
4.226.01 (3.4)26.41 (3.35)−0.41
(−0.82; 0.01)
0.0550.955
(0.915; 0.976)
5.2
0.22522.43 (2.80)23.06 (2.9)−0.63
(−0.94; −0.32)
<0.0010.952
(0.873; 0.978)
4.729.01 (4.04)29.59 (3.95)−0.58
(−1.25; 0.09)
0.0880.906
(0.831; 0.947)
7.9
0.2523.18 (2.95)23.68 (3.02)−0.50
(−0.84; −0.15)
0.0060.957
(0.909; 0.978)
4.830.13 (4.14)30.38 (4.12)−0.25
(−0.73; 0.22)
0.2860.963
(0.932; 0.98)
5.1
v
[m/s]
0.0250.97
(0.14)
0.96
(0.14)
0.01
(−0.01; 0.03)
0.4850.951
(0.911; 0.973)
6.31.37
(0.20)
1.39
(0.20)
−0.02
(−0.03; 0.00)
0.1110.97
(0.947; 0.983)
4.8
0.0750.72
(0.11)
0.73
(0.11)
−0.00
(−0.02; 0.01)
0.7960.964
(0.93; 0.981)
5.81.11
(0.17)
1.12
(0.17)
−0.01
(−0.03; 0)
0.0590.982
(0.965; 0.99)
4
0.2250.48
(0.08)
0.49
(0.08)
−0.01
(−0.02; −0.00)
<0.0000.989
(0.952; 0.996)
2.90.77
(0.15)
0.78
(0.15)
−0.01
(−0.02; −0.00)
0.0100.99
(0.98; 0.995)
3.6
0.250.47
(0.08)
0.47
(0.07)
−0.00
(−0.01; 0.01)
0.7280.976
(0.954; 0.987)
50.74
(0.14)
0.76
(0.14)
−0.01
(−0.02; −0.01)
0.0010.991
(0.977; 0.996)
3
Eccentric
GRF
[N/Kg]
0.02516.84 (1.31)16.73 (1.21)0.11
(−0.07; 0.29)
0.2140.933
(0.882; 0.962)
3.728.69 (3.54)28.01 (3.82)0.68
(0.05; 1.31)
0.0340.892
(0.807; 0.939)
7.9
0.07519.09 (1.8)19.43 (1.87)−0.34
(−0.61; −0.07)
0.0170.93
(0.861; 0.963)
4.629.19 (3.88)29.87 (4.46)−0.68
(−1.19; −0.18)
0.0090.954
(0.905; 0.976)
5.6
0.22522.76 (2.69)23.32 (2.84)−0.56
(−0.89; −0.24)
0.0010.948
(0.881; 0.974)
4.833.70 (5.19)34.49 (5.04)−0.79
(−1.77; 0.19)
0.110.874
(0.776; 0.93)
9.9
0.2523.61 (3.07)24.07 (2.86)−0.46
(−0.82; −0.09)
0.0150.953
(0.906; 0.976)
534.53 (5.39)35.92 (5.54)−1.39
(−2.10; −0.67)
<0.0000.937 (0.832; 0.971)6.7
v
[m/s]
0.025−0.97 (0.13)−0.97 (0.13)0.00
(−0.01; 0.02)
0.8720.962
(0.933; 0.979)
5.1−1.36 (0.20)−1.37 (0.21)−0.01
(−0.03; 0.02)
0.5110.95
(0.913; 0.972)
6.6
0.075−0.76 (0.11)−0.76 (0.12)−0.01
(−0.02; 0.00)
0.1480.981
(0.964; 0.989)
4.2−1.09 (0.18)−1.11 (0.18)−0.01
(−0.03; 0.00)
0.0780.985
(0.971; 0.992)
4
0.225−0.51 (0.09)−0.51 (0.09)−0.01
(−0.013; 0.0)
0.0410.985
(0.973; 0.992)
4.1−0.76 (0.16)−0.77 (0.16)−0.01
(−0.02; −0.00)
0.0090.991
(0.982; 0.995)
3.6
0.25−0.48 (0.08)−0.49 (0.09)−0.01
(−0.01; −0.00)
0.0220.988
(0.976; 0.994)
3.7−0.73 (0.15)−0.74 (0.15)−0.01
(−0.02; −0.00)
0.0020.992
(0.982; 0.996)
3.3
Bias was calculated as Set 1 minus Set 2; data are presented as average (95% CI); bias is presented as mean (LoA); LoA—limits of agreement; CI—confidence interval; p—paired samples t-test statistics; GRF—ground reaction force; v—velocity.

Appendix B

Table A2. Descriptive statistics and inter-set reliability of the observed force plates (GRF) and linear encoder variables (v).
MeanPeak
VariableInertia
(kg∙m2)
Set 1
Avg (SD)
Set 2
Avg (SD)
Set 1–Set 2Set 1
Avg (SD)
Set 2
Avg (SD)
Set 1–Set 2
Bias
(LoA)
pICC2.k
(95% CI)
CV
(%)
Bias
(LoA)
pICC2.k
(95% CI)
CV
(%)
Concentric
GRF
[N/Kg]
0.02514.62 (1.00)14.67 (1.02)−0.05
(−0.20; 0.10)
0.520.923
(0.865; 0.956)
3.725.09 (2.73)25.00 (3.00)0.09
(−0.48; 0.66)
0.7630.86
(0.754; 0.92)
8.1
0.07517.14 (1.53)17.42 (1.51)−0.28
(−0.53; −0.02)
0.0320.906
(0.826; 0.948)
523.87 (3.15)24.32 (2.88)−0.46
(−0.92; 0.01)
0.0550.923
(0.858; 0.958)
6.5
0.22520.21 (2.32)20.87 (2.49)−0.66
(−0.92; −0.40)
<0.0010.945
(0.806; 0.977)
4.526.25 (3.53)27.03 (3.60)−0.78
(−1.12; −0.44)
<0.0010.961
(0.877; 0.983)
4.4
0.2520.98 (2.76)21.44 (2.59)−0.46
(−0.76; −0.16)
0.0040.957
(0.907; 0.978)
4.827.22 (3.97)27.79 (3.80)−0.57
(−1.01; −0.14)
0.0110.96
(0.919; 0.979)
5.2
v
[m/s]
0.0250.85
(0.12)
0.86
(0.13)
−0.01
(−0.03; 0.01)
0.4990.915
(0.85; 0.952)
8.11.41
(0.20)
1.45
(0.23)
−0.04
(−0.06; −0.01)
0.0050.944
(0.888; 0.97)
6.5
0.0750.67
(0.11)
0.68
(0.11)
−0.00
(−0.02; 0.01)
0.6230.964
(0.935; 0.979)
6.11.17
(0.18)
1.17
(0.18)
−0.00
(−0.02; 0.02)
0.8310.972
(0.95; 0.985)
5.1
0.2250.44
(0.08)
0.44
(0.08)
−0.00
(−0.01; 0.00)
0.2420.983
(0.971; 0.991)
4.50.82
(0.15)
0.81
(0.15)
0.01
(−0.01; 0.02)
0.5150.974
(0.953; 0.985)
6
0.250.42
(0.08)
0.43
(0.08)
−0.00
(−0.01; 0.00)
0.3550.983
(0.97; 0.99)
4.70.78
(0.15)
0.79
(0.16)
−0.01
(−0.03; 0)
0.0440.977
(0.957; 0.987)
5.7
Eccentric
GRF
[N/Kg]
0.02514.14 (0.96)14.07 (0.97)0.07
(−0.12; 0.26)
0.4510.87
(0.771; 0.926)
4.725.82 (3.12)25.66 (3.38)0.17
(−0.49; 0.82)
0.6150.85
(0.738; 0.914)
9.2
0.07515.66 (1.68)16.16 (1.59)−0.50
(−0.81; −0.19)
0.0020.869
(0.72; 0.934)
6.524.47 (3.36)25.15 (3.31)−0.67
(−1.16; −0.19)
0.0080.925
(0.852; 0.961)
6.7
0.22518.74 (2.23)19.64 (2.31)−0.90
(−1.19; −0.62)
<0.0010.916
(0.552; 0.97)
527.43 (3.74)28.89 (4.01)−1.46
(−1.94; −0.97)
<0.0010.918
(0.618; 0.969)
6
0.2519.72 (2.60)20.41 (2.47)−0.69
(−1.01; −0.37)
<0.0010.938
(0.809; 0.973)
5.328.75 (4.22)29.82 (4.10)−1.07
(−1.60; −0.53)
<0.0010.935
(0.829; 0.97)
6.2
v
[m/s]
0.025−0.86 (0.14)−0.88
(0.14)
−0.01
(−0.03; 0.01)
0.2250.936
(0.887; 0.963)
7.9−1.61 (0.23)−1.65 (0.26)−0.04
(−0.08; −0.01)
0.0280.915
(0.848; 0.952)
8.2
0.075−0.66 (0.13)−0.67
(0.13)
−0.01
(−0.03; −0.00)
0.0270.97
(0.945; 0.984)
6.2−1.36 (0.22)−1.39 (0.22)−0.03
(−0.06; 0.00)
0.0690.933
(0.882; 0.962)
7.8
0.225−0.42 (0.08)−0.43
(0.08)
−0.01
(−0.02; −0.01)
<0.0010.972
(0.933; 0.986)
5.7−0.91 (0.17)−0.92 (0.16)−0.01
(−0.04; 0.01)
0.2490.94
(0.895; 0.965)
8.7
0.25−0.41 (0.08)−0.42
(0.08)
−0.02
(−0.02; −0.01)
<0.0010.979
(0.904; 0.992)
4.6−0.86 (0.15)−0.86 (0.16)−0.04
(−0.05; −0.02)
<0.0010.945
(0.86; 0.974)
7.3
Bias was calculated as Set 1 minus Set 2; data are presented as average (95% CI); bias is presented as mean (LoA); LoA—limits of agreement; CI—confidence interval; p—paired samples t-test statistics; GRF—ground reaction force; v—velocity.

References

  1. Beato, M.; Mcerlain-naylor, S.A.; Halperin, I.; Iacono, A. Dello Current Evidence and Practical Applications of Flywheel Eccentric Overload Exercises as Postactivation Potentiation Protocols: A Brief Review Current Evidence and Practical Applications of Flywheel Eccentric Overload Exercises as Postactivation Potentiat. Int. J. Sports Physiol. Perform. 2020, 15, 154–161. [Google Scholar] [CrossRef]
  2. Beato, M.; Stiff, A.; Coratella, G. Effects of Postactivation Potentiation After an Eccentric Overload Bout on Countermovement Jump and Lower-Limb Muscle Strength. J. Strength Cond. Res. 2021, 35, 1825–1832. [Google Scholar] [CrossRef]
  3. Coratella, G.; Chemello, A.; Schena, F. Muscle damage and repeated bout effect induced by enhanced eccentric squats. J. Sports Med. Phys. Fitness 2016, 56, 1540–1546. [Google Scholar] [PubMed]
  4. González, J.R.; de Keijzer, K.; Bishop, C.; Beato, M. Effects of flywheel training on strength-related variables in female populations. A systematic review. Res. Sports Med. 2021, 1–18, published online ahead of print, 5 January 2021. [Google Scholar] [CrossRef]
  5. Nuñez Sanchez, F.J.; Villarreal, E.S. Does flywheel paradigm training improve muscle volume and force? A meta-analysis. J. Strength Cond. Res. 2017, 31, 3177–3186. [Google Scholar] [CrossRef]
  6. Maroto-Izquierdo, S.; García-López, D.; Fernandez-Gonzalo, R.; Moreira, O.C.; González-Gallego, J.; Paz, J.A. Skeletal muscle functional and structural adaptations after eccentric overload flywheel resistance training: A systematic review and meta-analysis. J. Sci. Med. Sport 2017, 20, 943–951. [Google Scholar] [CrossRef] [PubMed]
  7. Petré, H.; Wernstål, F.; Mattsson, C.M. Effects of Flywheel Training on Strength-Related Variables: A Meta-analysis. Sports Med. 2018, 4, 1–15. [Google Scholar] [CrossRef] [PubMed]
  8. Raya-González, J.; Castillo, D.; Beato, M. The Flywheel Paradigm in Team Sports. Strength Cond. J. 2020, 43, 12–22. [Google Scholar] [CrossRef]
  9. Beato, M.; Fleming, A.; Coates, A.; Dello Iacono, A. Validity and reliability of a flywheel squat test in sport. J. Sports Sci. 2021, 39, 482–488. [Google Scholar] [CrossRef]
  10. Cabanillas, R.; Serna, J.; Muñoz-Arroyave, V.; Ramos, J.A.E. Effect of eccentric overload through isoinertial technology in basketball players. Rev. Bras. Cineantropometria Desempenho Hum. 2020, 22, e59831. [Google Scholar] [CrossRef]
  11. Coratella, G.; Beato, M.; Cè, E.; Scurati, R.; Milanese, C.; Schena, F.; Esposito, F. Effects of in-season enhanced negative work-based vs traditional weight training on change of direction and hamstrings-to-quadriceps ratio in soccer players. Biol. Sport 2019, 36, 241–248. [Google Scholar] [CrossRef]
  12. Gual, G.; Fort-Vanmeerhaeghe, A.; Romero-Rodriguez, D.; Tesch, P.A. Effects of in-season inertial resistance training with eccentric overload in a sports population at risk for patellar tendinopathy. J. Strength Cond. Res. 2015, 30, 1834–1842. [Google Scholar] [CrossRef] [PubMed]
  13. Romero-rodriguez, D.; Gual, G.; Tesch, P.A. Efficacy of an inertial resistance training paradigm in the treatment of patellar tendinopathy in athletes: A case-series study. Phys. Ther. Sport 2010, 12, 43–48. [Google Scholar] [CrossRef] [PubMed]
  14. Tesch, P.A.; Fernandez-Gonzalo, R.; Lundberg, T.R. Clinical applications of iso-inertial, eccentric-overload (YoYoTM) resistance exercise. Front. Physiol. 2017, 8, 241. [Google Scholar] [CrossRef] [Green Version]
  15. Agustín, R.M.S.; Sánchez-Barbadora, M.; García-Vidal, J.A. Validity of an inertial system for measuring velocity, force, and power during hamstring exercises performed on a flywheel resistance training device. PeerJ 2020, 8, e10169. [Google Scholar] [CrossRef] [PubMed]
  16. McErlain-Naylor, S.A.; Beato, M. Concentric and eccentric inertia–velocity and inertia–power relationships in the flywheel squat. J. Sports Sci. 2020, 39, 1136–1143. [Google Scholar] [CrossRef] [PubMed]
  17. Spudić, D.; Smajla, D.; Šarabon, N. Validity and reliability of force–velocity outcome parameters in flywheel squats. J. Biomech. 2020, 107, 109824. [Google Scholar] [CrossRef] [PubMed]
  18. Zivkovic, M.Z.; Djuric, S.; Cuk, I.; Suzovic, D.; Jaric, S. Muscle Force-Velocity Relationships Observed in Four Different Functional Tests. J. Hum. Kinet. 2017, 56, 39–49. [Google Scholar] [CrossRef] [Green Version]
  19. Jiménez-Reyes, P.; Samozino, P.; Cuadrado-Peñafiel, V.; Conceição, F.; González-Badillo, J.J.; Morin, J.B. Effect of countermovement on power–force–velocity profile. Eur. J. Appl. Physiol. 2014, 114, 2281–2288. [Google Scholar] [CrossRef]
  20. Bobbert, M.F. Why is the force-velocity relationship in leg press tasks quasi-linear rather than hyperbolic? Why is the force-velocity relationship in leg press tasks quasi-linear rather than hyperbolic? J. Appl. Physiol. 2012, 112, 1975–1983. [Google Scholar] [CrossRef] [PubMed]
  21. Jiménez-Reyes, P.; Samozino, P.; Morin, J.-B. Optimized training for jumping performance using the force-velocity imbalance: Individual adaptation kinetics. PLoS ONE 2019, 14, e0216681. [Google Scholar]
  22. Jaric, S.; Markovic, G. Body mass maximizes power output in human jumping: A strength-independent optimum loading behavior. Eur. J. Appl. Physiol. 2013, 113, 2913–2923. [Google Scholar] [CrossRef]
  23. Samozino, P.; Morin, J.B.; Hintzy, F.; Belli, A. A simple method for measuring force, velocity and power output during squat jump. J. Biomech. 2008, 41, 2940–2945. [Google Scholar] [CrossRef]
  24. Samozino, P.; Morin, J.-B.; Hintzy, F.; Belli, A. Jumping ability: A theoretical integrative approach. J. Theor. Biol. 2010, 264, 11–18. [Google Scholar] [CrossRef] [PubMed] [Green Version]
  25. Markovic, G.; Jaric, S. Positive and negative loading and mechanical output in maximum vertical jumping. Med. Sci. Sports Exerc. 2007, 39, 1757–1764. [Google Scholar] [CrossRef] [PubMed]
  26. Cormie, P.; McGuigan, M.; Newton, R. Developing Maximal Neuromuscular Power. Sports Med. 2011, 41, 125–146. [Google Scholar] [CrossRef] [PubMed]
  27. Raya-González, J.; Prat-Luri, A.; López-Valenciano, A.; Sabido, R.; Luis Hernández-Davó, J. Effects of flywheel resistance training on sport actions. A systematic review and meta-analysis. J. Hum. Kinet. 2021, 77, 191–204. [Google Scholar] [CrossRef] [PubMed]
  28. Coratella, G.; Beato, M.; Milanese, C.; Longo, S.; Limonta, E.; Rampichini, S.; Ce, E.; Bisconti, A.V.; Schena, F.; Esposito, F. Specific adaptations in performance and muscle architecture after weighted jumpsquat vs. body mass squat jump training in recreational soccer players. J. Strength Cond. Res. 2018, 32, 921–929. [Google Scholar] [CrossRef]
  29. Vázquez-Guerrero, J.; Moras, G.; Baeza, J.; Rodríguez-Jiménez, S. Force outputs during squats performed using a rotational inertia device under stable versus unstable conditions with different loads. PLoS ONE 2016, 11, e0154346. [Google Scholar] [CrossRef]
  30. Carroll, K.M.; Wagle, J.P.; Sato, K.; Christopher, B.; Taber, N.Y.; Bingham, G.E.; Stone, M.H. Characterising overload in inertial flywheel devices for use in exercise training. Sports Biomech. 2018, 18, 390–401. [Google Scholar] [CrossRef] [PubMed]
  31. Spudić, D.; Kambič, T.; Cvitkovič, R.; Pori, P. Reproducibility and criterion validity of data derived from a flywheel resistance exercise system. Isokinet. Exerc. Sci. 2020, 28, 129–137. [Google Scholar] [CrossRef]
  32. Sabido, R.; Hernández-Davó, J.L.; Pereyra-Gerber, G. Influence of Different Inertial Loads on Basic Training Variables During the Flywheel Squat Exercise. Int. J. Sports Physiol. Perform. 2018, 13, 482–489. [Google Scholar] [CrossRef] [PubMed]
  33. López, A.M.; Fonseca, F.; Ramirez-Campillo, R.; Nuñez, F.J.; Nakamura, F.Y. The use of real-time monitoring during flywheel resistance training programs: How can we measure the eccentric overload? A systematic review and meta-analysis. Biol. Sport 2021, 38, 639–652. [Google Scholar] [CrossRef]
  34. Weakley, J.; Fernández-Valdés, B.; Thomas, L.; Ramirez-Lopez, C.; Jones, B. Criterion validity of force and power outputs for a commonly used flywheel resistance training device and bluetooth app. J. Strength Cond. Res. 2019, 33, 1180–1184. [Google Scholar] [CrossRef] [PubMed]
  35. Sarabon, N.; Rosker, J.; Fruhmann, H.; Burggraf, S.; Loefler, S.; Kern, H. Reliability of maximal voluntary contraction related parameters measured by a novel portable isometric knee dynamometer. Phys. Med. Rehabil. Kurortmed. 2013, 23, 22–27. [Google Scholar] [CrossRef]
  36. Hagströmer, M.; Oja, P.; Sjöström, M. The International Physical Activity Questionnaire (IPAQ): A study of concurrent and construct validity. Public Health Nutr. 2006, 9, 755–762. [Google Scholar] [CrossRef] [PubMed]
  37. Sabido, R.; Hernández-davó, J.L.; Capdepon, L.; Tous-fajardo, J. How Are Mechanical, Physiological, and Perceptual Variables Affected by the Rest Interval Between Sets During a Flywheel Resistance Session? Front. Physiol. 2020, 11, 1–8. [Google Scholar] [CrossRef]
  38. Harris, N.K.; Cronin, J.; Taylor, K.; Boris, J.; Sheppard, J. Understanding Position Transducer Technology for Strength and Conditioning Practitioners. Strength Cond. J. 2010, 32, 66–79. [Google Scholar] [CrossRef] [Green Version]
  39. Samozino, P.; Edouard, P.; Sangnier, S.; Brughelli, M.; Gimenez, P.; Morin, J.B. Force-velocity profile: Imbalance determination and effect on lower limb ballistic performance. Int. J. Sports Med. 2014, 35, 505–510. [Google Scholar] [CrossRef]
  40. Bland, M.; Altman, D. Statistical methods for assessing agreement between two methods of clinical measurement. Lancet 1986, 8, 307–310. [Google Scholar] [CrossRef]
  41. Koo, T.K.; Li, M.Y. A Guideline of Selecting and Reporting Intraclass Correlation Coefficients for Reliability Research. J. Chiropr. Med. 2016, 15, 155–163. [Google Scholar] [CrossRef] [PubMed] [Green Version]
  42. Hopkins, W.G. Measures of Reliability in Sports Medicine and Science. Sports Med. 2000, 30, 1–15. [Google Scholar] [CrossRef] [Green Version]
  43. Cormack, S.; Newton, R.; McGuigan, M.; Doyle, T. Reliability of measures obtained during single and repeated countermovement jumps. Int. J. Sports Physiol. Perform. 2008, 3, 131–144. [Google Scholar] [CrossRef] [Green Version]
  44. Hinkle, D.E.; Wiersma, W.; Jurs, S.G. Applied Statistics for the Behavioral Sciences, 5th ed.; Houghton Mifflin: Boston, MA, USA, 2003. [Google Scholar]
  45. Demsar, J.; Curk, T.; Erjavec, A.; Gorup, C.; Hocevar, T.; Milutinovic, M.; Mozina, M.; Polajnar, M.; Toplak, M.; Staric, A.; et al. Orange: Data Mining Toolbox in Python. J. Mach. Learn. Res. 2013, 14, 2349–2353. [Google Scholar]
  46. Bakdash, J.Z.; Marusich, L.R. Repeated measures correlation. Front. Psychol. 2017, 8, 1–13. [Google Scholar] [CrossRef] [Green Version]
  47. Bobbert, M.F.; Van Soest, A.J. Effects of muscle strengthening on vertical jump height: A simulation study. Med. Sci. Sports Exerc. 1994, 26, 1012–1020. [Google Scholar] [CrossRef]
  48. Bollinger, L.; Brantley, J.; Tarlton, J.; Baker, P.; Seay, R.; Abel, M. Construct validity, test-retest reliability, and repeatability of performance variables using a flywheel resistance training device. J. Strength Cond. Res. 2020, 34, 3149–3156. [Google Scholar] [CrossRef]
  49. García-Ramos, A.; Feriche, B.; Pérez-Castilla, A.; Padial, P.; Jaric, S. Assessment of leg muscles mechanical capacities: Which jump, loading, and variable type provide the most reliable outcomes? Eur. J. Sport Sci. 2017, 17, 690–698. [Google Scholar] [CrossRef]
  50. Smajla, D.; Spudić, D.; Šarabon, N. Influence of Load and Phase of Contraction on Lateral Symmetries in Flywheel Squats. Symmetry 2021, 13, 111. [Google Scholar] [CrossRef]
  51. Alcazar, J.; Csapo, R.; Ara, I.; Alegre, L.M. On the shape of the force-velocity relationship in skeletal muscles: The linear, the hyperbolic, and the double-hyperbolic. Front. Physiol. 2019, 10, 1–21. [Google Scholar] [CrossRef] [PubMed]
  52. Hansen, K.T.; Cronin, J.B.; Newton, M.J. The reliability of linear position transducer and force plate measurement of explosive force-time variables during a loaded jump squat in elite athletes. J. Strength Cond. Res. 2011, 25, 1447–1456. [Google Scholar] [CrossRef] [PubMed]
  53. García-Ramos, A.; Pérez-Castilla, A.; Morales-Artacho, A.J.; Almeida, F.; Padial, P.; Bonitch-Góngora, J.; Fuente, B.D.; Feriche, B. Force-velocity relationship in the countermovement jump exercise assessed by different measurement methods. J. Hum. Kinet. 2019, 67, 37–47. [Google Scholar] [CrossRef] [PubMed] [Green Version]
  54. Giroux, C.; Rabita, G.; Chollet, D.; Guilhem, G. What is the Best Method for Assessing Lower Limb Force- Velocity Relationship? Int. J. Sports Med. 2015, 36, 143–149. [Google Scholar] [CrossRef] [PubMed]
  55. García-Ramos, A.; Jaric, S.; Pérez-Castilla, A.; Padial, P.; Feriche, B. Reliability and magnitude of mechanical variables assessed from unconstrained and constrained loaded countermovement jumps. Sport Biomech. 2017, 16, 514–526. [Google Scholar] [CrossRef] [PubMed]
  56. García-Ramos, A.; Štirn, I.; Padial, P.; Argüelles-Cienfuegos, J.; De la Fuente, B.; Strojnik, V.; Feriche, B. Predicting vertical jump height from bar velocity. J. Sports Sci. Med. 2015, 14, 256–262. [Google Scholar]
  57. Courel-Ibáñez, J.; Martínez-Cava, A.; Morán-Navarro, R.; Escribano-Peñas, P.; Chavarren-Cabrero, J.; González-Badillo, J.J.; Pallarés, J.G. Reproducibility and Repeatability of Five Different Technologies for Bar Velocity Measurement in Resistance Training. Ann. Biomed. Eng. 2019, 47, 1523–1538. [Google Scholar] [CrossRef] [PubMed]
  58. Garcia-Ramos, A.; Jaric, S. Two-point method: A quick and fatigue-free procedure for assessment of muscle mechanical capacities and the 1 repetition maximum. Strength Cond. J. 2018, 40, 54–66. [Google Scholar] [CrossRef]
  59. Lake, J.P.; Lauder, M.A.; Smith, N.A. Barbell kinematics should not be used to estimate power output applied to the barbell-and-body system center of mass during lower-body resistance exercise. J. Strength Cond. Res. 2012, 26, 1302–1307. [Google Scholar] [CrossRef]
  60. García-Ramos, A.; Stirn, I.; Strojnik, V.; Padial, P.; De la Fuente, B.; Argüelles-Cienfuegos, J.; Feriche, B. Comparison of the force-, velocity-, and power-time curves recorded with a force plate and a linear velocity transducer. Sports Biomech. 2016, 15, 329–341. [Google Scholar] [CrossRef] [PubMed]
  61. Spudić, D.; Smajla, D.; Burnard, M.D.; Šarabon, N. Muscle Activation Sequence in Flywheel Squats. Int. J. Environ. Res. Public Health 2021, 18, 3168. [Google Scholar] [CrossRef] [PubMed]
  62. Knudson, D. Letter to the editor regarding ‘the correlation of force-velocity-power relationship of a whole-body movement with 20 m and 60 m sprint’. Sports Biomech. 2021, 1–5. [Google Scholar] [CrossRef] [PubMed]
  63. Samozino, P.; Rejc, E.; Di Prampero, P.E.; Belli, A.; Morin, J.B. Optimal force-velocity profile in ballistic movements-Altius: Citius or Fortius? Med. Sci. Sports Exerc. 2012, 44, 313–322. [Google Scholar] [CrossRef] [PubMed]
Figure 1. The structure of the flywheel device consisted of flywheels (A), standing platform (B) with two force plates (C) (each 0.50 m × 0.60 m), rotating shaft diameter (0.03 m), pulling rope (d = 0.006 m) and a harness (D). A linear encoder (draw-wire sensor) was installed under the device. The encoder string had its origin above the centre of the axis (E) and was attached to the harness (between the legs) (F).
Applsci 11 10541 g001
Figure 2. Technical drawing of the shaft-based sensor. (A) flywheel (FW); (B) a custom-made sprocket-wheel profiled with 50 teeth that interact with optocoupler photocell sensor (C); (D) block bearings; (F) rotating shaft with 30 mm diameter (E) standing platform; the dashed line represents a pulling rope wrapped twice longitudinally around the shaft, enabling a constant wrapping radius. In the concentric part of the squat, the athlete accelerates the FW into a spinning motion by unwinding the rope and, in contrast, the spinning motion of the FW is slowed down and stopped by winding the rope around the shaft in the eccentric part of the squat.
Applsci 11 10541 g002
Figure 3. Representative ground reaction force (upper part) and linear velocity data (lower part) during flywheel squats. Filtered data are presented for six consecutive squat repetitions at inertia 0.225 kg·m2. Concentric and eccentric parts of the repetitions were determined from the vertical position data: from the lowest squat position (approximately 90° knee flexion) to the standing position (approximately 0° knee flexion). The shaded area represents the eccentric phase of the squat. The dashed line represents the encoder data, and the full line represents the force plate data (upper part) or the linear encoder data (lower part).
Applsci 11 10541 g003
Figure 4. Graphical presentation of average differences between force–velocity (linear lines) and power–velocity (hyperbolas) curves obtained from criterion (dotted curves, i.e., force plates and linear encoder) and direct (solid curves, i.e., rotary encoder) measures. Note that the Y-axis intercept represents maximal theoretical force (F0), X-axis intercept represents maximal theoretical velocity (V0), and the apex of the power–velocity curve represents the maximal theoretical power (Pmax) when performing squats on the FW device.
Applsci 11 10541 g004
Table 1. Main characteristics of the participants.
NAge (Years)Mass (kg)Height (cm)Body Mass Index (kg/m2)Training History (Years)IPAQ Score (MET/min/Week)Knee Extension Strength
(Nm/kg)
Male2423.8 (2.8)79.3 (12.2)181.3 (6.3)24.3 (3.0)12.1 (3.6)3366.8 (1743.3)3.44 (0.62)
Female2622.2 (2.9)63.0 (9.1)168.4 (5.6)22.4 (2.6)10.5 (3.5)3352.8 (2093.0)2.88 (0.48)
All5023.0 (2.9)71.1 (13.4)174.8 (8.8)23.4 (3.0)11.3 (3.6)3359.8 (1907.7)3.12 (0.61)
N, number of participants in the group; all, male and female; data are presented as means (standard deviations).
Table 2. Descriptive statistics and inter-set reliability of the observed mean force–velocity–power output variables.
Criterion (Force Plates and Linear Encoder) Direct (Rotary Encoder)
VariableSet 1
Avg (SD)
Set 2
Avg (SD)
Set 1–Set 2Set 1
Avg (SD)
Set 2
Avg (SD)
Set 1–Set 2
Bias
(95% LoA)
pICC2.1
(95% CI)
CV
(%)
Bias
(95% LoA)
pICC2.1
(95% CI)
CV
(%)
F0 [Nm·kg−1]27.341 (6.389)27.937 (4.938)−0.596
(−1.495; 0.303)
0.1890.916
(0.852; 0.952)
11.326.809 (4.657)27.977 (4.801)−1.169
(−1.866; −0.471)
0.0020.921
(0.823; 0.961)
8.6
V0 [m·s−1]2.041 (0.522)1.948 (0.417)0.093
(−0.013; 0.199)
0.0840.809
(0.664; 0.891)
18.64.047 (1.861)3.514 (1.573)0.534
(−0.03; 1.098)
0.0630.65
(0.303; 0.848)
39.5
Pmax [W·kg−1]13.343 (2.112)13.299 (2.252)0.043
(−0.374; 0.461)
0.8350.874
(0.778; 0.929)
10.925.757 (8.951)23.5 (7.548)2.257
(−0.54; 5.054)
0.1110.613
(0.235; 0.828)
28.5
Slope
[N·s·m−1·kg−1]
−15.102 (8.412)−15.252 (5.003)0.15
(−1.462; 1.762)
0.8520.801
(0.649; 0.887)
27.3−8.165 (4.15)−9.326 (3.743)1.16
(0.116; 2.204)
0.030.738
(0.524; 0.855)
30.1
Bias was calculated as Set 1 minus Set 2; data are presented as average (95% CI); Bias is presented as mean (LoA); LoA—limits of agreement; CI—confidence interval; p—paired samples t-test statistics.
Table 3. Agreement of velocity values between criterion (linear encoder) and direct measures (rotary encoder).
VariablesMeanPeak
Inertia
(kg∙m2)
Criterion
(m/s)
Direct
(m/s)
Bias
(95% LoA)
pr
(95% CI)
TETEsCriterion
(m/s)
Direct
(m/s)
Bias
(95% LoA)
pr
(95% CI)
TETEs
Concentric
0.0250.87
(0.13)
0.96
(0.15)
−0.09
(−0.12; −0.07)
<0.0010.864
(0.771; 0.920)
0.0120.0941.45
(0.22)
1.39
(0.2)
0.06
(0.03; 0.09)
<0.0010.900
(0.829; 0.942)
0.0160.070
0.0750.68
(0.1)
0.73
(0.12)
−0.05
(−0.07; −0.04)
<0.0010.884
(0.803; 0.933)
0.0090.0631.17
(0.18)
1.12
(0.17)
0.05
(0.03; 0.07)
<0.0010.917
(0.858; 0.952)
0.0120.065
0.2250.45
(0.07)
0.49
(0.09)
−0.04
(−0.05; −0.03)
<0.0010.887
(0.808; 0.935)
0.0060.0770.82
(0.15)
0.78
(0.15)
0.03
(0.02; 0.05)
<0.0010.948
(0.910; 0.970)
0.0080.053
0.250.43
(0.08)
0.47
(0.08)
−0.04
(−0.06; −0.02)
<0.0010.904
(0.836; 0.945)
0.0060.0790.8
(0.15)
0.76
(0.14)
0.04
(0.02; 0.06)
<0.0010.937
(0.981; 0.964)
0.0090.058
Eccentric
0.025−0.87
(0.14)
−0.97
(0.12)
−0.1
(−0.13; −0.07)
<0.0010.797
(0.585; 0.931)
0.0170.122−1.61
(0.25)
−1.35
(0.19)
0.26
(0.21; 0.30)
<0.0010.852
(0.732; 0.921)
0.0220.087
0.075−0.66
(0.12)
−0.76
(0.12)
−0.101
(−0.13; −0.08)
<0.0010.79
(0.629; 0.886)
0.0130.105−1.36
(0.21)
−1.10
(0.19)
0.26
(0.23; 0.30)
<0.0010.853
(0.733; 0.921)
0.0180.085
0.225−0.43
(0.08)
−0.50
(0.08)
−0.074
(−0.09; −0.06)
<0.0010.887
(0.792; 0.94)
0.0060.073−0.89
(0.15)
−0.74
(0.15)
0.15
(0.12; 0.17)
<0.0010.853
(0.732; 0.921)
0.0130.086
0.25−0.41
(0.08)
−0.48
(0.08)
−0.063
(−0.08; −0.05)
<0.0010.874
(0.77; 0.933)
0.0070.085−0.87
(0.15)
−0.72
(0.15)
0.15
(0.13; 0.18)
<0.0010.899
(0.812; 0.946)
0.0110.073
Bias was calculated as criterion minus direct measure; velocity data are presented as mean (CI); bias is presented as mean (LoA); LoA—limits of agreement; CI—confidence interval; p—simple main effect statistics with Bonferroni correction; r—Pearson’s correlation coefficient; TE—typical error; TEs—typical error standardized.
Table 4. Agreement of ground reaction force values between criterion (force plate) and direct measures (rotary encoder).
VariablesMeanPeak
Inertia
(kg∙m2)
Criterion
(N/kg)
Direct
(N/kg)
Bias
(95% LoA)
pr
(95% CI)
TETEsSF
(95% CI)
Criterion
(N/kg)
Direct
(N/kg)
Bias
(95% LoA)
pr
(95% CI)
TETEsSF
(95% CI)
Concentric
0.02514.61
(0.86)
18.79
(1.21)
−4.18
(−4.39;
−3.96)
<0.0010.855
(0.736; 0.922)
0.1050.122−0.2
(−0.24;
−0.15)
25.06
(2.36)
25.14
2.48
−0.08
(−0.59;
0.43)
0.7590.795
(0.637;
0.889)
0.2520.1020.98
(0.91;
1.1)
0.07517.46
(1.6)
20.65
(2.01)
−3.19
(−3.42;
−2.97)
<0.0010.953
(0.911; 0.976)
0.1110.069−0.74
(−0.84;
−0.64)
24.50
(2.99)
26.49
3.45
−1.97
(−2.48;
−1.50)
<0.0010.902
(0.818;
0.948)
0.2420.0810.29
(0.16;
0.42)
0.22520.57
(2.44)
22.64
(2.82)
−2.06
(−2.34;
−1.79)
<0.0010.959
(0.922; 0.979)
0.1360.056−1.44
(−1.68;
−1.21)
26.67
(3.47)
29.25
3.89
−2.58
(−3.14;
−2.02)
<0.0010.899
(0.814;
0.947)
0.2760.08−1.0
(−1.33;
−0.67)
0.2520.98
(2.31)
22.98
(2.64)
−2.0
(−2.26;
−1.74)
<0.0010.959
(0.922; 0.979)
0.1260.054−1.61
(−1.91;
−1.32)
27.27
(3.43)
29.72
3.75
−2.45
(−2.86;
−2.05)
<0.0010.945
(0.896;
0.971)
0.1990.058−1.12
(−1.43;
−0.82)
Eccentric
0.02514.05
(0.84)
16.61
(1.0)
−2.56
(−2.82;
−2.30)
<0.0010.75
(0.513; 0.904)
0.1290.1540.04
(−0.04; 0.12)
25.65
(2.72)
28.40
(2.96)
−2.76
(−3.58;
−1.93)
<0.0010.712
(0.463;
0.879)
0.4070.0150.67
(0.56;
0.79)
0.07516.21
(1.68)
19.53
(1.88)
−3.32
(−3.60;
−3.04)
<0.0010.891
(0.798; 0.943)
0.140.084−1.02
(−1.19;
−0.86)
25.26
(3.43)
29.93
(4.57)
−4.67
(−5.52;
−3.82)
<0.0010.827
(0.69;
0.907)
0.420.123−0.34
(−0.58;
−0.1)
0.22519.45
(2.25)
22.98
(2.72)
−3.54
(−3.87;
−3.20)
<0.0010.936
(0.878; 0.967)
0.1650.073−3.2
(−3.53;
−2.87)
28.38
(3.71)
33.98
(4.74)
−5.60
(−6.43;
−4.77)
<0.0010.85
(0.728;
0.92)
0.4090.11−2.45
(−3.1;
−1.81)
0.2520.02
(2.17)
23.45
(2.492)
−3.43
(−3.77;
−3.09)
<0.0010.914
(0.838; 0.955)
0.1670.077−3.35
(−3.76;
−2.95)
29.15
(3.47)
34.88
(4.78)
−5.73
(−6.59;
−4.87)
<0.0010.846
(0.722;
0.918)
0.4240.122−2.83
(−3.48;
−2.17)
Bias was calculated as criterion minus direct measure; ground reaction force data are presented as mean (CI); bias is presented as mean (LoA); LoA—limits of agreement; CI—confidence interval; p—simple main effect statistics with Bonferroni correction; r—Pearson’s correlation coefficient; TE—typical error; TEs—typical error standardized; scaling factor (SF) is expressed as proportion of the total participants’ body mass as median (95% CI of the median) due to its non-normal distribution.
Table 5. Agreement between criterion (force plate and linear encoder setup) and direct measure (rotary encoder) for observed mean force–velocity–power output variables.
VariableCriterionDirectBias (95% LoA)pr (95% CI)TETEs
F0 (Nm·kg−1)28.31
(4.76)
27.98
(4.80)
0.333
(−0.148; 0.814)
0.1710.943
(0.898; 0.968)
0.230.05
V0 (m·s−1)1.90
(0.40)
3.51
(1.57)
−1.611
(−1.987; −1.236)
<0.0010.827
(0.707; 0.901)
0.180.46
Pmax (W·kg−1)13.20
(2.23)
23.50
(7.55)
−10.298
(−12.188; −8.409)
<0.0010.737
(0.526; 0.883)
0.930.42
Slope (N·s·m−1·kg−1)−15.73
(4.86)
−9.33
(3.74)
−6.401
(−7.133; −5.669)
<0.0010.867
(0.771; 0.925)
0.360.07
Bias was calculated as criterion minus direct measure; data are presented as average (95% CI); bias is presented as average (LoA); LoA—limits of agreement; CI—confidence interval; r—Pearson’s correlation coefficient; TE—typical error; TEs—typical error standardized; p—paired samples t-test statistics; F0—maximal theoretical force, V0—maximal theoretical velocity; Pmax—maximal theoretical power; Slope—inclination of the force–velocity regression line.
Publisher’s Note: MDPI stays neutral with regard to jurisdictional claims in published maps and institutional affiliations.

