1. Introduction
In recent years, the development of new aluminium alloys adapted to the specific needs of every part of the aircraft, lighter, more resistant to corrosion, more tolerant to damage, weldable, and cheaper than carbon fibre, has allowed the aluminium alloy sheet to continue having an important presence in aeronautical structures, as demonstrated in the new generations of single-aisle aircraft.
Aluminium alloy sheet forming processes forging in rubber pad presses, also known as hydroforming processes, were developed in the 20th century with the arrival of metallic fuselage aircraft to be able to use a more economical and faster method than manual forming [
1].
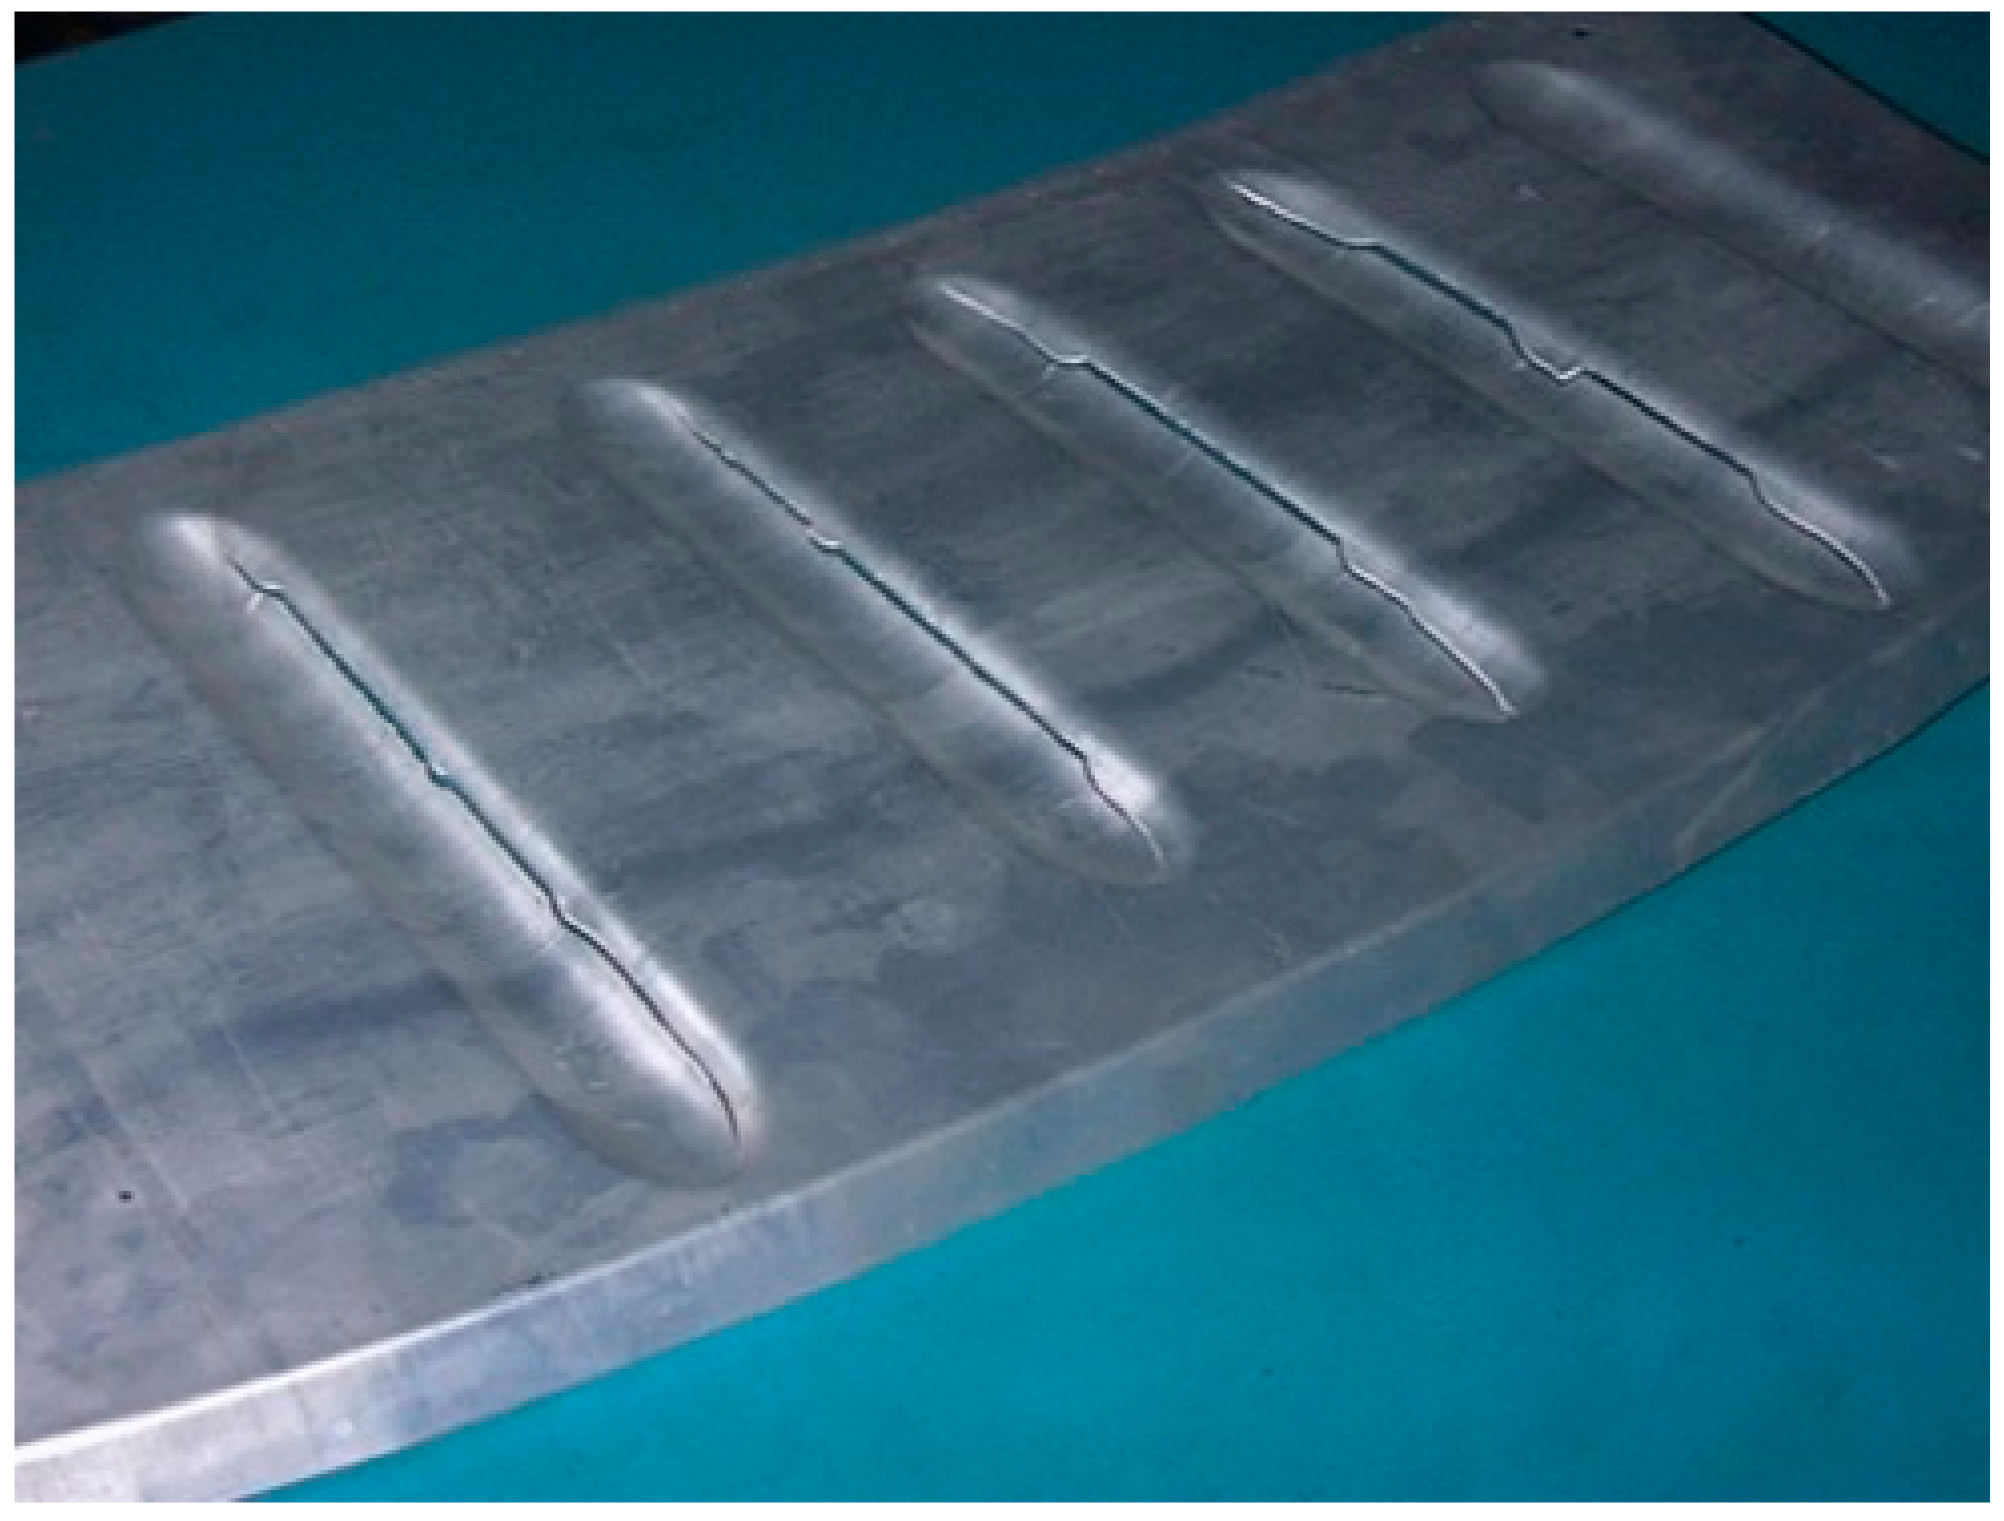
By means of hydroforming, the contour flaps are folded into sheet pieces from 0.5 to 3 mm, with a flat core, generally belonging to ribs or to aeronautical structural elements. The flaps are used to join other pieces by rivets and can be straight or curved (concave, convex, or mixed). Also, by means of hydroforming, smaller stampings are formed in the core of the pieces whose objective is to increase the rigidity without increasing the weight of the piece. In these stampings, the pressure acts on a free radius, forming the sheet by biaxial membrane tensions in the area of the sheet that is in contact with radiuses of the block, and bending stresses are generated accompanied by the traction produced by the dragging of the rubber.
The variability in the results is an unsolved problem in hydroforming, considering that it can lead to the need for unproductive operations on the finished piece to return it to the desired shape, as in the case of distortions caused by elastic recovery, or to render it unusable by localised necking or ductile fracture [
2]. For a given geometry, the appearance of defects depends on parameters directly related to the hydroforming process, such as: (i) technological parameters (like the pressure, the hardness of the rubber, the friction between the sheet and the rubber or between the sheet and the forming block), and (ii) parameters related to the formability of the sheet (like Young’s module, the strength coefficient, the anisotropy indexes or the hardening exponent of the material). The technological parameters of the process are controllable, while the parameters related to the formability of the sheet are difficult to control or it is expensive to reduce their variability. The main defects that appear in the hydroforming are the breaks produced by high tensile stresses, the elastic recovery that takes place when diminishing the forces of the forming, changing the form of the piece, and the wrinkles that occur when shaping the sheet in areas with less perimeter (see
Figure 1).
Different studies have analyzed aspects for the optimization of hydroforming processes. For example, (i) Mahabunphachai and Koc [
3] studied the microhydroforming process of metallic sheets considering the flow stress size effect. The authors used the hydraulic pumping test to investigate the size effects of the material, both grain size and specimen size. The results determined that the material flow curves decrease when reducing both relations; (ii) a similar study was carried out by Xu et al. [
4]. In their work, the authors analyzed the relationship between the geometry and the grain size on copper sheet hydroforming processes. The results showed that as the grain size approaches the thickness of the sheet, the maximum formation height and the final pressure decrease; (iii) Capece Minutolo et al. [
5] used finite element methods to reduce the production process of aeronautical materials from four to three steps. The results allowed them to reduce the time of production, although the thinning process constitutes the longest process, due to the combination of other subprocesses; and (iv) Reveles Arrebondo et al. [
6] developed a methodology for determining the hydraulic pressure necessary to perform hydroforming processes in noncircular pieces. The results achieved reductions of 5.5% in the thickness of the pieces.
Nevertheless, there is a gap in the knowledge of studies that analyze the optimization of aeronautical sheet hydroforming processes. In this scenario, the need arises to make the aeronautical sheet hydroforming processes more competitive. Generally, the forging aeronautical aluminium alloy sheet is received in an annealed condition and is formed in a fresh and unstable state following the heat treatment solution. In order to avoid the loss of ductility and the increase in the resistance that occurs in natural maturation, it is necessary to keep the sheet in the refrigerator at −40° C; this operation generates an important variability of the parameters related to the formability of the sheet. This variability occurs both within the same batch of pieces and between different batches. Being able to shape the sheet after its maturation, in a steady state T3, with lower ductility and greater resistance, could be an important competitive advantage for hydroforming; it would reduce the variability originating in the parameters related to the formability, but it would increase the risk of cracking by necking or by ductile fracture.
Therefore, in this study, the robust design methodology of Taguchi has been employed [
7,
8]. This was due to the good results in other industrial hydroforming processes, such as the one carried out by Reddy, Reddy, and Rao [
9]. In this work, the authors optimized the pipe hydroforming process for the construction of complex automotive parts. Also, in another work by Tilak and Nagaraju [
10], they analyzed the use of the methodology to optimize the cutting process on 1100 aluminium alloy surfaces. Therefore, the possibilities of application of this methodology constitutes an opportunity for the optimization of aeronautical sheet hydroforming processes, so the robust design methodology was applied to make the process less sensitive to the inherent variations [
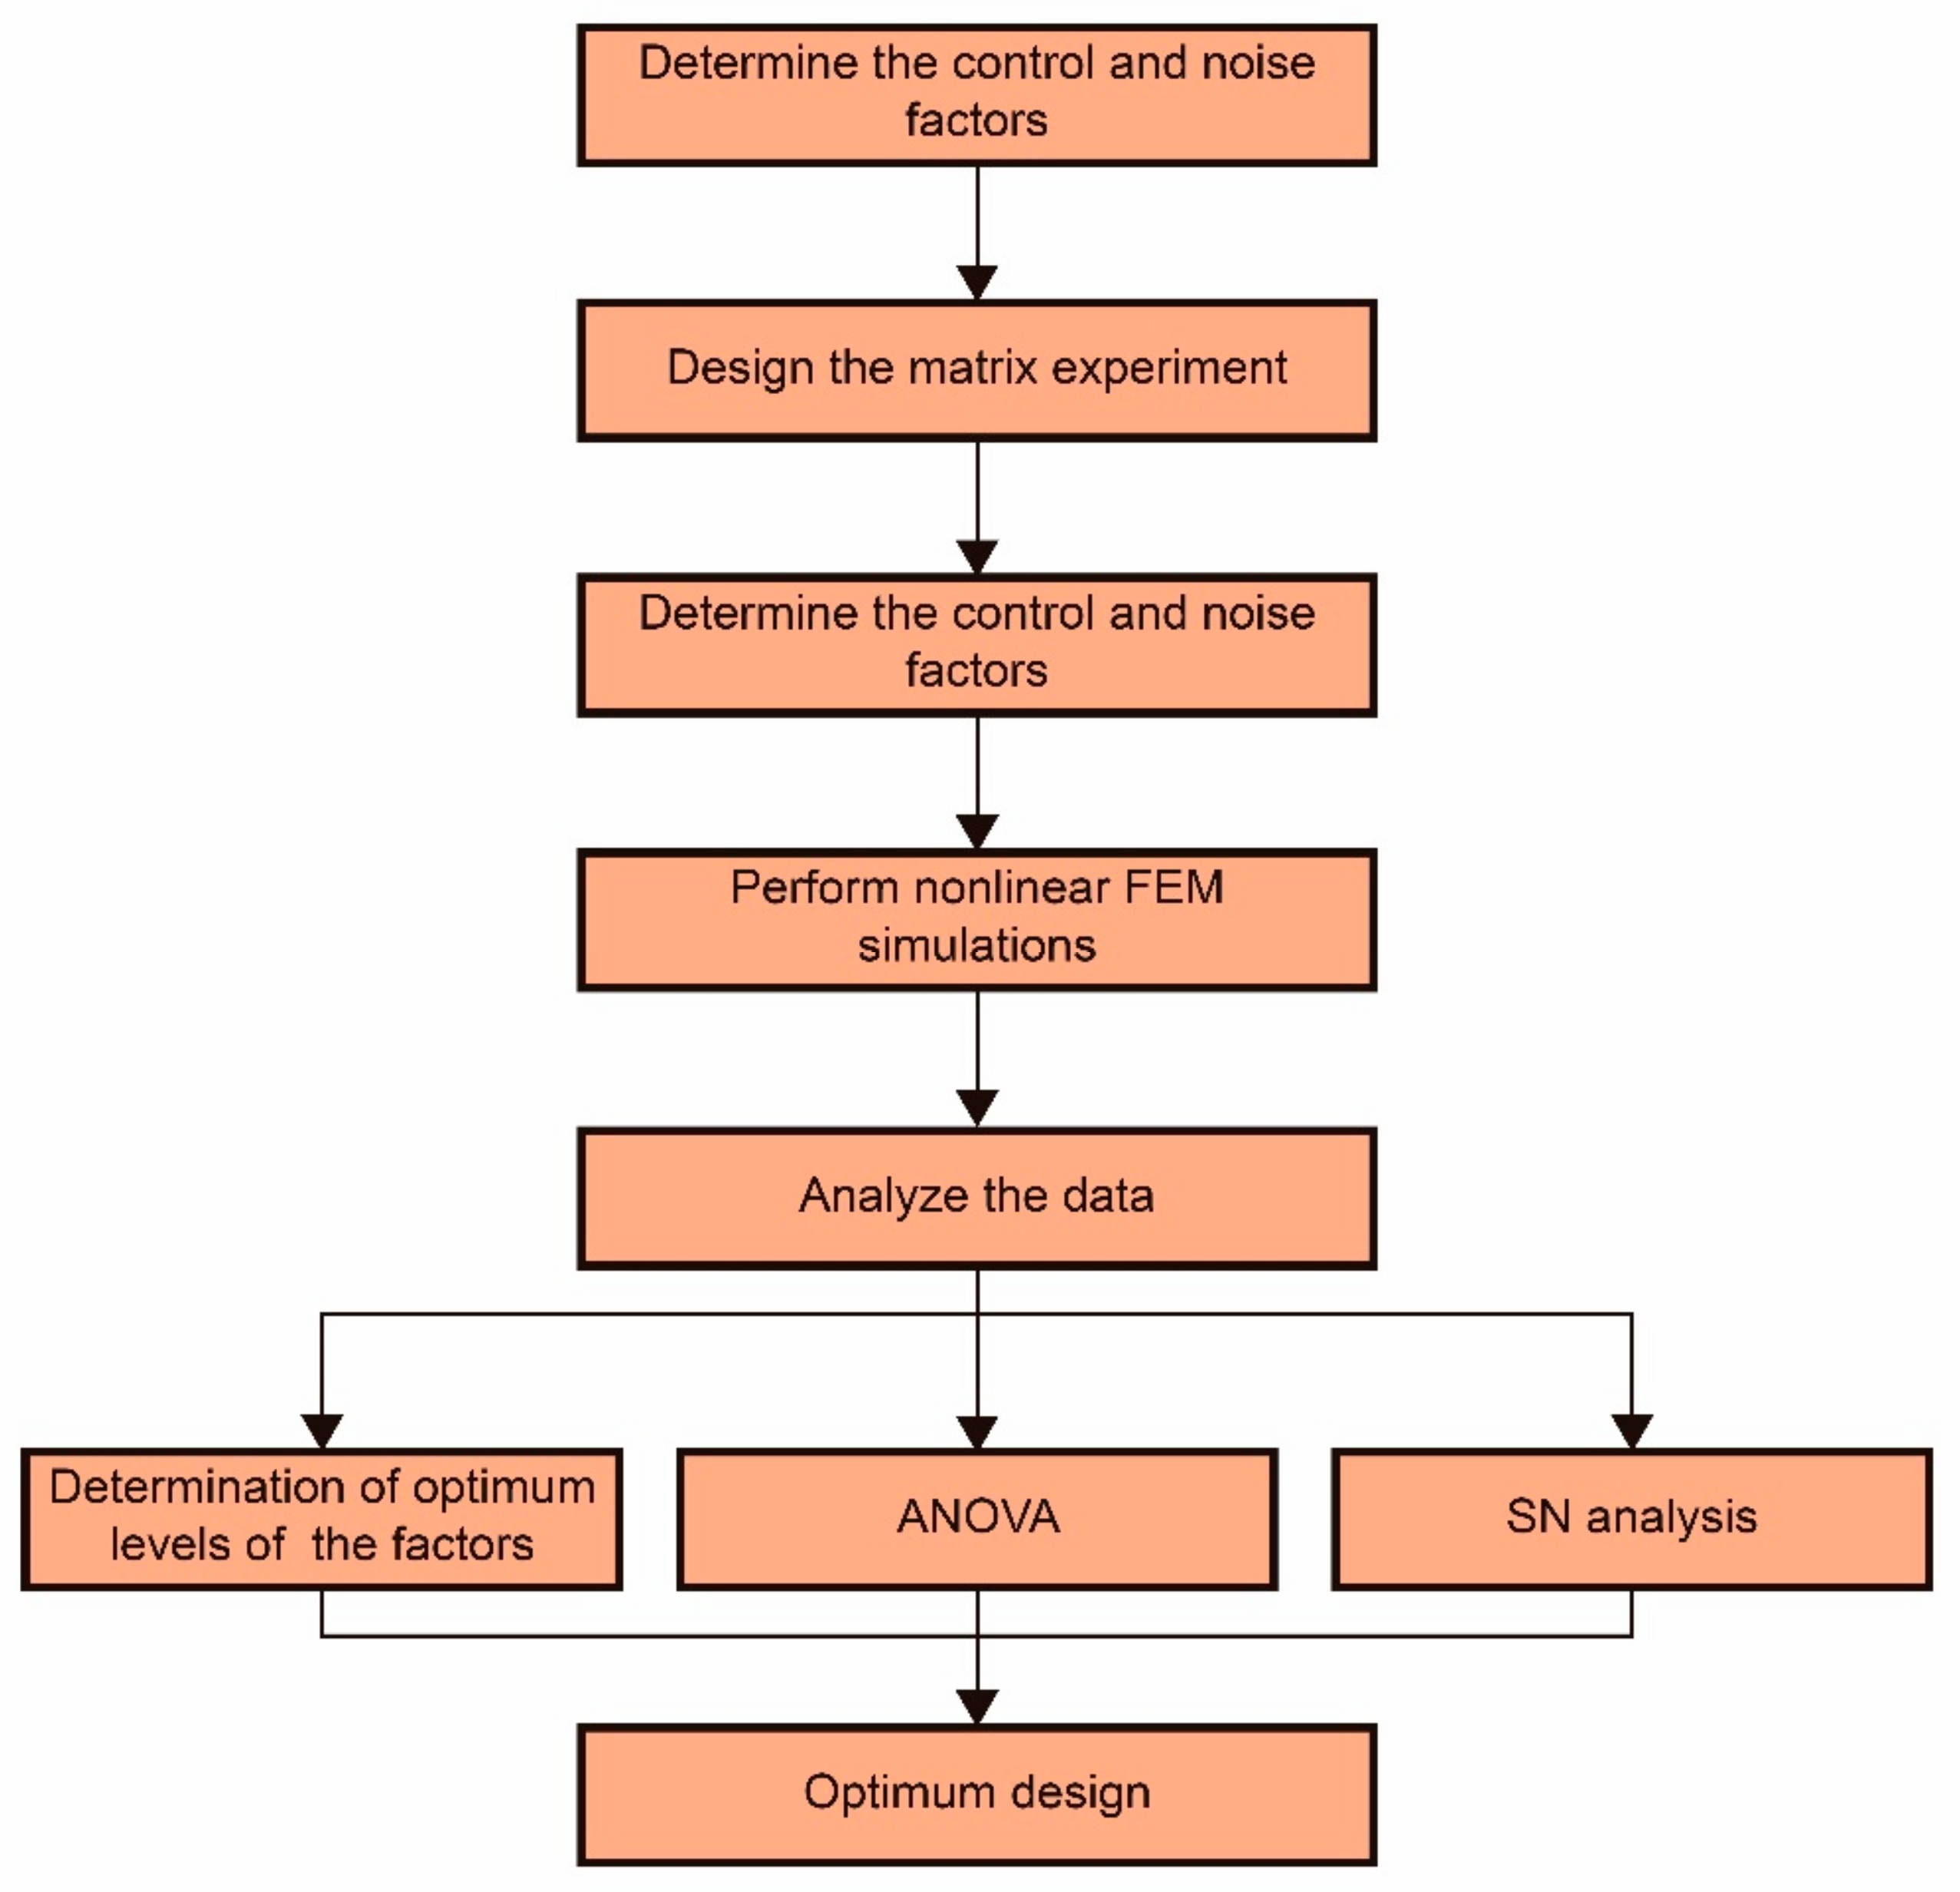
11]. The aim was to make that the elastic recovery and the thinning of the sheet in the stamping area minimal and insensitive to variations in the material. Technological parameters were considered as control factors of the process, while the noise factors were the parameters related to the formability of the sheet, and process simulation tools were used by means of the Finite Elements Method (FEM), from the conceptual design phase of the pieces until the design of the forming blocks.
The article is structured as follows: (i) in
Section 2, a detailed description of Taguchi’s robust design methodology and its applications in engineering is made; (ii)
Section 3 describes the methodology used in this study; (iii)
Section 4 discusses the results obtained; and (iv)
Section 5 establishes the main conclusions of the study.
2. Taguchi’s Robust Design Method
The classical analysis of conducting trials to optimize production processes by analyzing several factors is usually a complex process with high time consumption [
12]. In the case of statistically designed experiments, several individual experiments are performed simultaneously. However, there are problems such as the sequence of the experiments to be performed and the analysis of the influence of different independent variables analyzed during the trials. Given these aspects, Genichi Taguchi established a methodology for the design of factorial experiments that would allow optimizing productive processes [
7,
8]. This methodology emphasizes the use of fractional factorial designs and other orthogonal matrices in novel ways with the purpose of achieving four aspects [
13]: (i) manufacture products that are robust to environmental conditions; (ii) make the products insensitive to the variation of components; (iii) minimizing the mean square error over an objective value; and (iv) greater reliability and product life.
The experiments planned statistically with the Taguchi methodology allow one to recognize and characterize those parameters of the analyzed process that reduce the variation of their performance [
14]. Additionally, the Taguchi methodology has been widely applied in developmental trials, consisting of the detection of the optimal configurations of the analyzed parameters of a process through a reduced number of experiments [
7]. Therefore, the application of the Taguchi methodology allows one to optimize the process quickly [
15].
The experiments are designed in the form of orthogonal matrices. These experiments include several individual experiments that should be performed in a random manner. In this way the error is reduced, and the efficiency of the results is improved. For identification, the level indicator “L” and the number of trials performed are used. Thus, experiments of type L4, L9, and L18 can be configured with 4, 9, and 18 trials, respectively.
To understand the methodology, it is fundamental to distinguish two types of factors. All the processes analyzed by the Taguchi methodology are affected by a series of controllable and noncontrollable factors. Noncontrollable factors (also known as noise factors) make it difficult to achieve desirable quality levels. In practice, they are usually factors whose control requires high economic investment. The main aim of the robust design of a process is to reduce the sensitivity of noise factors [
16]. The signal-to-noise index (SN) establishes the quality and shows the relationship between control factors and noise factors, allowing one to determine the most robust design [
17].
The use of orthogonal arrays allows analyzing different combinations of control factors and noise factors. To determine the effect of each factor, SN should be calculated in each experiment. For this, the following equations are used:
where
is the experiment number,
is the value of the behavioural characteristic for a given experiment,
is the average value,
is the variance,
is number of trials for experiment i, and
is the trial number.
Depending on the process analyzed, it should be sought to minimize or maximize the performance characteristic. For this purpose, the definition of the SR relationship should meet the condition of Equation (4) to minimise the performance characteristic, or the condition of the Equation (5) to maximize the performance characteristic:
By doing so, this methodology is widely applied in different fields of engineering (see
Table 1), since it allows the development of quality products and to reduce the research periods and the delivery time of the products [
18]. Furthermore, the performance of the analysis obtained with the Taguchi method allows obtaining similar results to other advanced statistical techniques. In this sense, Aggarwal et al. [
19] conducted a comparative study between the Taguchi technique and the response surface methodology to optimize the energy consumption for turned parts controlled numerically by a computer. The methods obtained similar results, although the time required for the Taguchi methodology was less. For all these reasons, the use of this methodology constitutes an opportunity to optimize the hydroforming process of aeronautical sheets.
4. Results and Discussion
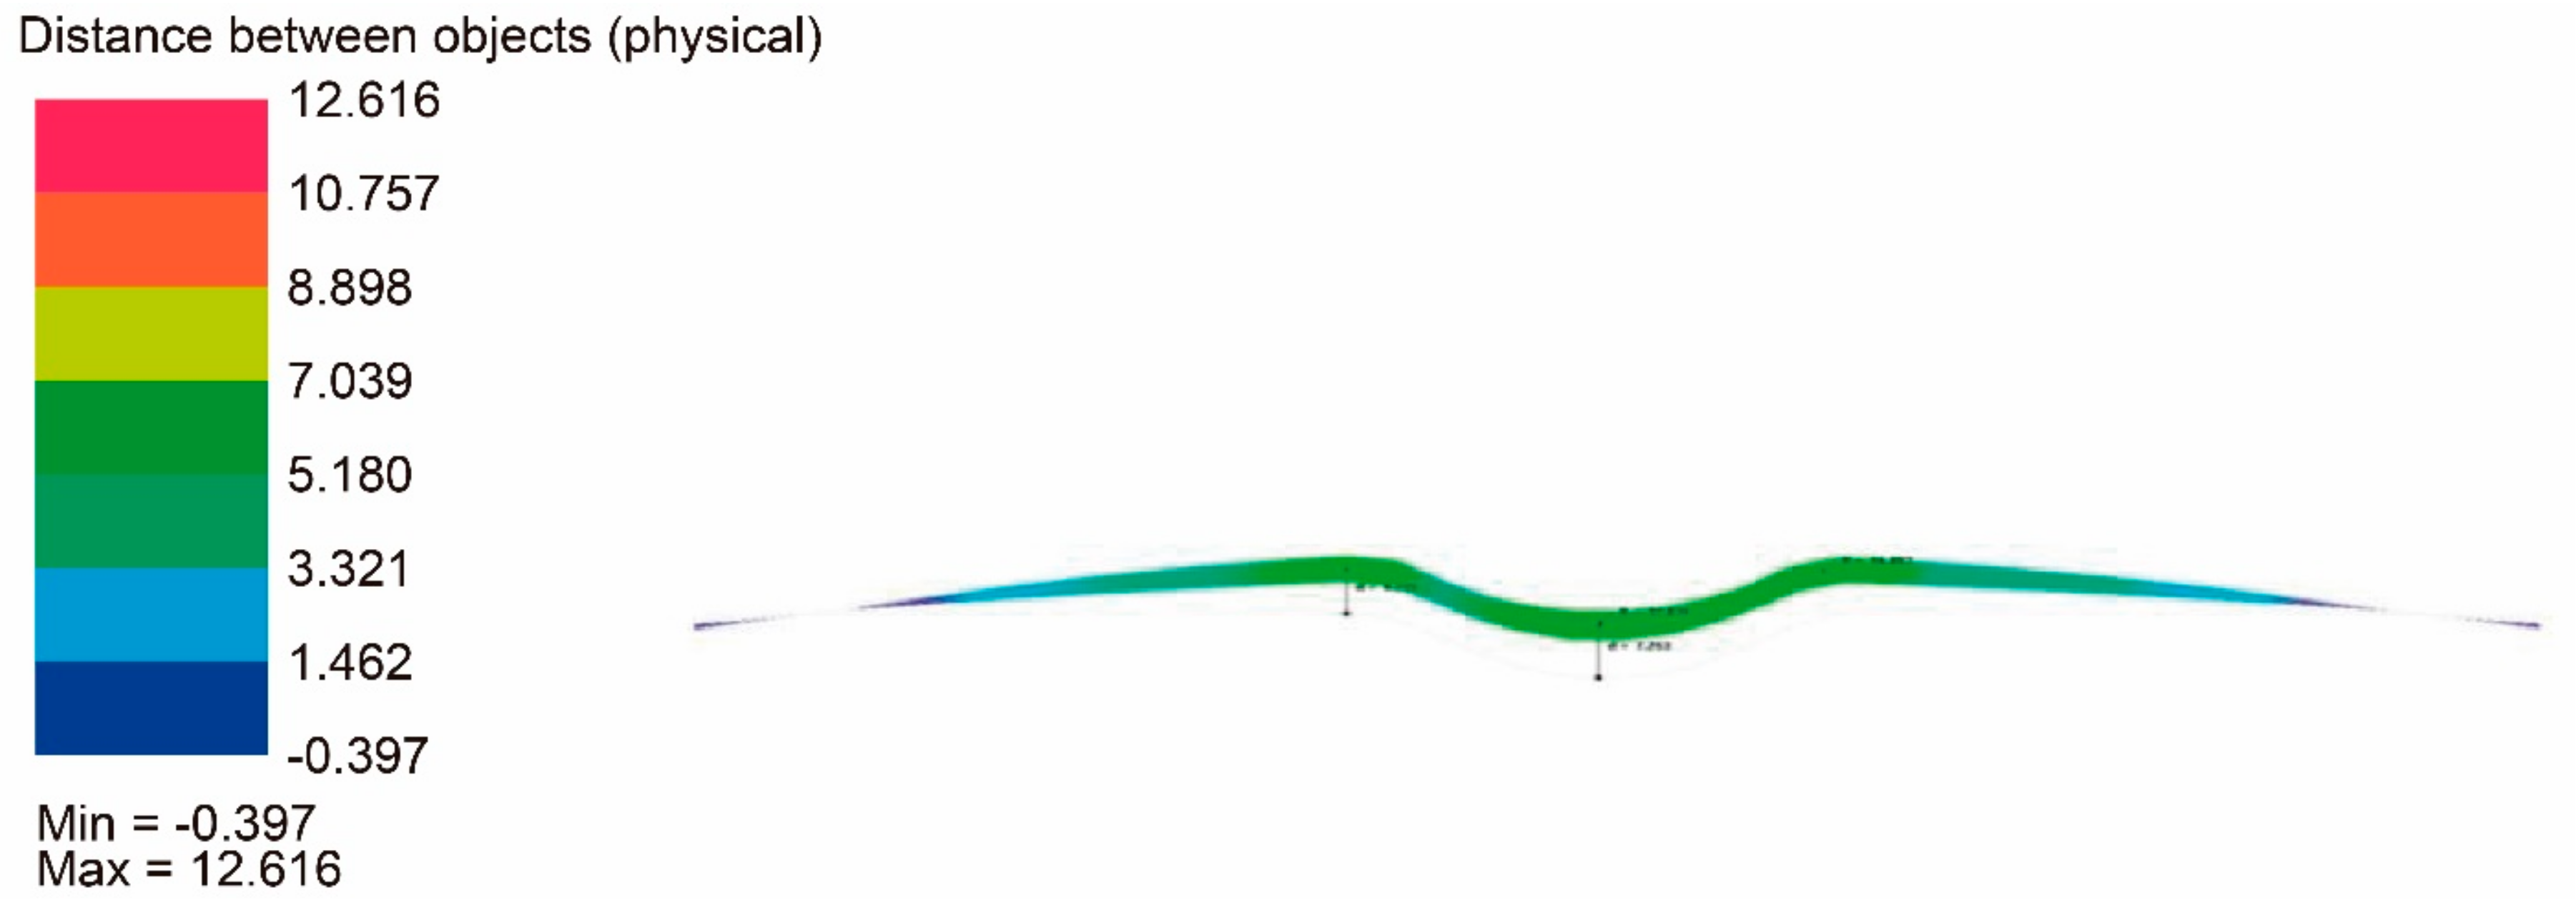
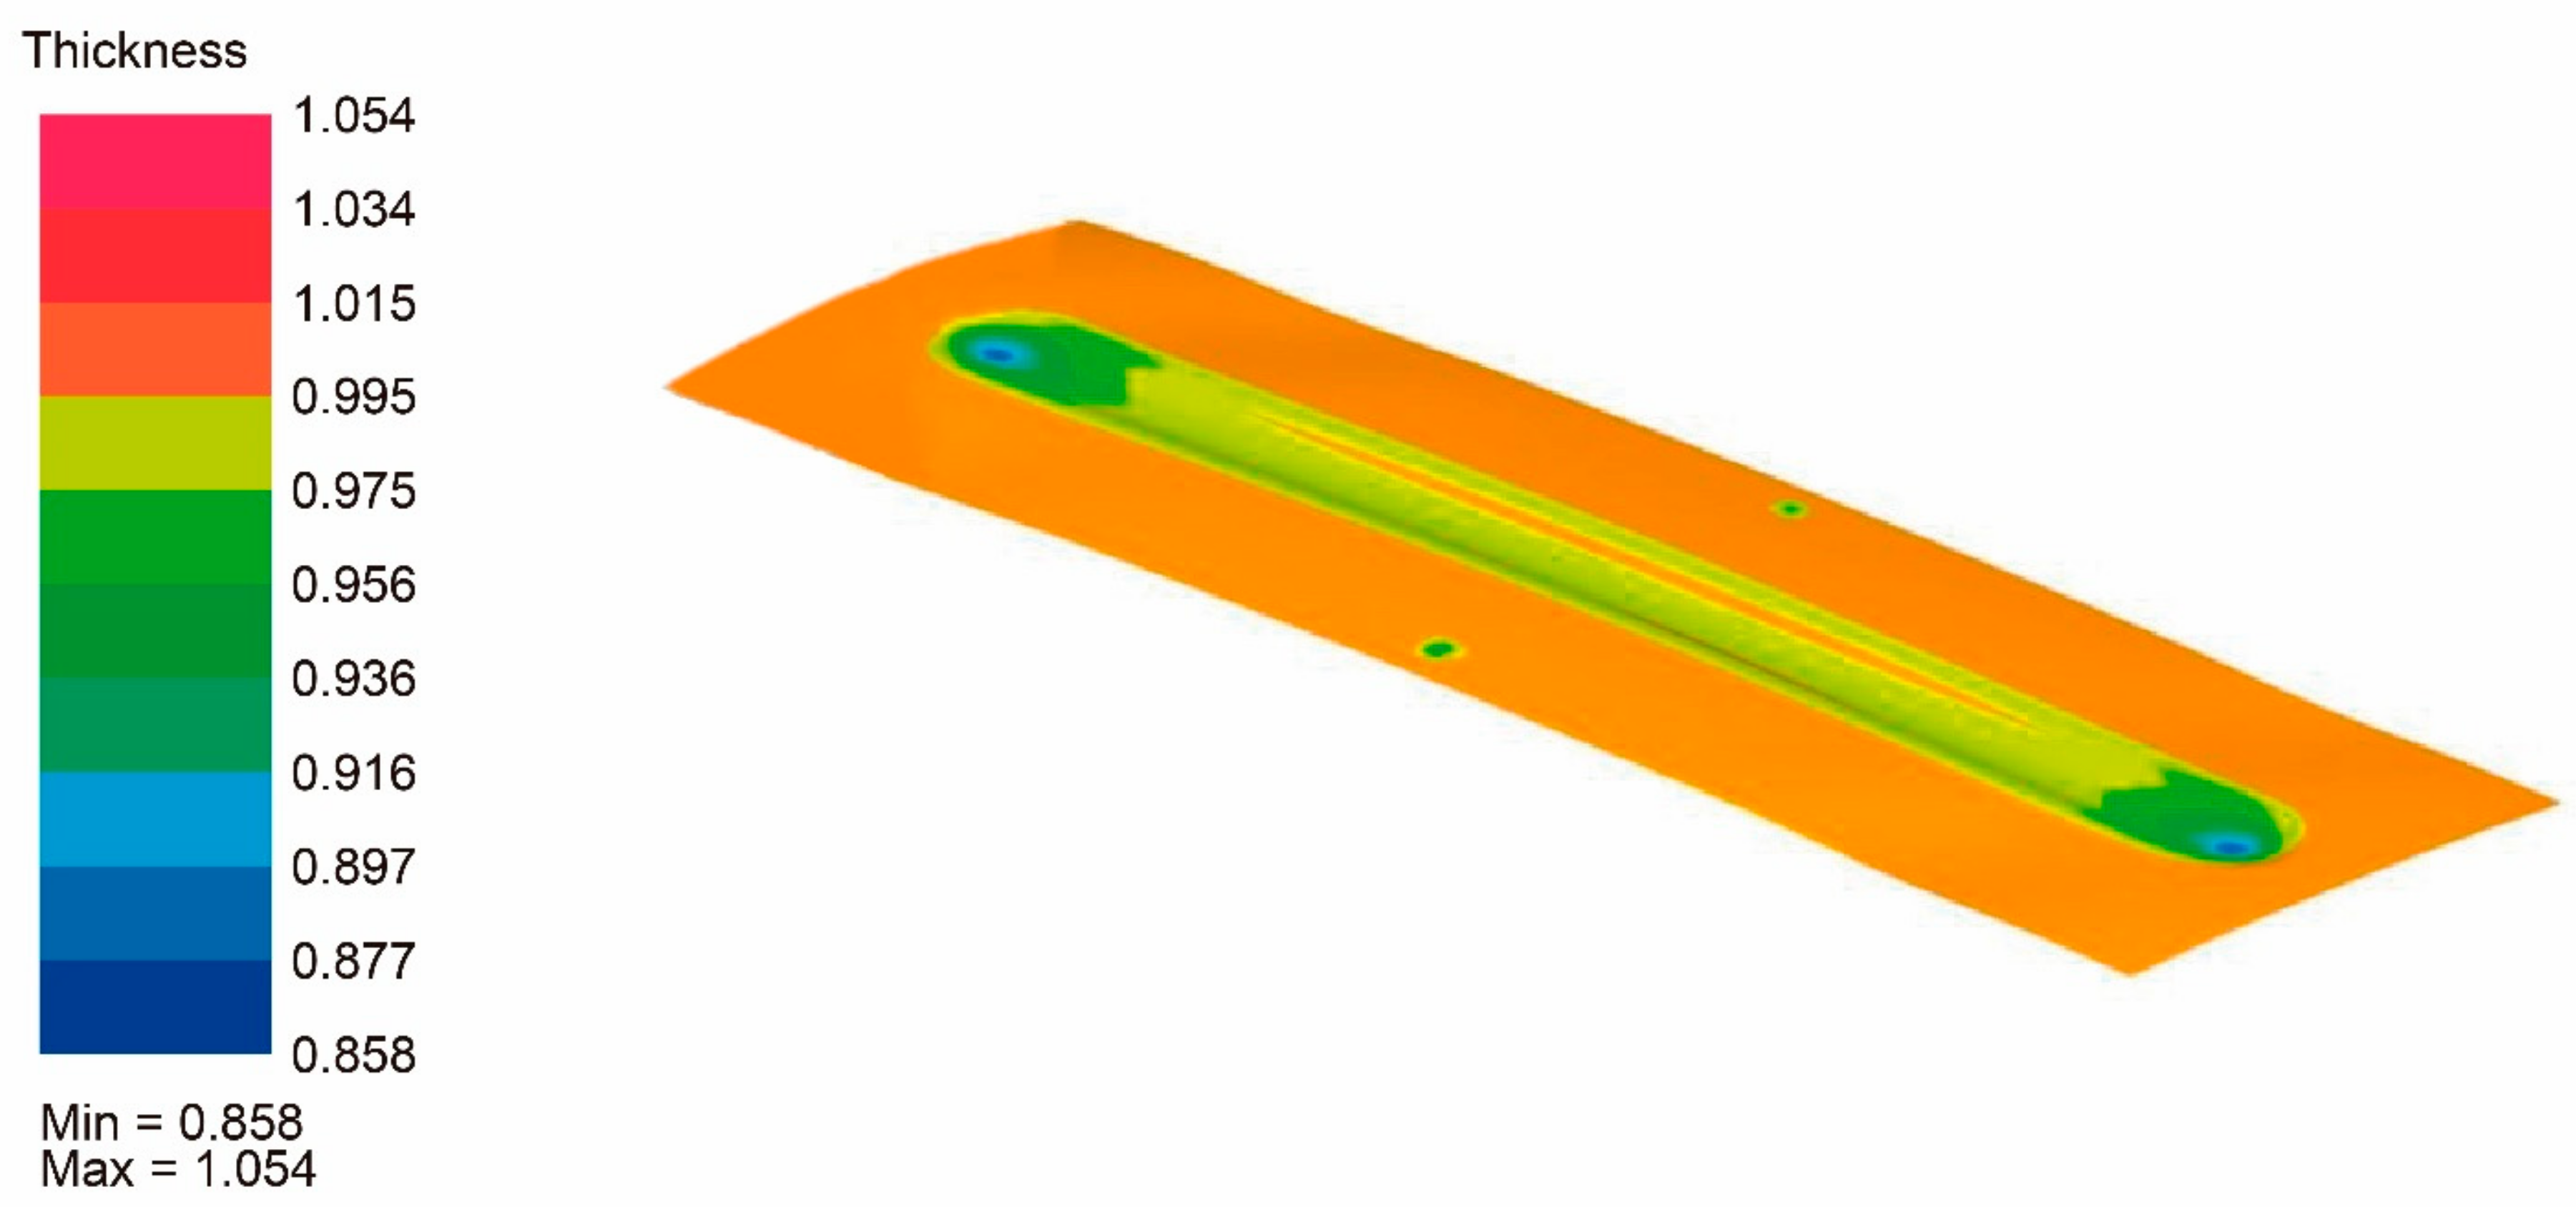
As already indicated, a total of 16 trials were performed using FEM simulations. By means of these simulations, it was possible to analyze the elastic recovery in the stamping area (see
Figure 5) and the minimum thickness (see
Figure 6).
Table 3 and
Table 4 reflect the results of elastic recovery and minimum thickness, respectively. It can be seen how the values of
d oscillated between 0.75 and 7.25, while the oscillations of
tmin had less variations, with values that ranged between 0.84 and 0.90. Therefore, it was important to optimise the forming process factors to conclude that the thinning and elastic recovery of the sheet was minimal.
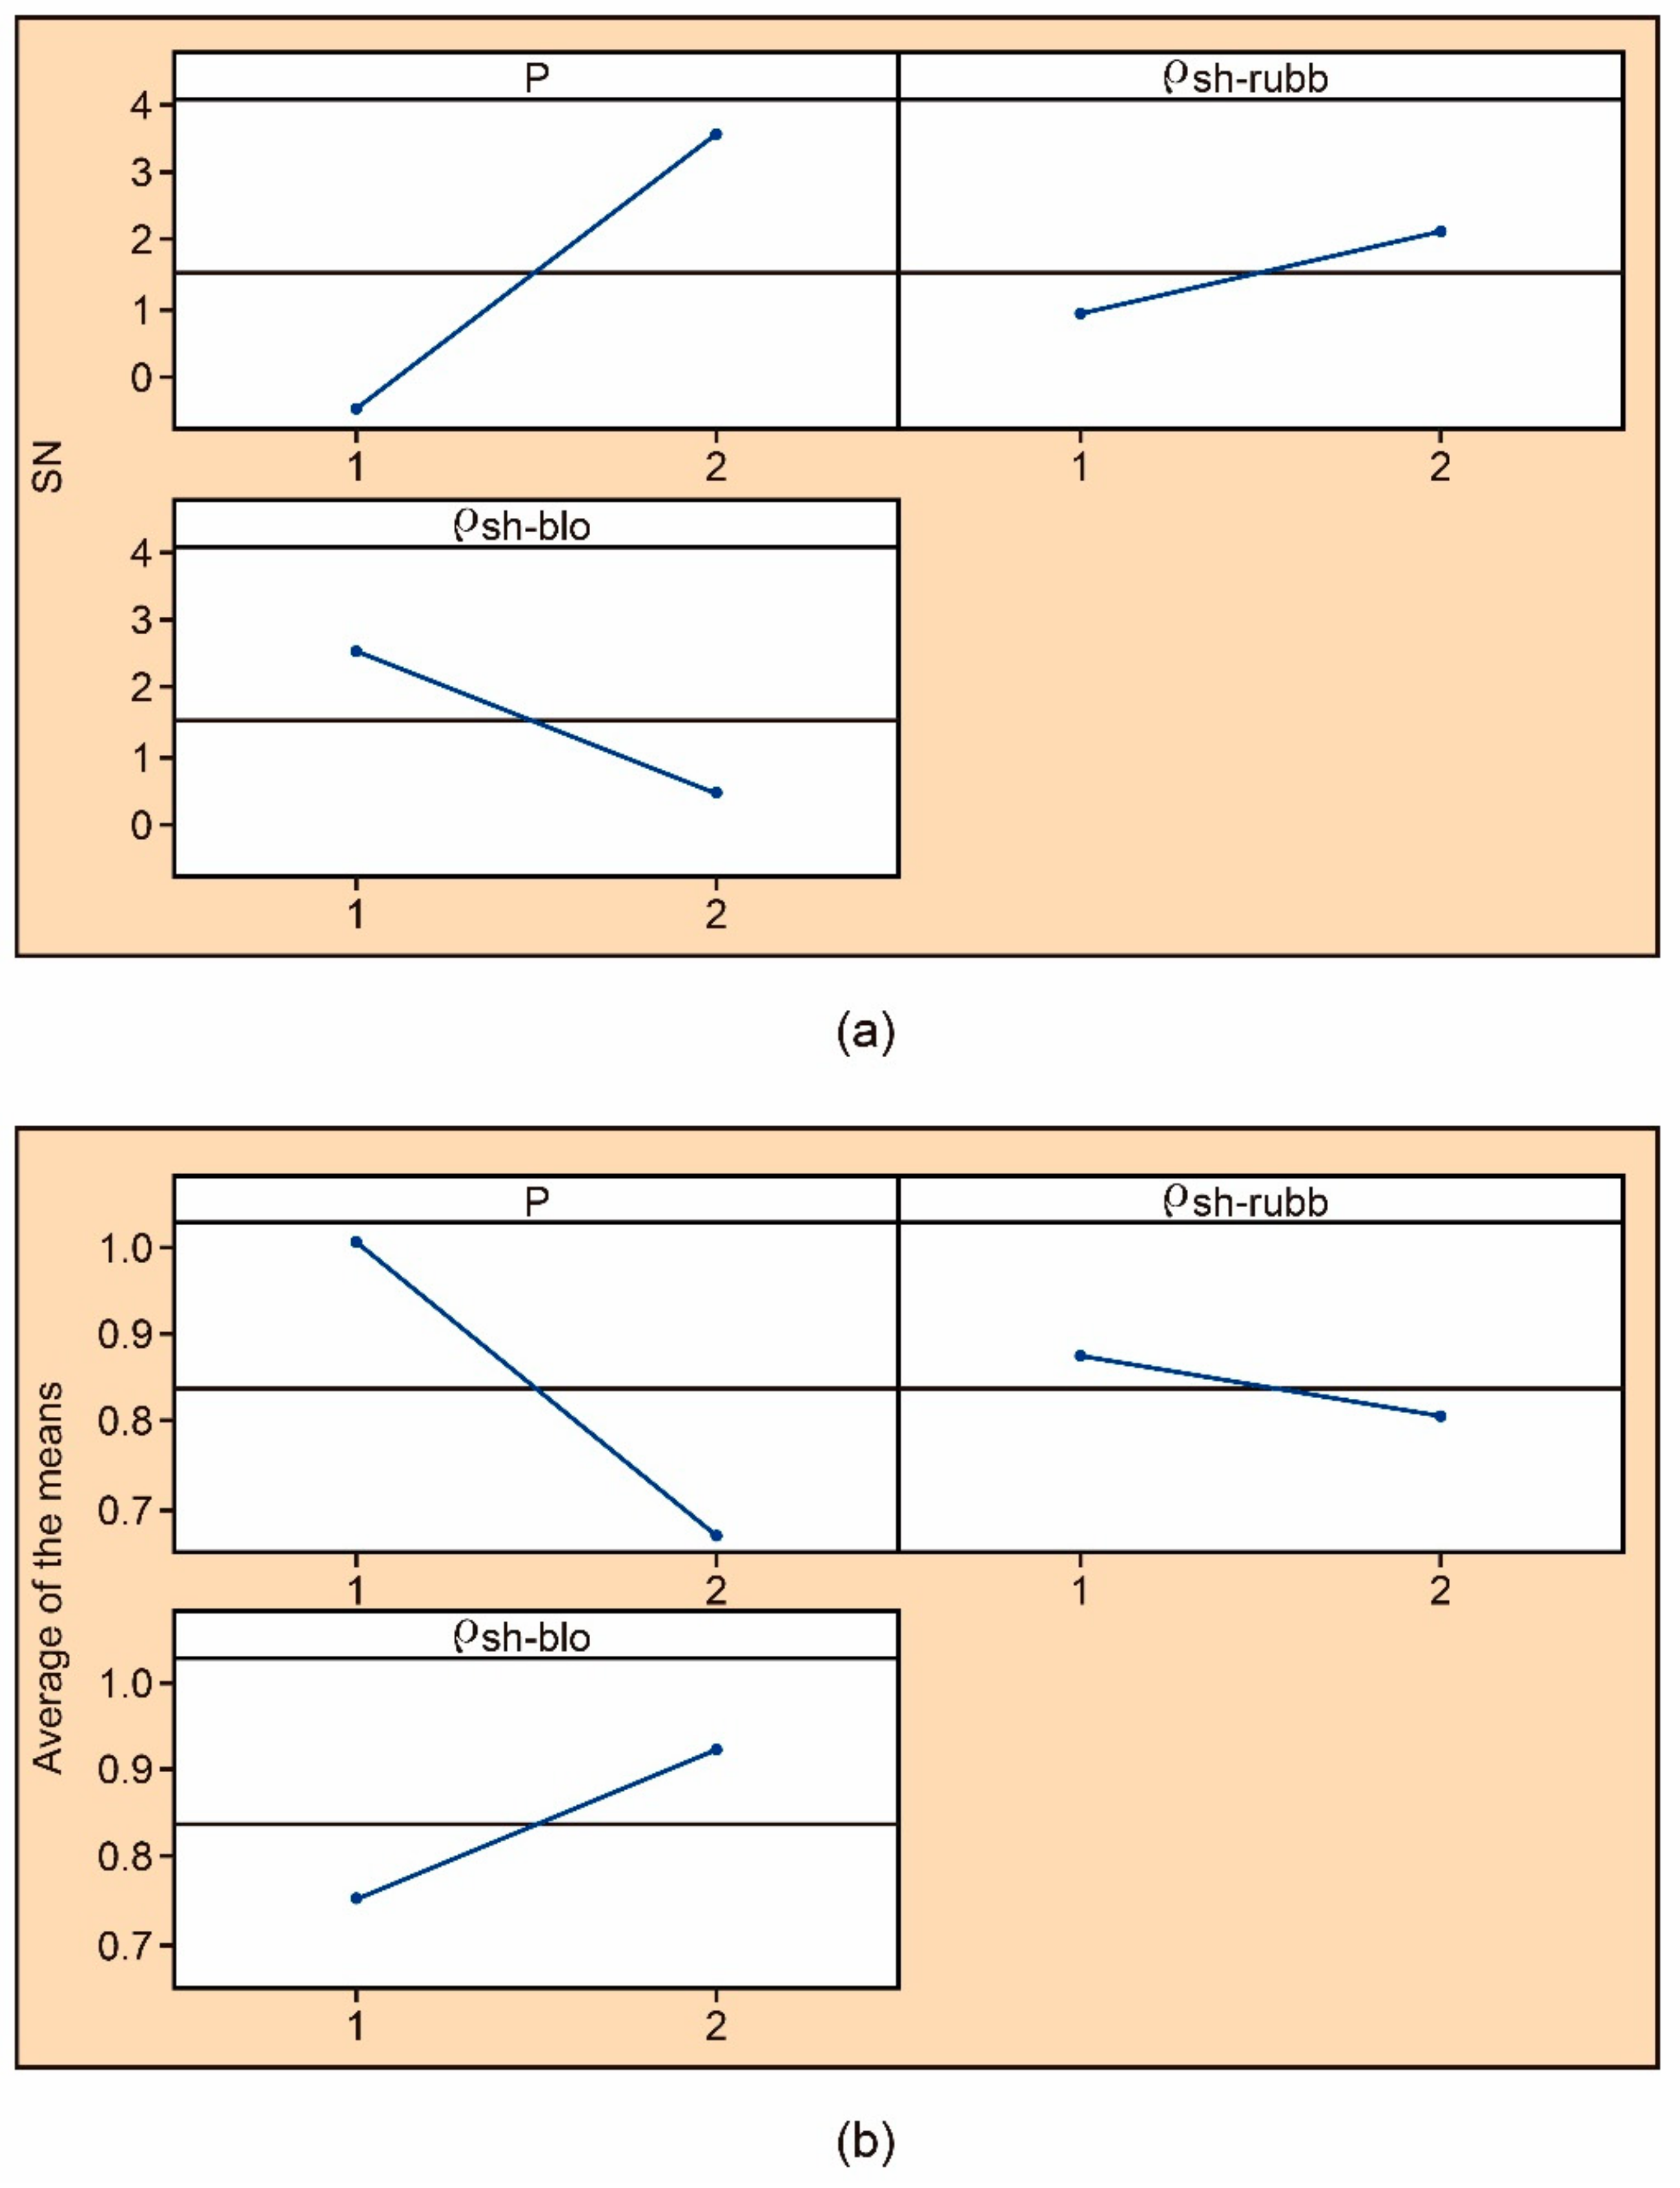
The optimization problem is reduced by minimizing the optimization function. For this, the SN ratio of Equation (4) should be used. The results of applying this function and the mean of the optimization function, obtained with the values of the elastic recovery, and the thinning of the simulation obtained with FEM (
Table 3 and
Table 4, respectively) are represented in
Table 5, while the main effect diagrams are represented in
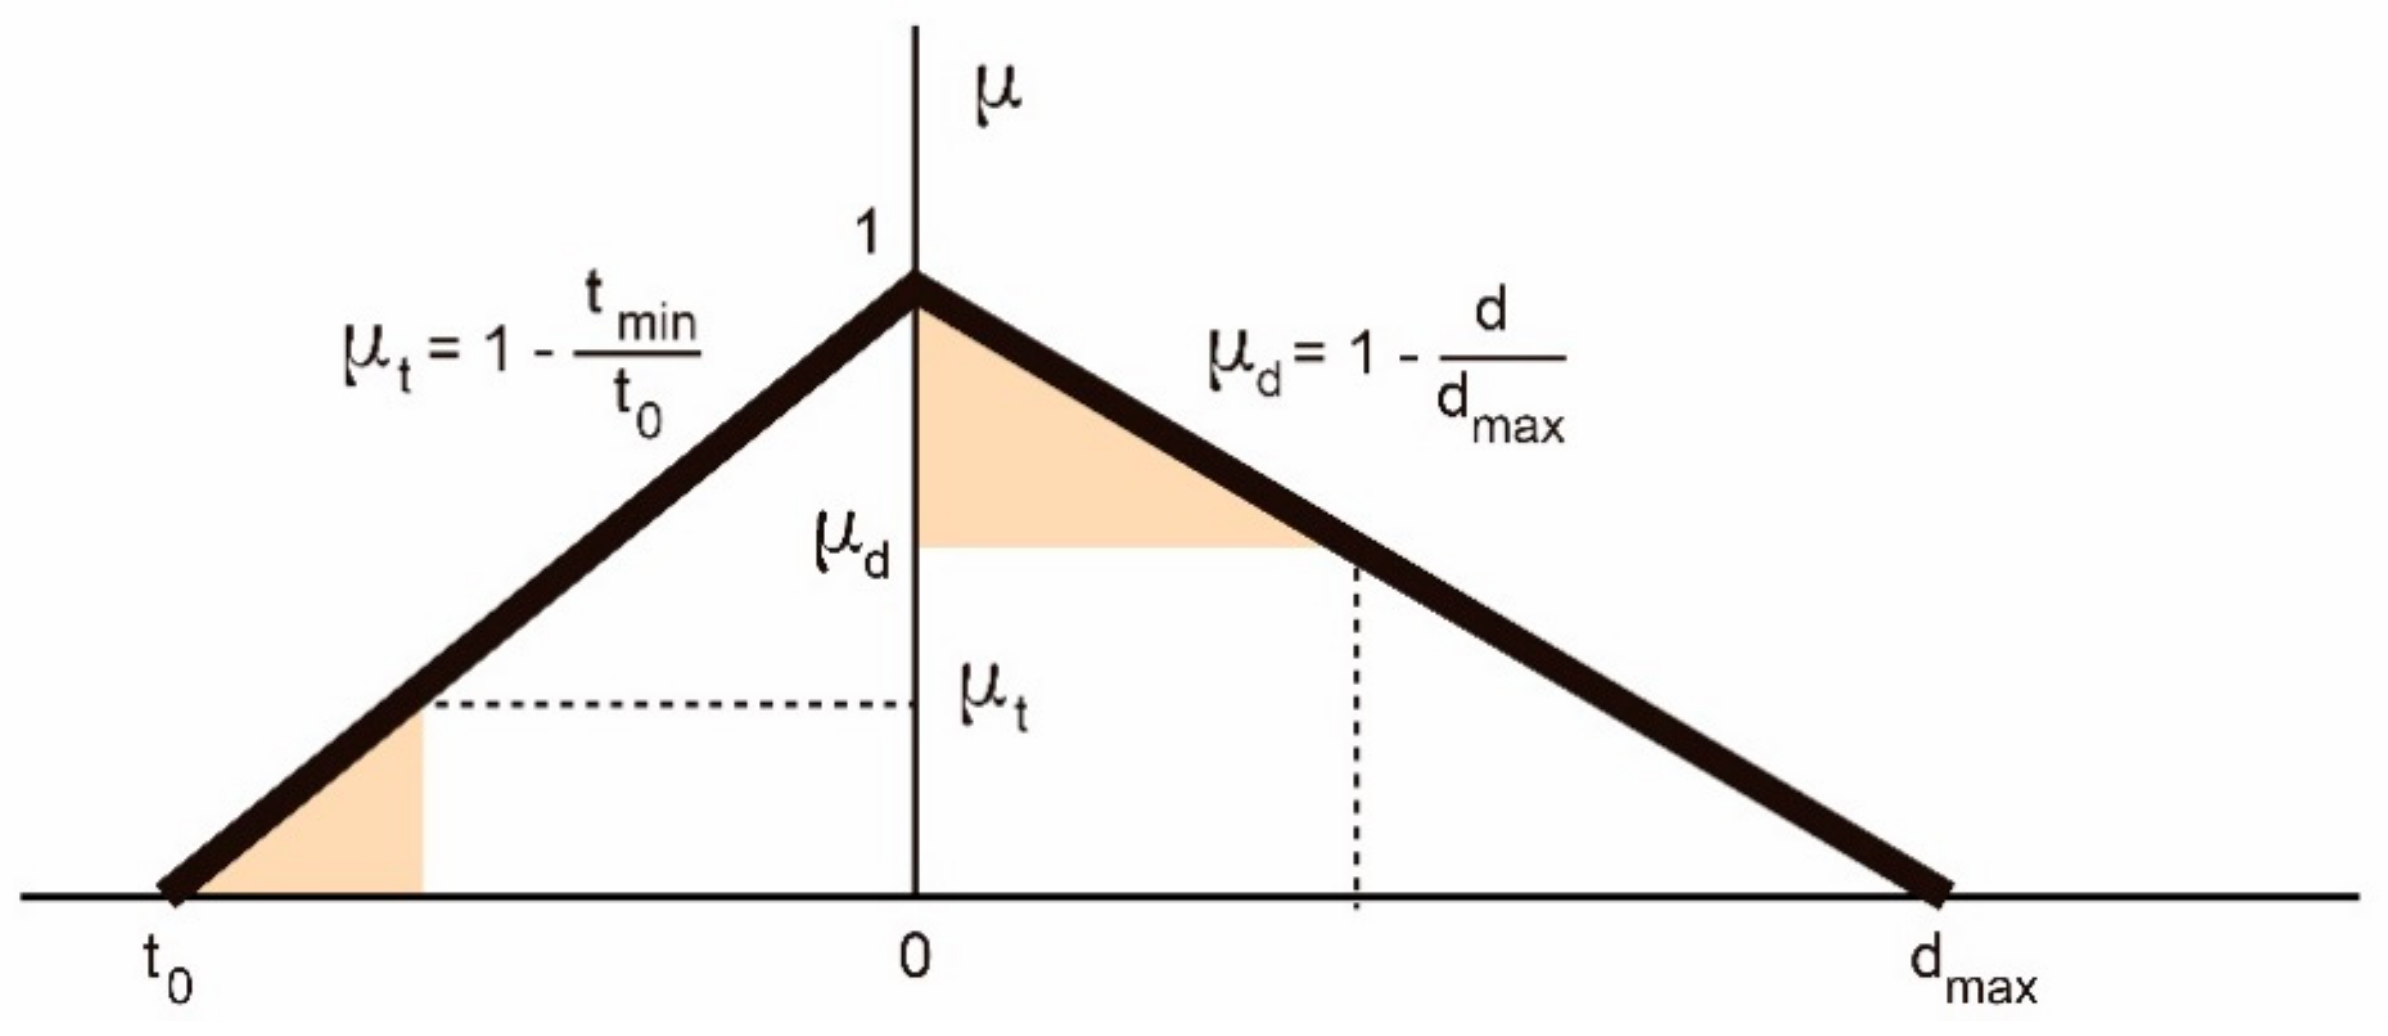
Figure 7. The values of the optimization functions were obtained with the weight functions
and
. In order to reduce the variability of the optimization function, it was necessary to maximize the SN statistical index, and to minimize the optimization function it was necessary to minimize the mean.
Analyzing the obtained results, it was observed that to maximize the SN index, the pressure had to be placed at the highest level (with a contribution of 75%), and the friction coefficient between the sheet and the block at the lowest level (with a contribution of 19%). In addition, the friction coefficient between the sheet and the rubber should have the smallest contribution of the three control factors (only 6%). The main effect diagrams of the mean and the ANOVA indicate that in order to reduce the average of the optimization function, the pressure should be at the highest level (with a contribution of 77%) and with the friction coefficient between the sheet and the block at the lowest level (with a contribution of 20%), while the friction coefficient between the sheet and the rubber should have the smallest contribution (3%). Therefore, the same trend was detected in the behavior of the different control factors.
With these results, it can be established that the pressure and the friction coefficient between the sheet and the block are class I factors, since they affect both the mean and the variation. To minimize their effects, the pressure should be placed at the highest level, while the friction between the sheet and the block should be arranged at the lowest level, facilitating the entrance of the sheet material in the cavity of the shaping block. The friction between the sheet and the block does not significantly affect the average or the variation, so it should be at the most economical level. In this sense, the most economical level would be the highest level, without lubricant and with greater frag of the sheet by the rubber inside the cavity of the conformation block.
With the levels of the optimal control factors found (i.e. 60 MPa for P, 0.5 for
ρsh-rubb, and 0.1 for
ρsh-blo) the values of elastic recovery and thinning were obtained for the different noise factors (see
Table 6). It was observed how the values of d and
tmin were minimal and insensitive to the noise factors variations. In the case of elastic recovery, the use of the optimal parameters of the control factors caused the values of d to oscillate between 1.57 and 1.81 mm, while in the rest of the tests performed with less optimal values, d increments were obtained between 3.83% and 296.17% (see
Table 3). The values of the elastic recovery would serve to compensate the conformation block.
To assess the necking risk in the sheet stamping process in state T3, it is necessary to perform standardised trials to represent the sheet forming limit diagram (FLD). By performing the simulations using the finite element program with the optimal levels of control factors for different noise levels,
Table 4, and obtaining the values of the largest and smallest true longitudinal deformations and representing them in the forming limit diagram, it is verified that if these values are above the forming limit curve, there will be necking risk, if they are below, there will be no necking risk and the sheet could be formed in state T3.
5. Conclusions
A methodology that allows one to make a traditional process of the aeronautical industry robust has been established. The proposed modification of the robust design method of Taguchi parameters for multiobjective optimization allows one to simultaneously address the problems of elastic recovery and thinning in a simple way. Likewise, the use of simulations by means of nonlinear finite element methods allows reduction of the effort and costs of the experimental analyses. This allows a greater opportunity to optimize forming processes of other materials.
This methodology was applied in an AA2024-T3 of 1 mm thickness aluminium alloy sheet. An optimal condition of values for the control factors of the process was found. The combination of the pressure factors, the friction coefficient between the sheet and the block, and the friction coefficient between the sheet and rubber should adopt values of 60 MPa, 0.1, and 0.5, respectively. The use of this configuration for different process conditions of noise factors caused the variations that presented the elastic deformation and the minimum thickness to be as low as possible. In this sense, the use of the optimal parameters of the control factors caused the values of elastic deformation to oscillate between 1.57 and 1.81 mm, while the values of minimum thickness oscillated between 0.88 and 0.90 mm.
In conclusion, the results obtained in this investigation are of great interest for the aeronautical engineering sector. Our findings can reduce the defects produced in the aeronautical sheet hydroforming process. Finally, the methodology used (which is fast and economical) can be extrapolated to the production of other aeronautical products, constituting an opportunity for its optimization.


 ,
, 


