Design of a Solar-Powered Portable ECG Device with Optimal Power Consumption and High Accuracy Measurement


1
Interdisciplinary Program of Biomedical Mechanical and Electrical Engineering, Pukyong National University, Busan 48513, Korea
2
College of Future Convergence, Pukyong National University, Busan 48513, Korea
3
Center for Marine-Integrated Biomedical Technology, Pukyong National University, Busan 48513, Korea
4
Department of Biomedical Engineering, Pukyong National University, Busan 48513, Korea
*
Authors to whom correspondence should be addressed.
Appl. Sci. 2019, 9(10), 2129; https://doi.org/10.3390/app9102129
Submission received: 5 May 2019
/
Revised: 17 May 2019
/
Accepted: 18 May 2019
/
Published: 24 May 2019
(This article belongs to the Section Applied Biosciences and Bioengineering)
Abstract
:One of the best ways to monitor the health of the heart is to regularly record its electrical activity by using an electrocardiogram (ECG). Abnormal ECG signals may indicate conditions such as heart attack, arrhythmia, or heart defects. There are many ECG devices available which can detect and amplify this differential biological signal from the heart, allowing a lot of information to be collected quickly. The ECG is often small and easy to use, but its power is supplied from regular batteries, which need to be replaced after a certain period of use. This causes discomfort for elderly users. To overcome this limitation, in this paper, we aim to develop a solar-powered, portable Bluetooth device for ECG measurements. The device can be interfaced with smartphones or other wireless devices via Bluetooth by a distance up to 100 m. The ECG device was designed to use solar energy, which is also the main power source. Following the solar energy harvesting circuit is a solar panel with an output voltage of 2.4 V and a power out of 0.25 W. We optimized the design to have a very low power consumption and in sleep mode the current consumption is only around 40 µA. The device was designed with 24-bit resolution and a sampling frequency of up to 2133 Hz, which can allow high accuracy ECG measurements. The device is not only used for heart rate monitoring, but it can also assist doctors in analyzing ECG signals with a high accuracy via embedded operating software.

1. Introduction
According to worldwide statistics in 2018, the average life expectancy of men is 70 and for women it is 74 years. There is a big difference in life expectancy between regions and countries around the world. Diet, healthcare, and public health service are important factors affecting the quality of life. According to reports from the American Heart Association, stroke and other cardiovascular diseases listed as the cause of death account for nearly 836,546 deaths in the United States. One ofthree cases of heart disease in the United States leads to death. Every day approximately 2300 Americans die from cardiovascular disease and there is a death every 38 s. The number of adult Americans living with certain types of cardiovascular disease or the consequences of stroke is about 92.1 million. Every year, the estimated cost is about 329.7 billion USD for cardiovascular and stroke treatment, including medical costs and loss of productivity [1].
The electrocardiogram (ECG) is one of the most important non-invasive tools for monitoring and diagnosing heart-related diseases [2,3]. An ECG provides an insight into the electrical activity generated in the heart muscle [4,5]. ECG devices allow for easy and quick monitoring of ECG for patients who have symptoms of heart problems [3,6].
There are many different ECG devices classified based on the features and intended use, but in general, the ECG device can be divided into two types. The first one, used in hospitals, is quite big with a high accuracy to detect problems such as congenital cardiovascular problems. The second type is smaller and can be used for individual patient monitoring. This type is suitable for the elderly and those involved in sports activities [7]. Selecting the device with the right working mode, good signal quality, and the right equipment cost are still the main obstacles for these devices. To achieve efficient and operable features, individual patient monitoring devices must adhere to several specific requirements: size reduction, mobility, wearable, minimal energy consumption, real-time data monitoring, and processing [8,9].
Wearable ECG devices usually run on batteries. Due to the small size requirement, the batteries used for ECG equipment often have a limited capacity, and so, must be periodically replaced. This often leads to problems in emergencies, especially for elderly patients [10].
To deal with this issue, we developed a portable ECG device that uses solar energy as the main energy source so that there is no need to replace the battery. The device can connect to a smartphone or a computer to display the results and monitor the user’s rhythm [2,10,11]. We optimized the design to have a very low power consumption and the current consumption of the sleep mode is only around 40 µA. The device was designed with 24-bit resolution and a sampling frequency up to 2133 Hz that could allow high accuracy ECG measurements.
To store electricity from solar cells, it is necessary to have rechargeable batteries or supercapacitors [12]. A battery has more energy storage capacity than a supercapacitor, but the discharge cycle is limited. On the other hand, supercapacitors have millions of charging cycles but a lower energy storage capacity compared to batteries [13]. Therefore, for low energy consumption of the ECG, we used a supercapacitor to store the solar energy [14,15,16].
The energy optimization issue is of special interest to us. We achieved energy optimization for the ECG device by designing multiple power modules suitable for the characteristics of each main component. For example, we designed two power supply modules of 1.9 V and 4.2 V for ADS1293 [17] and provided a 1.9 V power supply for both PIC16LF19186 [18] and Bluetooth modules [19] in the sleep mode for the main components.
Additionally, we developed an application for tracking ECGs on mobile devices with Windows, Android, and iOS operating systems. For Android and iOS operating systems, the sampling frequency of the ECG device is lower than 400 Hz [2,20], the recorded data is processed in real-time, and the results are displayed on the device. For higher frequencies, the data is synchronized on the server and processed by MATLAB (Academic Version R2017b, Mathworks, Inc., Natick, MA, USA) software. For Windows-based software, the operating system is mainly used to collect data with a high sampling frequency, from 100 Hz to 2133 Hz. The data are processed by MATLAB with more complex algorithms for accurate results [2,21,22].
The remainder of the paper is designed as follows. In Section 2, we describe the hardware and software designs of our ECG prototype in detail. In Section 3, we present the experimental evaluation to test the power consumption of the ECG prototype and test the accuracy of the recorded ECG signals. The conclusions and discussions are presented in Section 4 and Section 5, respectively.
2. Design of the Solar-Powered ECG Device
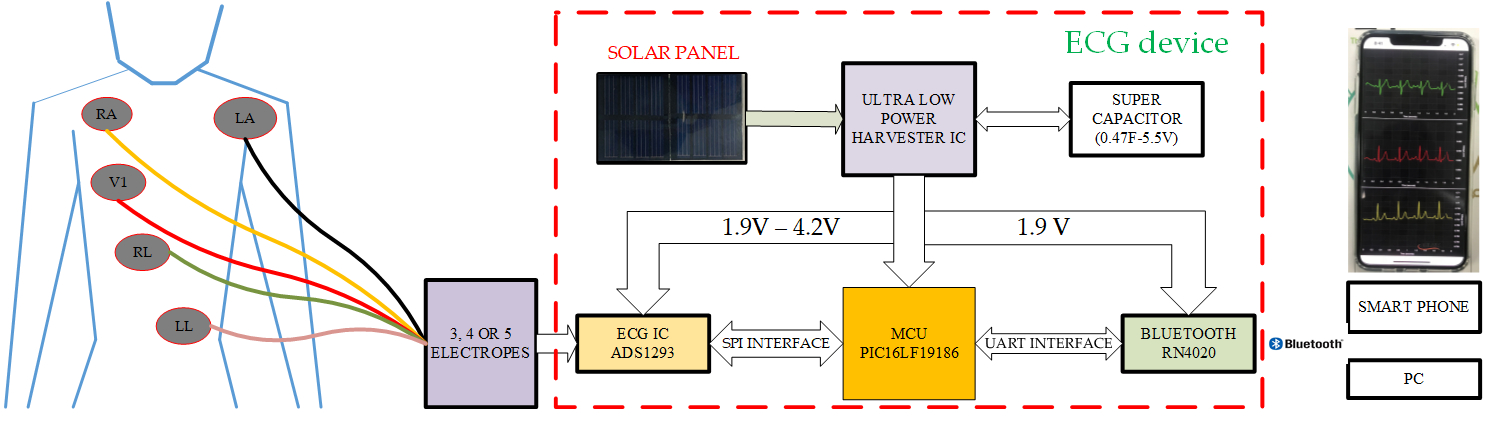
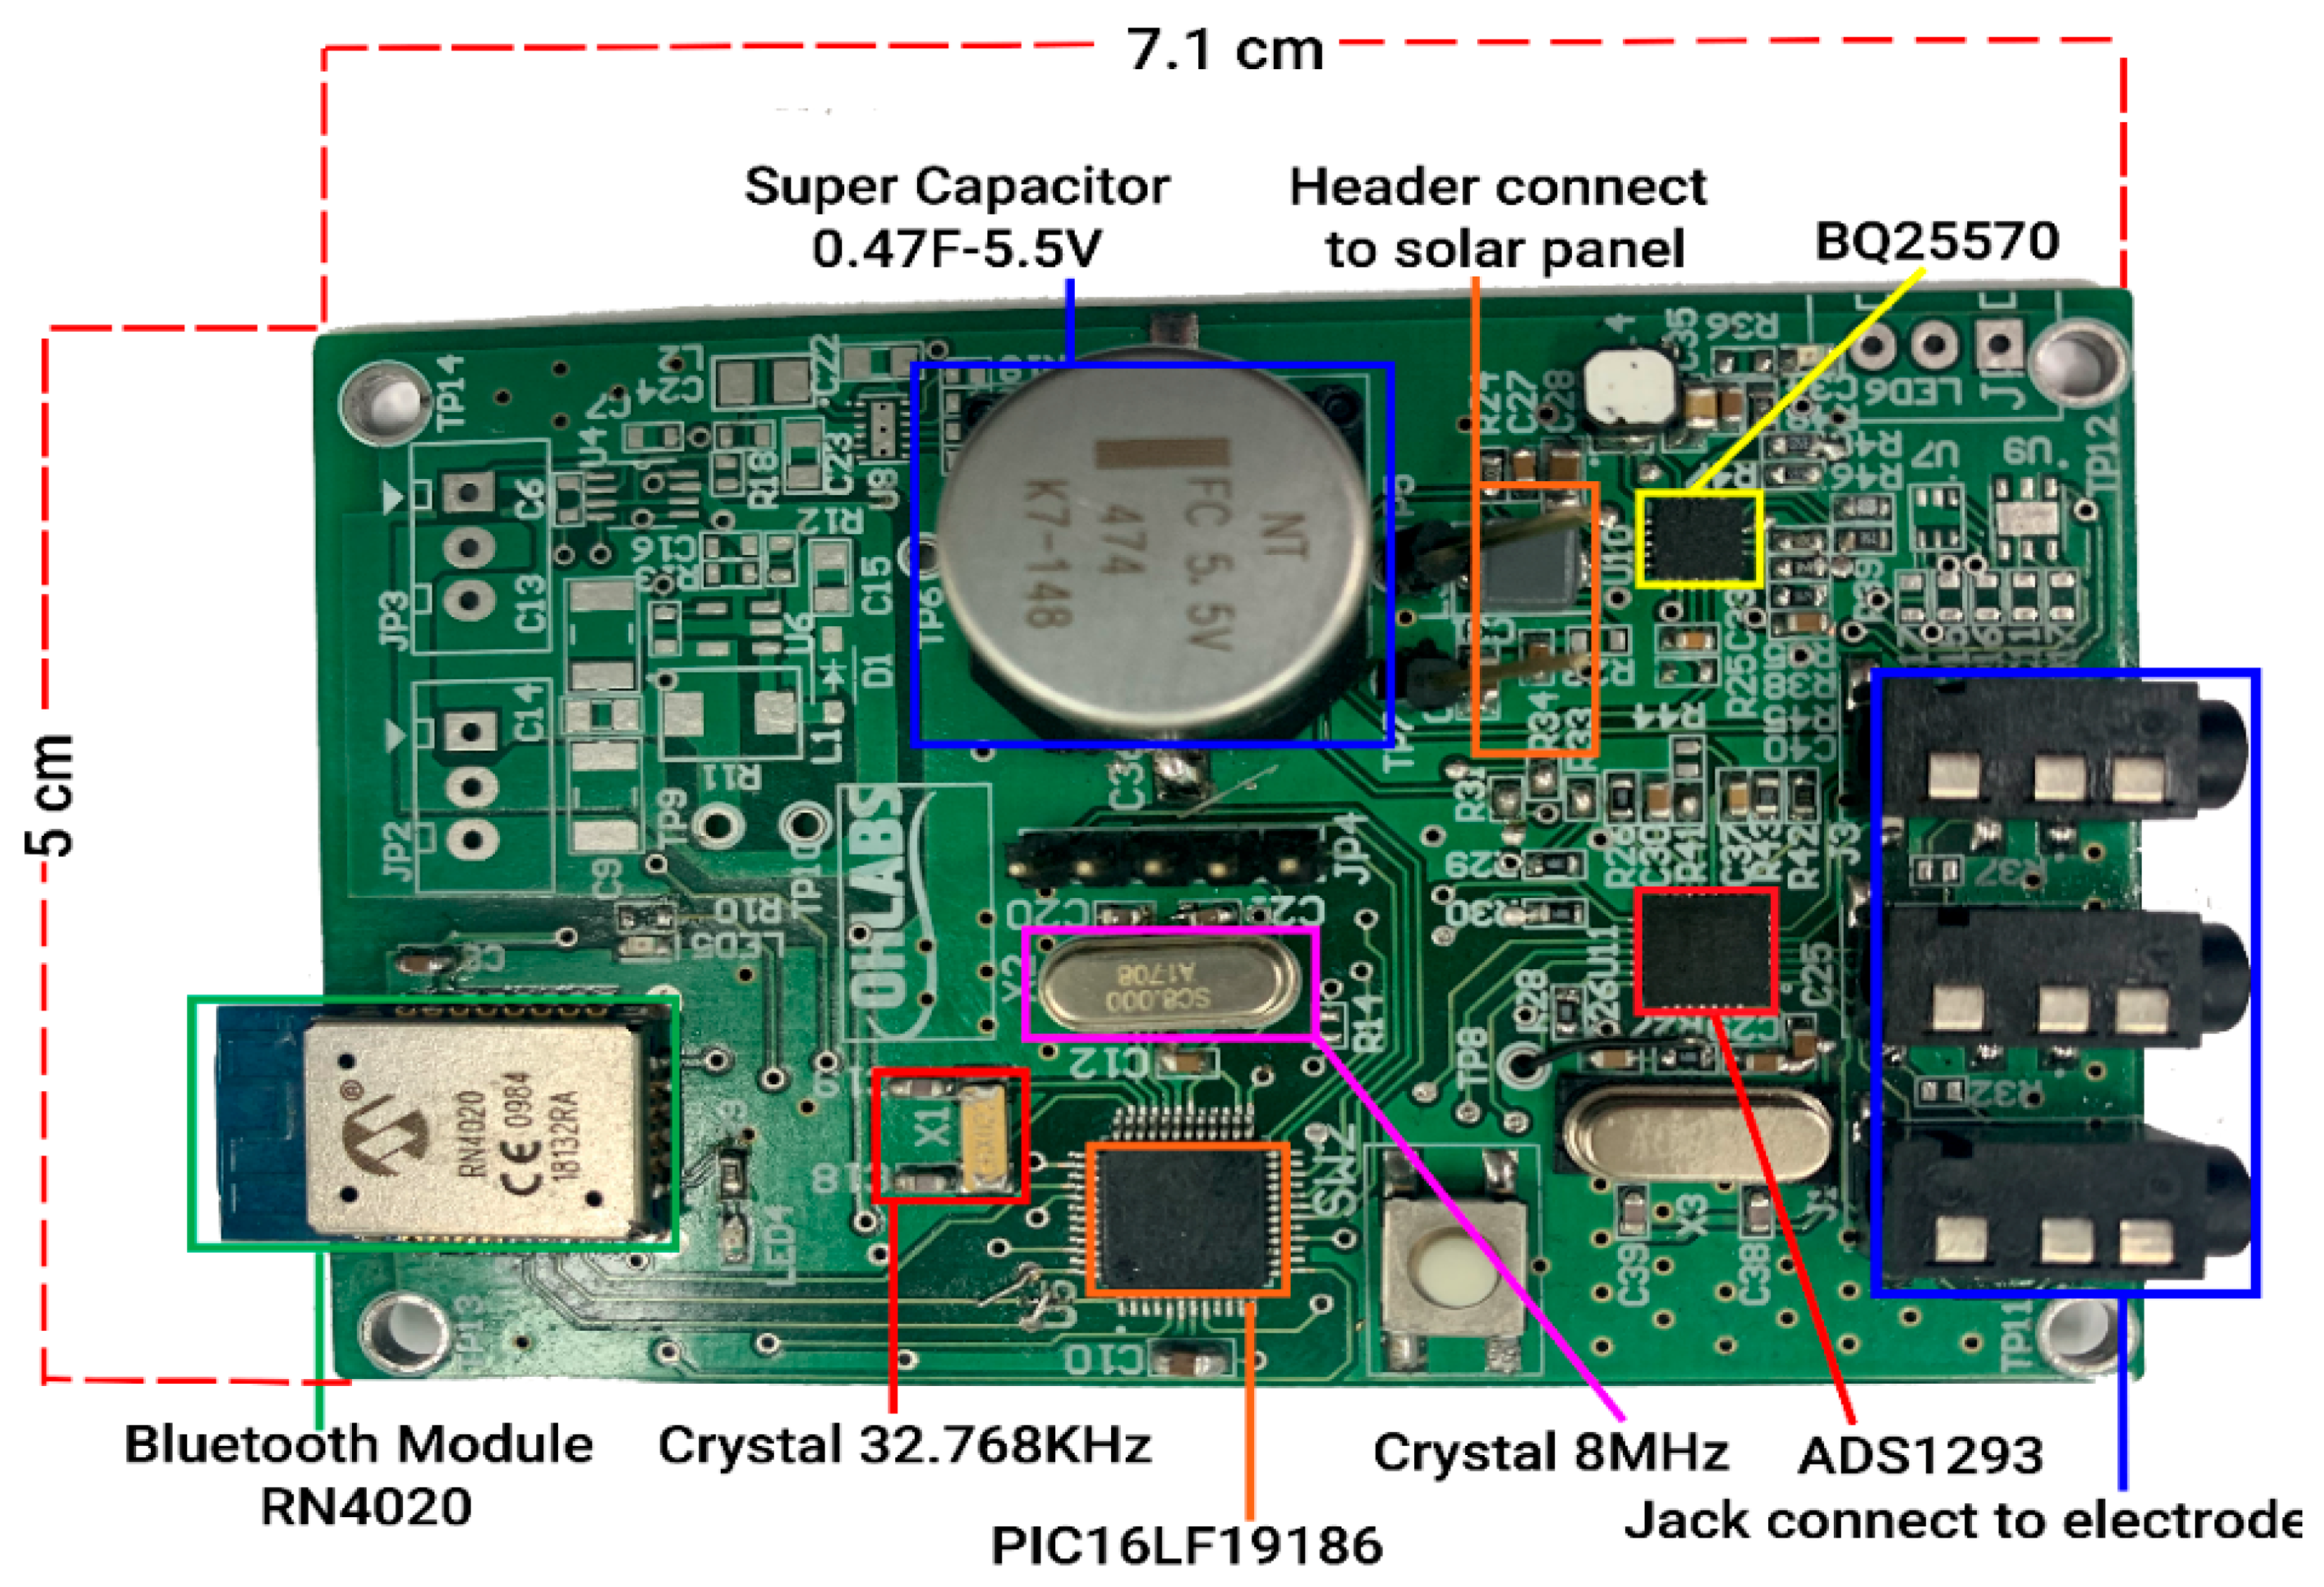
The ECG monitoring device is illustrated in Figure 1. In this design, up to five electrodes are used to collect three-channel ECG signals from the human body [17]. Five electrodes are attached to the patient’s chest and abdomen. The simple paste method is used to attach the electrodes to the patient. The ECG was designed with four main modules. The first one is the solar energy harvesting module, including a solar panel, solar energy harvester BQ25570, and a supercapacitor to store energy from the solar panel. The second module is an analog front-end module with the use of low power integrated analog front-end ADS1293. The third module is Bluetooth with a Bluetooth low energy (BLE) module RN4020. The final module is MCU with the use of an extreme low power (XLP) device (PIC16LF19186) for optimal power consumption.
As schematized in Figure 1, the recorded signals from ECG devices are transmitted to a smartphone or personal computer (PC) via Bluetooth [6,10,20]. Application software is developed based on smartphones to observe patients’ ECG signals in real-time. The patient’s ECG signals can also be collected by PC and then data analysis software is used to find abnormalities in the heart rate with a high accuracy. Doctors can use these results for further diagnosis.
2.1. Hardware Design
2.1.1. Solar Energy Harvesting
According to the manufacturer’s datasheet, we synthesize operating voltages and current consumption of the three main components, which are PIC16LF19168 [18], ADS1293 [17], and RN4020 [19] in Table 1.
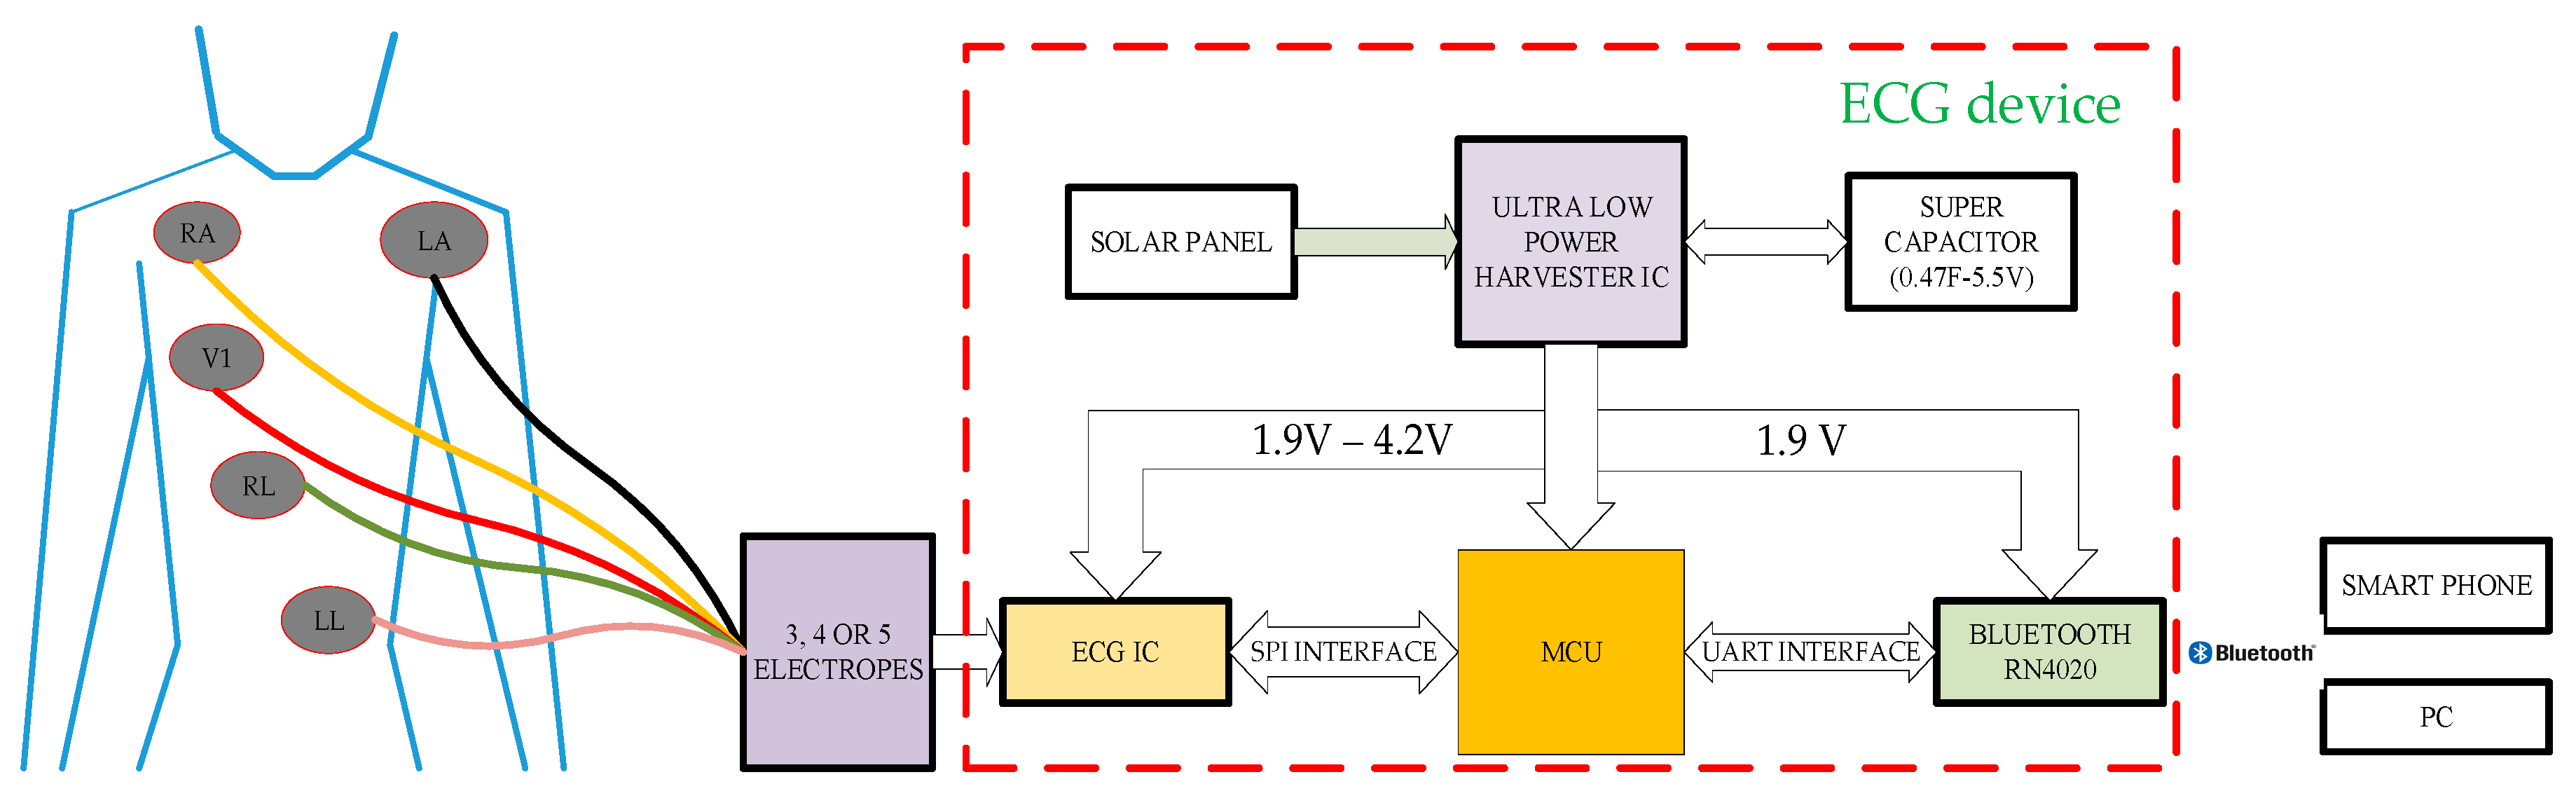
Following Table 1, the main components in the design can operate from 1.8 V but to ensure the stability of the design, the operating voltage of the main parts is 1.9 V. The block diagram is described in Figure 2. The power supply module for the entire design includes BQ25570 [23] energy harvesting integrated circuit, solar cell (2.4 V, 250 mW), and 0.47 F - 5.5 V supercapacitor. The BQ25570 [23] is configured with an output voltage of 1.9 V to be compatible with all other modules in this system and to optimize the lowest power consumption level. The voltage used to charge is 4.2 V with this voltage supercapacitor, and it can store more power than the configuration at 1.9 V voltage and is easily compatible with some rechargeable batteries operating at voltage 3.0 V in cases where you want to use rechargeable batteries for supercapacitors to create design flexibility.
In this design, we used supercapacitors to store energy from solar cells. Under normal working conditions, solar cells provide power to the device and charge the supercapacitor. When there is not enough solar energy to supply the main circuit, the energy will be discharged from the supercapacitor to supply the system. The charging time for supercapacitors is tested and shown in Table 2 with different electrical values and voltage applied to the main circuit board [23].
Calculation of the energy stored in a capacitor is as follows:
where E is energy stored in capacitor (J), V signifies capacitor voltage (V), and C is capacitance of capacitor (F). In this design, when V = 4.2 V and C = 0.47 F, E = 4.1454 (J) = 1.25 (mWh).
2.1.2. Design of Low Power Analog Front-End and Bluetooth Module
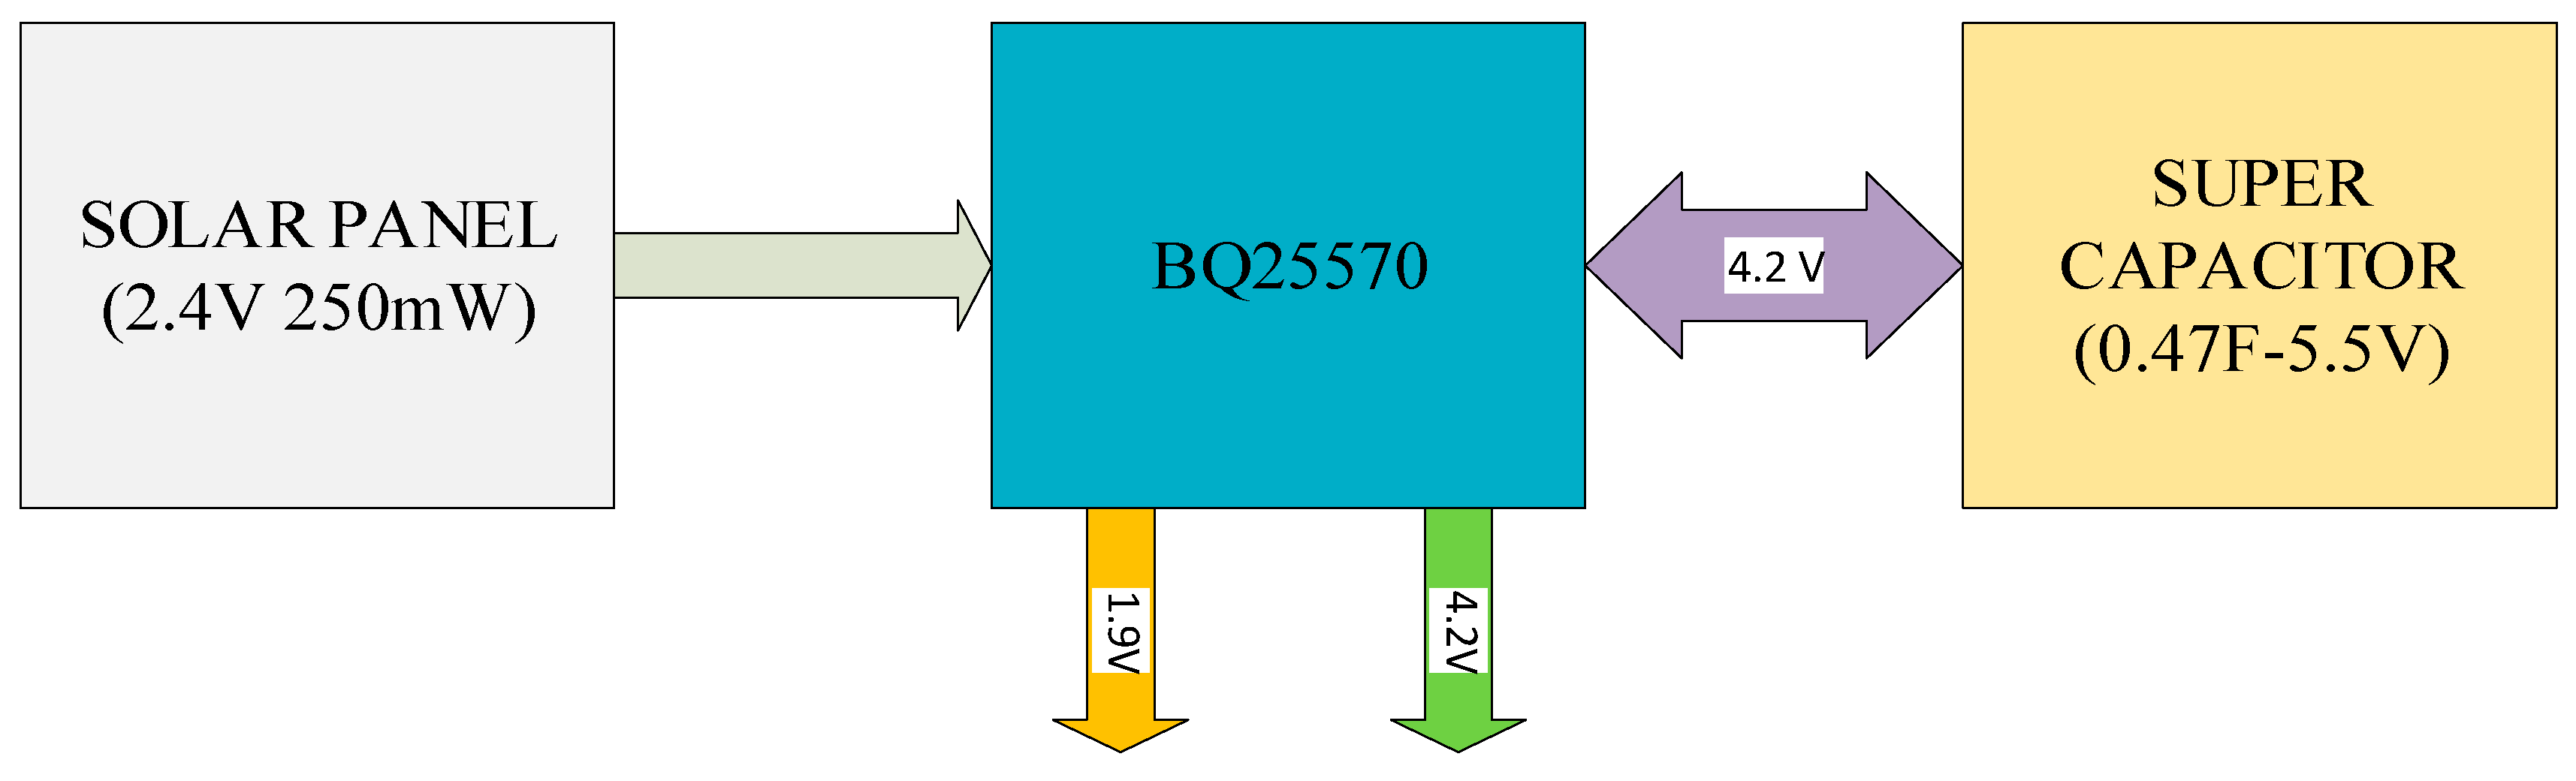
The structure of the ECG monitoring device is shown in Figure 3. It mainly consists of four analog modules that collect ECG signals from the human body and the processor interfaces with Bluetooth 4.1 through an enhanced universal synchronous asynchronous receiver transmitter (EUART) [18]. The serial peripheral interface (SPI) module is used for communication with an ADS1293 chip with the frequency of the SPI module (2 MHz is used in this design) [17,18]. The interrupt-on-changed module is used to detect the time of data in the ADS1293 chip that is ready to read. The timer’s module is designed with a resolution of 16-bit. For the ECG analog front-end module, we used an ADS1293 chip, which has an operating voltage from 1.65 V–3.6 V with a digital module and 2.7 V–5.5 V [17] with the analog module, and was specially designed for ECG applications with similar three channels with 24-bit integration to measure biological potential [17,24]. Each channel can be set for a specific sampling rate and bandwidth, with the AC/DC detection electrode dropping out. In this design, we configure the sampling frequency of the chip from 100 Hz to 2133 Hz depending on the data accuracy and data processing capability [17].
The Bluetooth module uses the RN4020 chip, which is a microchip product with an operating voltage from 1.8 V to 3.6 V and a maximum data transfer rate of up to 1 Mbps. Additionally, the module also supports microchip low energy data profile (MLDP) [19] mode, which has been exclusively developed by microchip for its Bluetooth modules, with transfer speeds of up to 115,200 bps. To ensure data transfer speeds with the Bluetooth module and the speed of communication with ADS1293, the MCU is configured to operate at 32 MHz crystal. We used an external crystal of 8 MHz with the PLL mode (×4) because this will consume less current than using the internal crystal [18]. Table 3 describes the voltage supply for all components. The real ECG prototype is shown in Figure 4 and the hardware solar cell and electrode are shown in Figure 5.
2.1.3. Optimization Power Consumption
As we presented in the previous section, the voltage applied to the main components was reduced to very low levels to allow the smallest current to be consumed. However, as PIC16LF18196 and RN4020 Bluetooth modules are the two major energy consuming components in this design, they need to be configured to operate in energy-saving modes to optimize power usage. The Bluetooth module is configured with the smallest transmission power (TX Power −19.1 dBm).
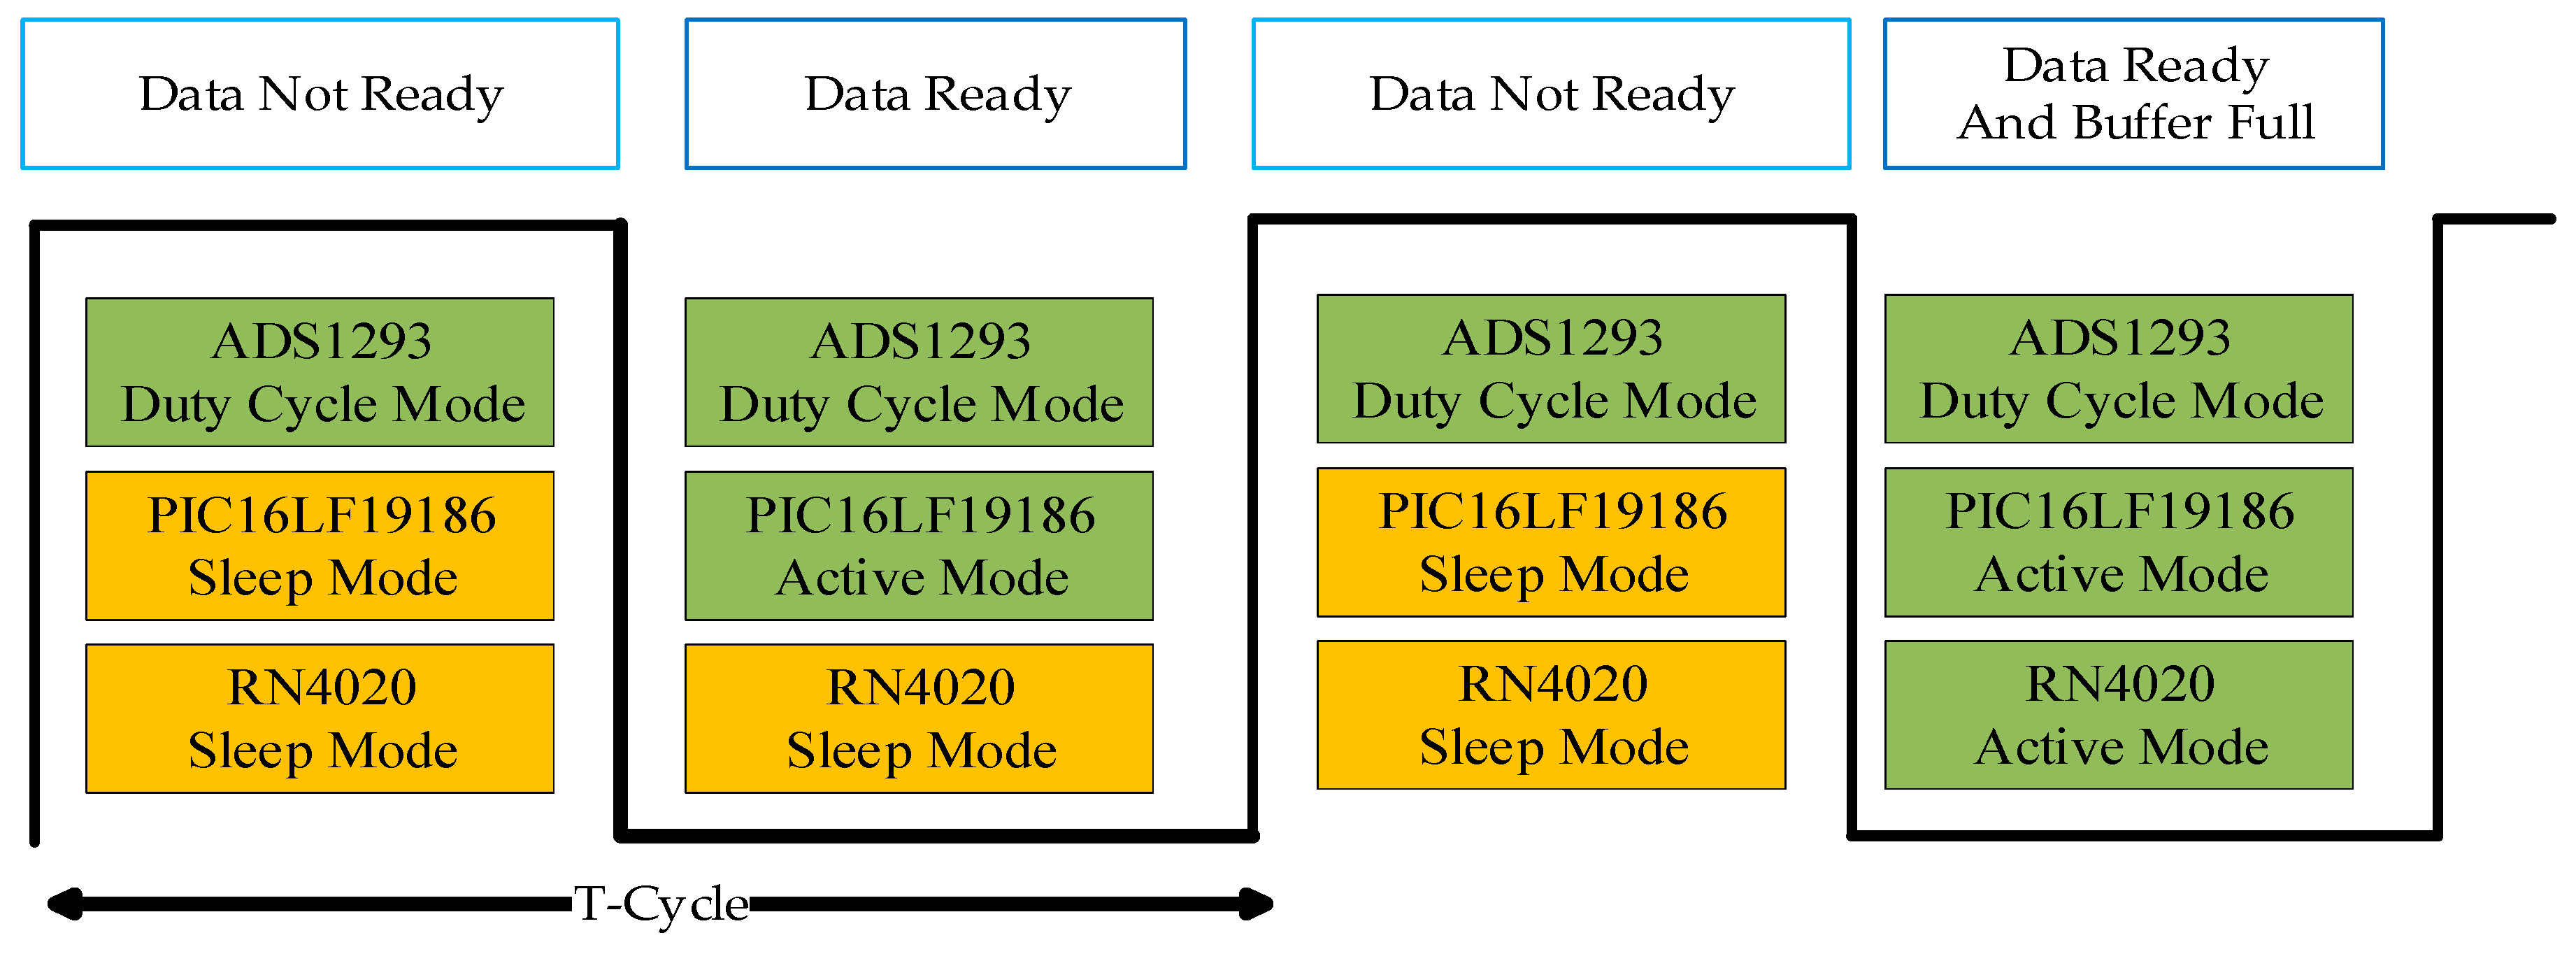
Figure 6 presents the operation of the main components in the firmware of our ECG device [18,19]. In the normal operation mode, MCU operates in energy-saving mode. When the data is ready and there is a signal from ADS1293, these parts go into operation mode and read data and buffer the Bluetooth module data into the active mode to transfer data. Then, the module goes into energy-saving mode.
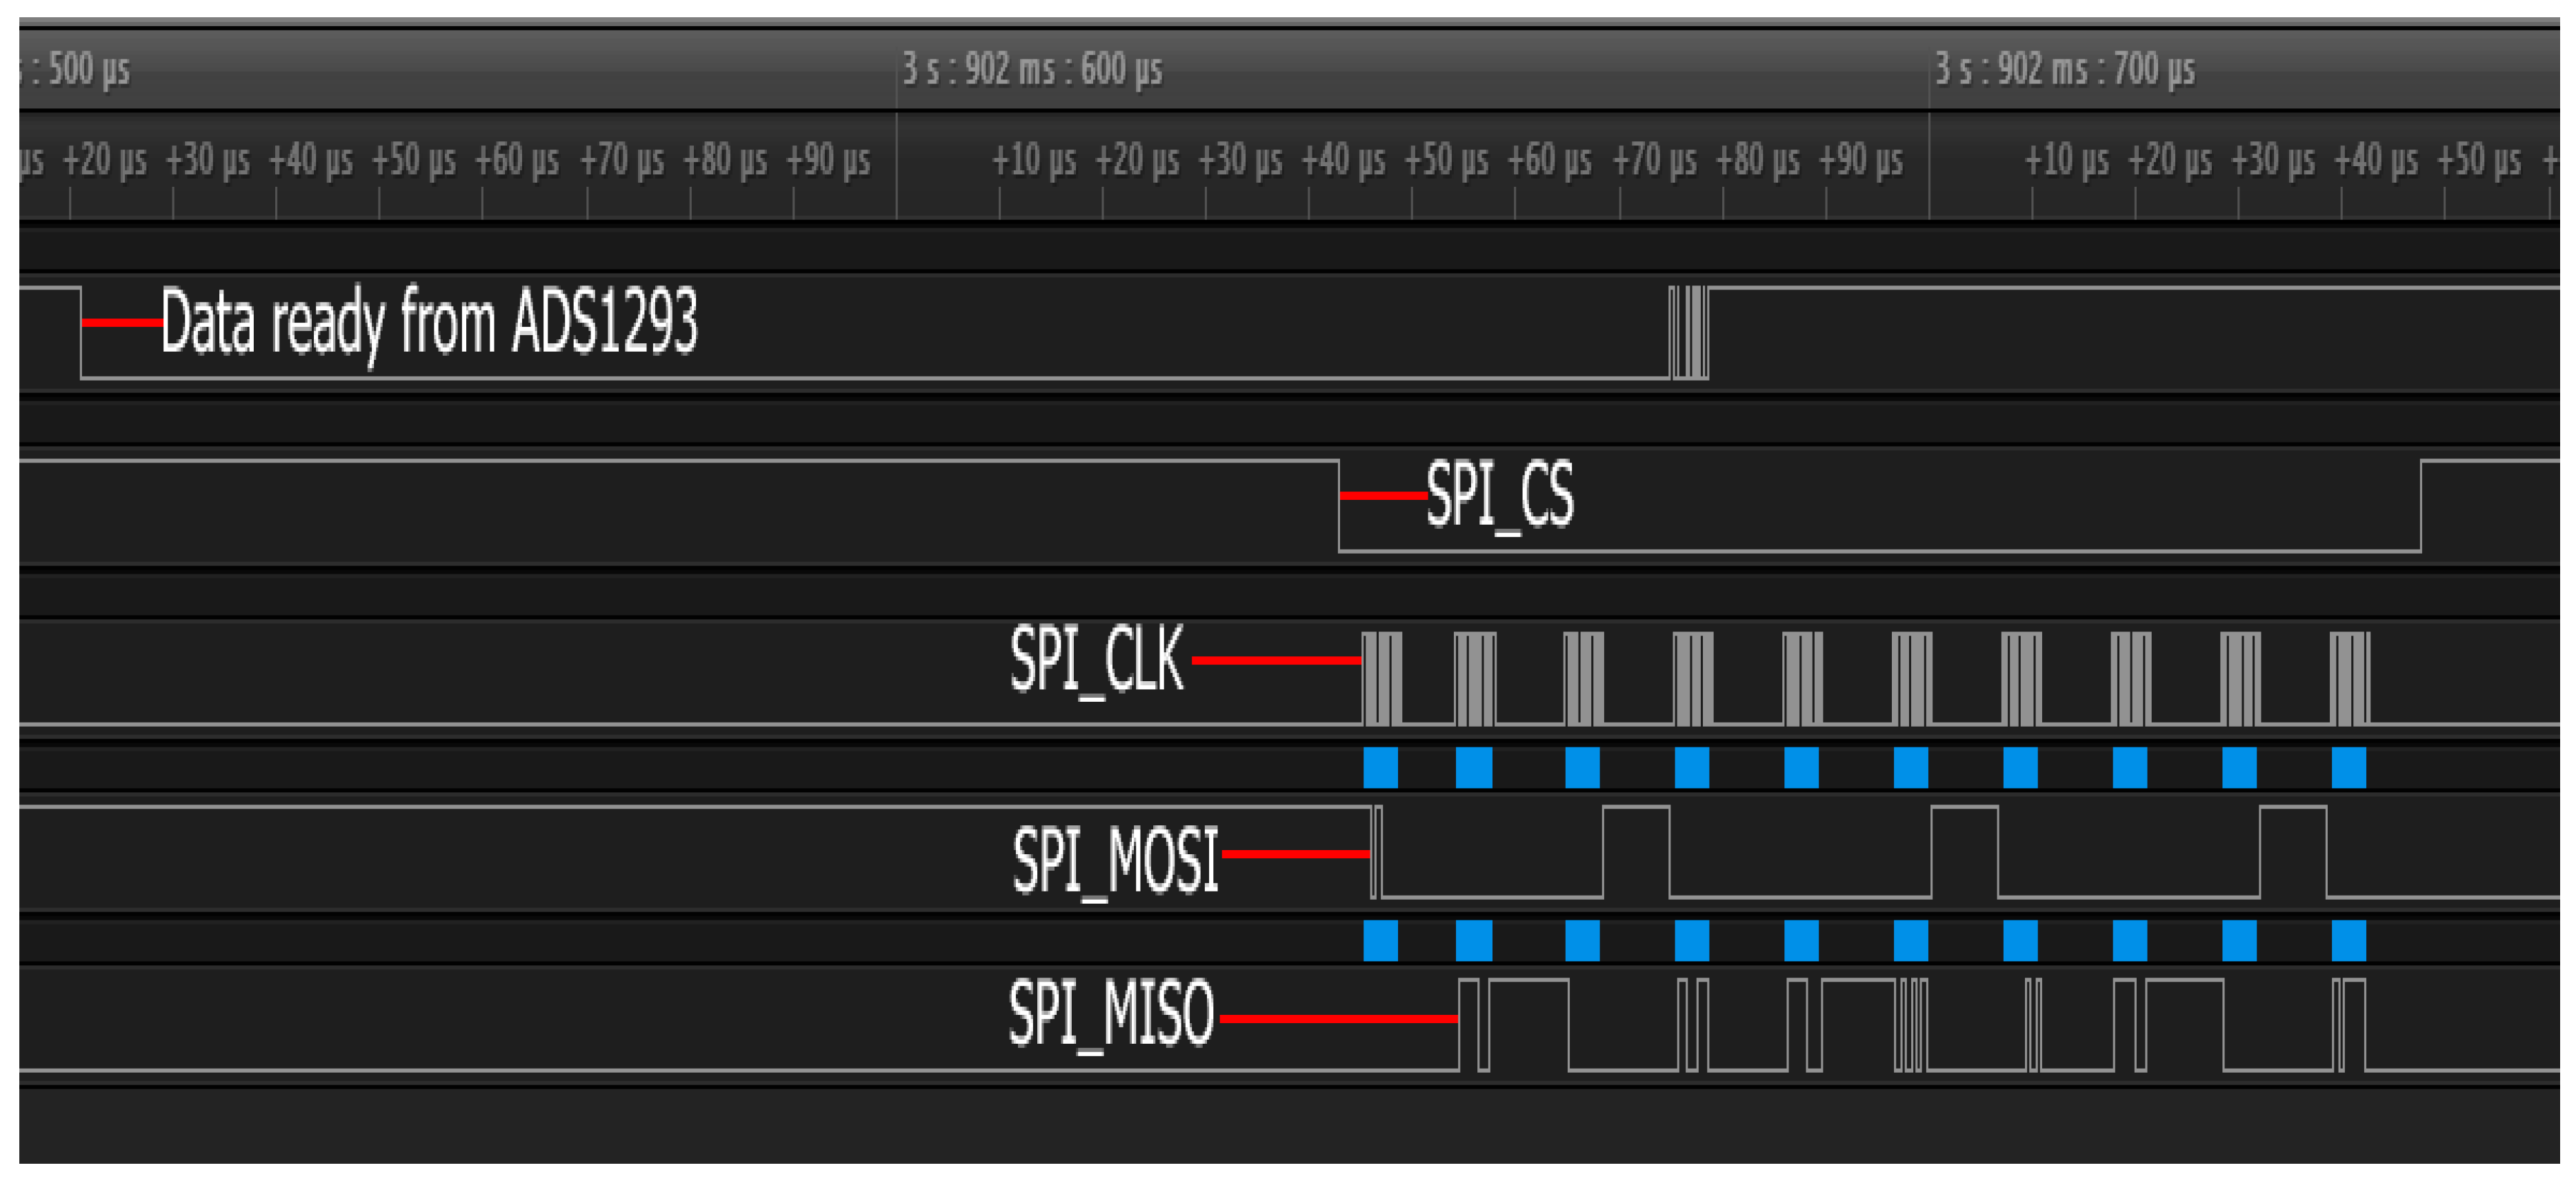
Figure 7 describes the signal type when MCU reads 9 bytes of data from ADS1293 and the communication frequency of the SPI module is 2 MHz. The time PIC16LF19186 receives the data ready signal to read is 0.25 ms. During this time, PIC16LF19186 operates at a maximum frequency of 32 MHz and the current consumption is 1.5 mA.
The total number of analog channels of the ECG device is 3 but due to the data transfer speed limit between the MCU and Bluetooth module (max speed 115,200 bps) [18], with the high sampling frequency, the device cannot transmit all data through all three channels. The details of the relationship between the sampling frequency and the number of channels are described in Table 4.
2.2. Software Design
The ECG signal obtained after passing the analog to digital converter is usually a collection of many signals, including ECG and noise signals [24]. There are many noisesources, but mainly from power line noise (50 Hz or 60 Hz) [25], roaming the base, creating motion, and contact noise hiding a lot of necessary information. For ECG devices with a low sampling frequency, <400 Hz, we have not seen the effect of these disturbances, but when sampling is at a higher frequency, the effect of this noise on ECG signals is quite obvious. In our design, ECG devices can operate at the sampling frequency 2133 Hz, and so, eliminating this noise effect is particularly important. The most important goal is to separate the ECG signal from noises. The high sampling frequency makes the ECG signal more accurate and gives the information needed to detect various cardiovascular diseases. Therefore, before processing the noise-canceling ECG signal, it is important to obtain important features of the ECG signal.
Using the FFT transformation method, we determined the noise of the ECG signal obtained within the frequency range from 0 Hz to 10 Hz. Therefore, we designed a filter in this range to remove noise from the ECG signal. Noise signals from 60 Hz power lines also affect large ECG signals. In order to eliminate these two types of noise in two different frequency bands, we had to design two filters, a low pass filter at 60 Hz frequency and a high pass filter with a frequency of 0 Hz to 10 Hz [21,26].
2.2.1. Designing the FIR Low Pass Filter
FIR filters are widely used due to the powerful design algorithms available for them, their inherent stability when implemented in non-recursive form, the ease with which one can attain linear phase, their simple extensibility to multirate cases, and the ample hardware support available, among other reasons. In this design, we chose to design the FIR filter to eliminate noise signals at 60 Hz. Compared to IIR filters, FIR filters have more linear phase rocks, they are more dominant in quantized designs, and are often deployed in FPGA designs or ASIC [21,27].
2.2.2. Designing the High Pass Filter
Low-frequency components in ECG signals are often generated by motion, respiratory changes, and base wandering. The high pass filter does not reduce signal amplitude like the low pass filter but it does deflect the signal phase. However, similar high pass filters have a 5 to 10 harmonic effect on the signal. This means that a high pass filter of 0.05 Hz, a lower frequency than the heart muscle, can still affect frequencies up to 5 Hz [22].
2.3. Mobile Phone Software
We designed the ECG monitoring system based on the smartphone using low power Bluetooth to communicate with the ECG device. We designed a data package and a data transfer protocol for transmission. Each package contains 800 bytes with one or two analog channels and 810 bytes with three analog channels. The smartphone parses the received data by using the data transfer protocol. With an application on a smartphone, we can reconfigure the sample rate on the device from 100 Hz to 2133 Hz depending on the number of the input channel. From a data package, with 800 bytes per two channels that is mean, corresponding to 400 data points per channel and 810 bytes per three channel, we have 270 bytes per channel. The data transmitted from the collector were received and processed, and ECG signals are separated and extracted [20].
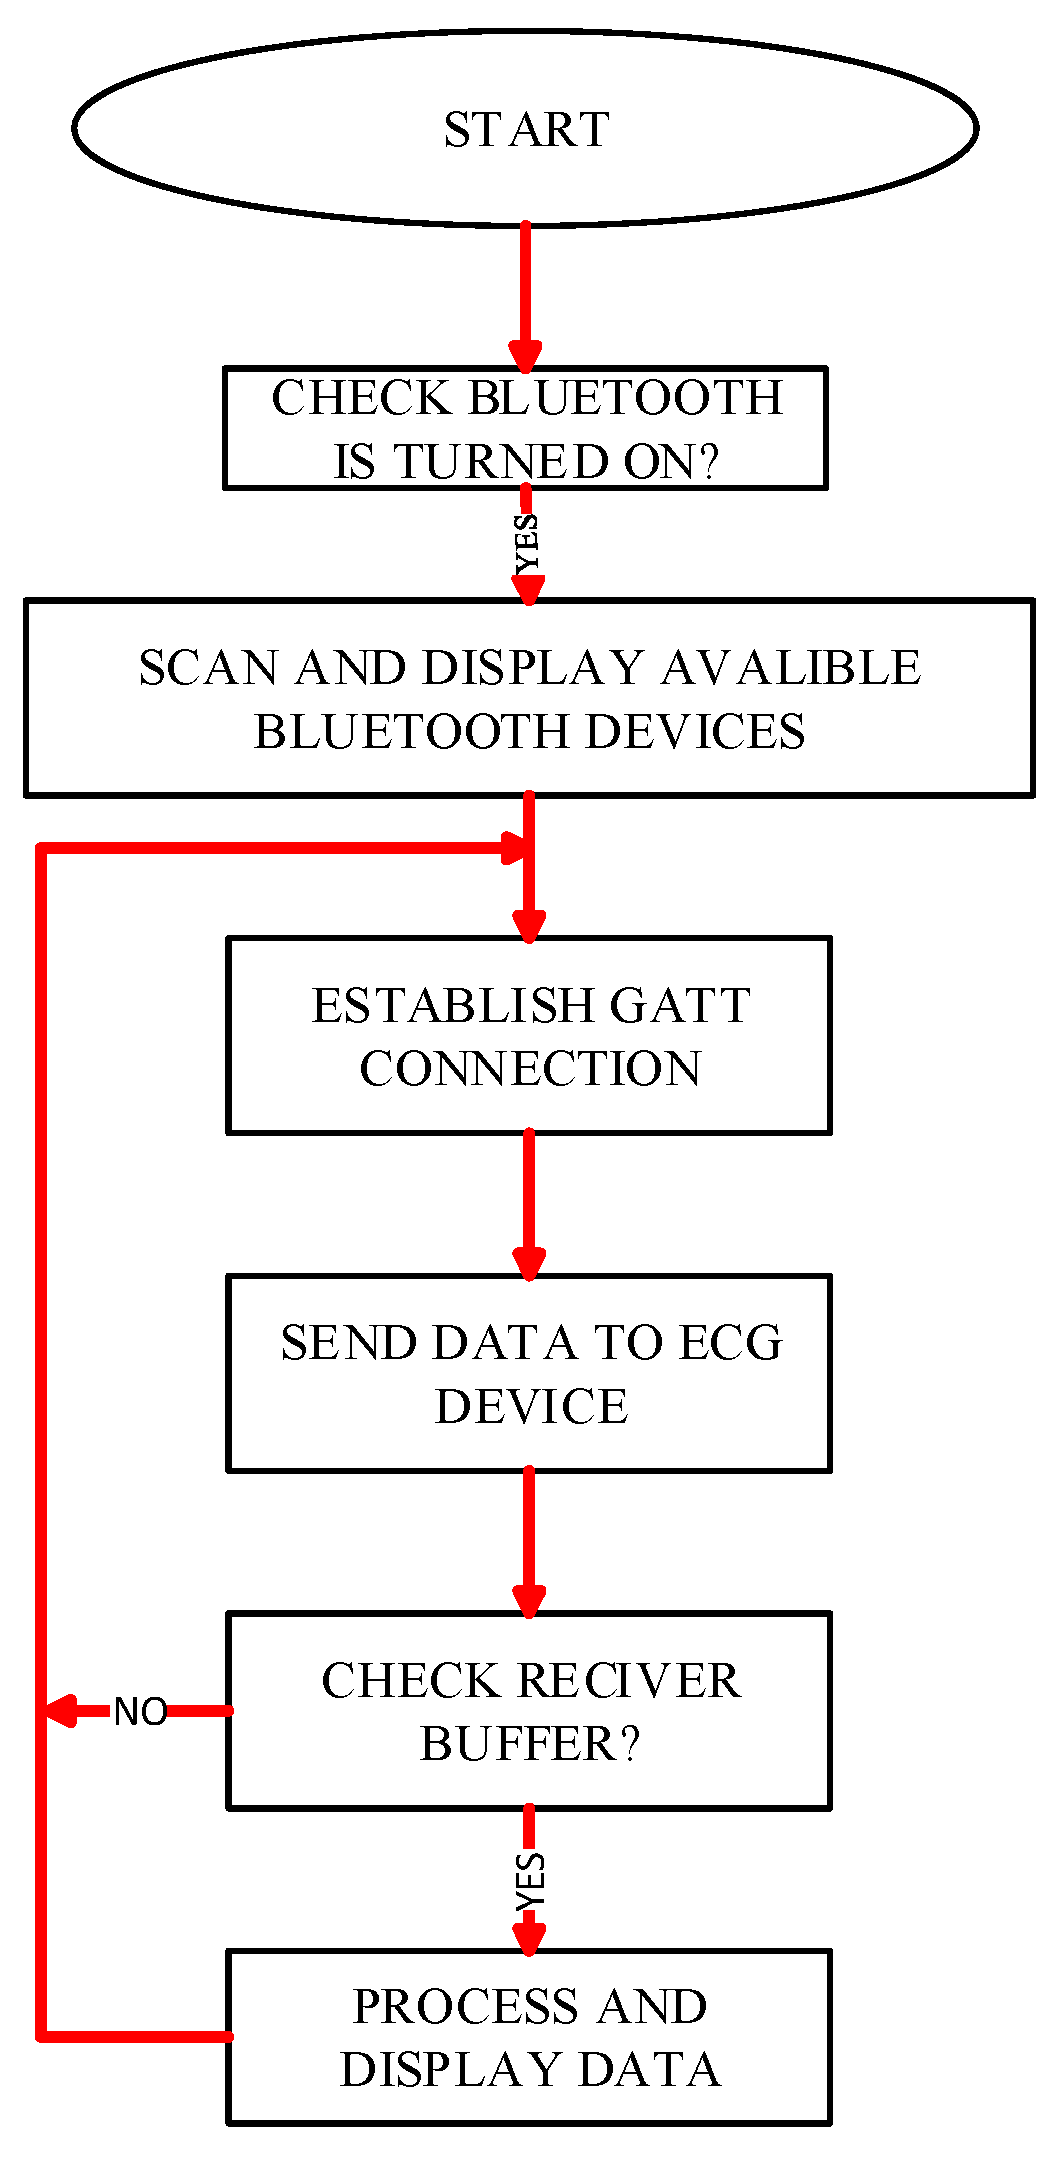
The flowchart of the application on the smartphone is shown in Figure 8. By setting up the service, the application starts preparing (turning on Bluetooth) to scan the BLE and establishing a connection GATT via address. After the connection is made, the smartphone sends the start command to the processor, PIC16F19186. After receiving the command, the processor starts to wake up the ADS1293 chip and collect the data into the buffer; when the buffer is full, they send the entire data from the buffer to the smartphone. Then, the application performs real-time filtering (eliminating baseline drift and high-frequency interference). When the service receives all the data, these data are transferred into the calculation flow and are then displayed. Details of the application modules and the standalone data transfer protocol are described in Table 5, Table 6 and Table 7.
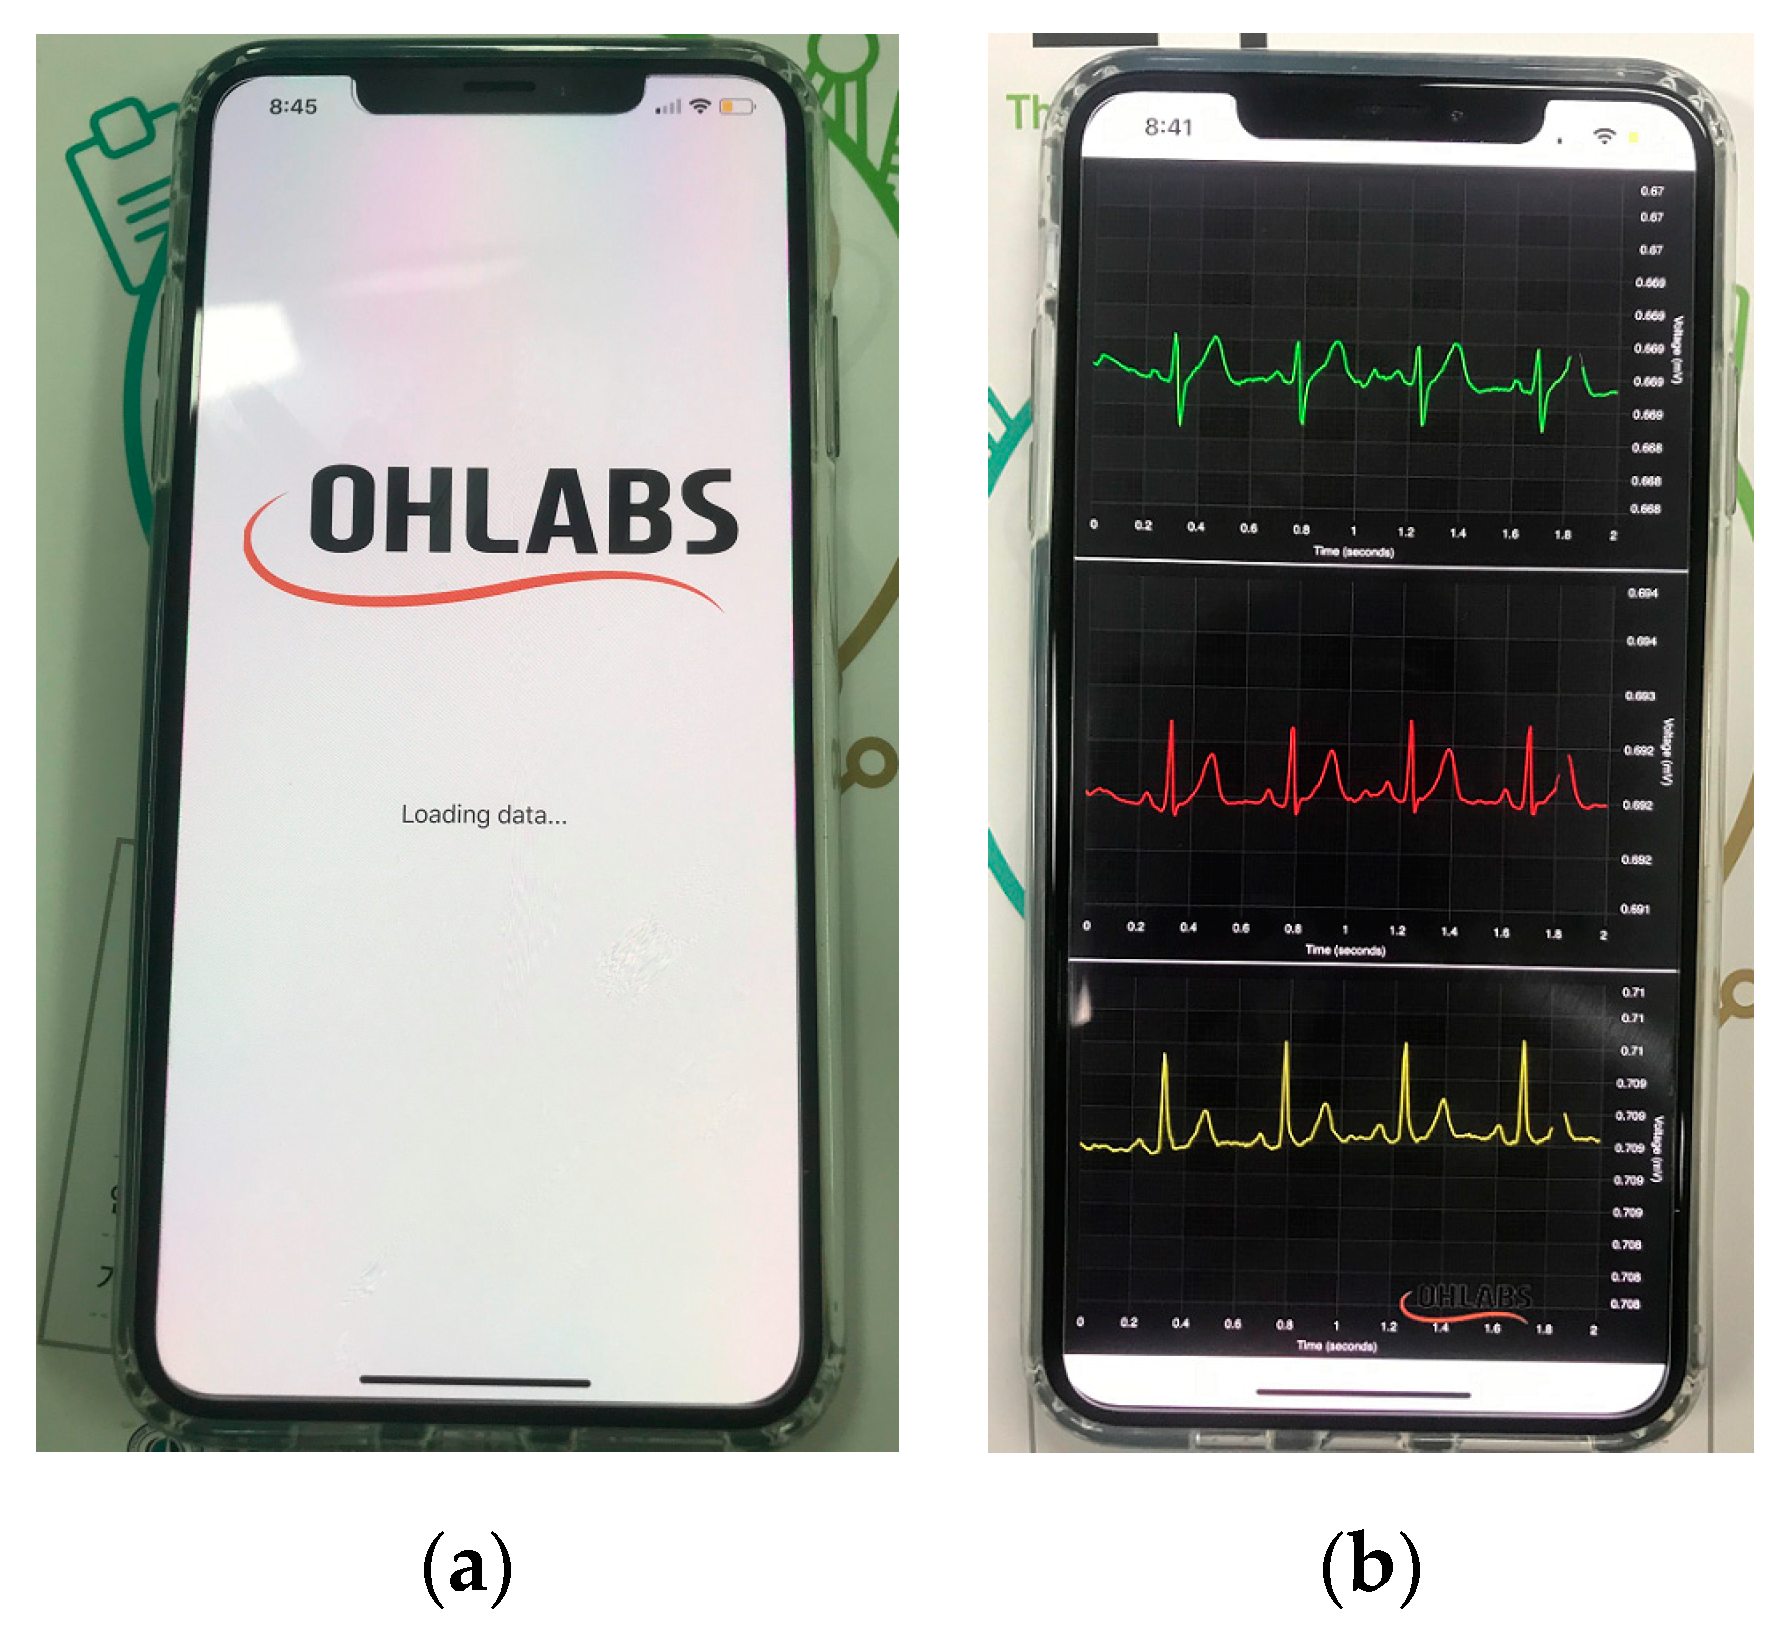
The main user interface of the app is shown in Figure 9. The “ECG monitoring” is used for displaying, in real-time, ECG waveforms and heart rates.
3. Experimental Evaluation
3.1. Testing Power Consumption
In this section, we conducted a measurement of the current consumption of the design at different operating modes in the main components. As shown in Section 2.1.1, operating voltages for PIC16LF19168, RN4020, ADS1293 (digital module) is 1.9 V and ADS1293 (analog module) is 4.2 V. We used Agilent U3606A power supply to create 1.9 V and RIGOL DP832 power devices to generate another voltage supply of 4.2 V. Both devices have an internal built-in current measuring device. The ECG device board has one button which can change the operation mode of the main components. The details of the current consumption of the devices in operation are tested as described in Table 8.
When the buffer in MCU is 810 bytes, MCU will transmit this data via the Bluetooth module at the rate of 115,200 bps, to transfer 810 bytes about 60 ms. During this time, MCU and Bluetooth modules consume a current of 1.5 mA and 3.4 mA, respectively [18,19], while the ECG device operating at 3.3 V current consumption of Bluetooth module will be much higher at about 14 mA.
According to the test results, we can see that the ECG device operating at the voltage of 1.9 V, current consumption without the data transmission process via Bluetooth module is 2.1 mA lower than the device operating at 3.3 V at about 8.2 mA, which is mainly consumed by PIC16LF19186 (operating voltage at 3.3 V and operating frequency at 32 MHz) and Bluetooth module RN4020. Normally, the device operates in Mode 4 to save energy. When the device is preparing to connect to another Bluetooth device for data transfer, it will operate in Mode 3, and after connecting to the Bluetooth device, it works in Mode 2, and while reading data from ADS1293, it works in Mode 1.
For the evaluation of the energy consumption, we conducted ECG testing with many different energy sources. Table 9 describes the operating time of the ECG device with different energy storage devices with a sampling frequency of 100 Hz. This design only supports low power mode at sampling frequency Fs = 100 Hz. Higher sampling frequencies require an external power supply.
3.2. Testing ECG Signal
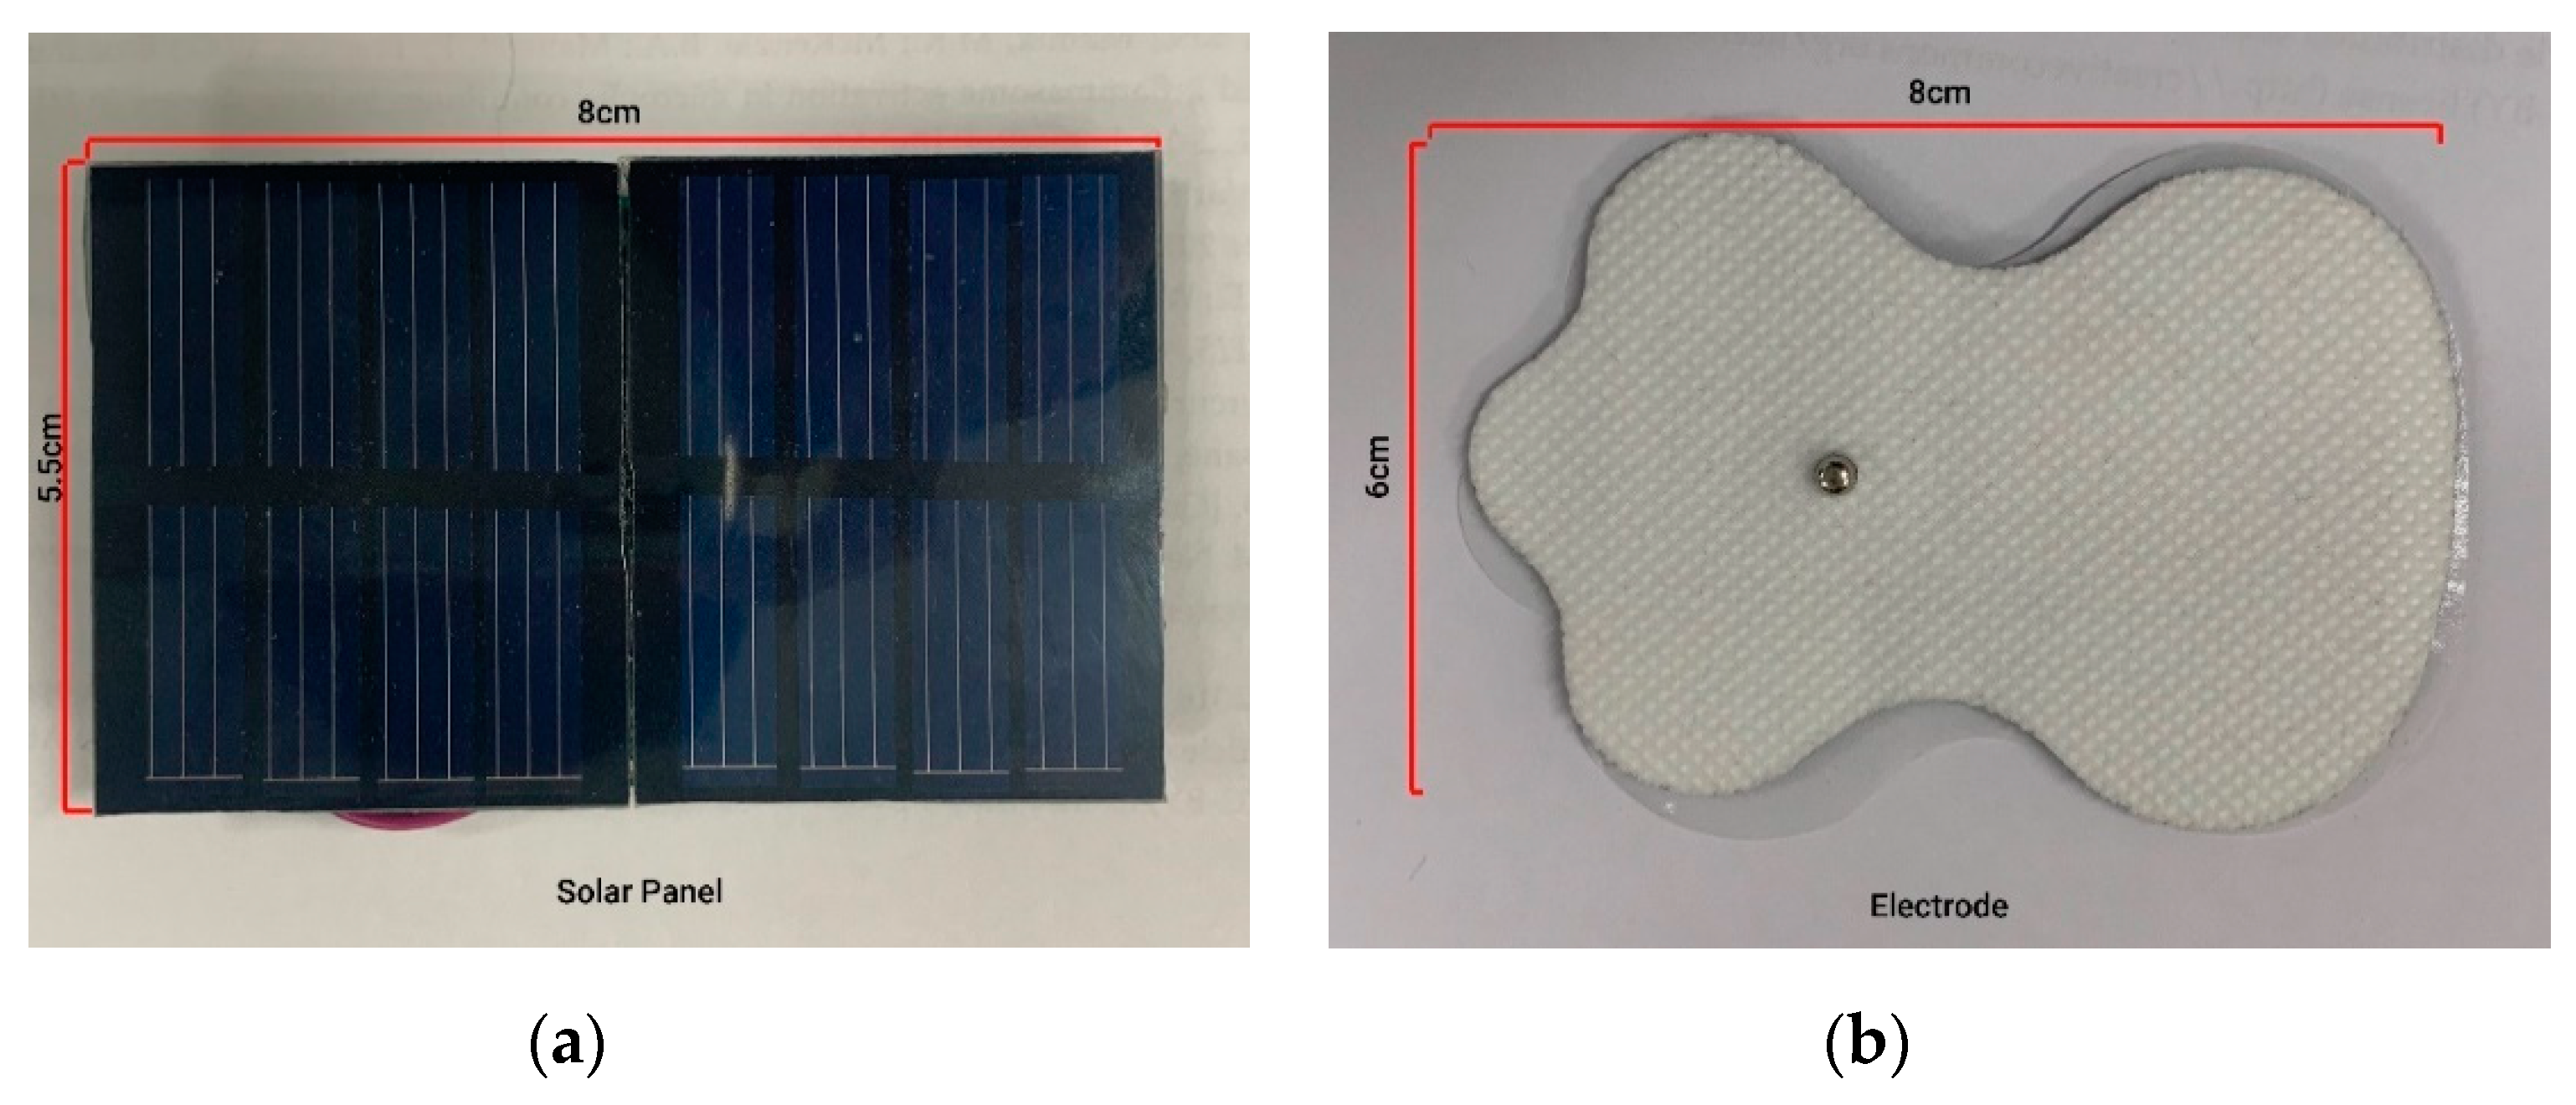
As shown in Table 9, when there is no light, the device operates stably for a short time only 2 s, so to make the device more stable, it is necessary to have a source of solar cells capable of creating large capacity or stable light source. In this design, we use a solar panel with a small size (Figure 5a). In the tests, we performed in an environment with almost no natural light and we used an artificial light source with a total capacity machining of 27 W for solar panels.
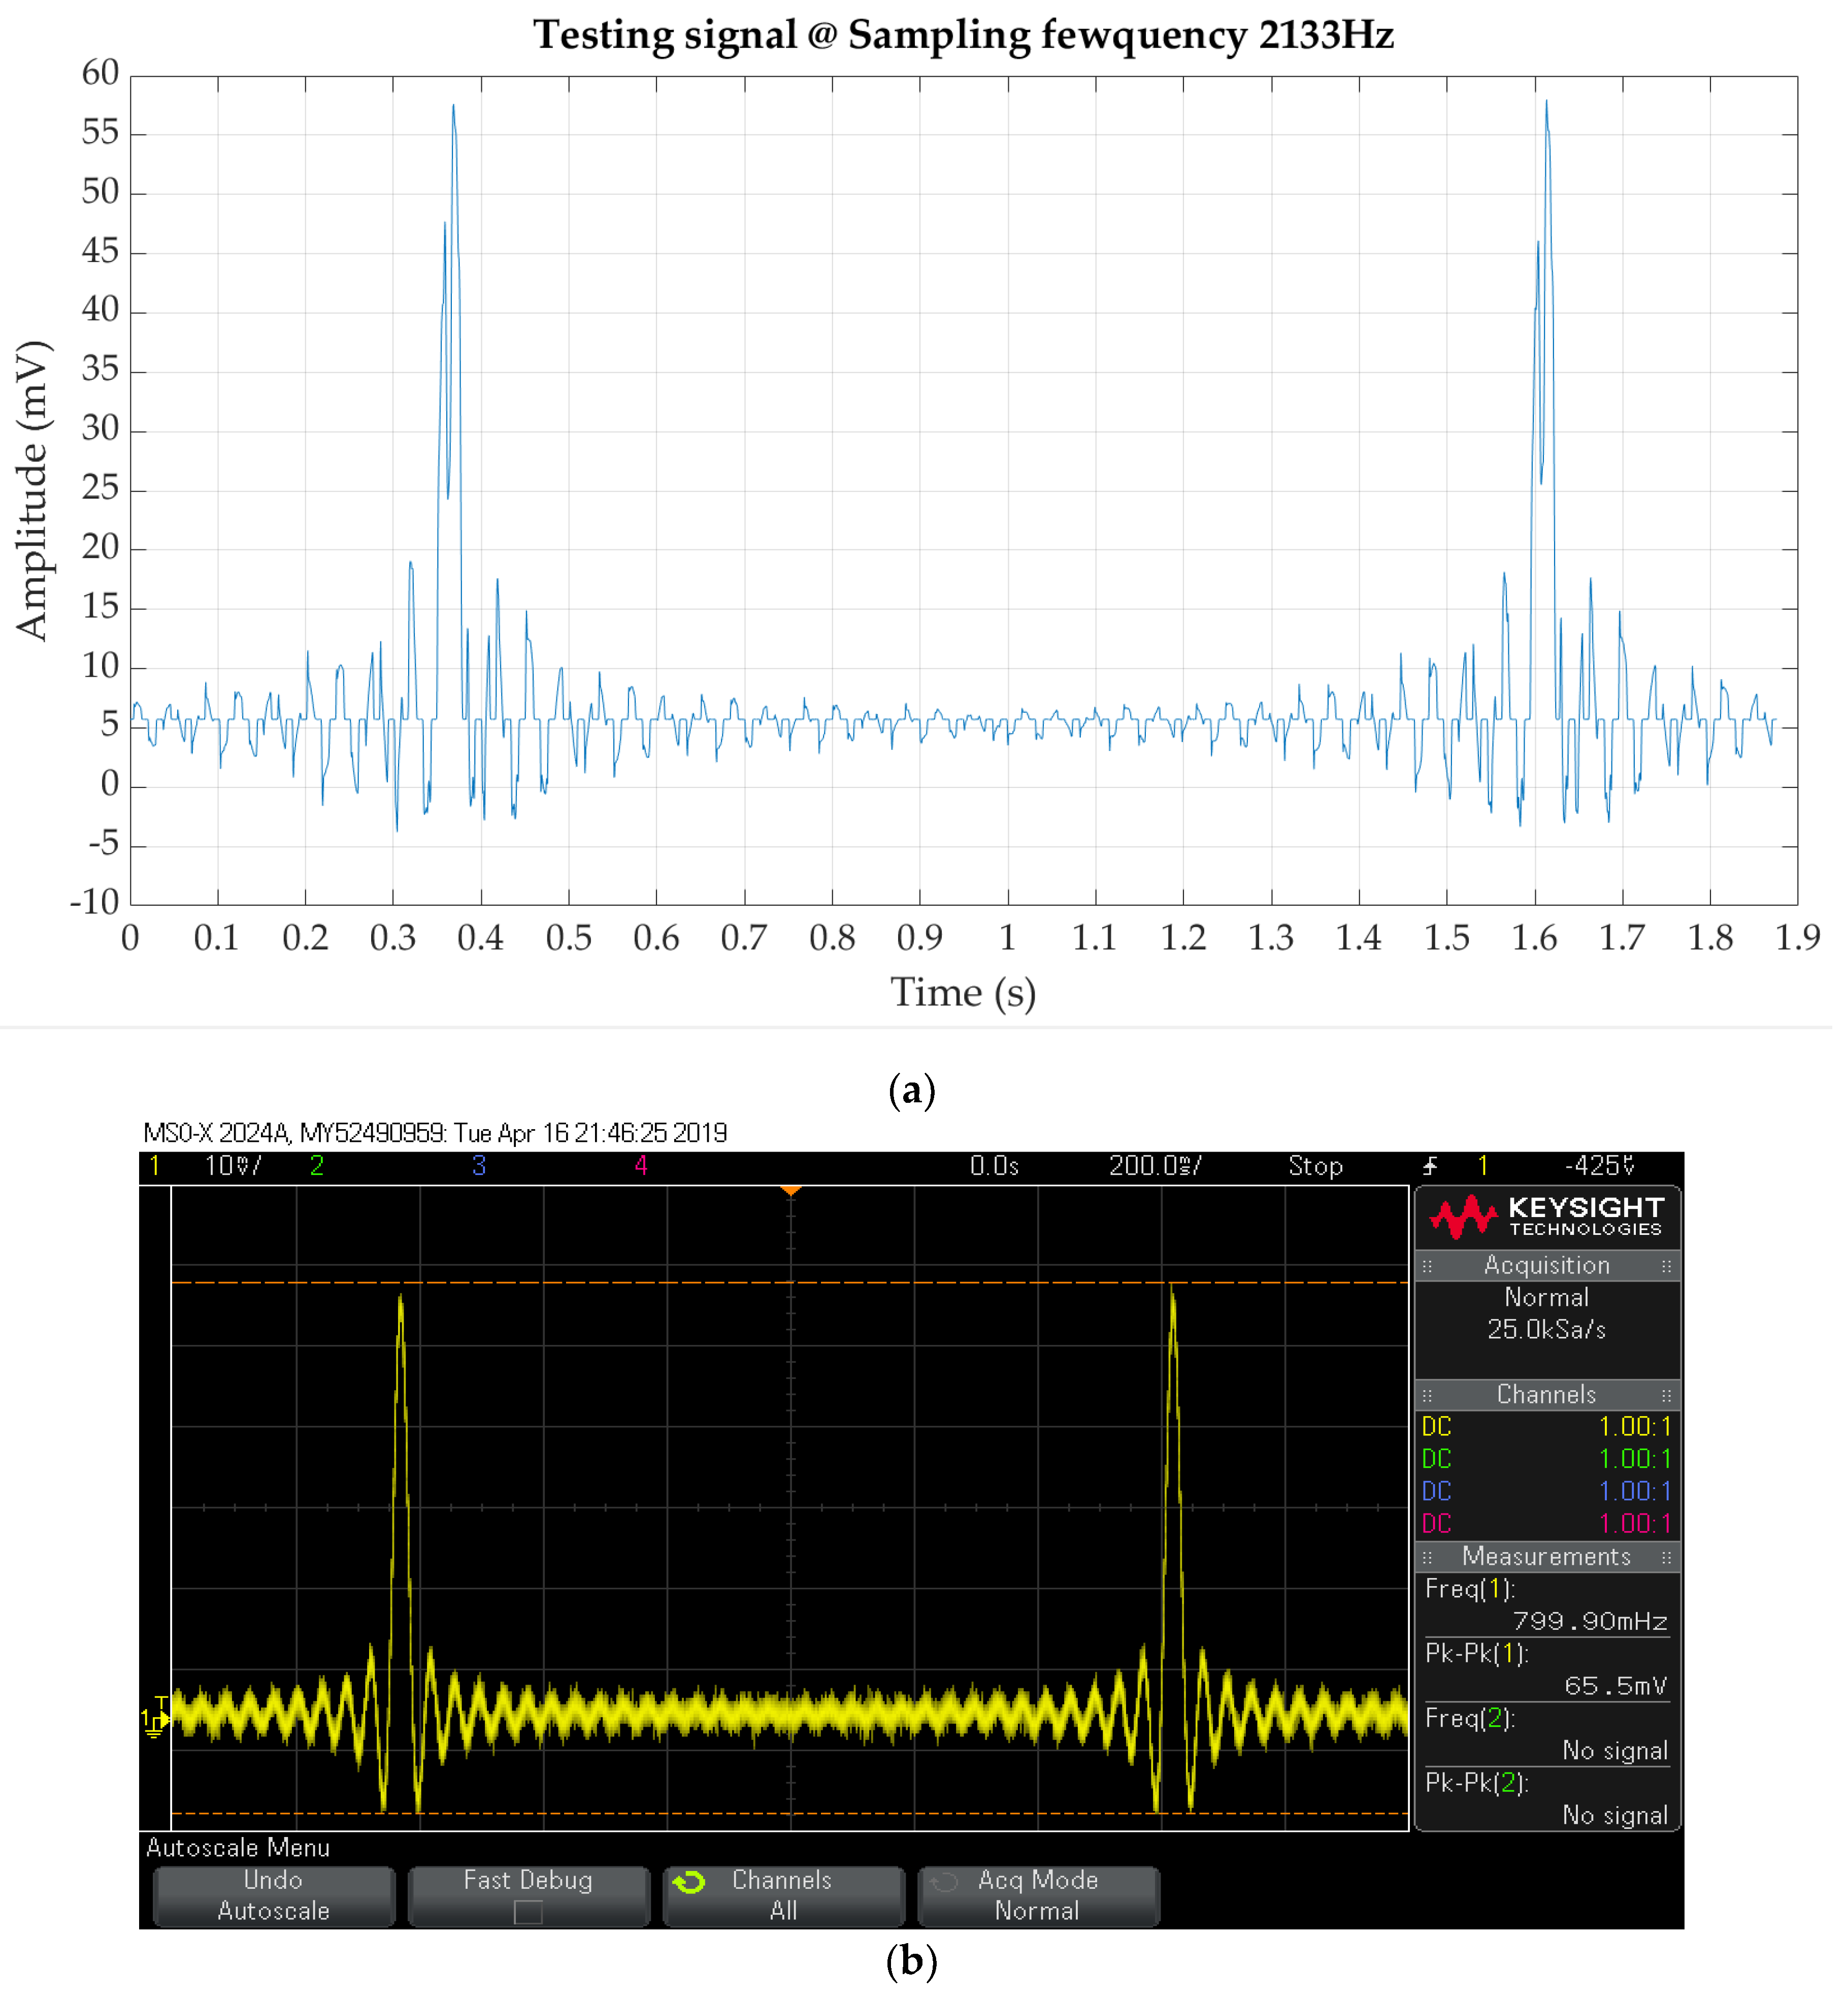
Before using the ECG device in this test with volunteers, we had tested the device’s accuracy with standard devices. The standard device used here is the function generator model Tektronix AFG3252 signaling with a descriptive form close to the human heart rate signal and oscilloscope MSOX2024A to observe and compare signal accuracy. Figure 10 shows the testing signal recorded by the ECG device and the standard device.
Table 10 compares the amplitude and frequency of the testing signal generated by the function generator as recorded by the ECG and oscilloscope. The presented results show that our ECG bit device is highly accurate with small signals such as heart rate signals with a signal amplitude of only several millivoltages.
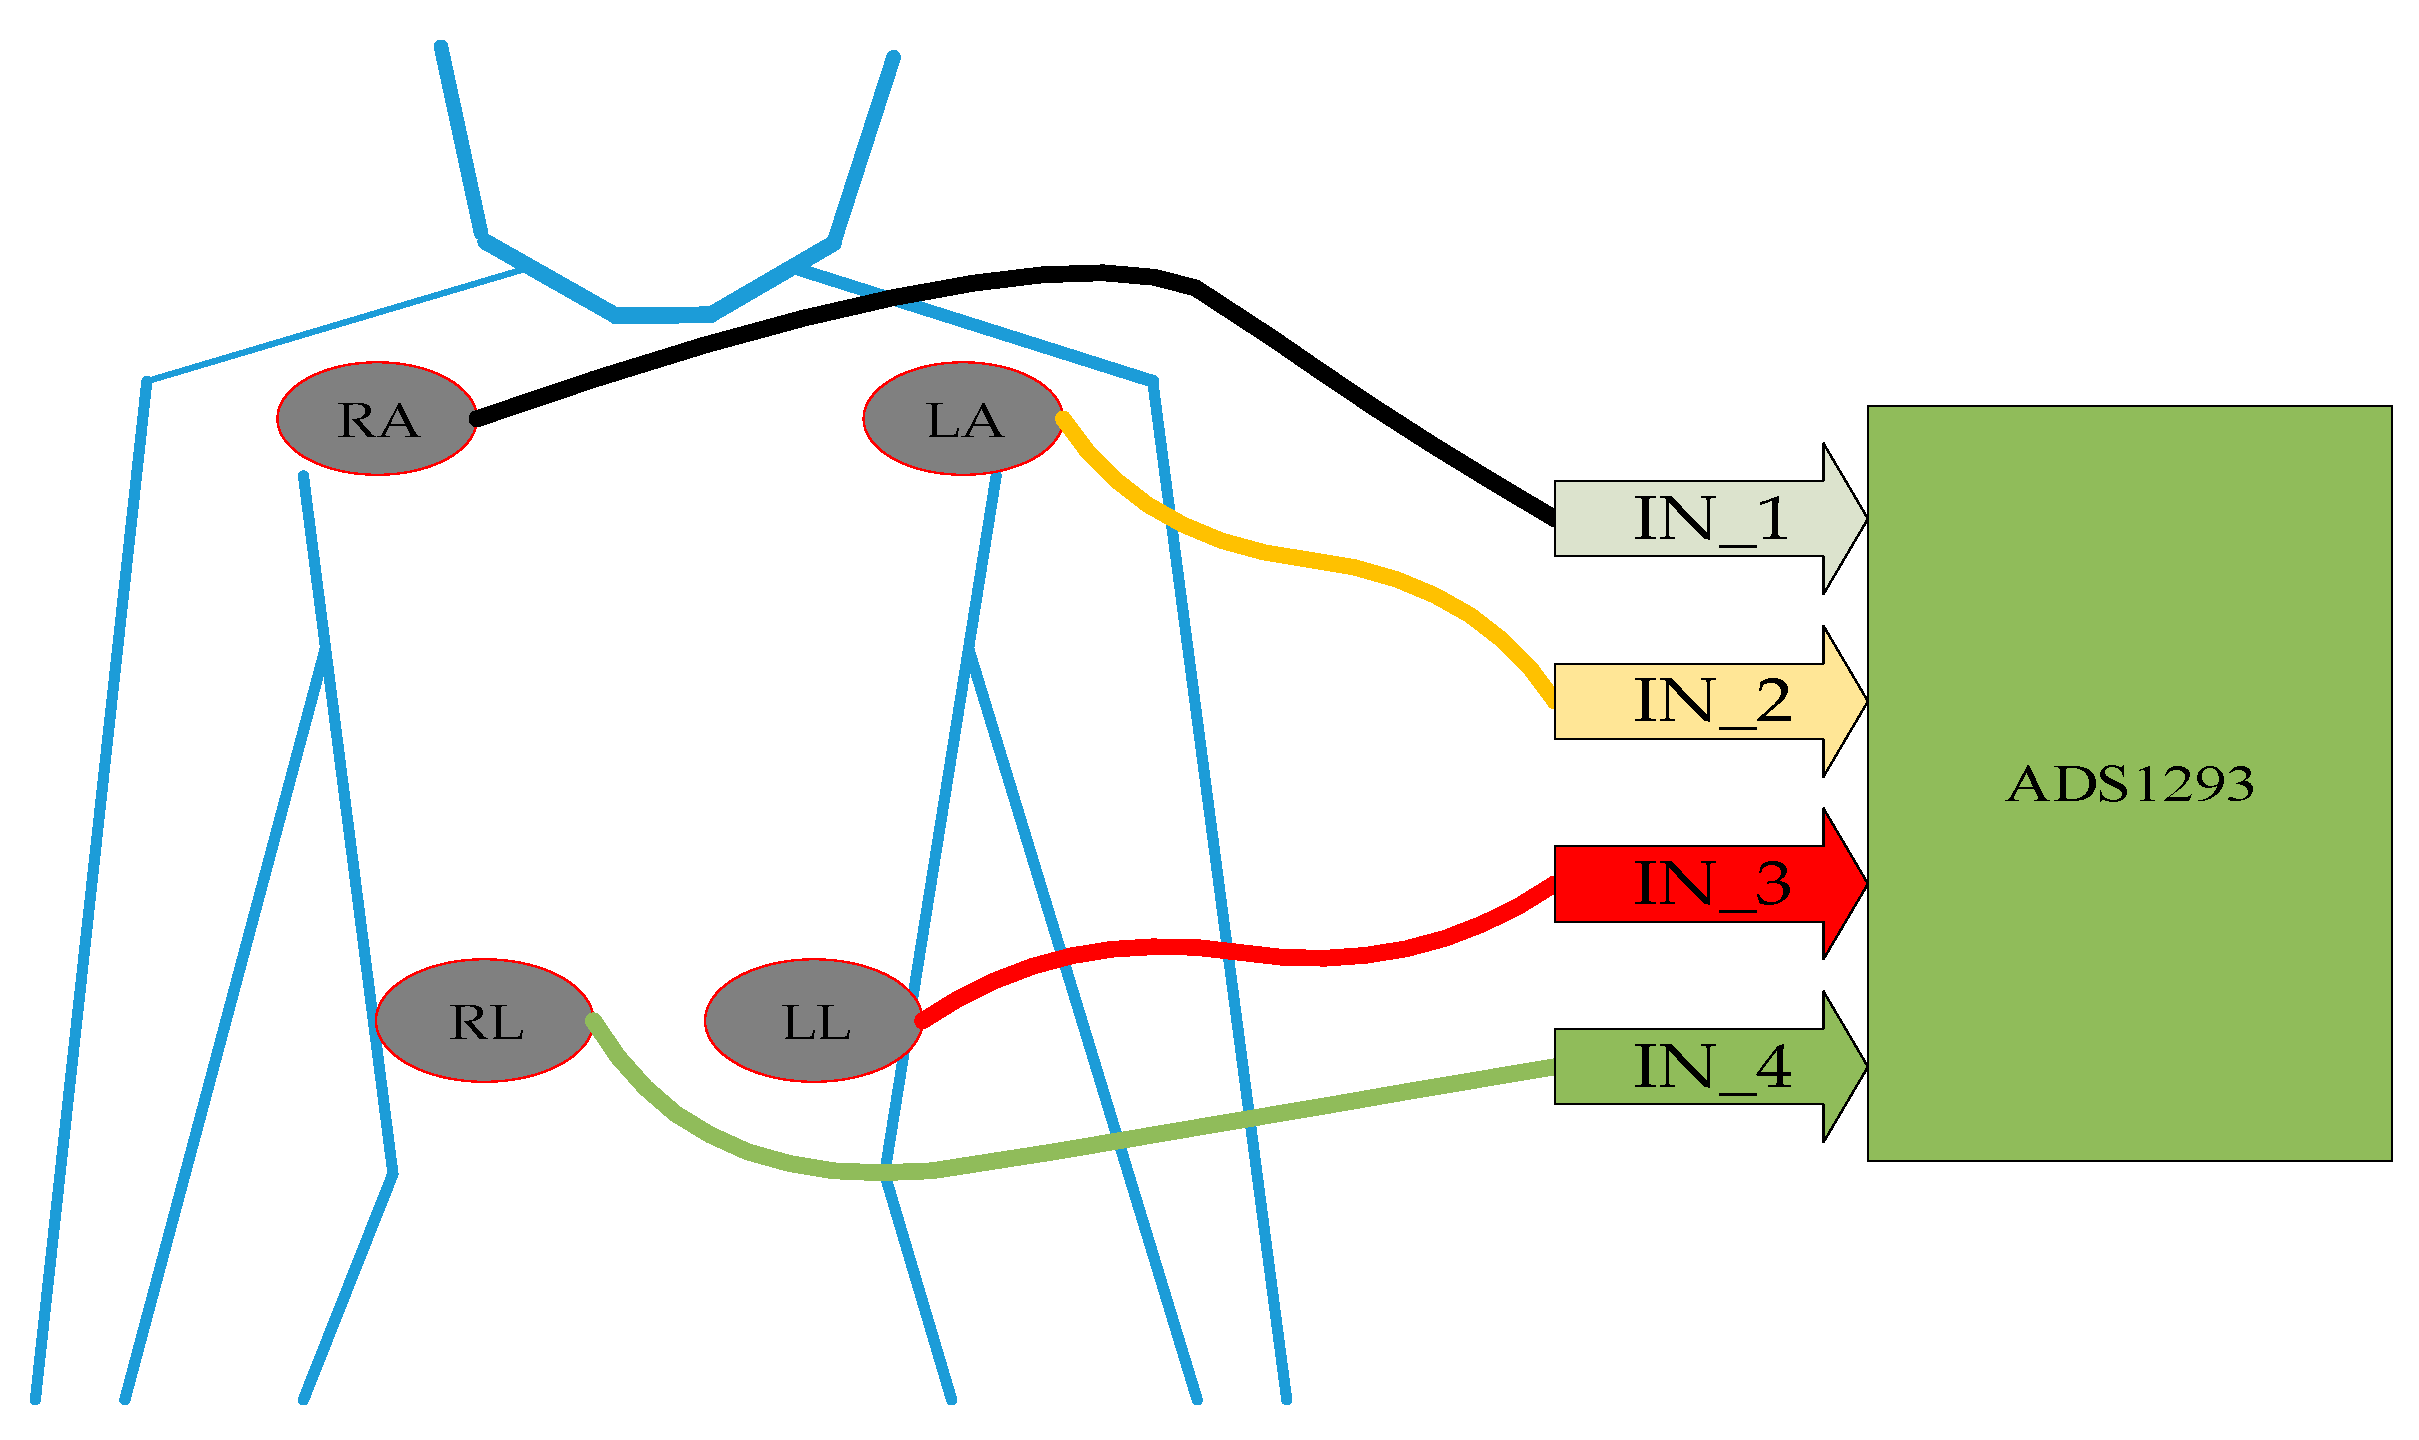
After experimenting with the device generator above with good results, we continued to test the ECG device with a volunteer. Before conducting ECG signal measurements, we set up the system. Volunteers were sitting in a chair and leaning back in a comfortable state. We pasted 4 electrodes on the volunteer and these electrodes are connected to the ECG device as described in Figure 11. During the experiment, the volunteers were quite comfortable and did not have strong movements before conducting the experiment.
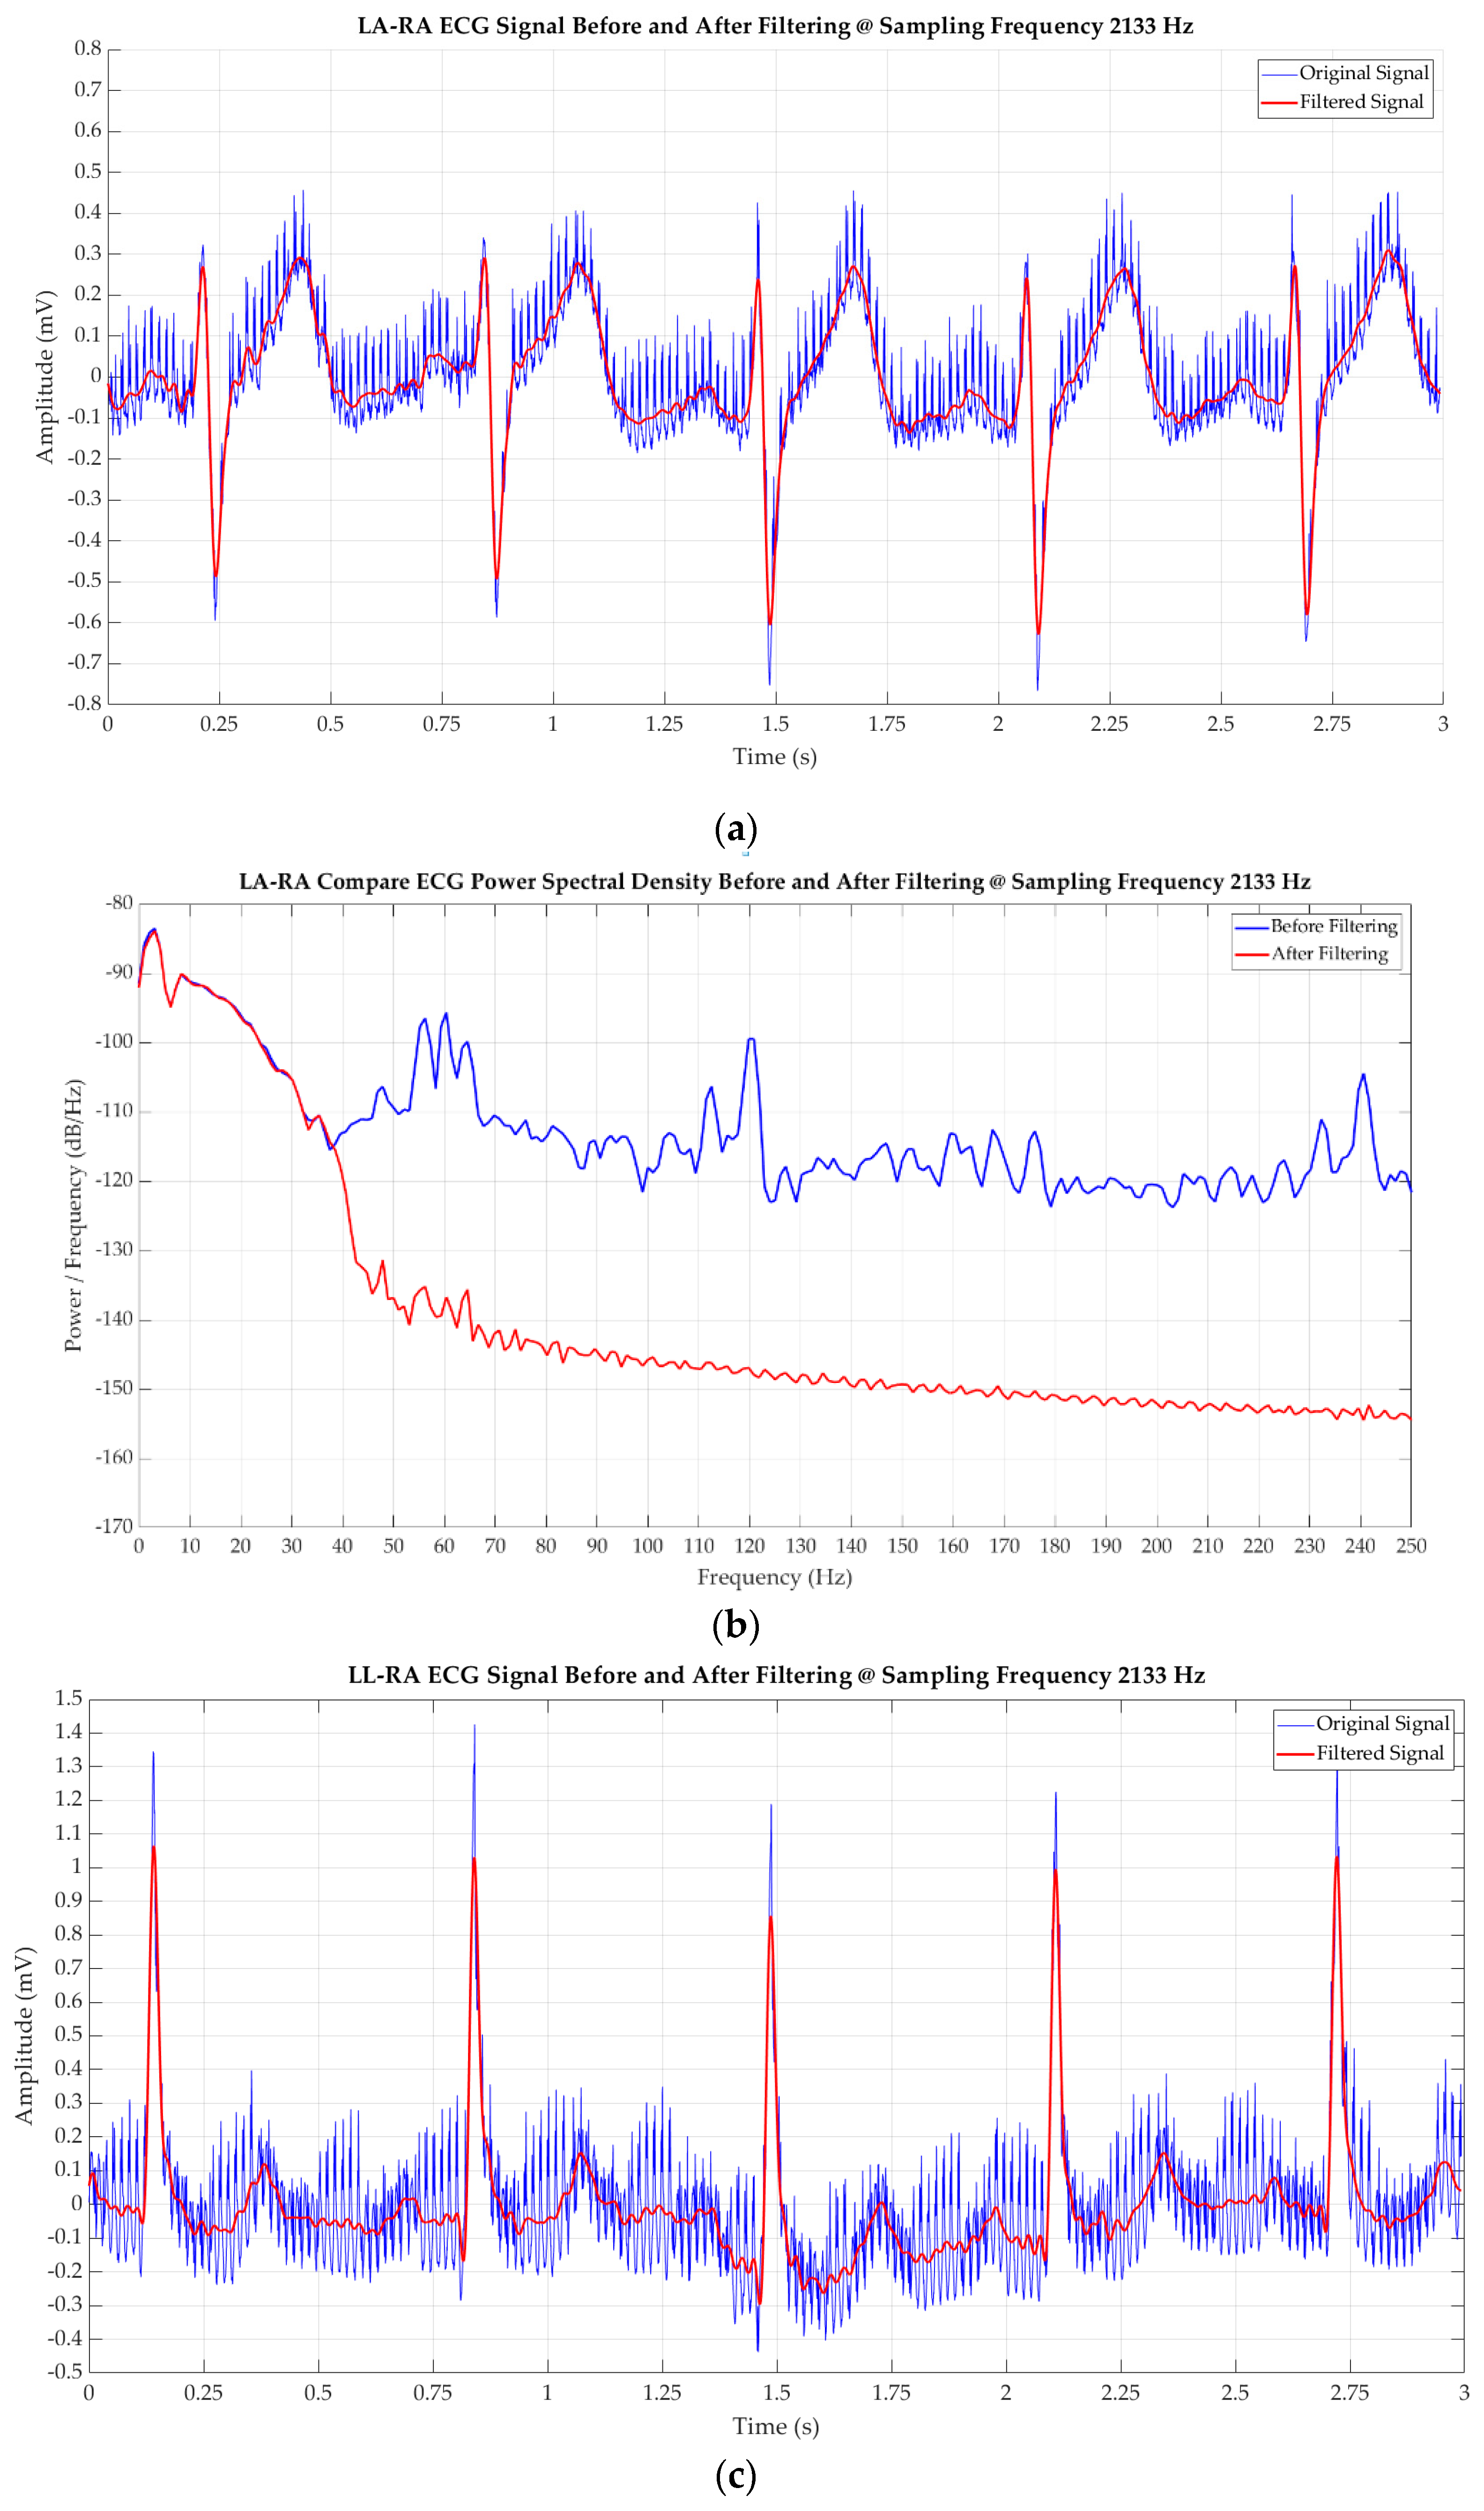
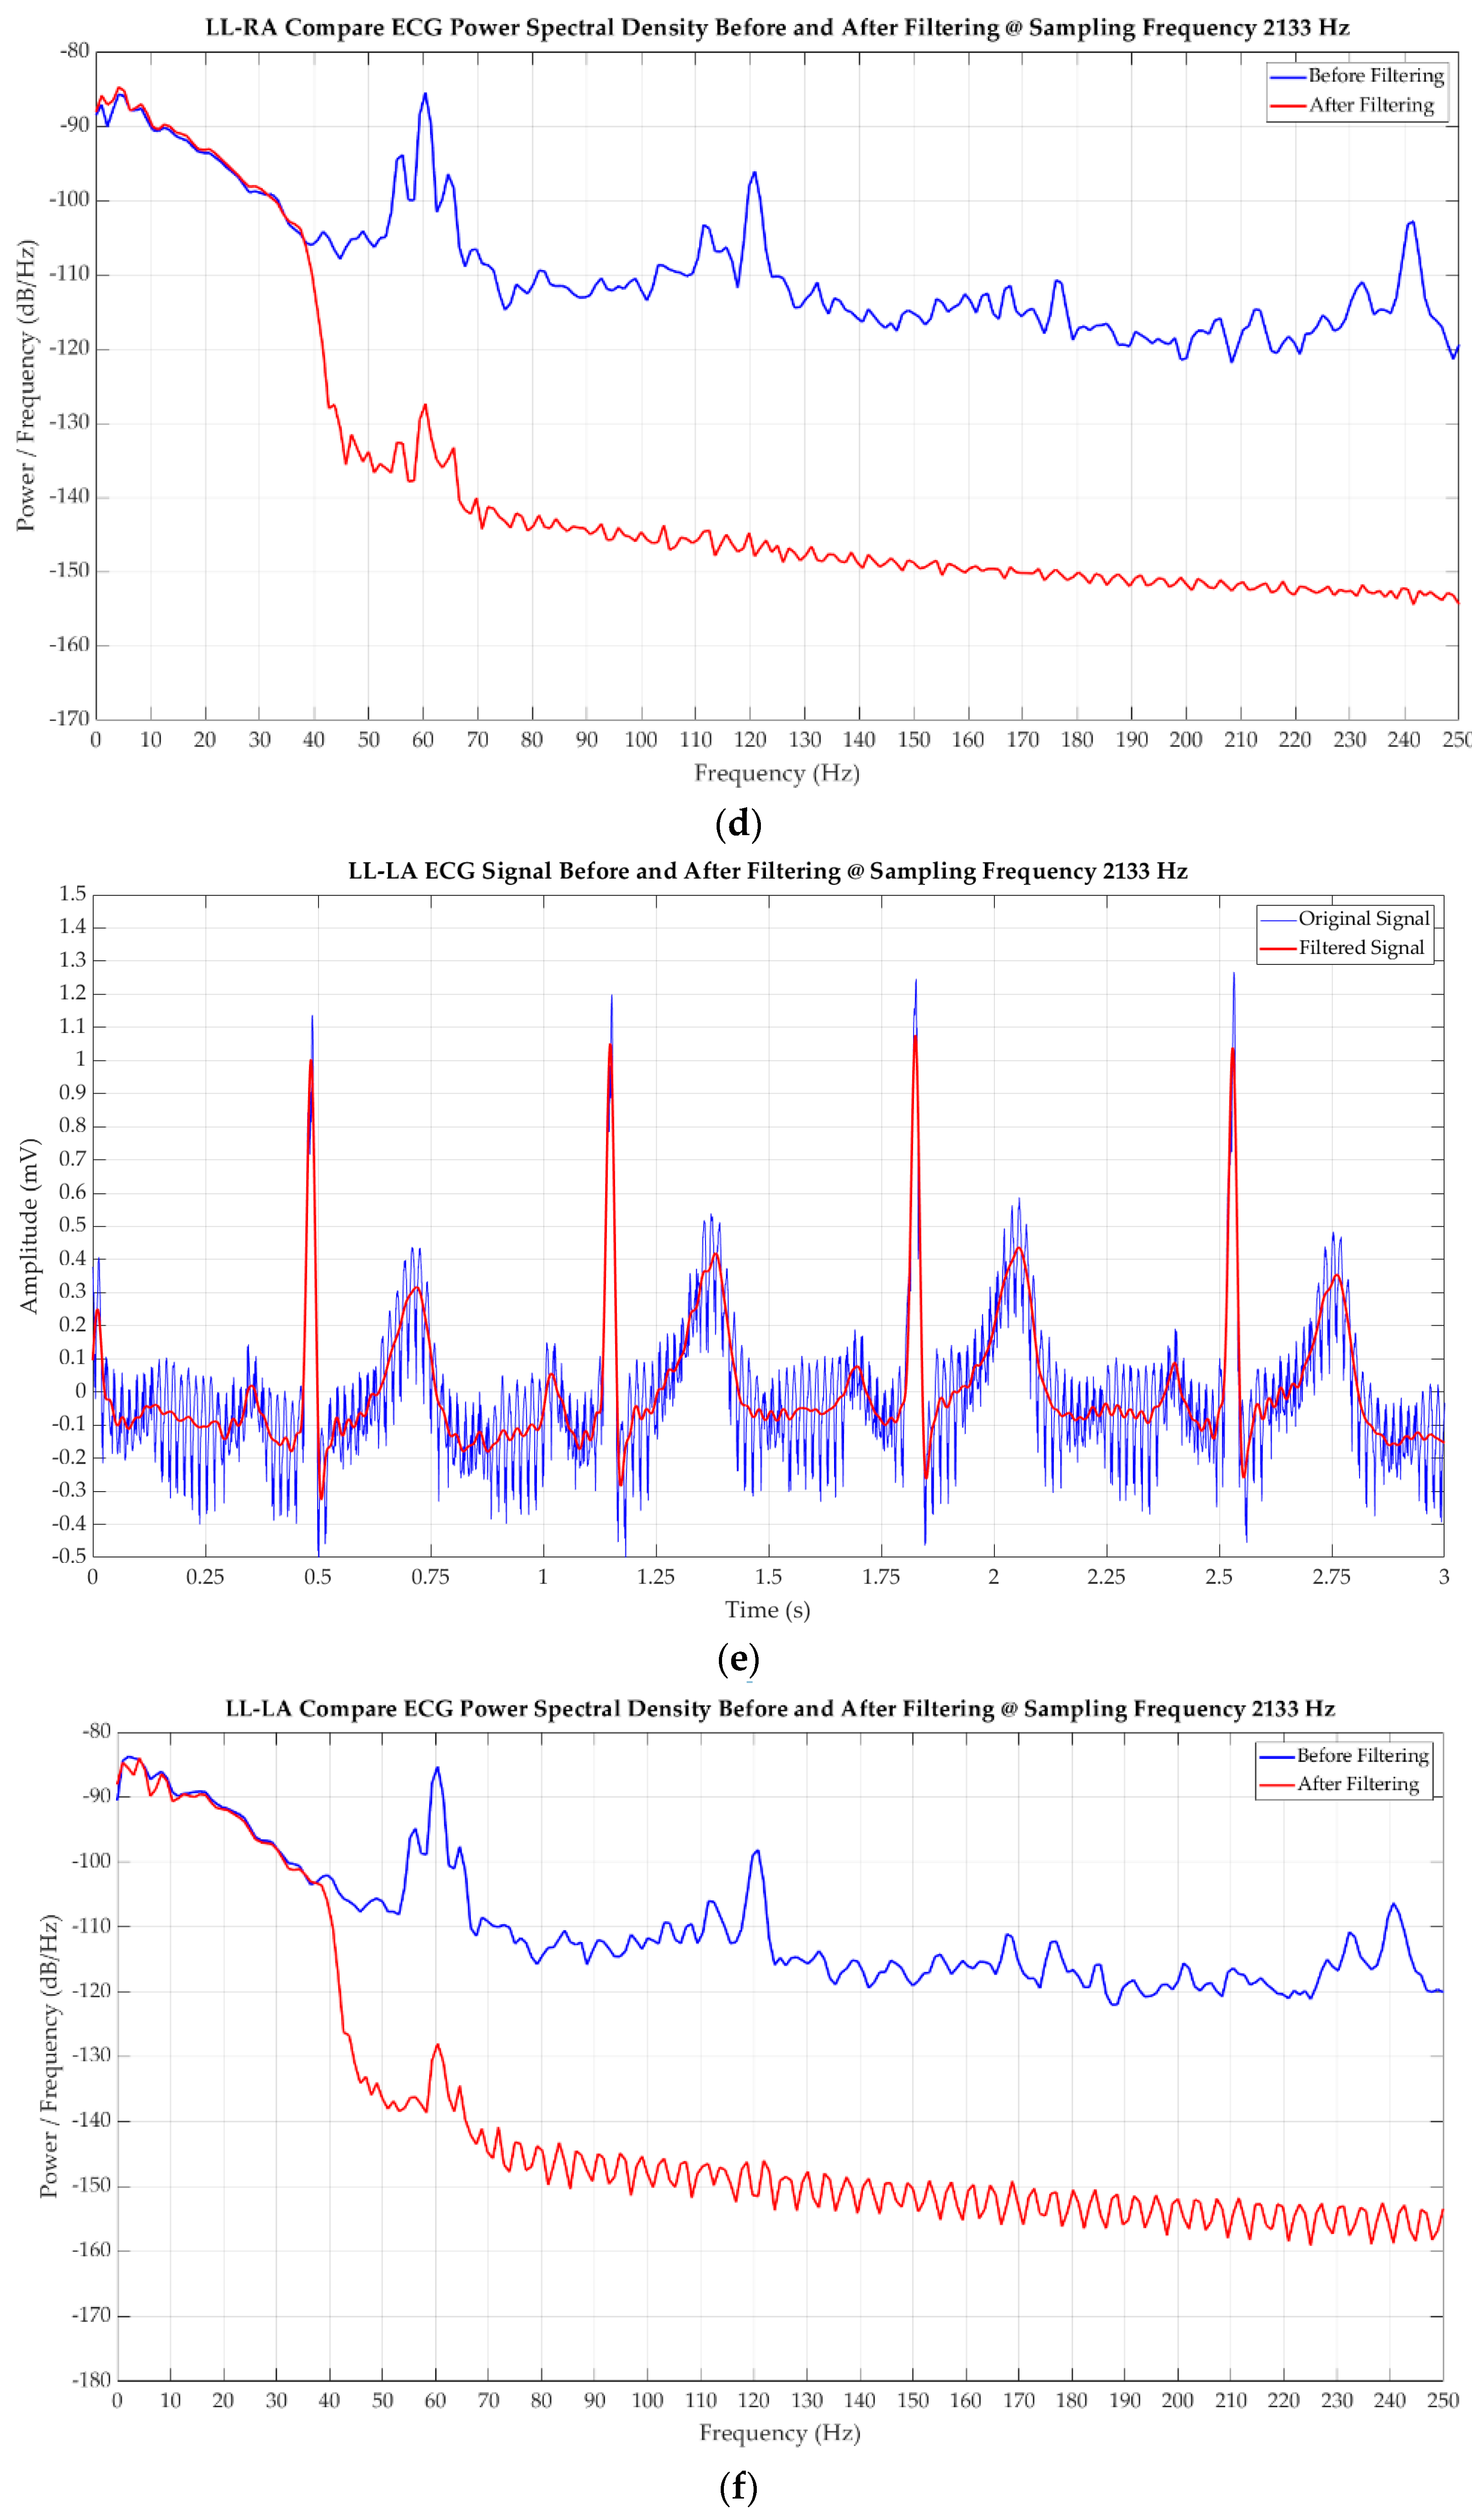
The test with high sampling frequency Fs = 2133 Hz waveform of the ECG signal is described in Figure 11. With the data in this test, we applied the high pass filter with cutoff frequency of 0.04 Hz and low pass filter with the parameters in Table 11. From this wave, we can see that the ECG signal consists of many noise signals, especially the 60 Hz power line noise signal. After applying filters, we obtained relatively clear and accurate ECG signals. From this signal, we can understand the situations of some features in the human body, such as rhythm or muscle contraction rhythm.
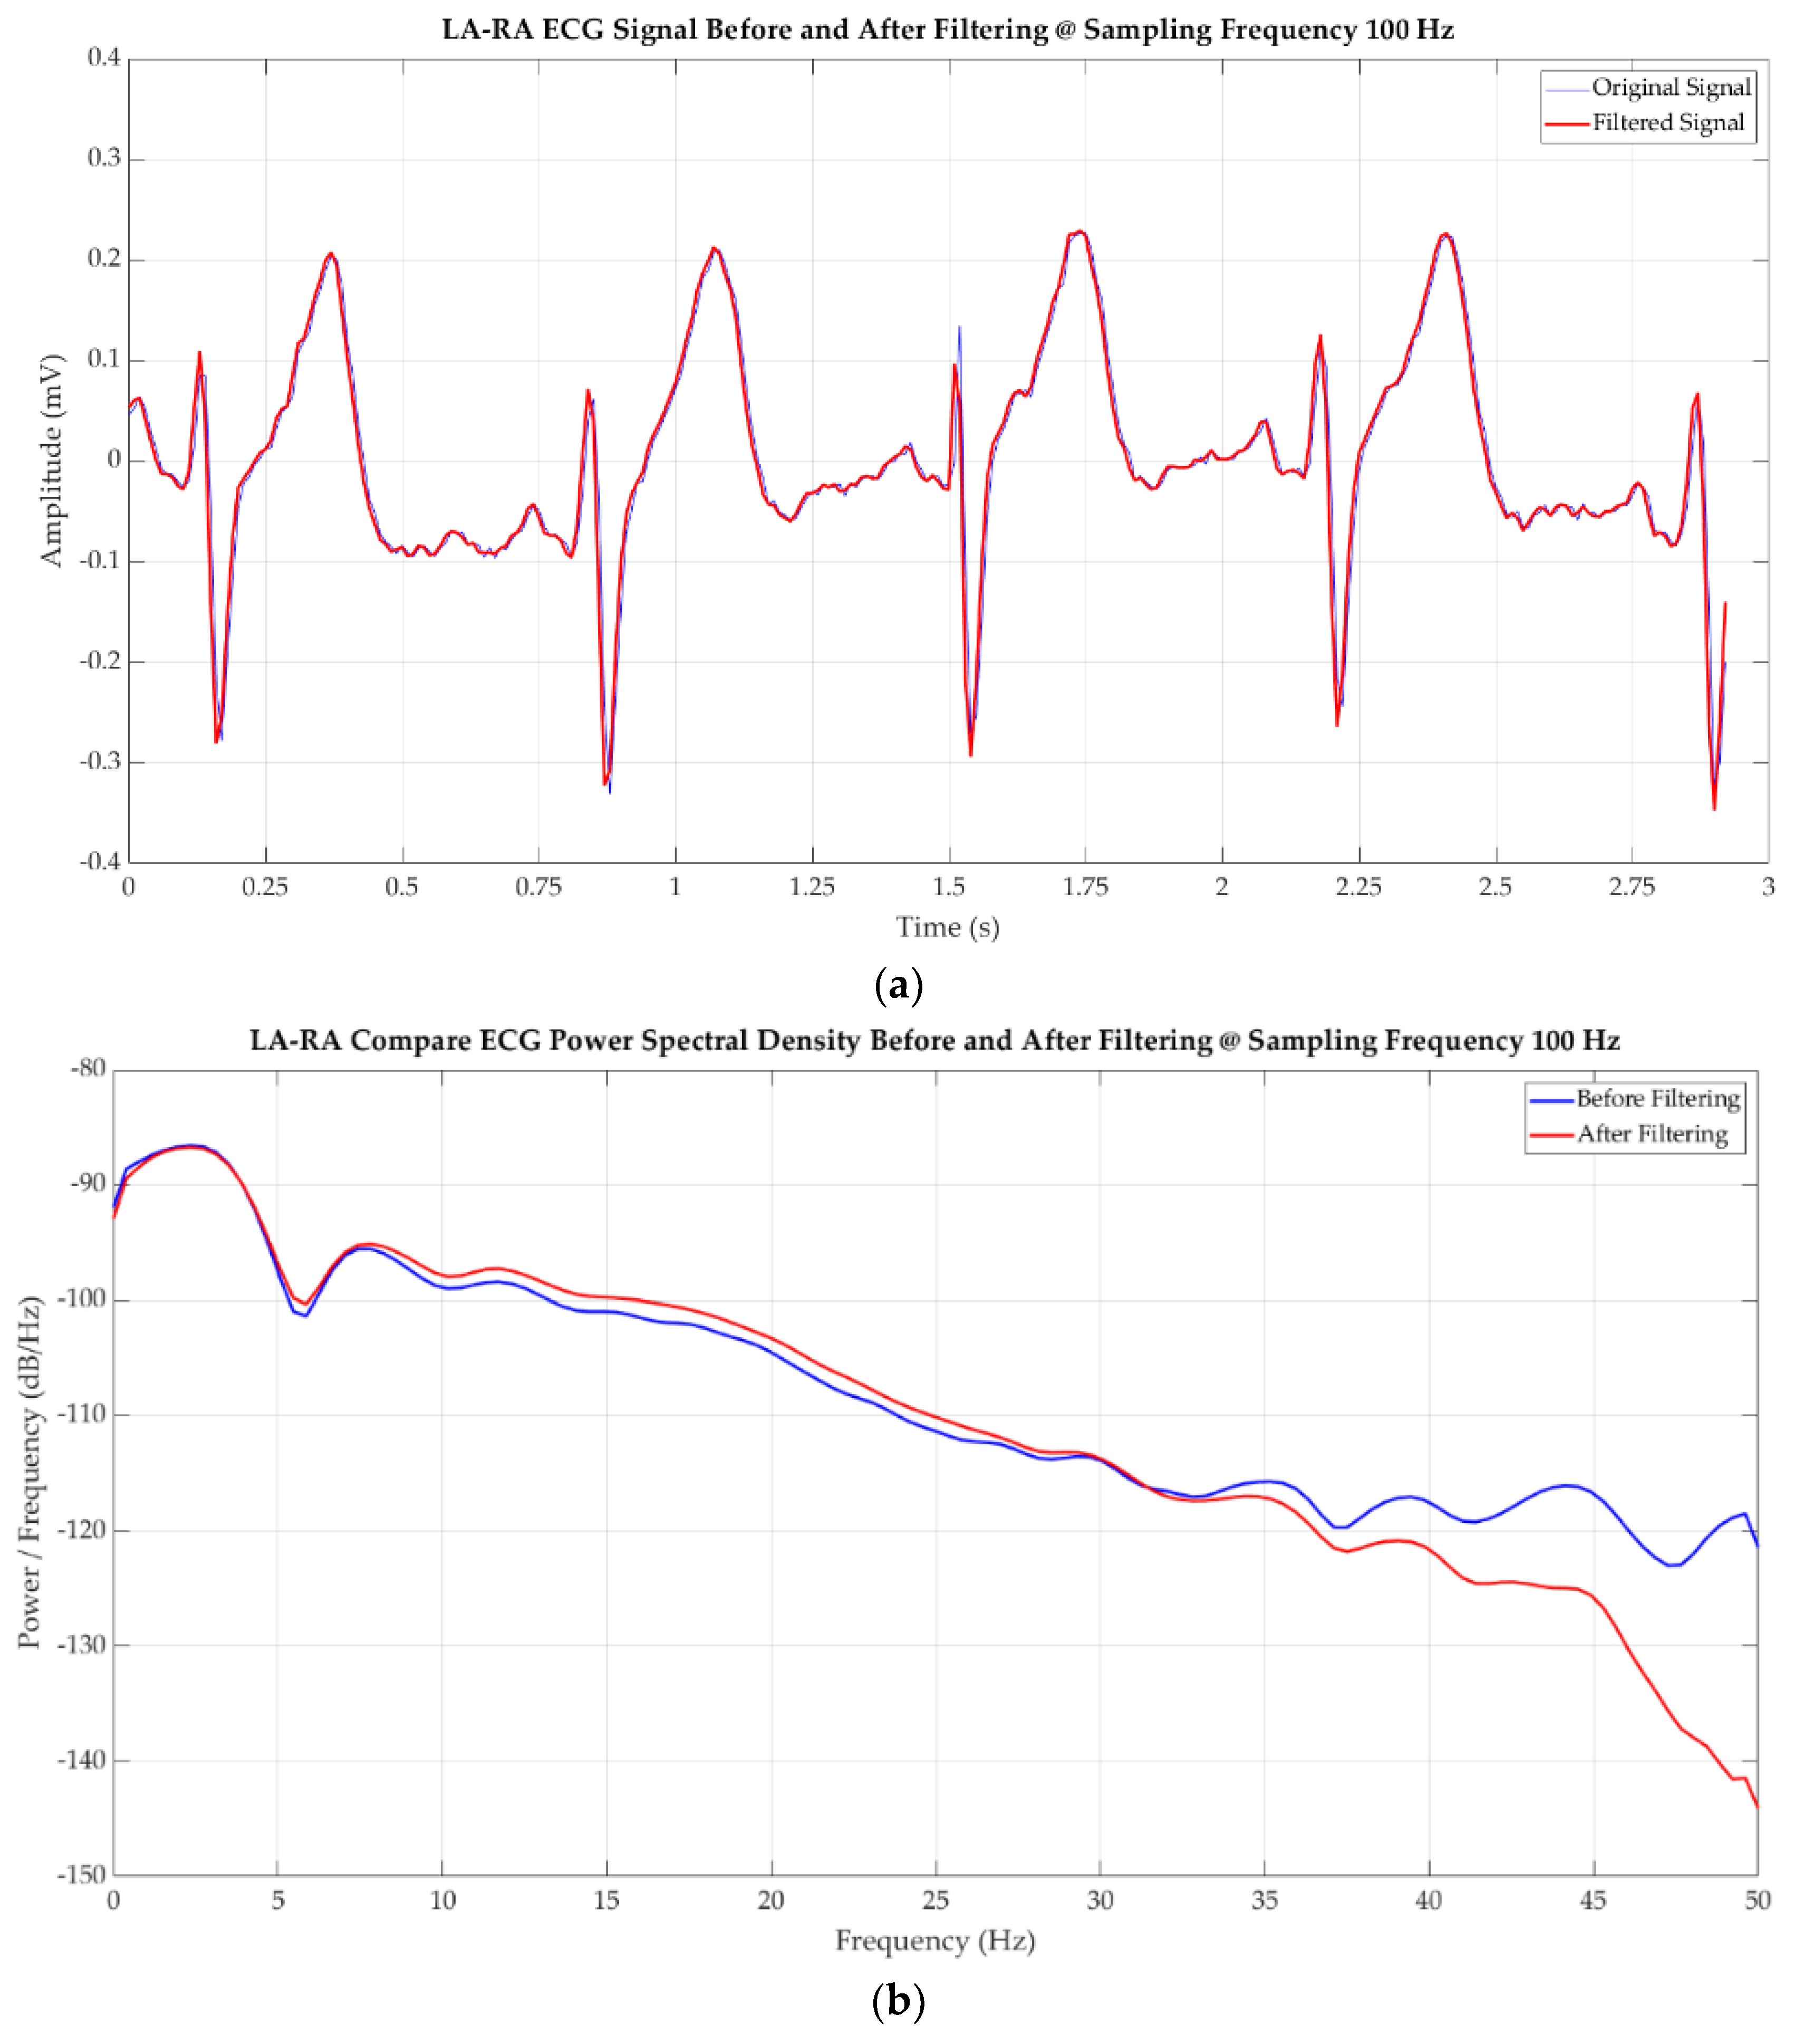
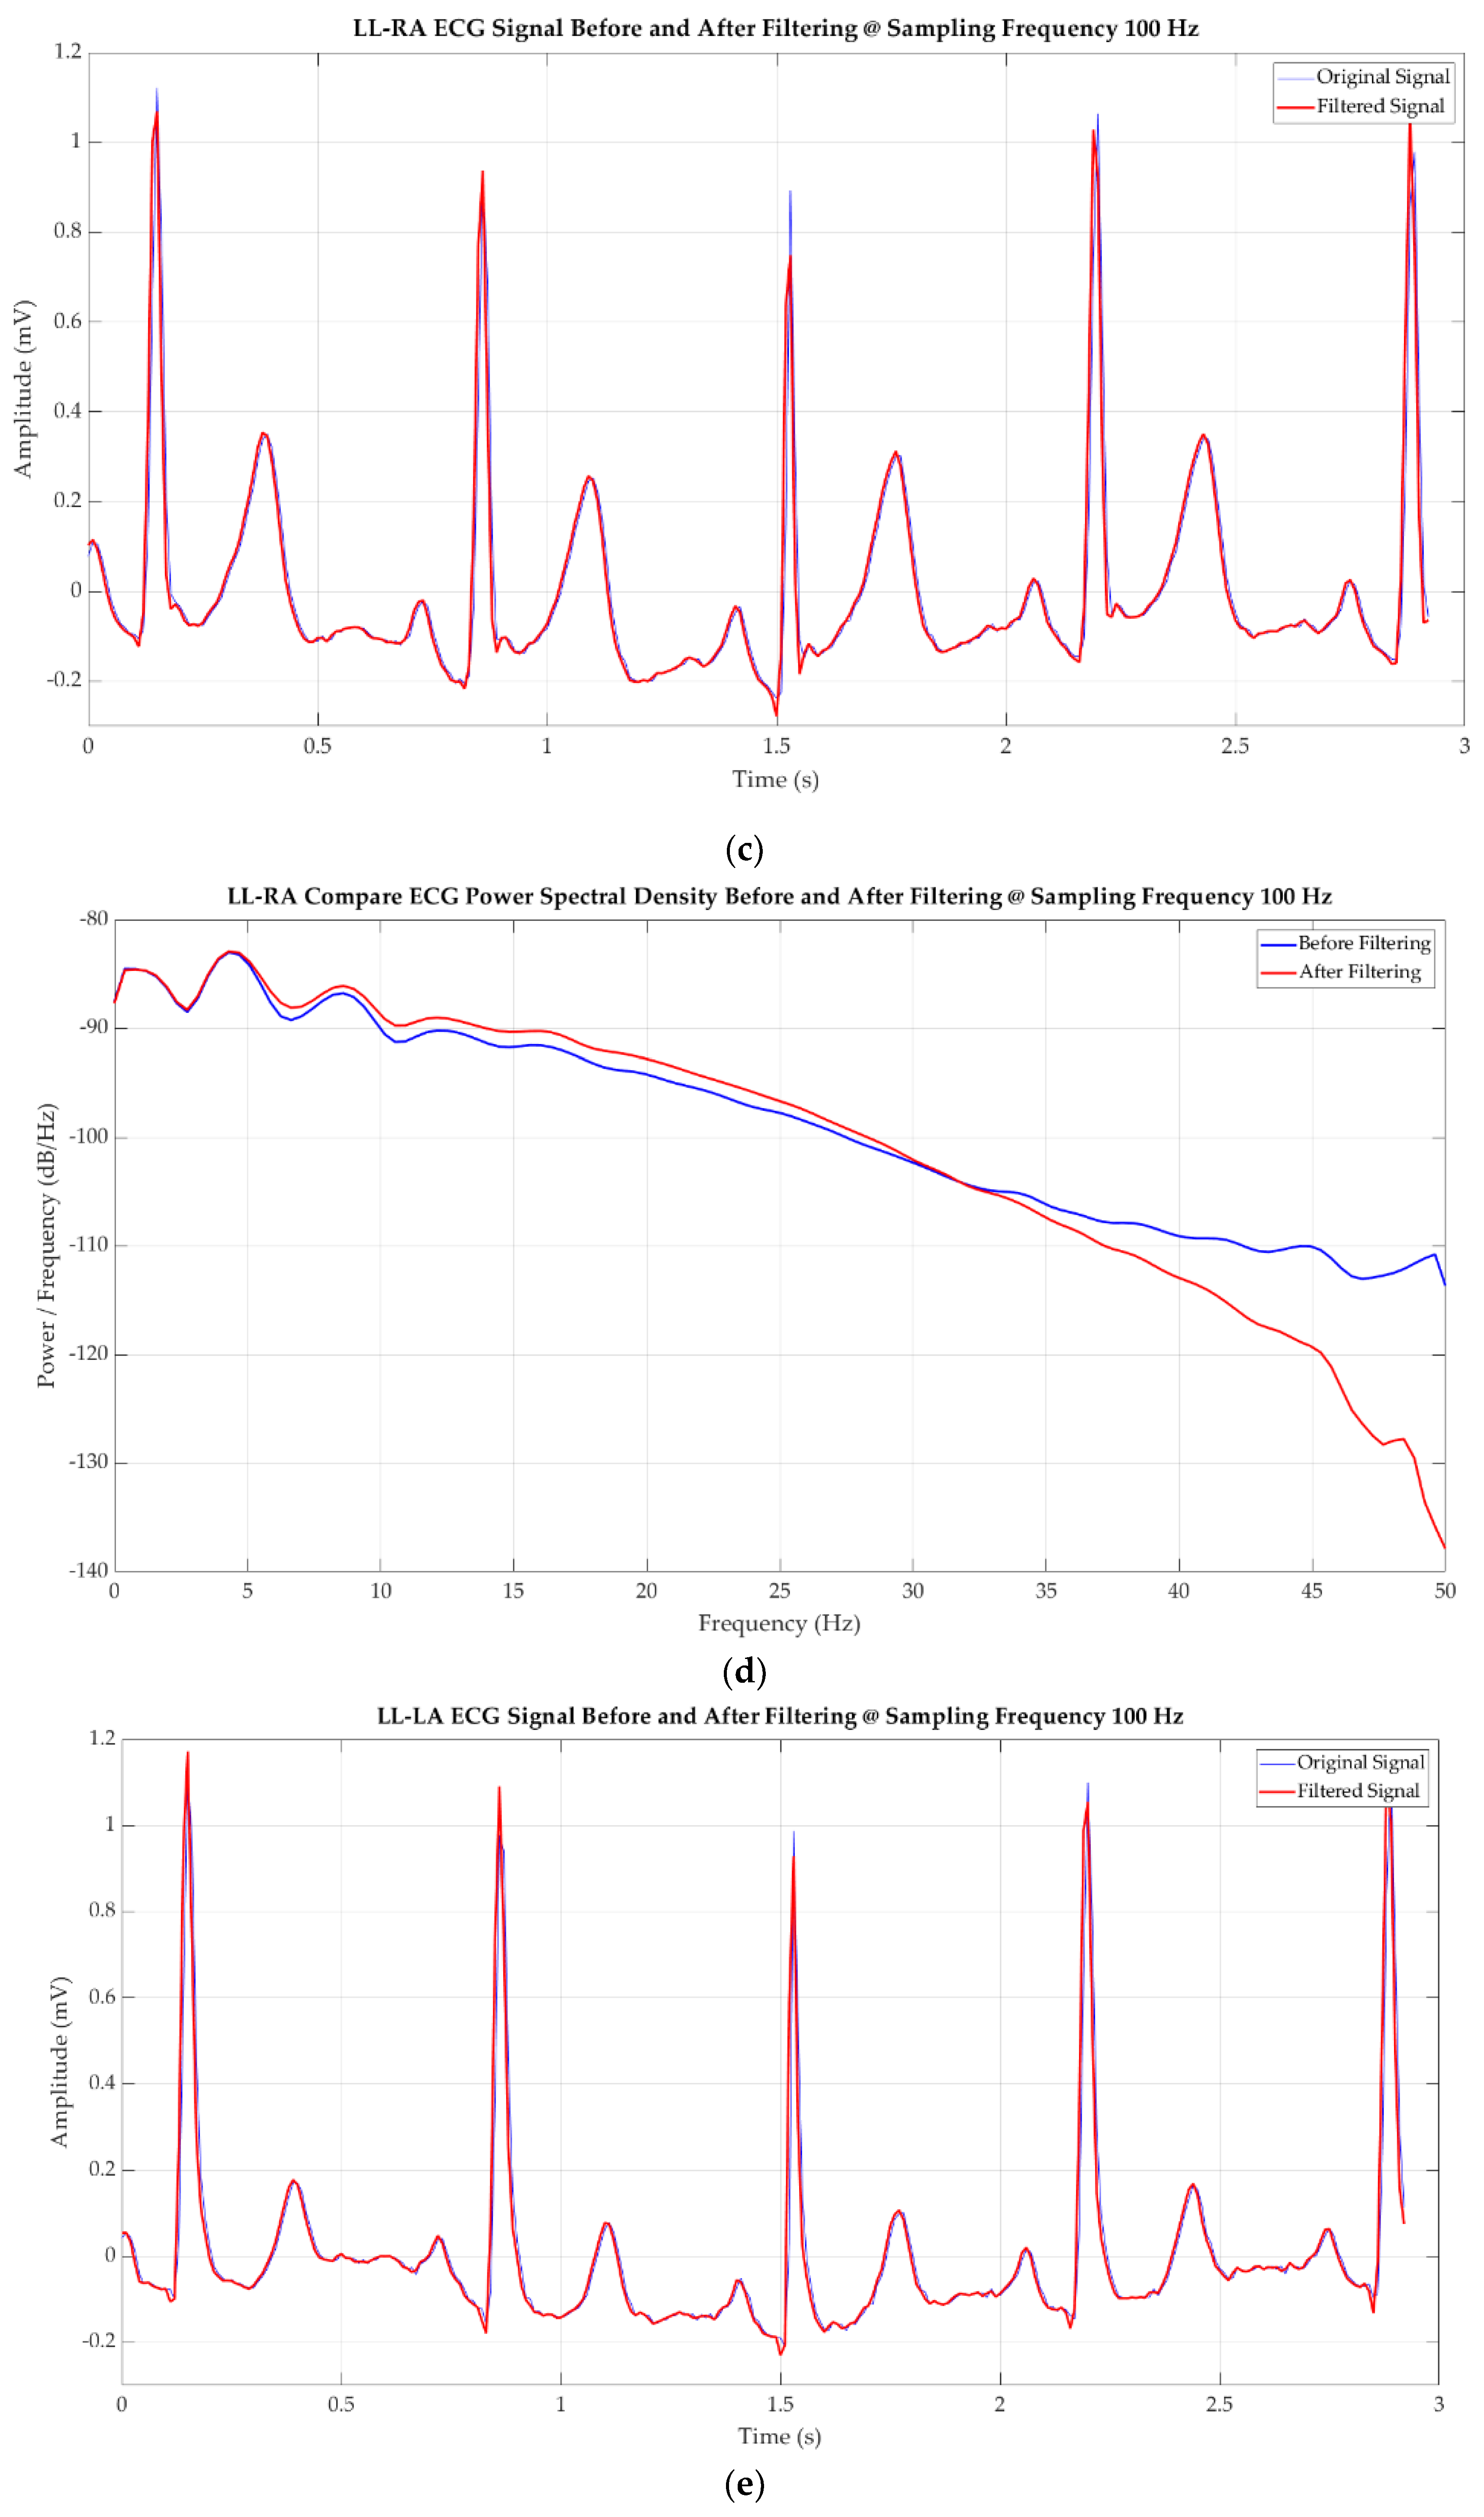
Additionally, we also tested the device with low sampling frequency Fs = 100 Hz. The test results are shown in Figure 12. In this test, we applied the high pass filter with a cutoff frequency of 0.04 Hz and a low pass filter with the parameters in Table 12. Here we can see that the ECG sampled the signal, and thus, we can determine the volunteer’s heart rate as well as the QRS parameters. However, due to the low sampling frequency, no interference with ECG signals was shown.
4. Discussion
According to the test results in Part 3, solar harvesting modules use supercapacitors (0.47 F - 5.5 V) to store energy when the light is turned off and the ECG device only runs for a short time. The supercapacitor has a large discharge time, so it does not affect the age of the device. To increase usage time, we need to increase the capacity of the supercapacitor or replace the supercapacitor with rechargeable batteries with a larger capacity but that also requires solar cells with higher power and performance. We also find that high-capacity batteries such as the battery NCR18650B direct charger solution or the wireless charger are more feasible than solar cell solutions.
In this design, the main components supply only 1.9 V, reducing power consumption significantly. At voltage 1.9 V, the consumed current is only about 1/4 of the voltage 3.3 V, which extends the use time and is suitable for a low power energy source as a solar cell. However, this also reduces the data transmission distance of the Bluetooth module.
The ECG device presented in this article can operate with the sampling frequency from 100 Hz to 2133 Hz, which creates the flexibility to select the device to receive the signal (with some smartphones with a low processing level). With low-speed equipment, we can choose a low sampling frequency. Meanwhile, the PC data processing speed is high, and many other supporting software can choose higher sampling frequencies for a higher accuracy of the ECG signal. However, this leads to the need for designing filters with many different coefficients to be suitable for many specific sampling frequencies. In addition, the design uses 8-bit MCU with relatively low data processing and transmission speeds (UART module speed), so it is impossible to transmit large data. Thus, the highest sampling frequency is 2133 Hz and the ADS1293 chip supports sampling frequencies up to 6400 Hz. That can be solved by changing the new MCU with a higher processing speed to be able to process real-time data with a high sampling frequency, which, after being processed, is transmitted to a high-performance smartphone. PC is a device that displays results.
The ECG signal improved after using the FIR filter shown in Section 3. Low pass filters filter noise from the power frequency noise, partially reducing ECG signals. However, the shape and characteristics of ECG signals were still guaranteed. The high pass filter eliminated the high-frequency signal and eliminates baseline deviation. The application of both filters led to the elimination of power line noise (60 Hz) and low-frequency noise while ensuring the accuracy of the signal type. However, compared to the original signal, the amplitude of the signal was still partially degraded, so other methods should be considered to achieve a better signal quality.
5. Conclusions
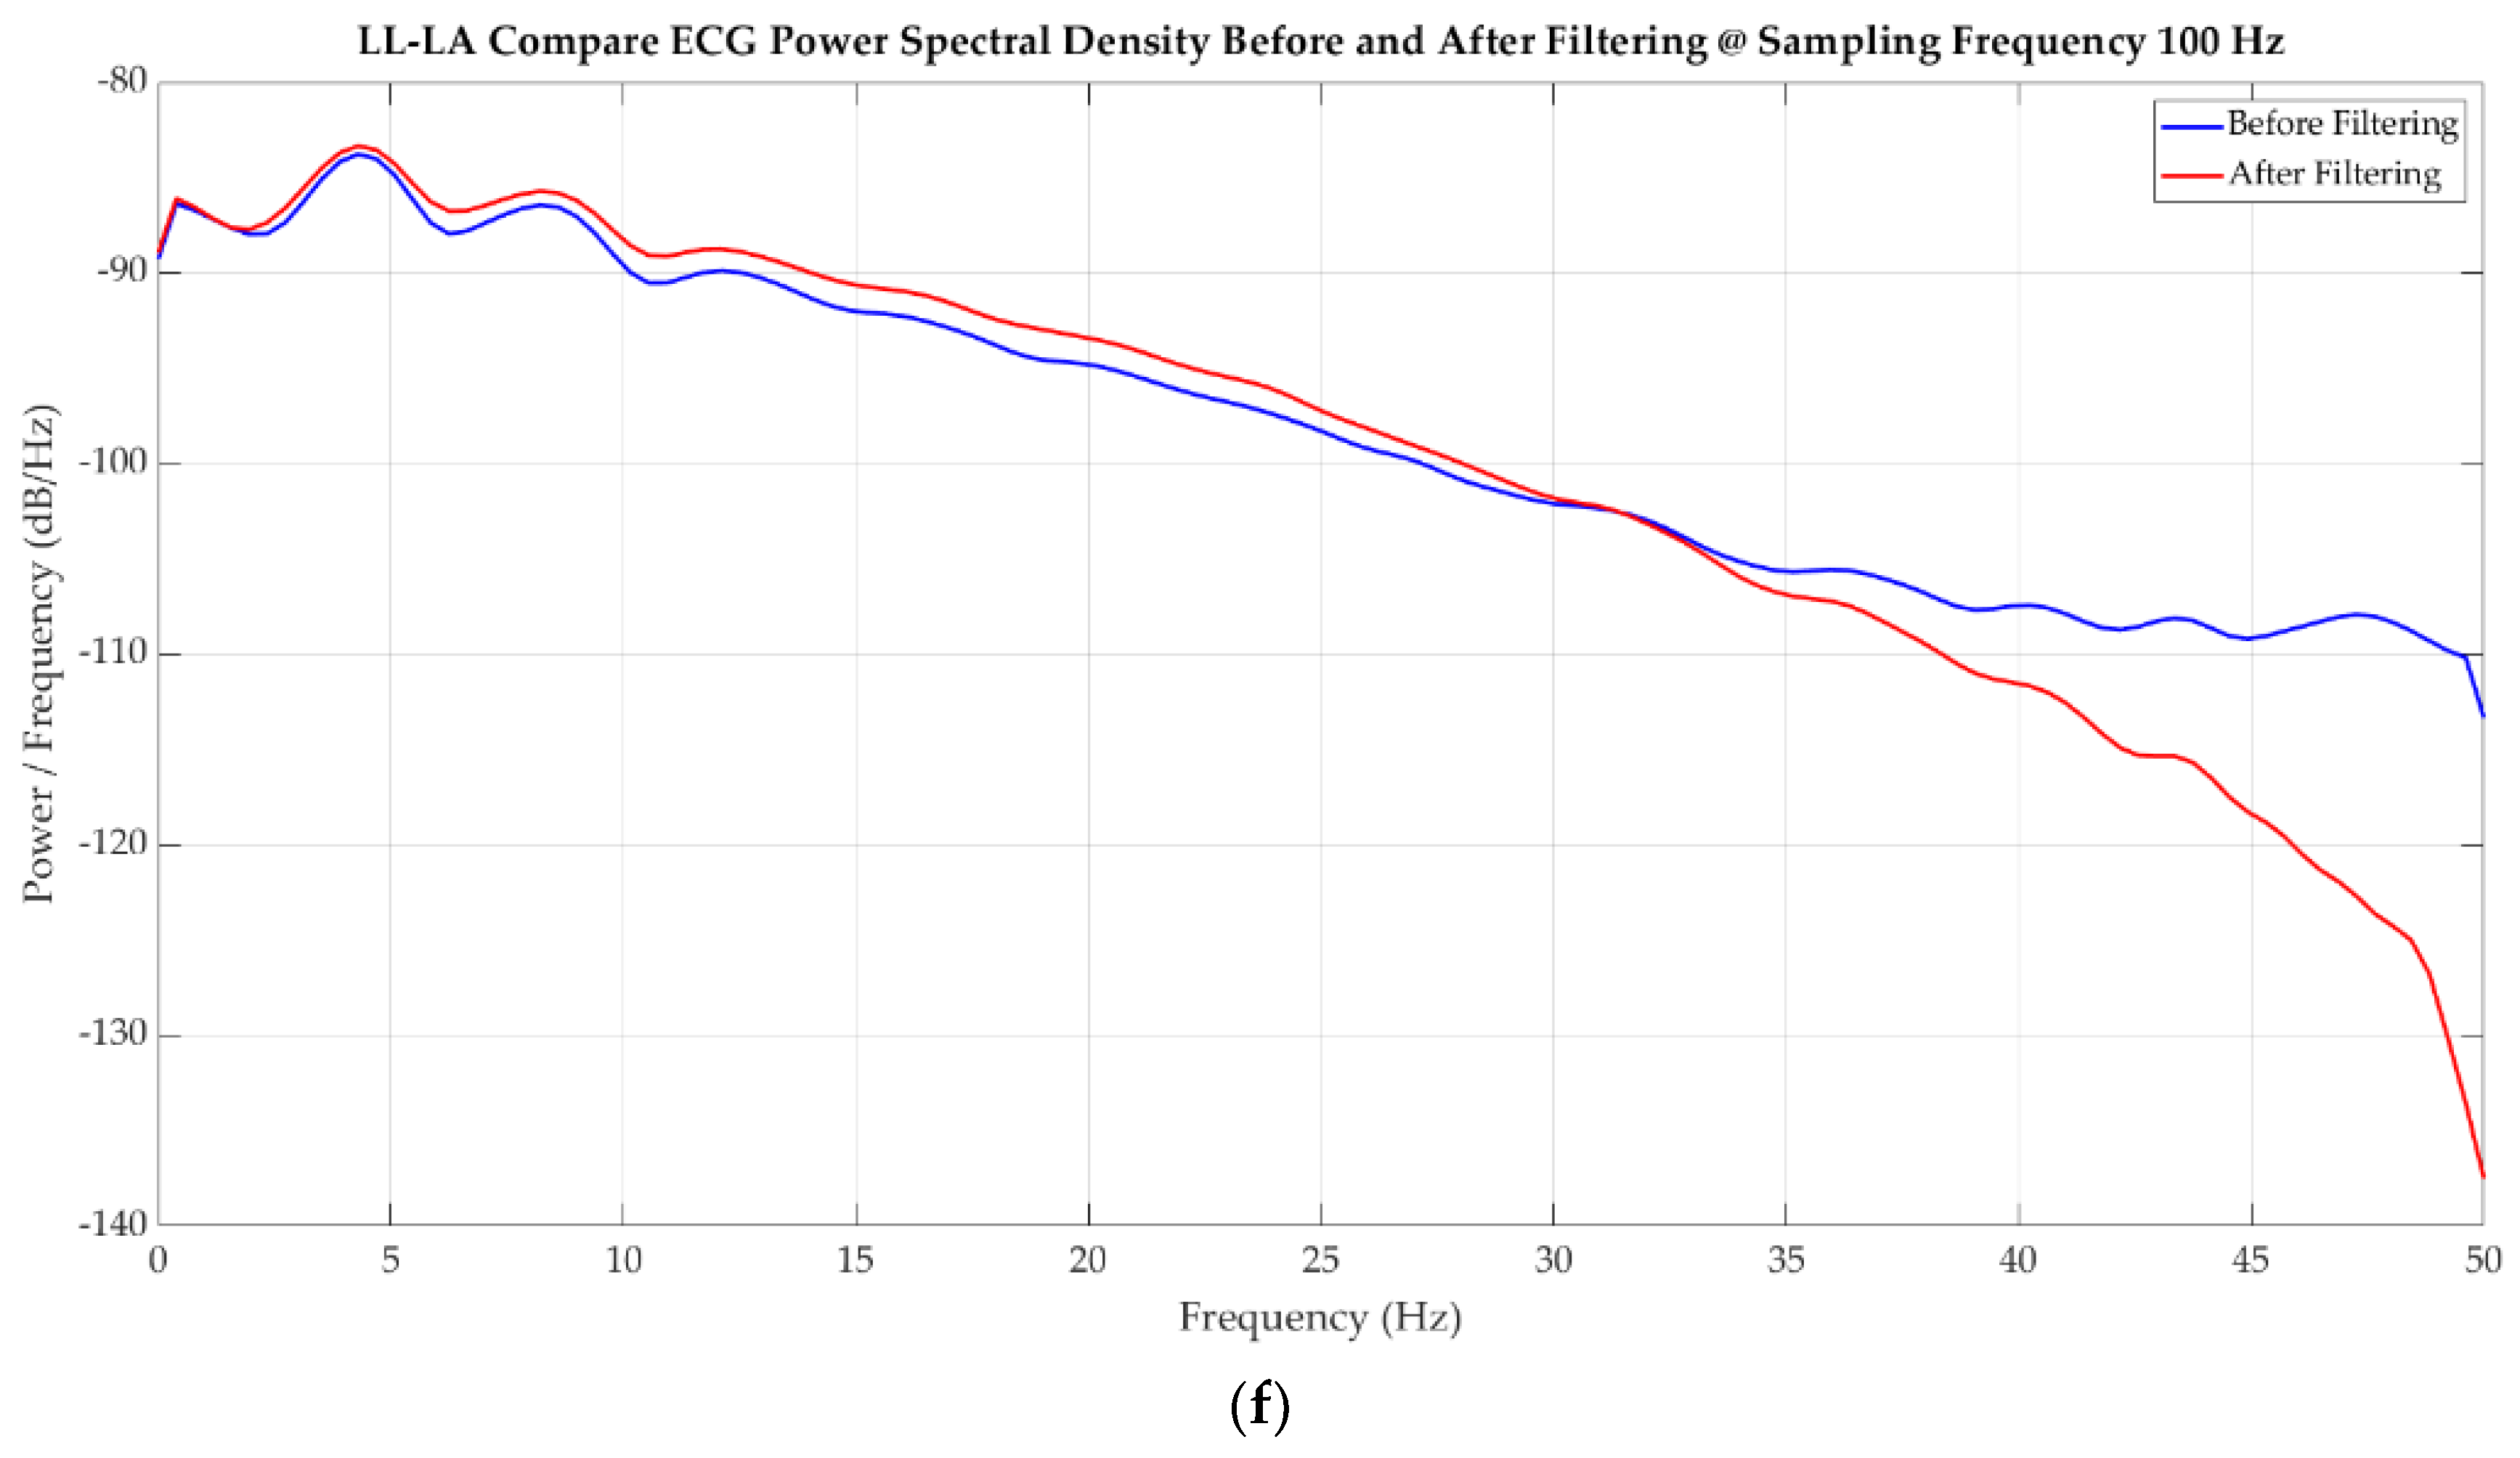
In this paper, we designed a mobile personal ECG monitoring system to save energy using renewable energy sources like solar energy. The ECG device uses solar energy as the main energy source so it does not require any other energy source. However, the usage time when there is no light is relatively short; therefore the device should be placed where the light is suitable. In addition, the device can be used with other battery sources without changing the hardware design details of the usage time we describe in Table 9. The device is highly accurate to give better measurement results to assist doctors in diagnosing the patient’s cardiovascular problems. There is a big difference in the signal before and after using the filter, which is depicted in Figure 12 with a sampling frequency of 2133 Hz. Figure 13 with 100 Hz sampling frequency does not have much difference between the previous and the filtered ones. This also affects the accuracy of the signal to be measured. ECG operates at a low sampling frequency, transmitting data directly into smartphones via Bluetooth. With higher sampling frequency, data is transmitted into the PC via another Bluetooth module and this data is processed and displayed on the PC. The ECG monitoring system presented in this paper can detect and transmit the basic elements of ECG waveform with high quality and efficiency. The current system has advantages such as convenience, low cost, and low power consumption. For high efficiency in energy-saving, the sleep mode is set for the PIC, Bluetooth module, and ECG ADS1293 chip. Application software running on smartphones is also developed to receive and draw ECG signals. Software functionality can also be enhanced by adding a number of diagnostic algorithms, which helps check for abnormalities in ECG waveforms, and thus, supports medical devices.
Author Contributions
Conceptualization, supervision, and funding acquisition, J.O.; methodology, N.T.B.; software, T.H.V.; validation, B.-G.K. and J.O.; writing—original draft preparation, N.T.B.; writing—review and editing, all authors.
Funding
This research was supported by a grant from the Marine Biotechnology Program (20150220) funded by the Ministry of Oceans and Fisheries, Korea.
Conflicts of Interest
The authors declare that there is no conflict of interests regarding the publication of this paper.
References
- American Heart Association. Heart Disease and Stroke Statistics 2018 At-a-Glance. 2018. Available online: https://healthmetrics.heart.org/wp-content/uploads/2018/02/At-A-Glance-Heart-Disease-and-Stroke-Statistics-2018.pdf (accessed on 31 January 2018).
- Rachim, V.P.; Chung, W.Y. Wearable Noncontact Armband for Mobile ECG Monitoring System. IEEE Trans. Biomed. Circuits Syst. 2016, 10, 1112–1118. [Google Scholar] [CrossRef] [PubMed]
- Gradl, S.; Cibis, T.; Lauber, J.; Richer, R.; Rybalko, R.; Pfeiffer, N.; Leutheuser, H.; Wirth, M.; von Tscharner, V.; Eskofier, B.M. Wearable Current-Based ECG Monitoring System with Non-Insulated Electrodes for Underwater Application. Appl. Sci. 2017, 7, 1277. [Google Scholar] [CrossRef]
- Chen, S.; Hua, W.; Li, Z.; Li, J.; Gao, X. Heartbeat classification using projected and dynamic features of ECG signal. Biomed. Signal Process. Control 2017, 31, 165–173. [Google Scholar] [CrossRef]
- Gargiulo, G.; Bifulco, P.; Cesarelli, M.; Fratini, A.; Romano, M. Problems in Assessment of Novel Biopotential Front-End with Dry Electrode: A Brief Review. Machines 2014, 2, 87–98. [Google Scholar] [CrossRef]
- Marco Longoni, D.C.; Rossi, B.; Fragneto, P.; Pessione, M.; Boracchi, G. A Wearable Device for Online and Long-Term ECG Monitoring. In Proceedings of the Twenty-Seventh International Joint Conference on Artificial Intelligence, Stockholm, Sweden, 13–19 July 2018; pp. 5838–5840. [Google Scholar]
- Korsakov, I.N.; Kuptsov, S.M.; Raznometov, D.A. Personal Medical Wearable Device for Distance Healthcare Monitoring X73-PHD. Int. J. Sci. Eng. Res. 2014, 5, 422–429. [Google Scholar]
- Mateo, J.; Torres, A.M.; Aparicio, A.; Santos, J.L. An efficient method for ECG beat classification and correction of ectopic beats. Comput. Electr. Eng. 2016, 53, 219–229. [Google Scholar] [CrossRef]
- Brito, R.; Mondouagne, L.P.; Stettler, C.; Combescure, C.; Burri, H. Automatic atrial fibrillation and flutter detection by a handheld ECG recorder, and utility of sequential finger and precordial recordings. J. Electrocardiol. 2018, 51, 1135–1140. [Google Scholar] [CrossRef] [PubMed]
- Cesarelli, P.B.G.R.F. Bluetooth Portable Device for ECG and Patient Motion Monitoring. In Proceedings of the 11th Mediterranean Conference on Medical and Biomedical Engineering and Computing, Ljubljana, Slovenia, 26–30 June 2007; Volume 16, pp. 369–372. [Google Scholar]
- Bhuvaneswari, P.T.V.; Balakumar, R.; Vaidehi, V.; Balamuralidhar, P. Solar Energy Harvesting for Wireless Sensor Networks. In Proceedings of the 2009 First International Conference on Computational Intelligence, Communication Systems and Networks, Indore, India, 23–25 July 2009. [Google Scholar]
- Victor Barbosa, T.N.; Carati, E.; Felgueirasab, C. Supercapacitor in battery charges of photovoltaic panel: Analysis of the technical feasibility. Energy Procedia 2018, 153, 80–85. [Google Scholar] [CrossRef]
- Alippi, C.; Galperti, C. An Adaptive System for Optimal Solar Energy Harvesting in Wireless Sensor Network Nodes. IEEE Trans. Circuits Syst. 2008, 55, 1742–1750. [Google Scholar] [CrossRef]
- Ghamrawi, A.; Gaubert, J.-P.; Mehdi, D. A new dual-mode maximum power point tracking algorithm based on the Perturb and Observe algorithm used on solar energy system. Sol. Energy 2018, 174, 508–514. [Google Scholar] [CrossRef]
- Camilo, J.C.; Guedes, T.; Fernandes, D.A.; Melo, J.D.; Costa, F.F.; Filho, A.J.S. A maximum power point tracking for photovoltaic systems based on Monod equation. Renew. Energy 2019, 130, 428–438. [Google Scholar] [CrossRef]
- Kouchachvili, L.; Yaïci, W.; Entchev, E. Hybrid battery/supercapacitor energy storage system for the electric vehicles. J. Power Sources 2018, 374, 237–248. [Google Scholar] [CrossRef]
- Texas Instruments. ADS1293. 2013. Available online: http://www.ti.com/product/ADS1293?keyMatch=ads1293&tisearch=Search-EN-Everything (accessed on 17 December 2014).
- MICROCHIP. PIC16F19186. Available online: https://www.microchip.com/wwwproducts/en/PIC16F19186 (accessed on 23 June 2017).
- MICROCHIP. RN4020. Available online: https://www.microchip.com/wwwproducts/en/RN4020 (accessed on 18 September 2015).
- Yuan, L.; Yuan, Y.; Zhou, Z.; Bai, Y.; Wu, S. A Fetal ECG Monitoring System Based on the Android Smartphone. Sensors 2019, 19, 446. [Google Scholar] [CrossRef] [PubMed]
- NiyanMarchon, G.; Pai, R. Monitoring of fetal heart rate using sharp transition FIR filter. Biomed. Signal Process. Control 2018, 44, 191–199. [Google Scholar] [CrossRef]
- Singh, N.; Ayub, S.; Saini, J.P. Design of Digital IIR Filter for Noise Reduction in ECG Signal. In Proceedings of the 2013 5th International Conference and Computational Intelligence and Communication Networks, Mathura, India, 27–29 September 2013. [Google Scholar]
- Texas Instruments. BQ25570. 2014. Available online: http://www.ti.com/product/BQ25570?keyMatch=bq25570&tisearch=Search-EN-Everything (accessed on 6 March 2019).
- Petros Spachos, A.M. Biomedical Signal Processing and Control. Comput. Commun. 2018, 119, 94–100. [Google Scholar] [CrossRef]
- AlMahamdy, M.; Riley, H.B. Performance Study of Different Denoising Methods for ECG Signals. Procedia Comput. Sci. 2014, 37, 325–332. [Google Scholar] [CrossRef] [Green Version]
- Kabir, M.A.; Shahnaz, C. Denoising of ECG signals based on noise reduction algorithms in EMD and wavelet domains. Biomed. Signal Process. Control 2012, 7, 481–489. [Google Scholar] [CrossRef]
- Sameni, R.; Shamsollahi, M.B.; Jutten, C.; Babaie-Zade, M. Filtering noisy ECG signals using the extended kalman filter based on a modified dynamic ECG model. Comput. Cardiol. 2005. [Google Scholar] [CrossRef]
Figure 1.
The electrocardiogram (ECG) monitoring system.

Figure 2.
Solar energy harvesting and power module.

Figure 3.
The interface between MCU, ADS1293, and RN4020.

Figure 4.
The hardware of the ECG monitoring system.

Figure 5.
A solar cell (a) and electrode (b).

Figure 6.
Mode of main components MCU, ADS1293, and RN4020.

Figure 7.
Timing read data from ADS1293.

Figure 8.
Flowchart of application software based on smartphone.

Figure 9.
Smartphone ECG application (a) startup monitor and (b) main monitor.

Figure 10.
Testing the ECG signal: (a) signal recorded by the ECG device, (b) signal recorded by an oscilloscope.
Figure 10.
Testing the ECG signal: (a) signal recorded by the ECG device, (b) signal recorded by an oscilloscope.

Figure 11.
Setup system measurement ECG signal.

Figure 12.
ECG signal before and after filter with sampling frequency 2133 Hz: (a,b) left arm to right arm signal, (c,d) left leg to right arm signal, and (e,f) left leg to left arm signal.
Figure 12.
ECG signal before and after filter with sampling frequency 2133 Hz: (a,b) left arm to right arm signal, (c,d) left leg to right arm signal, and (e,f) left leg to left arm signal.


Figure 13.
ECG signal before and after being filtered with a sampling frequency of 100 Hz: (a,b) left arm to right arm signal, (c,d) left leg to right arm signal, and (e,f) left leg to left arm signal.
Figure 13.
ECG signal before and after being filtered with a sampling frequency of 100 Hz: (a,b) left arm to right arm signal, (c,d) left leg to right arm signal, and (e,f) left leg to left arm signal.


Table 1.
Voltage and current consumption of three devices PIC16LF19186, ADS1293, and RN4020.
| Components | Operating Voltage (V) | Operating Current (µA) |
|---|---|---|
| PIC16LF19168 | 1.8–3.6 | Sleep Mode 50 Na @ 1.8 V |
| Active Mode 8 µA/32 kHz @ 1.8 V | ||
| Active Mode 32 µA/MHz @ 1.8 V | ||
| Second OSC 500 nA @ 32 kHz | ||
| RN4020 | 1.8–3.6 | Dormant < 900 nA @ 3 V |
| Deep Sleep < 5.0 µA @ 3 V | ||
| Idle < 1.5 mA @ 3 V | ||
| TX/ RX Active 16 mA @ 3 V | ||
| TX Power (dBm) - 19.1 with 14.0 mA @ 3.3 V | ||
| ADS1293 | 1.65–3.6 (Digital Module) | Duty-Cycle mode: 120 µA |
| 2.7–5.5 (Analog Module) | Normal mode: 415 µA |
Table 2.
The time of solar energy harvesting module to fully charge 0.47 F-5.5 V the supercapacitor with different input voltages.
Table 2.
The time of solar energy harvesting module to fully charge 0.47 F-5.5 V the supercapacitor with different input voltages.
| Vin (V) | Vsuper Cap (V) | Charging Time (s) |
|---|---|---|
| 0.7 | 4.2 | 405 |
| 1.2 | 4.2 | 137 |
| 2.4 | 4.2 | 32 |
Table 3.
Voltage supply for main components.
| Components | Operating Voltage (V) | Current Consumption (µA) |
|---|---|---|
| PIC16LF19186 | 1.9 | 32 µA/MHz @ 1.8 V |
| RN4020 | 1.9 | Deep Sleep < 5.0 µA @ 3 V |
| Idle < 1.5 mA @ 3 V | ||
| ADS1293 | 1.9 (Digital Module) | Duty-Cycle mode: 120 µA |
| 4.2 (Analog Module) |
Table 4.
Relationship between sampling frequency and the number of channels.
| Number | Sampling Frequency (Hz) | Number of Channels |
|---|---|---|
| 1 | 2133 | 1 |
| 2 | 1280 | 2 |
| 3 | ≤853 | 3 |
Table 5.
The modules in the application software.
| Number | Module | Functional Description |
|---|---|---|
| 1 | Check Bluetooth module start mode | Check the status of the Bluetooth module inside the smartphone |
| 2 | Scan and display available Bluetooth devices | Scan and display available Bluetooth devices near the smartphone |
| 3 | Establish GATT connection | Connected with Bluetooth module RN4020 |
| 4 | Send data to ECG device | Send request command or re-config data frame to ECG device |
| 5 | Process data from the buffer | Process available data from the buffer |
| 6 | Apply filter to data | Apply low-pass and high-pass filter to data |
| 7 | Display data | Display results |
Table 6.
The frame of data received from Bluetooth.
| Number | Frame | Functional Description |
|---|---|---|
| 1 | {00} | Configuration ECG device with 1 analog channel input |
| 2 | {10} | Configuration ECG device with 2 analog channel input |
| 3 | {20} | Configuration ECG device with 3 analog channel input |
| 4 | {03} | Configuration ECG device with sample rate 100 Hz |
| 5 | {04} | Configuration ECG device with sample rate 200 Hz |
| 6 | {05} | Configuration ECG device with sample rate 400 Hz |
| 7 | {06} | Configuration ECG device with sample rate 853 Hz |
| 8 | {07} | Configuration ECG device with sample rate 1280 Hz |
| 9 | {09} | Configuration ECG device with sample rate 2133 Hz |
Table 7.
The frame of data transfer to Bluetooth.
| Number | Frame | Functional Description |
|---|---|---|
| 1 | {3 byte of channel1} | Send 800 bytes of analog channel 1 through Bluetooth |
| 2 | {3 bytes of channel 1, 3 bytes of channel 2} | Send 800 bytes of analog channel 1 and channel 2 through Bluetooth |
| 3 | {3 bytes of channel 1, 3 bytes of channel 2, 3 bytes of channel 2} | Send 810 bytes of analog channel 1, channel 2 and channel 3 through Bluetooth |
Table 8.
Consumption current in working modes.
| Mode | Status | Current Consumption (µA) |
|---|---|---|
| 1 | Active (PIC, RN4020, ADS1293) | 2100 |
| 2 | Active (PIC, RN4020), Sleep (ADS1293) | 1900 |
| 3 | Active (RN4020), Sleep (PIC, ADS1293) | 500 |
| 4 | Sleep (PIC, RN4020, ADS1293) | 40 |
Table 9.
Used time of ECG device with differences sources.
| Number | Power Source | Used Time (s) |
|---|---|---|
| 1 | Supercapacitor 0.47 F - 5.5 V (1.25 mWh) | 2.1 |
| 2 | CR2030: 3 V - 220 mAh (660 mWh) | 1112 |
| 3 | NCR18650B: 3.7 V - 3400 mAh (12,580 mWh) | 26,484 |
Table 10.
The amplitude and frequency of the testing signal generated by a function generator, recorded by ECG and oscilloscope.
Table 10.
The amplitude and frequency of the testing signal generated by a function generator, recorded by ECG and oscilloscope.
| AFG3252 | MSOX2024A | ECG Device |
|---|---|---|
| Amplitude: 100 mV | Amplitude: 65.5 mV | Amplitude: 65 mV |
| Frequency: 0.8 Hz | Frequency: 0.799 Hz | Frequency: 0.8 Hz |
Table 11.
Low pass filter parameters at sampling frequency 2133 Hz.
| Low Pass Filter | FIR |
|---|---|
| Design method | Window |
| Type of window | Chebyshev |
| Filter order | 500 |
| Cut-off frequency | 40 Hz |
Table 12.
Low pass filter parameters at a sampling frequency of 100 Hz.
| Low Pass Filter | FIR |
|---|---|
| Design method | Window |
| Type of window | Chebyshev |
| Filter order | 5 |
| Cut-off frequency | 40 Hz |
© 2019 by the authors. Licensee MDPI, Basel, Switzerland. This article is an open access article distributed under the terms and conditions of the Creative Commons Attribution (CC BY) license (http://creativecommons.org/licenses/by/4.0/).
Share and Cite
MDPI and ACS Style
Bui, N.T.; Vo, T.H.; Kim, B.-G.; Oh, J. Design of a Solar-Powered Portable ECG Device with Optimal Power Consumption and High Accuracy Measurement. Appl. Sci. 2019, 9, 2129. https://doi.org/10.3390/app9102129
AMA Style
Bui NT, Vo TH, Kim B-G, Oh J. Design of a Solar-Powered Portable ECG Device with Optimal Power Consumption and High Accuracy Measurement. Applied Sciences. 2019; 9(10):2129. https://doi.org/10.3390/app9102129
Chicago/Turabian StyleBui, Ngoc Thang, Tan Hung Vo, Byung-Gak Kim, and Junghwan Oh. 2019. "Design of a Solar-Powered Portable ECG Device with Optimal Power Consumption and High Accuracy Measurement" Applied Sciences 9, no. 10: 2129. https://doi.org/10.3390/app9102129
Note that from the first issue of 2016, this journal uses article numbers instead of page numbers. See further details here.