Article

SPICE Model Identification Technique of a Cheap Thermoelectric Cell Applied to DC/DC Design with MPPT Algorithm for Low-Cost, Low-Power Energy Harvesting

Department of Industrial and Information Engineering, University of L’Aquila, 67100 L’Aquila, Italy
*
Author to whom correspondence should be addressed.
Appl. Sci. 2019, 9(18), 3744; https://doi.org/10.3390/app9183744
Submission received: 30 July 2019 / Revised: 3 September 2019 / Accepted: 5 September 2019 / Published: 7 September 2019

Abstract

:
In this work, an identification technique of a simple, measurements-based SPICE (Simulation Program with Integrated Circuit Emphasis) model is presented for small low-cost Peltier cells used in thermoelectric generator (TEG) mode for low-temperature differences. The collection of electric energy from thermal sources is an alternative solution of great interests to the problem of energy supply for low-power portable devices. However, materials with thermoelectric characteristics specifically designed for this purpose are generally expensive and therefore often not usable for low cost and low power applications. For these reasons, in this paper, we studied the possibility of exploiting small Peltier cells in TEG mode and a method to maximize the efficiency of these objects in energy conversion and storage since they are economical, easy to use, and available with different characteristics on the market. The identification of an accurate model is a key aspect for the design of the DC/DC converter, in order to guarantee maximum efficiency. For this purpose, the SPICE model has been validated and used in a design example of a DC/DC converter with maximum power point tracking (MPPT) algorithm with fractional open-circuit voltage. The results showed that it is possible to obtain a maximum power of 309 µW with a Peltier cell 2 × 2 cm at a ΔT of 16 °C and the designed SPICE DC/DC converter performance proved the improvement and optimization value given by the TEG model identification.

1. Introduction

Nowadays, energy harvesting and, in general, the research for alternative sources of energy represents a topic of great interest. In fact, the continuous and growing development of new electronic technologies is leading to the spread of an enormous number of new generation portable devices that denote an important change and improvement in the wellness of the humankind. In addition to the well-known smartphones and tablets, examples of new generation portable devices are linked to the Internet of Things and the possibility of making smart remote controlling and monitoring equipment for different applications like home automation [1,2], or the new wearable devices for monitoring biomedical parameters or sport activities [3,4], or wireless sensor networks (WSNs) and autonomous sensors for environmental monitoring [5,6,7,8,9,10,11] or for improving the supply chain and the efficiency of industrial warehouses. Although the quality of life has greatly improved in this sense, this incessant diffusion of portable electron devices leads to an increase in the need for energy sources capable of sustaining their functionality. Batteries have always been considered the primary source of portable energy and therefore many technological advances have been made in order to improve their performance, in terms of capacity per unit of volume and reliability. However, there are many negative aspects linked to such massive use of batteries for portable applications. First of all, disposal and environmental impact. Although eco-sustainable technologies have recently been developed [12], the vast majority of batteries currently in circulation constitute a danger to human health and the environment, as they consist of toxic materials that are difficult to dispose of [13], and an increase in their diffusion would intensify this problem. Secondly, the batteries have a limited duration in time, so they need maintenance for recharging or for replacing them, constituting a cost as well as a limitation for portable devices that benefit from it, especially those sensory autonomous devices used, for example, environmental monitoring, that is dislocated in hostile places and of difficult access.
Therefore, a possible solution to this problem, currently of great scientific interest, is represented by energy harvesting from low-cost alternative sources [14,15,16,17,18,19], with zero environmental impact, that can directly supply ideally infinite energy to portable electronic devices, or at least assist the use of the batteries, prolonging their life and therefore reducing their disposal over time.
There are many alternative energy sources and the related conversion techniques used to date for this purpose. Solar energy, for example, has always been considered one of the most important alternative fonts for both low-power and high-power applications. In this sense, the development of new materials and new technologies for recovering solar energy through photovoltaic panels is constantly evolving, to further improve conversion efficiency and reduce costs [20,21,22].
Another promising energy source is vibrational energy, generated for example by natural oscillations of structures such as bridges, frames of industrial equipment, but also by the very movement of the human body [23,24,25]. The most adopted conversion techniques of this energy are cantilevers with electromagnetic induction or the use of piezoelectric materials. The latter exploit a particular property for which by mechanically altering the crystal lattice of the material itself, a potential difference develops at its ends which is transformed into electric current if closed on a load or, vice versa, it is possible to compress or expand the piezoelectric material subjecting it to a proper voltage. This last effect was the first to be exploited, in the realization of actuators as speakers, but recently is being studied for the possibility of applying piezoelectric materials in contact with vibration sources to recover energy from them. For this purpose, more efficient piezoelectric materials, such as lead zirconate titanate (PZT) [26,27] or relaxor-based ferroelectric single crystals, have been studied [28].
Another important energy recovery technique exploits the known Seebeck effect, for which a thermoelectric material subjected to a thermal gradient generates a potential difference V between the hot and cold ends, proportional to the temperature difference ΔT times the Seebeck coefficient S [29,30]. Therefore, this method allows for recovering electricity from heat. The reverse phenomenon, or the Peltier effect, has been used for many years for the implementation of electronic systems capable of generating heat or cooling, based on the voltage applied to the device, called the Peltier cell. Recently, the Seebeck effect has been analyzed in new generation materials, with the aim of obtaining higher energy conversion efficiencies [31]. However, due to the still high cost and the scarce diffusion of such thermoelectric materials, they do not constitute a suitable solution for low-cost applications. On the contrary, the study of the employment of small low-cost Peltier cells as TEG generators for the recovery of thermal energy and how to maximize the conversion efficiency of such devices can be of great interest, as it constitutes a valid source of alternative energy for portable or wearable devices that require very low power. Among the various applications, the biomedical field is one of the most interesting, since the human body spends energy to maintain a constant temperature level, regardless of the atmospheric conditions of the surrounding environment, within certain limits. It is possible to recover part of this energy dissipated by the human body by using TEG generators, which can supply implantable devices or generic health monitoring sensors [32]. In order to directly feed autonomous, portable devices or to recharge the battery by means of thermoelectric energy harvesting, a constant standard supply voltage should be provided, such as 3.3 V, 1.8 V, etc. However, the output voltage obtained by thermoelectric generators is directly proportional to the temperature gradient and, therefore, it is not fixed to a specific value since it is application dependent. Hence, a DC/DC conversion stage is needed between the source and the equivalent load. This is a key aspect of the thermoelectric energy harvesting system, since the electrical description of the energy source, in terms of SPICE model, is crucial to properly design a DC/DC converter, in order to guarantee the maximum efficiency of operation for the whole system by means of maximum power point (MPPT) algorithms [33,34].
In addition to the previous work [35] conducted by the authors, where a repeatable characterization method for the Peltier cells has been described, in this paper we aim to implement an equivalent circuital SPICE (Simulation Program with Integrated Circuit Emphasis) model of a 2 × 2 cm Peltier module with the goal to easily analyze different multicell configurations in low-temperature difference, as for the human body heat, and provide a circuital design method for DC/DC converters with MPPT, in order to maximize the conversion efficiency by taking into account the real specifications of the thermoelectric generator.

2. Materials and Methods

The behavior of a thermoelectric generator has been firstly analyzed and reported in this section, in order to understand what is the best electrical equivalent model, suitable for low-power, low-temperature difference applications.
A thermoelectric generator is generally constituted by several junctions in series between semiconductors that are n-doped and p-doped, in order to achieve different Seebeck coefficients. In Figure 1, a block scheme of a single n-p couple is represented. The hot-side of the couple has a temperature TH while the cold side presents a temperature TC, lower that TH and because of the Seebeck effect, and electromotive force (emf) S Δ T is generated, where S is the total Seebeck coefficient, and a current I flows in the closed circuit, composed by the single n-p couple and the load RL. Considering the heat supplied to the hot side QH and the heat released from the cold side QC, according to the first law of thermodynamics, it is possible to compute the electric power generated by the thermoelectric n-p couple as
Q H = S T H I 1 2 I 2 R + K ( T H T C ) Q C = S T C I + 1 2 I 2 R   + K ( T H T c ) W = Q H Q C = S I Δ T I 2 R
where R is the electrical resistance of the thermocouple and K is its thermal conductance.
Since the system is closed to a load, the total electrical power W is also equal to I 2 R L , thus it is possible to express the current and voltage provided by the TEG as
V = I R L = S Δ T I R I = S ( T H T C ) R + R L
Therefore, the electrical model of a thermoelectric cell composed by N couples n-doped and p-doped can be simply represented by a voltage generator V T E G = N · V in series with an internal resistance R T E G = N · R . However, the Seebeck coefficient S, as well as the thermal conductance K and the internal resistance of the cell are temperature dependent and, therefore, the behavior of the system is non-linear for large temperature variations. On the other hand, if the temperature variation is small, as well as the temperature difference, (as in the case of human body heat energy harvesting) the system can be considered locally linear [36,37,38].
As a second step of this work, a Peltier cell 2 × 2 × 0.5 cm model TEC1-3103 [39] was analyzed with the aim of determining a method to identify a SPICE model from the acquired data. A specific test platform was therefore created (Figure 1a), which has the role of providing a stable temperature difference between the two sides of the Peltier cell. The system consists mainly of a 22 × 22 cm printed circuit board on a 2 mm thick thermal-controlled aluminum support, a 5 mm glass plate, an aluminum heat sink to be placed on the cold side of the TEG cell, a model S01138812M fan that has the role of cooling at room temperature the heatsink, and a control system managed by a Microchip ATMEGA2560 microcontroller, which communicates via USB–Serial bus with a host PC, where it is possible to control all the parameters of the platform and visualize as well as acquire measurement information by means of a LabVIEW-based HMI (Human-Machine Interface). The Peltier cell is fixed on the glass plate through a 150 µm double-sided thermal conductor, with thermal conductivity of 1.5 W (m · K) −1, also used for fixing and thermally interfacing the cold side of the cell with the aluminum heat sink. In order to prevent the heat, coming from the surface of the aluminum plate surrounding the cell, from affecting the temperature of the heat sink and therefore of the TEG cold side, the remaining glass surface was covered with an adhesive thermal insulator having a thermal conductivity of 0.0375 W (m · K)−1. Finally, a 100 kΩ negative temperature coefficient (NTC) thermistor is positioned immediately below the aluminum plate for monitoring and controlling the heater using a PID algorithm implemented on the microcontroller firmware, while a second thermistor of the same type is used to measure the temperature of the heat sink, in order to know and check the temperature difference between the two sides of the cell. The output of the cell is then connected to the programmable DC electronic load BK8600 by B&K Precision, which is controlled by the LabVIEW software and emulates the equivalent output resistive load, performing a resistive sweep and providing instantaneous output voltage and current of the cell under test. The final implementation of the system is illustrated in Figure 2.
The test system was then employed, to characterize the cell at three values of temperature difference between the aluminum bed and the heatsink
ΔT1 = Tbed,1 − Theatsink,1 = 4 °C;
ΔT2 = Tbed,2 − Theatsink,2 = 8 °C;
ΔT3 = Tbed,3 − Theatsink,3 = 16 °C.
A temperature difference lower than 4 °C was not considered, since the thermal conductance K is not infinite and the temperature between hot and cold side tends to equalize, leading to a system collapse, while temperature differences higher than 16 °C were not investigated, according to the real scenario of low temperature, low power energy harvesting as from human body heat.
For the SPICE model identification, a simple electrical description has been considered here to represent the TEG cell [40], which consists of an ideal generator VTEG in series with an internal resistance RTEG (Figure 3). The equivalent voltage supplied by the internal generator relative to this model is given by the temperature gradient applied between the two faces of the cell multiplied by the Seebeck coefficient S, which should be obtained from the measurements. The internal resistance of the model is also temperature-dependent, as is the resistivity of each material, so it is necessary to calculate its thermal coefficient, that could be positive or negative.
The expressions of VTEG can be identified from the measured data by comparing the measured open-circuit voltages with the values of the chosen temperature differences
S T E G , 1 = V o c 1 Δ T 1 , S T E G , 2 = V c o 2 Δ T 2 , S T E G , 3 = V o c 3 Δ T 3 S T E G =   1 n i = 1 n S T E G ,   i ,   n = 3
where VOCi is the measured open-circuit voltage at the temperature difference i.
The internal resistance RTEG can be computed, at each temperature gradient of analysis, by means of the voltage divider rule, where Vout is the output voltage of the cell over the equivalent load
R T E G = V T E G , Δ T i V o u t , Δ T i V o u t , Δ T i · R L o a d , i , i = 1 , 2 , 3
Therefore, measurements are used to obtain a polynomial expression of the first order
R T E G , i =   α i Δ T i + β i R T E G =   1 n i = 1 n α i · Δ T + 1 n i = 1 n β i = α · Δ T + β n = 3
where α represents the thermal coefficient while β is a fixed resistive term.
Once the SPICE model has been obtained by means of the above-described method, parametric load sweep simulations can be conducted and data can be compared with measurements, in order to validate the model at different temperature differences. The same procedure can be replicated with two or more TEG cells with different interconnection configurations, in order to verify the model validity even for multicell applications.
The final step is to use the aforementioned multicell TEG SPICE model for a design example of a DC/DC converter with MPPT algorithm, in order to maximize the conversion efficiency. For this purpose, a conventional boost converter has been considered, with ideal components, as depicted in Figure 4. As for many low-power portable or autonomous application, its is very important to harvest the maximum available power from the source, in order to guarantee high itegrability, with the usage of small batteies. The MPPT here plays this role, therefore a DC/DC with maximum powerpoint track algorithm works more as a power pump, where the output voltage is amplified, with respect to the input, according to the system load, in order to extract the maximum energy from the source [41,42,43]. This can be employed to directly charge a battery or to directly feed digital systems that do not require a stable power supply. If a fixed voltage regulation is also needed, combined with MPPT, usually the latter works as a pre-regulator for a second DC/DC with fixed output voltage [44]. In Figure 4, an example of an energy harvesting power management system with both MPPT and regulated voltage is depicted, as S. Alli et al. reported in [45]. In this case, The system is composed of a first stage DC/DC converter, which is controlled by an MPPT block that has the role to modulate the PWM (pulse width modulation) of the switching frequency f1, in order to guarantee the maximum transferred power at the output. The latter is delivered to a battery and to a storage capacitor CSTORE, so as to harvest the maximum available power. The output of this first stage is then delivered to a second standard DC/DC converter, which provides a fixed regulated voltage to the system load. In this case, a bandgap voltage reference is needed for the output voltage regulation loop. Such a configuration can store the excess of energy that is not instantly requested by the output load into the battery with the maximum power conversion efficiency, while a fixed voltage VREGULATED is even supplied, together with the MPPT regulated voltage VOUT. Another possibility is to exploit the MPPT algorithms to instantly disable the fixed output voltage when the system load requires higher power than the available energy, in order to perform a sort of PWM output modulation that helps to keep the input voltage near the maximum power point [46]. In this case, usually a supercapacitor is employed to store power to be supplied when the energy source is temporarily unavailable or when the system requires more power.
Referring to Figure 4, the purpose of this work is to show how the proposed technique to identify a simple LTSPICE model for the TEG cell can improve the design procedure of the first stage MPPT converter, which affects the power conversion efficiency of the harvetseng thermal energy. Therefore, a design example of the first DC/DC (grey dashed box) stage is presented in the following pages, since the second conversion stage is considered standard and not always requested.
As well known, the operation modes of the boost converter converter can change, based on the current flowing through the inductor L. If the current does not go to zero, the converter operates in continuous mode, where
V o u t = V T E G 1 1 D I T E G = I O U T 1 D
where D is the Duty cycle of the square wave signal that controls the switch S.
From Equation (6), is evident that the equivalent input resistance of the converter that drives an output load RL is not constant, since
R D C / D C = V T E G I T E G = V o u t ( 1 D ) I o u t 1 D = V o u t I o u t ( 1 D ) 2 = R L ( 1 D ) 2
From Equation (7) it can be stated that the equivalent input resistance of the DC/DC converter depends on the output load and the switching signal duty cycle. The same dependence of the output voltage and current, thus the equivalent DC/DC input resistance, from the duty cycle and the output load occurs when the converter operates in discontinuous mode, for which the current flowing through the inductor goes to zero during a single operation cycle
V o u t = V T E G + V T E G 2 D 2 T 2 L I o u t I o u t = V T E G 2 D 2 T 2 L ( V o u t V T E G )
where T is the time period of the switching signal.
According to the well-known maximum power transfer theorem, to extract the maximum power from the TEG source, the equivalent input resistance R D C / D C of the converter should be equal to the source resistance R T E G . Therefore, a control algorithm for the DC/DC is needed, in order to dynamically adjust the converter input impedance to guarantee the maximum power transfer. For this reason, many MPPT algorithms have been developed and described in the literature. They differ for complexity, number of sensors or required measured data, They differ for complexity, number of sensors or required measured data, efficiency, and hardware, and can be classified into two major categories. The first continuously track voltage and current, in order to dynamically adjust the power operation point, without the need for any empirical information. Algorithms like perturb and observe (P&O), incremental conductance (IC), or hill climbing (HC) belongs to this category [47,48,49] and are characterized by high hardware, complexity, continuous functionality, and high efficiency, especially if the behavior of the energy source is unknown. Other MPPT techniques like fractional open-circuit voltage (FOCV) or fractional short-circuit current (FSCC) requires less complexity and measured data, without the need of continuously track the input voltage and/or current since they rely on a priori information about the source [50,51]. These algorithms represent the second category of MPPT techniques. The drawback of such type of algorithms is the conversion efficiency, which is affected and lowered if the knowledge and description of the source are not accurate.
The identification of the TEG cell SPICE model enables the usage of a priori MPPT techniques for thermal energy harvesting, which are better in terms of occupied hardware area, cost, and complexity. For the purpose of this work, a FOCV technique has been selected for a design example. The technique expects that the source output voltage corresponding to the maximum power point is linearly proportional to the source open-circuit (OC) voltage with a constant K coefficient. Therefore, the goal of this algorithm is to measure the open-circuit voltage and modulate the required source current, in order to guarantee the output voltage is a constant fraction K of the OC measured voltage. The adopted scheme is depicted in Figure 5.
In this scheme, the MPPT algorithm is divided into two working steps, that are repeated over time.
• Step 1:
In the first step, the switch S1 is open while S2 and S3 are closed. The capacitor C is then charged at a voltage VA as
V A = V T E G ,   O C R 2 R 1 + R 2 = K · V T E G ,   O C
where V T E G ,   O C is the open-circuit output voltage of the TEG cells, since S1 disconnects the source from the DC/DC, thus no load is attached. The resistors R 1 and R 2 value should be high enough so as to not affect the open-circuit voltage. In this case, the charging time constant τ is equal to K · C , therefore the value of the capacitor should be small, in order to reduce the charging time and, consequently, the duration of the voltage sensing step. On the other hand, if the capacitor value C is too small, the charge retention could be affected by the input polarization current of the differential amplifier. Therefore, a compromise should be considered between these two conditions.
The duration of this step should be as low as possible, since the input of the DC/DC converter is disconnected at this stage, in order to properly sense the MPPT information.
• Step 2:
In the second operative step, the switch S1 is closed while S2 and S3 are opened. This constitutes the normal operative condition, where the TEG cells output is connected to the DC/DC for voltage boost. The instantaneous value V T E G is continuously compared with the voltage V A stored by the capacitor and the difference signal e represents the error, that is employed to modulate the duty cycle of the DC/DC switching signal, in order to set to zero the difference between the sampled voltage and the output voltage of the source.

3. Results and Discussion

In this section, experimental data for the description of the Peltier cell and the relative SPICE model are reported, as well as a design example of an ideal DC/DC converter with FOCV MPPT algorithm, considering the obtained SPICE model for the optimization.

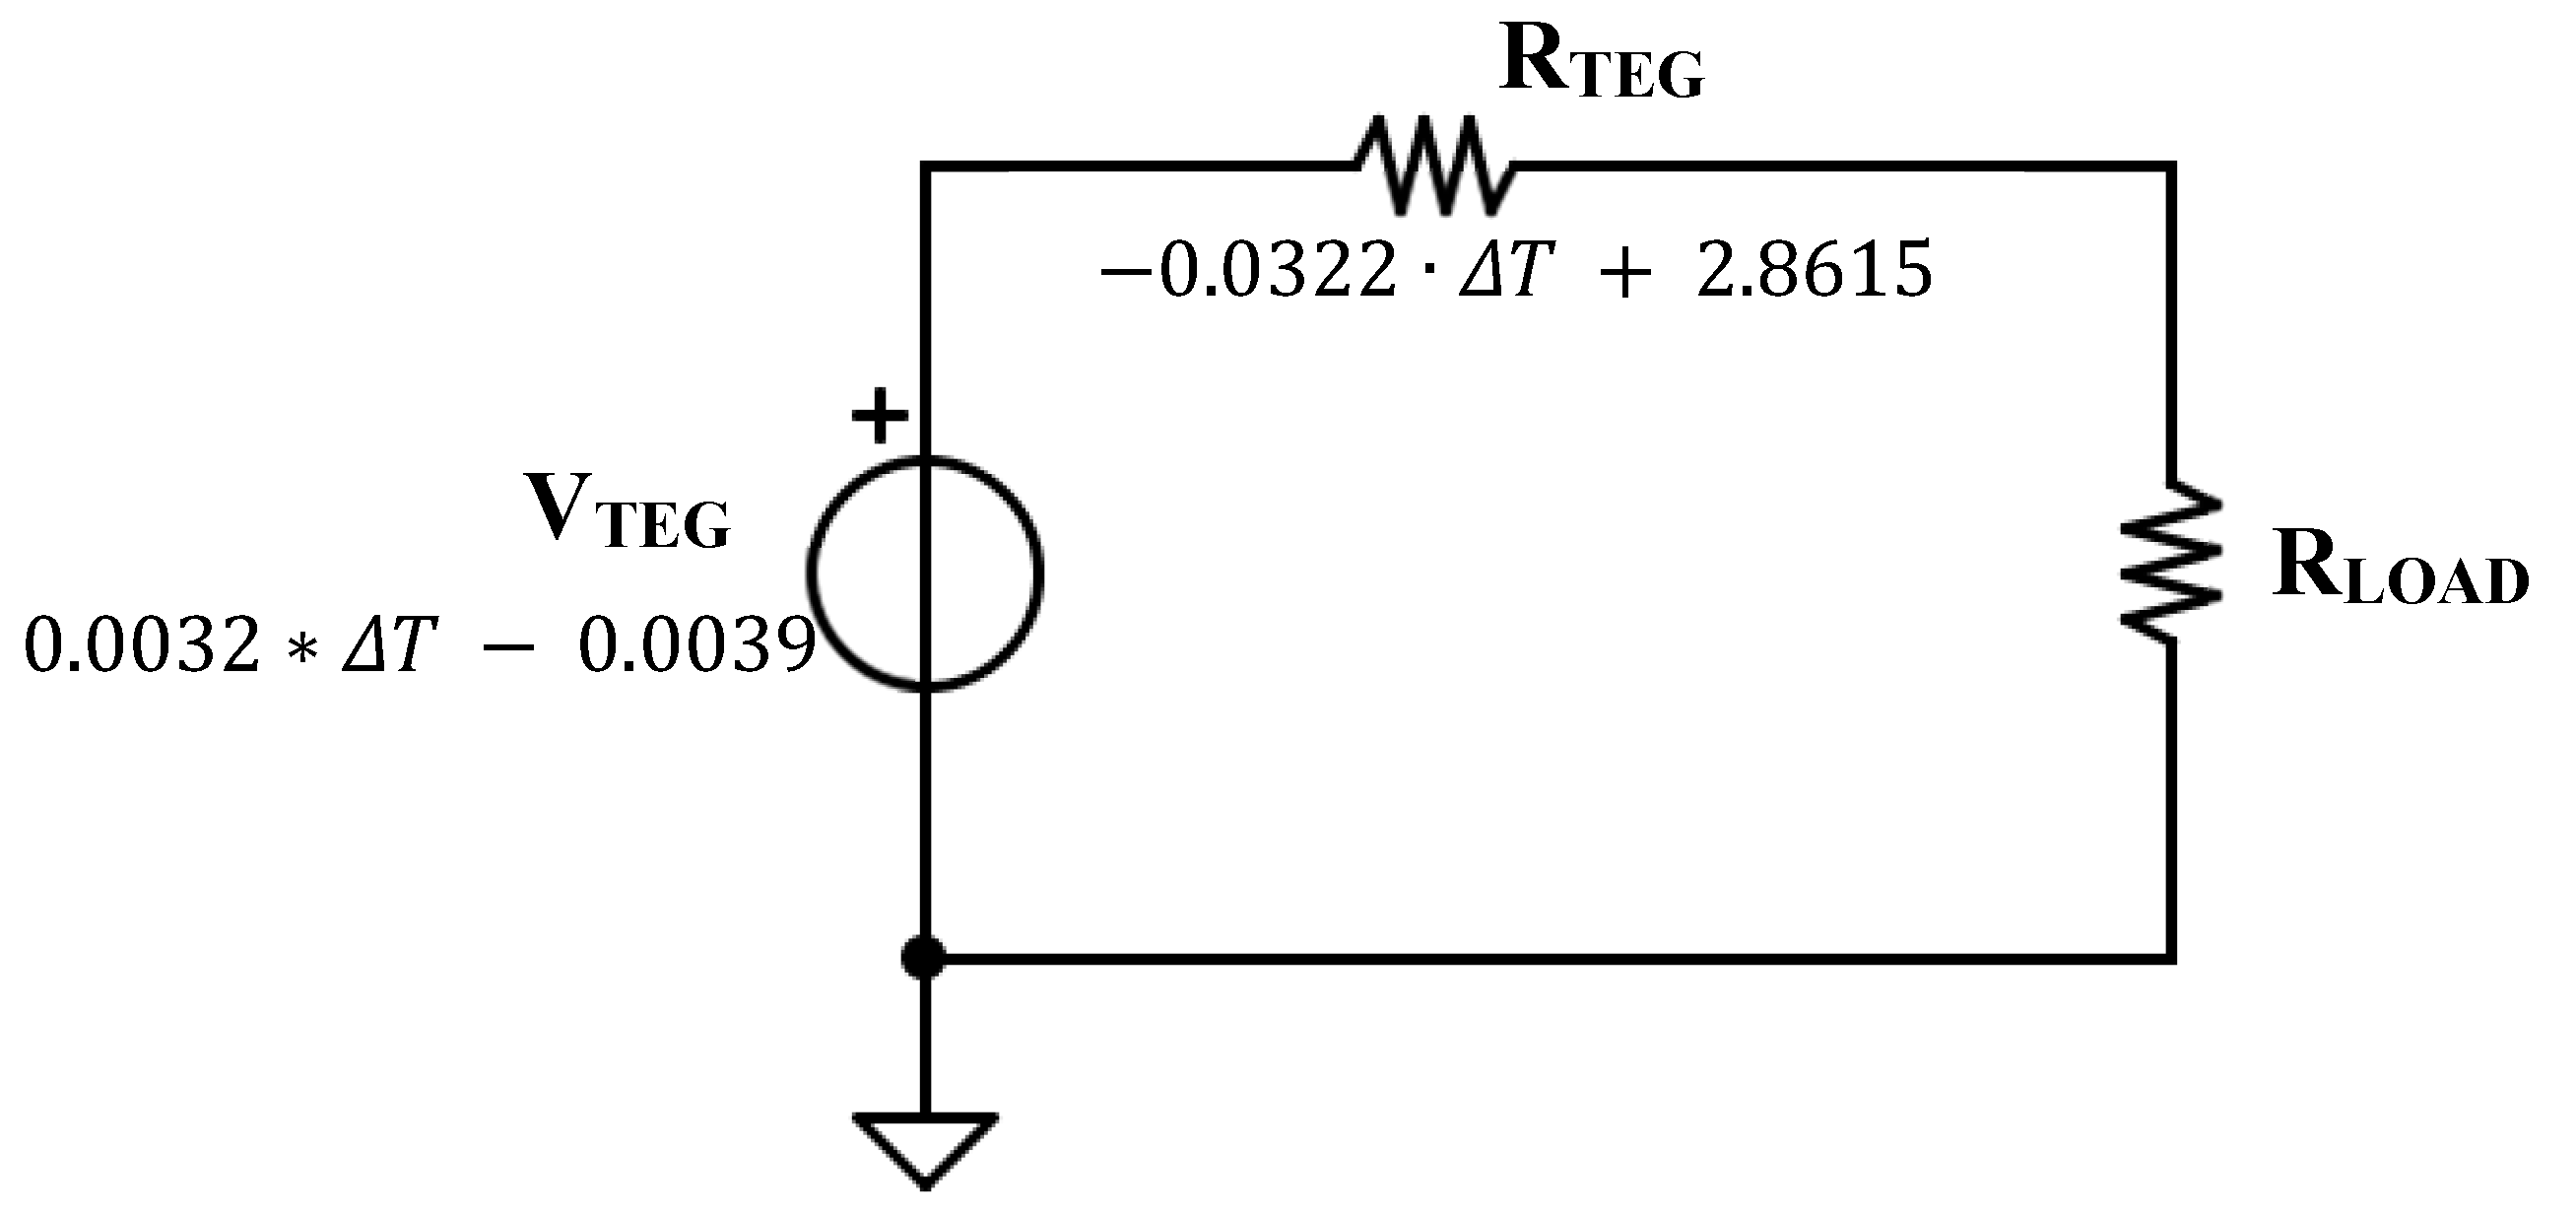
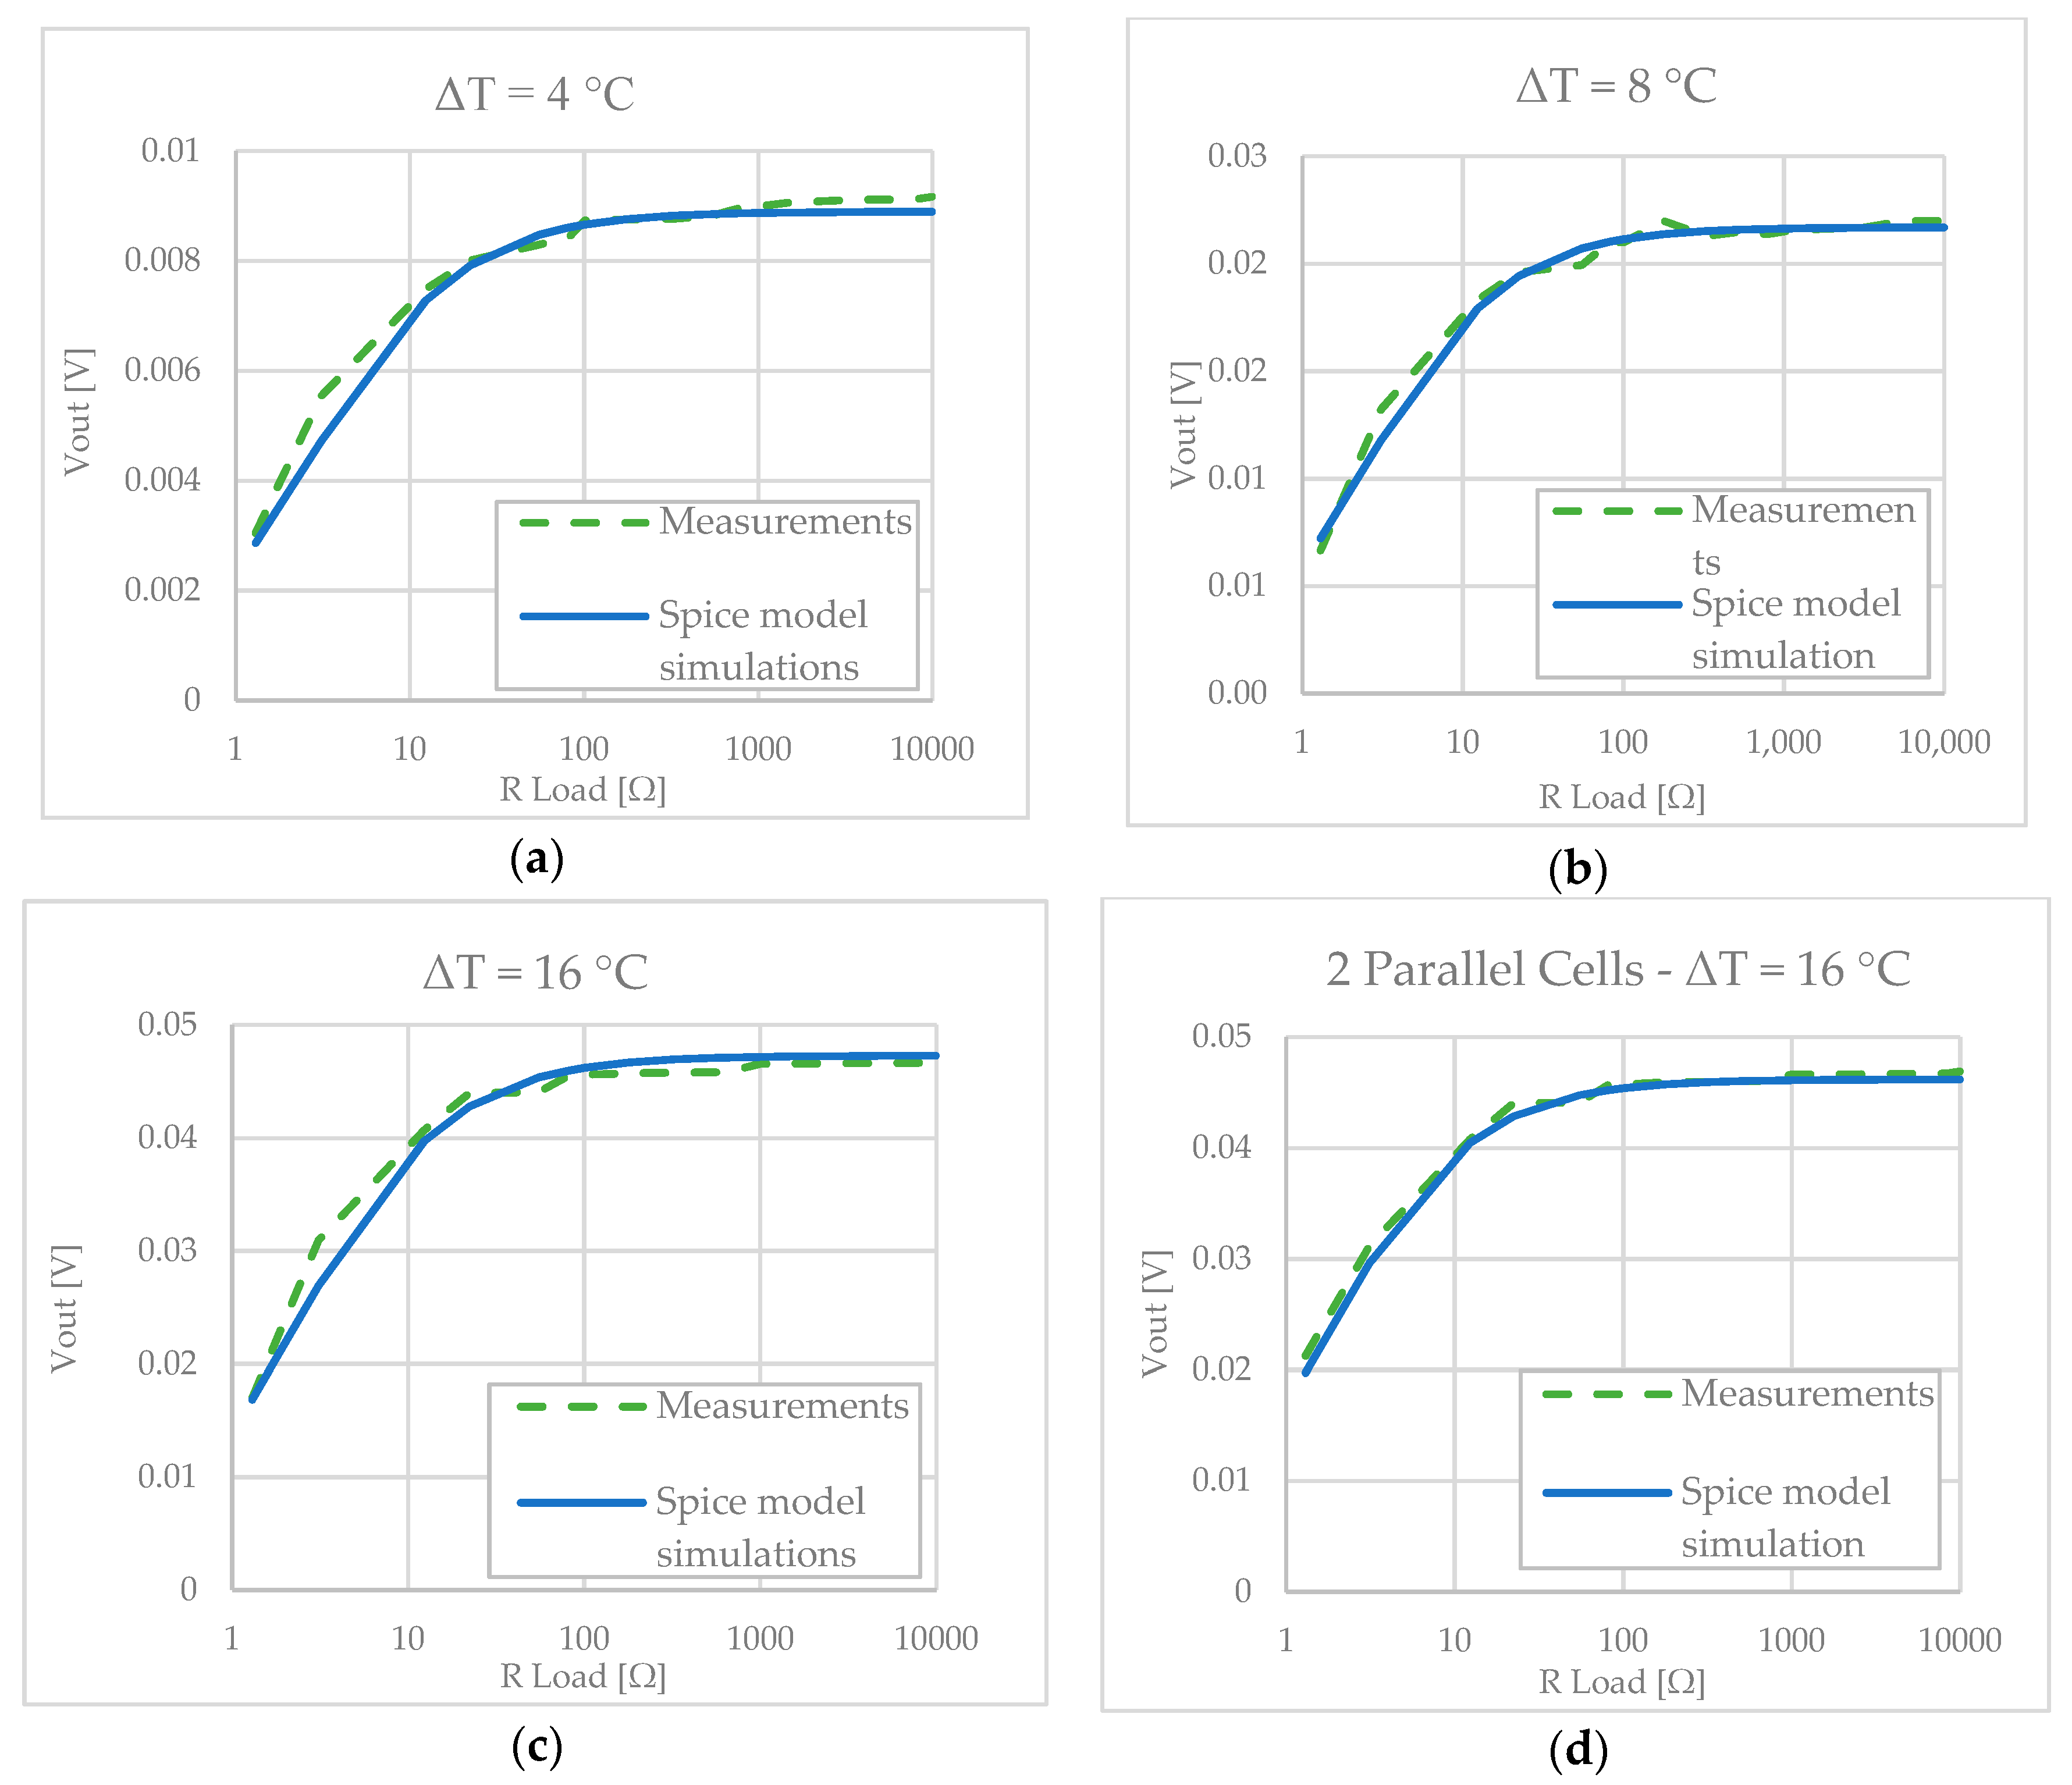
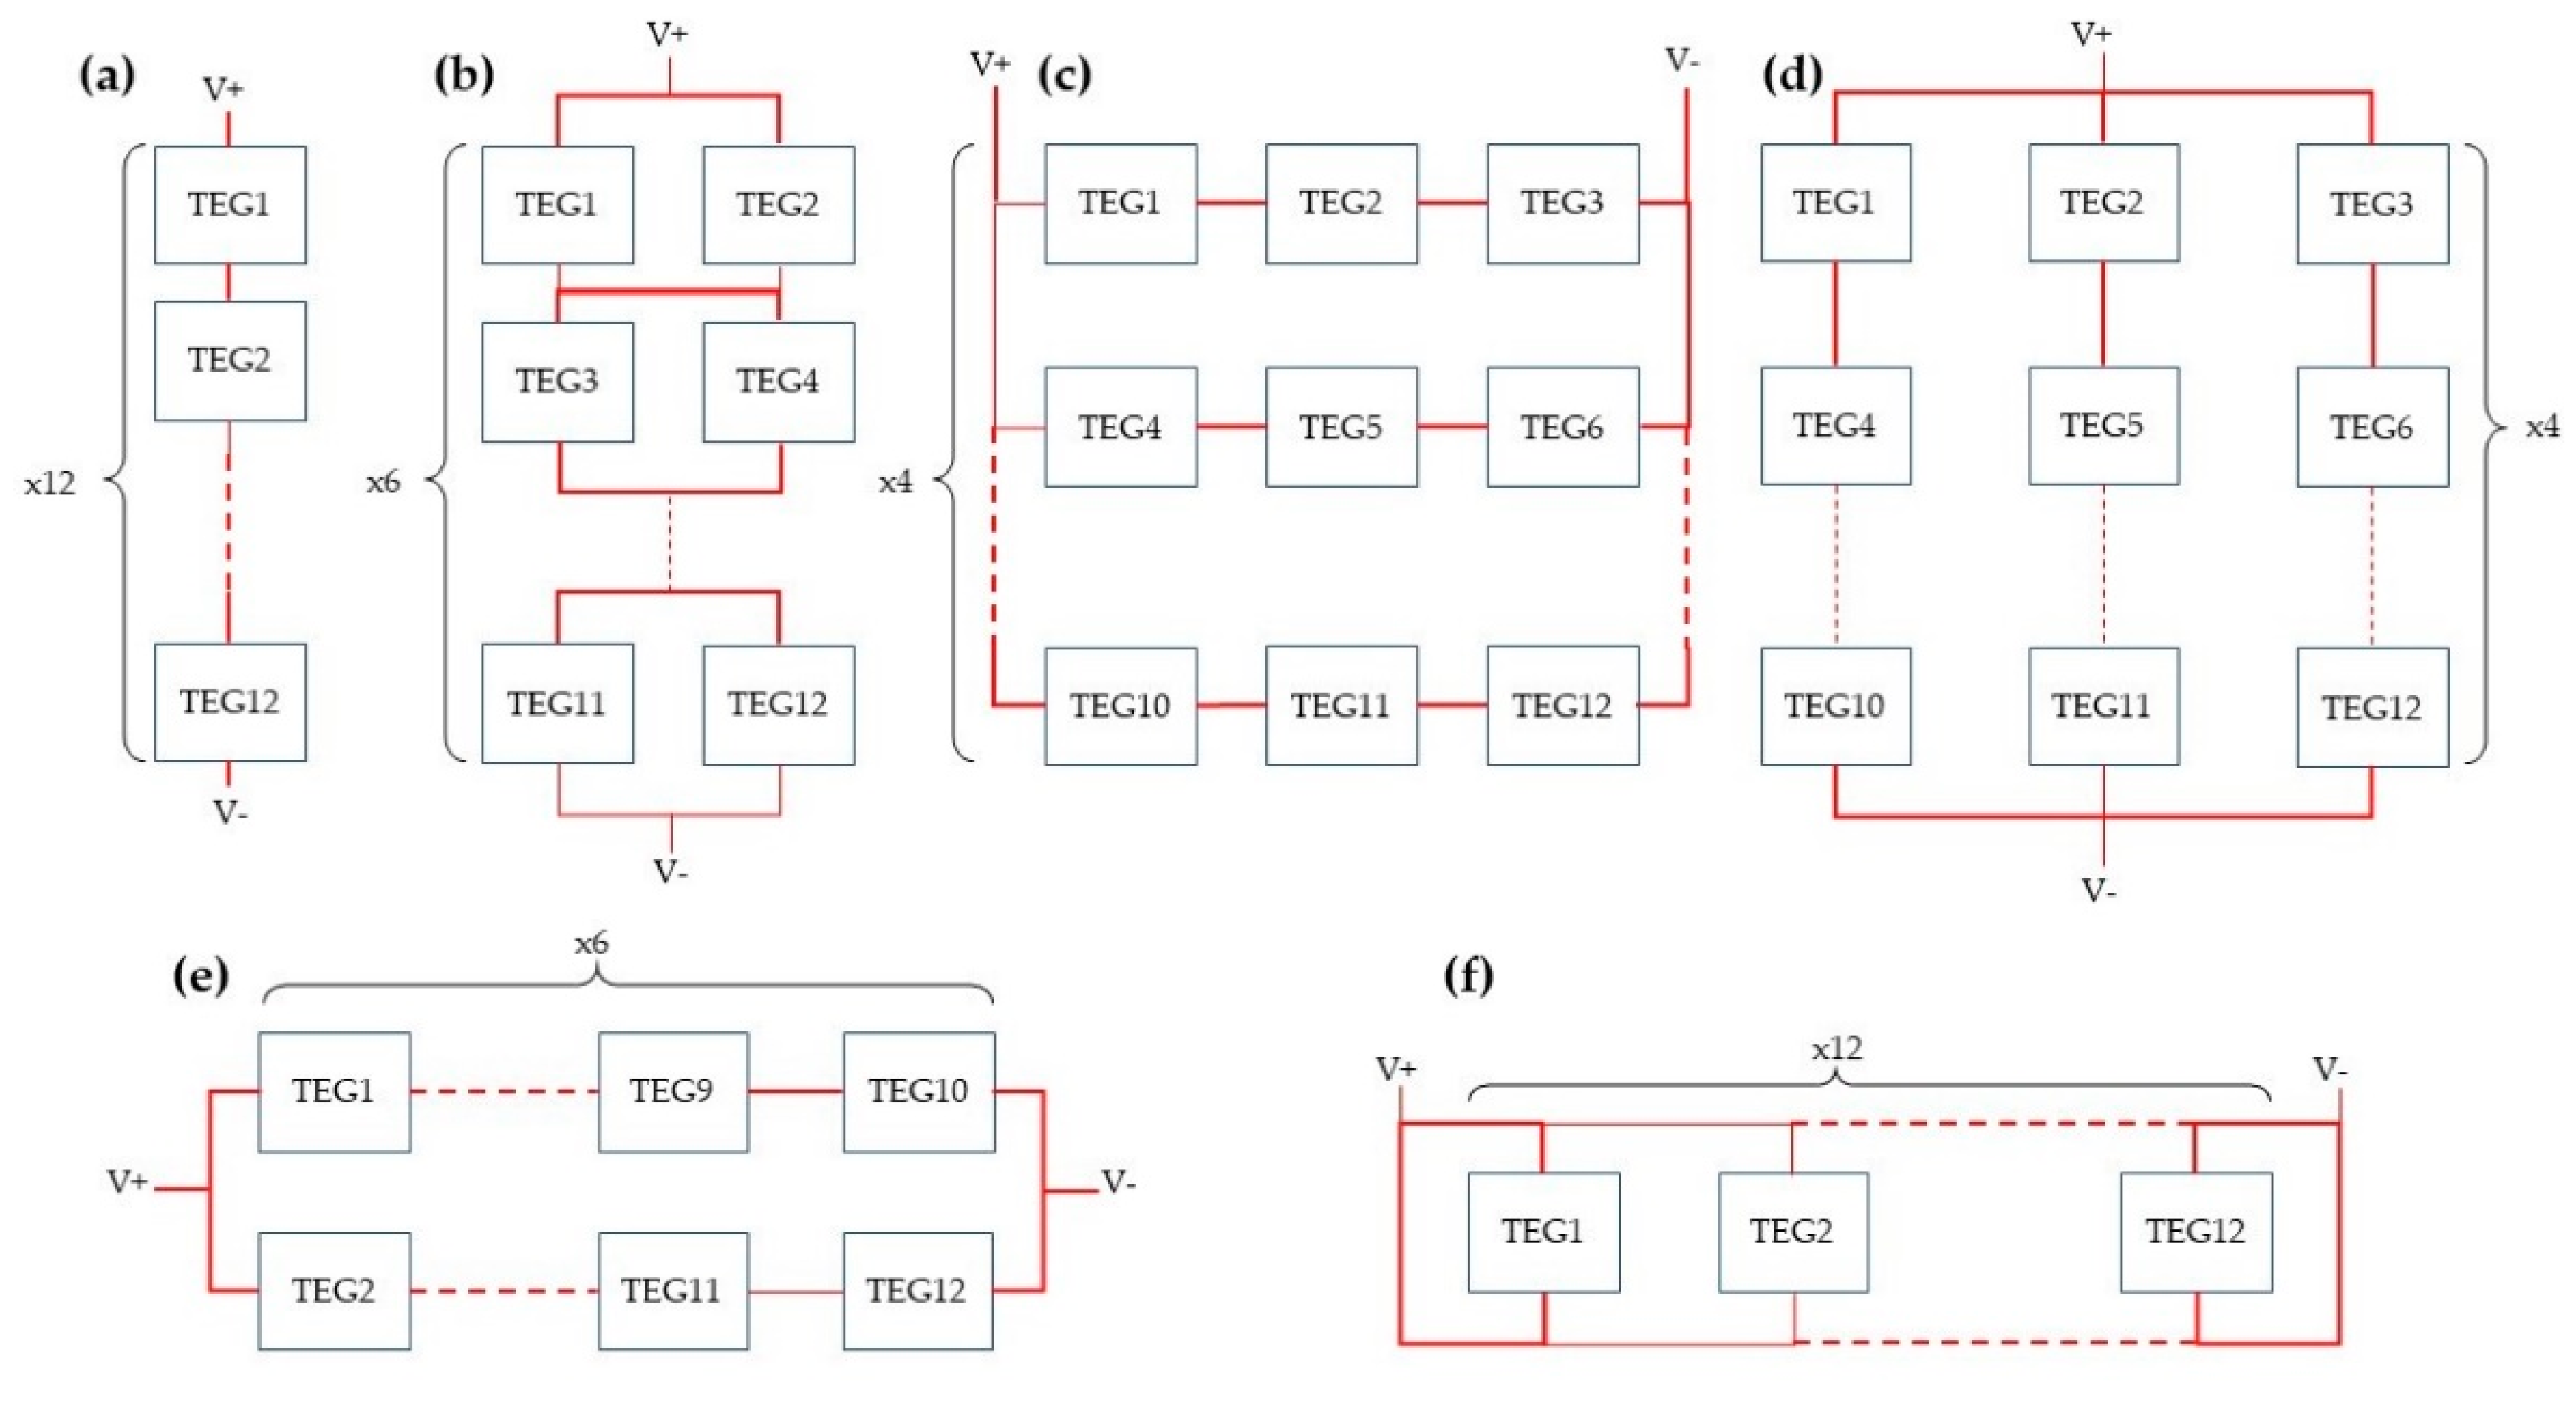
3.1. SPICE Model Identification

In Table 1, information about open-circuit voltage, short circuit current, and maximum power have been measured and reported, for each temperature difference ΔT of analysis.
Following Equations (3) and (5), is then possible to obtain the SPICE model of a single TEG cell once has been characterized, as shown in Figure 6.
The obtained SPICE model is then verified by means of load sweep simulations firstly for the single cell, to relate it with measured data (Figure 7a–c). Consequently, two cells have been connected in parallel and simulations have been compared with real measurements acquired with the test platform, performing a load sweep as in the previous characterization (Figure 7d). Results demonstrate that the model is useful even for multicell simulations since the obtained data are in good correspondence with the acquired measures.

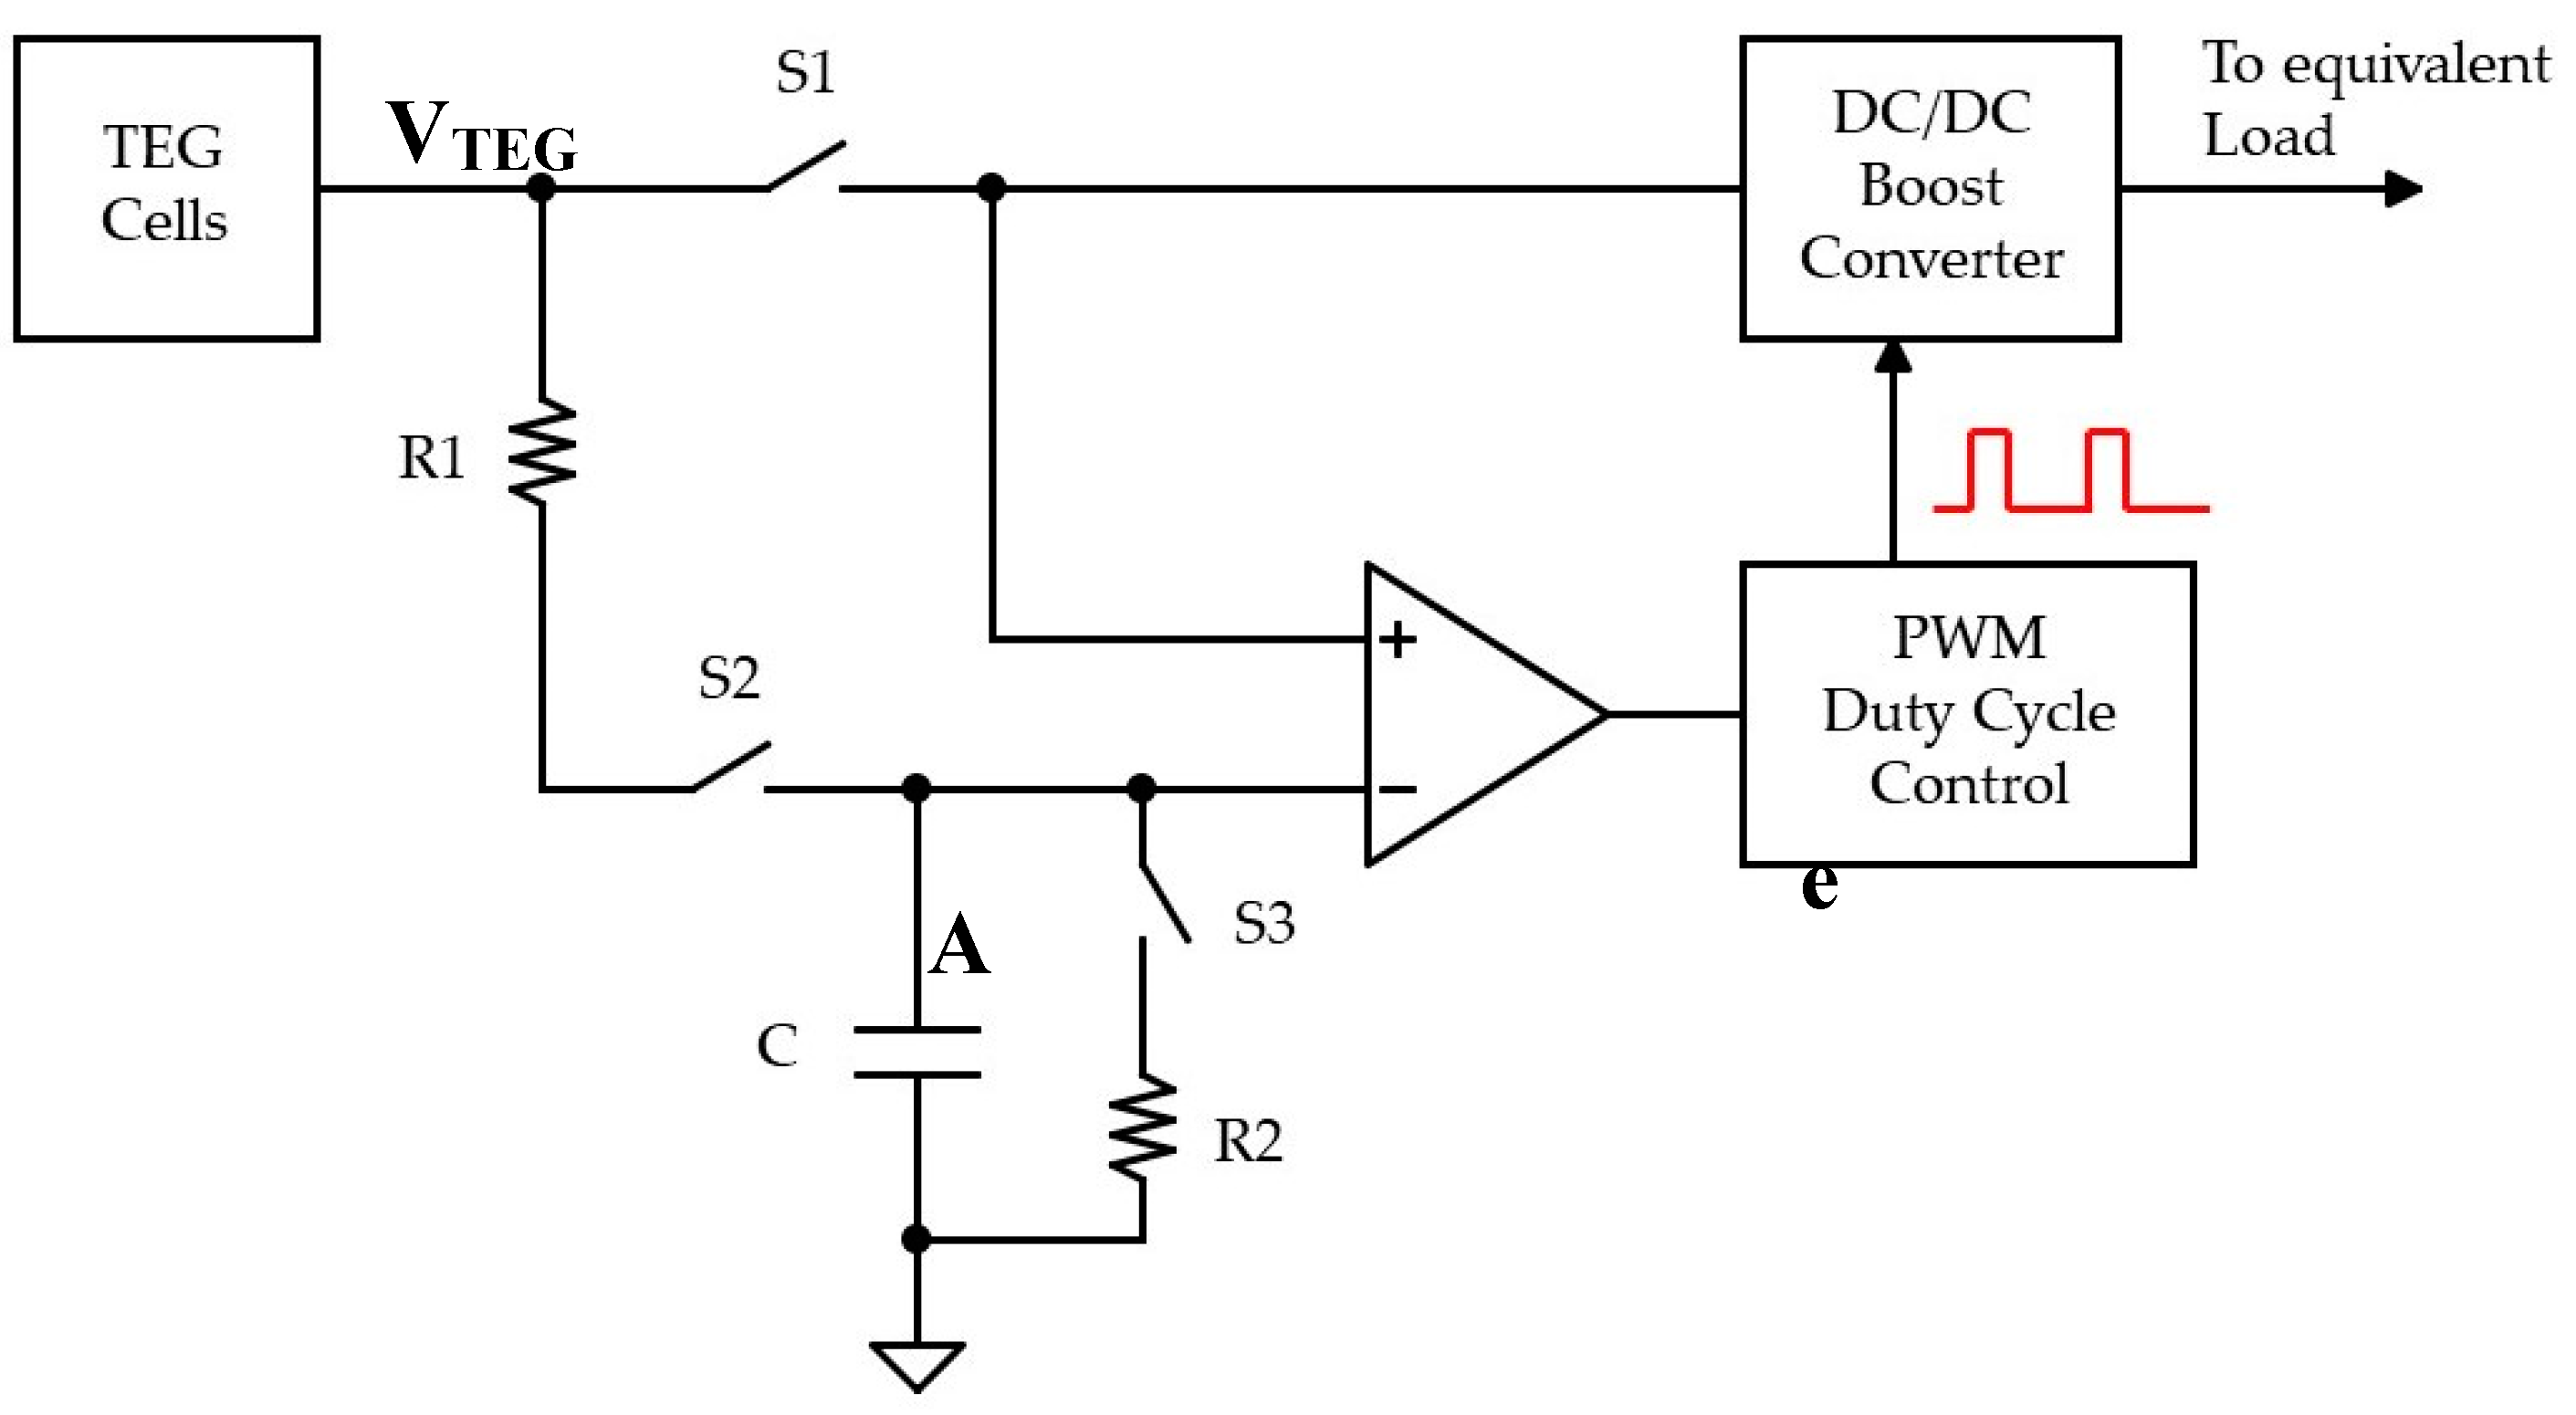
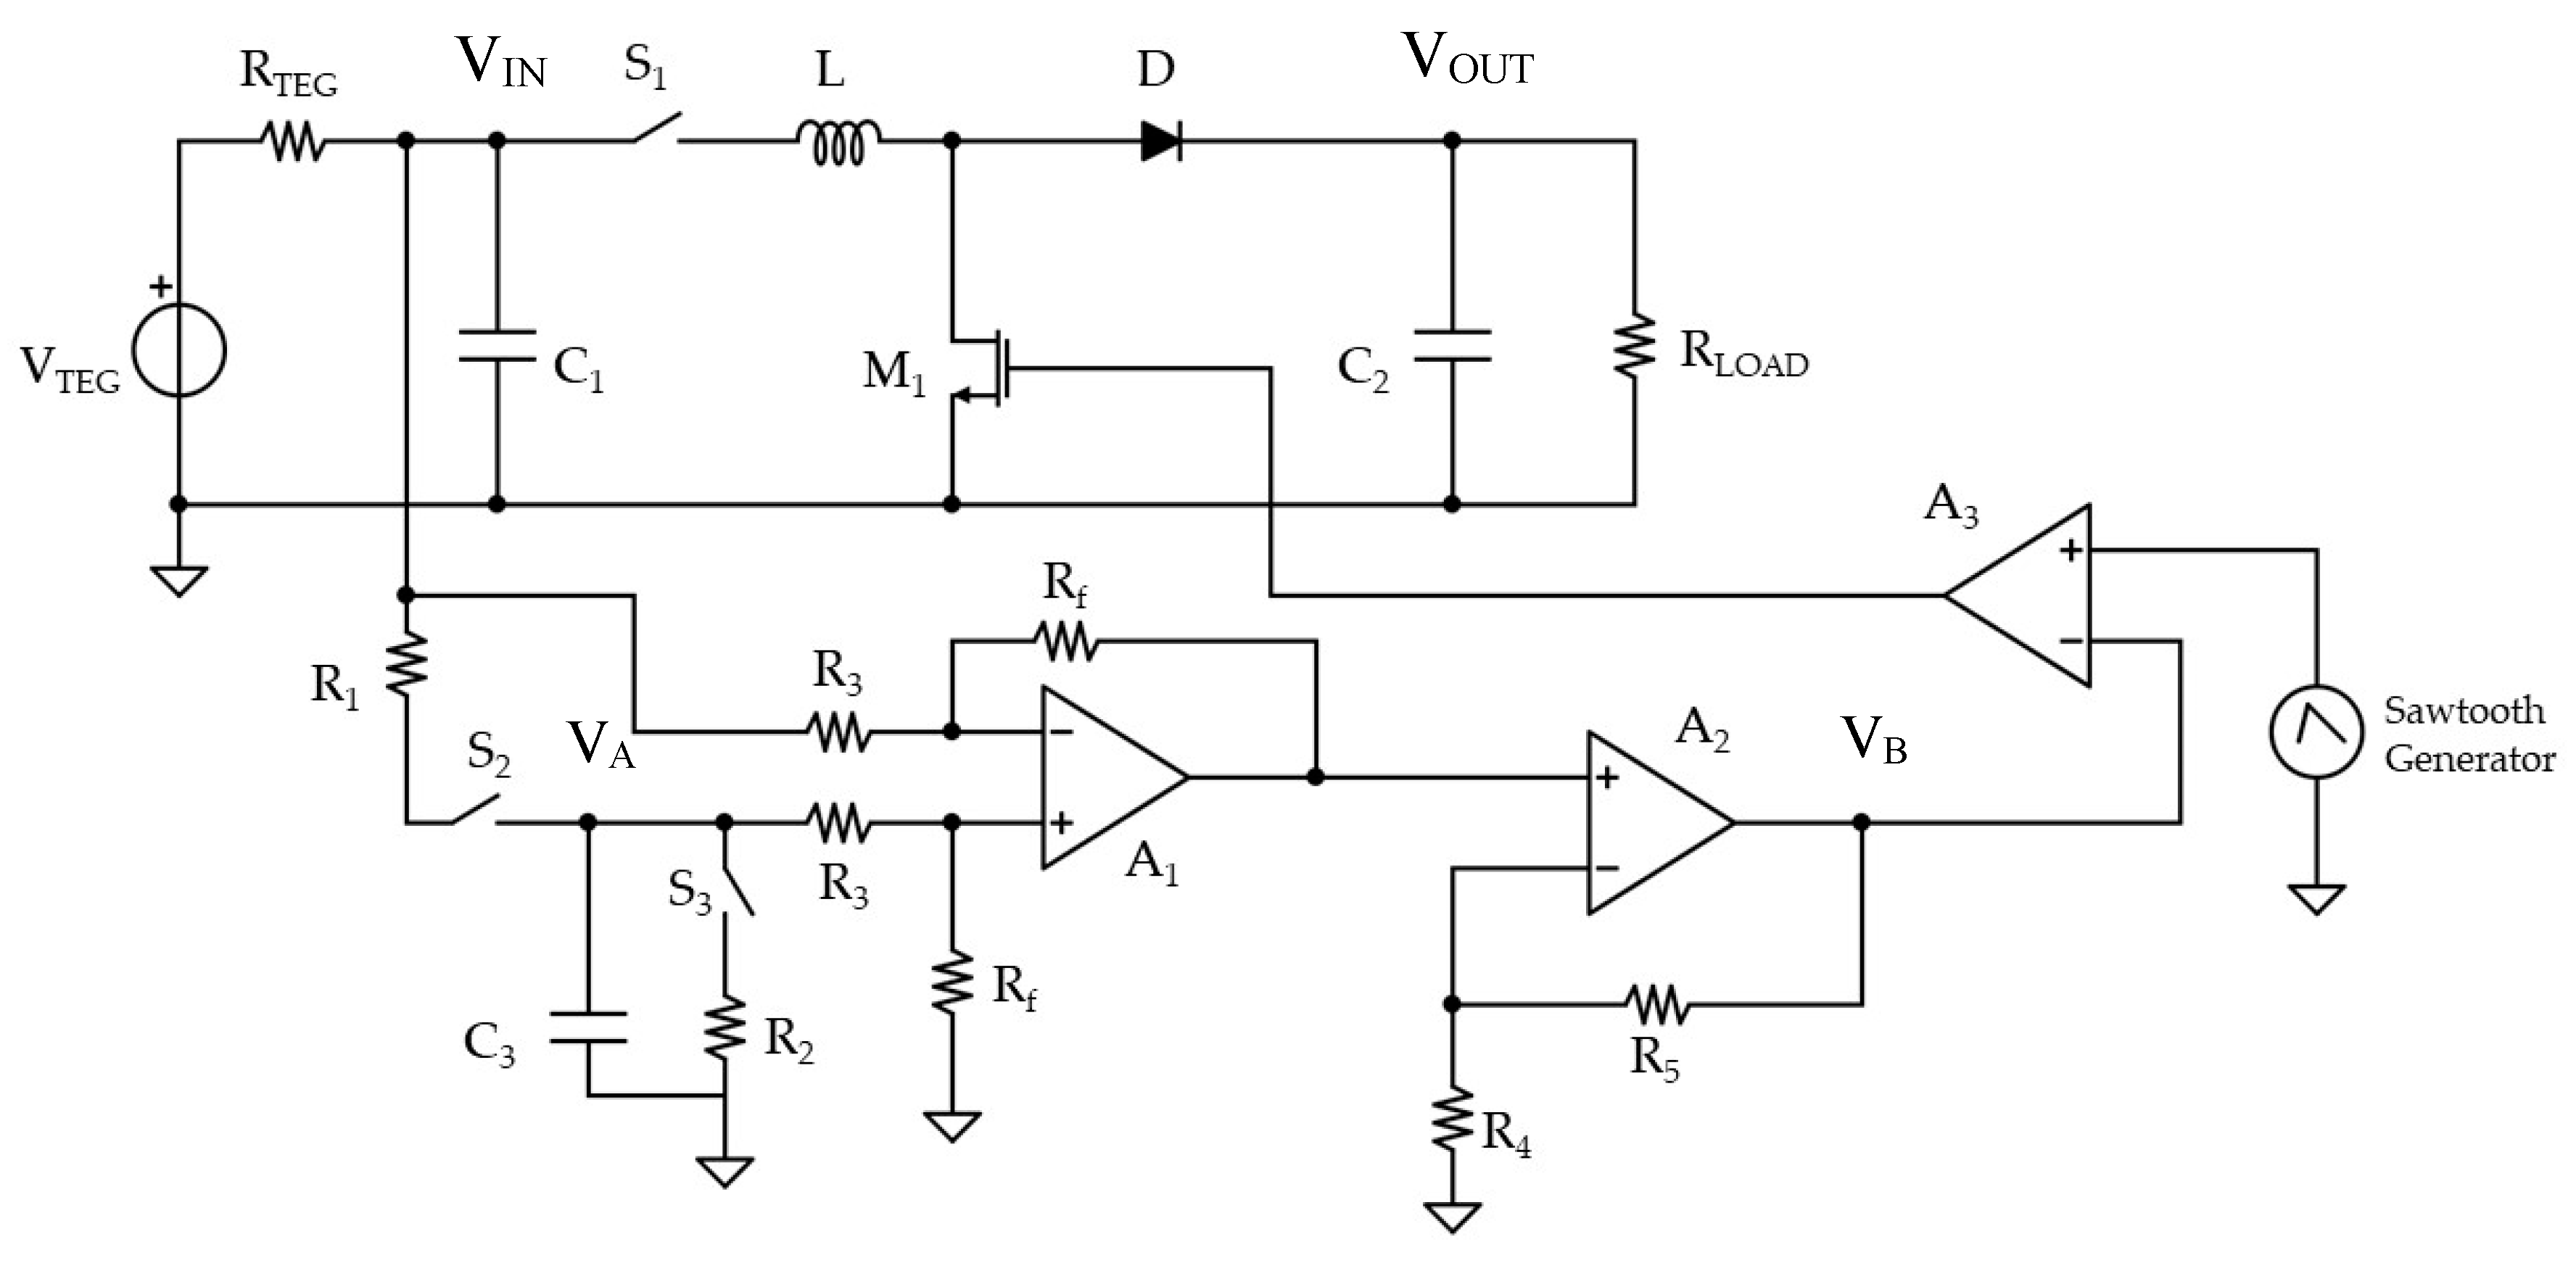
3.2. DC/DC with MPPT Design

For the DC/DC design, a multicell configuration with 12 Peltier modules has been considered. First, it is necessary to analyze the equivalent SPICE circuit in order to identify the best connection strategy. Among all the possible configurations, six architectures have been considered, as depicted in Figure 8.
For each configuration, a load sweep analysis has been performed, in order to obtain the current–voltage (I–V) characteristic trace, as well as the power–voltage (P–V) characteristic curve for a temperature difference of 16 °C (Figure 9).
From the multicell simulation analysis, it can be inferred that the power-voltage curve is a paraboloid, being the equivalent circuital model of a single cell constituted by a simple voltage generator in series with an internal resistor. For 12 cells all connected in series (Figure 9a), the maximum power point is located exactly at VOC/2, while this point translates to the left, towards a lower voltage value, as the configuration tends to a parallel connection [52]. For 12 cells all connected in parallel, the maximum power point falls out of the lower simulation range for the load sweep. From the obtained results, it can be inferred that the best configurations are the 4 × 3 or 3 × 4, since it is a compromise between the output voltage and current, and the loss of conversion efficiency due to a possible heat distribution unevenness for the hot side among the cells. On the other hand, from the electrical point of view, the voltage provided by the TEG array should be as high as possible, in order to reduce the DC/DC design critical issues. For this reason, the full series configuration of the 12 cells has been selected in this case for the DC/DC design example, assuming that the temperature difference is uniform for every cell, since the corresponding voltage of the maximum power point is higher, which helps the DC/DC converter to boost the output voltage. In fact, the lower is the input voltage, the more is the complexity of a real DC/DC converter in order to guarantee the voltage translation, since limitations and parasitic elements of single electronic devices that constitute the converter architecture can inhibit its functionality when the input voltage is too low.
Once the configuration of operation has been selected, it is necessary to analyze the power–voltage curve at different temperature differences, in order to verify that the maximum power point condition is constant for every operative condition. According to previous single-cell characterization for SPICE model identification, the voltage value of the equivalent circuit is linearly dependent on the temperature gradient, thus the P–V curve shape is expected to remain unaltered, as depicted in Figure 10, where a load sweep analysis has been performed for 12 TEG cells connected in series at different ΔT values.
The simulation shown in Figure 10 demonstrates that the maximum power point condition for series-connected multicell TEG source, at every temperature difference, is equal to
V T E G ( Δ T ) | P M A X ( Δ T ) = 1 2 V O C ( Δ T )
Recalling Equation (9) for the FOCV MPPT algorithm, the voltage divider coefficient K for the fractional open-circuit voltage sampling should be equal to 0.5, so as to guarantee the maximum power point condition for the selected multicell source.
Finally, the utility and usage of the Peltier cell SPICE model have been proved by proposing a design example of a DC/DC boost converter with FOCV MPPT algorithm (Figure 11), to demonstrate how the design can be conditioned and optimized by considering a real source model instead of an ideal generator.
In this design, the selected switching frequency of the PWM signal is 200 kHz, which is obtained by means of a sawtooth generator and the ideal comparator A3. The latter continuously performs the difference between the reference sawtooth signal and a DC voltage value coming from the MPPT feedforward network, producing an output square wave, that controls the transistor M1, where its duty cycle is proportional to the VB voltage level. In this design example, an ideal built-in block of LTSPICE has been employed regarding the sawtooth generator, while a reference for a possible real implementation can be found in [53].
As mentioned in the previous paragraph, the fractional open-circuit voltage sensing is performed by closing switches S2 and S3 and opening the switch S1, in order to store the maximum power point voltage level by means of the capacitor C3. Here, an additional 100 nF capacitor C1 has been added at the output of the TEG source, in order to retain the output voltage during the switching transients. For the capacitor C3, a value of 1 μF has been chosen, while a resistive value of 10 kΩ has been selected for both resistors R1 and R2. The difference between the FOCV value and the instantaneous output voltage of the source is computed by means of the ideal op-amp A1 in differential amplifier configuration. All the resistors R3 and Rf have the same value of 200 kΩ. The PID algorithm introduced in the scheme of Figure 5 is here simplified to only a proportional contribution, represented by the non-inverting amplifier A2, where the gain has been set to 3, by means of the resistors R4 and R5.
The inductor selection criterion is crucial for the DC/DC functionality. As a rule of thumb, the higher the inductor value, the higher the maximum achievable current at the output of the converter is, thanks to the reduced ripple. On the other hand, if the inductor value is too high, it can affect the cost and size of the solution, as well as the efficiency, because of the equivalent series resistance. Therefore, the minimum inductor value can be selected as follows, recalling Equation (6) and by considering the desired maximum output current
L m i n = V T E G ( V o u t V T E G ) Δ I L · f S · V o u t
where f S is the switching frequency and Δ I L represents the predictable output ripple current. A good estimation of the ripple value is 20% to 40% of the maximum output current
Δ I L = ( 0.2 ÷ 0.4 ) · I o u t , M A X · V O U T V T E G
In this design example, by applying Equations (11) and (12), and considering the multicell source characterization, with a maximum operating temperature difference of 16 °C, the inductor value L has been fixed to 1 mH.
Regarding the Op-Amps A1, A2, and A3, a generic component has been used, with an open-loop gain of 50k and a GBW (Gain BandWidth) of 10 MHz. The transistor M1 was chosen to have an Ron equal to 1 Ω and a threshold voltage of 500 mV, while the diode D1 is a Schottky barrier with a forward voltage of 150 mV at 1 mA.
The first system simulation, depicted in Figure 12, represents a load variation for 12 TEG cell connected in series with a 16 °C temperature difference. In the first region of the graph, the input is not connected to the DC/DC and the fractional open-circuit voltage is stored in the capacitor C3. The sensing time period is fixed to 30 ms, which is enough for the capacitor to be charged at 0.3 V, that is half of the open-circuit output voltage of the source. At the end of this time window, the converter switches from sensing mode to operative mode, thus the MPPT circuit is disconnected from the TEG output, which is attached at the DC/DC input by means of the switch S1. In order to guarantee the maximum power operative point for the source, considering a DC/DC output load of 2 kΩ, the output voltage is boosted up to 2.4 V. At the end of the region 2, the resistive load changes from 2 kΩ to 1 kΩ. As can be observed, the output voltage is suddenly decreased, in order to keep constant the input voltage and to guarantee the source to operate at the maximum power point (MPP). At the beginning of region 4, the resistive load is reset to 2 kΩ and the output voltage is boosted accordingly.
For the second simulation, the resistive load has is kept constant, while a source temperature difference changing has been emulated, from 16 °C to 10 °C. As shown in Figure 13, in the first two regions the fractional voltage is sensed and the output is regulated, keeping the voltage provided by the TEG source close to the desired MPP. At the end of region 2, the temperature change occurs, thus the output voltage is lowered but the TEG voltage is still close to the previous maximum power point condition.
At the beginning of region 4, a new voltage sensing is performed and the FPCV value is updated to the correct value. The output of the DC/DC converter falls towards zero in this time window, since the input source is disconnected. After this sensing stage, the output is restored and boosted in accordance with the new MPP reference. In fact, the TEG source voltage is coincident to the reference value.
Finally, Figure 14 shows a time window reporting a transition between MPPT input voltage sensing and output voltage regulation modes regarding a load variation simulation. Once the FOCV has been updated, the signal produced by Op-Amp A2, which is the result of MPPT hardware processing, begins to rise and therefore, the PWM switching signal controlling the transistor M1 gradually modifies the duty cycle in order to perform the MPPT regulation of the output.

4. Conclusions

In this work, a TEG-Peltier cell SPICE model identification technique with multicell analysis has been presented. The model is based on acquired data, thus a massive measurement campaign has been conducted by employing a custom testbench platform, which was implemented in order to guarantee a precise, repeatable temperature difference between the two sides of the cell. The obtained SPICE model has been used first to identify the best multicell configuration, proving that series connection offers the best performance also considering the conversion stage, and secondly to implement a design example for a DC/DC converter with FPCV MPPT algorithm. The simulation showed that the selected strategy, in combination with the multicell SPICE model, offer good performance in terms of power extraction from the source.

Author Contributions

Conceptualization, A.L. and L.P.; Methodology, A.L.; Software, A.L.; Validation, A.L. and L.P.; Formal analysis, A.L.; Investigation, L.P.; Resources, L.P.; Data curation, A.L.; Writing—original draft preparation, A.L.; Writing—review and editing, L.P.; Visualization, A.L.; Supervision, L.P.

Funding

This research received no external funding.

Conflicts of Interest

The authors declare no conflict of interest.

References

  1. Morales, R.; Badesa, F.J.; García-Aracil, N.; Perez-Vidal, C.; Sabater, J.M. Distributed Smart Device for Monitoring, Control and Management of Electric Loads in Domotic Environments. Sensors 2012, 12, 5212–5224. [Google Scholar] [CrossRef] [PubMed]
  2. Tejesh, B.S.S.; Neeraja, S. A Smart Home Automation system using IoT and Open Source Hardware. Int. J. Eng. Technol. 2018, 7, 428. [Google Scholar] [CrossRef]
  3. Piscitelli, G.; Errico, V.; Ricci, M.; Giannini, F.; Saggio, G.; Leoni, A.; Stornelli, V.; Ferri, G.; Pantoli, L.; Ulisse, I. A low-cost energy-harvesting sensory headwear useful for tetraplegic people to drive home automation. AEU. Int. J. Electron. Commun. 2019, 107, 9–14. [Google Scholar] [CrossRef]
  4. Leoni, A.; Stornelli, V.; Ferri, G.; Errico, V.; Ricci, M.; Pallotti, A.; Saggio, G. A human body powered sensory glove system based on multisource energy harvester. In Proceedings of the 14th Conference on Ph.D. Research in Microelectronics and Electronics (PRIME), Prague, Czech Republic, 2–5 July 2018; IEEE: Piscataway, NJ, USA, 2018; pp. 113–116. [Google Scholar] [CrossRef]
  5. Lin, K.-F.; Lin, S.-S.; Hung, M.-H.; Kuo, C.-H.; Chen, P.-N. An Embedded Gateway with Communication Extension and Backup Capabilities for ZigBee-Based Monitoring and Control Systems. Appl. Sci. 2019, 9, 456. [Google Scholar] [CrossRef]
  6. Pantoli, L.; Leoni, A.; Parente, F.R.; Stornelli, V.; Ferri, G. Integrable autonomous devices for WSNs. In Lecture Notes in Electrical Engineering; Springer: Cham, Switzerland, 2016; Volume 431. [Google Scholar] [CrossRef]
  7. Di Marco, P.; Stornelli, V.; Ferri, G.; Pantoli, L.; Leoni, A. Dual band harvester architecture for autonomous remote sensors. Sens. Actuators A Phys. 2016, 247, 598–603. [Google Scholar] [CrossRef]
  8. Banerjee, A.; Hussain, D.M.A. SD-EAR: Energy Aware Routing in Software Defined Wireless Sensor Networks. Appl. Sci. 2018, 8, 1013. [Google Scholar] [CrossRef]
  9. Leoni, A.; Stornelli, V.; Pantoli, L. A low-cost portable spherical directional anemometer for fixed points measurement. Sens. Actuators A Phys. 2018, 280, 543–551. [Google Scholar] [CrossRef]
  10. Stornelli, V.; Ferri, G.; Leoni, A.; Pantoli, L. The assessment of wind conditions by means of hot wire sensors and a modifed Wheatstone bridge architecture. Sens. Actuators A Phys. 2017, 262, 130–139. [Google Scholar] [CrossRef]
  11. Ferri, G.; Parente, F.; Stornelli, V.; Barile, G.; Pantoli, L. Automatic Bridge-based Interface for Differential Capacitive Full Sensing. Procedia Eng. 2016, 168, 1585–1588. [Google Scholar] [CrossRef]
  12. Wang, C.; Yu, Y.; Niu, J.; Liu, Y.; Bridges, D.; Liu, X.; Pooran, J.; Zhang, Y.; Hu, A. Recent Progress of Metal–Air Batteries—A Mini Review. Appl. Sci. 2019, 9, 2787. [Google Scholar] [CrossRef]
  13. Hossain, E.; Murtaugh, D.; Mody, J.; Faruque, H.; Haque Sunny, M.; Mohammad, N. A Comprehensive Review on Second-Life Batteries: Current State, Manufacturing Considerations, Applications, Impacts, Barriers & Potential Solutions, Business Strategies, and Policies. IEEE Access 2019, 7, 73215–73252. [Google Scholar]
  14. Ha, D.-H.; Dong, S.T.C.; Nguyen, T.N.; Trang, T.T.; Voznak, M. Half-Duplex Energy Harvesting Relay Network over Different Fading Environment: System Performance with Effect of Hardware Impairment. Appl. Sci. 2019, 9, 2283. [Google Scholar] [CrossRef]
  15. Stomelli, V.; Leoni, A.; Ferri, G.; Errico, V.; Ricci, M.; Pallotti, A.; Saggio, G. A Multi-source energy harvesting sensory glove electronic architecture. In Proceedings of the 3rd International Conference on Smart and Sustainable Technologies (SpliTech), Split, Croatia, 26–29 June 2018; pp. 1–4. Available online: http://ieeexplore.ieee.org/stamp/stamp.jsp?tp=&arnumber=8448343&isnumber=8448303.
  16. Leoni, A.; Pantoli, L.; Stornelli, V.; Ferri, G.; Solic, P.; Russo, M. A Combined 90/900 MHz IC Architecture for Smart Tag Application. J. Commun. Softw. Syst. 2018, 14. [Google Scholar] [CrossRef] [Green Version]
  17. Leoni, A.; Pantoli, L.; Stornelli, V.; Ferri, G.; Russo, M.; Solic, P. 90/900 MHz IC architecture for autonomous systems. In Proceedings of the 2nd International Multidisciplinary Conference on Computer and Energy Science (SpliTech), Split, Croatia, 12–14 July 2017; pp. 1–4. Available online: http://ieeexplore.ieee.org/stamp/stamp.jsp?tp=&arnumber=8019240&isnumber=8019234.
  18. Pantoli, L.; Leoni, A.; Stornelli, V.; Ferri, G. Energy harvester for remote sensors systems. In Proceedings of the International Multidisciplinary Conference on Computer and Energy Science (SpliTech), Split, Croatia, 13–15 July 2016; pp. 1–3. [Google Scholar] [CrossRef]
  19. Di Marco, P.; Leoni, A.; Pantoli, L.; Stornelli, V.; Ferri, G. Remote sensor networks with efficient energy harvesting architecture. In Proceedings of the 12th Conference on Ph.D. Research in Microelectronics and Electronics (PRIME), Lisbon, Portugal, 27–30 June 2016; pp. 1–4. [Google Scholar]
  20. Bui, N.T.; Vo, T.H.; Kim, B.-G.; Oh, J. Design of a Solar-Powered Portable ECG Device with Optimal Power Consumption and High Accuracy Measurement. Appl. Sci. 2019, 9, 2129. [Google Scholar] [CrossRef]
  21. Orsetti, C.; Muttillo, M.; Parente, F.; Pantoli, L.; Stornelli, V.; Ferri, G. Reliable and Inexpensive Solar Irradiance Measurement System Design. Procedia Eng. 2016, 168, 1767–1770. [Google Scholar] [CrossRef]
  22. Salimi, M. Practical implementation of the Lyapunov based nonlinear controller in DC-DC boost converter for MPPT of the PV systems. Sol. Energy 2018, 173, 246–255. [Google Scholar] [CrossRef]
  23. Dechant, E.; Fedulov, F.; Fetisov, L.Y.; Shamonin, M. Bandwidth Widening of Piezoelectric Cantilever Beam Arrays by Mass-Tip Tuning for Low-Frequency Vibration Energy Harvesting. Appl. Sci. 2017, 7, 1324. [Google Scholar] [CrossRef]
  24. Chin, W.K.; Ong, Z.C.; Kong, K.K.; Khoo, S.Y.; Huang, Y.-H.; Chong, W.T. Enhancement of Energy Harvesting Performance by a Coupled Bluff Splitter Body and PVEH Plate through Vortex Induced Vibration near Resonance. Appl. Sci. 2017, 7, 921. [Google Scholar] [CrossRef]
  25. Saida, M.; Zaibi, G.; Samet, M.; Kachouri, A. Design and study of piezoelectric energy harvesting cantilever from human body. In Proceedings of the 15th International Multi-Conference on Systems, Signals & Devices (SSD), Hammamet, Tunisia, 19–22 March 2018; pp. 164–168. [Google Scholar] [CrossRef]
  26. Li, L.; Zhu, R.; Zhou, Z.; Ren, J. PZT Micro Actuator and Its Application in Robotic Manipulators. In Proceedings of the Second International Symposium on Intelligent Information Technology Application, Shanghai, China, 20–22 December 2008; pp. 598–601. [Google Scholar] [CrossRef]
  27. Perera, R.; Sevillano, E.; Sun, R.; Arteaga, A.; De Diego, A.; Cisneros, D. Comparison of PZT and FBG sensing technologies for debonding detection on reinforced concrete beams strengthened with external CFRP strips subjected to bending loads. Materiales de Construcción 2016, 66, e088. [Google Scholar] [CrossRef] [Green Version]
  28. Kim, N.; Jang, S.J.; Shrout, T.R. Relaxor based fine grain piezoelectric materials. In Proceedings of the IEEE 7th International Symposium on Applications of Ferroelectrics, Urbana-Champaign, IL, USA, 6–8 June 1990; pp. 605–609. [Google Scholar] [CrossRef]
  29. Nesarajah, M.; Frey, G. Optimized Design of Thermoelectric Energy Harvesting Systems for Waste Heat Recovery from Exhaust Pipes. Appl. Sci. 2017, 7, 634. [Google Scholar] [CrossRef]
  30. Wong, H.; Dahari, Z. Human body parts heat energy harvesting using thermoelectric module. In Proceedings of the IEEE Conference on Energy Conversion (CENCON), Johor Bahru, Malaysia, 19–20 October 2015; pp. 211–214. [Google Scholar] [CrossRef]
  31. Zhou, S.; Zhuo, C.; Min, Q.; Li, E. Graphene based thermoelectric energy harvesting in 3D ICs. In Proceedings of the IEEE Electrical Design of Advanced Packaging and Systems Symposium (EDAPS), Haining, China, 14–16 December 2017; pp. 1–3. [Google Scholar] [CrossRef]
  32. Lee, D.G.E. Tunable thermo-triboelectric energy harvesting using human body heat for self-powered applications. In Proceedings of the IEEE Micro Electro Mechanical Systems (MEMS), Belfast, Northern Ireland, 21–25 January 2018; pp. 669–672. [Google Scholar] [CrossRef]
  33. Uprety, S.; Lee, H. A 93%-power-efficiency photovoltaic energy harvester with irradiance-aware auto-reconfigurable MPPT scheme achieving >95% MPPT efficiency across 650 µW to 1 W and 2.9 ms FOCV MPPT transient time. In Proceedings of the IEEE International Solid-State Circuits Conference (ISSCC), San Francisco, CA, USA, 5–9 February 2017; pp. 378–379. [Google Scholar] [CrossRef]
  34. Morales-Caporal, M.; Rangel-Magdaleno, J.; Morales-Caporal, R. Digital simulation of a predictive current control for photovoltaic system based on the MPPT strategy. In Proceedings of the 13th International Conference on Power Electronics (CIEP), Guanajuato, Mexico, 20–26 June 2016; pp. 295–299. [Google Scholar] [CrossRef]
  35. Leoni, A.; Ulisse, I.; Pantoli, L.; Errico, V.; Ricci, M.; Orengo, G.; Giannini, F.; Saggio, G. Energy harvesting optimization for built-in power replacement of electronic multisensory architecture. AEU Int. J. Electron. Commun. 2019, 107, 170–176. [Google Scholar] [CrossRef]
  36. Singkaselit, K.; Sakulkalavek, A.; Sakdanuphab, R. Effects of annealing temperature on the structural, mechanical and electrical properties of flexible bismuth telluride thin films prepared by high-pressure RF magnetron sputtering. Adv. Nat. Sci. Nanosci. Nanotechnol. 2017, 8, 035002. [Google Scholar] [CrossRef] [Green Version]
  37. Han, M.; Jin, Y.; Lee, D.; Kim, S. Thermoelectric Properties of Bi2Te3: CuI and the Effect of Its Doping with Pb Atoms. Materials 2017, 10, 1235. [Google Scholar] [CrossRef] [PubMed]
  38. Pei, Y.; Wang, H.; Gibbs, Z.; LaLonde, A.; Snyder, G. Thermopower enhancement. In Proceedings of the Pb1−xMnxTe alloys and its effect on thermoelectric efficiency. NPG Asia Mater. 2012, 4, e28. [Google Scholar] [CrossRef]
  39. Fujitaka Co. Peltier Guide. Specification. Available online: https://download.siliconexpert.com/pdfs/2008/03/05/c/manual/fujtk/htmls/fph112702ac.pdf? (accessed on 21 August 2019).
  40. Kubov, V.I.; Dymytrov, Y.Y.; Kubova, R.M. LTSPICE-model of thermoelectric Peltier-Seebeck element. In Proceedings of the IEEE 36th International Conference on Electronics and Nanotechnology (ELNANO), Kiev, Ukraine, 19–21 April 2016; pp. 47–51. [Google Scholar] [CrossRef]
  41. Liu, X.; Huang, L.; Ravichandran, K.; Sanchez-Sinencio, E. A Highly Efficient Reconfigurable Charge Pump Energy Harvester With Wide Harvesting Range and Two-Dimensional MPPT for Internet of Things. IEEE J. Solid State Circuits 2016, 51, 1302–1312. [Google Scholar] [CrossRef]
  42. Liu, X.; Sanchez-Sinencio, E. A Highly Efficient Ultralow Photovoltaic Power Harvesting System With MPPT for Internet of Things Smart Nodes. IEEE Trans. Very Large Scale Integr. Syst. 2015, 23, 3065–3075. [Google Scholar] [CrossRef]
  43. Ram, S.K.; Sahoo, S.R.; Sudeendra, K.; Mahapatra, K. Energy efficient ultra low power solar harvesting system design with MPPT for IOT edge node devices. In Proceedings of the IEEE International Symposium on Smart Electronic Systems (iSES) (Formerly iNiS), Hyderabad, India, 17–19 December 2018; pp. 130–133. [Google Scholar]
  44. Cheng, Y.; Chao, P.C.; Men, G.; Yang, C.; Wang, T. An 80% effeciency and highly adaptable PV energy harvest circuitry with MPPT for IOT devices. In Proceedings of the IEEE Sensors 2017, Glasgow, Scotland, 30 October–1 November 2017; pp. 1–3. [Google Scholar]
  45. Alli, S.; Jovanović, S.; Poure, P.; Jamshidpour, E. MPPT and output voltage control of Photovoltaic systems using a Single-Switch DC-DC converter. In Proceedings of the IEEE International Energy Conference (ENERGYCON), Leuven, Belgium, 4–8 April 2016; pp. 1–6. [Google Scholar] [CrossRef]
  46. Rajendran, M.K.; Kansal, S.; Mantha, A.; Priya, V.; Priyamvada, Y.B.; Dutta, A. Automated environment aware nW FOCV—MPPT controller for self-powered IoT applications. In Proceedings of the IEEE International Symposium on Circuits and Systems (ISCAS), Montreal, QC, Canada, 22–25 May 2016; pp. 1818–1821. [Google Scholar]
  47. Selmi, T.; Abdul-Niby, M.; Devis, L.; Davis, A. P&O MPPT implementation using MATLAB/Simulink. In Proceedings of the 9th International Conference on Ecological Vehicles and Renewable Energies (EVER), Monte-Carlo, Monaco, 25–27 March 2014; pp. 1–4. [Google Scholar] [CrossRef]
  48. Chung, T.M.; Daniyal, H.; Sulaiman, M.; Bakar, M. Comparative study of P&O and modified incremental conductance algorithm in solar maximum power point tracking. In Proceedings of the 4th IET Clean Energy and Technology Conference (CEAT 2016), Kuala Lumpur, Malaysia, 14–15 November 2016; pp. 1–6. [Google Scholar] [CrossRef]
  49. Motsoeneng, P.; Bamukunde, J.; Chowdhury, S. Comparison of Perturb & Observe and Hill Climbing MPPT schemes for pv plant under cloud cover and varying load. In Proceedings of the 10th International Renewable Energy Congress (IREC), Sousse, Tunisia, 26–28 March 2019; pp. 1–6. [Google Scholar] [CrossRef]
  50. Baimel, D.; Tapuchi, S.; Levron, Y.; Belikov, J. Improved Fractional Open Circuit Voltage MPPT Methods for PV Systems. Electronics 2019, 8, 321. [Google Scholar] [CrossRef]
  51. Kollimalla, S.K.; Mishra, M.K. A new adaptive P&O MPPT algorithm based on FSCC method for photovoltaic system. In Proceedings of the International Conference on Circuits, Power and Computing Technologies (ICCPCT), Nagercoil, India, 20–21 March 2013; pp. 406–411. [Google Scholar] [CrossRef]
  52. Wan, Q.; Teh, Y.; Gao, Y.; Mok, P. Analysis and Design of a Thermoelectric Energy Harvesting System With Reconfigurable Array of Thermoelectric Generators for IoT Applications. IEEE Trans. Circuits Syst. I Regul. Pap. 2017, 64, 2346–2358. [Google Scholar] [CrossRef]
  53. Wittmann, J.; Wicht, B. A configurable sawtooth based PWM generator with 2 ns on-time for >50 MHz DCDC converters. In Proceedings of the 11th Conference on Ph.D. Research in Microelectronics and Electronics (PRIME), Glasgow, Scotland, 29 June–2 July 2015; pp. 41–44. [Google Scholar] [CrossRef]
Figure 1. Single couple of P-type and N-type materials constituting a thermoelectric generator.
Applsci 09 03744 g001
Figure 2. Block scheme of the test platform.
Applsci 09 03744 g002
Figure 3. Adopted electrical description of the TEG cell.
Applsci 09 03744 g003
Figure 4. An example of a complete energy harvesting power management system with cascaded maximum power point track (MPPT) and fixed voltage regulated DC/DC converters.
Applsci 09 03744 g004
Figure 5. Adopted circuital scheme for the implemented fractional open-circuit voltage (FOCV) MPPT algorithm.
Applsci 09 03744 g005
Figure 6. Identified SPICE (Simulation Program with Integrated Circuit Emphasis) model of the single TEG cell.
Applsci 09 03744 g006
Figure 7. Comparison of the obtained SPICE model: (a) single cell at ΔT = 4 °C, (b) single cell at ΔT = 8 °C, (c) single cell at ΔT = 16 °C, and (d) two parallel cells at Δt = 16 °C.
Applsci 09 03744 g007
Figure 8. Configurations for multicell simulation analysis. (a) series of 12 cells, (b) 6 series of 2 parallel cells, (c) 4 parallels of 3 series cells, (d) 3 parallels of 4 series cells, (e) 2 parallels of 6 series cells and (f) 12 parallel cells.
Applsci 09 03744 g008
Figure 9. Multicell current–voltage (blue trace) and power–voltage (orange trace) simulation analysis with ΔT = 16 °C. (a) series of 12 cells, (b) 6 series of 2 parallel cells, (c) 4 parallels of 3 series cells, (d) 3 parallels of 4 series cells, (e) 2 parallels of 6 series cells, and (f) 12 parallel cells.
Applsci 09 03744 g009aApplsci 09 03744 g009b
Figure 10. Power-voltage simulation analysis for 12 cells connected in series with ΔT = 16 °C (yellow), ΔT = 10 °C (grey), ΔT = 8 °C (orange), and ΔT = 4 °C (blue).
Applsci 09 03744 g010
Figure 11. Complete scheme of the implemented DC/DC boost converter with FCOV MPPT algorithm.
Applsci 09 03744 g011
Figure 12. DC/DC converter VOUT (green trace), VIN (blue trace), and VA (red trace) simulation with load step variation. Region 1: input voltage sensing; Region 2: output voltage regulation; Region 3: load changing from 2 kΩ to 1 kΩ and output lowering for MPPT; Region 4: load changing from 1 kΩ to 2 kΩ and output boosting for MPPT.
Applsci 09 03744 g012
Figure 13. DC/DC converter VOUT (green trace), VIN (blue trace), and VA (red trace) simulation with source temperature difference variation. Region 1: input voltage sensing; Region 2: output voltage regulation; Region 3: temperature difference changing from 16 °C to 10 °C and output lowering; Region 4: new source voltage sensing window and FOCV update; Region 5: output voltage regulation in accordance with the new detected maximum powerpoint.
Applsci 09 03744 g013
Figure 14. Switching signal controlling transistor M1 (green trace), the MPPT output signal from Op-Amp A2 (violet trace), and input TEG voltage (blue trace) in a time window reporting the transition between MPPT input voltage sensing and output voltage regulation modes.
Applsci 09 03744 g014
Table 1. Characterization of a single TEC1-3103 Peltier cell as TEG.
Δ T [°C] V o c [mV] I s c [mA] P m a x [μW]
49.252.359.94
820.735.248.25
1647.1213.1309

