Direct Under-Sampling Compressive Sensing Method for Underwater Echo Signals and Physical Implementation


1
Department of Automation, Hangzhou Dianzi University, Xiasha Higher Education Zone, Hangzhou 310018, China
2
Department of Physics, University of Bath, Claverton Down, Bath BA2 7AY, UK
*
Author to whom correspondence should be addressed.
Appl. Sci. 2019, 9(21), 4596; https://doi.org/10.3390/app9214596
Submission received: 29 September 2019
/
Revised: 23 October 2019
/
Accepted: 24 October 2019
/
Published: 29 October 2019
(This article belongs to the Section Acoustics and Vibrations)
Abstract
:Featured Application
The direct under-sampling compressive sensing method presented in the article can be applied to many types of acquisition systems for underwater echo signals.
Abstract
Compressive sensing can guarantee the recovery accuracy of suitably constrained signals by using sampling rates much lower than the Nyquist limit. This is a leap from signal sampling to information sampling. The measurement matrix is key to implementation but limited in the acquisition systems. This article presents the critical elements of the direct under-sampling—compressive sensing (DUS–CS) method, constructing the under-sampling measurement matrix, combined with a priori information sparse representation and reconstruction, and we show how it can be physically implemented using dedicated hardware. To go beyond the Nyquist constraints, we show how to design and adjust the sampling time of the A/D circuit and how to achieve low-speed random non-uniform direct under-sampling. We applied our method to data measured with different compression ratios (volume ratios of collected data to original data). It is shown that DUS-CS works well when the SNR is 3 dB, 0 dB, −3 dB, and −5 dB and the compression ratio is 50%, 20%, and 10%, and this is validated with both simulation and actual measurements. The method we propose provides an effective way for compressed sensing theory to move toward practical field applications that use underwater echo signals.
1. Introduction
The core of signal acquisition technology is the transformation of analog signals into digital signals. The Nyquist sampling theorem [1,2] forms the critical basis of modern approaches to signal sampling and processing; it requires that the sampling frequency is greater or equal to twice the highest frequency of the effective signal, thus avoiding aliasing. In this way, the sampled signal can contain the information of the original signal and can be restored without distortion. In practical applications, the sampling frequency is usually 5–10 times the highest frequency of the signal. As signal frequency and bandwidth increase in modern technology (up to MHz rates for some sonars), the Nyquist sampling rate also increases linearly. This makes the amount of data increase dramatically. Not only does this bring difficulties to the acquisition system, but for signals with underlying repeatability, it also generates a large amount of redundant data, which increases the cost of signal transmission, storage, and processing.
Compressive sensing (also called compressive sampling) [3,4,5,6] differs from Nyquist sampling in that it combines the compression and sampling stages. It utilizes the characteristics of sparse representation of signals on a set of bases and realizes the perception of high-dimensional signals through non-correlated observations of low-dimensional space, low-resolution, and under-Nyquist sampled data to reconstruct the original signal by combining optimization methods. The compressive sensing method directly converts the samples from a continuous time signal while discarding redundant information in the Nyquist sampling. Then optimization is used to process the compressed samples.
How to achieve the sampling of information using compressive sensing theory is a critical issue that needs a solution at present. Many studies have been carried out on this issue, such as: the observation matrix construction [7,8,9], analog broadband signal sampling [10,11,12], radar signal compression [13,14], image compression technology [15,16,17,18], and ultrasound transducer fields [19]. Some researchers [20,21,22] designed ultra-high-speed analog-to-digital converters, but their high level of complexity makes them difficult to implement in practice. Some researchers [11,23] used an AIC (analog-to-information converter) structure to realize random observations. The main problem is that the clock frequency of the random symbol function is greater than the Nyquist sampling rate, which increases the difficulty of frequency mixing. The sampling method of AIC structure is quite different from the traditional sampling method; there is no compatibility between the AIC structure circuit and a traditional sampling circuit. Therefore, there is an urgent need for a compressive sensing acquisition method that is convenient for physical implementation.
In this article, we first present the direct under-sampling compressive sensing (DUS-CS) method, summarizing the key points of the theory and how they can be implemented in hardware (Section 2). Next, we apply DUS-CS to simulated high-resolution data and compare different compression ratios (Section 3). The hardware designed for under-sampling and compressive sensing is presented in Section 4, and its application is presented in Section 5. The advantages and limits of this approach are summarized in Section 6.
2. Direct Under-Sampling Compressive Sensing Method
2.1. Basic Theory of Compressive Sensing
Compressive sensing includes three core parts: signal sparse decomposition, uncorrelated signal observation, and signal reconstruction. The sparseness of the signal is a necessary condition for compressive sensing, uncorrelated observation is the key to compressive sensing, and signal reconstruction is the technique of compressively sensing reconstructed signals.
If a discrete signal is sparse or compressible, it can be represented as a linear combination of a set of standard orthogonal bases
In the formula, is an matrix and is considered as the sparse basis of the signal . If there are non-zero coefficients in , then the signal is called a -sparse signal under the sparse basis .
Compressive sensing projects a high-dimensional signal onto low-dimensional spaces through an observation matrix using measurements in the following way
where is the observation and is called the perceptual matrix. According to the number of observations necessary to calculate , this can be expressed as an optimization problem in the sense of an -norm
Equation (3) is an NP-hard problem, so the signal reconstruction solution is transformed into a -norm optimization problem with relaxation constraints. It then becomes
2.2. Direct Under-Sampling Compressive Sensing Method (DUS-CS)
2.2.1. Direct Under-Sampling (DUS) Implementation
The direct under-sampling method [27] is modified based on the traditional sampling circuit. The sampling trigger time is controlled by pseudo-random timing control, which samples along the rising edge (or falling edge) of each trigger signal, and the corresponding signal is collected in the data buffer. Compared to traditional sampling, only the design of the sampling circuit is changed. Applying DUS to the reception of echo signals can reduce both the complexity of the receiving system and its cost. Before the A/D conversion, the control of the signal sampling time has low speed and is non-uniform. At each instance, the sampling trigger is initiated at a different location and at different times, which can ensure the resulting signal is a discrete sample.
2.2.2. Direct Under-Sampling Compressive Sensing (DUS-CS) Method
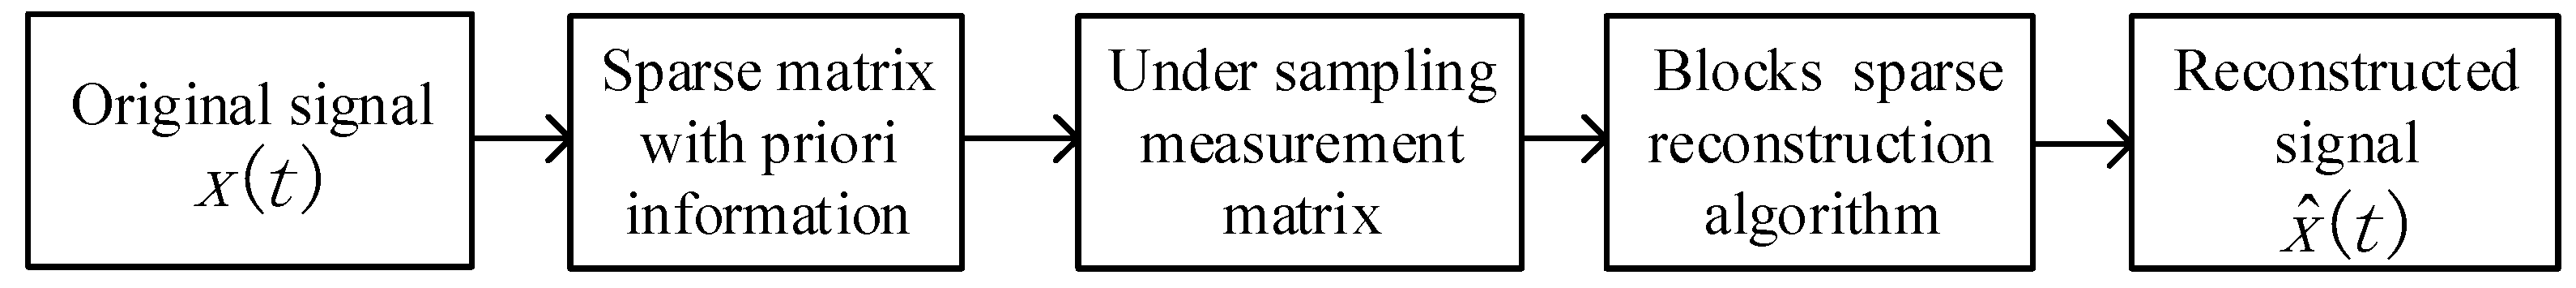
The basic idea of DUS-CS is that, in combination with the inherent characteristics of the signal, one can use the prior information sparse matrix [28,29] to represent the original signal. The signal can be represented by a complete prior atomic library and K-sparse coefficient vector. Then, according to the implementation method of direct under-sampling and the RIP (restricted isometry property) [30] condition of the measurement matrix to constructed measurement matrix, signal observation sampling can be performed to obtain under-sampling observation signals. Finally, based on the orthogonal matching pursuit method, combined with the block sparse property of the signal, it becomes possible to reconstruct the original signal (see flow diagram in Figure 1).
As shown in Figure 1, the core of the direct under-sampling compression sensing method lies in the construction of the measurement matrix and the sparse representation and reconstruction method, leveraging the prior information. Therefore, the following two parts are described in detail.
(1) Construction of measurement matrix
The direct under-sampling method is used on an input signal , with signal length , sampling rate , to yield observation signals
where
The sampling moment satisfies the following conditions
where is the sampling period of the signal and is an integer to ensure that the under-sampled measurements are low speed and random.
We use the implementation of direct under-sampling and combined with the theory of compressive sensing to construct the observation matrix. The observable structure of the original signal, , is expressed as
where is the observed signal and is observation matrix ().
According to the Whittaker interpolation theorem [31], continuous signals can be reconstructed by interpolation of their uniform discrete samples by
So, the observation matrix can be expressed as
According to the Nyquist sampling theorem, signal reconstruction is obtained by filtering the periodic spectrum of the signal. Assuming a periodic signal such as Equation (10), each element in the observation matrix is calculated considering a certain signal period. According to the slow decay and non-compact support characteristics of the sin c function, the role of other cycles, while not dominant, cannot be simply ignored directly.
Therefore, the R cycles are accumulated to obtain the observation matrix
In this formula, the larger the period R, the higher the calculation accuracy. However, as the number of cycles increases to obtain high precision, it takes longer to reach convergence of the Equation (11). In order to guarantee a certain precision, the Poisson superposition summation formula is used to speed up the calculation summation
In the formula, the function, , is the Fourier transform of the signal . Owing to the nature of the sinc function, the continuous Fourier transform is a finitely supported rectangular pulse. The measurement matrix now becomes
This approach improves the accuracy of observation of the signals and increases the calculation speed.
(2) Sparse representation and reconstruction method incorporating prior information
① Sparse representation method incorporating prior information
The key to signal sparse representation is the construction of a sparse dictionary and selection of the appropriate atom from the dictionary to represent the signal. The more similar the characteristics of the atom are to the original signal, the better the effect of signal observation and processing. Based on the prior information of the incident signal combined with the principle of signal sparse decomposition, it is possible to construct an a priori complete dictionary. The specific construction method is as follows: the number of sample points, generated by one pulse width forms a vector quantity, , of size and normalization identity . This defines the prototype atom . Each atom is treated as a block and recorded as . Then, by blocking and shifting, the sparse complete dictionary is achieved. The block sparse decomposition is expressed as
where is the block sparse coefficient vector in sparse decomposition theory.
② Reconstruction method of block sparse orthogonal matching pursuit
This is first performed by integrating the block sparseness of prior information into an orthogonal matching pursuit (OMP) algorithm, to form a block-sparse orthogonal matching pursuit (BOMP) reconstruction. Then, the most relevant sub-block of the signal is chosen from the sparse complete dictionary and its projection on the sub-block from the signal is subtracted to obtain a residual signal. This process is iterated until the energy of the residual signal is less than a given threshold, or the algorithm reaches its termination condition.
The BOMP algorithm flow is as follows:
- 1)
- Initialize the residual . The block structure of the dictionary is .
- 2)
- Selection of atomic blocks. On the -th iteration, select the index to be the largest inner product value of the residual, such that
- 3)
- Update the set of support blocks (choose sub-blocks that best match the signal) and the residuals, such that
- 4)
- Convergence conditions. When , return to the step 2 or stop iterating, then output the reconstructed signal.
The biggest difference between the BOMP algorithm and the traditional method is that the inner product of each atom block with the current residual is used to select the most correlated atomic block. Now there is no longer an atom, but an atomic sub-block. This reduces the number of calculations and improves the reconstruction accuracy.
3. Application of Compressive Sensing Method with Direct Under-Sampling in Underwater Echo Signals
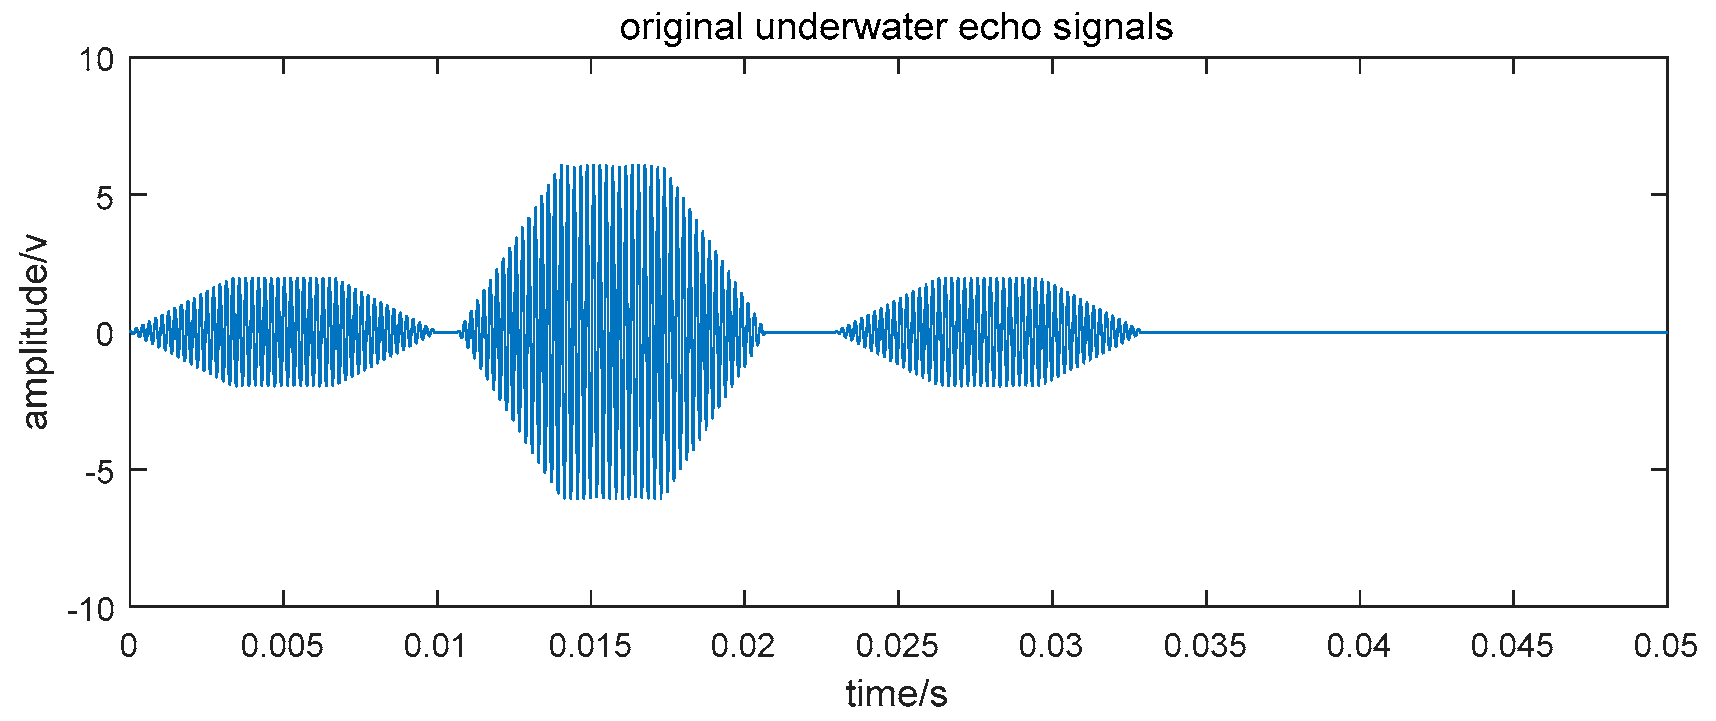
According to the highlight model [32,33], an echo signal can be represented as the linear superposition of K sub-echoes
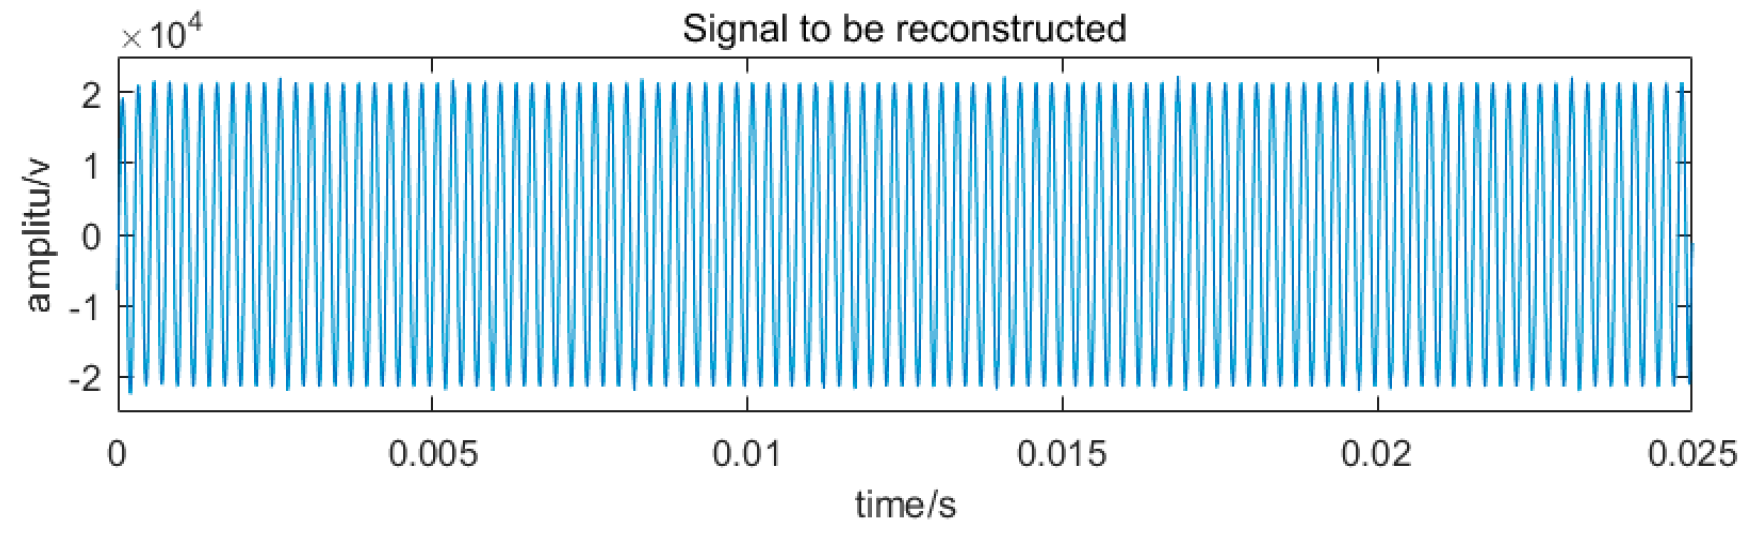
where is the emitted pulse signal, with a pulse time of 0.01 s and a frequency of 30 kHz, is the echo signal, is the amplitude of a sub-echo,
is the time-delay of a sub-echo.
Acoustic echoes are simulated and shown in Figure 2.
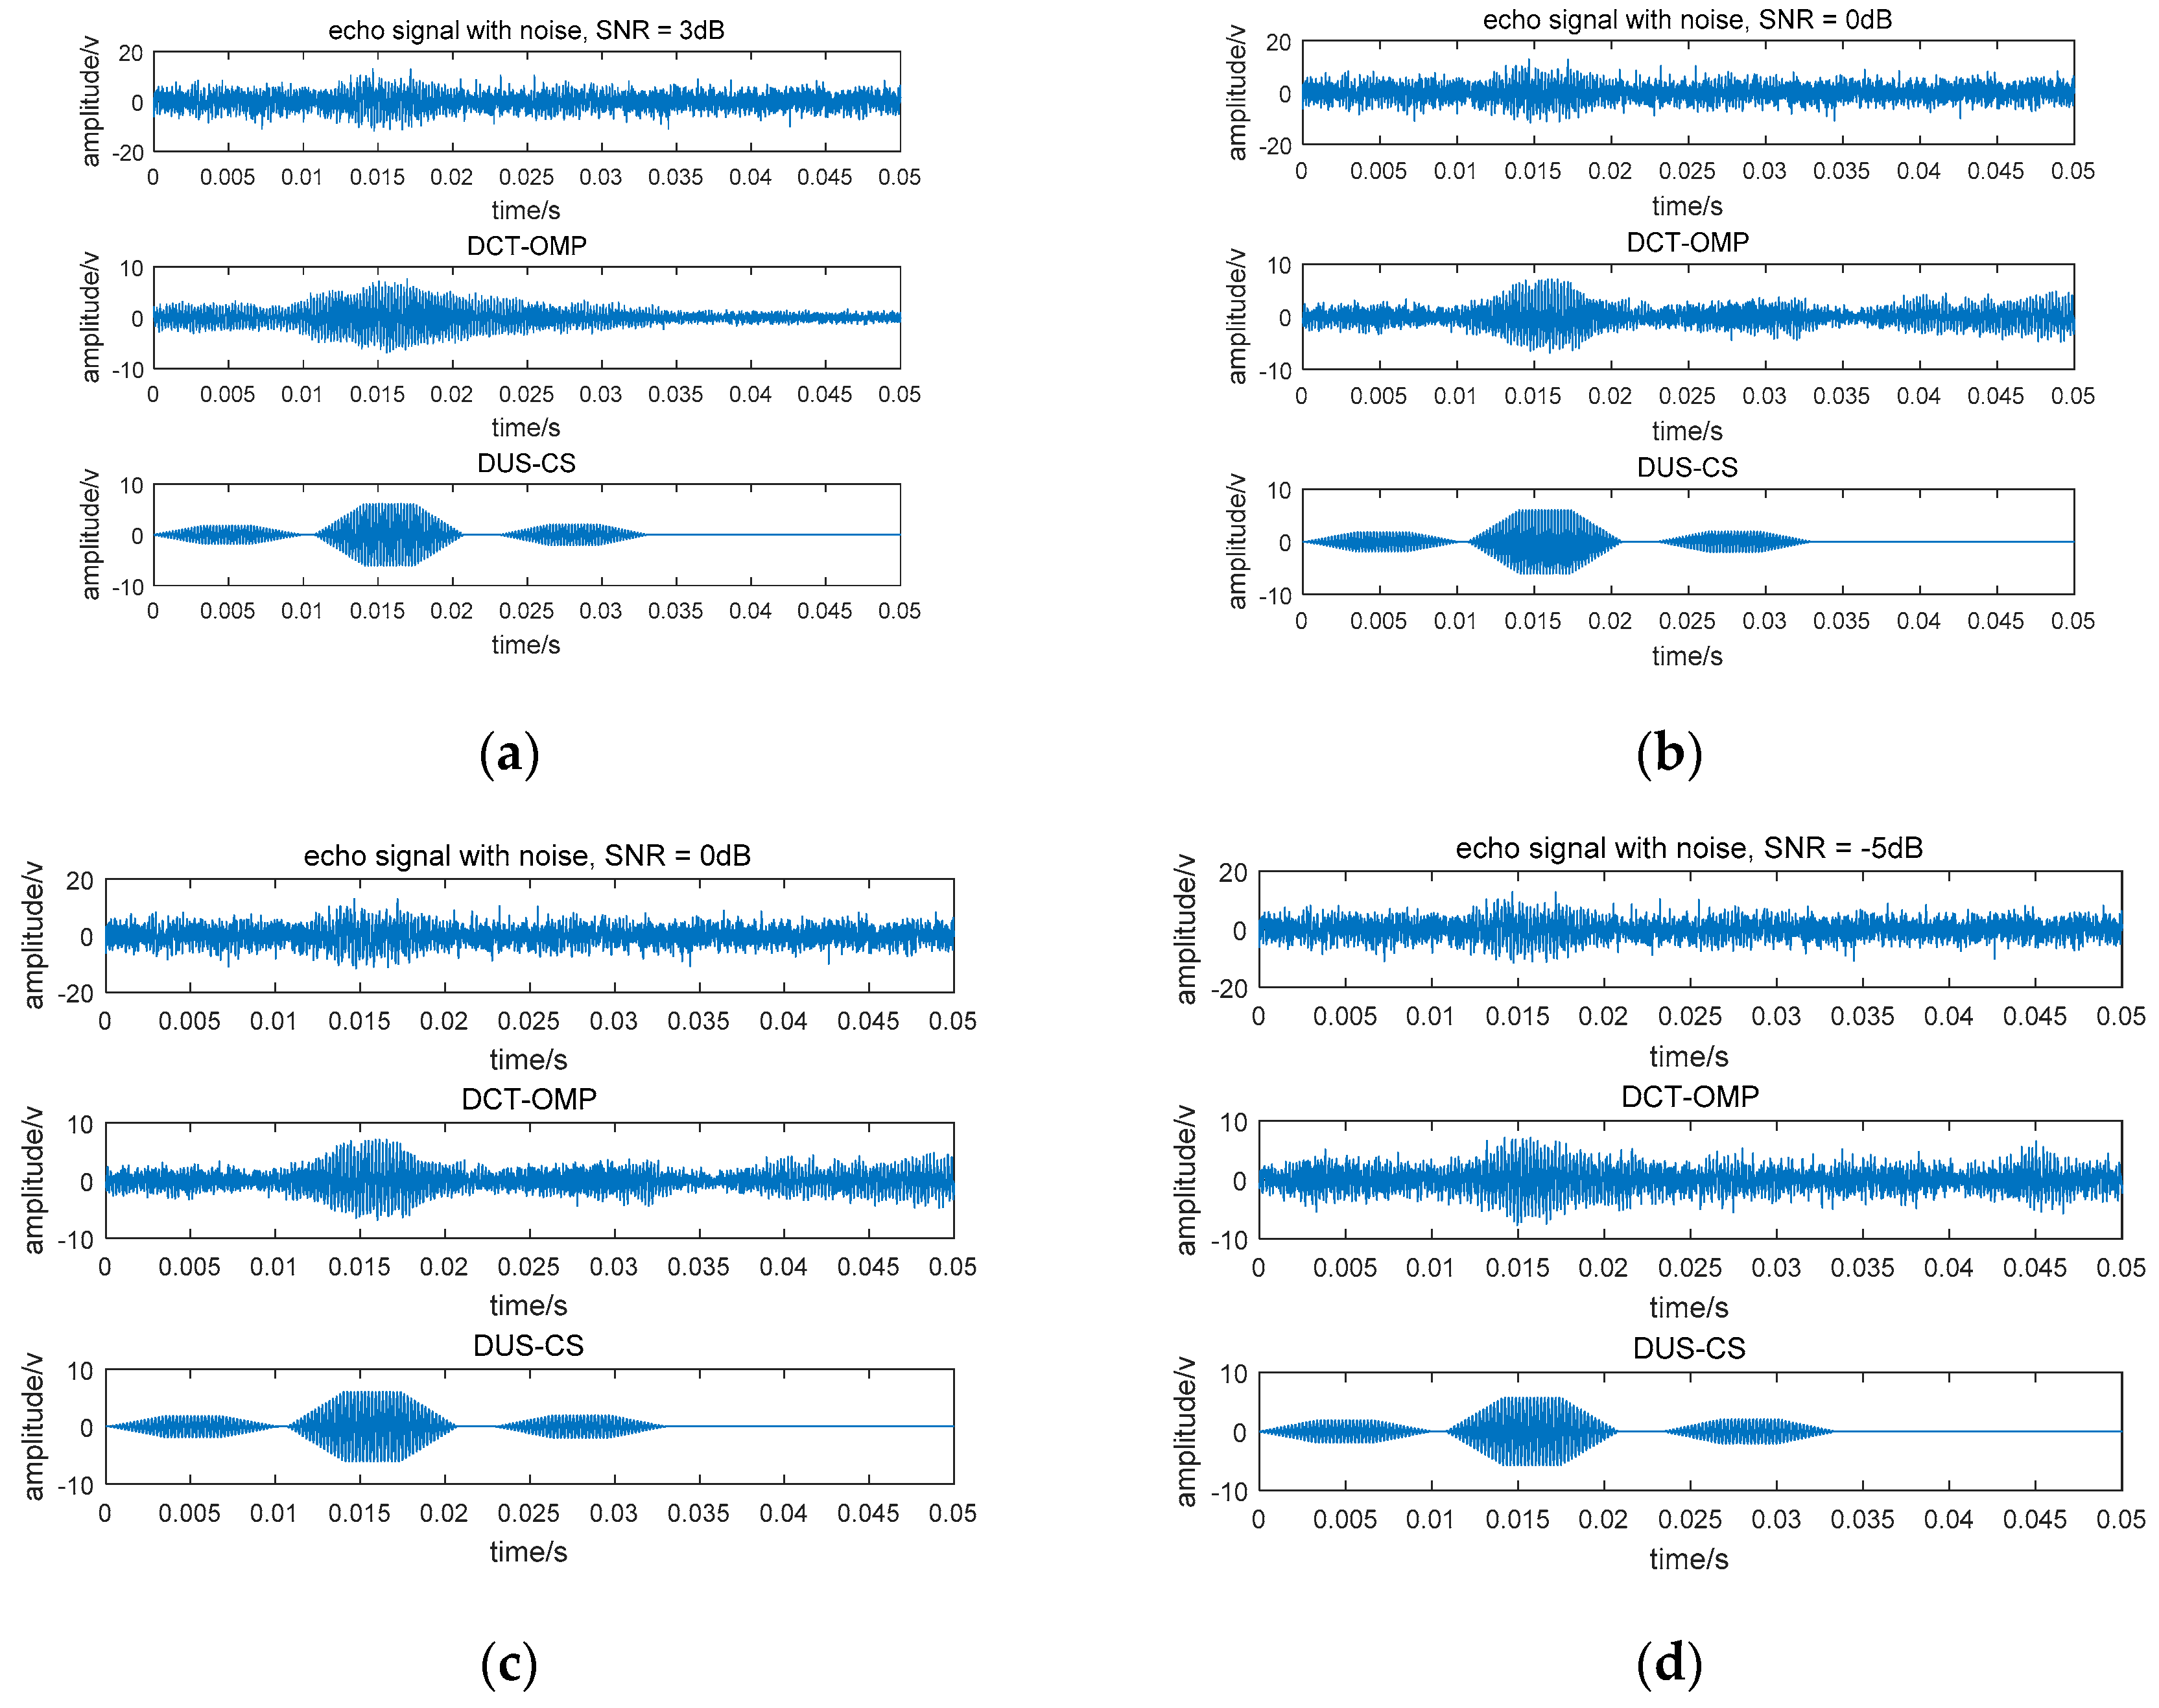
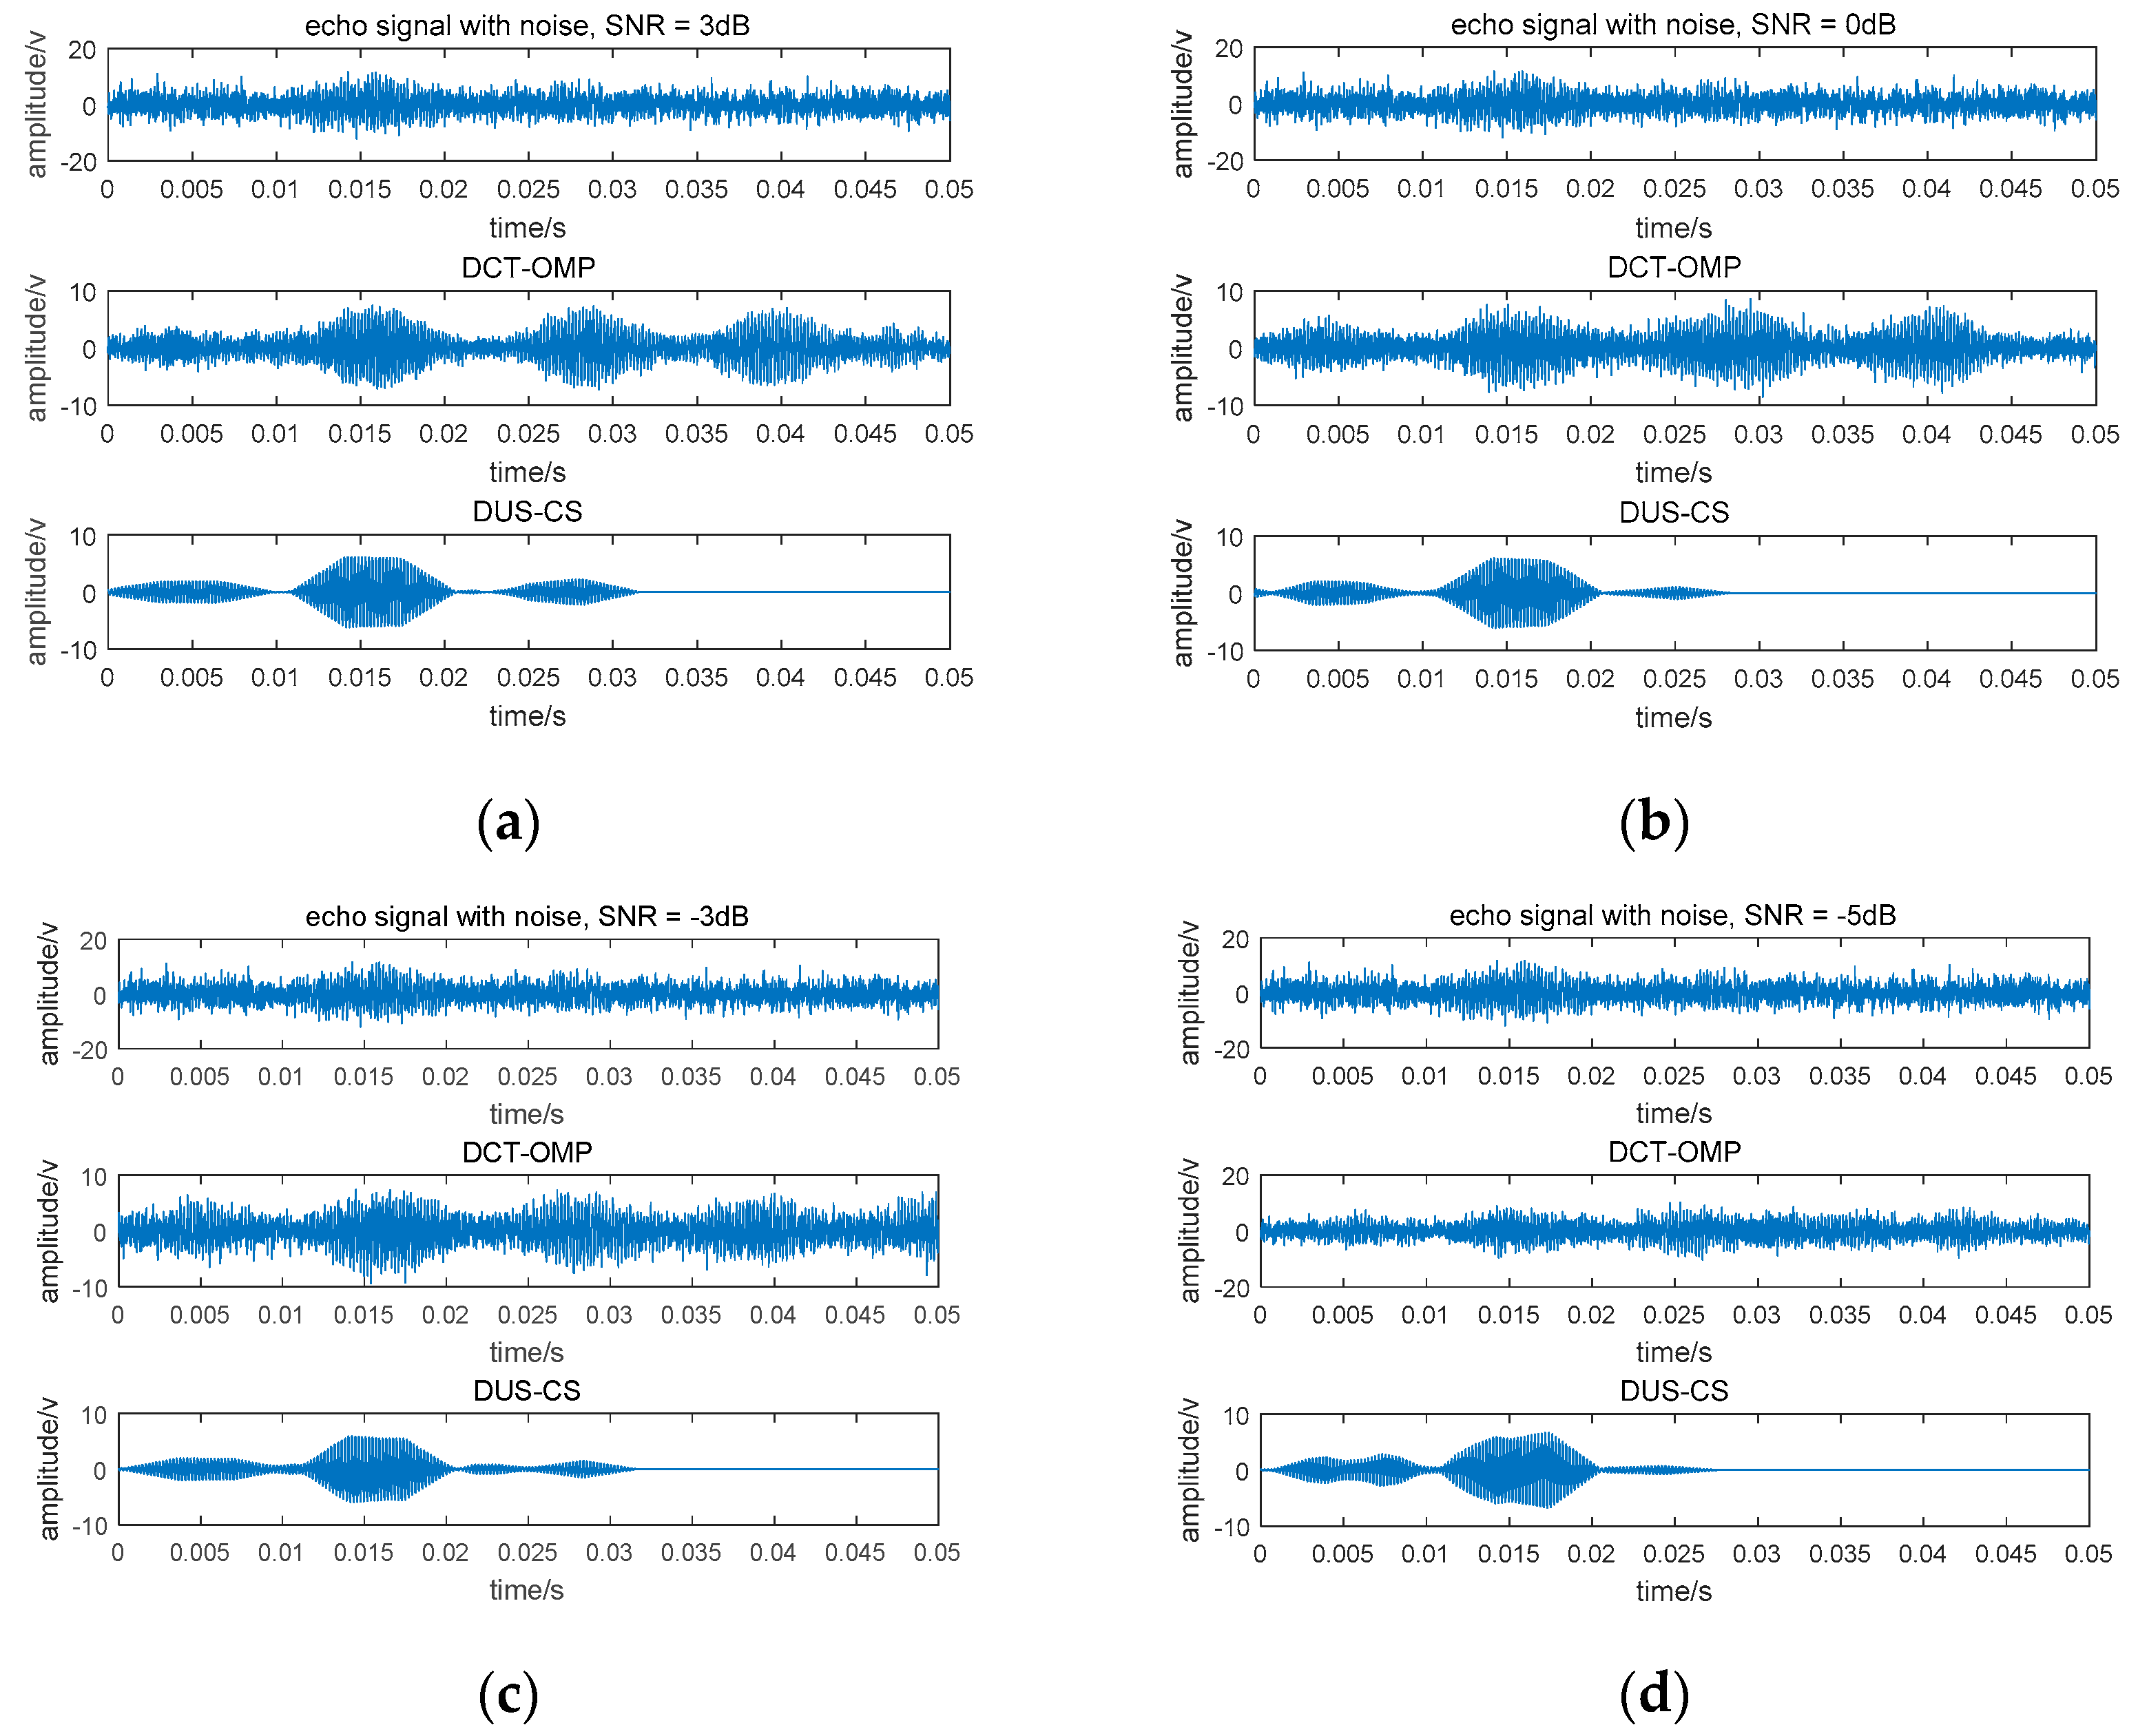
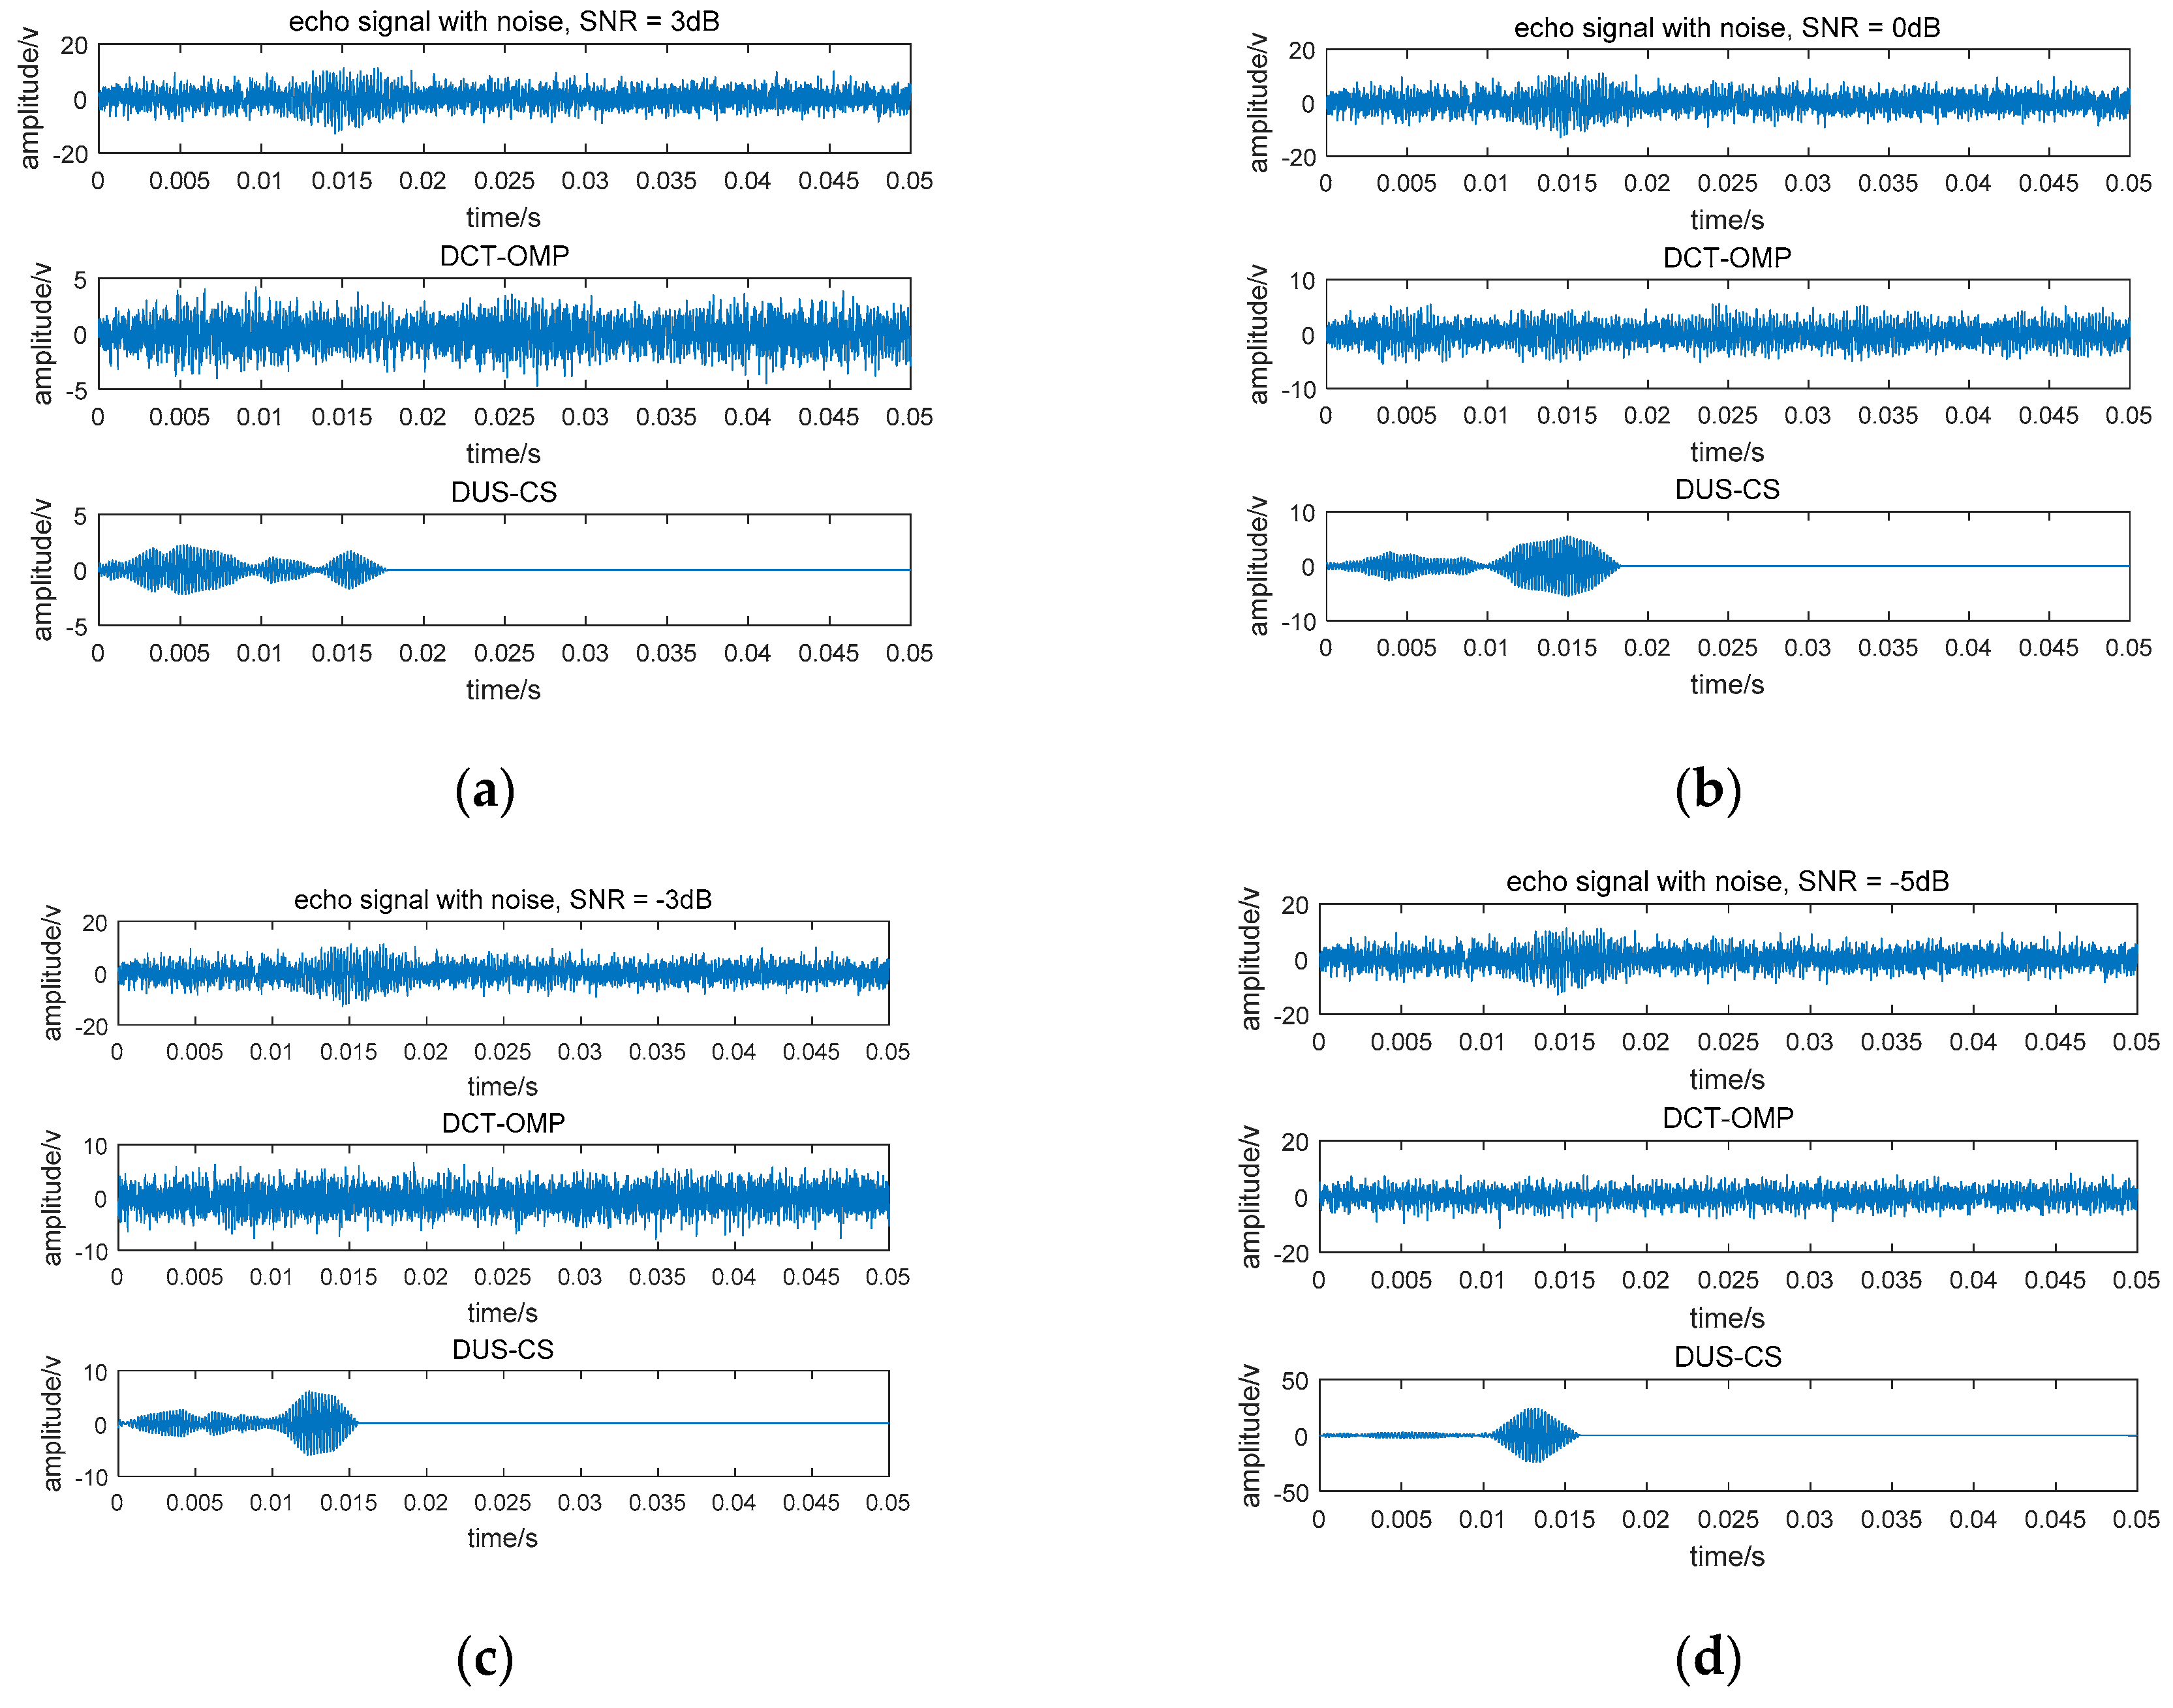
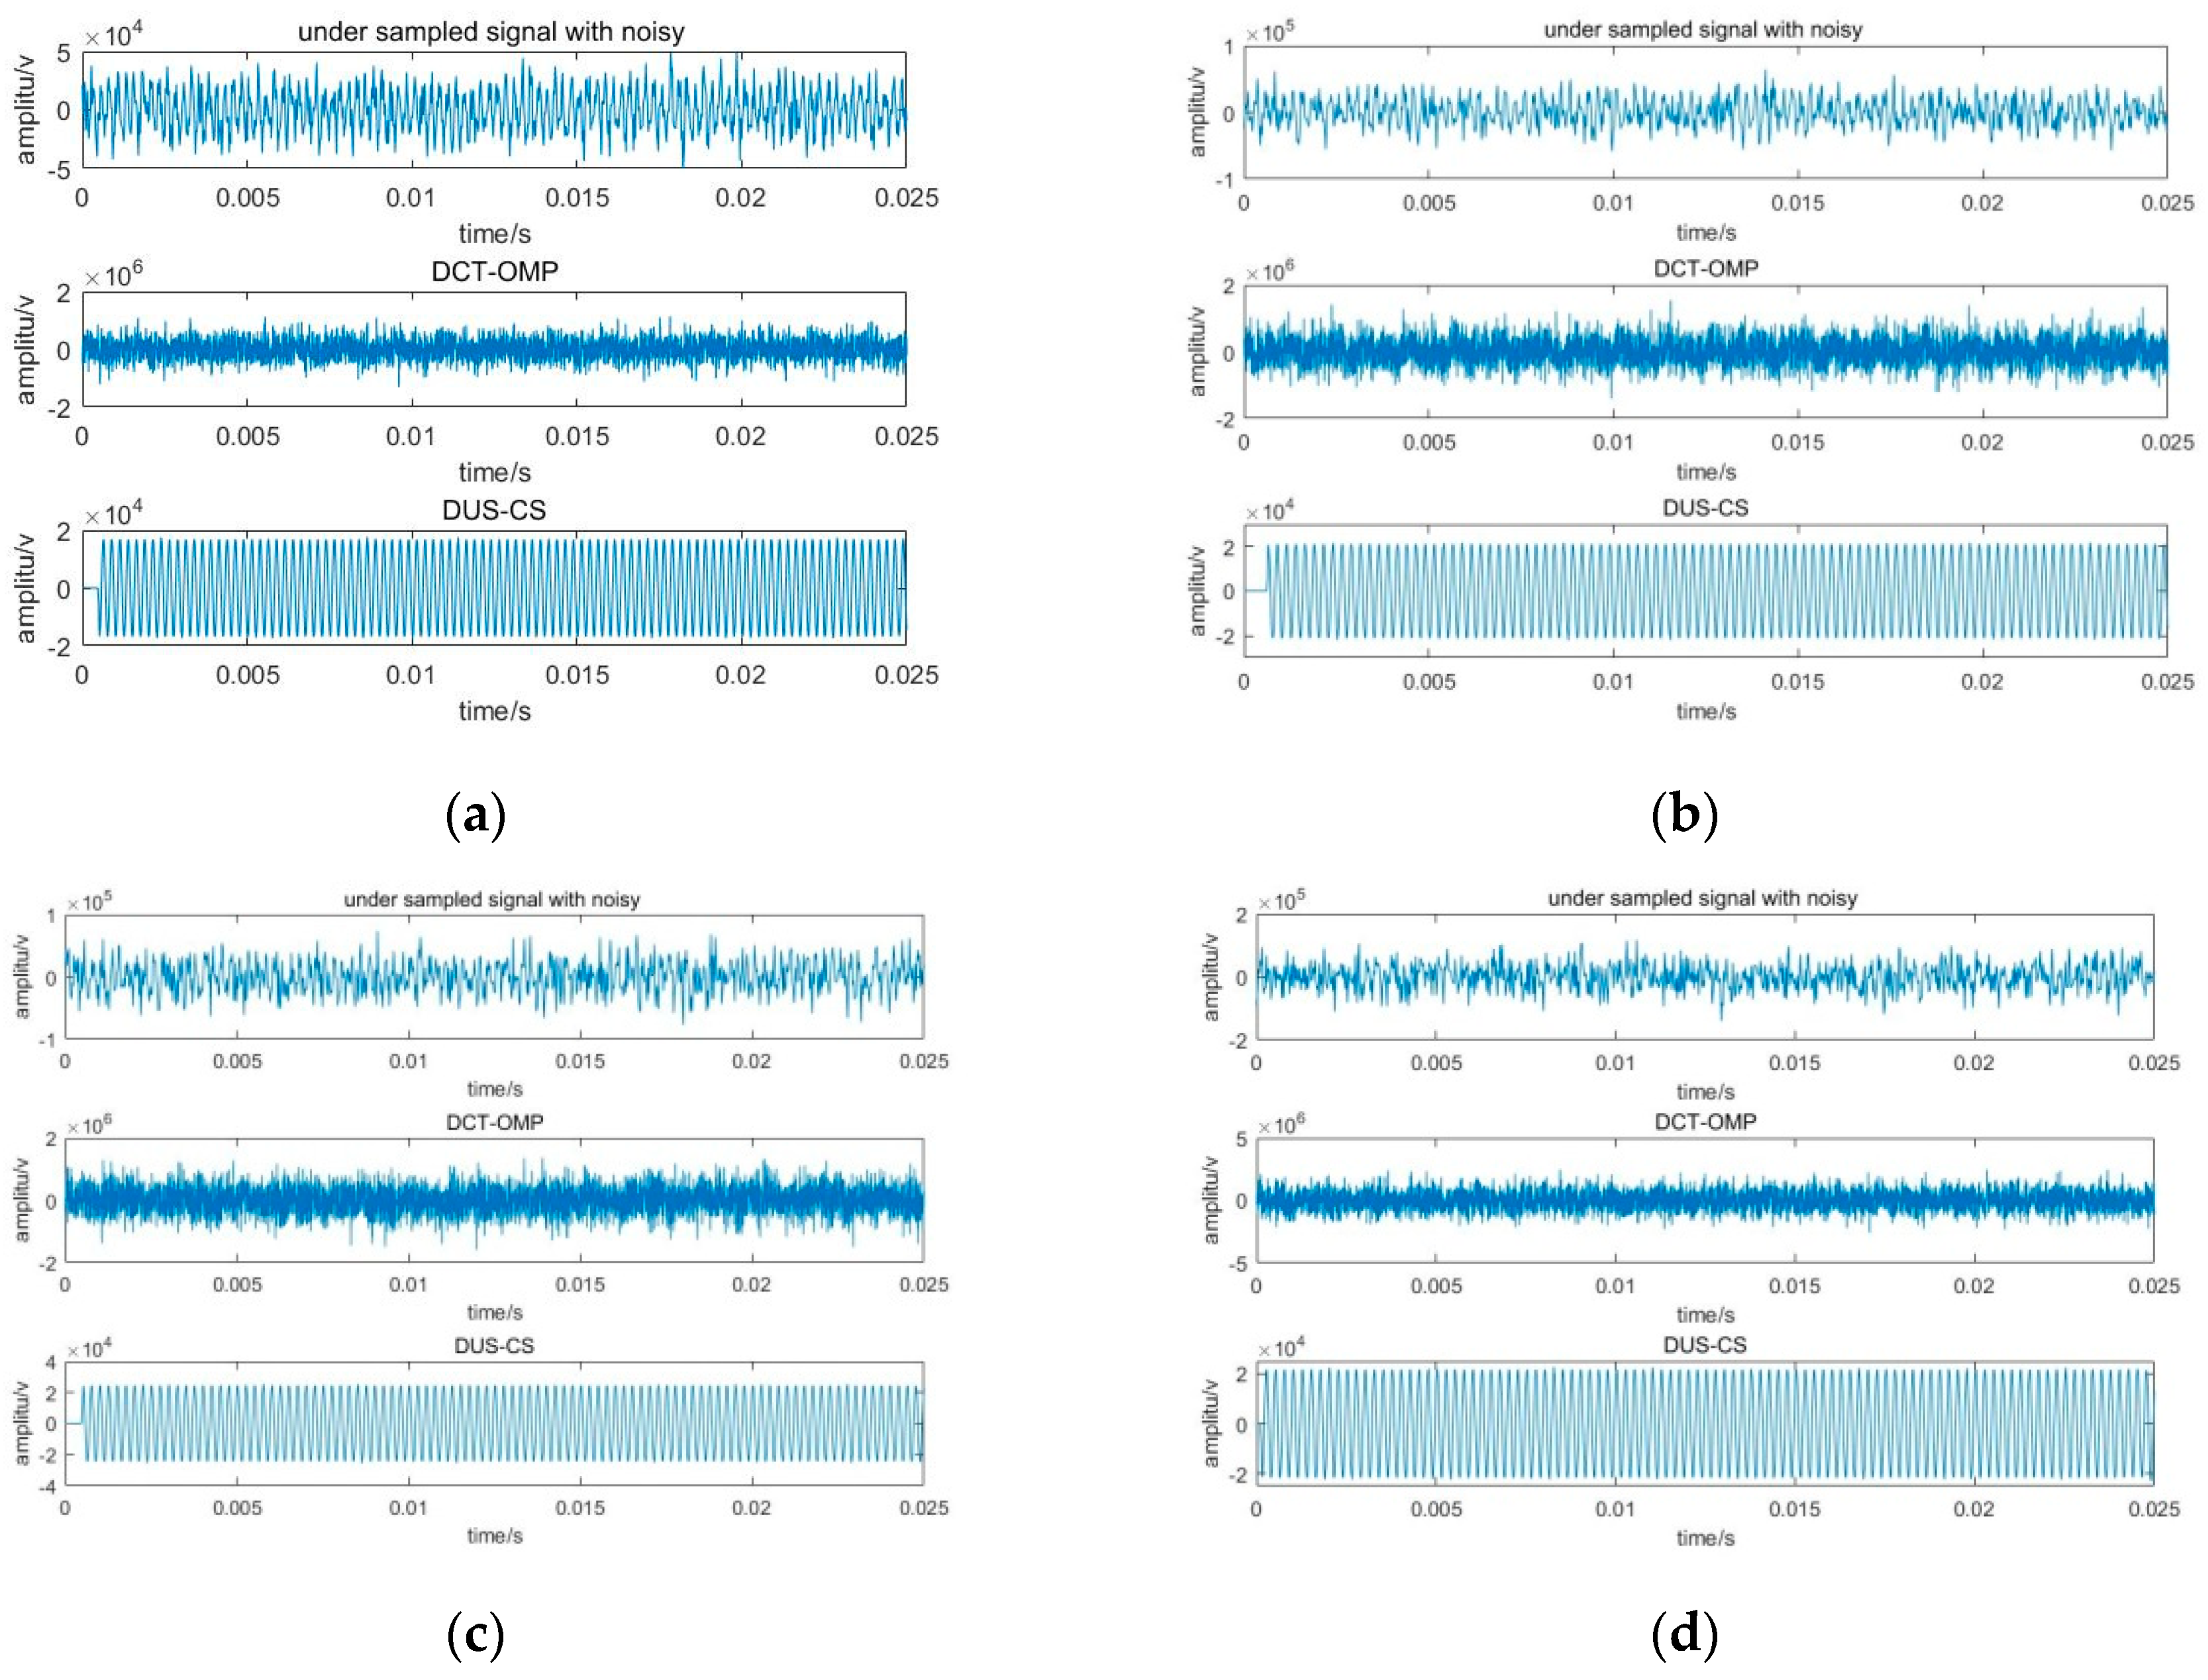
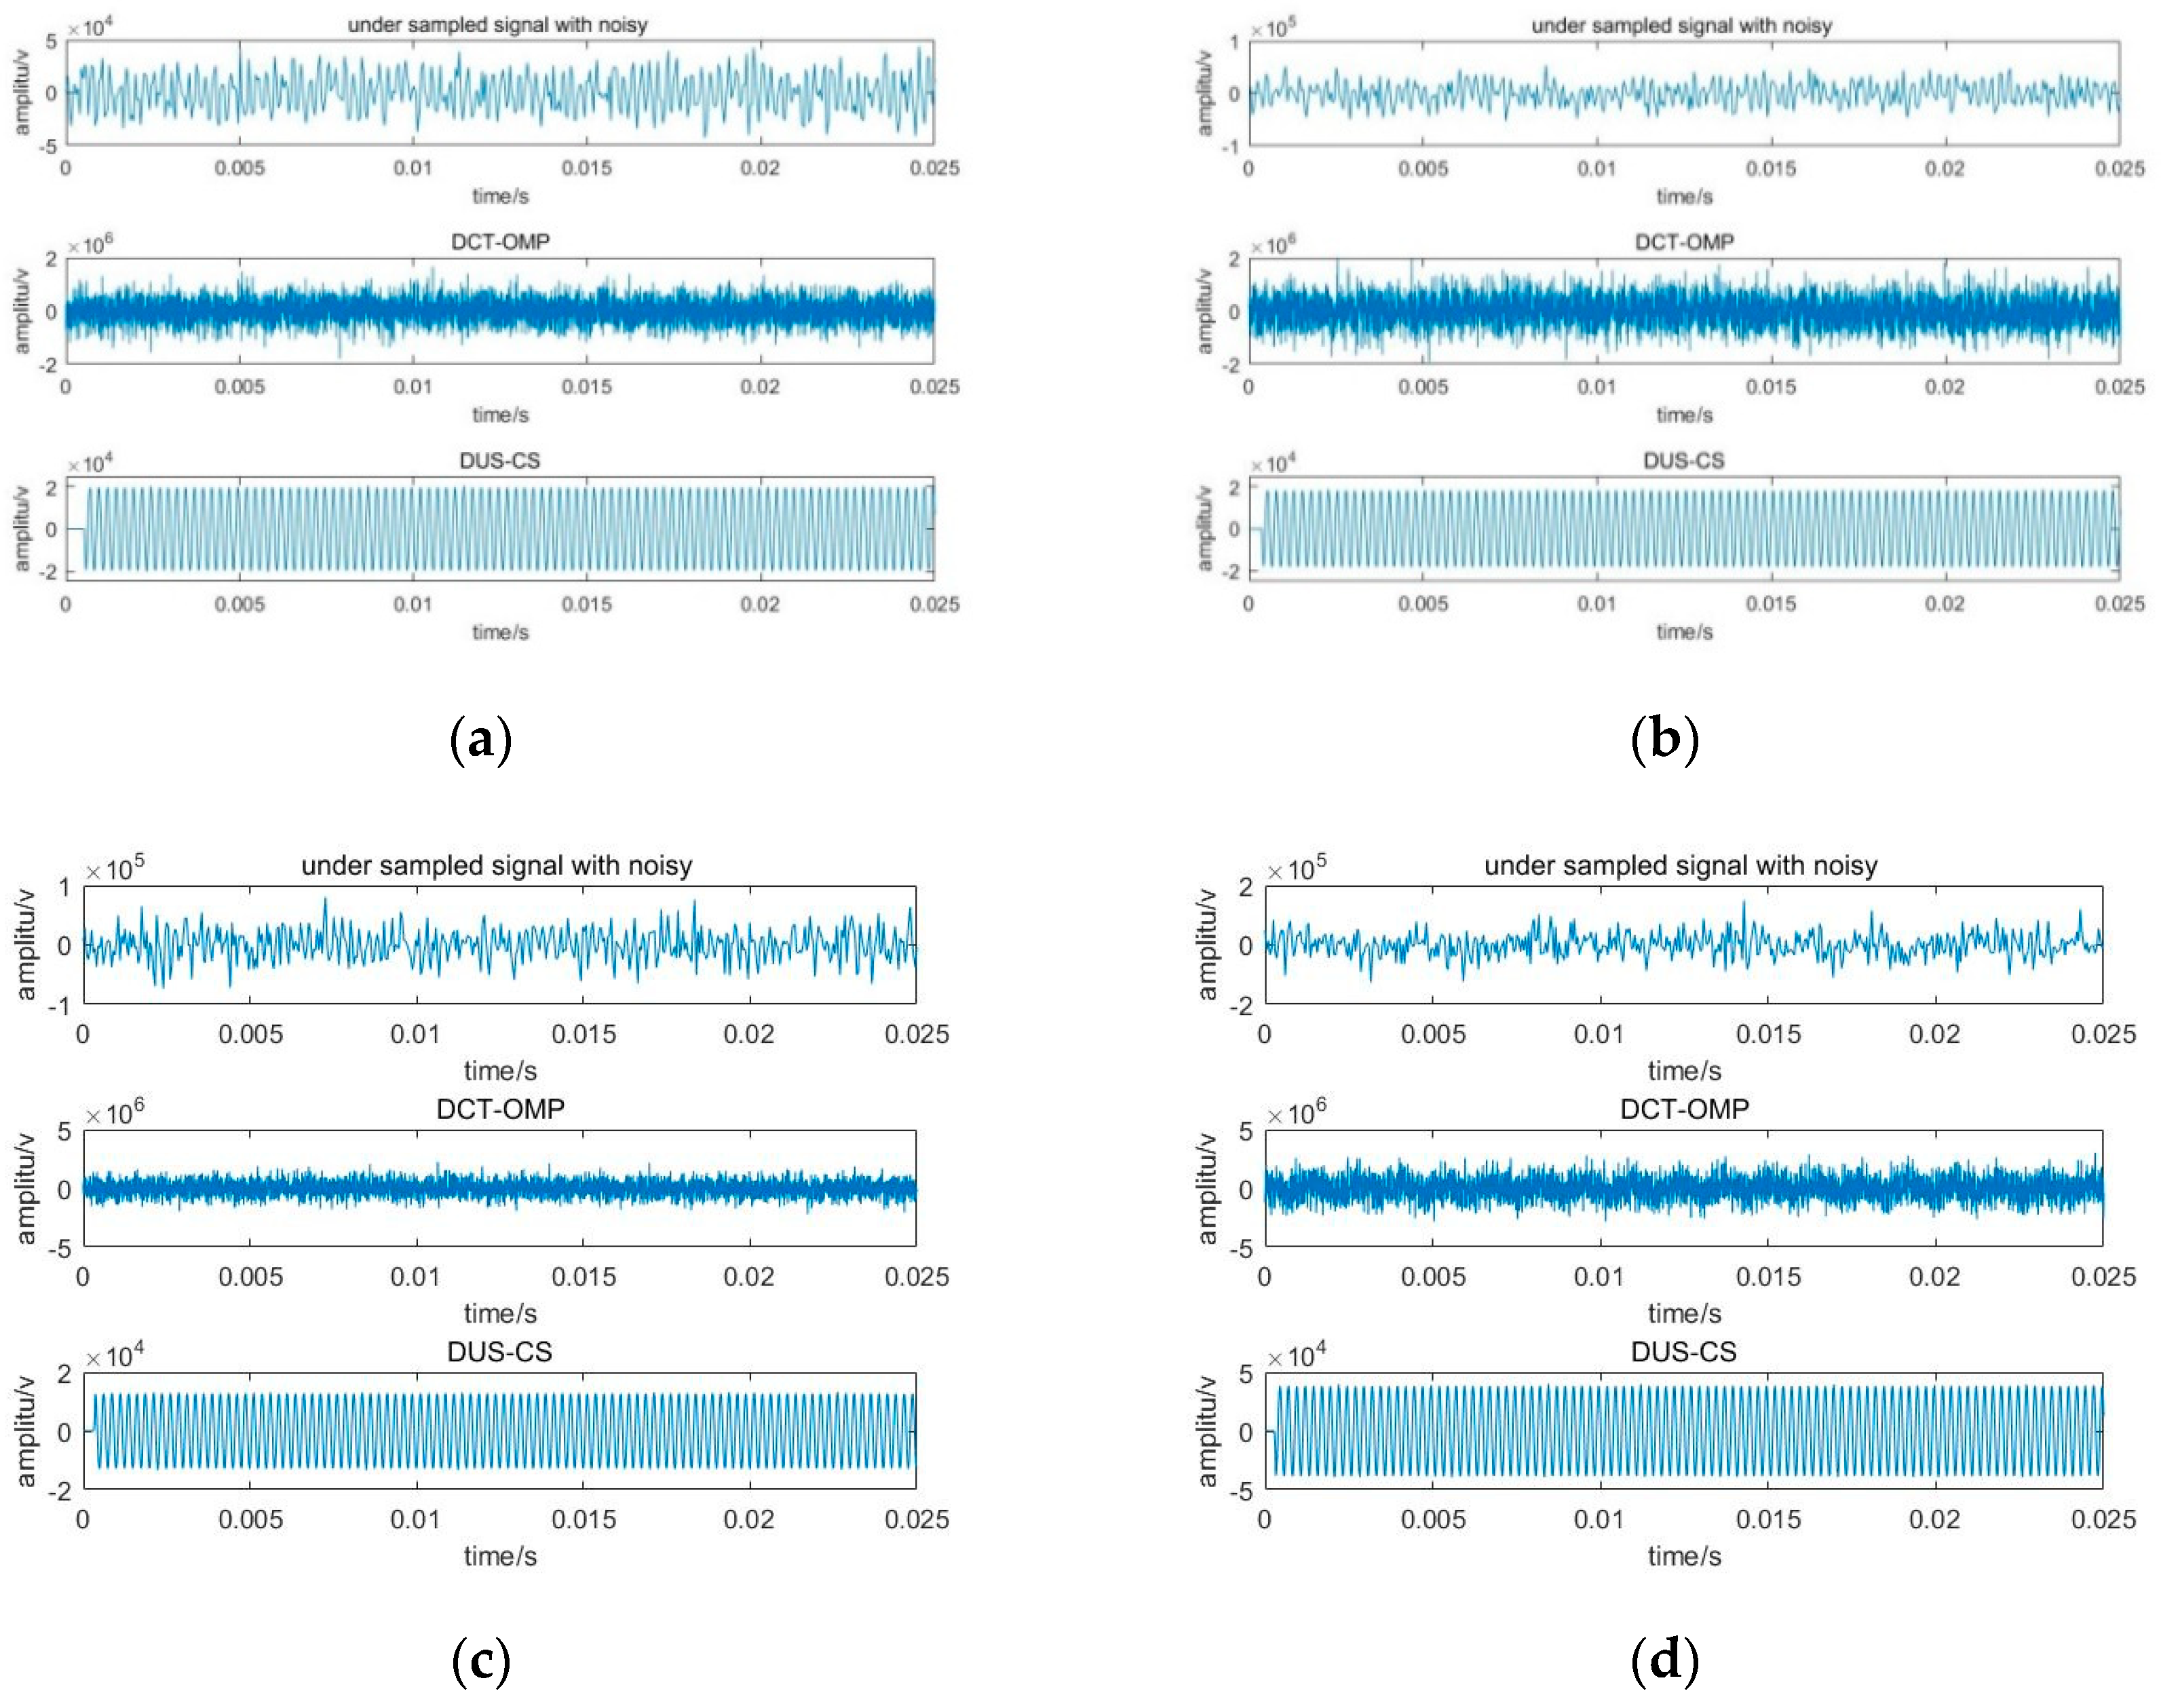
Generally, the probability density function of marine environmental noise obeys Gaussian distribution, so Gaussian noise is added in the generated signals with different signal-to-noise ratios (SNRs) to simulate marine environmental noise, and the under-sampling measurement matrix is used to compress the echo signals. Figure 3 shows the reconstruction of a signal when the compression ratio is 100% (no compression). Figure 4 and Figure 5 are reconstruction results when the compression ratio is 50% and 20%, respectively. In Figure 3, Figure 4 and Figure 5, DCT-OMP represents the combination of the discrete cosine transformation and orthogonal matching pursuit method and DUS-CS represents the direct under-sampling compressive sensing method presented in this paper.
From Figure 3a, we can see that when the compression ratio is 100% and SNR = 3 dB, both methods can reconstruct the original signal with a noise reduction effect. When the signal-to-noise ratio is further reduced to 0 dB, the DCT-OMP method does not reconstruct the original signal as well as before, while the DUS-CS method still reconstructs the signal well. When the SNR continues to decrease, the DCT-OMP method can hardly reconstruct the original signal, but the DUS-CS method still performs well. The correctness and the engineering achievability of the under-sampled measurement matrix construction have been verified in Figure 3. Figure 4 and Figure 5 are the results of the two methods when the compression ratios are 50% and 20%, respectively. From the results, the DCT-OMP method is not ideal for signal reconstruction, but the DUS-CS method reconstructs the original signal well.
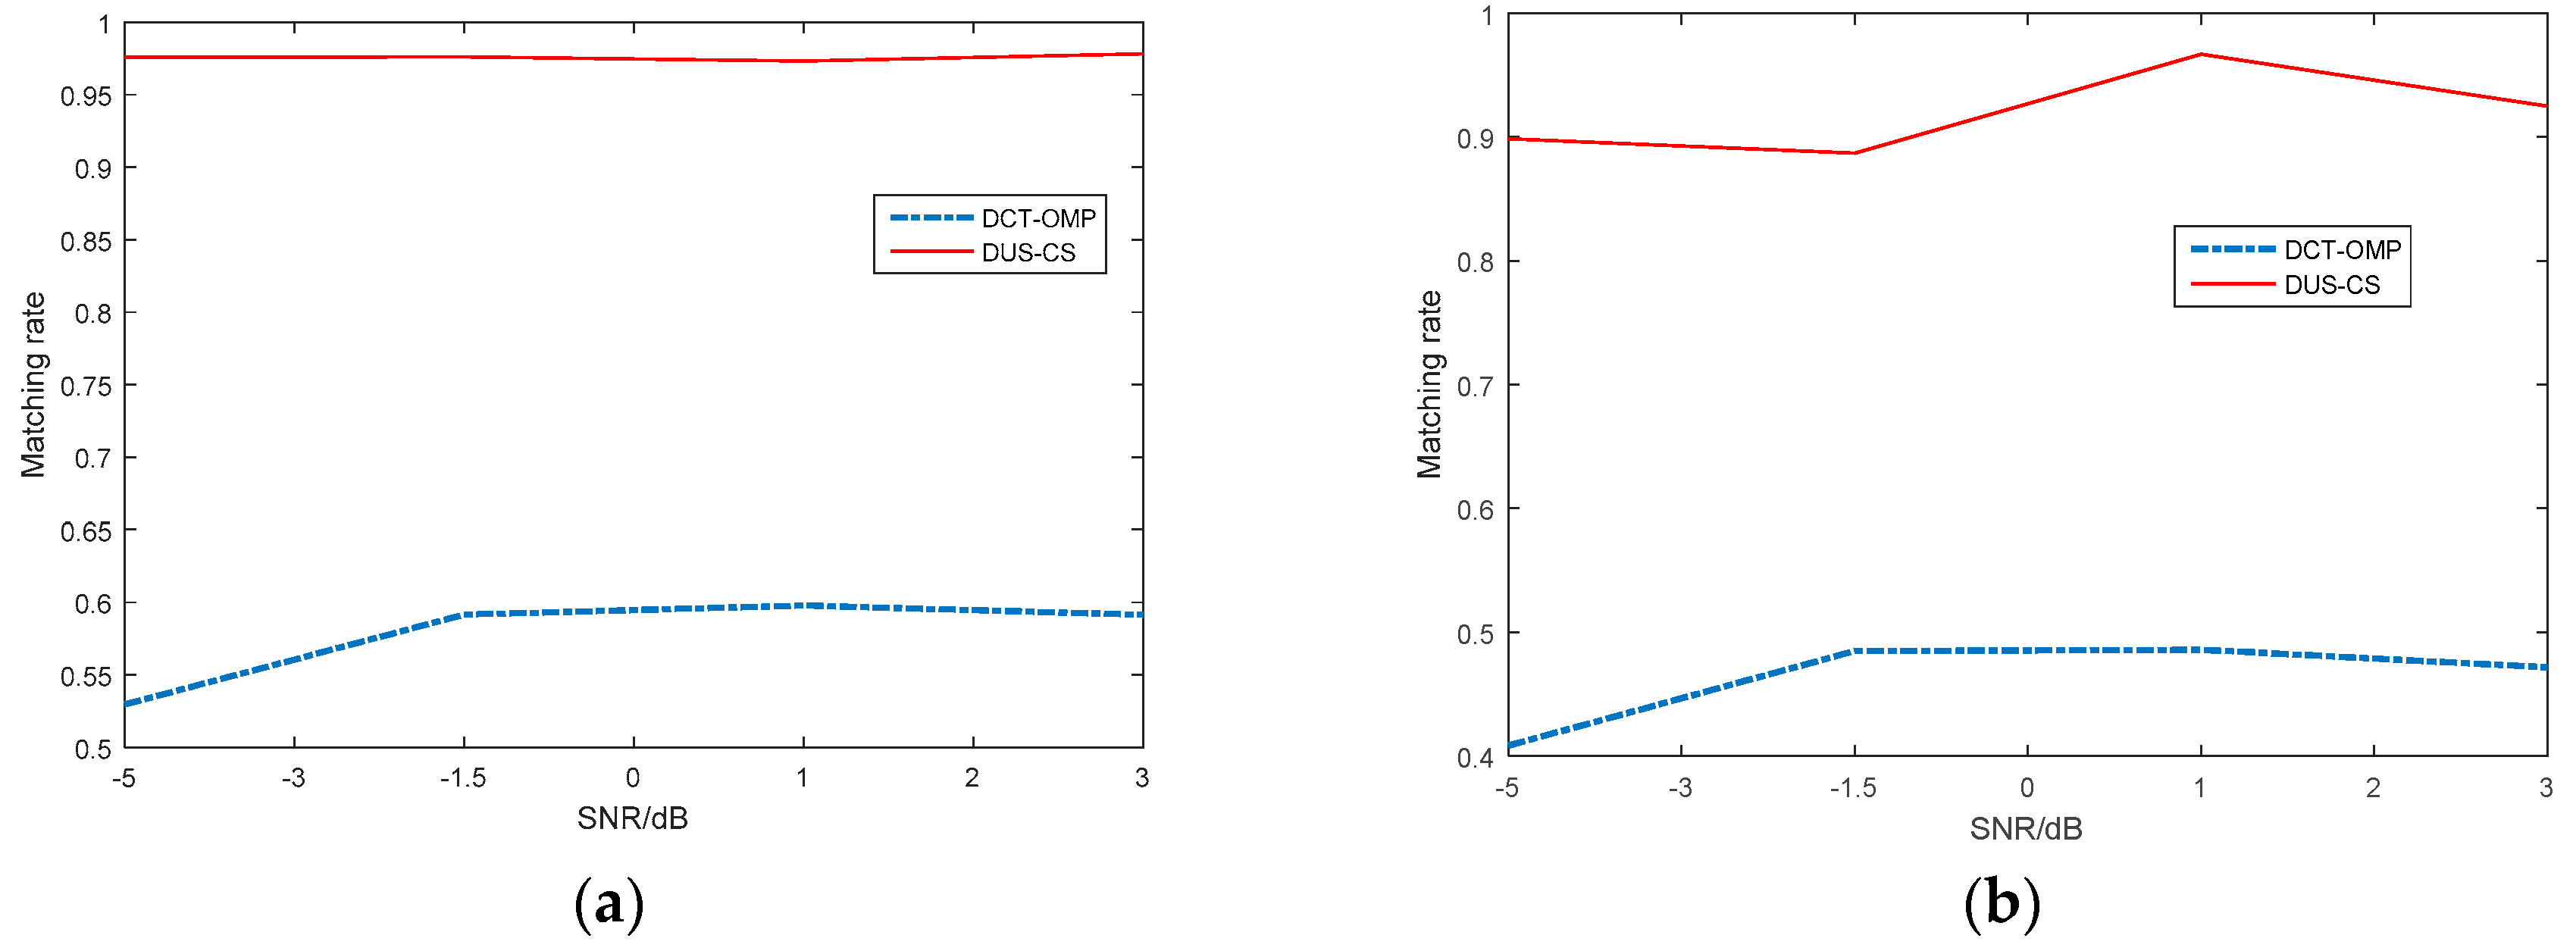
To compare the two methods quantitatively, we use the concept of matching rate [34]
In which is the original signal, is the reconstruction result, and and , respectively, represent the absolute values of and . We give the variation of the matching rate with the signal-to-noise ratio when the compression ratio is 100% and 50%, respectively (Figure 6a,b). It can be seen that the DUS-CS method has obvious advantages. Therefore, the direct under-sampling structure can be used to observe underwater echo signals. The framework of compressive sensing can effectively recover the original signals, which confirms the correctness and effectiveness of the direct under-sampling observation method.
4. DUS-CS Hardware Design
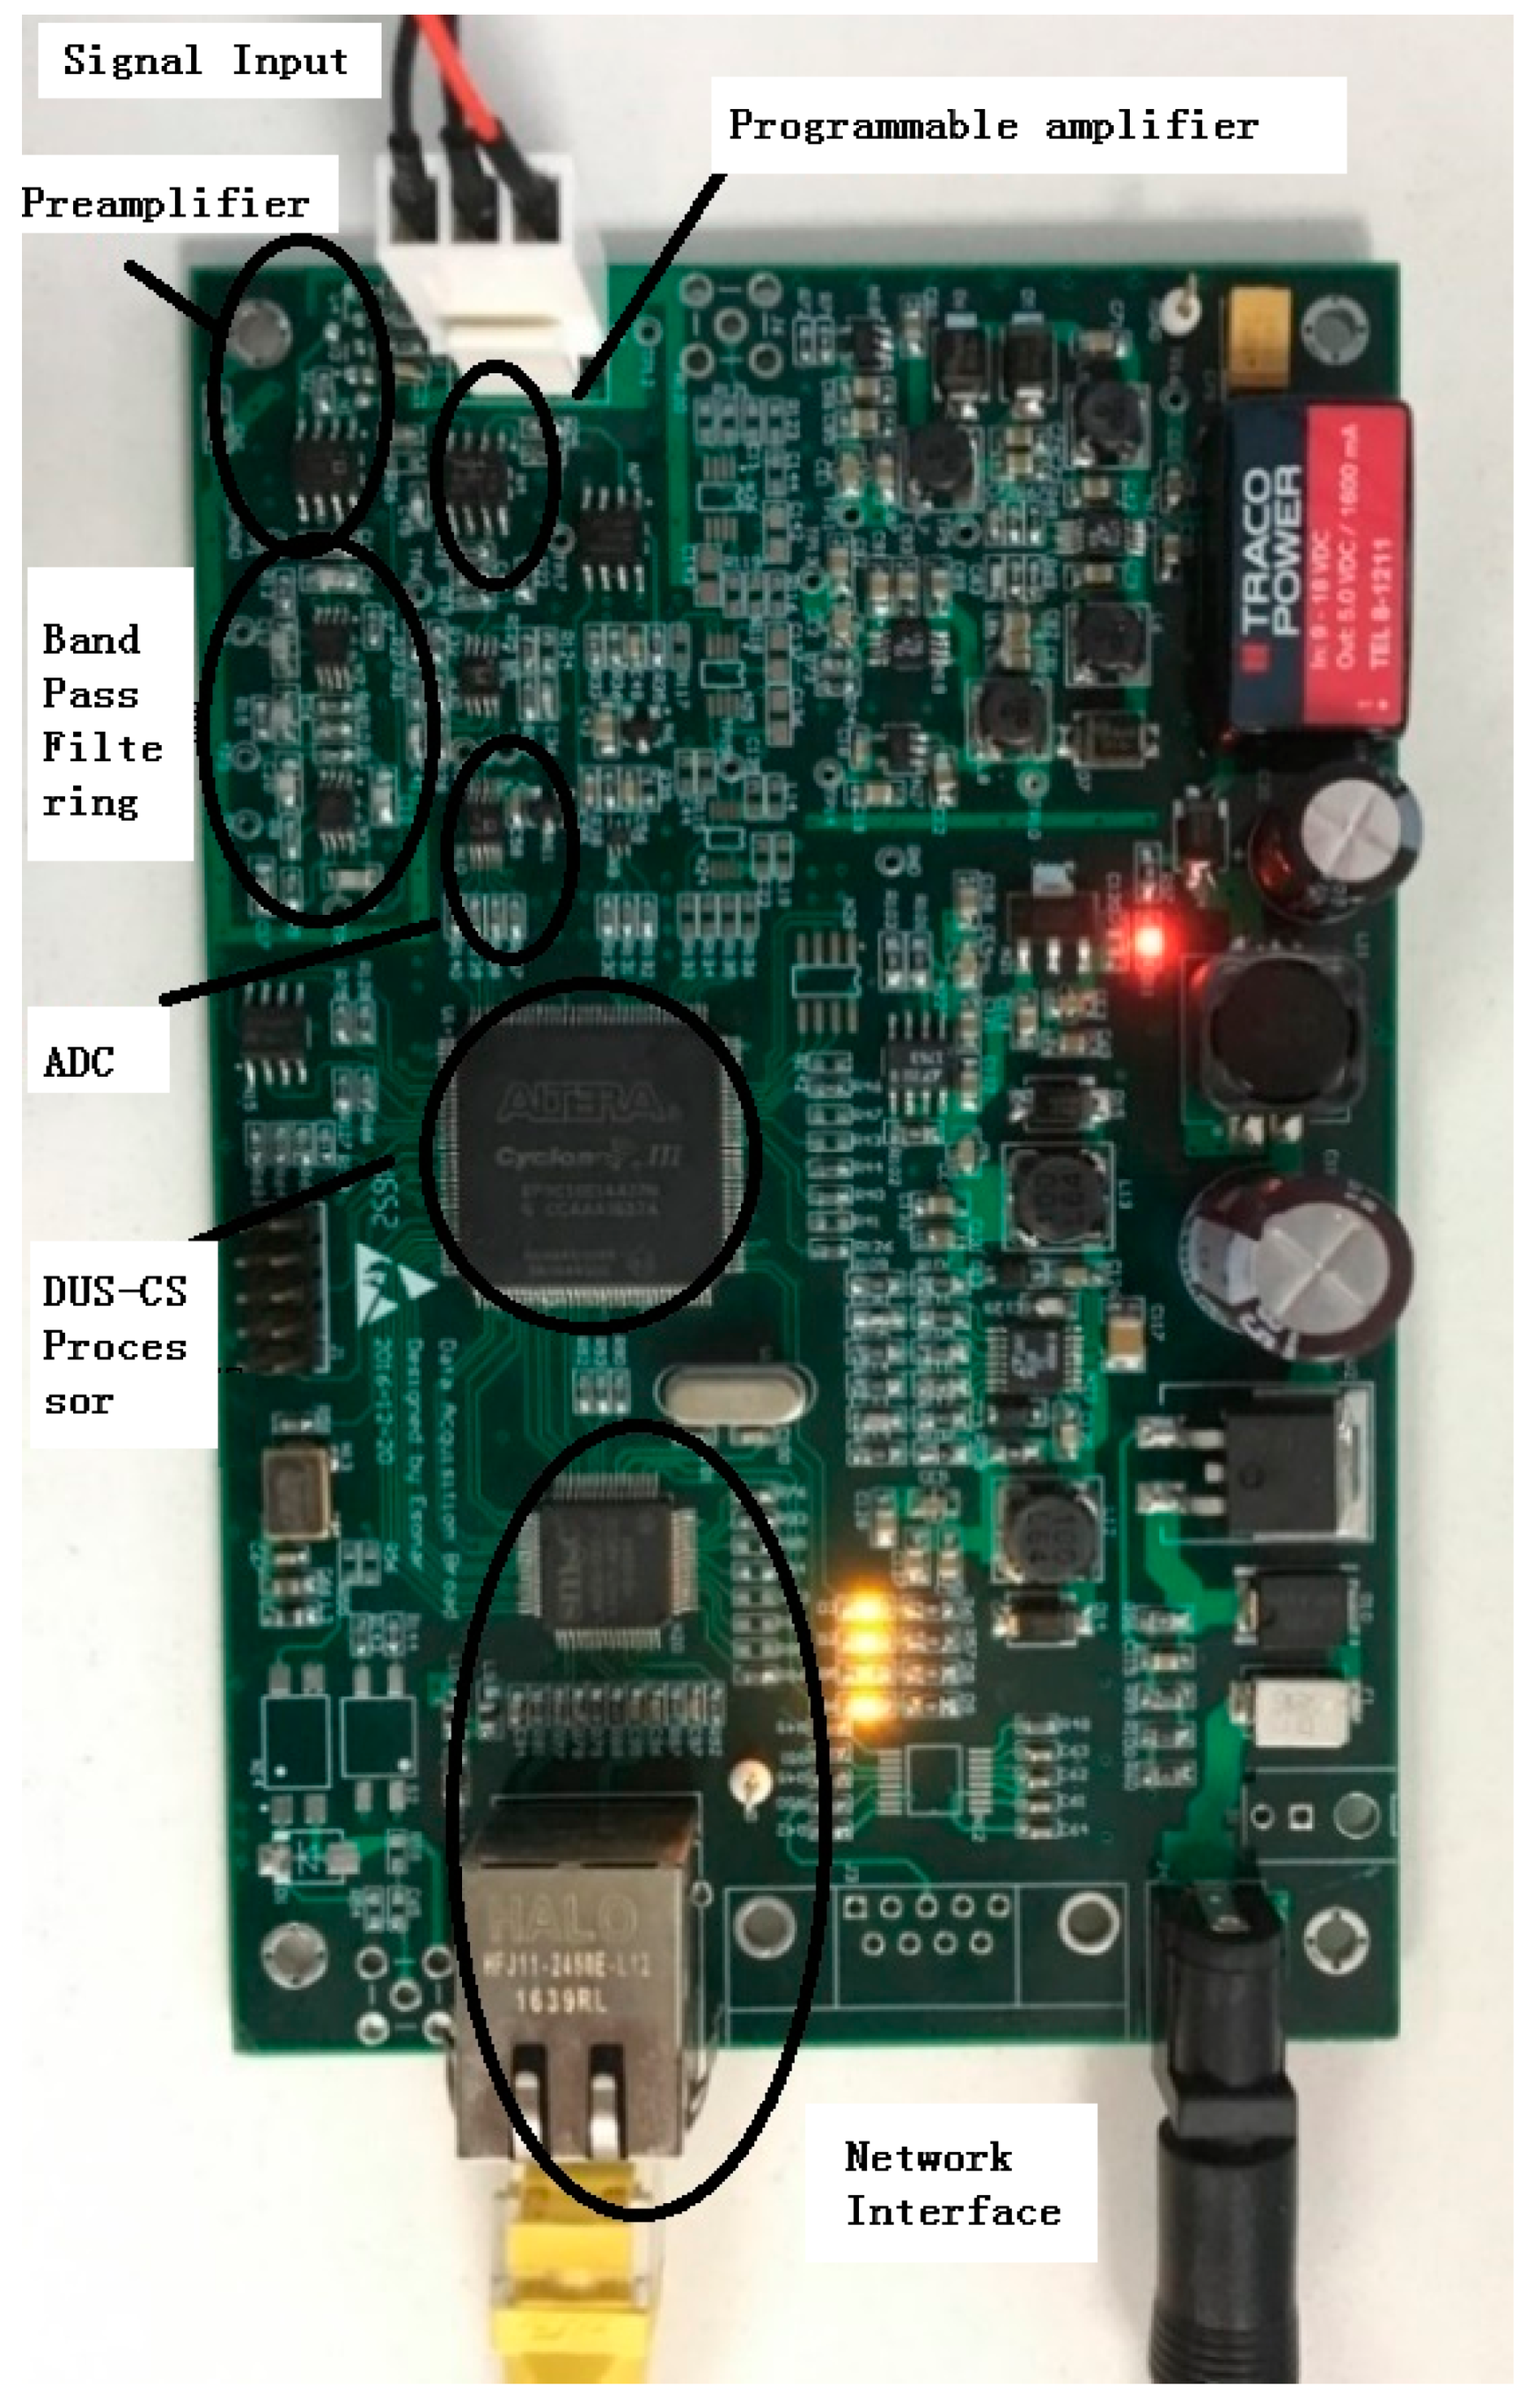
In the direct under-sampling system, the most vital component is data acquisition (DAQ) hardware. This is designed according to the receiving, collecting, and transmitting functions of the underwater acoustic signal. The hardware components include a preamplifier, band pass filtering, programmable amplifier, ADC (analog-to-digital conversion), the DUS-CS processor and the network interface (Figure 7). Figure 8 is an image of the signal collection card.
The preamplifier is the first stage of the collection card, which is controlled with a single resistor that meets the requirements of the system. The bandpass filter uses a fourth-order high-pass filter and a fourth-order low-pass filter in cascade implementation. The programmable amplifier is used for automatic gain control of the underwater acoustic receiver. According to the experimental environment, it is possible to adjust the amplification factor manually or automatically to improve the signal-to-noise ratio of the receiver in a better state. The ADC converts the signal from analog to digital and this function determines the quality of the acquired signal. The processor is the main component of signal acquisition and control, and it is also the main module of the direct under-sampling method. The network collection of the DAQ is used for data upload and network protocol conversion.
5. DUS-CS Data Acquisition and Analysis
5.1. Data Acquisition
The direct under-sampling sensing system has multiple collection modes, such as Nyquist sampling, direct under-sampling, and pseudo-random sampling. Each specific implementation is defined as follows:
- a)
- Nyquist sampling is directly taken from ADC, and put it into the data cache.
- b)
- The direct under-sampling is based on the coefficient, n, of under-sampling. Starting the counter, each time one ADC data is received, the counter is incremented by one. When the number of counts equals n, the current number is stored in the buffer and the counter is reset to zero. In this mode, the amount of data is 1/n of Nyquist sampling.
- c)
- Pseudo-random sampling is the random acquisition of one element of data from coefficient n. The specific implementation method is to pre-generate a pseudo-random sequence of numbers. If the data volume is 1/10 of the Nyquist sampling, and random numbers between 0 and 9 are generated, then the probability of choosing a random number is the same. Then, the numbers are saved to the ROM inside the FPGA. The counter is started and the count value is 10, counting from 0 to 9. When the count value is the same as the output value of the ROM, data is put into the buffer. When the counter reaches 9, the output of the ROM is moved to the next address. This is how pseudo-random sampling of data can be achieved.
5.2. Data Processing and Analysis
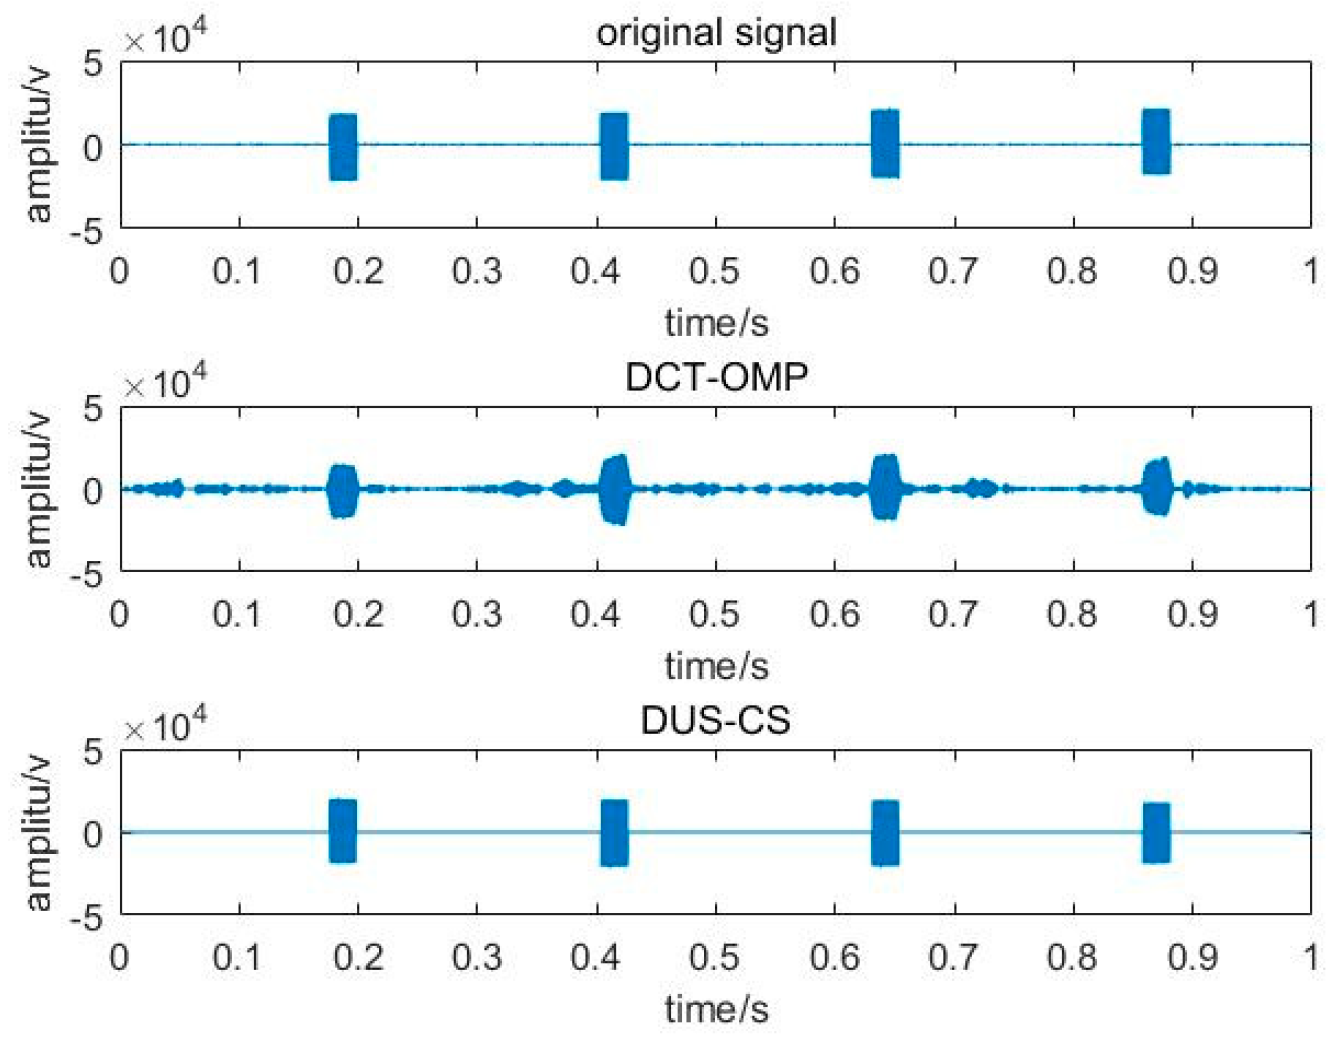
Firstly, the Nyquist sampling data is compressed, observed, and reconstructed to verify the correctness of the method. Figure 9 shows the Nyquist sampling data (sampling rate of 500 kHz) and the reconstruction results of the DCS-OMP method and the DUS-CS method.
To show the reconstruction effect more clearly, we cut off part of the original signal and compared it to the under-sampling observation and reconstruction performed on the original signal (Figure 10).
The amount of the data is 20% of the original signal after direct under-sampling. Noise is added to generate signals with the different SNRs. Then, the original signal is reconstructed using DCS-OMP and DUS-CS (Figure 11).
Figure 12 is a compressive sensing signal with a compression ratio of 10% with different SNRs.
Figure 11 shows the compressive sensing signal with a compression ratio of 10% with different SNRs. As for the processing result of the compressive sensing signal, it can be seen from Figure 11 that when the compression ratio is 20% and SNR = 3 dB, the reconstruction effect of the DCS-OMP method is poor, but the prior information method works well. As the SNR continues to decrease, the DUS-CS still reconstructs the original signal very well. When the compression ratio is 10%, the DCS-OMP method has a poor processing effect, as seen from Figure 12. For the DUS-CS method, as the signal-to-noise ratio decreases, the amplitude of the reconstructed signal deviates from the original, but the overall reconstruction effect is still significant. This result shows that the compressive signal obtained by the direct under-sampling system can recover the original signal, which confirms the correctness and engineering feasibility of the direct under-sampling compressive sensing system.
6. Conclusions
This paper studies the direct under-sampling compression sensing method from the perspective of theory and engineering implementation. The DUS-CS method is proposed based on the theory of compressive sensing and the combination of the characteristics of echo signals with the implementation of direct under-sampling. Underwater echo simulation data was used to verify the correctness and effectiveness of the proposed method. Engineering implementation was achieved by improving the Nyquist sampling circuit with the adoption of pseudo-random sampling timing control. The rising edge (or falling edge) of each trigger signal was sampled and the signal was stored in the data buffer to obtain observation signals with compression ratios of 100%, 50%, 20%, and 10%. Then the DCT-OMP and the DUS-CS methods were used to process the data. The results show that both methods can reconstruct the original signal well when the compression ratio is 100% (in Nyquist sampling mode). Based on this, the correctness of the two methods was verified. When the compression ratio was 20% and below, the reconstruction effect of the DCS-OMP method was weak, but the DUS-CS method proposed in this paper was found to reconstruct the original signal well, even with the SNR being exceptionally low. These results confirm the correctness and engineering practicability of the DUS-CS method and data acquisition system. The method proposed in this paper provides an effective way for compressive sensing to be employed in practical engineering applications.
Author Contributions
Conceptualization, methodology, validation, writing—original draft preparation, T.S. and J.L.; Writing—review and editing, P.B.; Formal analysis, J.L.; Funding acquisition, T.S.
Funding
This research was funded by the pre-research field fund project from Chinese Military Equipment Development Department, grant number 6140243010116DZ04001; the Extension Fund from Underwater Test & Control Technology Key Laboratory, grant number YS24071802; and Chinese National Natural Science Foundation, grant numbers 11974084.
Acknowledgments
This article used experimental data collected at Jiaxing Yisheng Electronic Technology Company (China). We gratefully acknowledge our colleagues for their experimental skills. T. Sun worked on this article as a Visiting Research Fellow to the University of Bath (UK), thanks to the Chinese Scholarship Council (State Scholarship Fund no. 201608330338).
Conflicts of Interest
The authors declare no conflict of interest.
References
- Nyquist, H. Certain Topics in Telegraph Transmission Theory. Trans. Am. Inst. Electr. Eng. 1928, 47, 617–644. [Google Scholar] [CrossRef]
- Shannon, C.E. A Mathematical Theory of Communication. Bell Syst. Tech. J. 1948, 27, 379–423. [Google Scholar] [CrossRef] [Green Version]
- Candès, E.J. Compressed sampling. In Proceedings of the International Congress of Mathematicians, Madrid, Spain, 22–30 August 2006; Volume 3, pp. 1433–1452. [Google Scholar]
- Tsaig, Y.; Donoho, D.L. Extensions of compressed sensing. Signal Process. 2006, 86, 549–571. [Google Scholar] [CrossRef]
- Donoho, D.L. Compressed sensing. IEEE Trans. Inf. Theory 2006, 52, 1289–1306. [Google Scholar] [CrossRef]
- Shi, G.; Liu, D.; Gao, D. Compressed Sensing Theory and Its Research Progress. Chin. J. Electron. 2009, 37, 1070–1081. [Google Scholar]
- Sun, T.; Cao, H.; Blondel, P.; Guo, Y.; Shentu, H. Construction of Measurement Matrix Based on Cyclic Direct Product and QR Decomposition for Sensing and Reconstruction of Underwater Echo. Appl. Sci. 2018, 8, 2510. [Google Scholar] [CrossRef]
- Pant, J.K.; Lu, W.S.; Antoniou, A. Reconstruction of sparse signals by minimizing a re-weighted approximate ℓ-norm in the null space of the measurement matrix. In Proceedings of the IEEE International Midwest Symposium on Circuits and Systems, Seattle, WA, USA, 1–4 August 2010; pp. 430–433. [Google Scholar]
- De Launey, W.; Levin, D.A. A Fourier-analytic approach to counting partial Hadamard matrices. Cryptogr. Commun. 2010, 2, 307–334. [Google Scholar] [CrossRef] [Green Version]
- Kirolos, S.; Laska, J.; Wakin, M.; Duarte, M.; Baron, D.; Ragheb, T.; Massoud, Y.; Baraniuk, R. Analog-to-Information Conversion via Random Demodulation. In Proceedings of the IEEE Dallas/CAS Workshop on Design, Applications, Integration and Software, Richardson, TX, USA, 29–30 October 2006; pp. 71–74. [Google Scholar]
- Laska, J.N.; Kirolos, S.; Duarte, M.F.; Ragheb, T.S.; Baraniuk, R.G.; Massoud, Y. Theory and Implementation of an Analog-to-Information Converter using Random Demodulation. In Proceedings of the IEEE International Symposium on Circuits and Systems, New Orleans, LA, USA, 27–30 May 2007; pp. 1959–1962. [Google Scholar]
- Laska, J.; Kirolos, S.; Massoud, Y.; Baraniuk, R.; Gilbert, A.; Iwen, M.; Strauss, M. Random Sampling for Analog-to-Information Conversion of Wideband Signal. In Proceedings of the 2006 IEEE Dallas/CAS Workshop on Design, Applications, Integration and Software, Richardson, TX, USA, 29–30 October 2006; pp. 119–122. [Google Scholar]
- Yu, Y.; Petropulu, A.P.; Poor, H.V. Measurement Matrix Design for Compressive Sensing–Based MIMO Radar. IEEE Trans. Signal Process. 2011, 59, 5338–5352. [Google Scholar] [CrossRef]
- Pasquero, O.P.; Herique, A.; Kofman, W. Oversampled Pulse Compression Based on Signal Modeling: Application to CONSERT/Rosetta Radar. IEEE Trans. Geosci. Remote. Sens. 2017, 55, 2225–2238. [Google Scholar] [CrossRef]
- Khwaja, A.S.; Ma, J. Applications of Compressed Sensing for SAR Moving-Target Velocity Estimation and Image Compression. IEEE Trans. Instrum. Meas. 2011, 60, 2848–2860. [Google Scholar] [CrossRef]
- Deng, C.; Lin, W.; Lee, B.-S.; Lau, C.T.; Lee, F.B. Robust image compression based on compressive sensing. In Proceedings of the IEEE International Conference on Multimedia and Expo, Suntec City, Singapore, 19–23 July 2010; pp. 462–467. [Google Scholar]
- Li, J.; Fu, Y.; Li, G.; Liu, Z. Remote Sensing Image Compression in Visible/Near-Infrared Range Using Heterogeneous Compressive Sensing. IEEE J. Sel. Top. Appl. Earth Obs. Remote Sens. 2018, 11, 4932–4938. [Google Scholar] [CrossRef]
- Zhou, N.; Zhang, A.; Zheng, F.; Gong, L. Novel image compression–encryption hybrid algorithm based on key-controlled measurement matrix in compressive sensing. Opt. Laser Technol. 2014, 62, 152–160. [Google Scholar] [CrossRef]
- Schiffner, M.; Schmitz, G. Rapid measurement of ultrasound transducer fields in water employing compressive sensing. In Proceedings of the IEEE International Ultrasonics Symposium, San Diego, CA, USA, 11–14 October 2010; pp. 1849–1852. [Google Scholar]
- Ito, T.; Ueno, T.; Kurose, D.; Yamaji, T.; Itakura, T. A 10-bit, 200-MSPS, 105-mW pipeline A-to-D converter. IEICE Electron. Express 2005, 2, 429–433. [Google Scholar] [CrossRef] [Green Version]
- Liu, W.; Chen, G.; Han, X.; Wang, Y.; Xie, Y.; Yang, H. Design methodologies for 3D mixed signal integrated circuits: A practical 12-bit SAR ADC design case. In Proceedings of the 51st ACM/EDAC IEEE Design Automation Conference (DAC), San Francisco, CA, USA, 1–5 June 2014; pp. 1–6. [Google Scholar]
- Voulgari, E.; Noy, M.; Anghinolfi, F.; Krummenacher, F.; Kayal, M. Correction to: Design of a wide dynamic range ADC for current sensing. Analog Integr. Circuits Signal Process. 2018, 96, 371. [Google Scholar] [CrossRef]
- Guo, W.; Kim, Y.; Tewfik, A.H.; Sun, N. A Fully Passive Compressive Sensing SAR ADC for Low-Power Wireless Sensors. IEEE J. Solid-State Circuits 2017, 52, 2154–2167. [Google Scholar] [CrossRef]
- Wang, R.; Zhang, J.; Ren, S.; Li, Q. A reducing iteration orthogonal matching pursuit algorithm for compressive sensing. Tsinghua Sci. Technol. 2016, 21, 71–79. [Google Scholar] [CrossRef]
- Mota, J.F.; Xavier, J.M.; Aguiar, P.M.; Puschel, M. Distributed Basis Pursuit. IEEE Trans. Signal Process. 2012, 60, 1942–1956. [Google Scholar] [CrossRef]
- Yaghoobi, M.; Wu, D.; Davies, M.E. Fast Non-Negative Orthogonal Matching Pursuit. IEEE Signal Process. Lett. 2015, 22, 1229–1233. [Google Scholar] [CrossRef] [Green Version]
- Lin, J. Random Projection Observation Method and Its Application in Ultra-Wideband Signal Sampling. Ph.D. Thesis, Xidian University, Xi’an, China, 2012; pp. 60–64. [Google Scholar]
- Sun, T.; Gao, E.; Chen, H. Block Signal Sparse Decomposition Method for Underwater Target Echo. Acoust. Technol. 2015, 34, 457–461. [Google Scholar]
- Sun, T.; Blondel, P.; Jia, B.; Li, G.; Gao, E. Compressive sensing method to leverage prior information for submerged target echoes. J. Acoust. Soc. Am. 2018, 144, 1406–1415. [Google Scholar] [CrossRef]
- Candés, E.J. The restricted isometry property and its implications for compressed sensing. C. R. Math. 2008, 346, 589–592. [Google Scholar] [CrossRef]
- Whittaker, J.M. Interpolatory Function Theory; Cambridge Univ. Press: Cambridge, UK, 1935. [Google Scholar]
- Tang, W. Highlight model of echoes from sonar targets. Acoust. J. 1994, 2, 131–140. [Google Scholar]
- Chen, S.; Xie, Z.; Yu, Y. Simulation of simplified reflect highlights model from submarine. Audio Eng. 2011, 35, 53–55. [Google Scholar]
- Ma, Q. Research on Signal Reconstruction Algorithms for Compressed Sensing. Master’s Thesis, Nanjing University of Posts and Telecommunications, Nanjing, China, 2013; pp. 12–13. [Google Scholar]
Figure 1.
Direct under-sampling compressive sensing method.

Figure 2.
Simulation results of underwater echo signals.

Figure 3.
Reconstruction signal at a compression ratio of 100% (no compression). (a) SNR = 3 dB; (b) SNR = 0 dB; (c) SNR = −3 dB; (d) SNR = −8 dB.
Figure 3.
Reconstruction signal at a compression ratio of 100% (no compression). (a) SNR = 3 dB; (b) SNR = 0 dB; (c) SNR = −3 dB; (d) SNR = −8 dB.

Figure 4.
Reconstruction signal at a compression ratio of 50%. (a) SNR = 3 dB; (b) SNR = 0 dB; (c) SNR = −3 dB; (d) SNR = −8 dB.
Figure 4.
Reconstruction signal at a compression ratio of 50%. (a) SNR = 3 dB; (b) SNR = 0 dB; (c) SNR = −3 dB; (d) SNR = −8 dB.

Figure 5.
Reconstruction signals at a compression ratio of 20%. (a) SNR = 3 dB; (b) SNR = 0 dB; (c) SNR = −3 dB; (d) SNR = −5 dB.
Figure 5.
Reconstruction signals at a compression ratio of 20%. (a) SNR = 3 dB; (b) SNR = 0 dB; (c) SNR = −3 dB; (d) SNR = −5 dB.

Figure 6.
Variation of the matching rate with the SNR. (a) the compression ratio is 100%; (b) the compression ratio is 50%.
Figure 6.
Variation of the matching rate with the SNR. (a) the compression ratio is 100%; (b) the compression ratio is 50%.

Figure 7.
Data acquisition (DAQ) components.

Figure 8.
Photograph of the collection card.

Figure 9.
Nyquist sampling and reconstruction results.

Figure 10.
The original signal.

Figure 11.
Reconstruction results with compression ratio of 20%. (a) SNR = 3 dB; (b) SNR = 0 dB; (c) SNR = −3 dB; (d) SNR = −8 dB.
Figure 11.
Reconstruction results with compression ratio of 20%. (a) SNR = 3 dB; (b) SNR = 0 dB; (c) SNR = −3 dB; (d) SNR = −8 dB.

Figure 12.
Reconstruction results with compression ratio of 10%. (a) SNR = 3 dB; (b) SNR = 0 dB; (c) SNR = −3 dB; (d) SNR = −8 dB.
Figure 12.
Reconstruction results with compression ratio of 10%. (a) SNR = 3 dB; (b) SNR = 0 dB; (c) SNR = −3 dB; (d) SNR = −8 dB.

© 2019 by the authors. Licensee MDPI, Basel, Switzerland. This article is an open access article distributed under the terms and conditions of the Creative Commons Attribution (CC BY) license (http://creativecommons.org/licenses/by/4.0/).
Share and Cite
MDPI and ACS Style
Sun, T.; Li, J.; Blondel, P. Direct Under-Sampling Compressive Sensing Method for Underwater Echo Signals and Physical Implementation. Appl. Sci. 2019, 9, 4596. https://doi.org/10.3390/app9214596
AMA Style
Sun T, Li J, Blondel P. Direct Under-Sampling Compressive Sensing Method for Underwater Echo Signals and Physical Implementation. Applied Sciences. 2019; 9(21):4596. https://doi.org/10.3390/app9214596
Chicago/Turabian StyleSun, Tongjing, Ji Li, and Philippe Blondel. 2019. "Direct Under-Sampling Compressive Sensing Method for Underwater Echo Signals and Physical Implementation" Applied Sciences 9, no. 21: 4596. https://doi.org/10.3390/app9214596
Note that from the first issue of 2016, this journal uses article numbers instead of page numbers. See further details here.