Influence of Impeller Speed Patterns on Hemodynamic Characteristics and Hemolysis of the Blood Pump


Key Laboratory of Advanced Manufacturing and Intelligent Technology, Ministry of Education, Harbin University of Science and Technology, Harbin 150080, China
*
Author to whom correspondence should be addressed.
Appl. Sci. 2019, 9(21), 4689; https://doi.org/10.3390/app9214689
Submission received: 25 September 2019
/
Revised: 17 October 2019
/
Accepted: 30 October 2019
/
Published: 4 November 2019
(This article belongs to the Section Mechanical Engineering)
Abstract
:A continuous-flow output mode of a rotary blood pump reduces the fluctuation range of arterial blood pressure and easily causes complications. For a centrifugal rotary blood pump, sinusoidal and pulsatile speed patterns are designed using the impeller speed modulation. This study aimed to analyze the hemodynamic characteristics and hemolysis of different speed patterns of a blood pump in patients with heart failure using computational fluid dynamics (CFD) and the lumped parameter model (LPM). The results showed that the impeller with three speed patterns (including the constant speed pattern) met the normal blood demand of the human body. The pulsating flow generated by the impeller speed modulation effectively increased the maximum pulse pressure (PP) to 12.7 mm Hg, but the hemolysis index (HI) in the sinusoidal and pulsatile speed patterns was higher than that in the constant speed pattern, which was about 2.1 × 10⁻⁵. The flow path of the pulsating flow field in the spiral groove of the hydrodynamic suspension bearing was uniform, but the alternating high shear stress (0~157 Pa) was caused by the impeller speed modulation, causing blood damage. Therefore, the rational modulation of the impeller speed and the structural optimization of a blood pump are important for improving hydrodynamic characteristics and hemolysis.
1. Introduction
A ventricular assist device helps the native heart to pump blood to meet the normal demand of patients with heart failure. It is an effective method for treating heart failure in a clinic. At present, a ventricular assist device has developed from the first generation of a total artificial heart to the third generation of a suspension rotary blood pump. Additionally, the structure of a blood pump has been further reduced to be implantable into the thoracic cavity of a human body. In clinical application, a blood pump is the core component of a ventricular assist device that needs to not only satisfy the hemodynamic characteristics of the blood flow rate and pressure output of a wide range of patients, but also have good blood compatibility to prevent hemolysis and thrombosis. At present, commercial blood pumps used for treating heart failure are divided mainly into two forms: total artificial heart and continuous-flow blood pump (CFBP). The output blood flow form of a pulsatile-flow blood pump (PFBP) is consistent with the native heart of the human body, but the structure is complex and the volume is large, making its implantation into a patient body difficult; it also has a high failure rate. Moreover, PFBP is prone to cause thrombosis, infection, and other symptoms in clinical applications. A CFBP realizes the continuous output of blood flow rate and blood pressure by controlling the impeller speed. This kind of blood pump has the advantages of small size, stable performance, and good implantability. Therefore, the continuous development of a PFBP or a CFBP has always been a hot topic for researchers [1,2].
A CFBP provides a specific blood pressure at a constant speed pattern to meet the blood demand. Although it has been widely used in clinically treating patients with heart failure and has achieved a good auxiliary effect, some complications still exist, such as bleeding, aortic valve insufficiency, and thrombosis, in patients with heart failure, seriously affecting the treatment effect and the quality of life [3]. Therefore, some studies have explored the possibility that the blood flow rate and pressure at the outlet of CFBP can be similar to the pulsatile-flow output by means of impeller speed modulation [4,5,6], and investigated the differences in the hemodynamic characteristics between a CFBP and a PFBP.
Professor Kunxi Qian designed a PFBP impeller with low hemolysis based on the ternary theory [7,8]. The experimental result showed that the pulsating flow was produced when the impeller speed changed periodically. Compared with diaphragm pumps and other types of PFBP, it had a lower hemolysis value. Pirbodaghi et al. studied the effects of different speed patterns of a blood pump on hemodynamic characteristics through animal experiments. The results showed that the speed modulation of the blood pump directly affected the left ventricular pressure and volume, and the arterial pressure, while the coronary blood flow was not affected. The synchronized pulsatile control of the impeller speed of the blood pump helped in ventricular unloading, resulting in more physiological blood flow and better blood perfusion effect [9]. Cheng compared the advantages and disadvantages between a CFBP and a PFBP, and pointed out that a CFBP could cause complications in long-term assistance and reduce blood pressure pulsatility, which was not conducive to myocardial recovery [10]. Therefore, the best solution was to achieve pulsating blood flow on the basis of a CFBP. In addition, the author also pointed out that it was necessary to study the physiological response, end-organ function, and left ventricular remodeling at different levels of pulsation and assistance. Nammakie [11] studied the hemolysis performance of PFBP using the Lagrange particle tracking method, and the effects of trapezoidal and sinusoidal speed patterns on the flow rate and hemolysis were analyzed. Deepankaew established a cardiovascular system simulation model, and the effects of constant and periodic change in impeller rotation on ventricular output under normal and heart failure conditions were compared and analyzed using the MATLAB software. The results showed that the ejection fraction, pressure–volume area, and ventricular efficiency improved under the periodic change in impeller rotation [12]. Therefore, the method controlling the periodic change in impeller rotation could be used to reduce the ventricular load in adjuvant therapy of patients waiting for heart transplantation. Some scholars have studied the speed modulation control method of the blood pump to improve blood pulsation and blood output characteristics in line with physiological characteristics [13,14,15,16].
In summary, some studies explored the realization of pulsating flow in a CFBP, and most of them focused on axial flow blood pumps. This study aimed to investigate the centrifugal blood pump with hybrid magnetic-hydrodynamic suspension based on the aforementioned studies, taking the complex hemodynamic characteristics of the centrifugal blood pump relative to the axial-flow blood pump into consideration. The impeller speed modulation of the PFBP was determined on the basis of the pressure head versus the flow rate (H–Q) curve of the CFBP. The hemodynamic characteristics of patients with heart failure under different speed patterns of a blood pump support were simulated and analyzed using the lumped parameter model (LPM) of the cardiovascular system. The hemolysis characteristics of the blood pump were analyzed using the computational fluid dynamics (CFD) method. It provided a certain research basis for formulating a control strategy of the pulsatile-flow rotary blood pump and the optimization of hemodynamic characteristics and hemolysis.
2. Materials and Methods
2.1. Structure and Working Principle of the Blood Pump
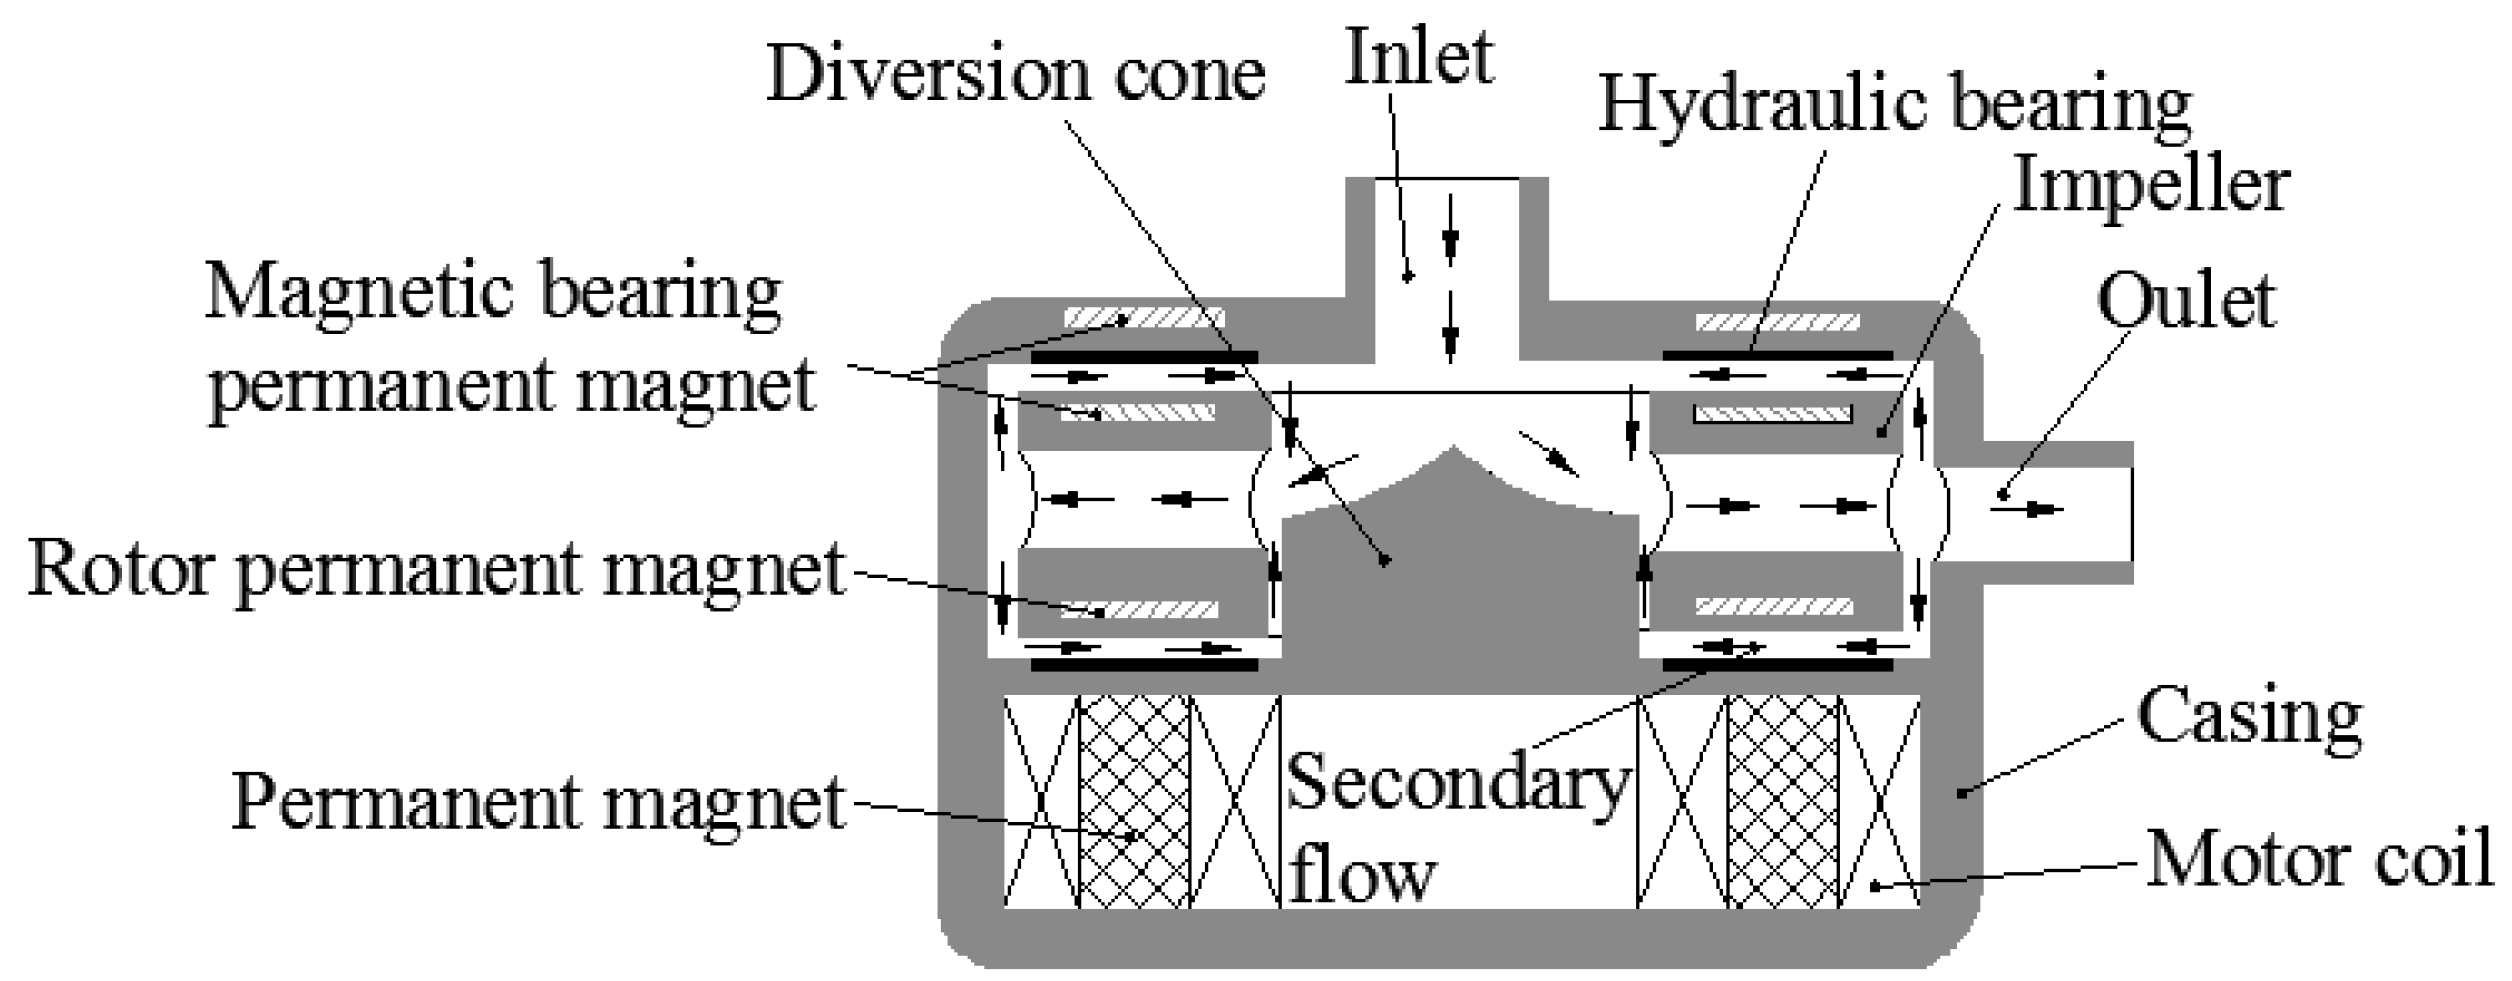
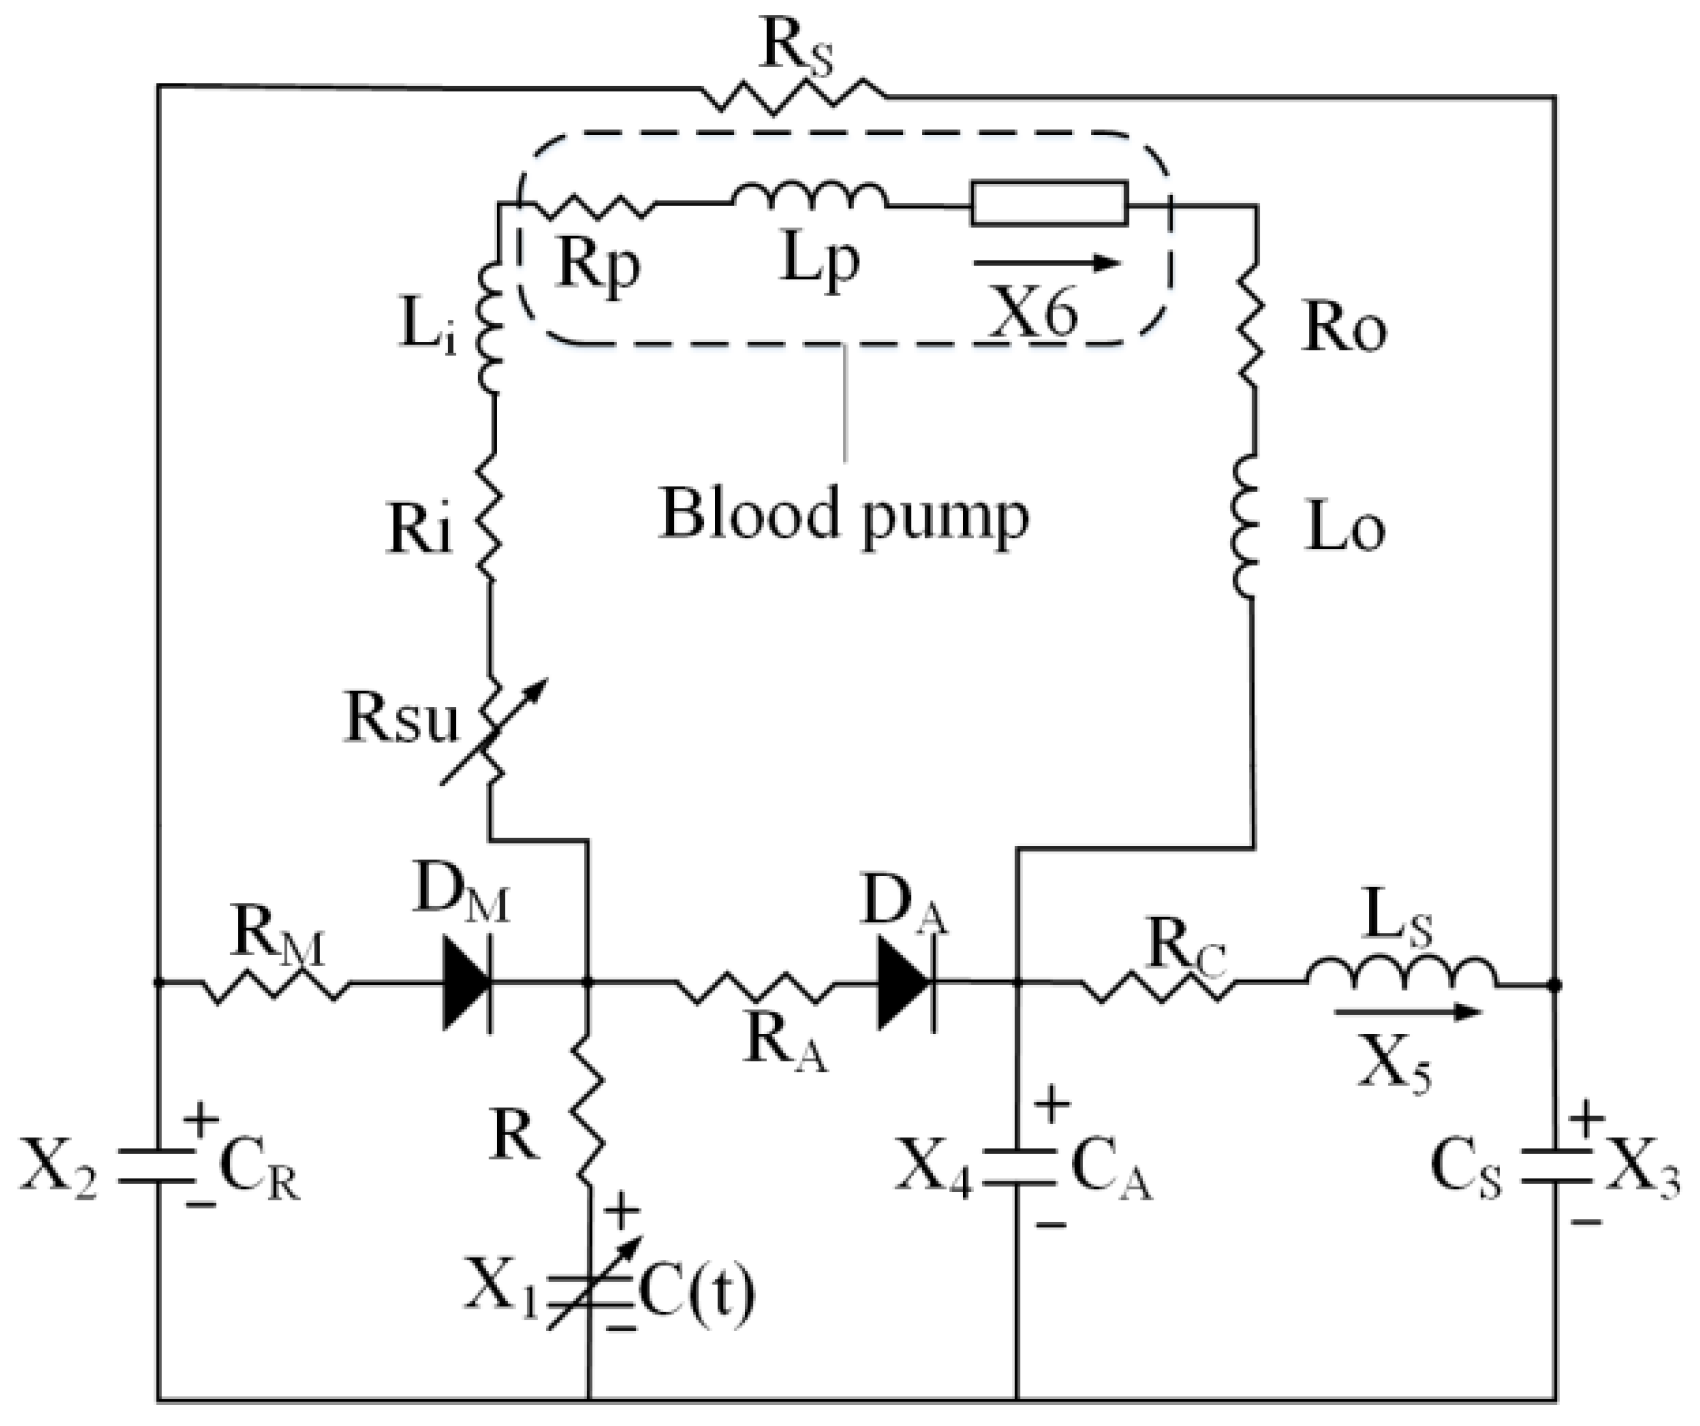
Figure 1 shows the structure of a centrifugal hybrid magnetic-hydrodynamic suspension blood pump. The impeller adopted the hybrid magnetic-hydrodynamic suspension technology. The magnetic suspension force was balanced by the interaction between the permanent magnetic force and the electromagnetic force of the motor acting on the impeller. Therefore, the impeller was suspended in the pump shell under the combined action of the magnetic suspension force and the supporting force of the hydraulic bearing. The impeller of the blood pump was regarded as the rotor of the motor. The impeller was driven by the changing magnetic field produced by the stator in the motor shell.
2.2. Modeling and Meshing
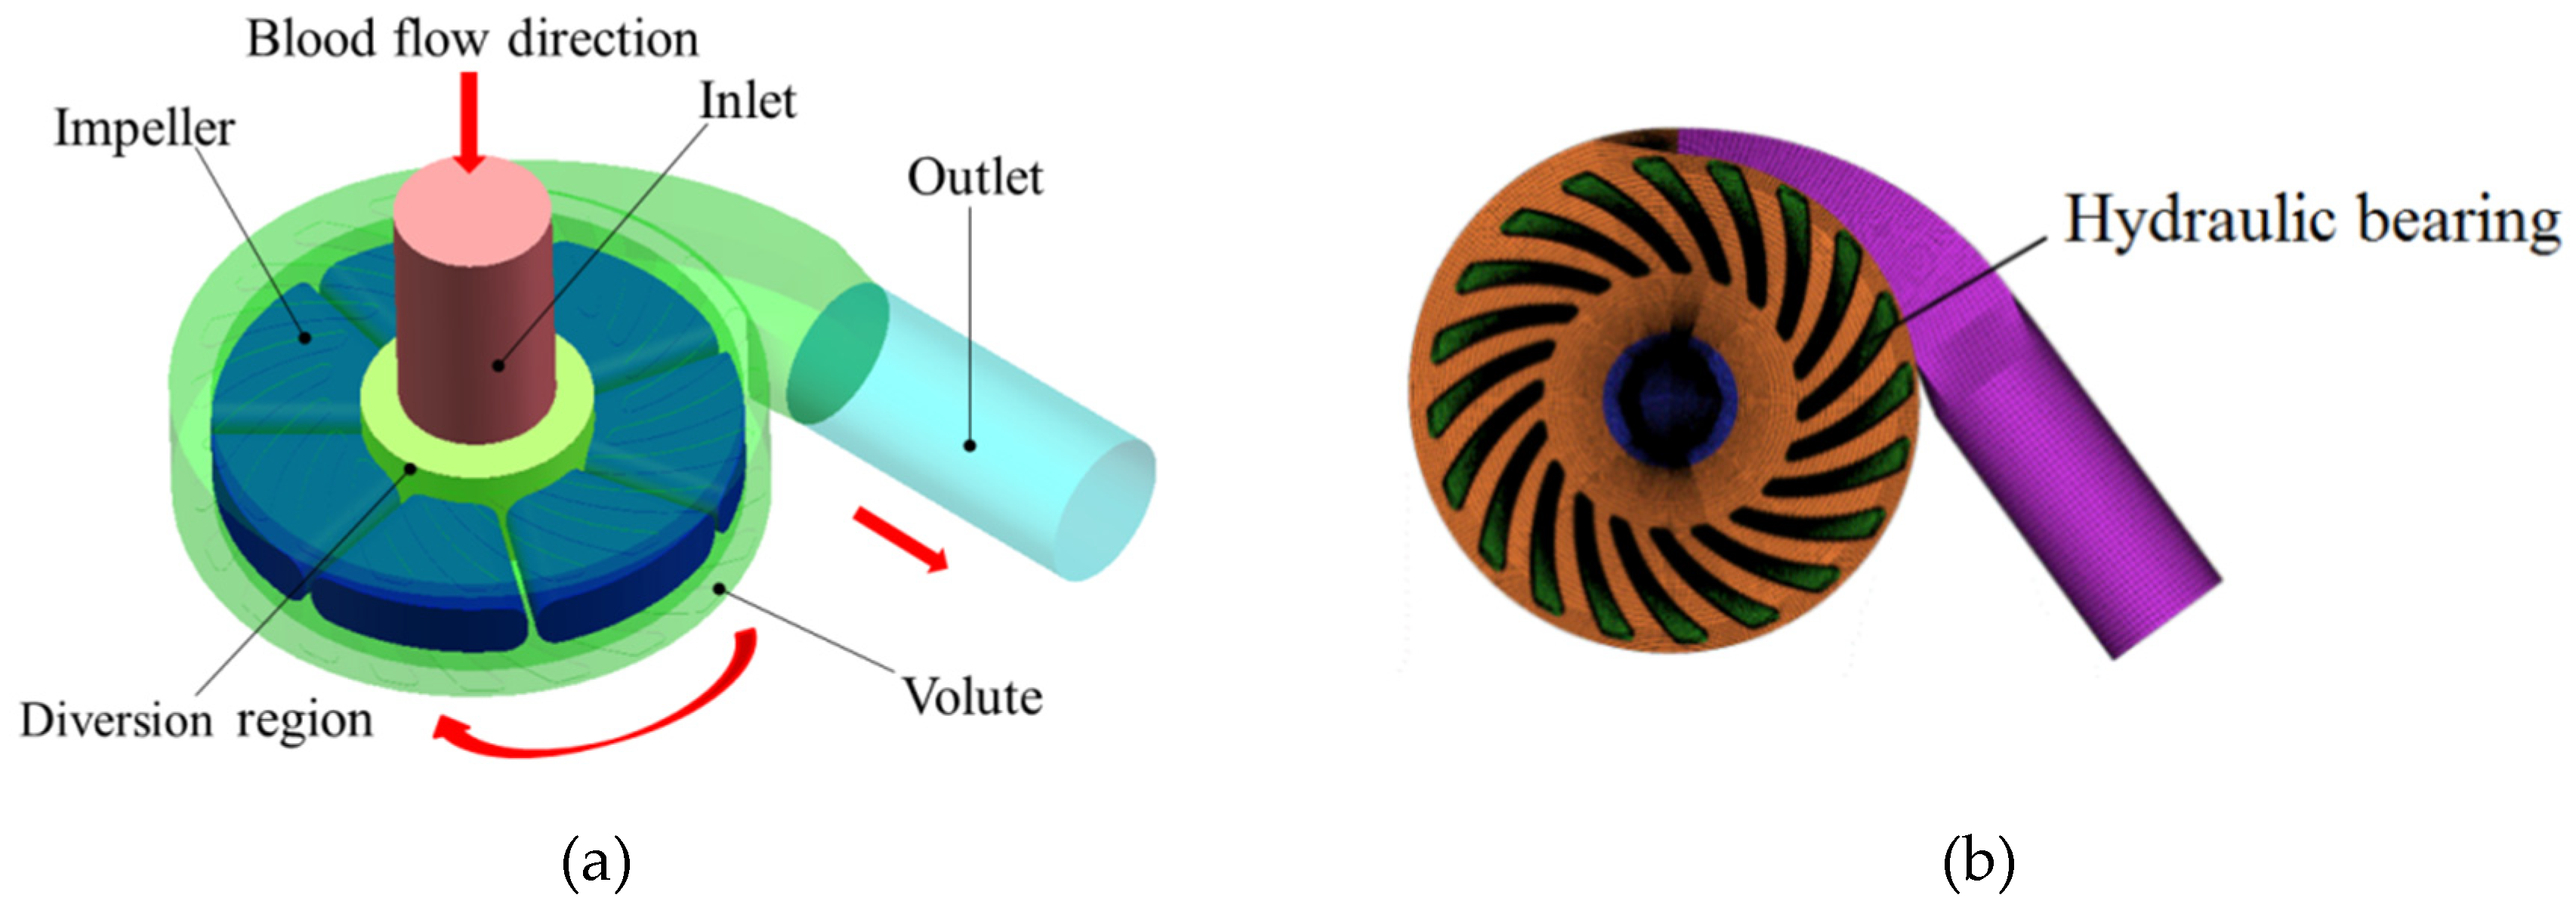
The simulation model of the flow field of the blood pump consisted of five parts to simulate the flow characteristics of blood pumps accurately, as shown in Figure 2a. The structural grid had better calculation accuracy and convergence, and could capture the flow details of the internal flow field of the blood pump. Therefore, structural meshes were divided for each part of the simulation model of a blood pump in the ANSYS ICEM software (ANSYS, Inc., PA, USA), as shown in Figure 2b.
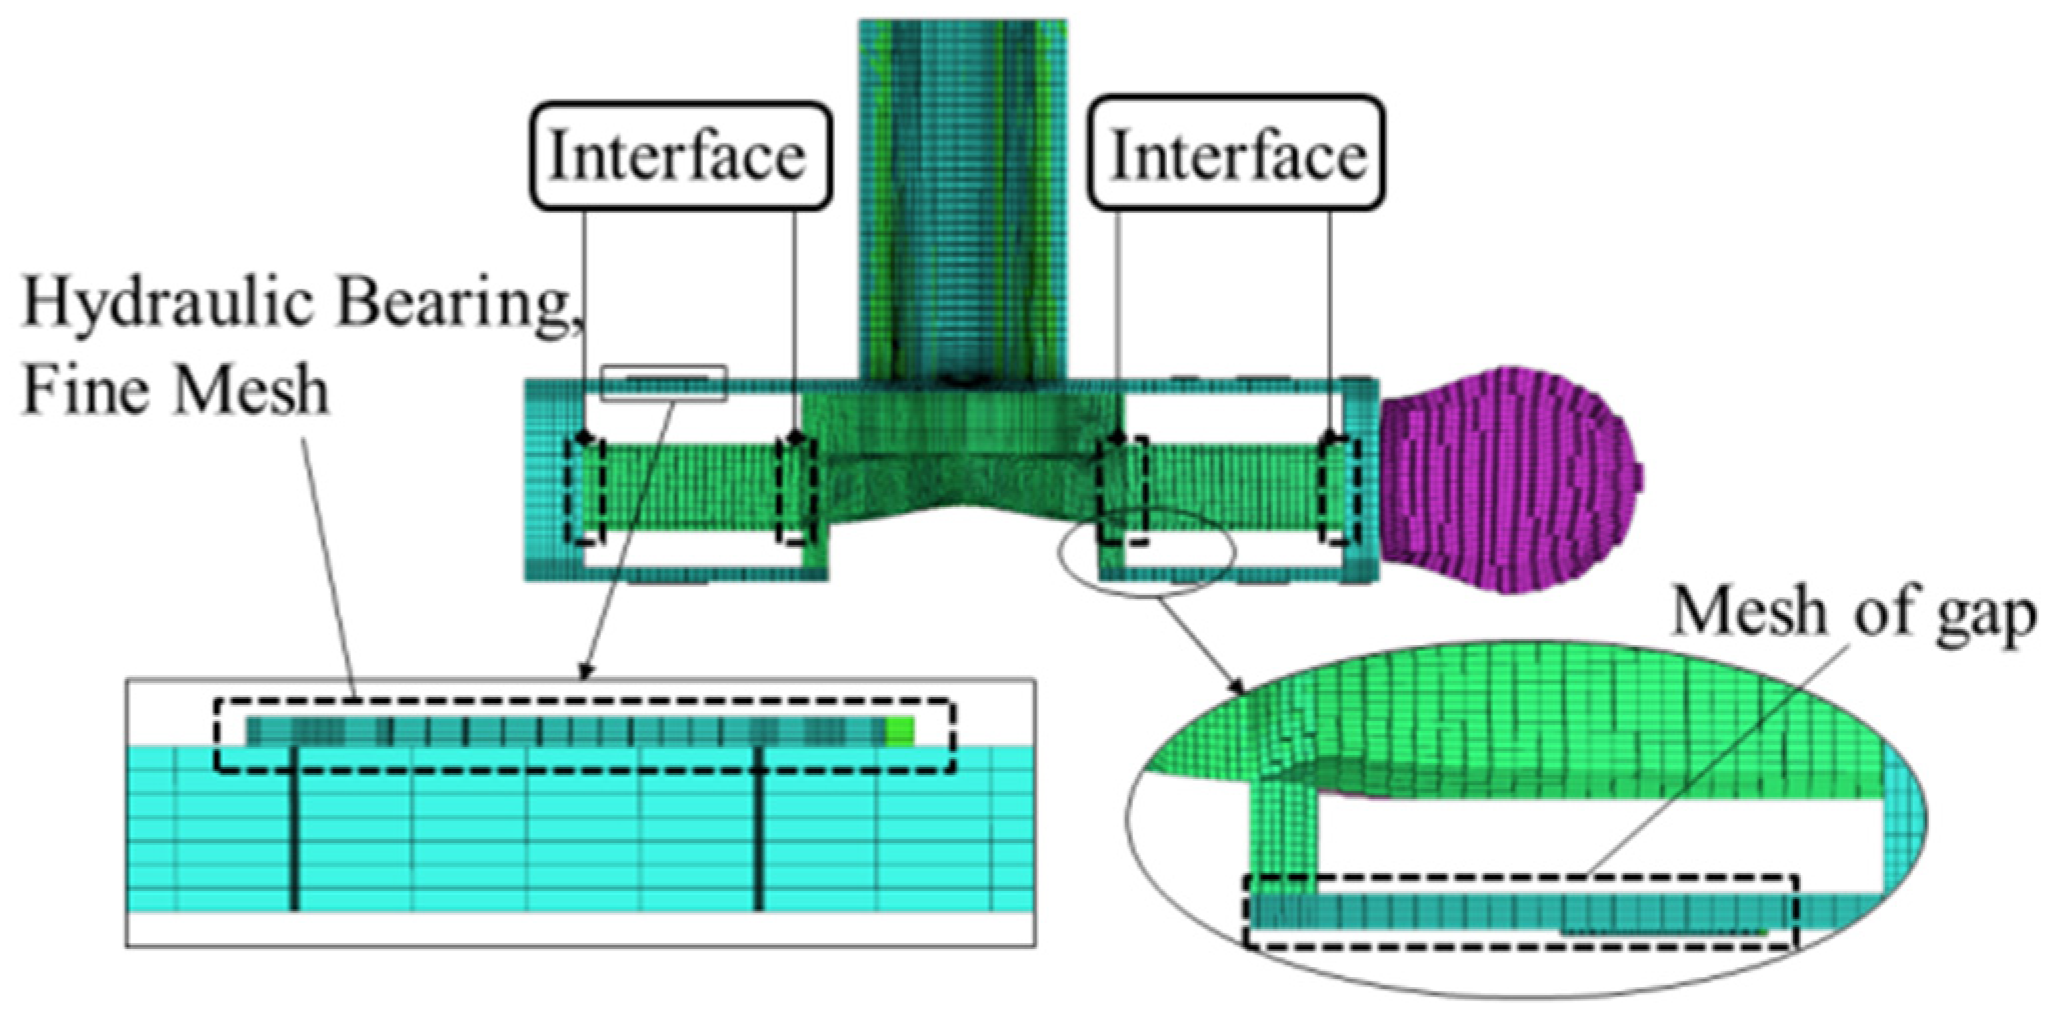
An impeller was a significant driving component of the blood pump. The boundary layer grids were divided for the impeller channel to obtain accurate simulation results. In addition, hemolysis might occur in the small clearance between the impeller and the pump shell and the small size of the spiral groove of the hydrodynamic bearing. Therefore, refined structural grids, as shown in Figure 3, were divided into these areas to obtain accurate simulation results. The number of grid elements in each region is shown in Table 1.
2.3. Steady-State Simulation of the Hydrodynamic Characteristics of the Blood Pump
CFD is an effective method to obtain the hydrodynamic characteristics of blood pumps and the cardiovascular system [17,18]. Blood is considered as a Newtonian fluid in large vessels where the shear strain is high; in the present study, blood was basically simplified to a Newtonian fluid for modeling, simulation, and experimental research [6,19]. Therefore, the viscosity of the blood was set at 3.5 cp. The blood density was set at 1055 kg/m3. The inlet boundary condition of the blood pump was the blood flow rate, and the outlet boundary condition was the outflow. When analyzing the flow field of the centrifugal blood pump, it is often considered that the flow characteristic in the pump is a three-dimensional incompressible viscous turbulent flow field. According to the theory of fluid mechanics and the blood flow state in the pump chamber, the flow field is solved using the continuity equation, momentum equation, and turbulence model. With the conditions of constant density, the continuity equation was reduced to:
where ( = 1, 2, 3) is the Cartesian component of the velocity vector. The momentum conservation equation in the direction was as follows:
where ( = 1, 2, 3) is the directional coordinates, ( = 1, 2, 3) is the respective components of the velocity vector in the direction, is the static fluid pressure, is time, is the stress tensor, is the fluid density, and is the gravitational force in the direction.
The relative motion of the impeller relative to the volute in the computational domain was simulated by the multiple reference frame model. The coordinates of the dynamic reference frame were set on the impeller, and the impeller wall was set as the rotating wall. In the simulation model, the interface between the dynamic and static regions was set as the interface for data transmission, as shown in Figure 3, and the rest of the wall was set as a wall without sliding. The near-wall area was processed by the standard wall function method, and the solver adopted the semi-implicit method for pressure-linked equations (SIMPLEs) algorithm. The residual of the calculation results reached 10−4, which confirmed the end of the calculation.
The hemodynamic characteristics of the blood pump under different working conditions were analyzed. The impeller speed ranged from 2800 to 3000 rpm, and the flow rate ranged from 2 to 7 L/min. The steady-flow field of the blood pump was solved and analyzed using the ANSYS Fluent software. The pressure difference between the inlet and the outlet of the blood pump at a specific speed and a flow rate was obtained, and the H–Q curve of the blood pump was drawn.
2.4. Hydrodynamic Characteristic Test and Result Analysis
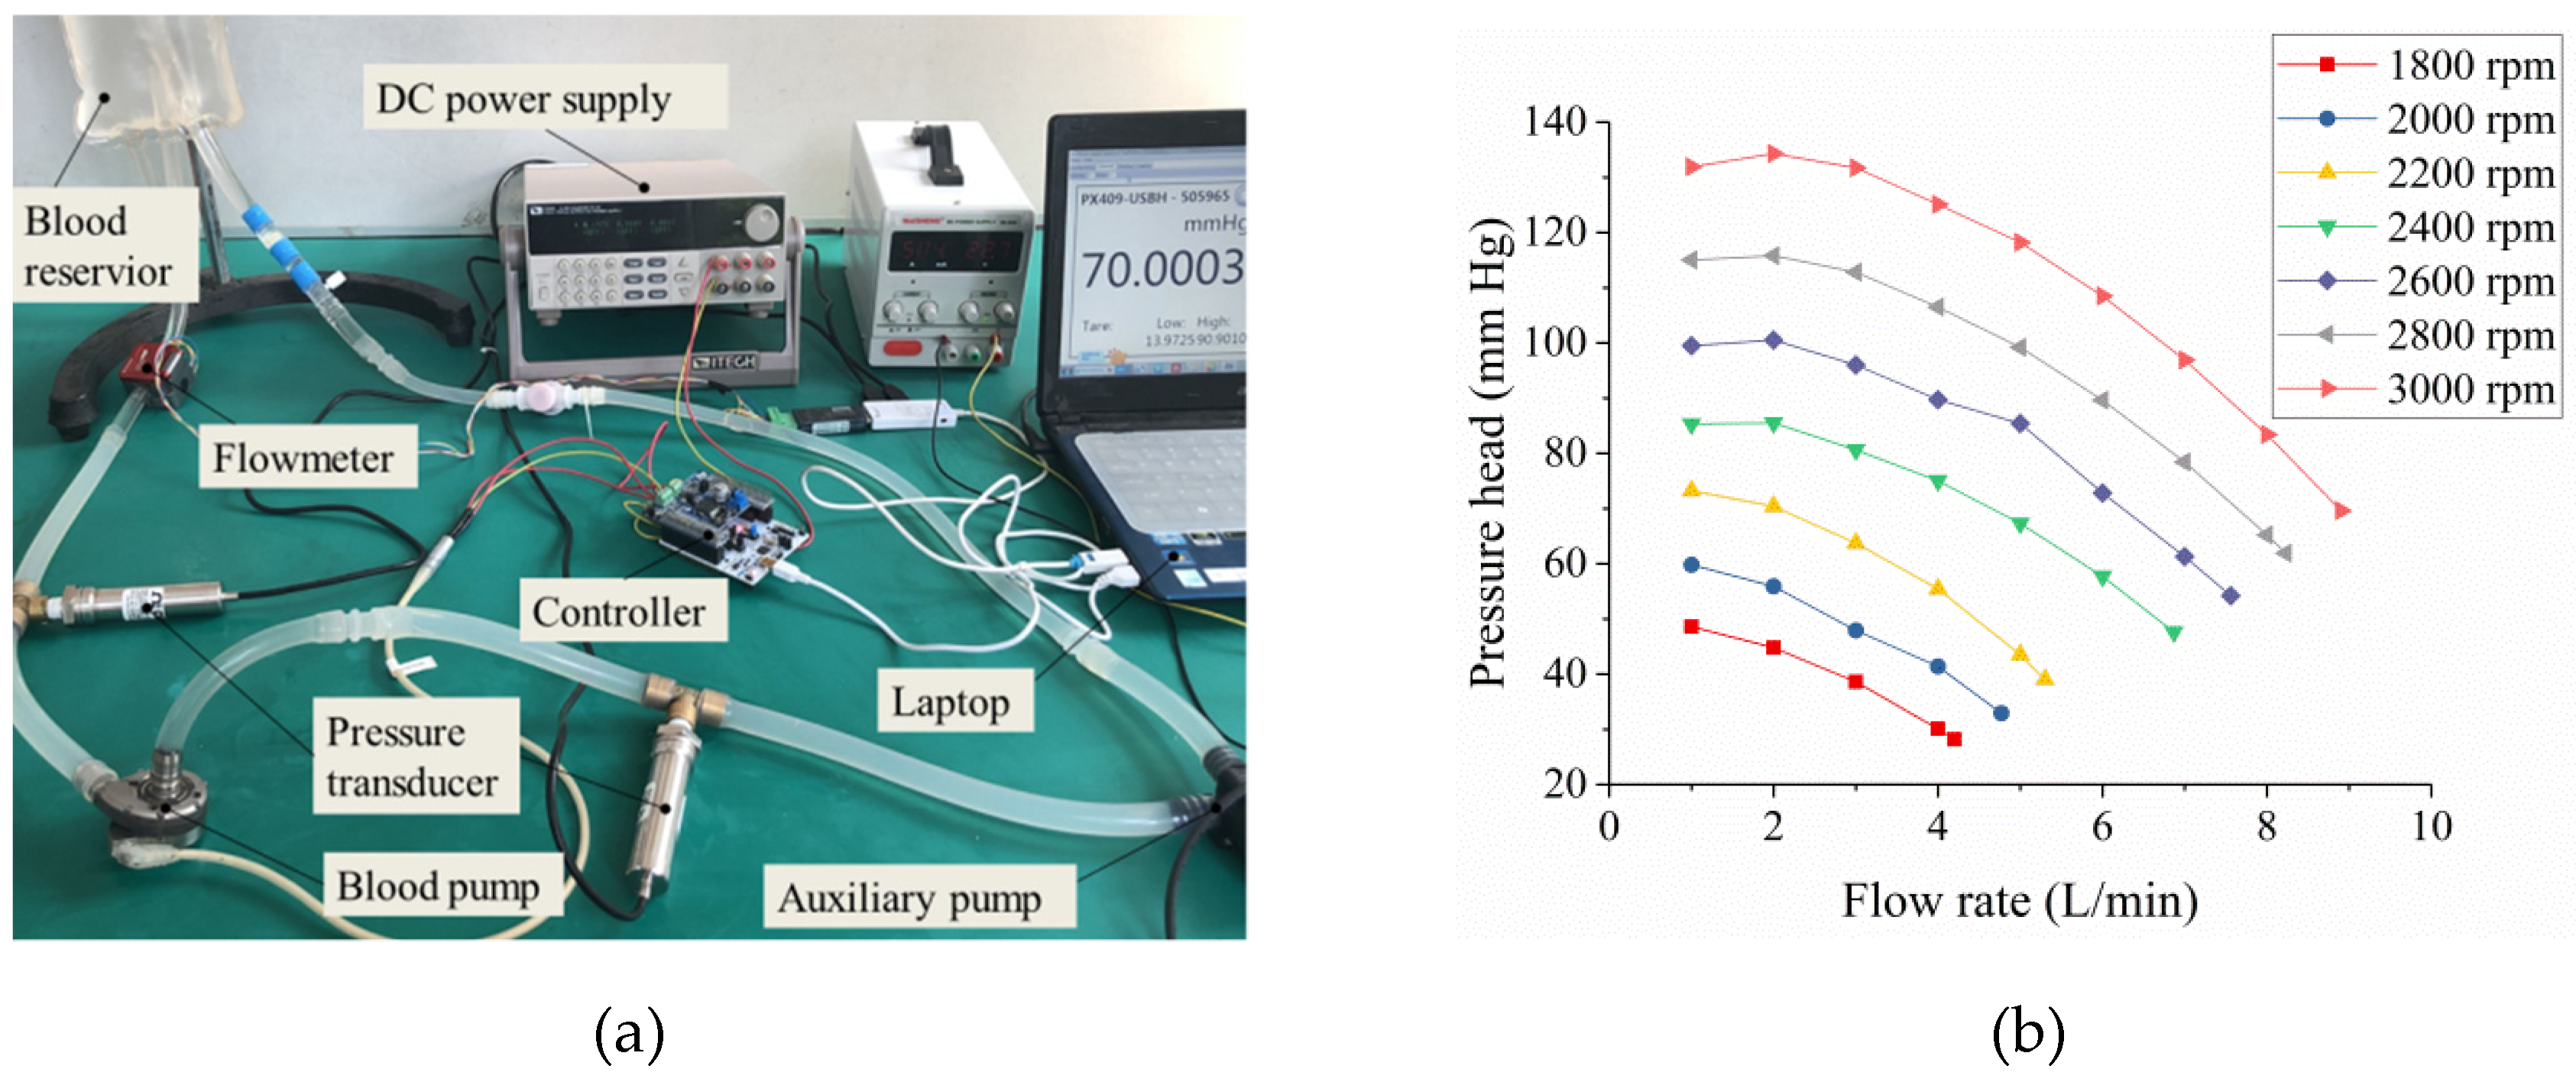
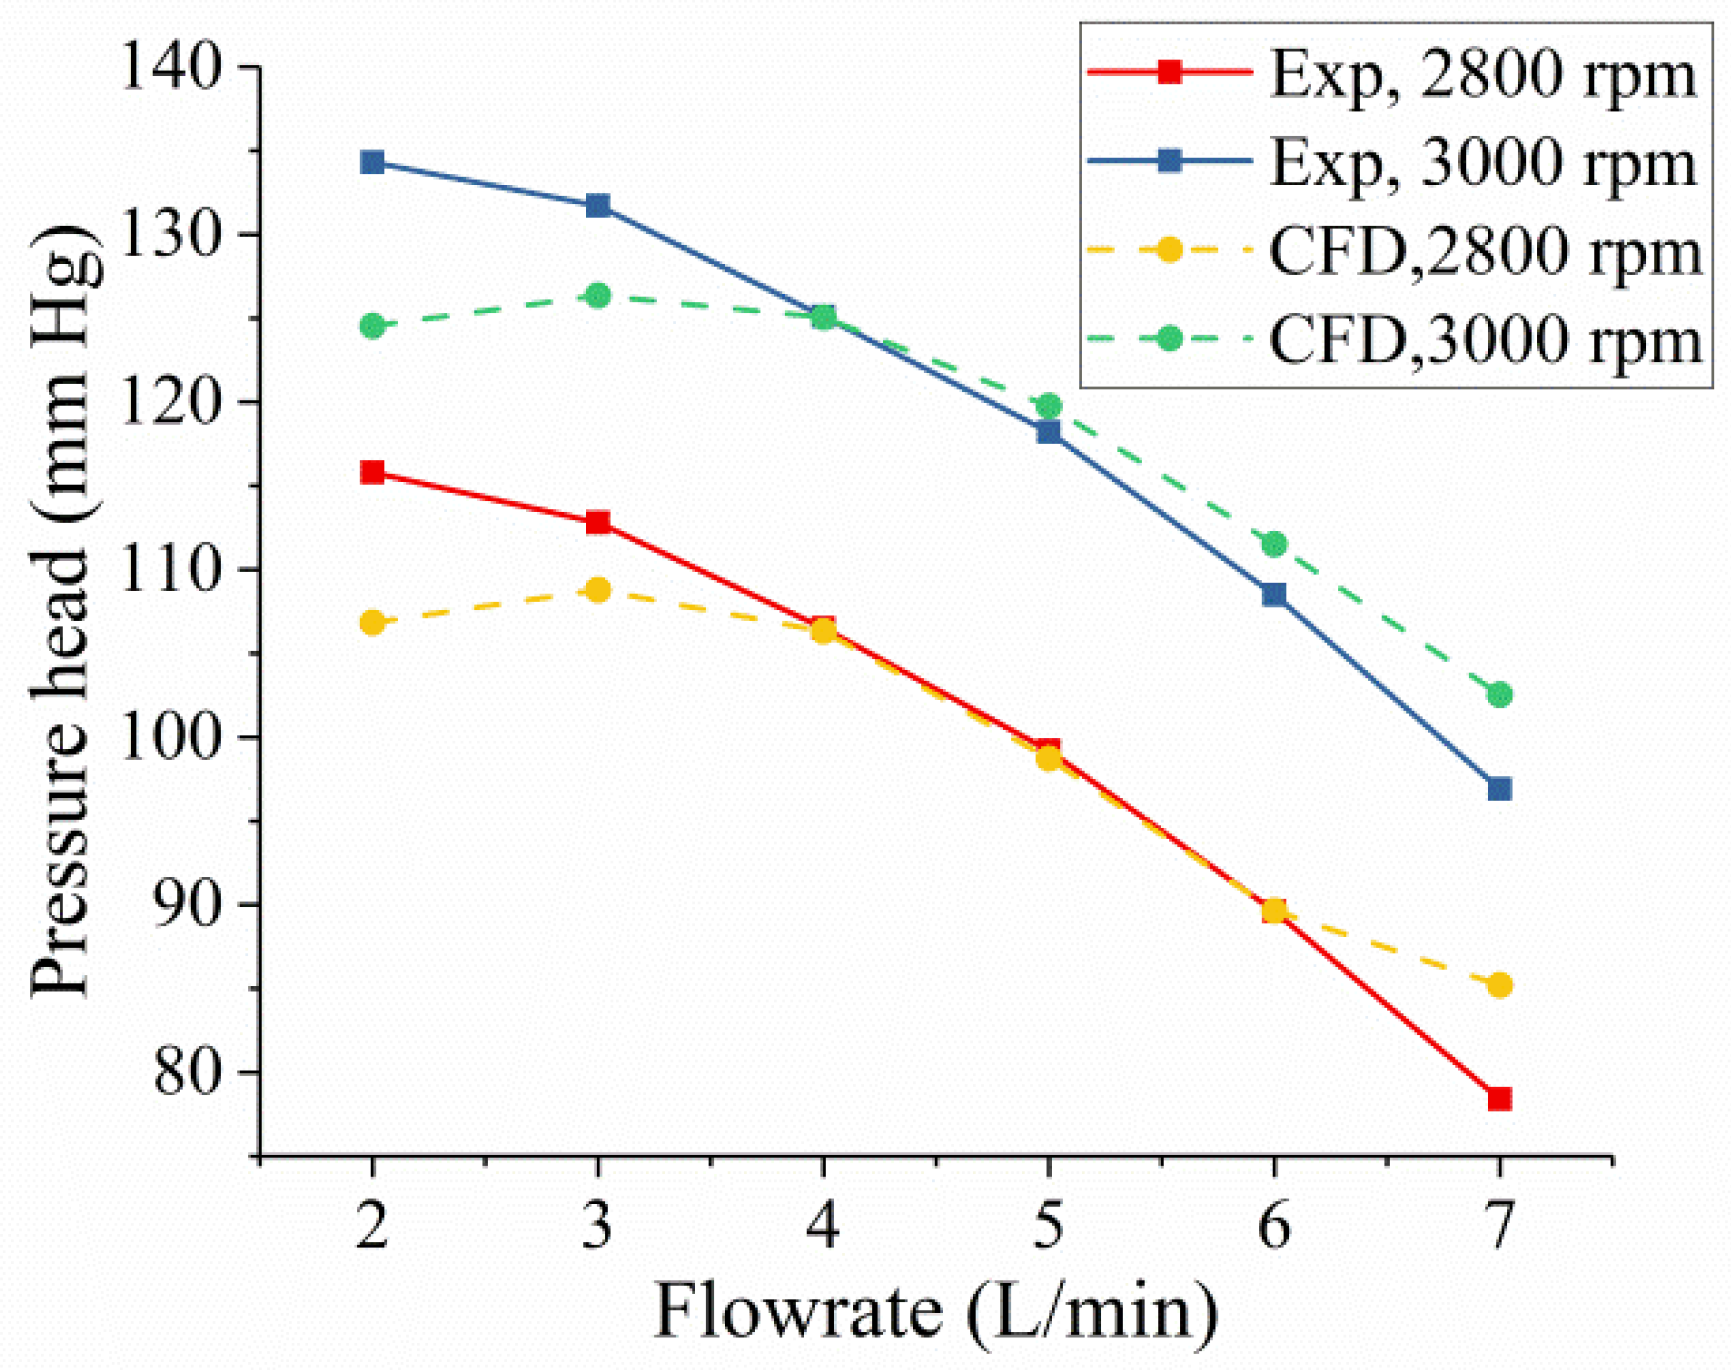
An experimental platform was built to measure the hydrodynamic characteristics of the blood pump (Figure 4a). The inlet and outlet pressures were measured using two pressure sensors (PX409-015CGUSBH, ±1 bar, 0.06% accuracy, Omega Engineering Inc., CA, USA). The outlet of the blood pump was connected with an ultrasonic flowmeter (CO.56/120, 0–12 L/min, 2% accuracy, SONOTEC Ultraschallsensorik Halle GmbH, Germany), which was used to measure the outlet flow rate of the blood pump. The blood reservoir was connected with rubber hoses (φ16 and φ14 mm, Dongguan Kuwei Medical Devices Co., Ltd., China) to simulate the actual human blood circulation circuit. An auxiliary water pump (DC50C-2480A, 0–2400 L/min, Shenzhen Zhongke Century Co. Ltd., China) was connected to the outlet of the blood reservoir to adjust the flow rate with a damper valve. When the steady-state characteristics of the blood pump were studied, the auxiliary water pump did not work, so the inlet flow of the blood pump was regulated by a damper valve. However, in the study of the dynamic hydraulic model of a blood pump, an auxiliary water pump worked to generate a pulsating blood flow at the inlet of the blood pump, which simulated the pulsating blood flow of patients with heart failure. Glycerol solution (40%) was used to replace blood as the fluid medium [20]. The normal human blood flow demand is 4–6 L/min, and the pressure range is 80–120 mm Hg. When the blood pump worked in a constant speed pattern, it ensured 5 L/min and 100 mm Hg of blood flow output. This was also a part of the reference index of the blood pump structure design. When the blood pump was partially or completely assisted, it was able to meet the normal output of the cardiovascular system; however, when the impeller speed was lower than 1800 rpm, the impeller could not suspend stably. Therefore, the selection of impeller speed and flow range was based on the stable operation of the blood pump and the widest range of patients’ blood flow demand of the human body. After setting different speeds of the blood pump and reading the inlet flow rate and the pressure of the inlet and outlet of the blood pump, the pressure head under different working conditions was calculated. The H–Q curve of the blood pump was drawn according to the results of the measurement, as shown in Figure 4b.
The experimental results in Figure 4b showed that the pressure head of the blood pump decreased with the increase in the flow rate and increased with the increase in the impeller speed. The shape of the H–Q curve was parabolic. When the impeller speed changed from 2400 to 3000 rpm, the pressure head increased from 47.6 to 131.9 mm Hg. In this impeller speed range, the pressure at the outlet of the blood flow better met the needs of the patients with heart failure; therefore, it was the main working area of the rotational speed. Figure 5 shows that the simulation results coincided with the experimental data at 4 and 5 L/min, while the simulation results far away from the main working nodes deviated from the measured values; the error was less than 10%. This showed that the simulation method could better reflect the influence of the operation parameters of the blood pump on the hydrodynamic characteristics of the blood pump [21]. Therefore, according to the relationship between the blood pump speed, flow rate, and pressure difference, the quality of life of patients with heart failure could be improved by adjusting the speed of the blood pump in a specific range, so as to avoid the problems of ventricular collapse and swelling caused by the pressure difference between the entrance of the blood pump and the ventricle.
2.5. Cardiovascular System Simulation Model
This study referred to the LPM calculation method of the cardiovascular circulatory system, proposed by Ferreria and Siman [22,23], to simulate changes in physiological parameters in patients with heart failure assisted with a blood pump. Figure 6 shows that the model included left atrium, left ventricle, mitral valve, aortic valve, arterial system, and blood pump. The network model could simulate the opening and closing of the mitral and aortic valves of the human heart and analyze the effect of blood pump assistance on the physiological parameters of patients with heart failure.
The hydraulic performance model reflecting the pulsation characteristics of the blood pump [20] was as follows:
where is the differential pressure between the outlet and the inlet of the blood pump, in mm Hg; is the impeller speed of the blood pump, in rpm; and is the blood pump flow rate, in mL/s. Therefore, reflected the time-dependent characteristics of the blood flow rate through the blood pump. The coefficients , , , and could be calculated from the experimental result, as shown in Table 2.
According to Kirchhoff’s law, the cardiovascular system model coupled with the hydraulic model of a blood pump was established, and the differential equation with as the state variable was calculated, as shown in Equation (4). Detailed definitions of time-varying capacitance reflecting left ventricular characteristics , mitral valve state function , and function simulating left ventricular aspiration can be referred to from previous studies [22,23].
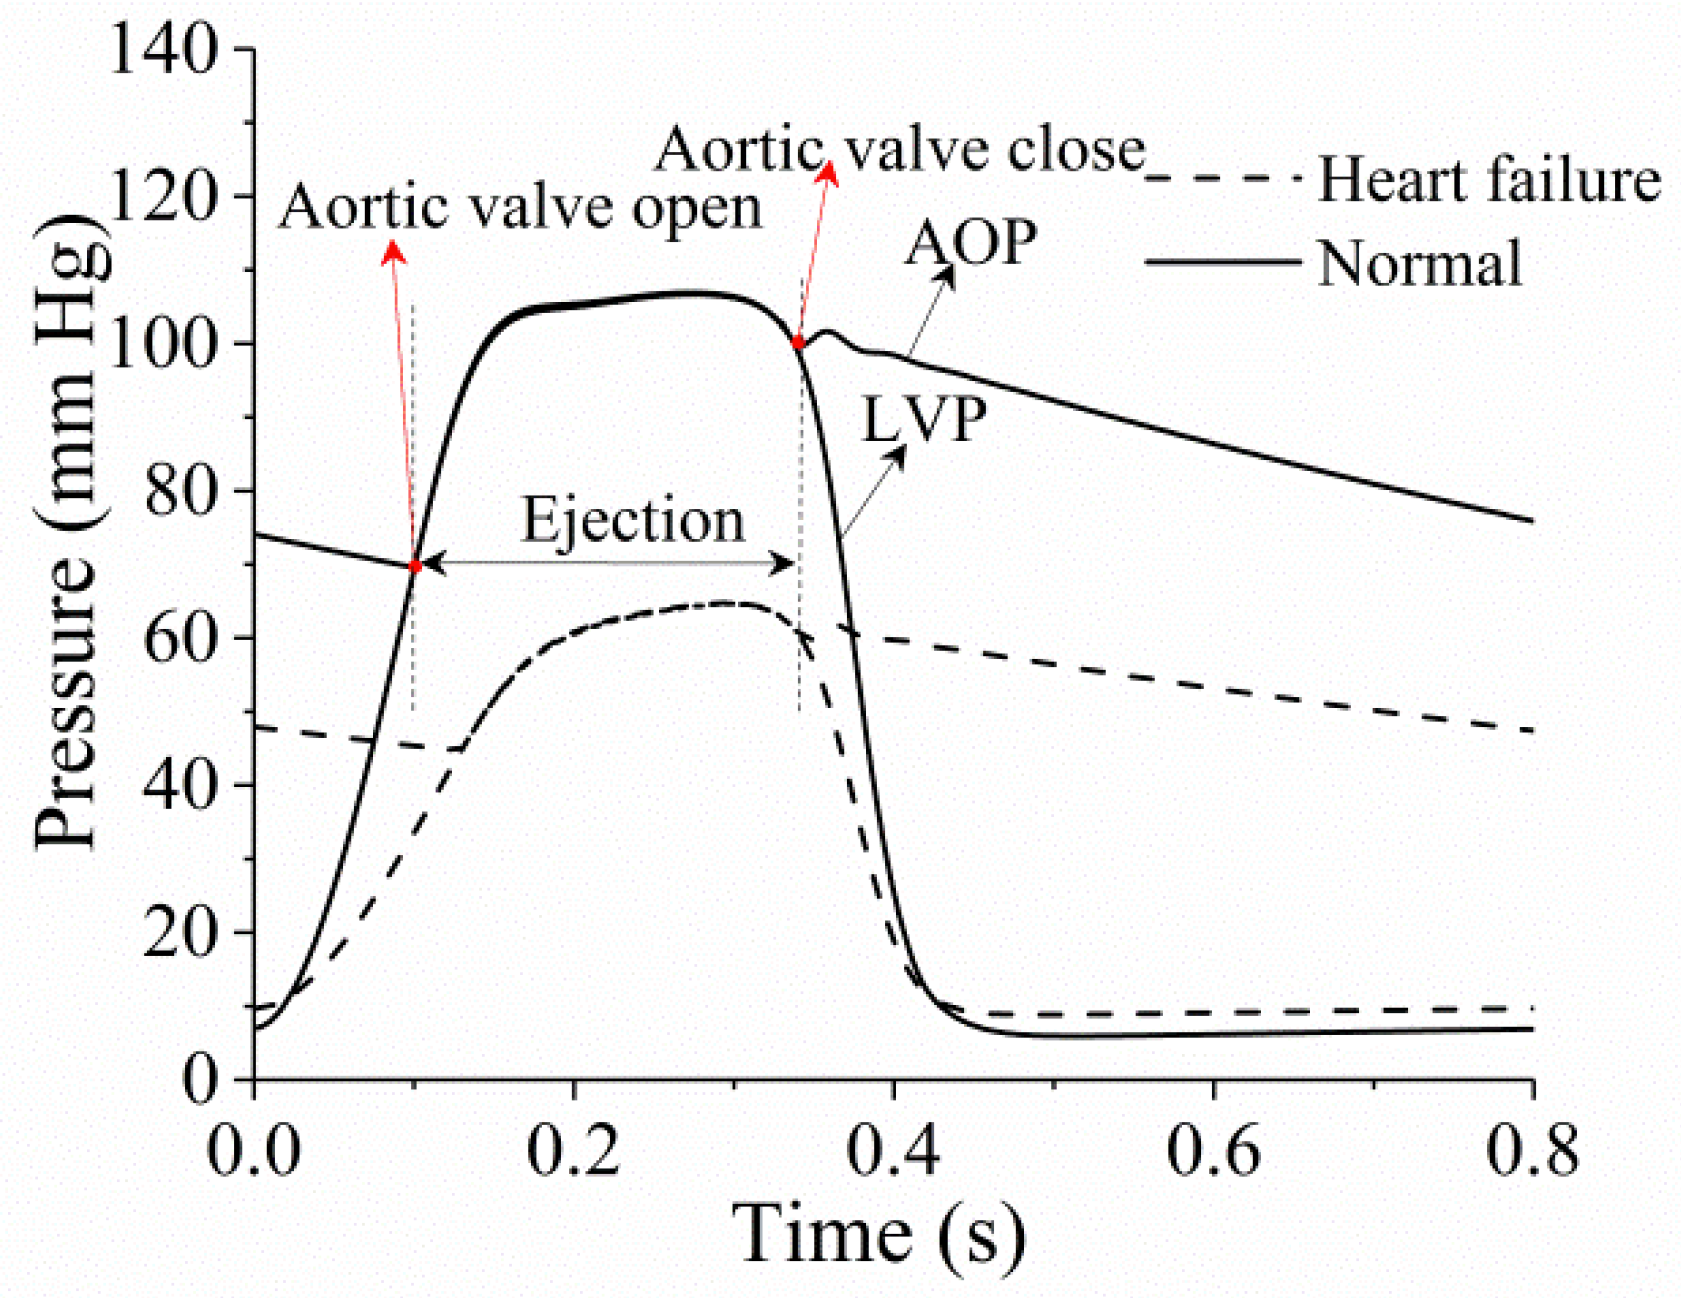
When the heart rate was 75 bpm, the cardiac cycle was 0.8 s. The myocardial systolic force and the slope of the left ventricular end-diastolic pressure–volume relationship curve were modified to simulate the symptoms of heart failure. In Equation (4), , , and the detailed definition of state equation parameters are shown in Table 3, , and the initial value of the state variable was taken as .
The value change of and in the left ventricular characteristic function reflected the degree of left ventricular failure. and of the healthy left ventricle were 2 and 0.06 mm Hg/mL, respectively. Here, the characteristics of diastolic and systolic dysfunctions were used to reflect the pathological features of heart failure, and the corresponding modifications of and was 1.05 and 0.1 mm Hg/mL, respectively. The left ventricular and aortic pressures under normal and heart failure conditions in a cardiac cycle were calculated using the Runge–Kutta numerical method in numerical analysis software MATLAB (The MathWorks Inc., MI, USA). Figure 7 shows the pressure waveform solution. The left ventricular pressure (LVP) and the aortic pressure (AOP) in heart failure were reduced by about 40 mm Hg compared with the normal levels.
2.6. Speed Modulation of the Blood Pump Impeller
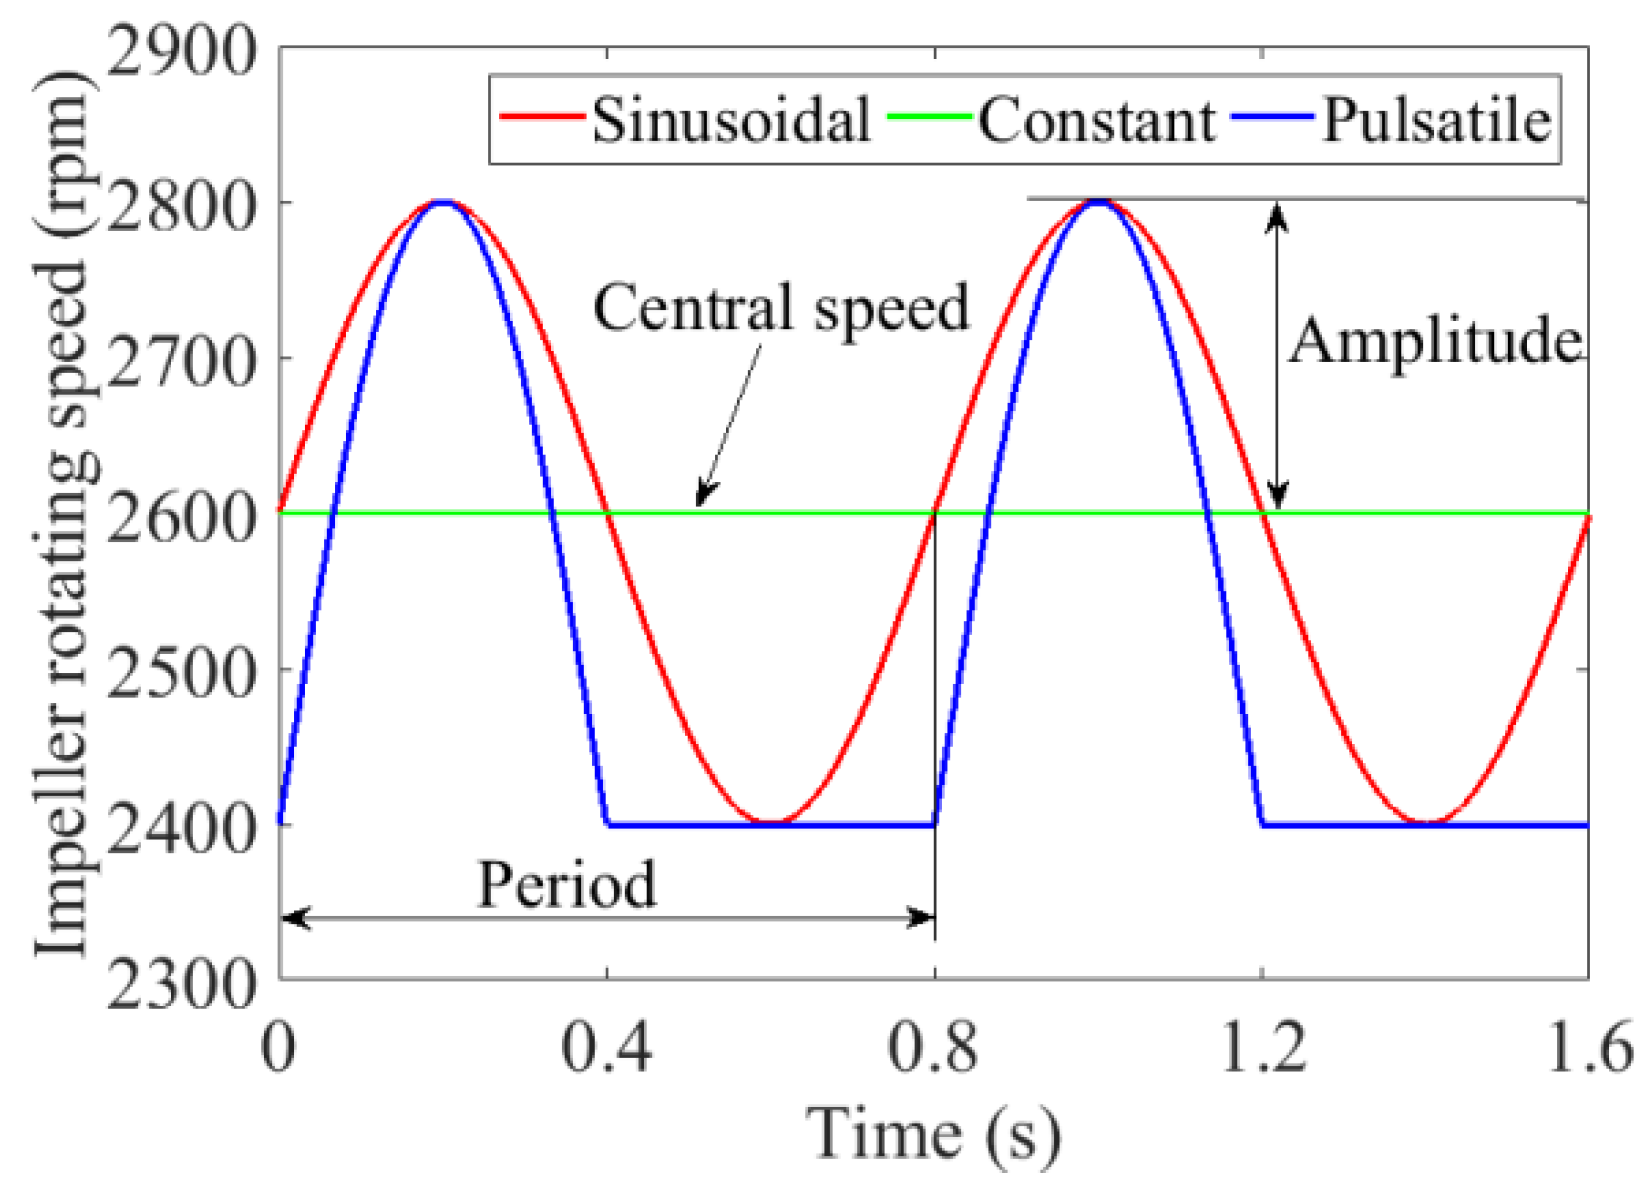
Considering the influence of impeller speed waveform on AOP fluctuation, an impeller with three speed patterns was designed in two cardiac cycles to satisfy the normal blood pressure (80–120 mm Hg) and conform to the normal pulse range of human blood pressure as far as possible, as shown in Figure 8.
According to the characteristics of the H–Q curve and avoidance of reflux phenomenon, the impeller speed of the blood pump working in parallel with the native heart was set to 2600 rpm in a constant speed pattern. The two other speed patterns were sinusoidal and pulsatile patterns. The impeller speed of the constant speed pattern was the reference speed of the sinusoidal speed pattern. The pulsatile speed pattern waveform was determined using the human aorta waveform, which consisted of the sinusoidal and constant parts, as shown in Equation (5). The reference speed of the sinusoidal part was 2400 rpm, and the amplitude was 400 rpm. The period depended on the cardiac cycle in which the heart rate was . Additionally, represented the cardiac cycle. In this study, the heart rate was 75 bpm for analysis; thus the cardiac cycle time was 0.8 s. The pulsatile speed pattern waveform increased from 2400 rpm at low speed to 2800 rpm, and then decelerated to 2400 rpm. It maintained a constant speed 2400 rpm at 0.4 to 0.8 s, which corresponded to the diastole process of the native heart.
The sinusoidal speed pattern fluctuated sinusoidally relative to the central speed , as shown in Equation (6), which was the same as the constant speed pattern. The amplitude of the speed waveform was 200 rpm, and the period between sinusoidal and pulsatile speed patterns was the same.
The design basis of the pump speed waveform was to ensure that the peak phase of the speed waveform was consistent with the peak phase of the LVP, so that the maximum pulse pressure was obtained when the cardiac output blood pressure and the peak value of the pump output pressure were superimposed on the aorta.
3. Results
3.1. Analysis of Hemodynamic Characteristics
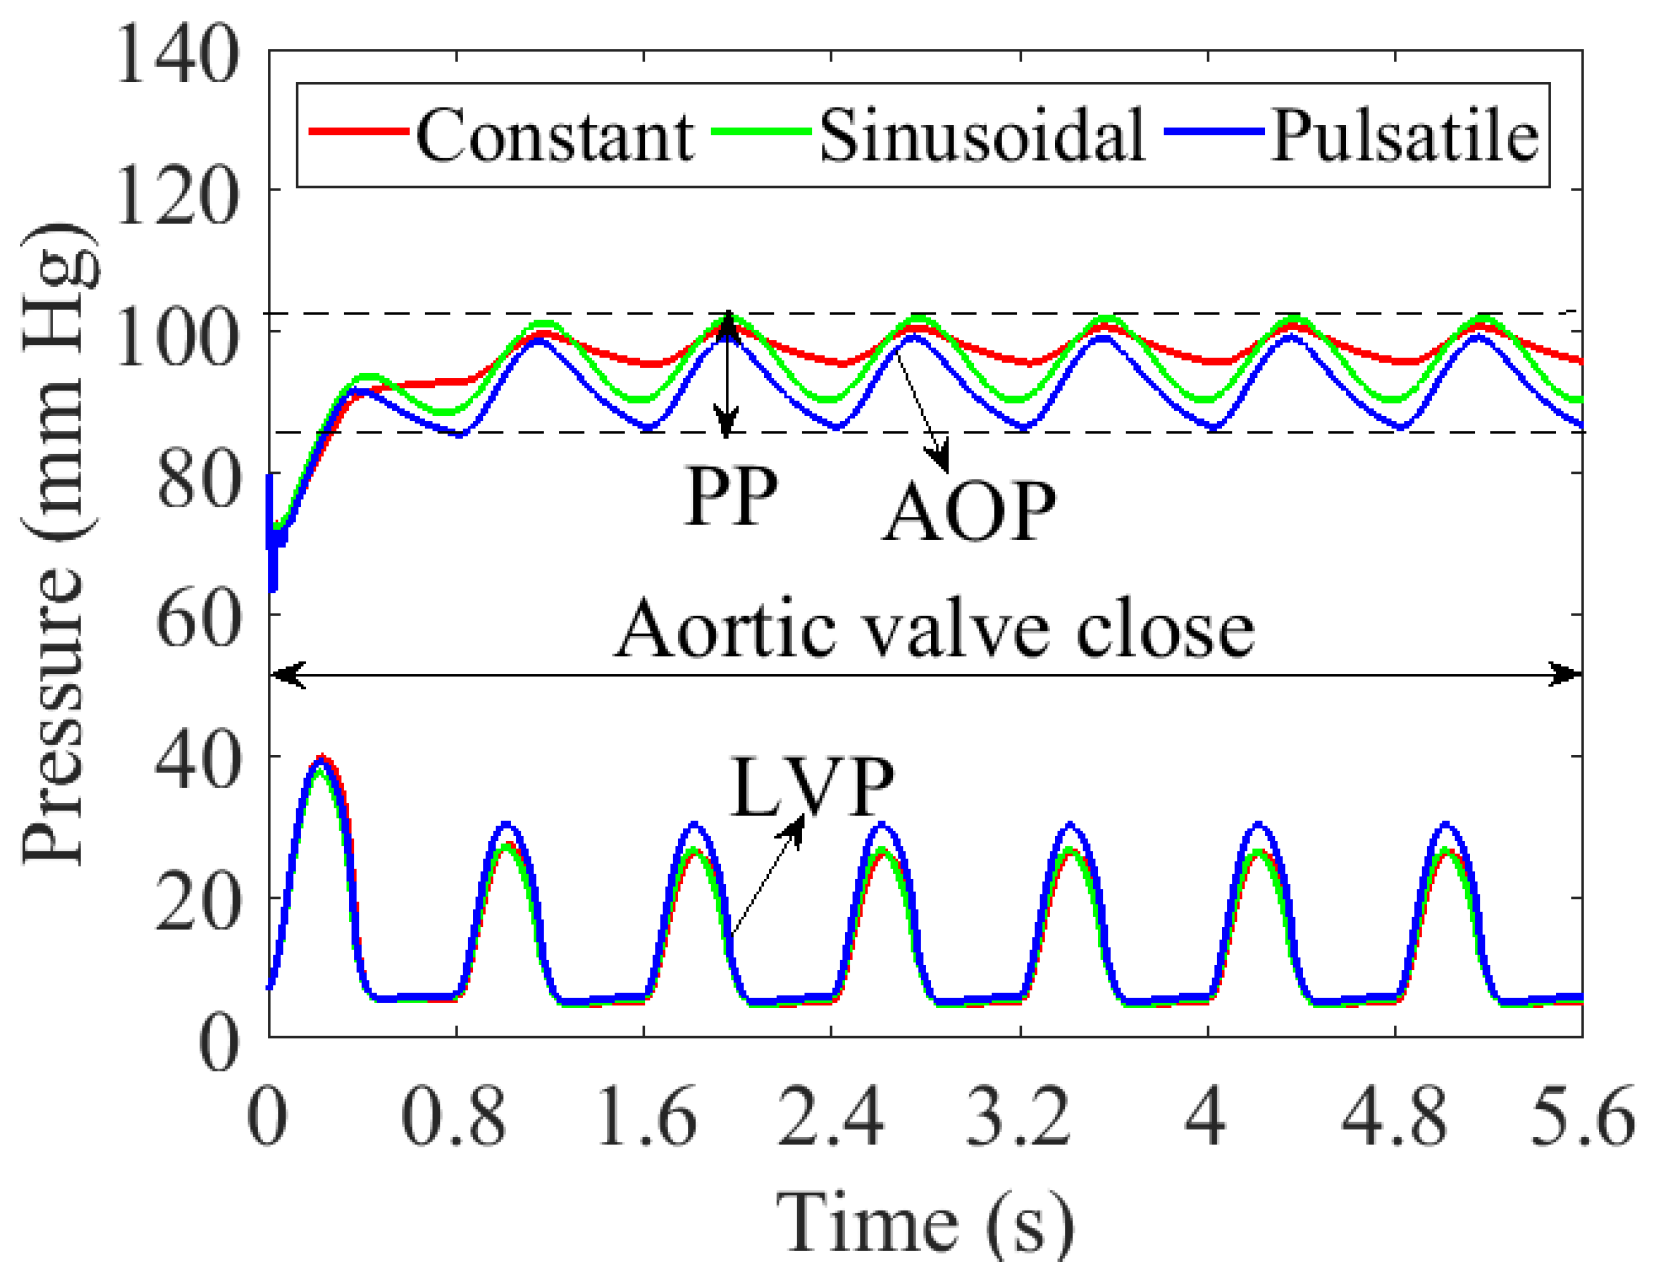
Figure 9 shows the hemodynamic characteristics of the cardiovascular-coupled blood pump. The AOP could meet the normal physiological needs of the human body with the help of the impeller with three speed patterns, and the pressure fluctuated between 86 and 102 mm Hg. The AOP pressure pulsation range was small at a constant speed pattern, and the sinusoidal and pulsatile speed patterns provided a larger range of pressure pulsation for the blood input to the aorta. It was up to a max pulse pressure (PP) of 13 mm Hg, which was relative to the constant speed pattern. During the assistance process of the blood pump with three speed patterns, the aortic valve remained closed and the blood pump helped in pumping the blood, contributing to ventricular unloading and left ventricular function recovery.
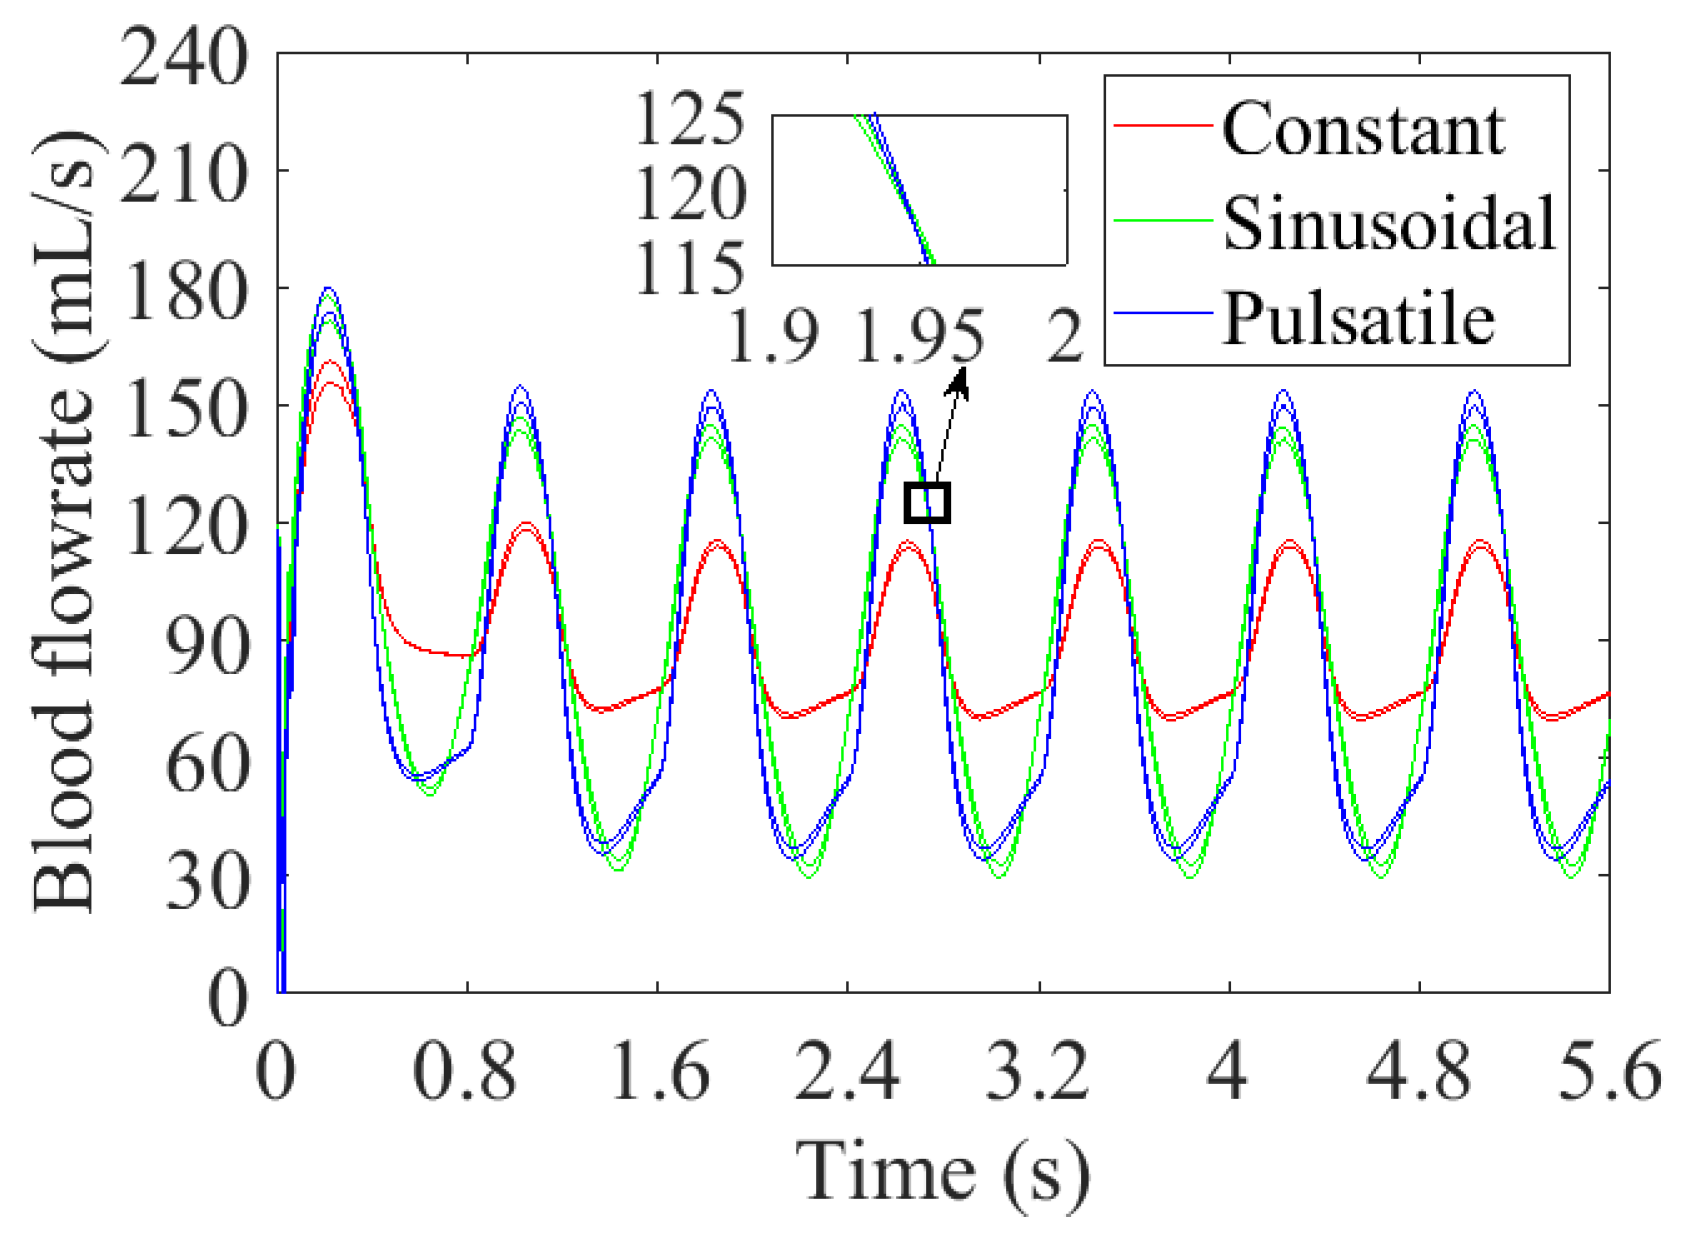
During a cardiac cycle, the trend of flow change in the blood pump with three speed patterns was basically consistent with that of AOP. Figure 10 shows that the flow fluctuated around 90 mL/s. It also shows that the blood flow through the blood pump was almost equal to the blood flow into the aorta, indicating that the aortic valve remained closed during the operation of the blood pump, and almost all the blood flowed through the blood pump to the aorta.
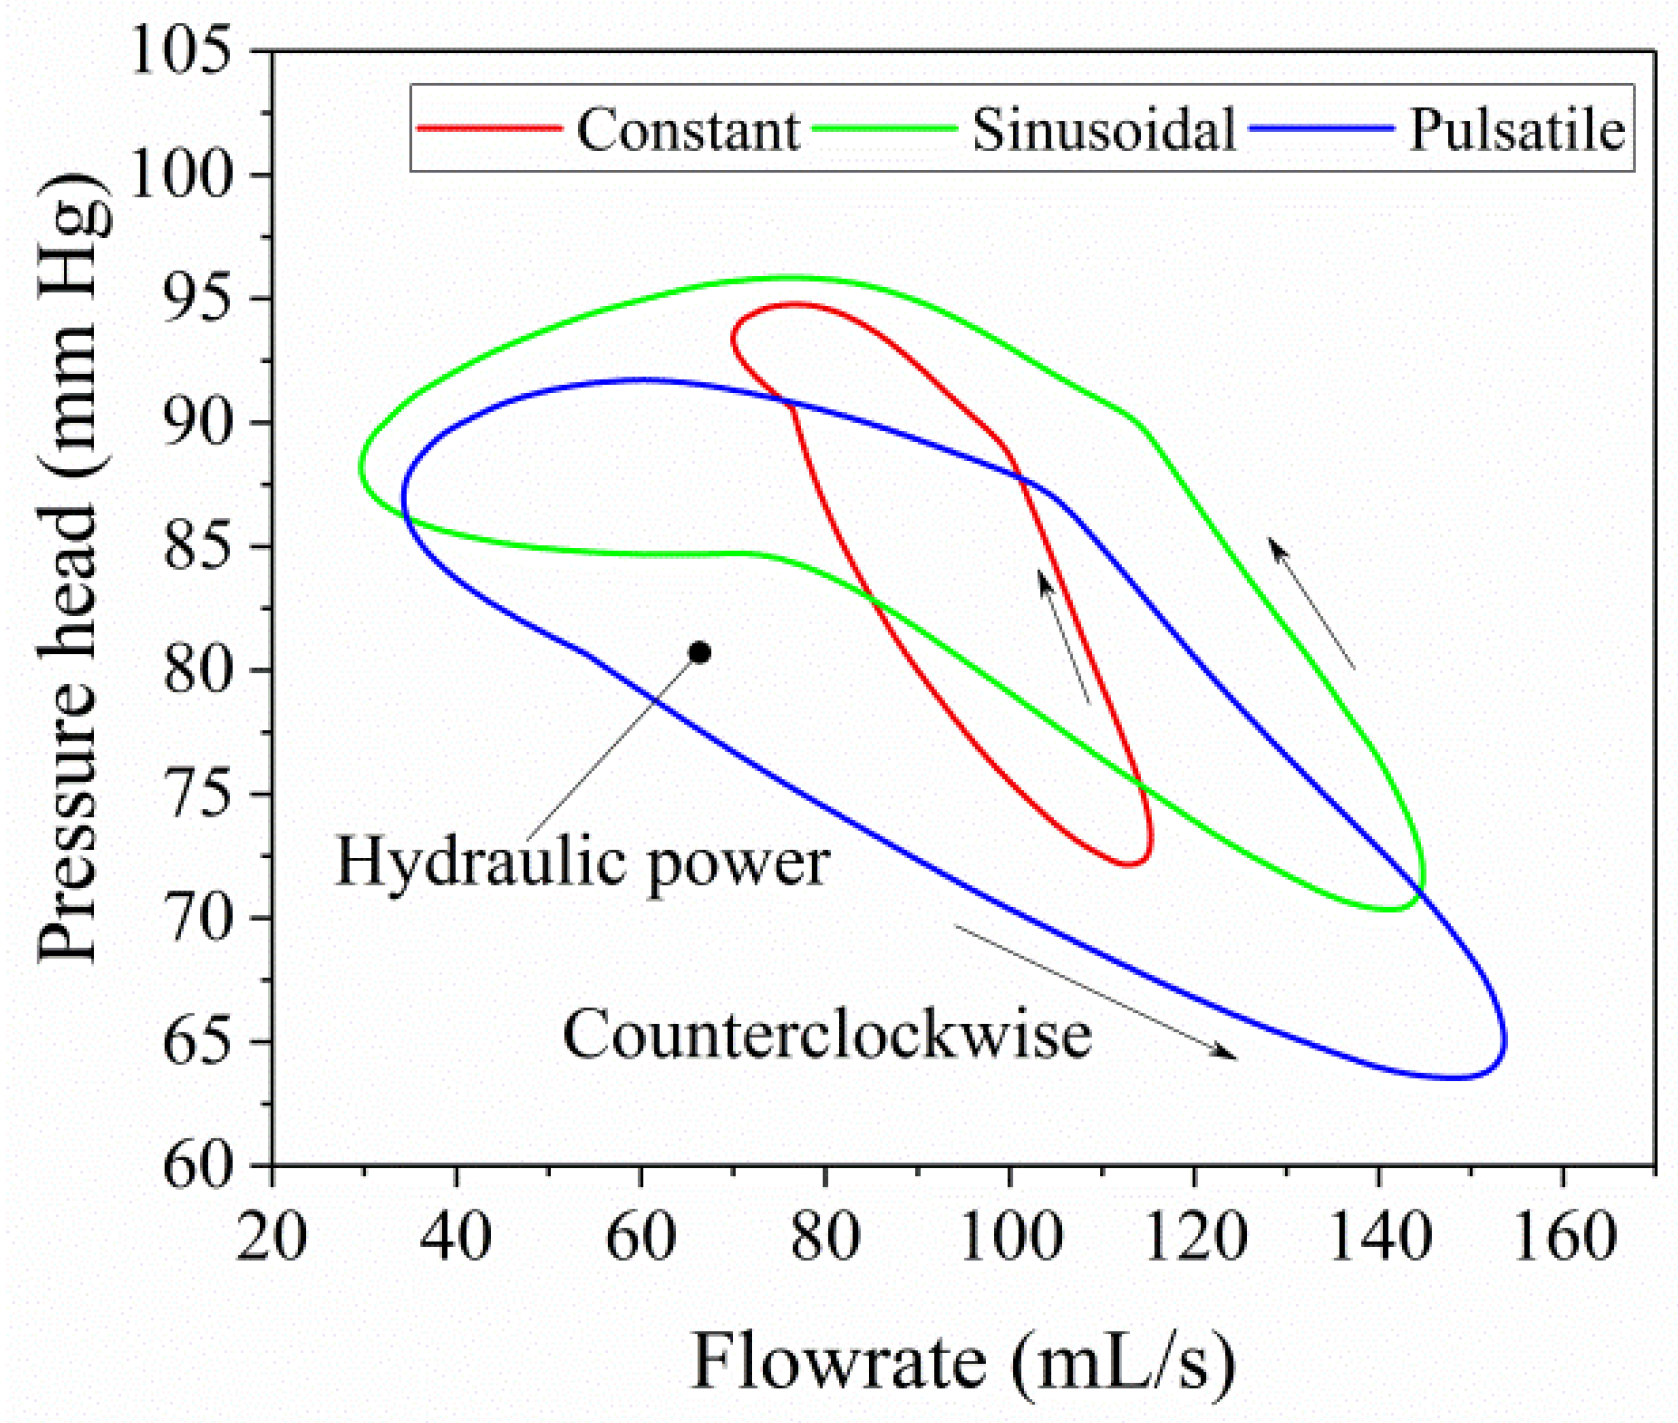
The relationship between the pressure head and the flow rate of the blood pump was different from that in the steady state. In the transient state, the H–Q curve between the pressure head and the flow rate was a closed loop, consistent with the results of previous studies [24]. The pressure head generated by the blood pump varied counterclockwise with the flow rate. The starting point and the endpoint of the two closed loops were the same, as shown in Figure 11. The range of flow fluctuation corresponding to the pulsatile and sinusoidal speed patterns was larger than that of the constant speed pattern. The closed-loop area formed by the pressure head and the flow rate represented the hydraulic power consumed by the blood pump. The hydraulic power consumed by the pulsatile and sinusoidal speed patterns was larger than that by the constant speed pattern. Compared with the steady-state H–Q curve, the H–Q curve corresponding to the three speed patterns could display the hemodynamic changes in the blood pump in the real situation more dynamically, and facilitate the monitoring and further control of the actual working state of the blood pump.
The PP, energy equivalent pressure (EEP), and surplus hemodynamic energy (SHE) were used to evaluate blood pulsatility. Table 4 shows the blood output indicators under the three speed patterns of the blood pump. The cardiac output (CO) was about 5 L/min, which could meet the normal blood demand of the human body. The sinusoidal and pulsatile speed patterns could effectively increase the pressure pulsation value compared with the constant speed pattern. The difference between EEP and mean arterial pressure (MAP) was the largest; therefore, the SHE was correspondingly the largest. It indicated that the pulsatile and sinusoidal speed patterns had larger pulsating energy compared with the constant speed pattern, and could increase the degree of blood pulsation in the cardiovascular circuit.
3.2. Eulerian Hemolysis Model
High shear force in the flow field could cause damage to blood cells. Both turbulent shear stress and viscous shear stress were present in the flow field because of the irregular turbulent flow in the blood pump. Turbulent shear stress led to larger numerical simulation results; therefore, the viscous shear stress was used to calculate the hemolysis index [25,26]. For incompressible Newtonian fluid, the viscous shear stress was proportional to the deformation rate of the fluid and consisted of two components, the normal stress component and the shear stress component [27], as follows:
In Equation (7), is the fluid viscosity; , , and are the velocity components of velocity vectors in , , and directions, respectively; and , , , , , and are the six tensor components of viscous stress, respectively. Therefore, according to the calculation method of shear stress proposed by Bludszuweit [28], the magnitude of shear stress was expressed:
The hemolysis formed in the flow field was the result of shear stress and exposure time. The amount of blood damage was estimated by the power–law relationship using the shear force and exposure time. Therefore, the function model of shear force and exposure time was used to predict the blood damage. Giersiepen [29] proposed the following hemolysis prediction model based on the experimental results as follows:
where represents the hemolysis index, which is the damage degree of blood flow through the blood pump; is the shear force acting on the blood cells; is the exposure time; and , , and are constants. In this study, the constants proposed by Giersiepen were chosen, which were 3.62 × 10⁻⁷, 0.785, and 2.416, respectively. The Lagrangian method involved a large number of calculations for the flow field of the transient blood pump and could not directly obtain the region with blood damage in the flow field. However, the Euler method could provide the hemolysis value in the whole flow field of the blood pump. It was convenient and could also analyze the flow field intuitively. Moreover, it was also convenient to compare the influence of different working modes of the blood pump on the flow field and hemolytic characteristics. Therefore, a fast hemolysis prediction method for the three-dimensional numerical simulation proposed by Garon [30,31] was used in this study. The hyperbolic transport equation in the calculation model was as follows:
where is the velocity vector, is the linear HI, and is the hemolysis damage rate per unit time:
The average in the whole stable flow field of the blood pump was:
where Q is the flow rate; therefore, the HI of the blood pump could be obtained by exponential conversion:
3.3. Simulation Method of Hemolysis Characteristics of the Impeller with Three Speed Patterns
The fitting results of the blood pump flow rate and AOP, under the condition of heart failure in the second cardiac cycle, were used as the boundary conditions of the blood pump inlet and outlet to simulate the internal flow field and hemodynamic characteristics of the blood pump in auxiliary work. The speed of the blood pump was set according to the three speed patterns. The flow rate, pressure boundary conditions, and impeller speed were set using the user-defined function. The hemolysis model was solved in the form of a user-defined scalar transfer equation. The HI was set to zero at the inlet of the blood pump, and the hemolysis was calculated using the mass-weighted average at the outlet. The simulation was carried out in ANSYS Fluent. The relative motion between the impeller and the volute was simulated with a sliding mesh. The time step was 0.001 s, and the solution step was 1600 steps with a total time of 1.6 s. Considering the instability of the simulation results of the first cardiac cycle, this study compared mainly the difference between the convective flow field and the blood damage of the impeller with three speed patterns in the second cardiac cycle.
3.4. CFD Results of the Hemodynamic Characteristics and Hemolysis
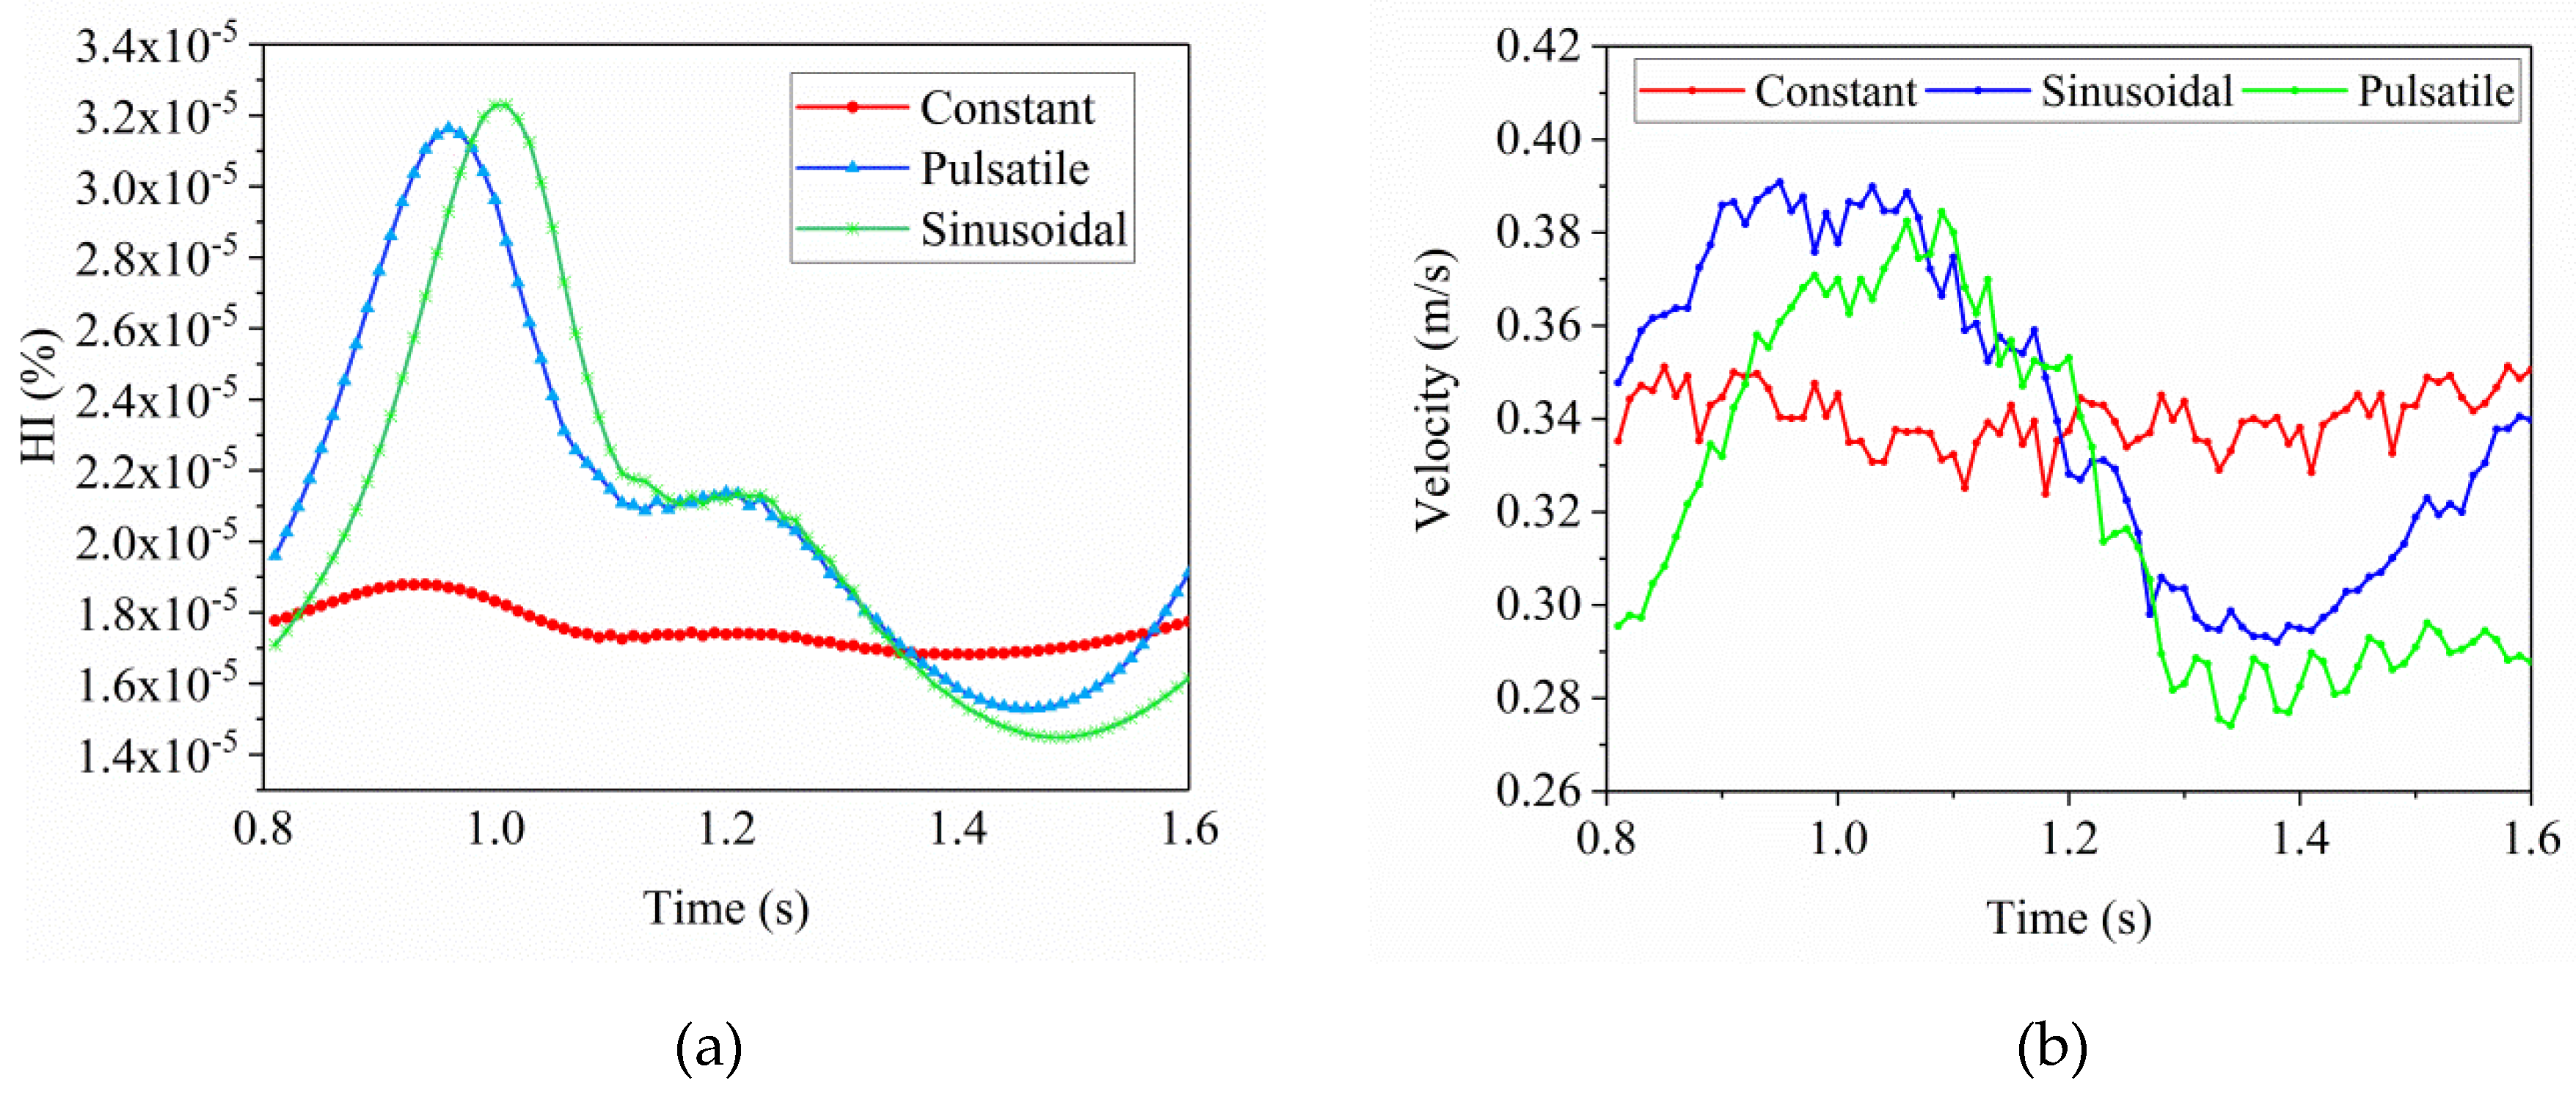
The hemolysis index (HI) of the impeller with three speed patterns was compared and analyzed. According to Figure 12a, the HI corresponding to the three speed patterns met the requirements of clinical use. The average HI of the constant speed pattern was 1.75 × 10⁻⁵ in a cardiac cycle. The sinusoidal and pulsatile speed patterns were 2.11 × 10⁻⁵ and 2.05 × 10⁻⁵, respectively. The latter two kinds of speed patterns led to an increase in HI, but the changing trend of HI was more consistent and closer. The change in the HI of the blood pump was small under the condition of continuous flow with a constant speed pattern. The HI amplitude of the other two patterns changed to a certain extent, indicating that the impeller speed had a direct effect on the degree of hemolysis, but the hemolysis value did not increase by an order of magnitude. Therefore, it might be related to the small range of impeller speed fluctuation. The blood velocity in the groove of the hydraulic bearing of the blood pump was monitored. The blood velocity in the groove was basically stable at 0.34 m/s when the blood pump worked at a constant speed, as shown in Figure 12b. Under the action of the impeller with sinusoidal and pulsatile speed patterns, the blood velocity fluctuation range of the blood pump was about 0.1 m/s. Therefore, with a periodic change in the impeller speed, the flow field of the blood pump also changed at any time. The impeller speed directly affected the distribution characteristics of the flow field in the spiral groove of hydrodynamic bearing because of the small clearance between the impeller and the upper and lower pump shells and the effect of fluid viscosity. With a periodic change in the impeller speed, the flow field of the blood pump also changed at any time, and the changing trend of the flow velocity was close to that of the impeller speed.
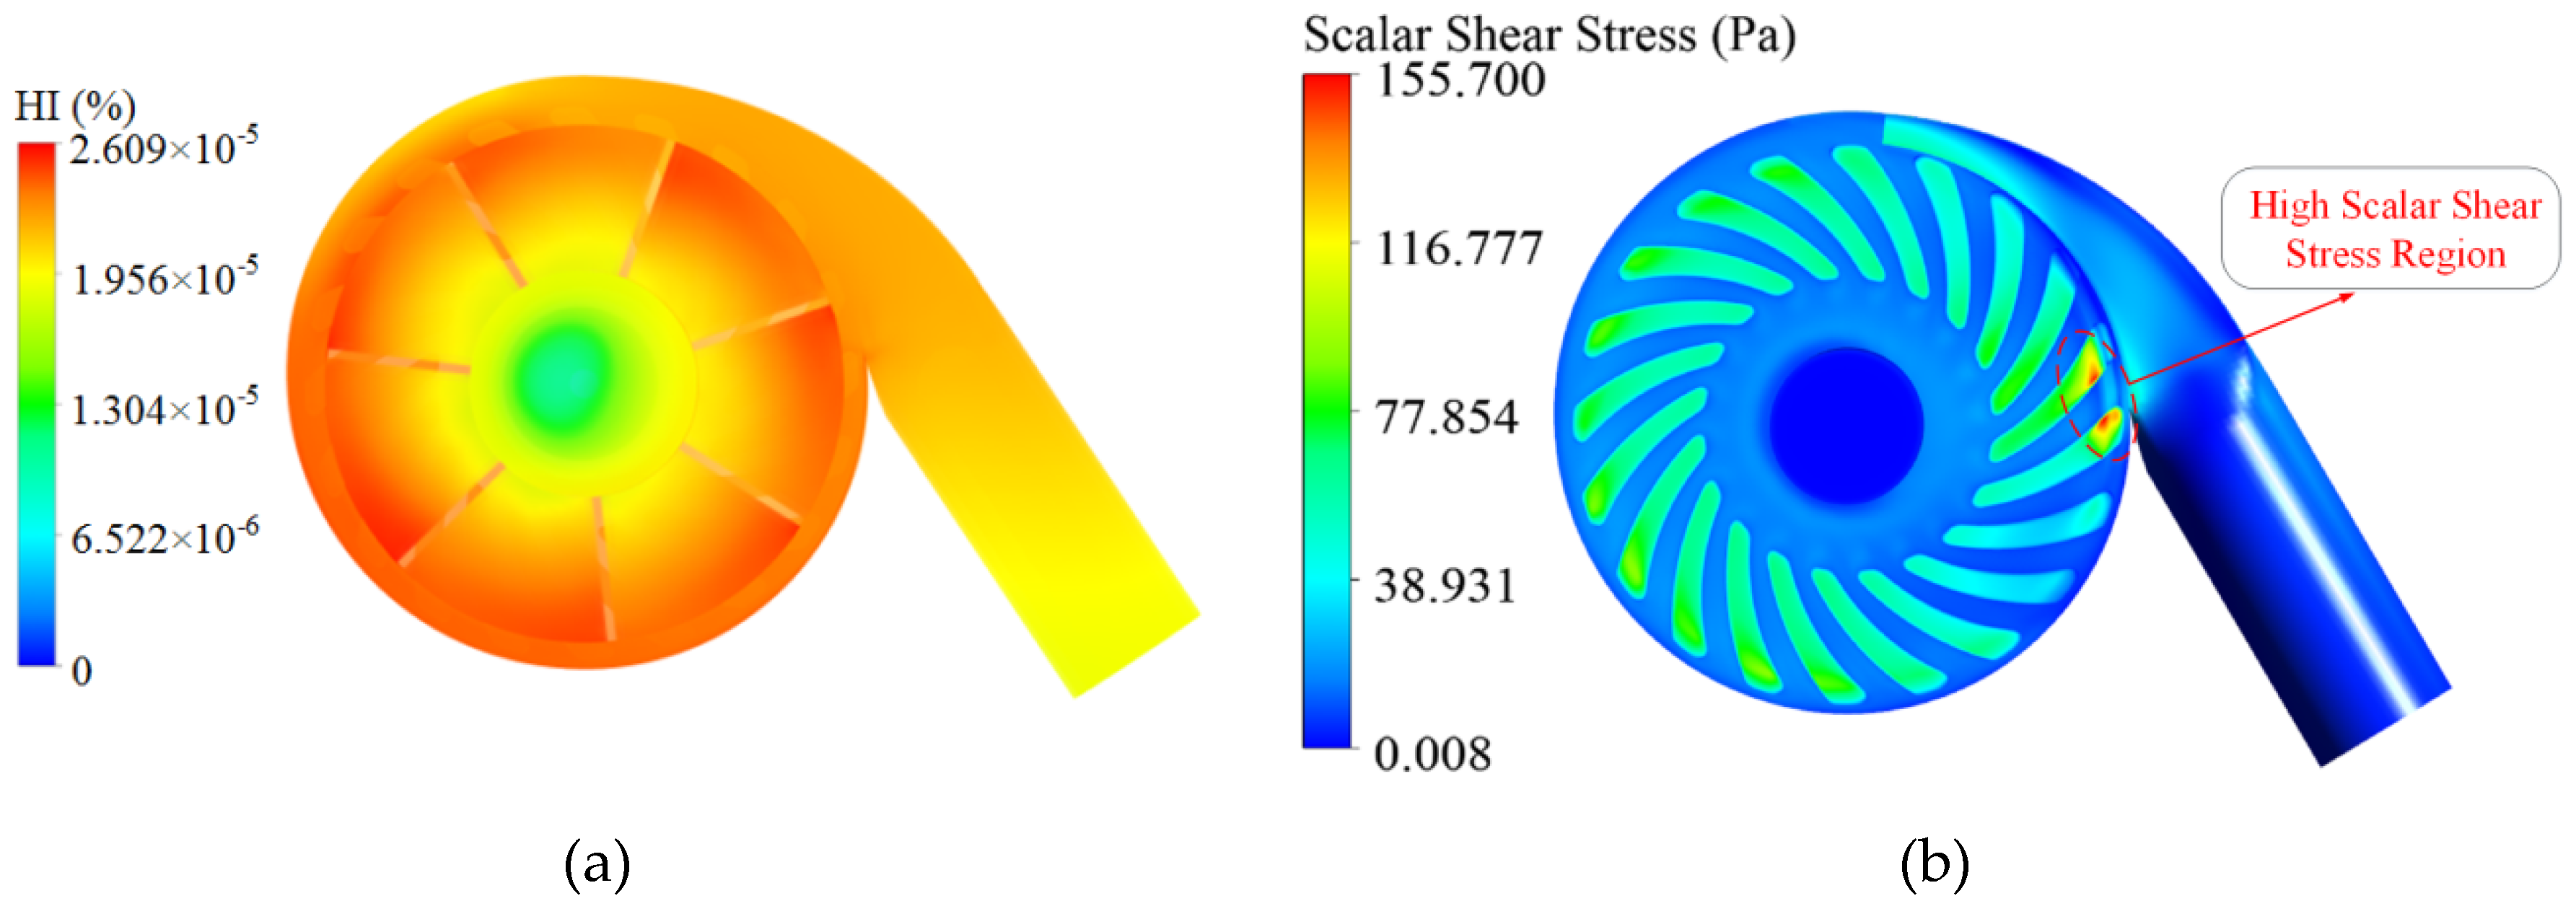
The HI and shear stress distribution in the flow field of the blood pump driven by the sinusoidal speed pattern at 0.9 s are shown in Figure 13a,b. The distribution of HI was more uniform, and its value was larger at the outlet of the impeller and in the volute runner. Most areas had low shear stress, but the shear stress in the spiral groove area was larger, which reached 155 Pa. Therefore, the spiral groove part was the main area causing blood damage, as shown in Figure 13b. When blood flowed through these areas, the high shear stress affected the blood and led to the destruction of blood cells.
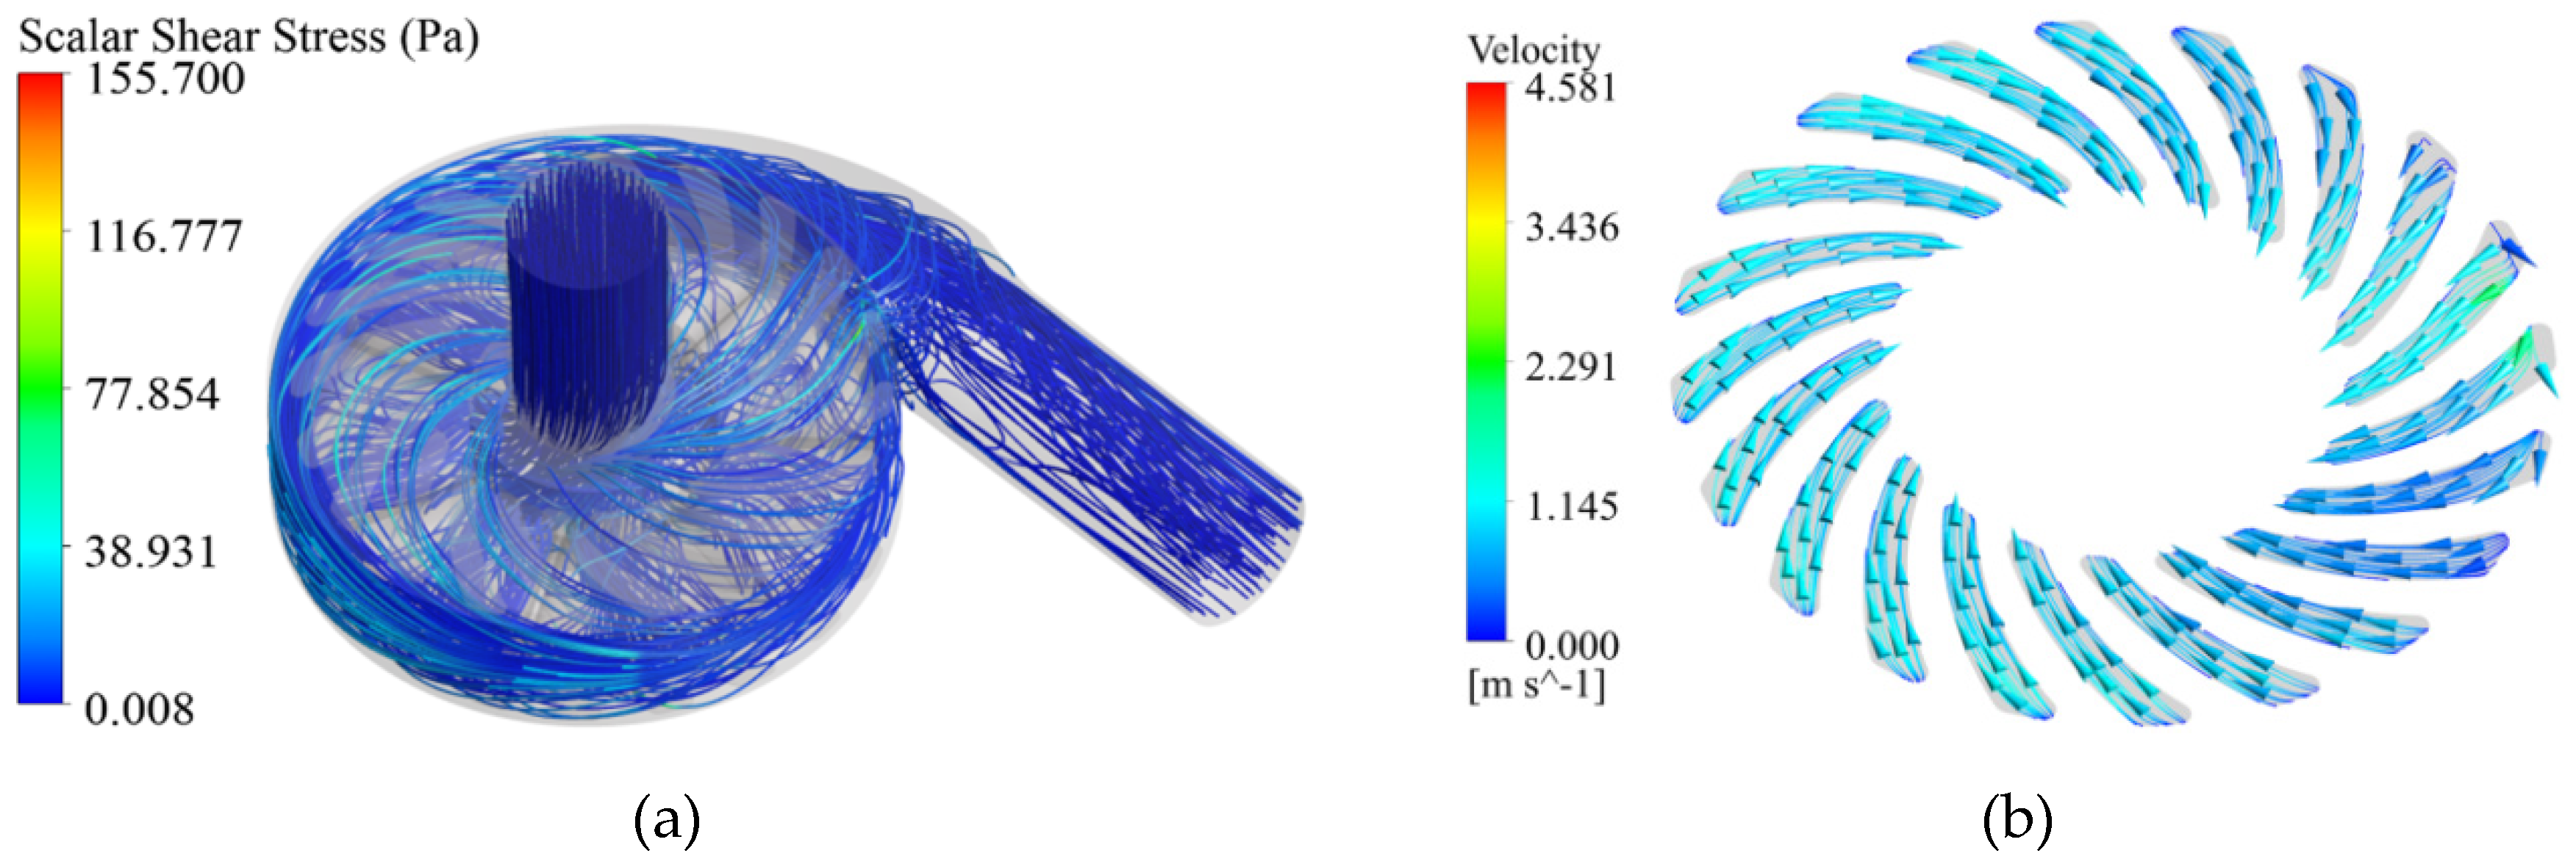
Under the action of the pulsating flow field, the flow path of the flow field of the blood pump is shown in Figure 14a. No obvious eddy and flow stagnation zone were found. The high shear stress in the flow process was mainly in the secondary flow passage of the impeller and the volute. The flow fields in some areas of the spiral groove were analyzed, as shown in Figure 14b. The blood flow path in the spiral groove was more uniform and regular. The blood flowed from the outer end of the spiral groove to the inner end in a spiral form, and was not disturbed by the changing impeller speed.
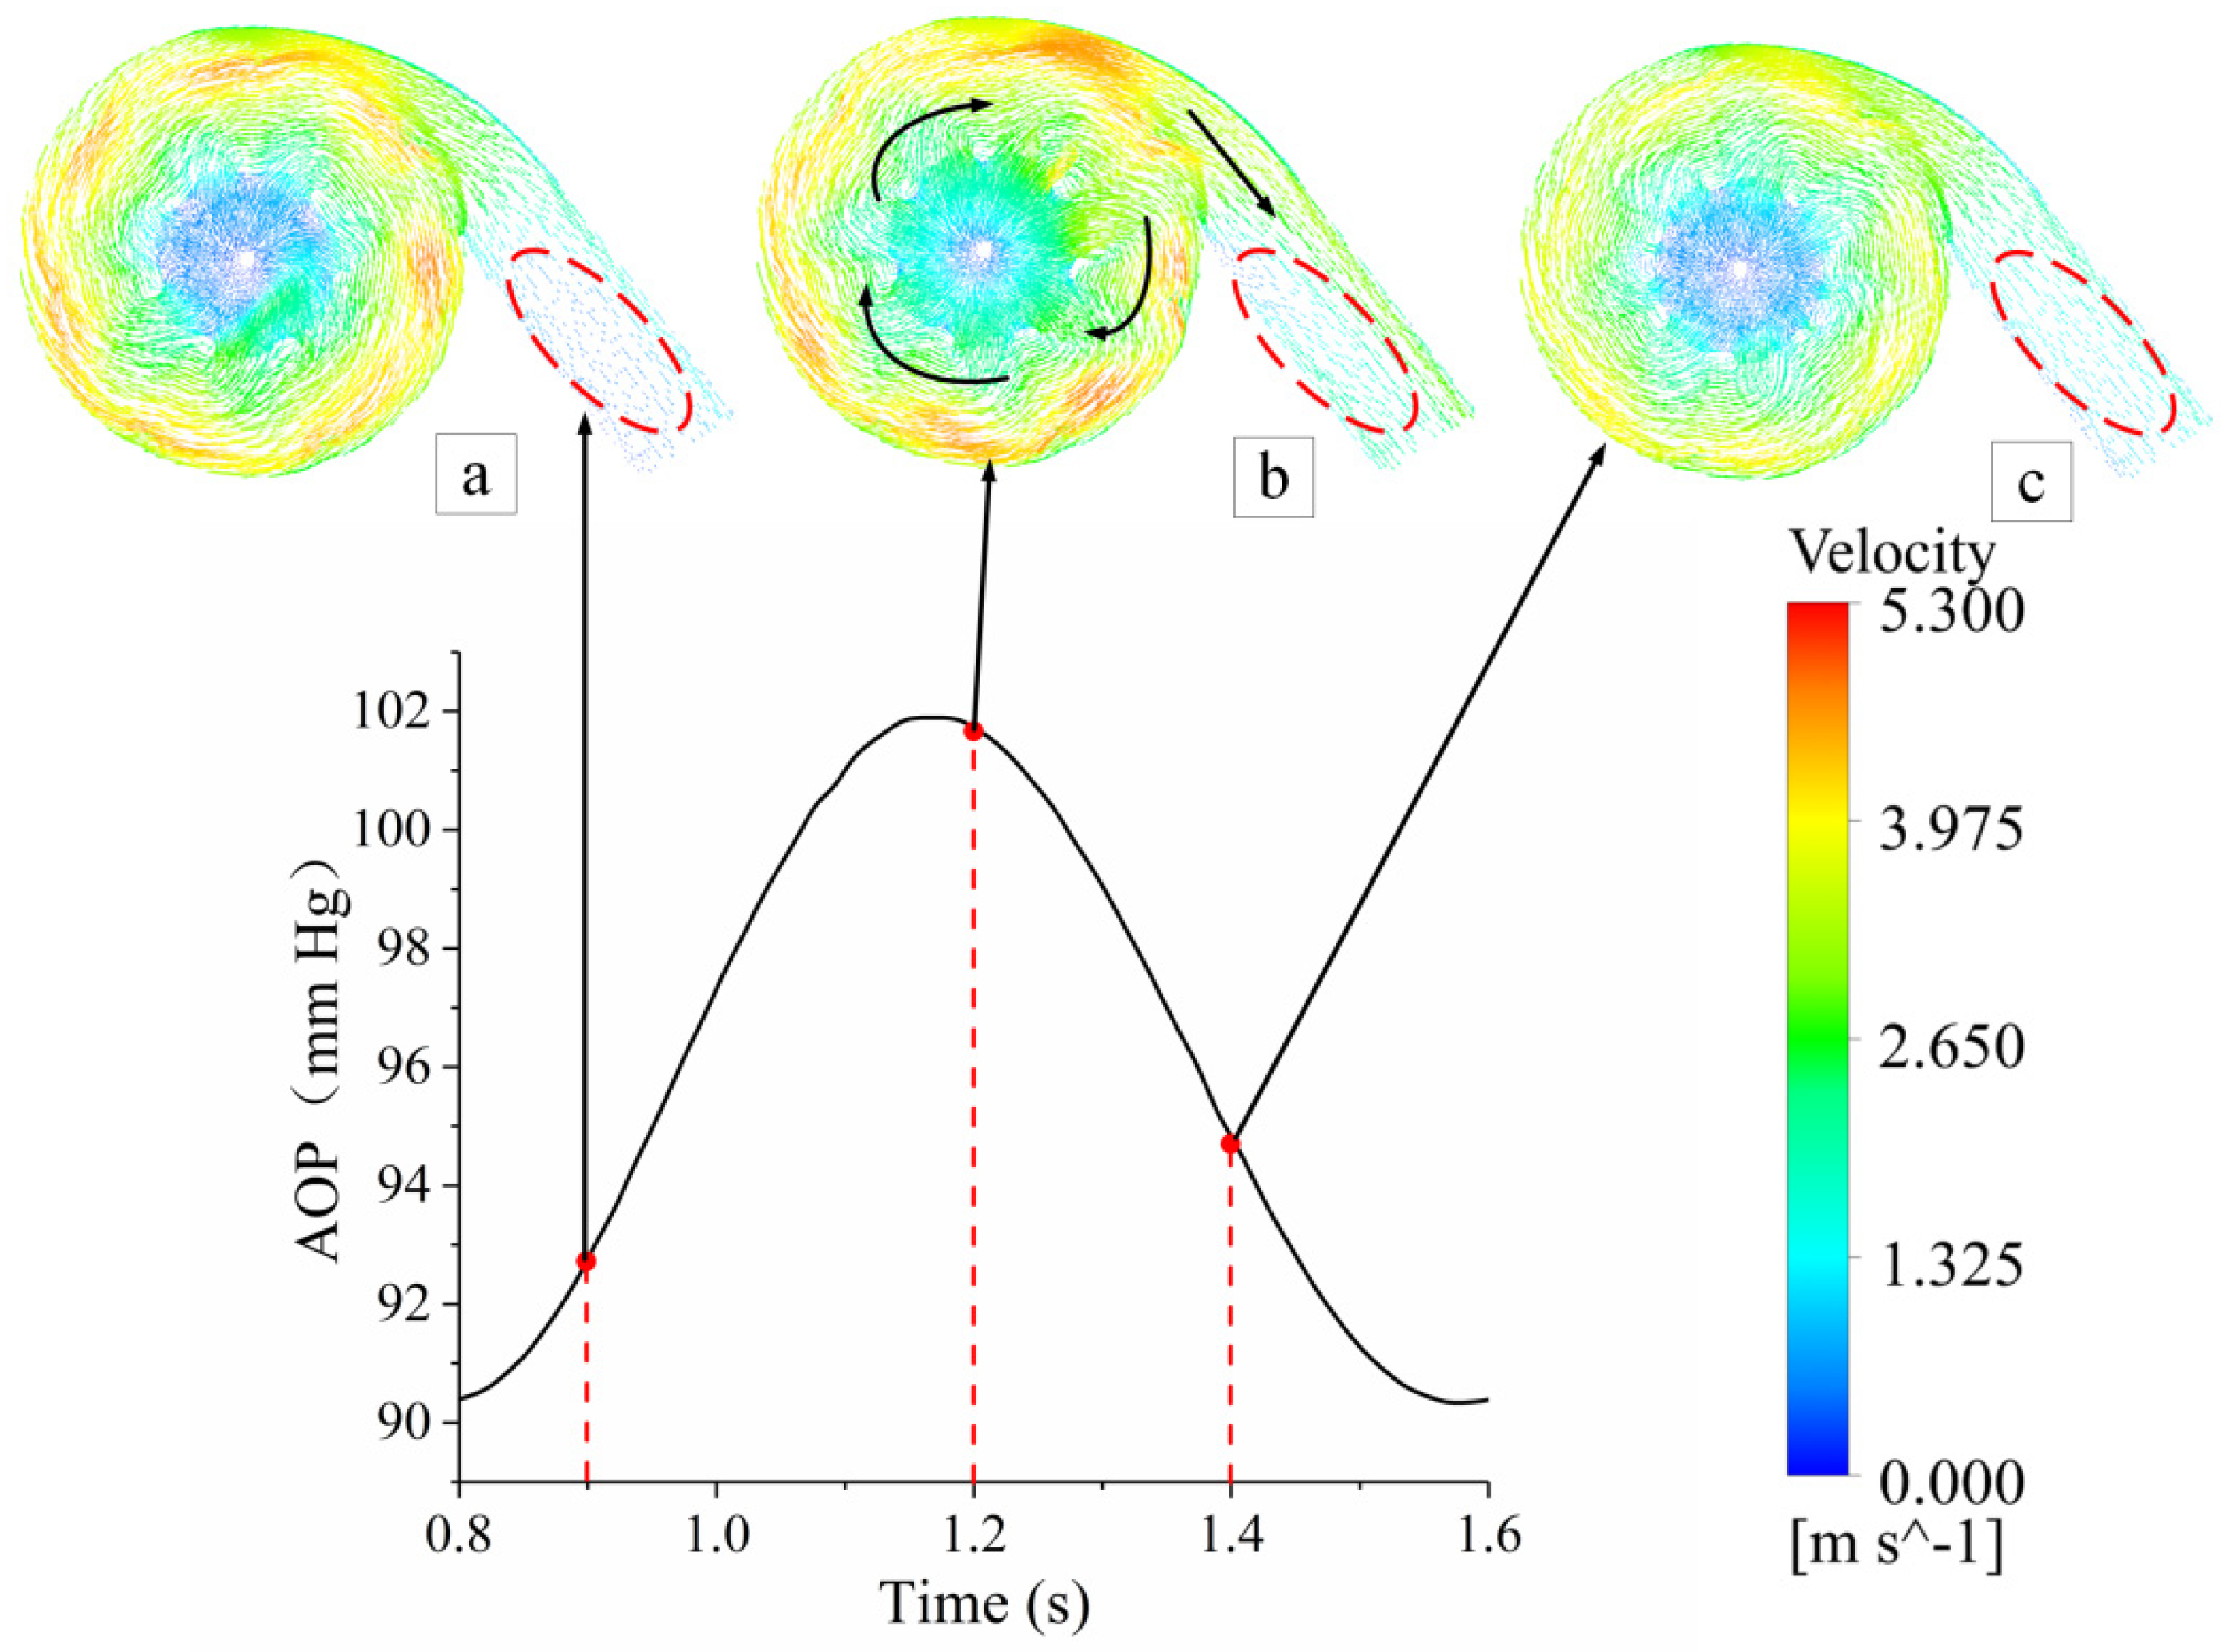
The blood flow trajectory in the spiral groove showed that the hemolysis index fluctuated to different degrees in 0.9, 1.2, and 1.4 s, according to the HI change trend of the pulsating speed pattern. Therefore, the three moments were used for analysis, as shown in Figure 15a–c. The blood velocities corresponding to the ascending, peak, and descending phases of AOP at different moments were different. Moreover, the flow velocity was the highest during the peak pressure period. The red dotted line region in Figure 15a shows the slow flow area at the outlet of the blood pump. At the peak pressure moment, the flow velocity at the outlet of the blood pump increased and the slow flow area disappeared, as shown in Figure 15b. Then the flow velocity in the red dotted line region in Figure 15c became smaller compared with peak time. Therefore, the pulsatile pattern washed away the surface of the blood pump outlet region and inhibited the adhesion of blood cells.
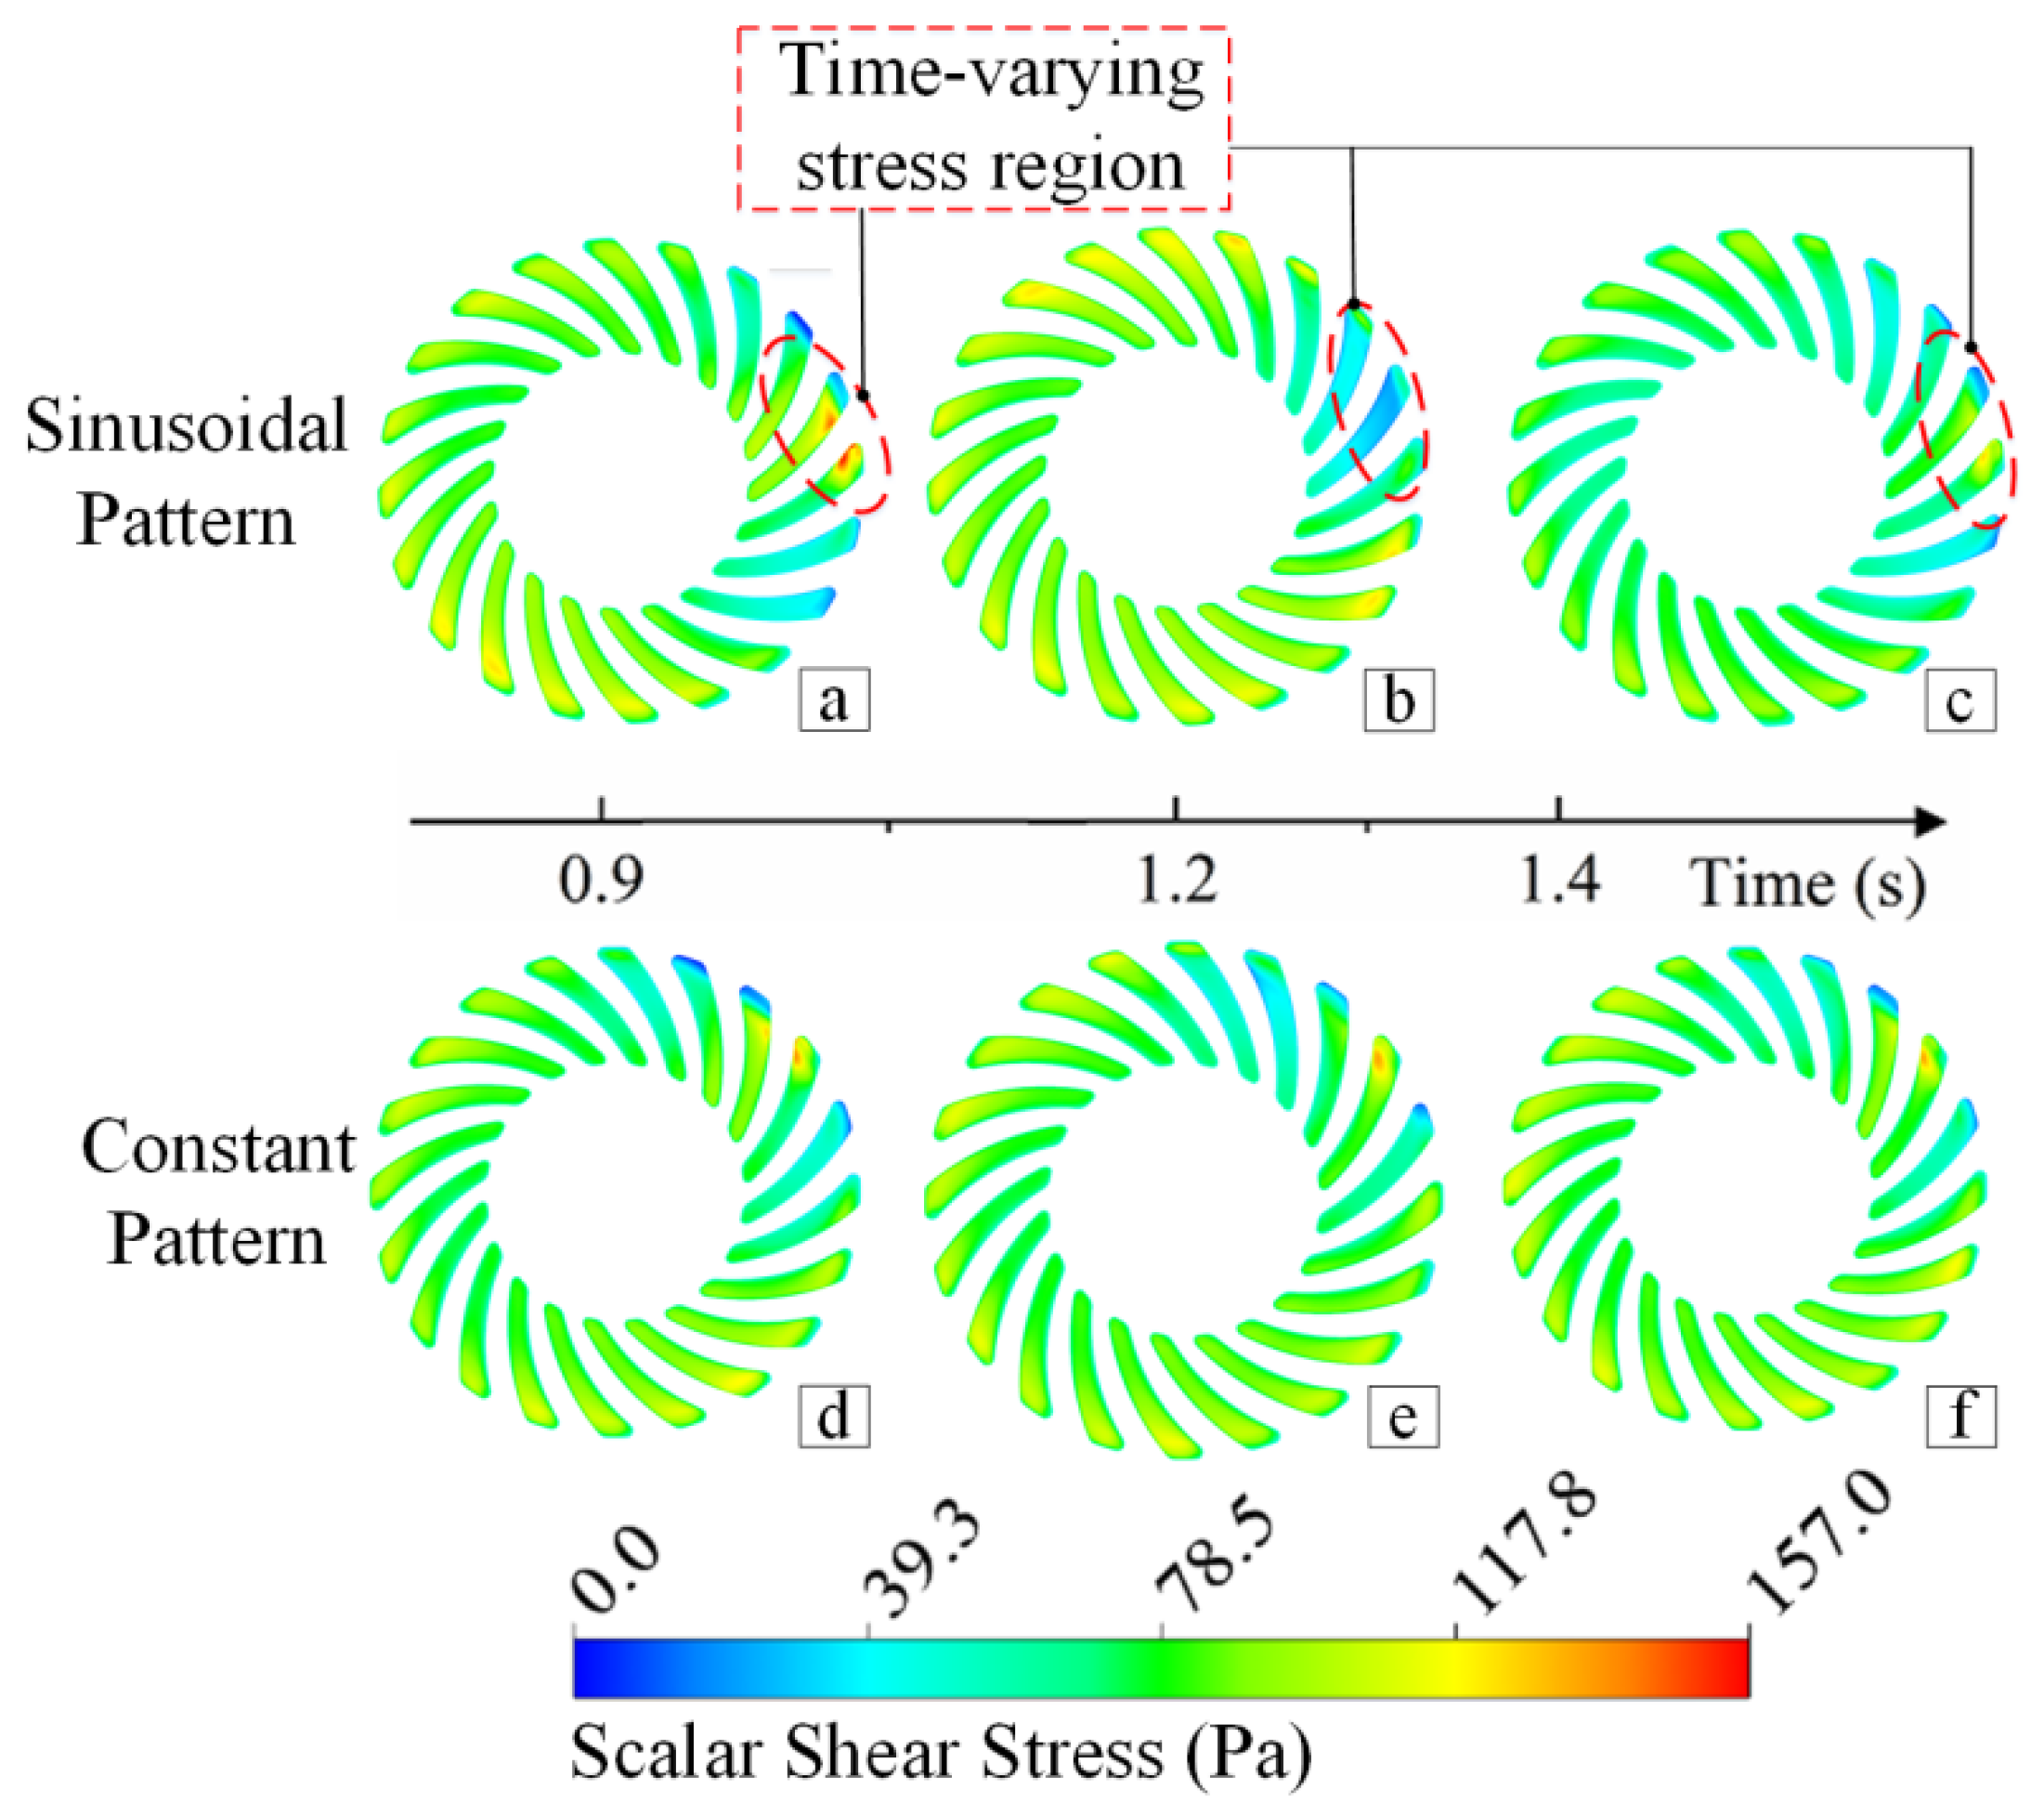
The shear stress distribution in the spiral groove in the sinusoidal speed pattern was compared with that in the constant speed pattern at different moments. The shear stress distribution in the spiral groove under the constant speed pattern was more uniform and hardly changed with time, as shown in Figure 16d–f. However, the internal shear stress of the spiral groove in the sinusoidal speed pattern had time-varying characteristics. The maximum shear stress was different at different times. The maximum shear stress appeared in the rising stage of the impeller speed, which basically reached 157 Pa, as shown in Figure 16a. The maximum shear stress in the sinusoidal speed pattern was slightly higher than that in the constant speed pattern. Therefore, the HI and shear stress characteristics of different impeller speed patterns were established. The results showed that the shear stress increased to a certain extent in the variable speed condition, and the HI in the pulsatile and sinusoidal speed patterns was higher than that in the constant speed pattern.
4. Discussion
Assisted therapy of implementing pulsatile flow on a rotary impeller blood pump has always been a research hotspot. In this study, the impeller speed pattern waveform was modulated according to the blood pressure output characteristics of the native heart and the steady-state H–Q curve of the pump. The effects of an impeller with three speed patterns on the blood flow characteristics and HI were compared and analyzed under the condition of heart failure. On the basis of satisfying the normal blood demand of a patient body, the pulsating flow generated by periodic changes in the impeller speed could effectively increase the fluctuation of blood pressure in the aorta, which helped in improving the effect of peripheral blood vessel perfusion. A blood pump with three speed patterns made the H–Q change into a dynamic counterclockwise closed loop. The hydraulic power consumption in sinusoidal and pulsatile speed patterns was greater than that in the constant speed pattern. Under the sinusoidal and pulsatile speed patterns, the flow field of the blood pump was similar. The flow field in the spiral groove of hydrodynamic bearing varied pulsatively, but the flow path was uniform and no local flow field existed that was prone to thrombosis, such as eddy current and flow stagnation zone. Compared with the constant speed pattern, the high shear stress in the spiral groove of the sinusoidal and pulsatile speed patterns varied with time. When blood flowed through the blood pump, the shear stress and HI increased slightly within a reasonable range, not causing obvious blood damage. Therefore, reasonable control of the impeller speed range is an important aspect to improve the hemolysis performance of a blood pump.
The pulsatility of intra-aortic blood pressure could be improved by impeller speed modulation. The impeller speed modulation method produced pulsatile blood flow, which was similar to the natural heart physiological characteristics of the human body. It could effectively eliminate the complications such as hemorrhage and aortic insufficiency caused by the constant speed pattern, and improved the assisting effect of the blood pump to a certain extent. An impeller is the key component of a blood pump. Its speed not only affects not only the output of blood flow and pressure, but also affects the hemolysis characteristics of the blood pump. Therefore, the method of blood pump speed modulation plays an important role in the design of blood pump structure and physiological adaptive control.
The narrow liquid film gap at the hydrodynamic bearing is the main area causing blood damage. Therefore, compared with the effect of speed waveform modulation on blood compatibility, the structure design of a blood pump might have a greater impact on blood compatibility. In addition, blood compatibility is more complex and affected by several factors. Further, blood compatibility experiments and clinical verification are needed. In addition, modulating the amplitude and phase of the blood pump impeller speed waveform according to the LVP waveform is also one of the difficulties. Therefore, in future research, it is necessary to study the influence of impeller speed pulsation characteristics on the performance of the blood pump, so as to design a pulsating rotary blood pump with low hemolysis characteristics, to achieve blood output in line with the native heart blood flow characteristics and to improve the quality of life of patients with heart failure.
Author Contributions
Y.W. and P.S. conceptualized this study. M.Z. and P.F. did the formal analysis. P.S. worked on the methodology and software-related evaluations. L.L., J.W. and L.Y. wrote, reviewed, and edited the manuscript.
Funding
This study was funded by the National Natural Science Foundation of China (grant number 51875143).
Conflicts of Interest
The authors declare no conflicts of interest.
References
- Garcia, S.; Kandar, F.; Boyle, A.; Colvin-Adams, M.; Lliao, K.; Joyce, L.; John, R. Effects of Pulsatile- and Continuous-flow Left Ventricular Assist Devices on Left Ventricular Unloading. J. Heart Lung Transplant. 2008, 27, 261–267. [Google Scholar] [CrossRef]
- Bartoli, C.R.; Atluri, P. Do patients with a continuous-flow left ventricular assist device benefit from induced-pulsatility or are we just spinning our wheels. J. Thorac. Cardiovasc. Surg. 2015, 150, 945–946. [Google Scholar] [CrossRef]
- Soucy, K.G.; Koenig, S.C.; Giridharan, G.A.; Sobieski, M.A.; Slaughter, M.S. Defining pulsatility during continuous-flow ventricular assist device support. J. Heart Lung Transplant. 2013, 32, 581–587. [Google Scholar] [CrossRef]
- Bozkurt, S. Physiologic outcome of varying speed rotary blood pump support algorithms: A review study. Australas. Phys. Eng. Sci. Med. 2016, 39, 13–28. [Google Scholar] [CrossRef]
- Naito, N.; Nishimura, T.; Iizuka, K.; Takewa, Y.; Umeki, A.; Ando, M.; Ono, M.; Tatsumi, E. Rotational speed modulation used with continuous-flow left ventricular assist device provides good pulsatility. Interact. Cardiovasc. Thorac. Surg. 2017, 26, 119–123. [Google Scholar] [CrossRef]
- Ising, M.; Warren, S.; Sobieski, M.A.; Slaughter, M.S.; Koenig, S.C.; Giridharan, G.A. Flow Modulation Algorithms for Continuous Flow Left Ventricular Assist Devices to Increase Vascular Pulsatility: A Computer Simulation Study. Cardiovasc. Eng. Technol. 2011, 2, 90–100. [Google Scholar] [CrossRef]
- Qian, K. Design of blood pump impeller with ternary theory. J. Eng. Math. 1987, 4, 99–101. (In Chinese) [Google Scholar]
- Qian, K.; Fei, Q. Pulsatile flow impeller blood pump with low hemolysis. J. Biomed. Eng. China 1990, 9, 113–119. (In Chinese) [Google Scholar]
- Pirbodaghi, T.; Axiak, S.; Weber, A.; Gempp, T.; Vandenberghe, S. Pulsatile control of rotary blood pumps: Does the modulation waveform matter. J. Thorac. Cardiovasc. Surg. 2012, 144, 970–977. [Google Scholar] [CrossRef] [PubMed]
- Cheng, A.; Williamitis, C.A.; Slaughter, M.S. Comparison of continuous-flow and pulsatile-flow left ventricular assist devices: Is there an advantage to pulsatility. Ann. Cardiothorac. Surg. 2014, 3, 573. [Google Scholar]
- Nammakie, E.; Niroomand-Oscuii, H.; Koochaki, M.; Ghalichi, F. Computational fluid dynamics-based study of possibility of generating pulsatile blood flow via a continuous-flow VAD. Med. Biol. Eng. Comput. 2017, 55, 167–178. [Google Scholar] [CrossRef] [PubMed]
- Deepankaew, R.; Plianchaisuk, A.; Naiyanetr, P. Numerical Simulation of aBiventricular Assist Device with Pulsatile Control Operation for Bridge toRecovery. Int. J. Appl. Biomed. Eng. 2015, 8, 10–16. [Google Scholar]
- Shiose, A.; Nowak, K.; Horvath, D.J.; Massiello, A.L.; Golding, L.A.; Fukamachi, K. Speed Modulation of the Continuous-Flow Total Artificial Heart to Simulate a Physiologic Arterial Pressure Waveform. ASAIO J. 2010, 56, 403–409. [Google Scholar] [CrossRef] [PubMed] [Green Version]
- Ando, M.; Nishimura, T.; Takewa, Y.; Yamazaki, K.; Kyo, S.; Ono, M.; Tsukiya, T.; Mizuno, T.; Taenaka, Y.; Tatsumi, E. Electrocardiogram-Synchronized Rotational Speed Change Mode in Rotary Pumps Could Improve Pulsatility. Artif. Organs 2011, 35, 941–947. [Google Scholar] [CrossRef] [PubMed]
- Choi, S.; Boston, J.R.; Antaki, J.F. Hemodynamic Controller for Left Ventricular Assist Device Based on Pulsatility Ratio. Artif. Organs 2007, 31, 114–125. [Google Scholar] [CrossRef] [PubMed]
- Shi, Y.; Lawford, P.V.; Hose, D.R. Numerical Modeling of Hemodynamics with Pulsatile Impeller Pump Support. Ann. Biomed. Eng. 2010, 38, 2621–2634. [Google Scholar] [CrossRef]
- Alberto, M.B.; Manuel, F.O.J.; Andrés, M.F. Numerical methodology for the CFD simulation of diaphragm volumetric. Int. J. Mech. Sci. 2018, 150, 322–336. [Google Scholar] [CrossRef]
- May-Newman, K.; Vu, V.; Herold, B. Modeling the Link between Left Ventricular Flow and Thromboembolic Risk Using Lagrangian Coherent Structures. Fluids 2016, 1, 38. [Google Scholar] [CrossRef]
- Behbahani, M.; Behr, M.; Hormes, M.; Steinseifer, U.; Arora, D.; Coronado, O.; Pasquali, M. A review of computational fluid dynamics analysis of blood pumps. Eur. J. Appl. Math. 2009, 20, 363–397. [Google Scholar] [CrossRef] [Green Version]
- Moscato, F.; Danieli, G.A.; Schima, H. Dynamic Modeling and Identification of an Axial Flow Ventricular Assist Device. Int. J. Artif. Organs 2009, 32, 336–343. [Google Scholar] [CrossRef]
- Fraser, K.H.; Taskin, M.E.; Griffith, B.P.; Wu, Z.J. The use of computational fluid dynamics in the development of ventricular assist devices. Med. Eng. Phys. 2011, 33, 263–280. [Google Scholar] [CrossRef] [PubMed] [Green Version]
- Ferreira, A.; Chen, S.; Simaan, M.A.; Boston, J.R.; Antaki, J.F. A Nonlinear State-Space Model of a Combined Cardiovascular System and a Rotary Pump. In Proceedings of the IEEE Conference on Decision & Control, Seville, Spain, 15 December 2005. [Google Scholar]
- Simaan, M.A. Modeling and control of the heart left ventricle supported with a rotary assist device. In Proceedings of the IEEE Conference on Decision & Control, Cancun, Mexico, 9–11 December 2008. [Google Scholar]
- Noor, M.R.; Ho, C.H.; Parker, K.H.; Simon, A.R.; Banner, N.R.; Bowles, C.T. Investigation of the Characteristics of HeartWare HVAD and Thoratec HeartMate II Under Steady and Pulsatile Flow Conditions. Artif. Organs 2016, 40, 549–560. [Google Scholar] [CrossRef] [PubMed]
- Arvand, A.; Hormes, M.; Reul, H. A Validated Computational Fluid Dynamics Model to Estimate Hemolysis in a Rotary Blood Pump. Artif. Organs 2005, 29, 531–540. [Google Scholar] [CrossRef] [PubMed]
- Ge, L.; Dasi, L.P.; Sotiropoulos, F.; Yoganathan, A.P. Characterization of Hemodynamic Forces Induced by Mechanical Heart Valves: Reynolds vs. Viscous Stresses. Ann. Biomed. Eng. 2008, 36, 276–297. [Google Scholar] [CrossRef]
- Apel, J.; Paul, R.; Klaus, S.; Siess, T.; Reul, H. Assessment of Hemolysis Related Quantities in a Microaxial Blood Pump by Computational Fluid Dynamics. Artif. Organs 2001, 25, 341–347. [Google Scholar] [CrossRef]
- Bludszuweit, C. Three-dimensional numerical prediction of stress loading of blood particles in a centrifugal pump. Artif. Organs 1995, 19, 590–596. [Google Scholar] [CrossRef]
- Giersiepen, M.; Wurzinger, L.J.; Opitz, R.; Reul, H. Estimation of shear stress-related blood damage in heart valve prostheses--in vitro comparison of 25 aortic valves. Int. J. Artif. Organs 1990, 13, 300–306. [Google Scholar] [CrossRef]
- Taskin, M.E.; Fraser, K.H.; Zhang, T.; Wu, C.; Griffith, B.P.; Wu, Z.J. Evaluation of Eulerian and Lagrangian Models for Hemolysis Estimation. ASAIO J. 2012, 58, 363–372. [Google Scholar] [CrossRef]
- Garon, A.; Farinas, M.I. Fast Three-dimensional Numerical Hemolysis Approximation. Artif. Organs 2015, 28, 1016–1025. [Google Scholar] [CrossRef]
Figure 1.
Schematic diagram of the blood pump. The arrow indicates the blood flow path and the secondary flow path.
Figure 1.
Schematic diagram of the blood pump. The arrow indicates the blood flow path and the secondary flow path.

Figure 2.
(a) Blood pump simulation model; (b) structured mesh of the blood pump, in which the area mesh of hydraulic bearing was refined.
Figure 2.
(a) Blood pump simulation model; (b) structured mesh of the blood pump, in which the area mesh of hydraulic bearing was refined.

Figure 3.
Mesh section of the simulation model of the flow field of the blood pump; the mesh with smaller characteristic scale was refined and densified.
Figure 3.
Mesh section of the simulation model of the flow field of the blood pump; the mesh with smaller characteristic scale was refined and densified.

Figure 4.
(a) An experimental platform for testing the hydrodynamic characteristics of blood pumps. (b) Pressure head versus blood flow rate curve.
Figure 4.
(a) An experimental platform for testing the hydrodynamic characteristics of blood pumps. (b) Pressure head versus blood flow rate curve.

Figure 5.
Comparison between the experimental and simulation results of the H–Q curve.

Figure 6.
Cardiovascular system model coupled with the hydraulic performance model of a blood pump.

Figure 7.
Characteristics of left ventricular pressure (LVP) and aortic pressure (AOP) in healthy and heart failure conditions. Solid and dotted lines represent the characteristics of the blood pressure output of normal individuals and patients with heart failure, respectively. The aortic valves had normal opening and closing function at all times.

Figure 8.
Amplitude and frequency characteristics of the three kinds of speed patterns of a blood pump impeller. The central speed was the same as that of the constant speed pattern, which was also the reference speed of the sinusoidal speed pattern.
Figure 8.
Amplitude and frequency characteristics of the three kinds of speed patterns of a blood pump impeller. The central speed was the same as that of the constant speed pattern, which was also the reference speed of the sinusoidal speed pattern.

Figure 9.
Changes in LVP and AOP when the left ventricle was assisted by the three kinds of speed patterns of the blood pump. The pressure difference between the dotted lines represents the maximum aortic pulse pressure (PP) As LVP was much lower than AOP, the aortic valve remained closed during the process of blood pump assistance.

Figure 10.
Blood flow rate variation characteristics with time; the curve in the frame indicates the difference between the blood pump flow rate and the blood flow rate in the aorta.
Figure 10.
Blood flow rate variation characteristics with time; the curve in the frame indicates the difference between the blood pump flow rate and the blood flow rate in the aorta.

Figure 11.
H–Q curve loop of the impeller with three speed patterns. Arrows indicate the trend of the blood flow rate and pressure changes with the impeller speed. The closed curve represents the hydraulic power consumed by the blood pump in a cardiac cycle.
Figure 11.
H–Q curve loop of the impeller with three speed patterns. Arrows indicate the trend of the blood flow rate and pressure changes with the impeller speed. The closed curve represents the hydraulic power consumed by the blood pump in a cardiac cycle.

Figure 12.
(a) Changes in hemolysis index (HI) under the three speed patterns. (b) Blood velocity in the spiral groove of the hydraulic bearing of the blood pump varied with time.
Figure 12.
(a) Changes in hemolysis index (HI) under the three speed patterns. (b) Blood velocity in the spiral groove of the hydraulic bearing of the blood pump varied with time.

Figure 13.
(a) HI distribution of the sinusoidal speed pattern at 0.9 s. (b) High shear stress region of the spiral groove in the sinusoidal speed pattern at 0.9 s.
Figure 13.
(a) HI distribution of the sinusoidal speed pattern at 0.9 s. (b) High shear stress region of the spiral groove in the sinusoidal speed pattern at 0.9 s.

Figure 14.
(a) Flow trace of blood under shear stress in the whole flow field of the blood pump. (b) Track of blood flow in the spiral groove.
Figure 14.
(a) Flow trace of blood under shear stress in the whole flow field of the blood pump. (b) Track of blood flow in the spiral groove.

Figure 15.
Flow-field variation characteristics of the blood pump at different moments in the pulsating speed pattern. The panels (a–c) show the velocity vector of the flow field inside the blood pump when the aortic pressure increased (a) at 0.9 s, (b) was at peak at almost 1.2 s, and (c) decreased at 1.4 s. Black arrows indicate the direction of fluid flow.

Figure 16.
Shear stress variation characteristics of sinusoidal and constant speed patterns at different moments. Red dotted frames in panels (a–c) show the time-varying characteristics of scalar shear stress in the sinusoidal speed pattern; panels (d–f) show that the amplitude and distribution of scalar shear stress were almost unchanged in the constant speed pattern.


Table 1.
Number of grid units in each part of the blood pump simulation model.
| Diversion Zone | Impeller Channel | Inlet Channel and Volute | Outlet Channel | Total |
|---|---|---|---|---|
| 108,000 | 420,600 | 930,500 | 182,900 | 1,642,000 |
Table 2.
Hydraulic performance model coefficient of the blood pump.
(mm Hg/rpm2) | (mm Hg·s/mL) | (mm Hg/(s2·mL)) | (mm Hg·s2/mL) |
|---|---|---|---|
| 1.5674e−5 | −0.1169 | −0.0023 | −0.0034 |
Table 3.
Simulation model parameters of the cardiovascular system.
| Variable | Description | Magnitude |
|---|---|---|
| () | Lumped resistance of the arterial system | 1 |
| () | Mitral valve resistance | 0.005 |
| () | Aortic valve resistance value | 0.001 |
| () | Aortic characteristic impedance | 0.0398 |
| () | Myocardial impedance | 0 |
| () | Resistance of inlet cannula | 0.0677 |
| () | Resistance of outlet cannula | 0.0677 |
| () | Lumped compliance of the arterial system | 1.33 |
| () | Aortic compliance | 0.08 |
| () | Left atrial compliance | 4.4 |
| () | Blood flow inertia of the arterial system | 0.0005 |
| () | Inertia of inlet cannula | 0.0127 |
| () | Inertia of outlet cannula | 0.0127 |
Table 4.
Cardiac output indicators under different speed patterns of the blood pump.
| Patterns | CO (L/min) | MAP (mm Hg) | PP (mm Hg) | EEP (mm Hg) | SHE (erg/cm3) |
|---|---|---|---|---|---|
| Constant | 5.2 | 97.2 | 5.0 | 98.2 | 1300.4 |
| Sinusoidal | 5.1 | 94.2 | 11.6 | 97.2 | 4054.9 |
| Pulsatile | 4.9 | 90.8 | 12.7 | 93.8 | 4036.5 |
© 2019 by the authors. Licensee MDPI, Basel, Switzerland. This article is an open access article distributed under the terms and conditions of the Creative Commons Attribution (CC BY) license (http://creativecommons.org/licenses/by/4.0/).
Share and Cite
MDPI and ACS Style
Wang, Y.; Shen, P.; Zheng, M.; Fu, P.; Liu, L.; Wang, J.; Yuan, L. Influence of Impeller Speed Patterns on Hemodynamic Characteristics and Hemolysis of the Blood Pump. Appl. Sci. 2019, 9, 4689. https://doi.org/10.3390/app9214689
AMA Style
Wang Y, Shen P, Zheng M, Fu P, Liu L, Wang J, Yuan L. Influence of Impeller Speed Patterns on Hemodynamic Characteristics and Hemolysis of the Blood Pump. Applied Sciences. 2019; 9(21):4689. https://doi.org/10.3390/app9214689
Chicago/Turabian StyleWang, Yiwen, Peng Shen, Minli Zheng, Pengqiang Fu, Lijia Liu, Jingyue Wang, and Lishan Yuan. 2019. "Influence of Impeller Speed Patterns on Hemodynamic Characteristics and Hemolysis of the Blood Pump" Applied Sciences 9, no. 21: 4689. https://doi.org/10.3390/app9214689
Note that from the first issue of 2016, this journal uses article numbers instead of page numbers. See further details here.