Development and Evaluation of Crack Band Model Implemented Progressive Failure Analysis Method for Notched Composite Laminate


1
Department of Mechanical Engineering, Chungnam National University, Daejeon 34134, Korea
2
HANKUK FIBER GROUP, Daejeon 34068, Korea
*
Author to whom correspondence should be addressed.
Appl. Sci. 2019, 9(24), 5572; https://doi.org/10.3390/app9245572
Submission received: 12 November 2019
/
Revised: 15 December 2019
/
Accepted: 16 December 2019
/
Published: 17 December 2019
(This article belongs to the Special Issue Selected Papers from the ICMR 2019)
Abstract
:Featured Application
A model studied in this article, which allows for a good representation of behavior of notched geometry and less mesh dependence, is expected to benefit the design process of complex composite structures.
Abstract
Progressive failure analysis (PFA) is widely used to predict the failure behavior of composite materials. As a structure becomes more complex with discontinuities, prediction of failure becomes more difficult and mesh dependence must be taken into account. In this study, a PFA model was developed using the Hashin failure criterion and crack band model. The failure initiation was evaluated using the Hashin failure criterion. If failure initiation occurred, the damage variables at each failure mode (fiber tension and compression; matrix tension and compression) were calculated according to linear softening degradation and they were then used to derive the damaged stiffness matrix. This matrix reflected a degraded material, and PFA was continued until the damage variables became “1,” implying complete material failure. A series of processes were performed using the finite element method program ABAQUS with a user-defined material subroutine. To evaluate the proposed PFA model, experimental results of open-hole composite laminate tests were compared with the obtained numerical results. The strain behaviors were compared using a digital image correlation system. The obtained numerical results were in good agreement with the experimental ones.
1. Introduction
Several studies are being conducted on composite materials to design structures in engineering. In addition to aeronautical fields that have been investigated extensively, studies are being performed in a variety of fields such as the automobile and naval manufacturing industries. In structural design, geometric discontinuities, such as holes and notches, should be studied. Discontinuities in materials can serve as advantages in areas such as sound scattering [1]. However, they can also pose critical issues as they can cause stress concentrations in structural design and determine the overall structural life. Furthermore, in designing structures using composite materials, it is important to verify and predict the failure behavior of a composite material with its complexity. Progressive failure analysis (PFA) has been studied for a long time and is a prominent tool used to predict the failure of composite materials. Various studies have been conducted to investigate the failure behavior of composite materials using PFA. The Matzenmiller–Lubliner–Taylor (MLT) damage variable [2] is currently being used as a typical PFA tool. Furthermore, PFA models have been proposed in many studies. Various studies on the application of these suggested models in the design of composite structures have been conducted. Chang et al. [3] studied the progressive failure behavior of notched T300/1034C graphite/epoxy composite laminate. Stress and failure analysis studies were conducted, and it was confirmed that the suggested PFA model demonstrated a good correlation with the experimental results. This model used the damage variables while taking into consideration the reduction in area induced during the failure. Su et al. [4,5] performed an open-hole compression test using a composite laminate. Furthermore, the size effect of open-hole compressive tests was investigated. Using the crack band model, a PFA tool was developed. Additional cohesive elements were introduced using the finite element method (FEM) model to observe the delamination behavior. A PFA model using the crack band model [6] was suggested to alleviate the mesh dependency of the result. Lapczyk et al. [7] suggested a PFA model using the crack band model. The suggested model demonstrated good mesh independency and predicted the failure behavior of the notched composite laminate. Some studies pertaining to viscosity factors for FEM efficiency were conducted. Riccio et al. [8] used a crack-band-model-applied PFA model to predict the failure behavior of stiffened composite panels. The applied PFA model predicted the failure behavior of composite panels well and demonstrated less mesh dependency. The less mesh dependency of the crack-band-model-applied PFA model can be easily used to predict the failure behavior of complex composite structures. Kodagali et al. [9] suggested the PFA model using the Puck failure criterion. The model used instantaneous softening behavior during the PFA. Element weakening and constant stress exposure methods were introduced in the PFA model. In comparison to the open-hole tensile test and digital image correlation (DIC) results, the efficiency of the suggested model was verified. This model effectively predicted the failure behavior of the composite laminate regardless of the stacking sequences. The failure behavior of the T300/1034C carbon/epoxy composite laminate was also studied using this model. Strain fields obtained from DIC results of the composite material were also investigated. Using DIC, Jiang et al. [10] measured the J-integral value of dental ceramics. The obtained strain values using DIC were used to measure the J-integral value according to Paris’ equation. To verify the path independency of the J-integral, some studies were performed using various contour sizes. Catalanotti et al. [11] conducted a similar study on the composite laminate. Using the compact tension (CT) and compact compression specimens of unidirectional carbon-fiber-reinforced epoxy composite, CT tests were conducted, and the strain field was obtained using DIC. The J-integral value was calculated using the strain values and the fracture energy value was finally obtained according to some assumptions. Many studies have been performed [12,13,14,15,16,17,18,19,20,21] on the failure behavior of an open-hole composite laminate. However, studies regarding the validity assessment of the suggested PFA by comparing it to the values obtained from experimental studies are scarce.
In this study, the crack-band-model-implemented PFA model was developed using the commercial FEM software program ABAQUS and a user-defined material subroutine (UMAT) code to predict the behavior of a composite laminate containing an open-hole. For this investigation, linear gradual softening behavior was assumed. The mesh dependency of the suggested PFA model was studied to confirm the benefits of the PFA model. To evaluate the developed PFA model, experimental load-displacement data and strain values obtained using DIC were compared with the PFA results. After the evaluation, the failure behavior of the open-hole composite laminate specimen was investigated.
2. Development of Progressive Failure Analysis
2.1. Progressive Failure Analysis
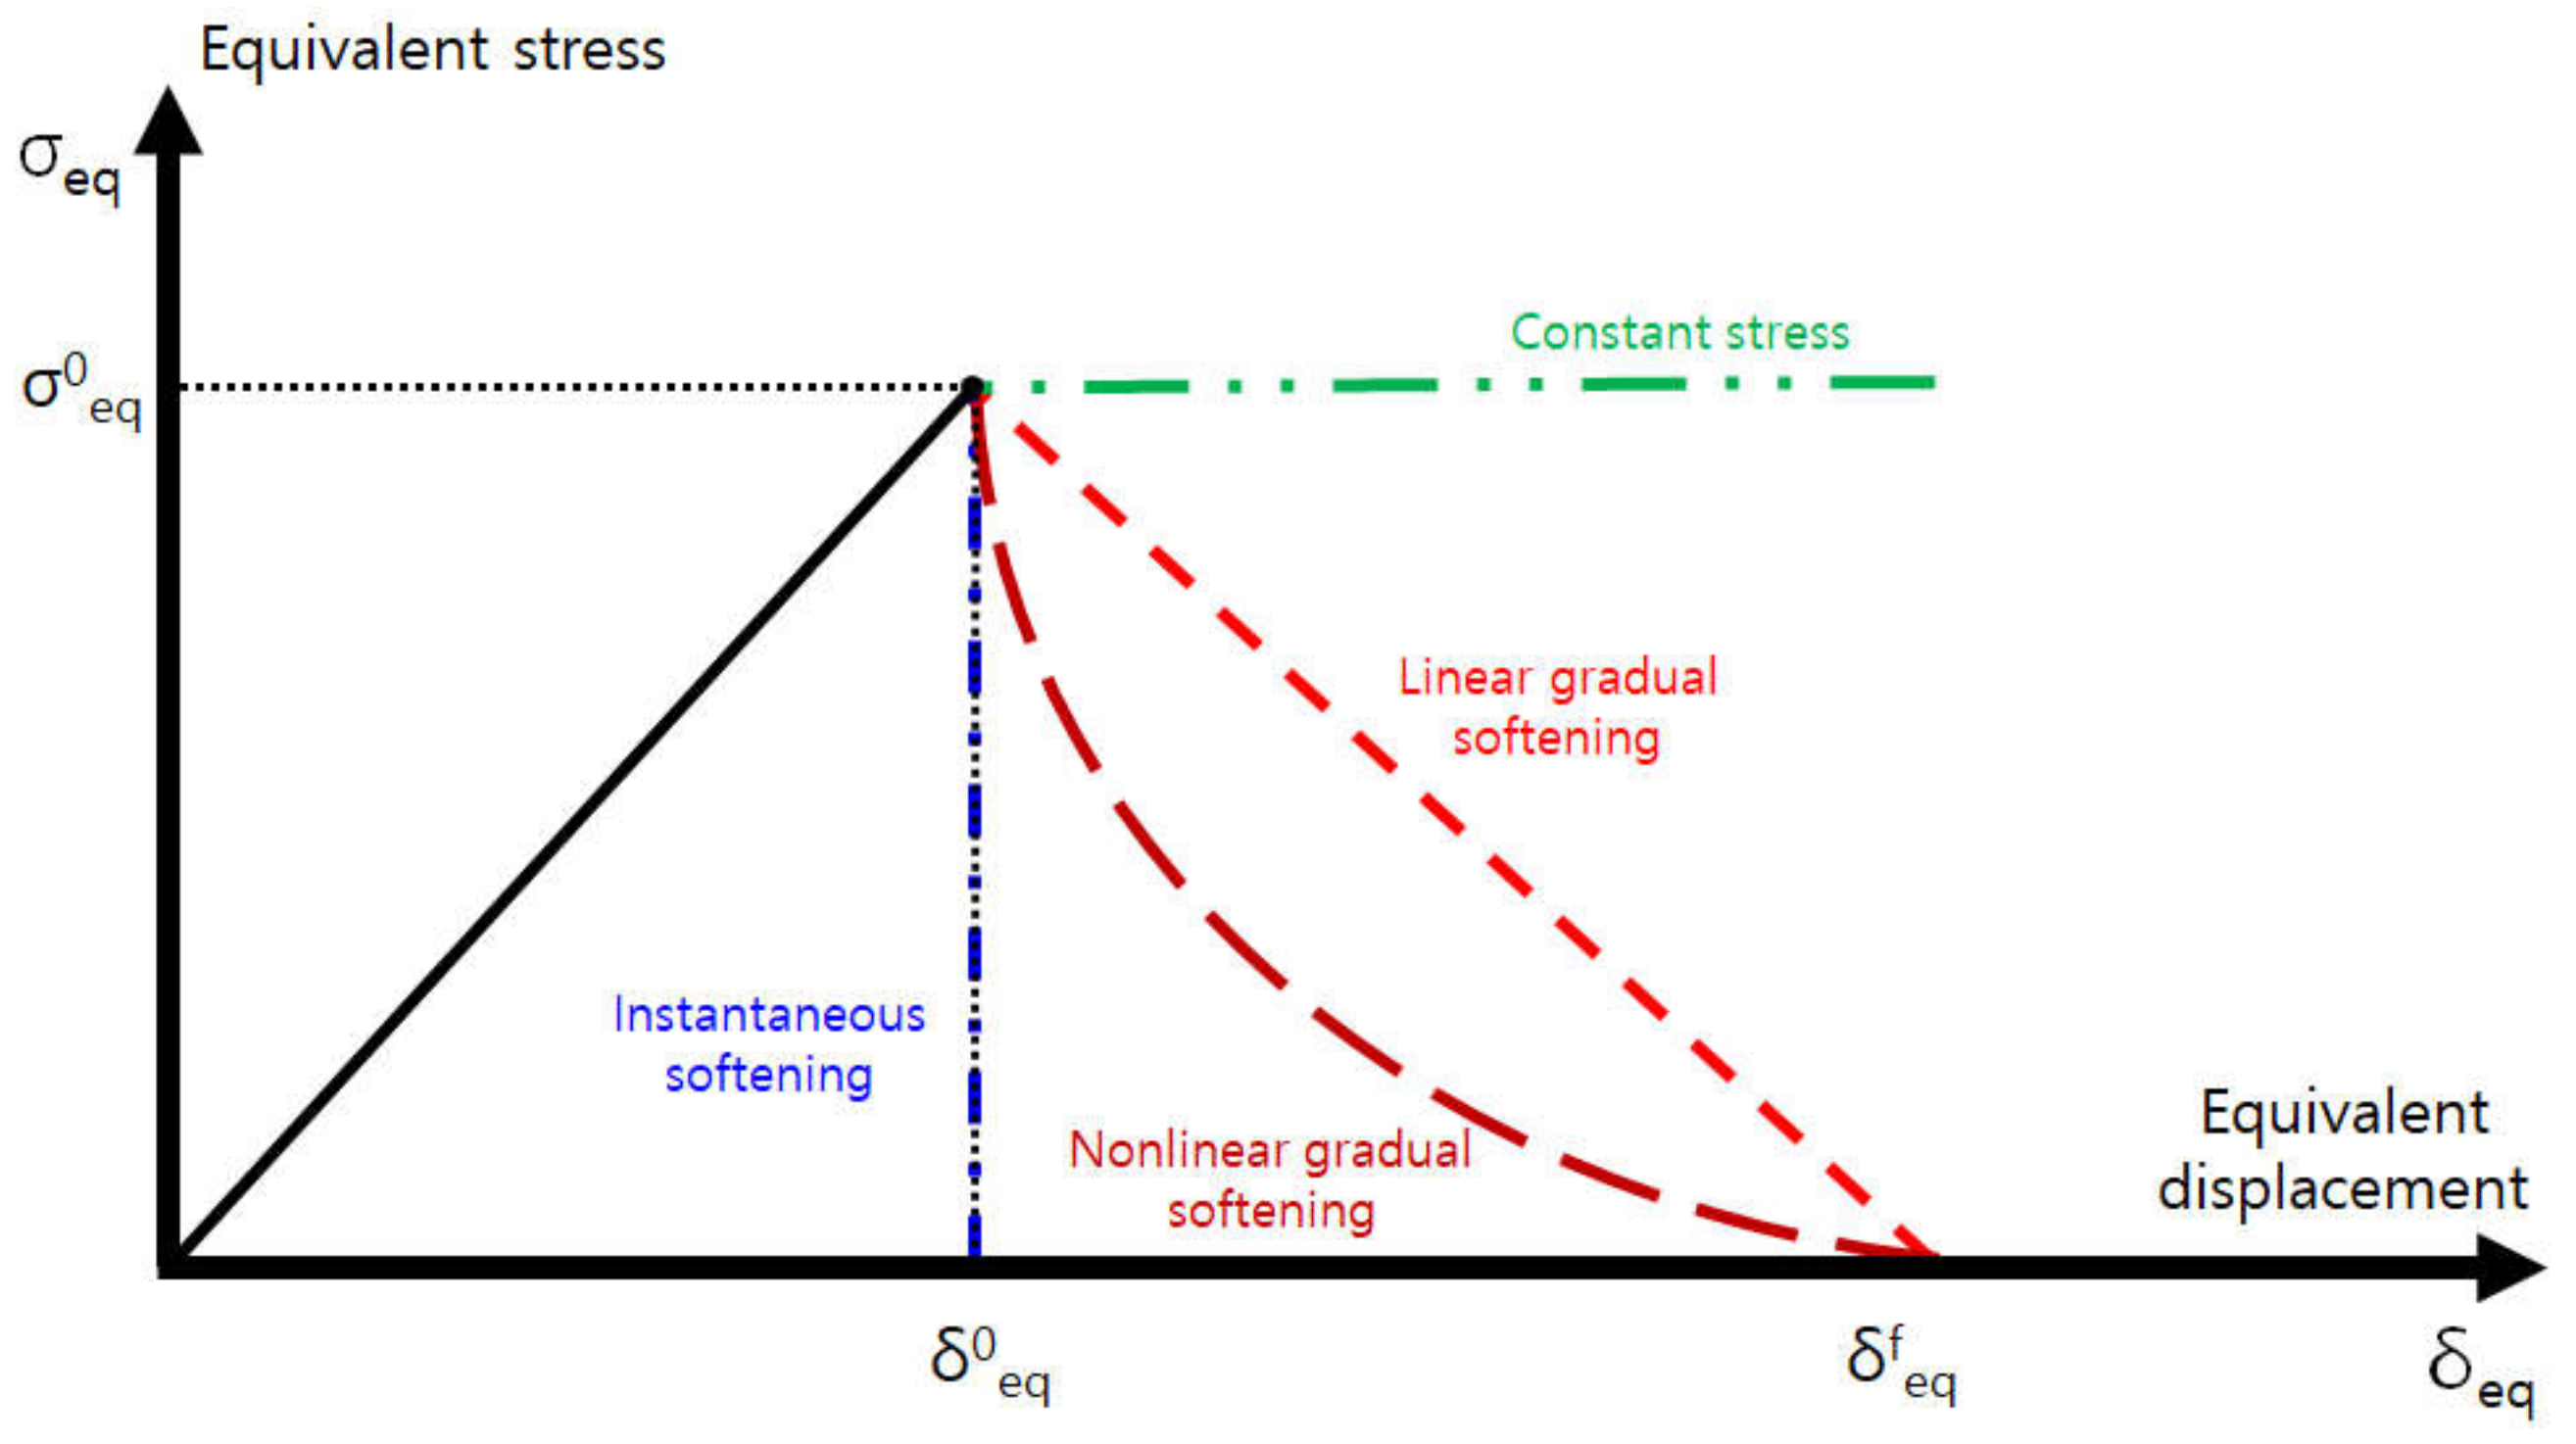
Generally, PFA is performed to reduce the stiffness of the composite materials based on the damage initiation criteria and evolution behavior. Some material property degradation models have been proposed (e.g., instantaneous softening, gradual softening, or constant stress at failure material point) as shown in Figure 1. The linear gradual degradation model (GDM) was used in this study to describe the behavior of a composite material. The material behavior displays linear elastic behavior until damage initiation. By observing the linear softening behavior, the stress is reduced progressively when either the displacement or strain increases. When a composite material is being damaged, its stiffness matrix is replaced by the damaged stiffness matrix. Equation (1) shows the damaged stiffness matrix, where all the “Cij” values include the damage variable, d, according to its directions.
The subscripts 1, 2, and 3 denote the directions on the coordinate. The parameters df, dm, and ds are damage variables for the fiber, matrix, and shear damage, respectively, which range from 0 to 1. Additionally, 0 and 1 imply undamaged status and complete damage status, respectively. As material failure occurs, the damage variables approach 1. When performing a PFA, the failure criteria are verified to detect failure in materials in terms of the effective stress that reflects the damaged stress status at each analysis increment. The effective stress, , is as follows:
2.2. Damage Initiation and Evolution
During PFA, failure initiation should be detected to apply the damage evolution model. In this study, damage initiation was evaluated using the Hashin failure criterion [22,23]. Using this criterion, failures at the “fiber tension/compression” and “matrix tension/compression” modes can be evaluated. The following equations are the Hashin’s criteria at each failure mode:
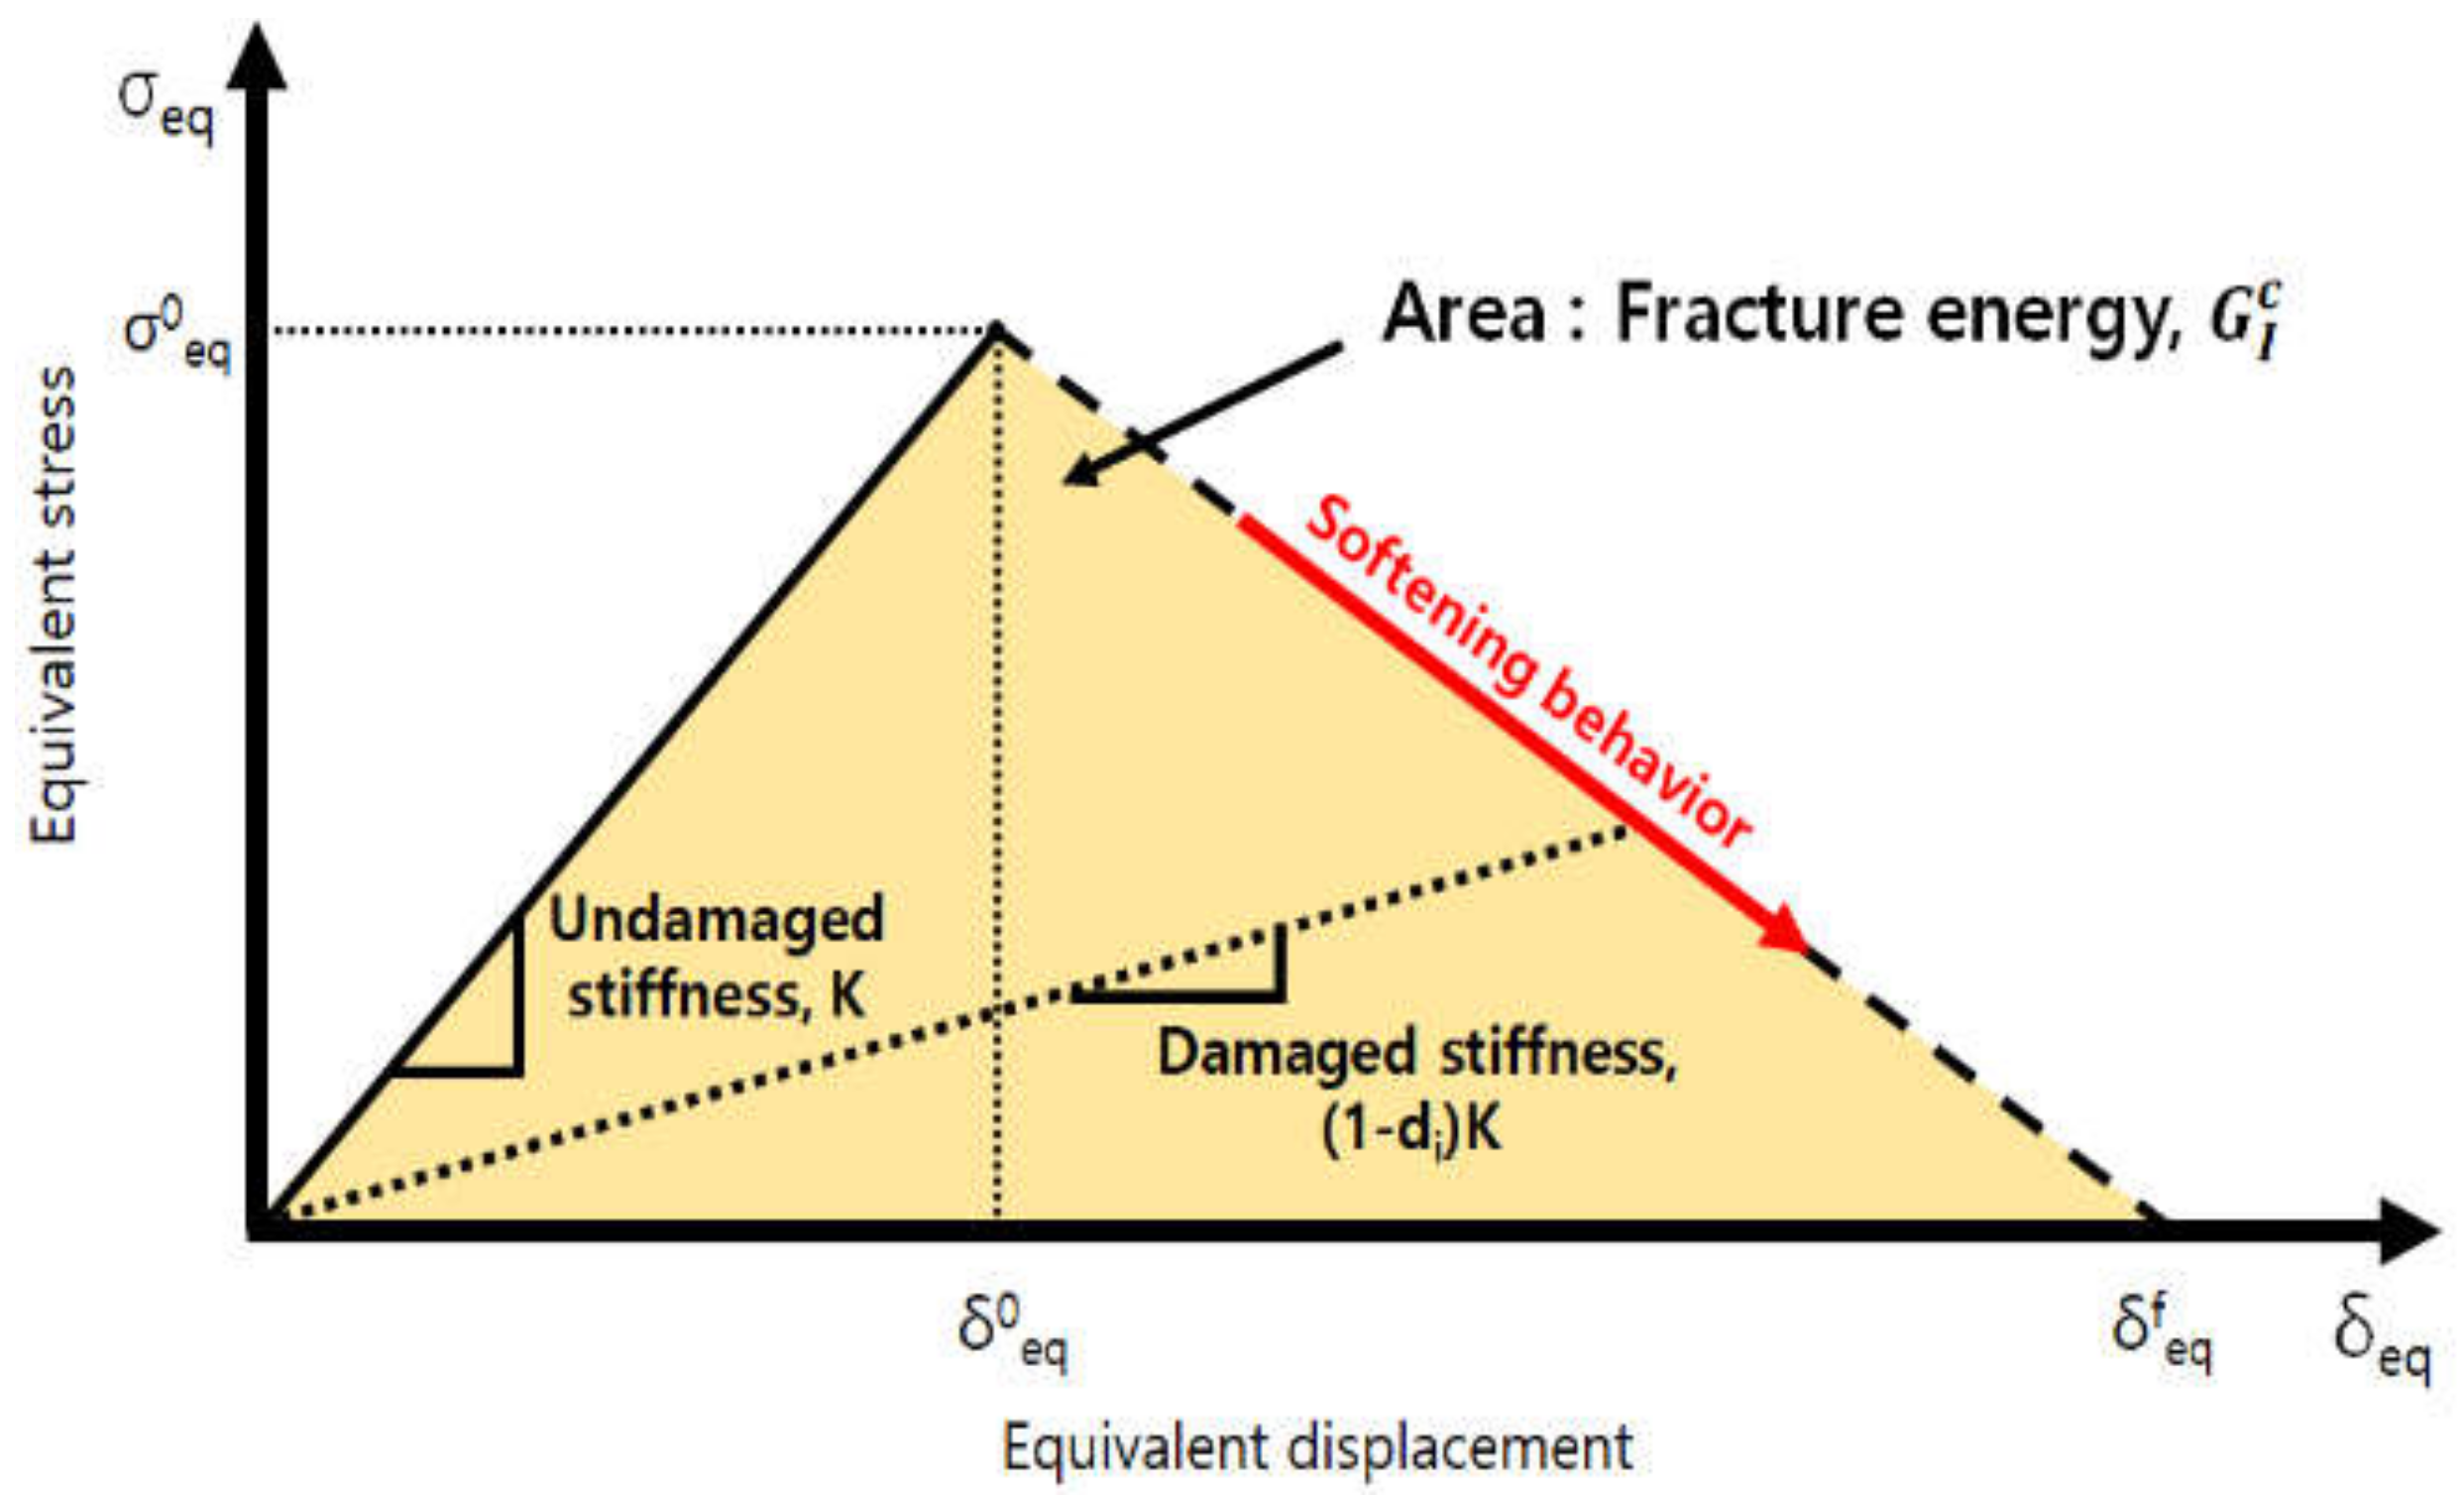
The failure criterion parameter, “”, is calculated using the effective stress values (mentioned in Section 2.1) to evaluate the failure in the composite material. “I” can be replaced by ft, fc, mt, and mc, meaning fiber tension, fiber compression, matric tension, and matrix compression, respectively. Failure occurred when the failure criterion parameter is “1.” Once the failure was initiated, the damage variable was calculated to obtain the damaged stiffness matrix. The crack-band-model-applied damage model was used in this study. To obtain the damage variables, an equivalent displacement and an equivalent stress were calculated based on the relationship provided in Figure 2.
The equivalent displacement and stress at each failure mode can be calculated according to the following equations:
<Fiber tension failure mode>
<Fiber compression failure mode>
<Matrix tension failure mode>
<Matrix compression failure mode>
where Lc is the characteristic length and “⟨⟩” refers to the Macaulay brackets. The definition of the Macaulay brackets is as follows:
To calculate the damage variables at each failure mode, the “equivalent displacement and equivalent stress at the initial failure state” and the “equivalent displacement at the final failure state” should be obtained. Using the failure criterion parameter, , the equivalent displacement and stress at the initial failure state can be obtained as follows:
<Equivalent displacement at the initial failure state>
<Equivalent stress at the initial failure state>
The superscript “0” implies the failure initial state. The equivalent displacement at the final failure state can be calculated using the crack band model [6].
<Crack band model>
<Equivalent displacement at the final failure state>
Using the equivalent stress and equivalent displacement, a damage variable at each failure mode can be calculated based on the following equation:
As the damage initiates and propagates in the material, the variable gets incremented from 0 to 1. Damage variables are applied to the stiffness matrix based on each failure mode while considering the effective stress condition.
Damage variables were considered in the damaged stiffness matrix in the form of (1 − dI), as shown in Equation (2). Consequently, an increase in the damage variables induced a decrease in the stiffness matrix.
3. Material and Test Procedures
3.1. Composite Material and Test Specimen
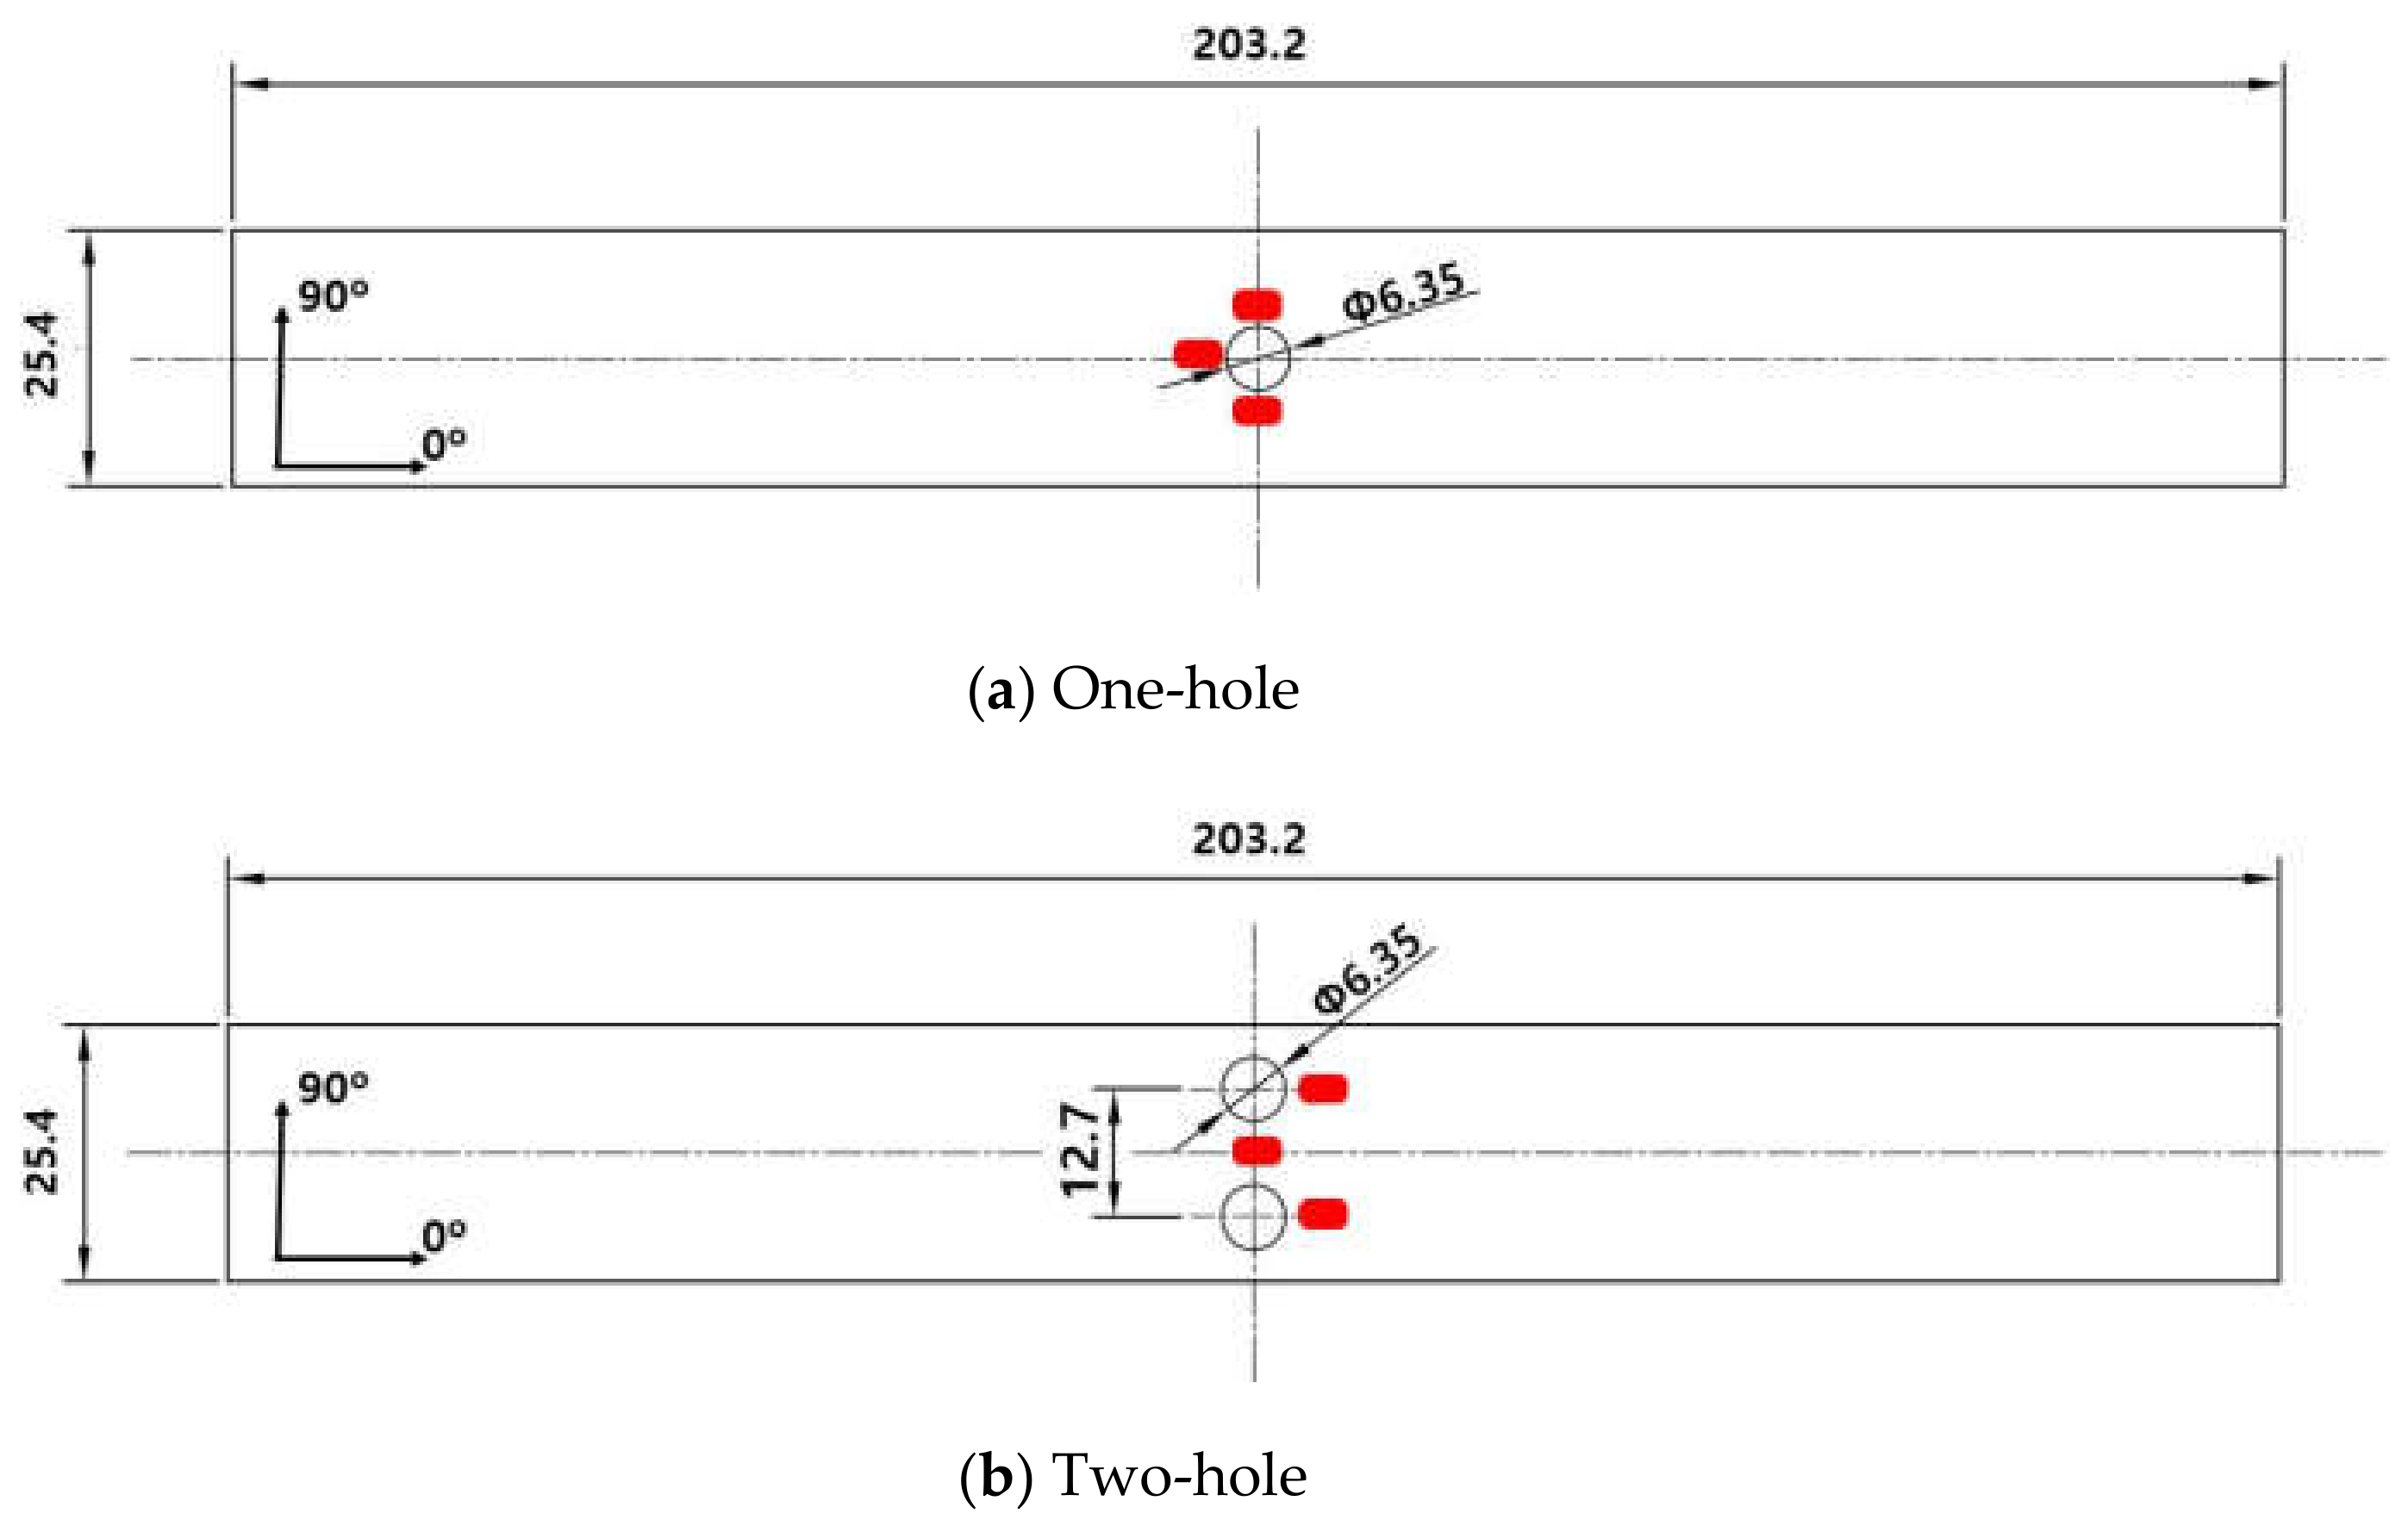
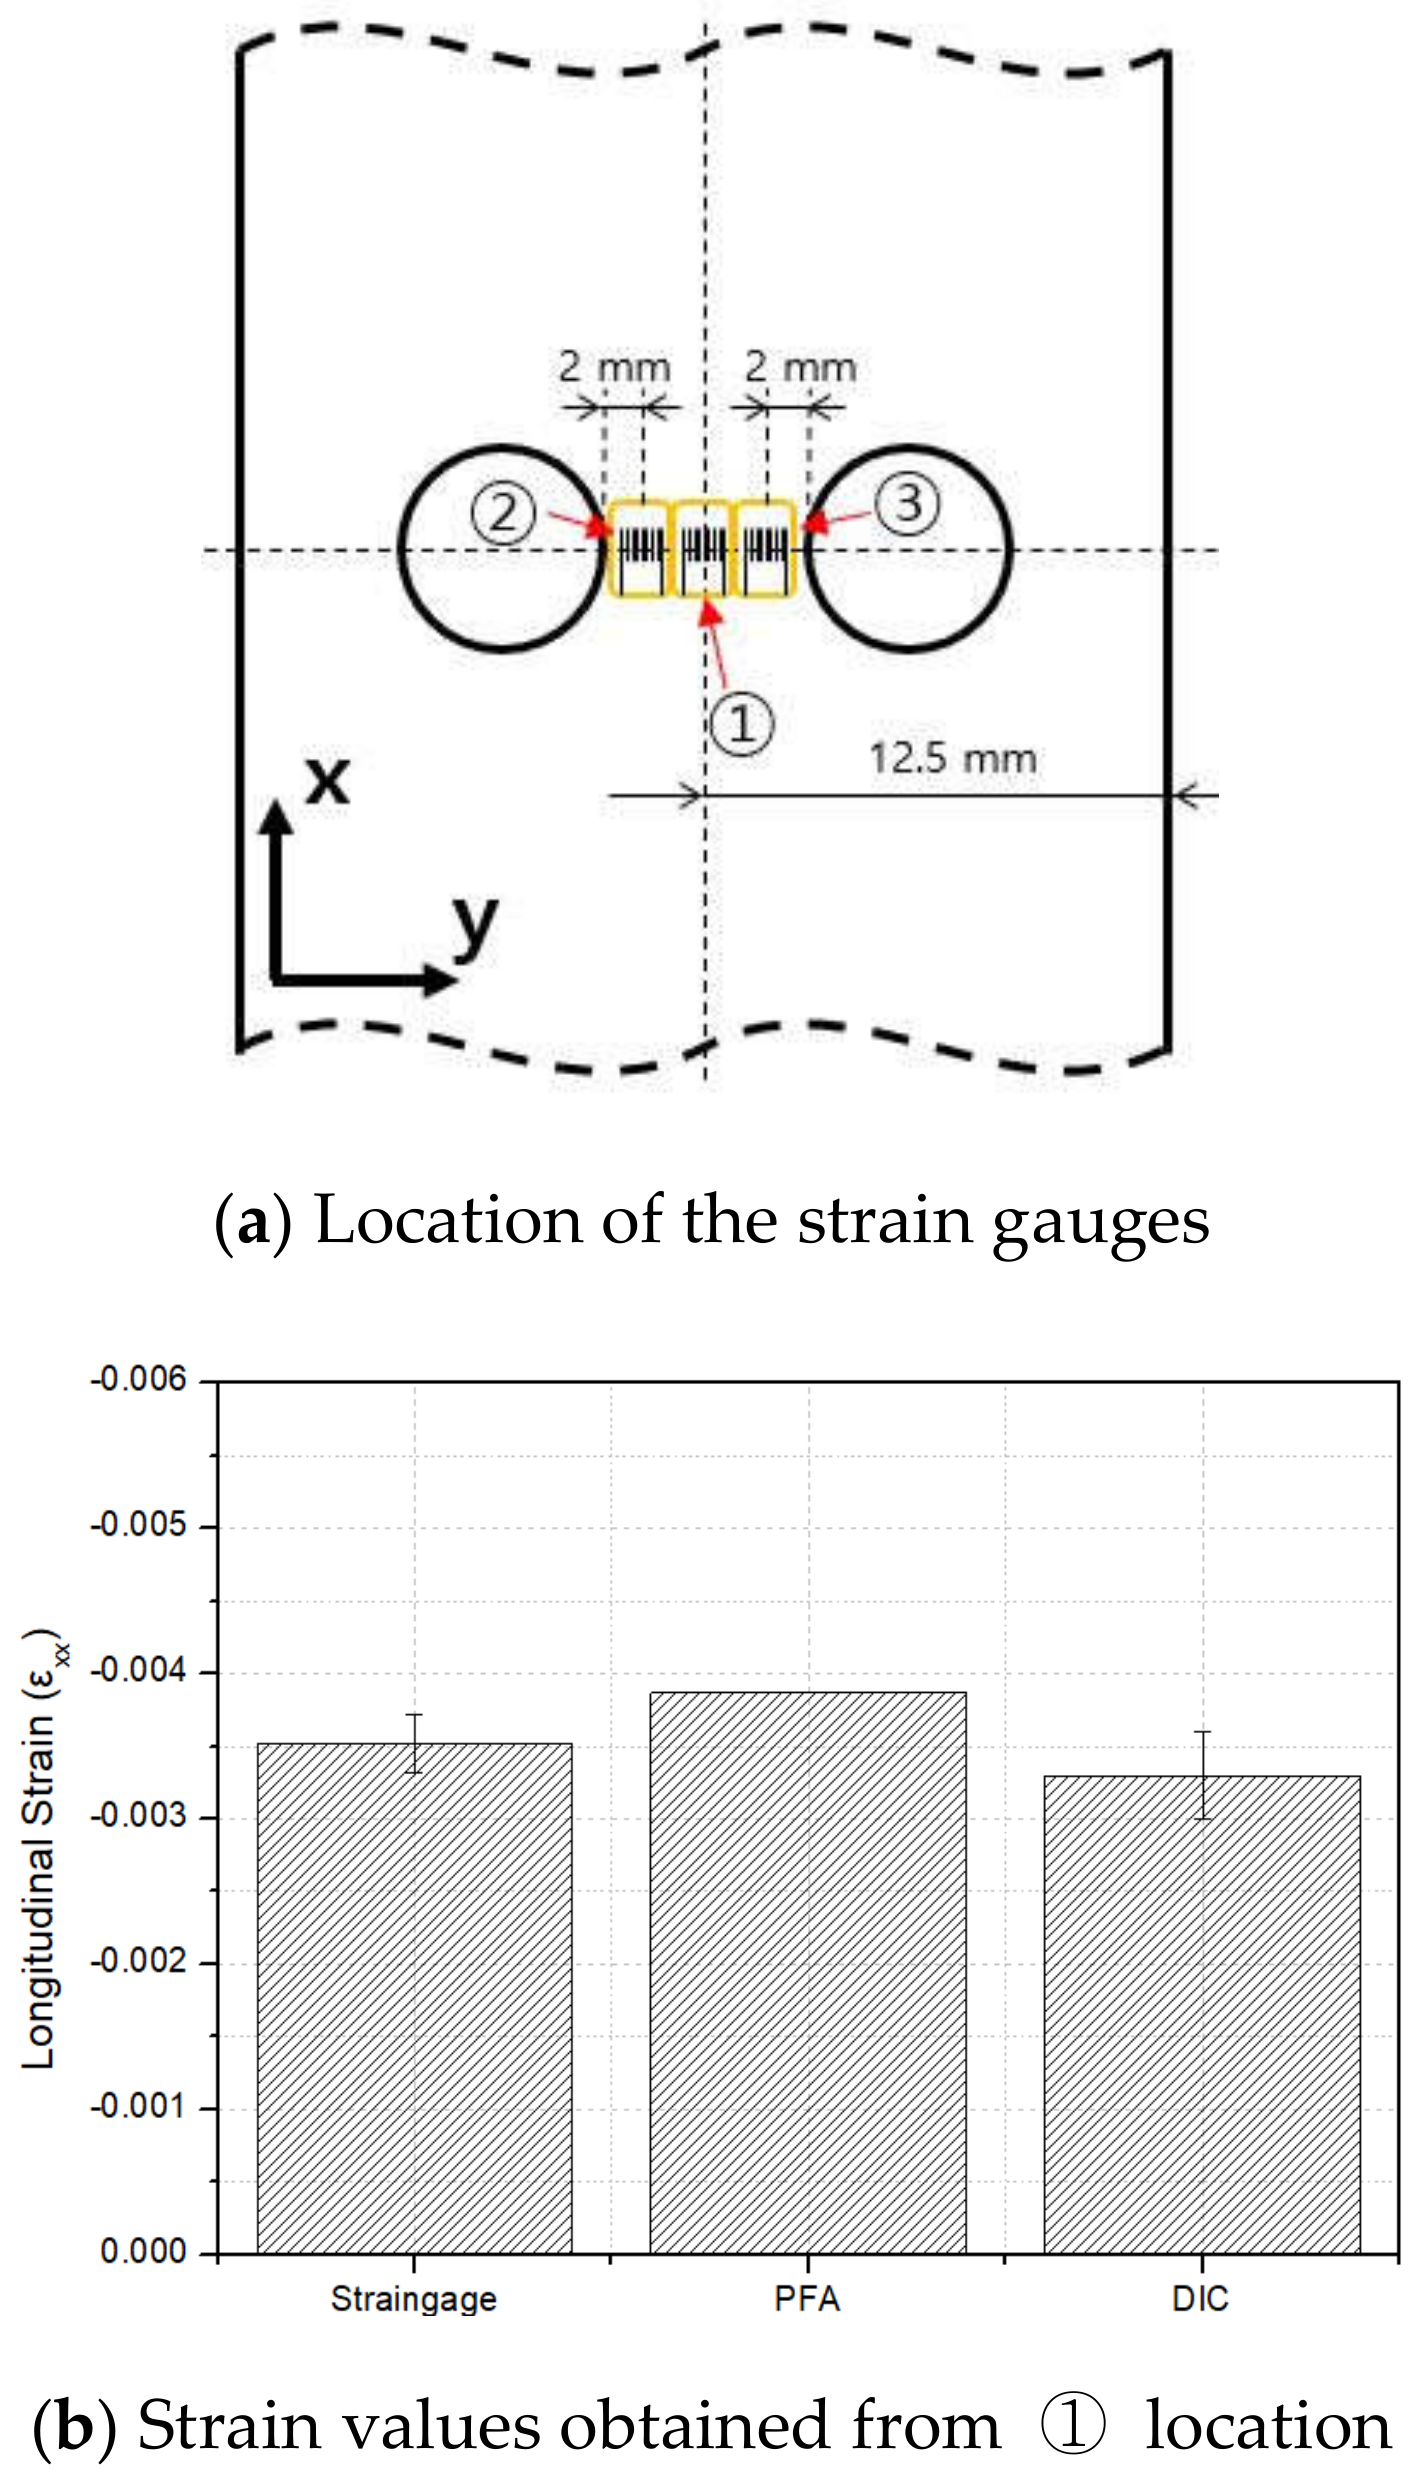
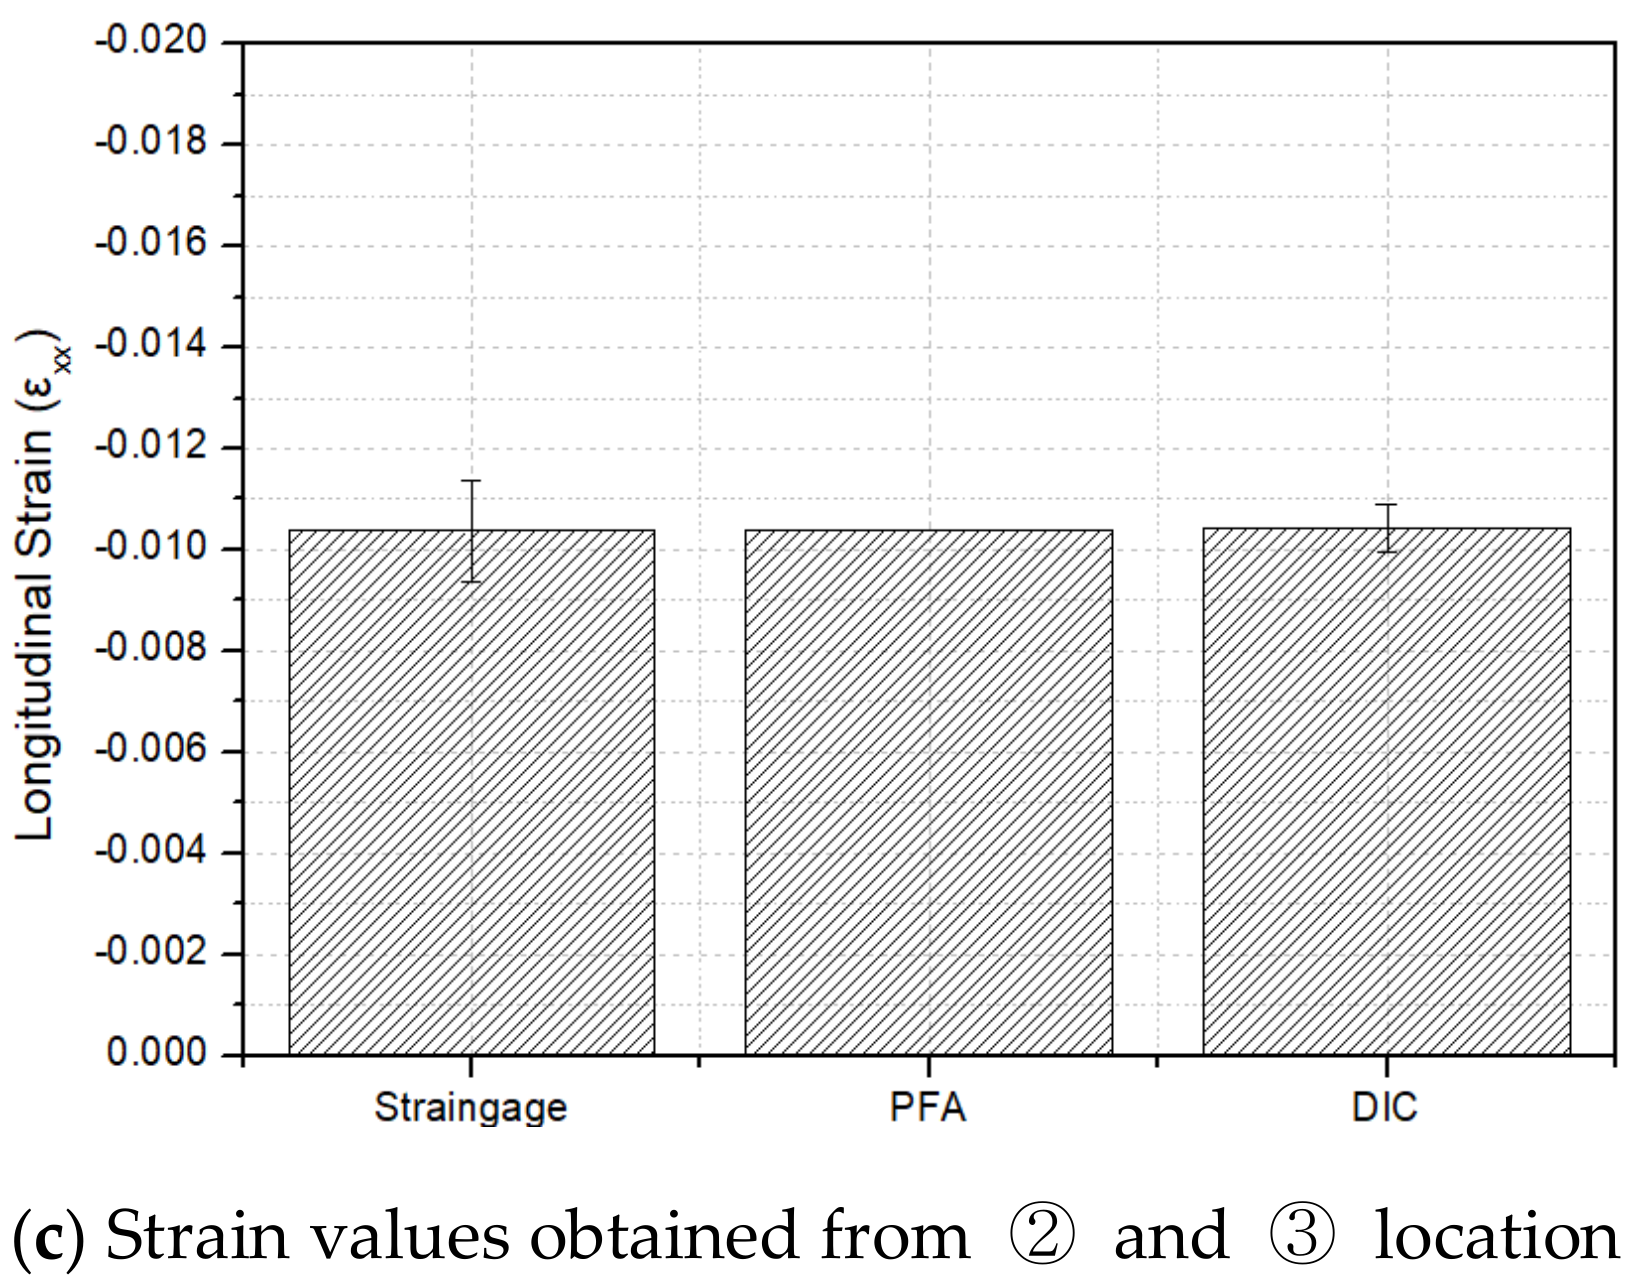
A T700/epoxy composite laminate was used in this study. The mechanical properties of the composite material are shown in Table 1. All the properties were obtained from material tests conducted according to ASTM standards [24,25,26] and some references [27,28,29]. To validate the developed PFA method, tensile and compressive tests were performed for composite laminate specimens with open holes. The test specimen geometry and dimensions are presented in Figure 3. Some strain gauges were attached near the open-hole (2–2.5 mm apart from the hole edge) to measure the longitudinal strain value. The location of the attached strain gauges is illustrated in Figure 3. One of two holes were applied to the composite laminate specimen as a notch. The composite laminate was manufactured with two types of stacking sequences. The stacking conditions are listed in Table 2. The type-2 stacking sequence was only introduced to the one-hole tensile test specimens. A type-1 specimen exhibits a 90-degree orientation ply in the middle of the laminate. The specimens contain eight plies and the measured specimen thickness was 1.2 mm. To apply the DIC method, spackle patterns were introduced on the surface of the specimens.
3.2. Test Procedures
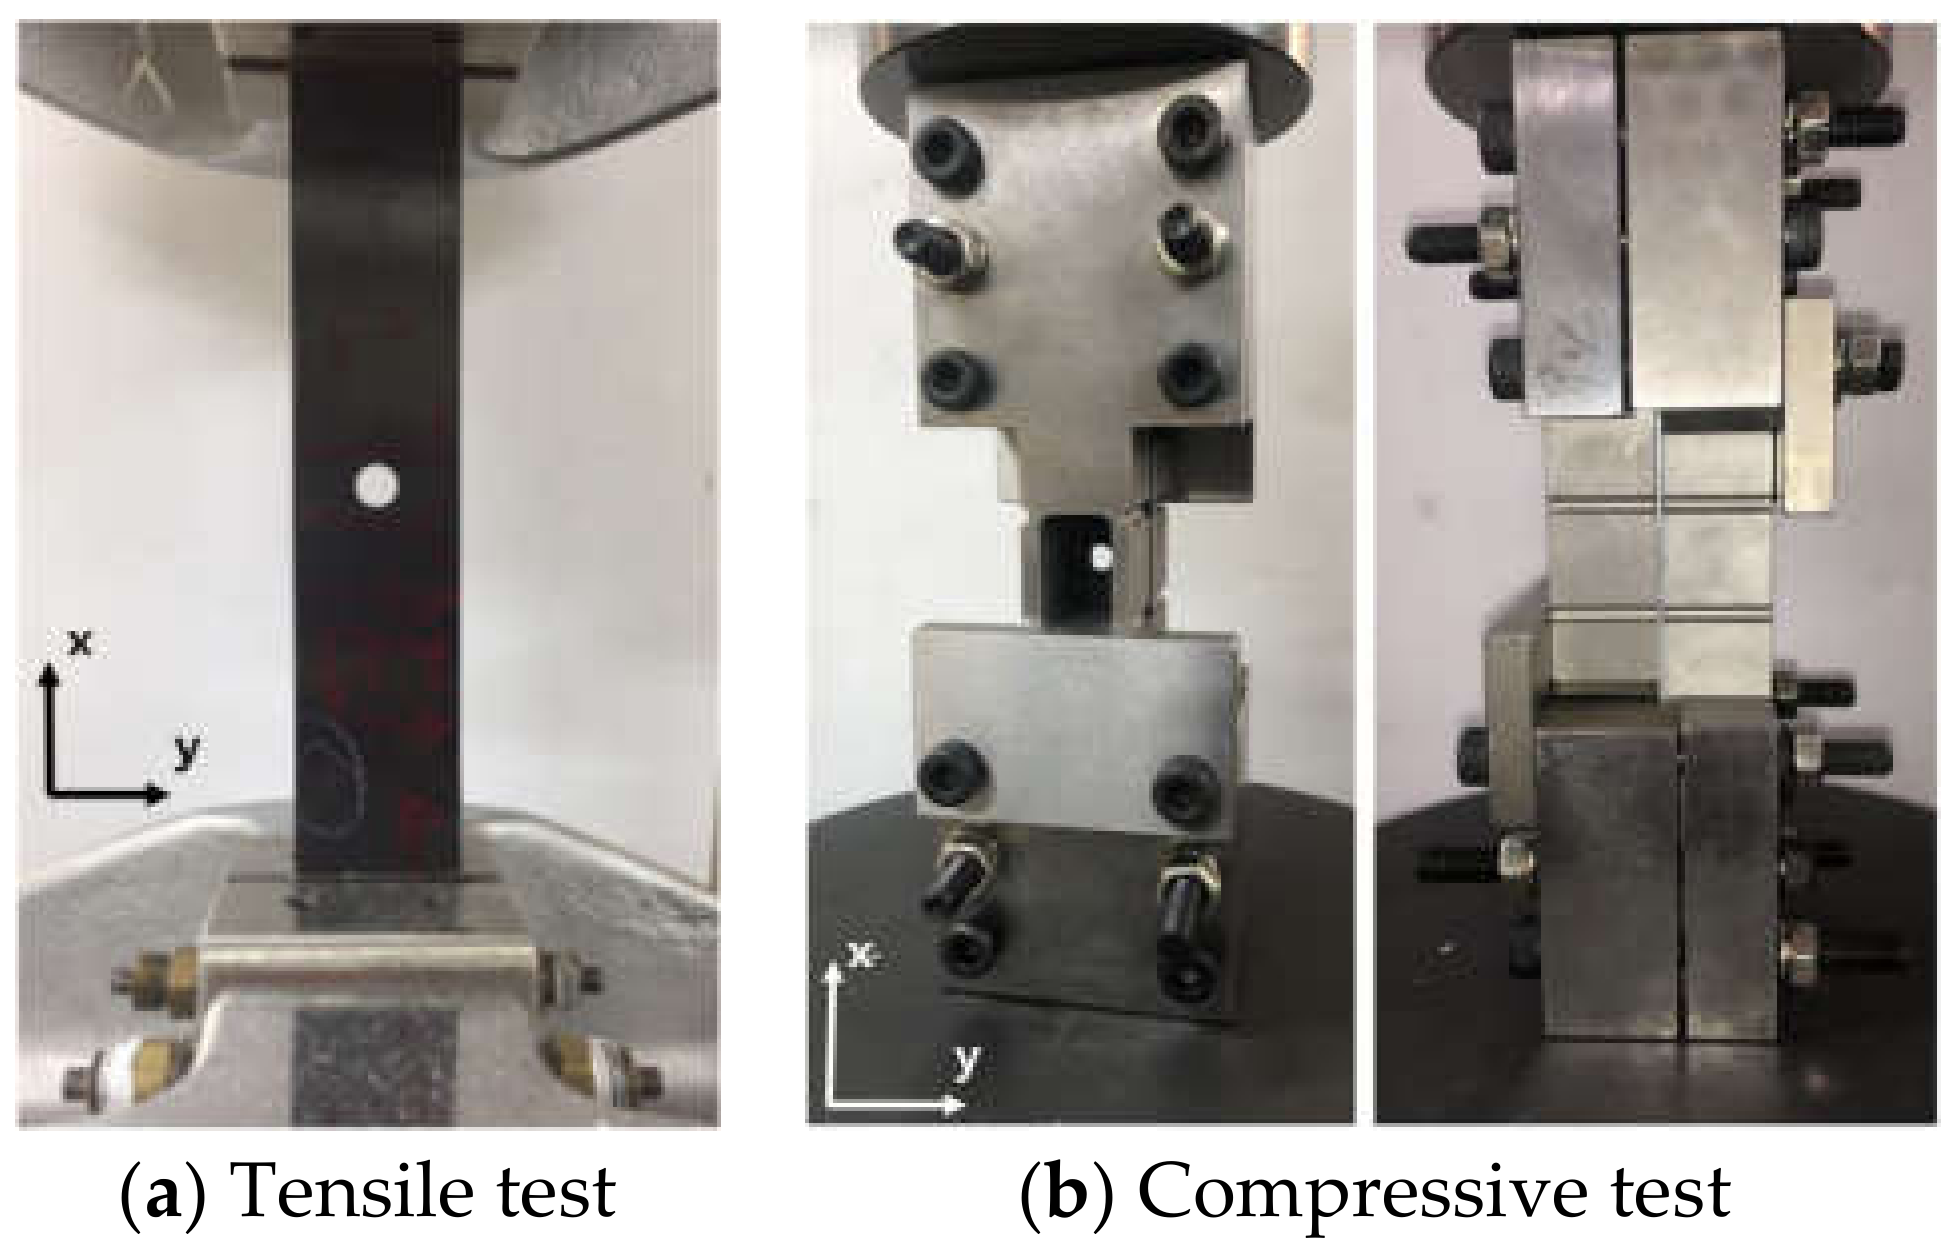
Tensile and compressive tests were performed using the MTS810 hydraulic test machine. A displacement control of 1 mm/min and −2 mm/min were applied to conduct static tensile and compressive tests, respectively. The compressive tests were conducted according to ASTM D6484 [30]. The standard suggests that these procedures perform the open-hole composite compressive tests without buckling the specimen. The designed test fixture according to the standard is shown in Figure 4b. The support parts of the fixture were assembled using bolts. The bolts were fixed at 7 N-m according to the method given in the standard. The test configuration for the tensile and compressive tests is presented in Figure 4. During the test, a CCD camera was used to capture the images of the specimen until the test was completed. The captured images were used to perform DIC. The DIC analysis was conducted using the VIC-2D software program. Through the DIC method, the strain field of the specimen surface that varies during the test can be obtained. Strain measurement was conducted using strain gauges as well as the DIC method. The strains measured by the gauge and DIC were compared. The reason for performing strain measurements is to compare the results with the PFA results. The strain gauge data sampling, load data sampling, and image capture rates were set to 100 Hz.
3.3. FEM Procedures
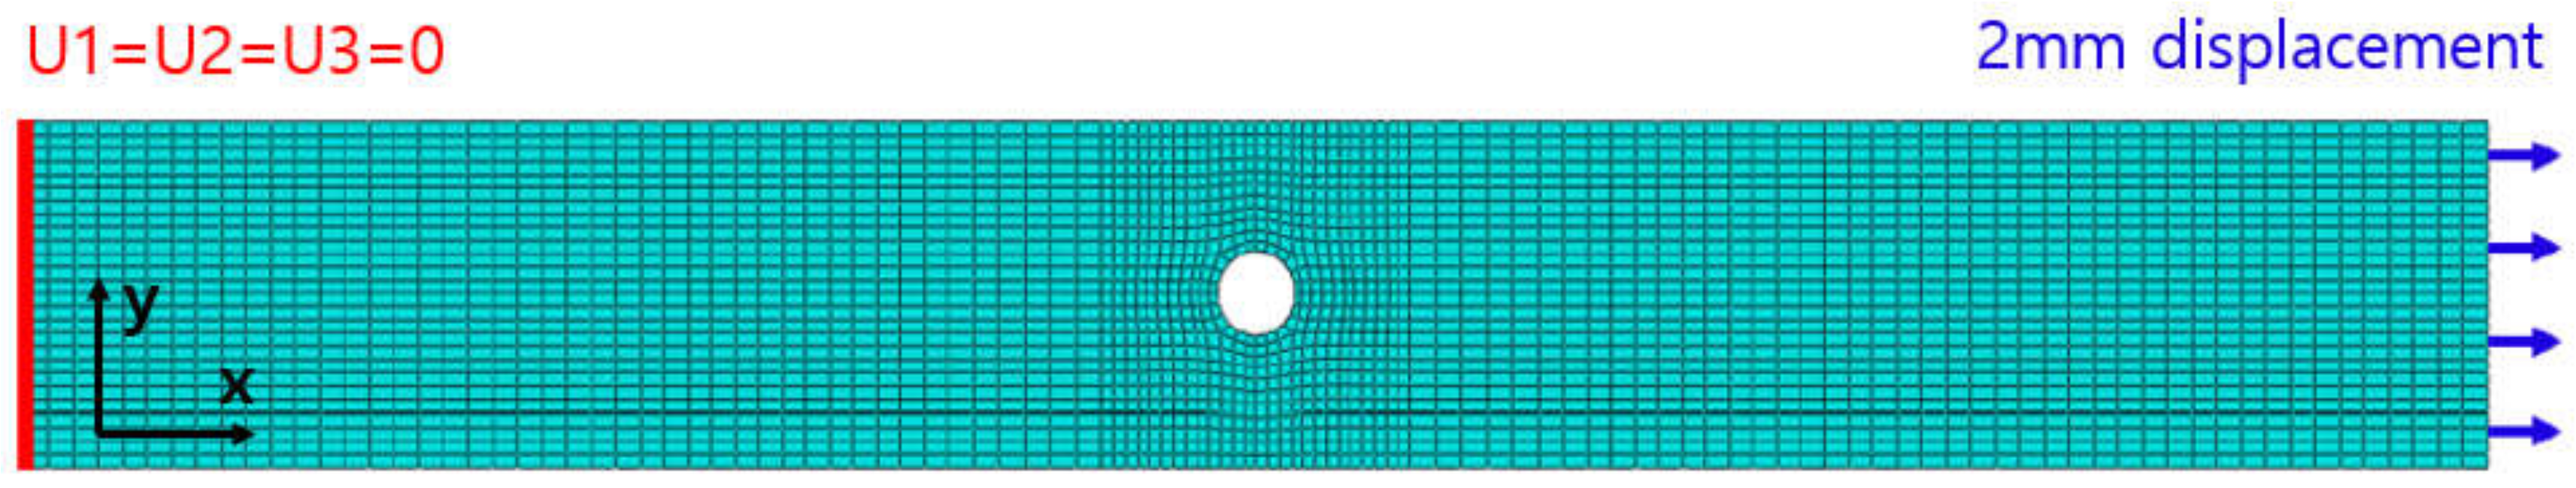
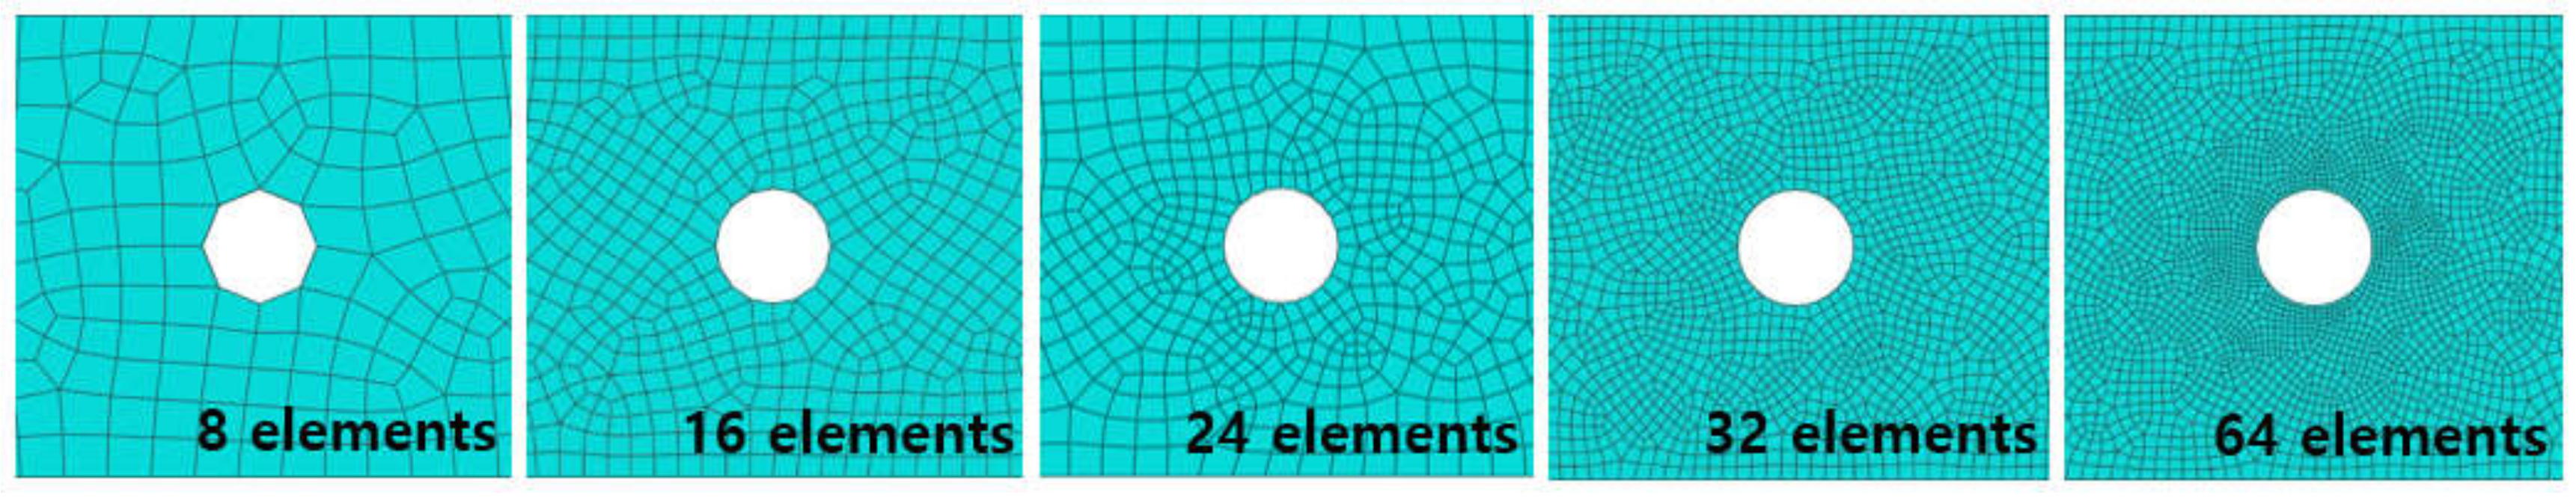
Three-dimensional FEM analysis was conducted using the commercial software program ABAQUS. To perform PFA, a UMAT code was developed and applied to the FEM procedure. The material properties obtained from the experimental results were introduced, and the stacking sequences were arranged according to the specimen type as depicted in Table 1 and Table 2. The linear hexahedral C3D8 element was used to construct the model, which is displayed in Figure 5. For the tensile test, the left side of the model was fixed, and a 2 mm displacement was applied to the right side of the model. For the compressive test, the out-of-plane displacement was constrained while following ASTM D6484. In addition, the applied displacement at the right edge was changed to −2 mm. To verify the mesh dependency of the PFA results, the mesh numbers were controlled near the open hole, as shown in Figure 6.
4. Results
4.1. Mesh Dependency Study
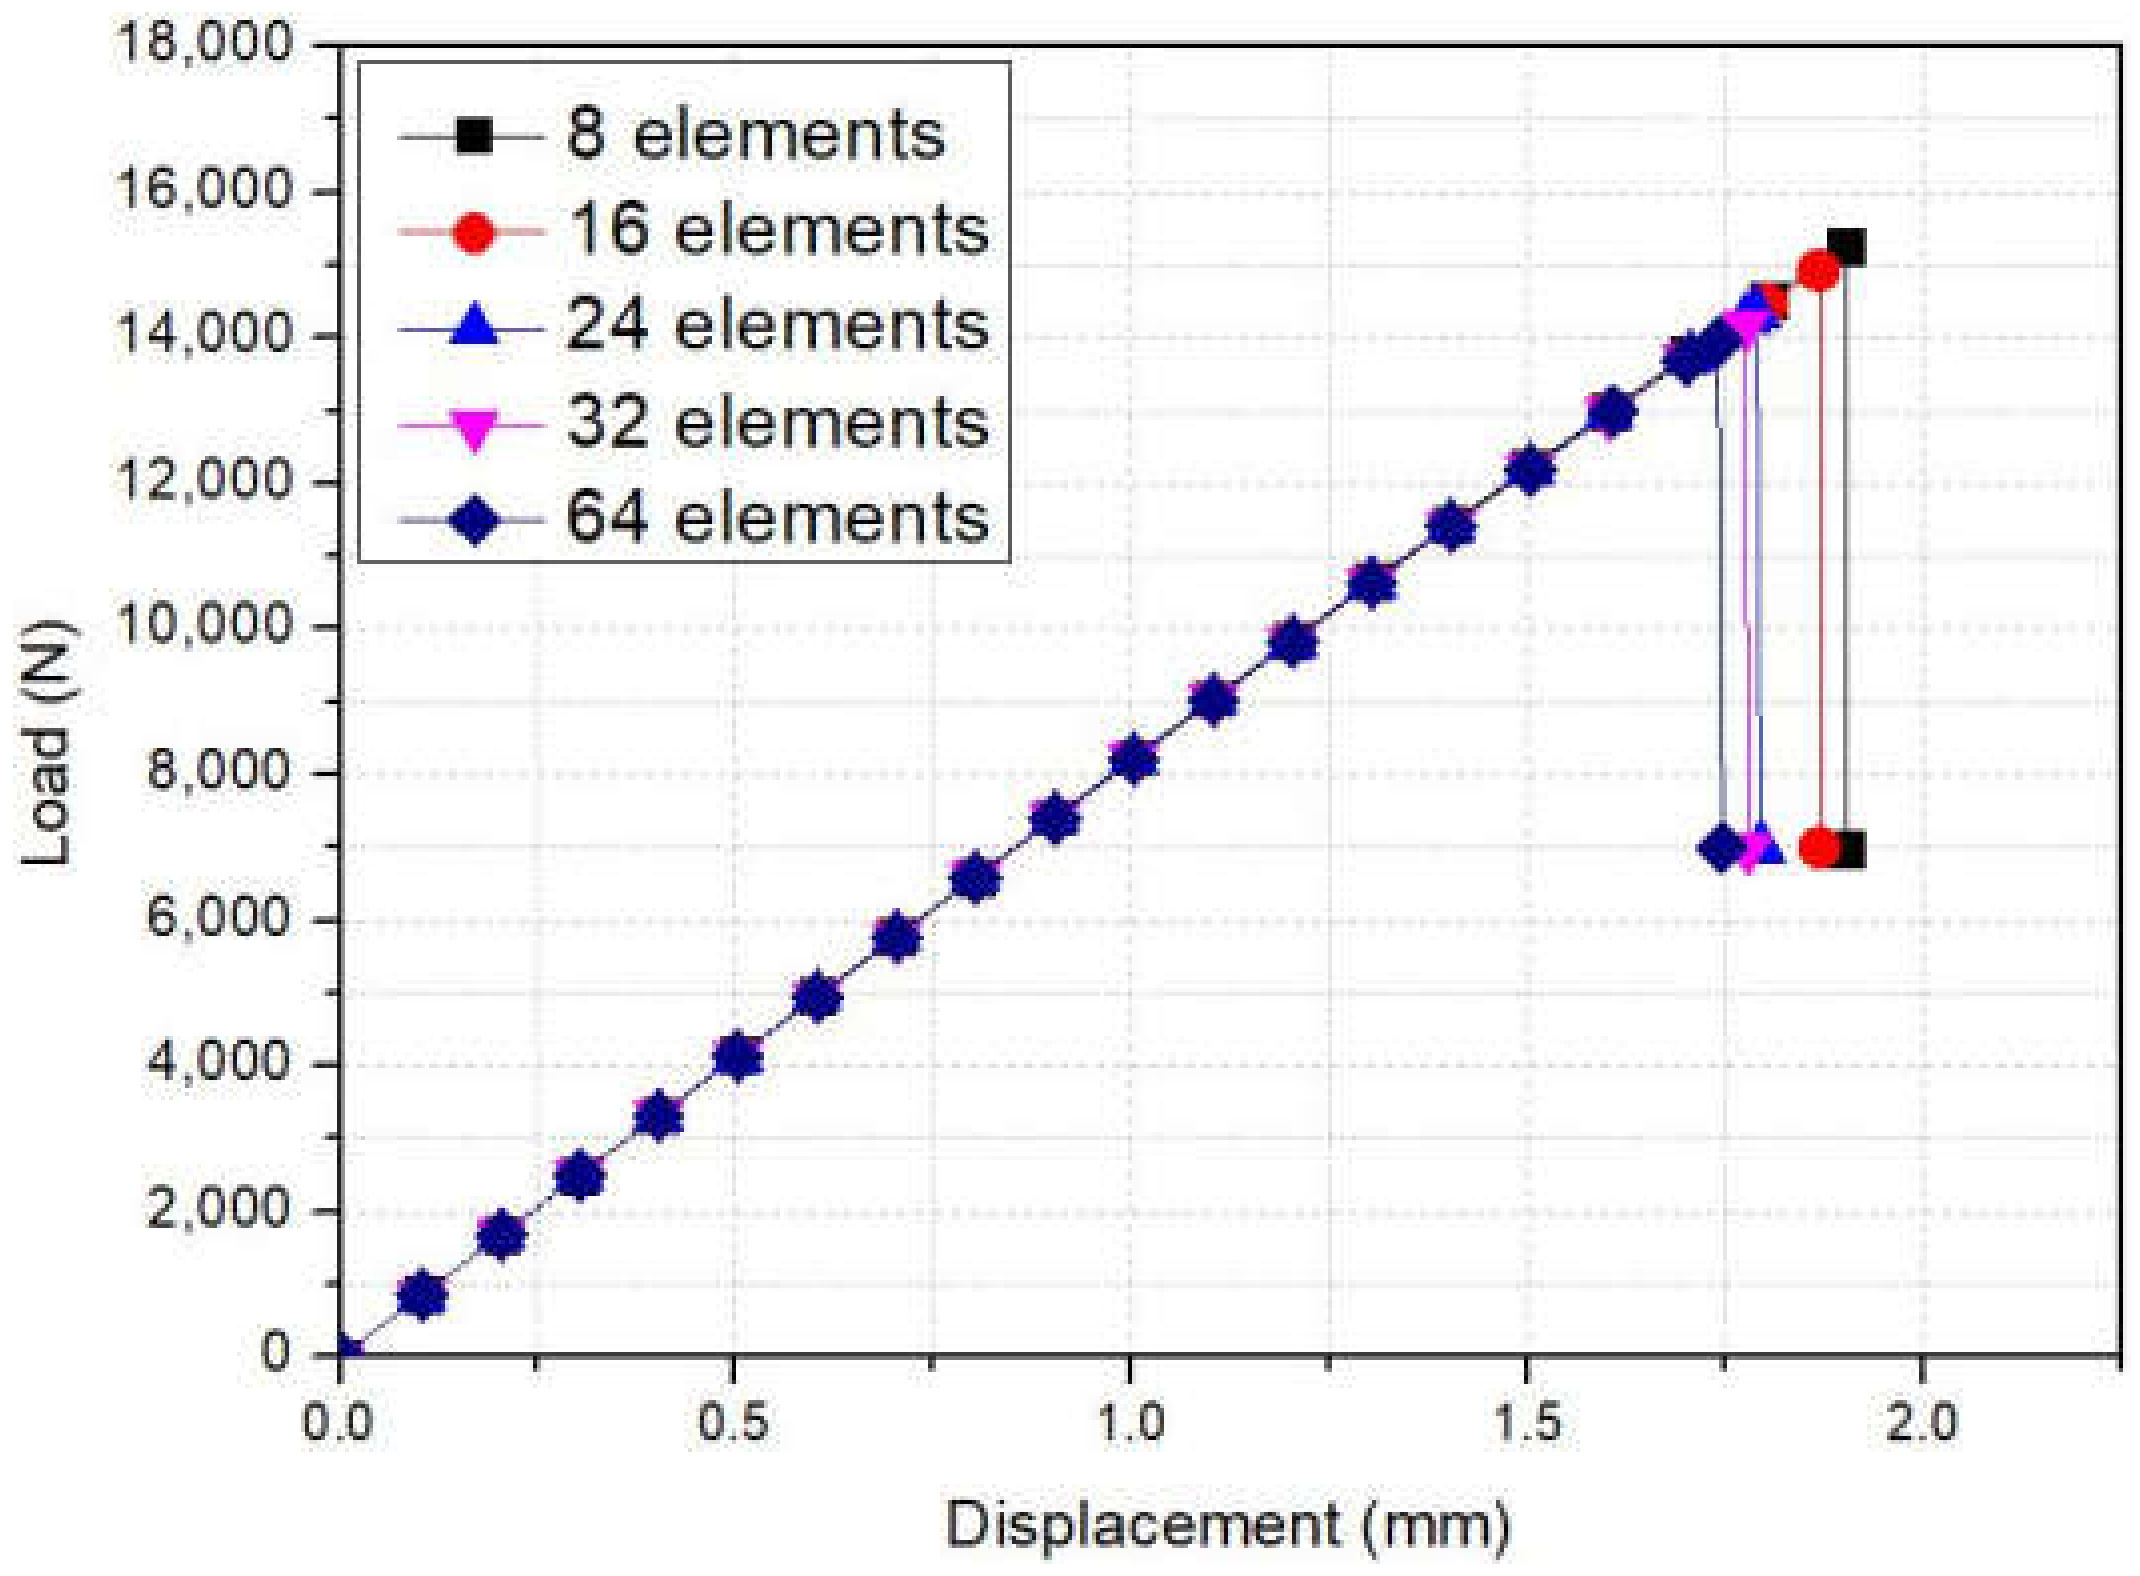
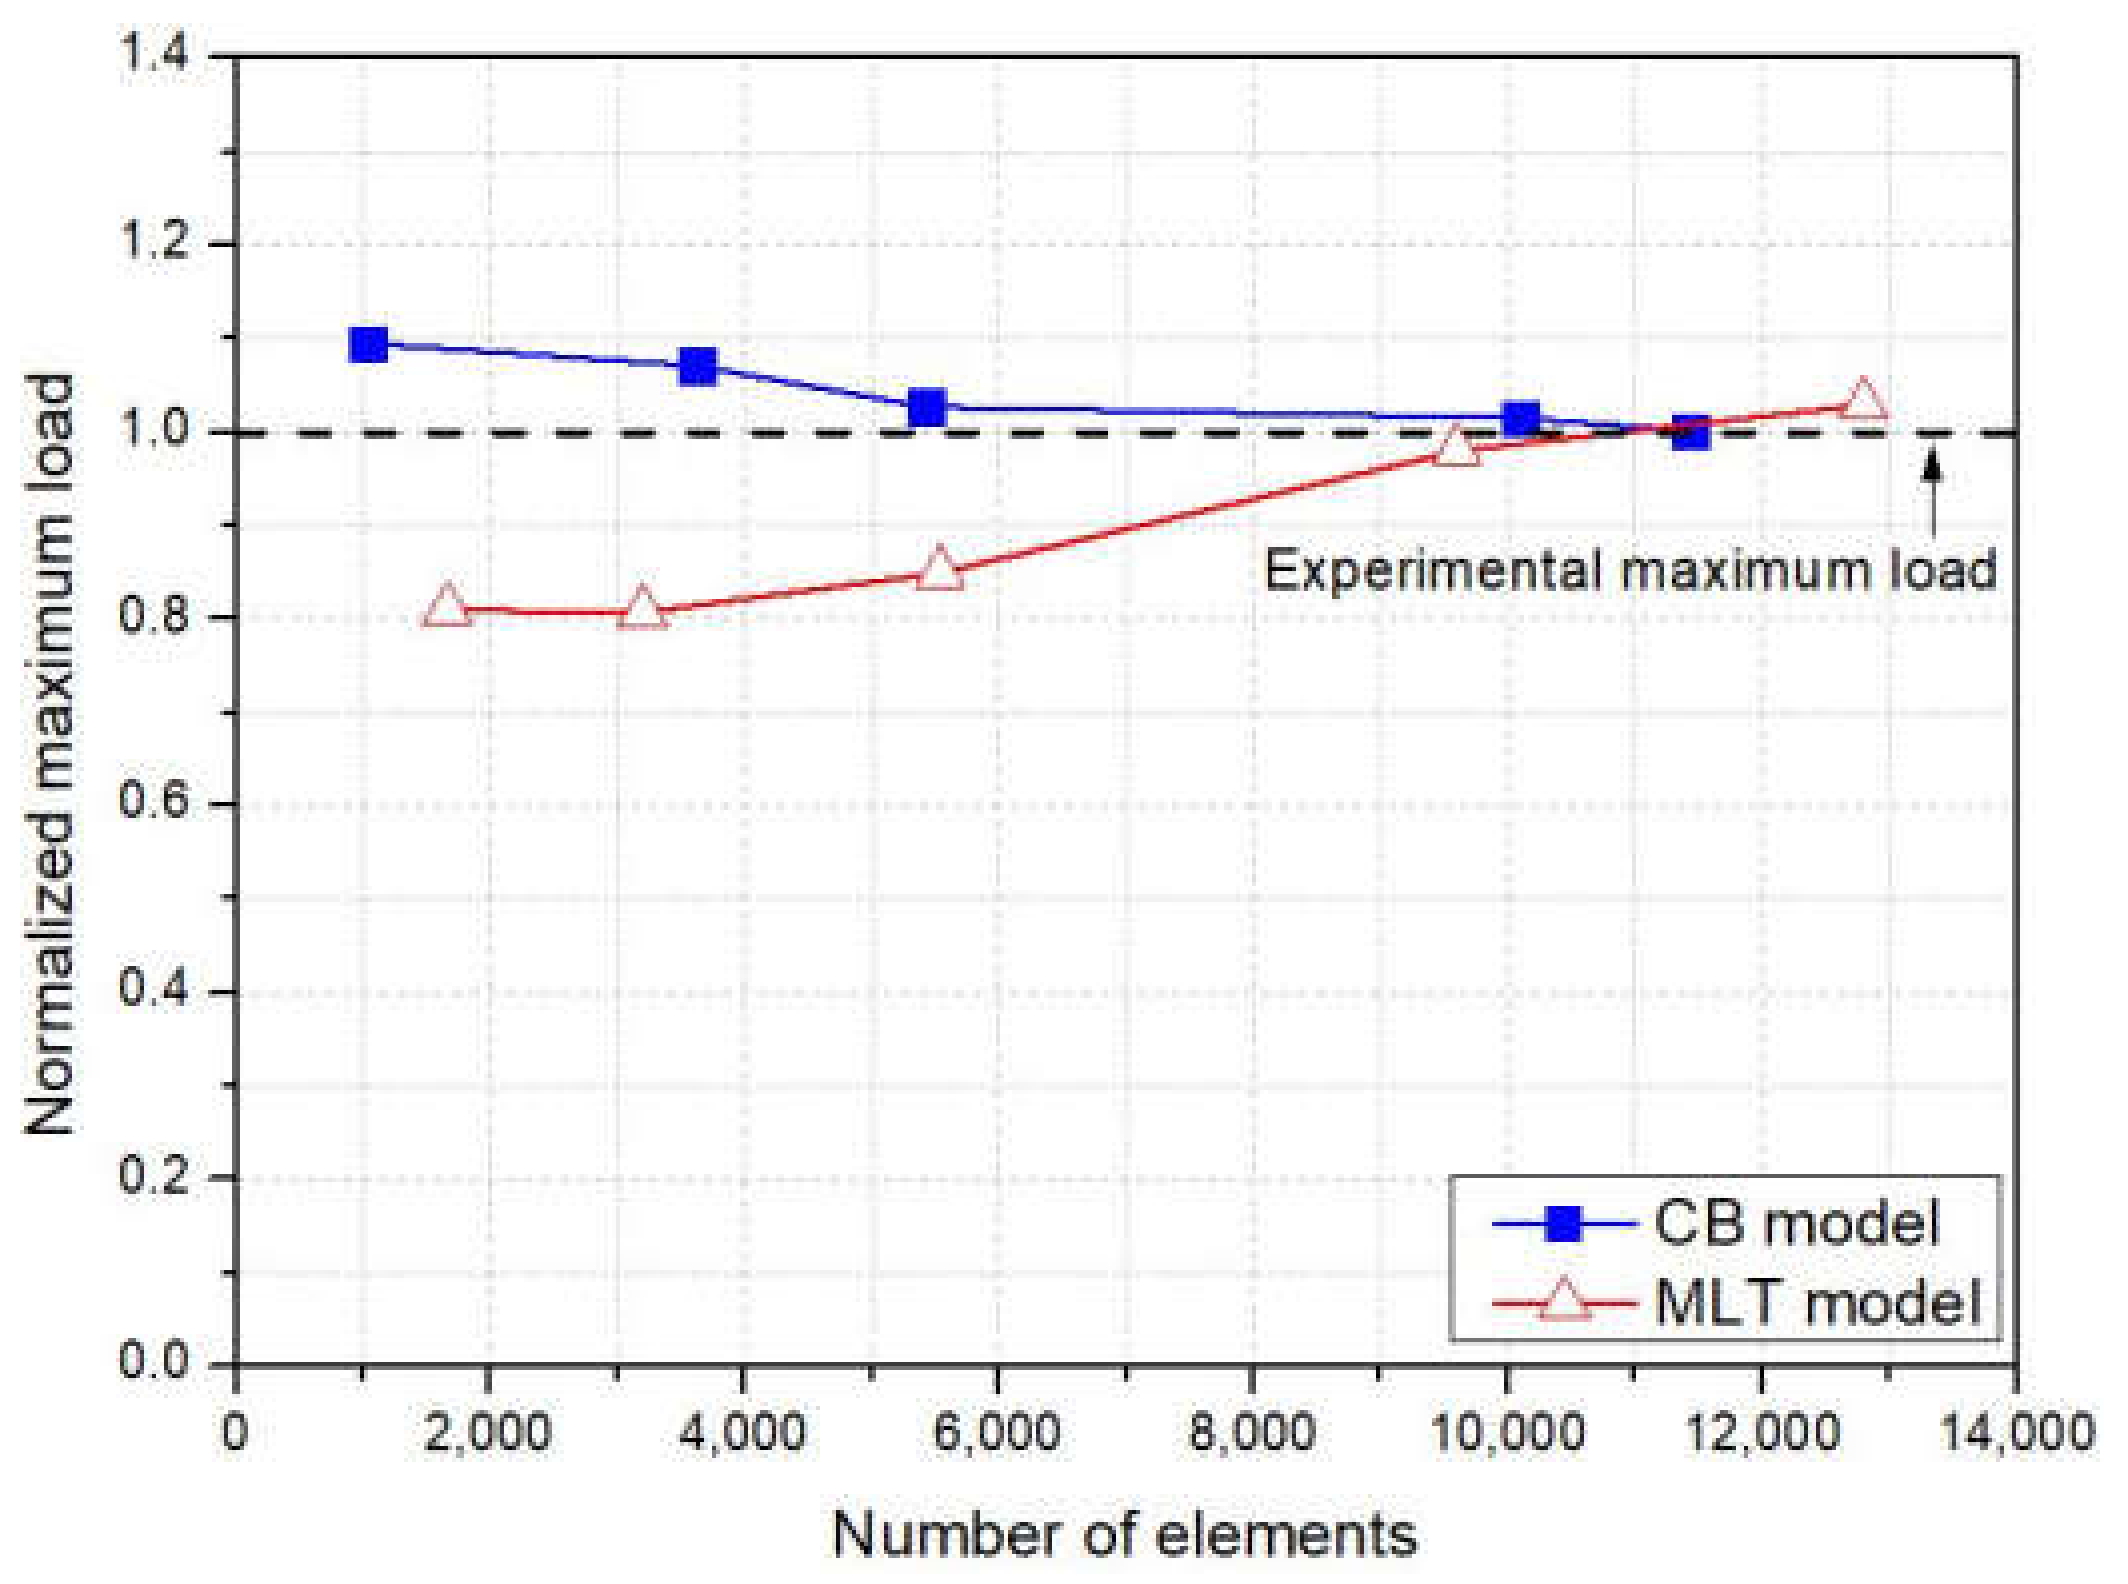
Figure 7 shows the load-displacement curves of the PFA results with different mesh cases explained in Section 3.3. The crack band (CB) model applied PFA (CB-PFA) shows less influence with mesh dependency. This is because the elements of the model are fractured, and the fracture energies are the same in each failure mode (fiber tension/compression, matrix tension/compression) [7]. Figure 8 shows the normalized maximum load variation according to the total number of elements of the PFA model conducted with the CB and MLT model, respectively. The MLT model implemented PFA (MLT-PFA) [1] is the most commonly known PFA model, and this has been used in various studies [2,31,32,33]. The normalized maximum load was calculated by dividing the predicted load by the experimental load. As shown in Figure 7, despite the difference of 11 times the number of elements, only 8.5% of the maximum load error was observed in the CB-PFA model. For the quantitative study, this was compared to the results obtained from the MLT-PFA model. The results of the MLT-PFA model showed an error up to 10% in comparison to the CB-PFA model even though the number of elements was similar to the CB-PFA model. As the results converged towards the experimental results, the CB-PFA model results displayed lower errors than the MLT-PFA model. The small mesh dependence of the CB-PFA model results from the damage variable were calculated using the CB model. In the damage variable, the equivalent displacement at the final failure state was calculated in consideration of the fracture energy of the material (Equation (9)), and the fracture energies at each failure mode had a constant value. Therefore, each element failed when considering the constant fracture energy regardless of the element size. As a result, the PFA model of this study has less mesh dependency. The small errors were induced from the difference in the element aspect ratio in CB-PFA model [7,8].
4.2. Evaluation of Load-Displacement Behavior
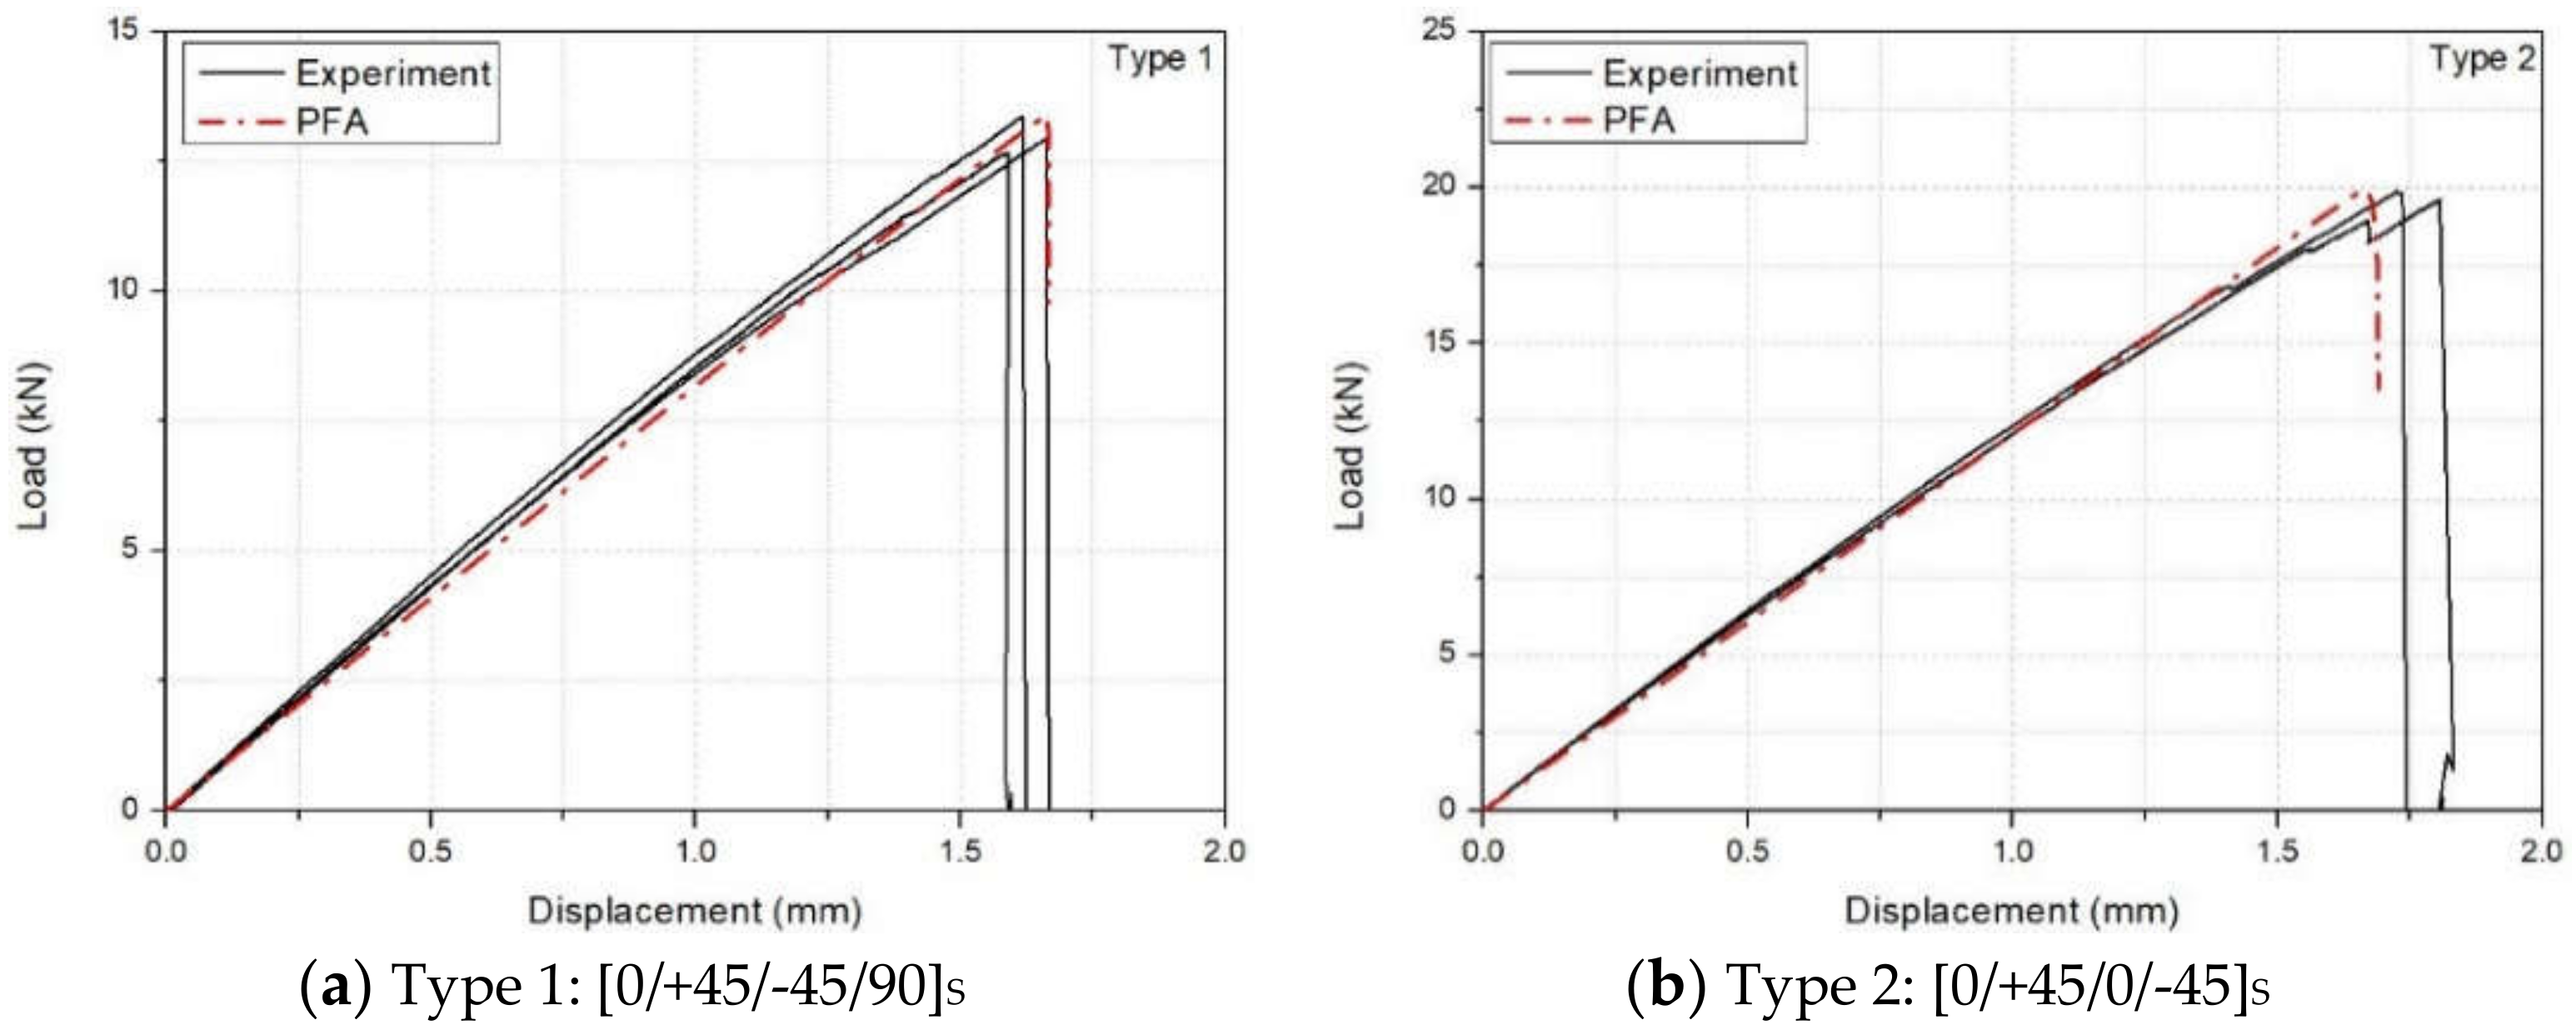
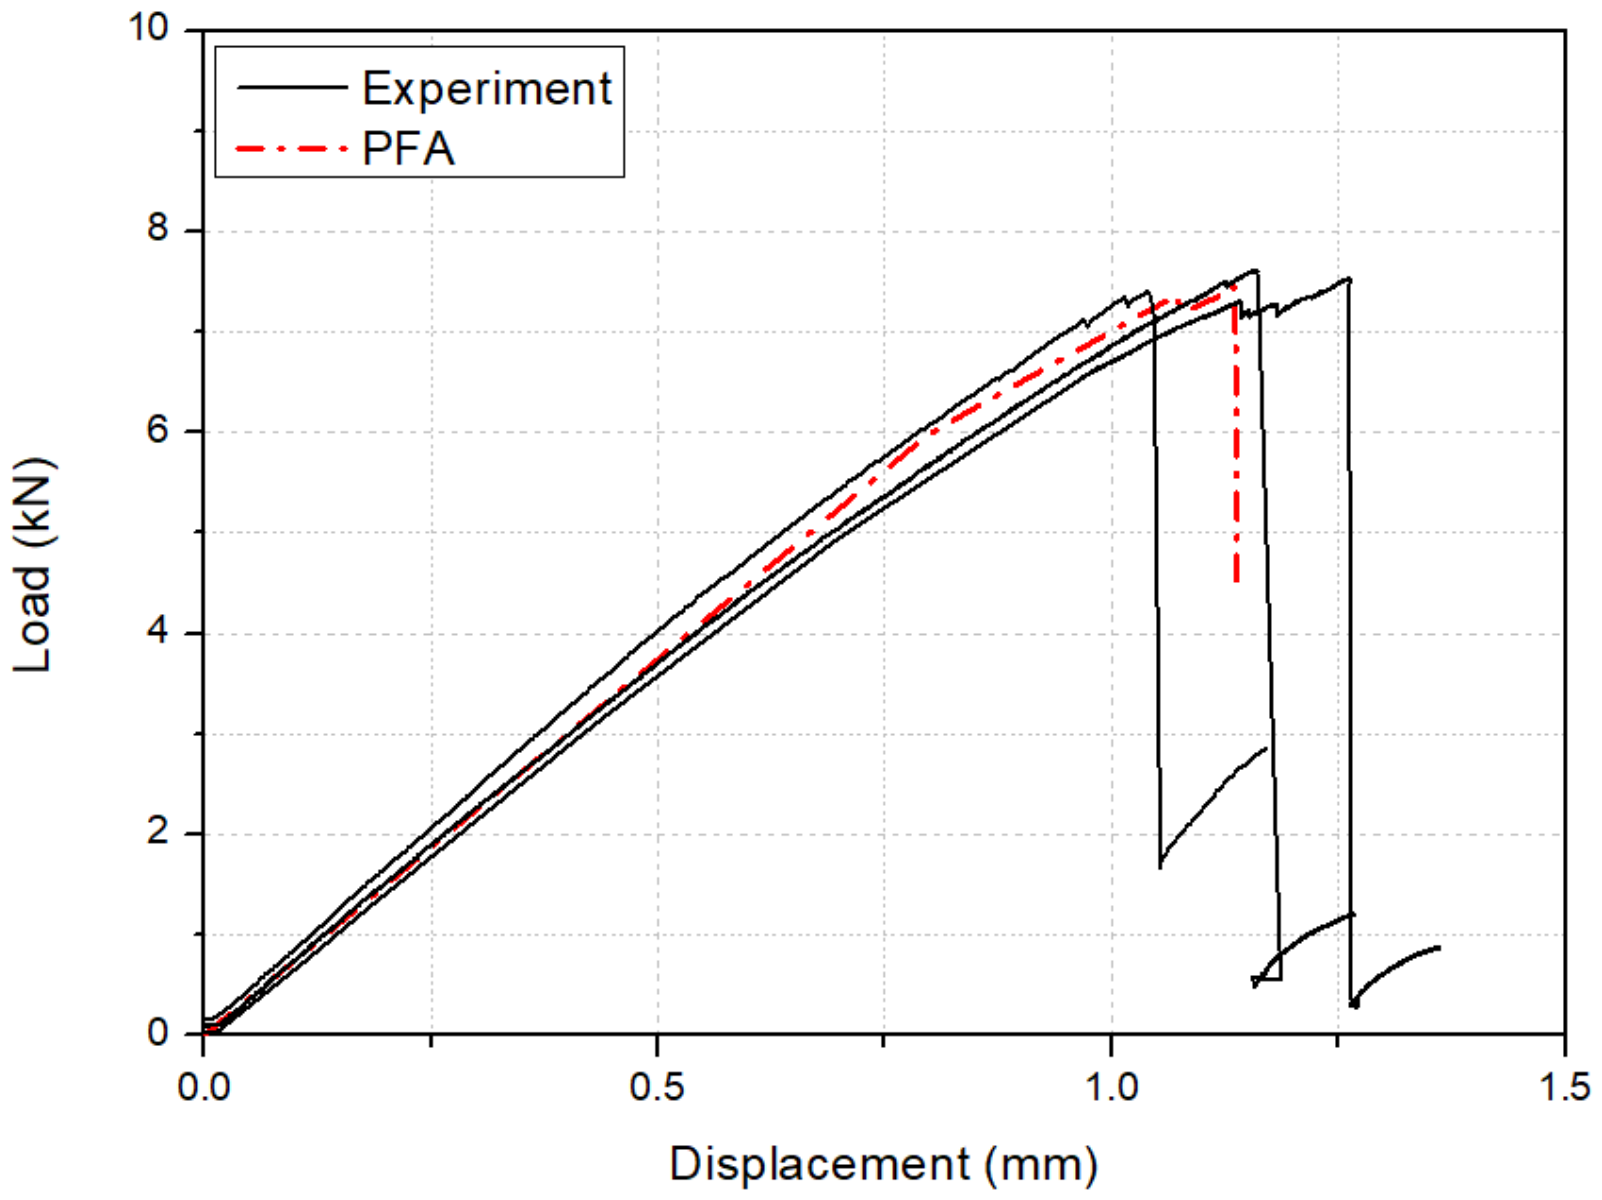
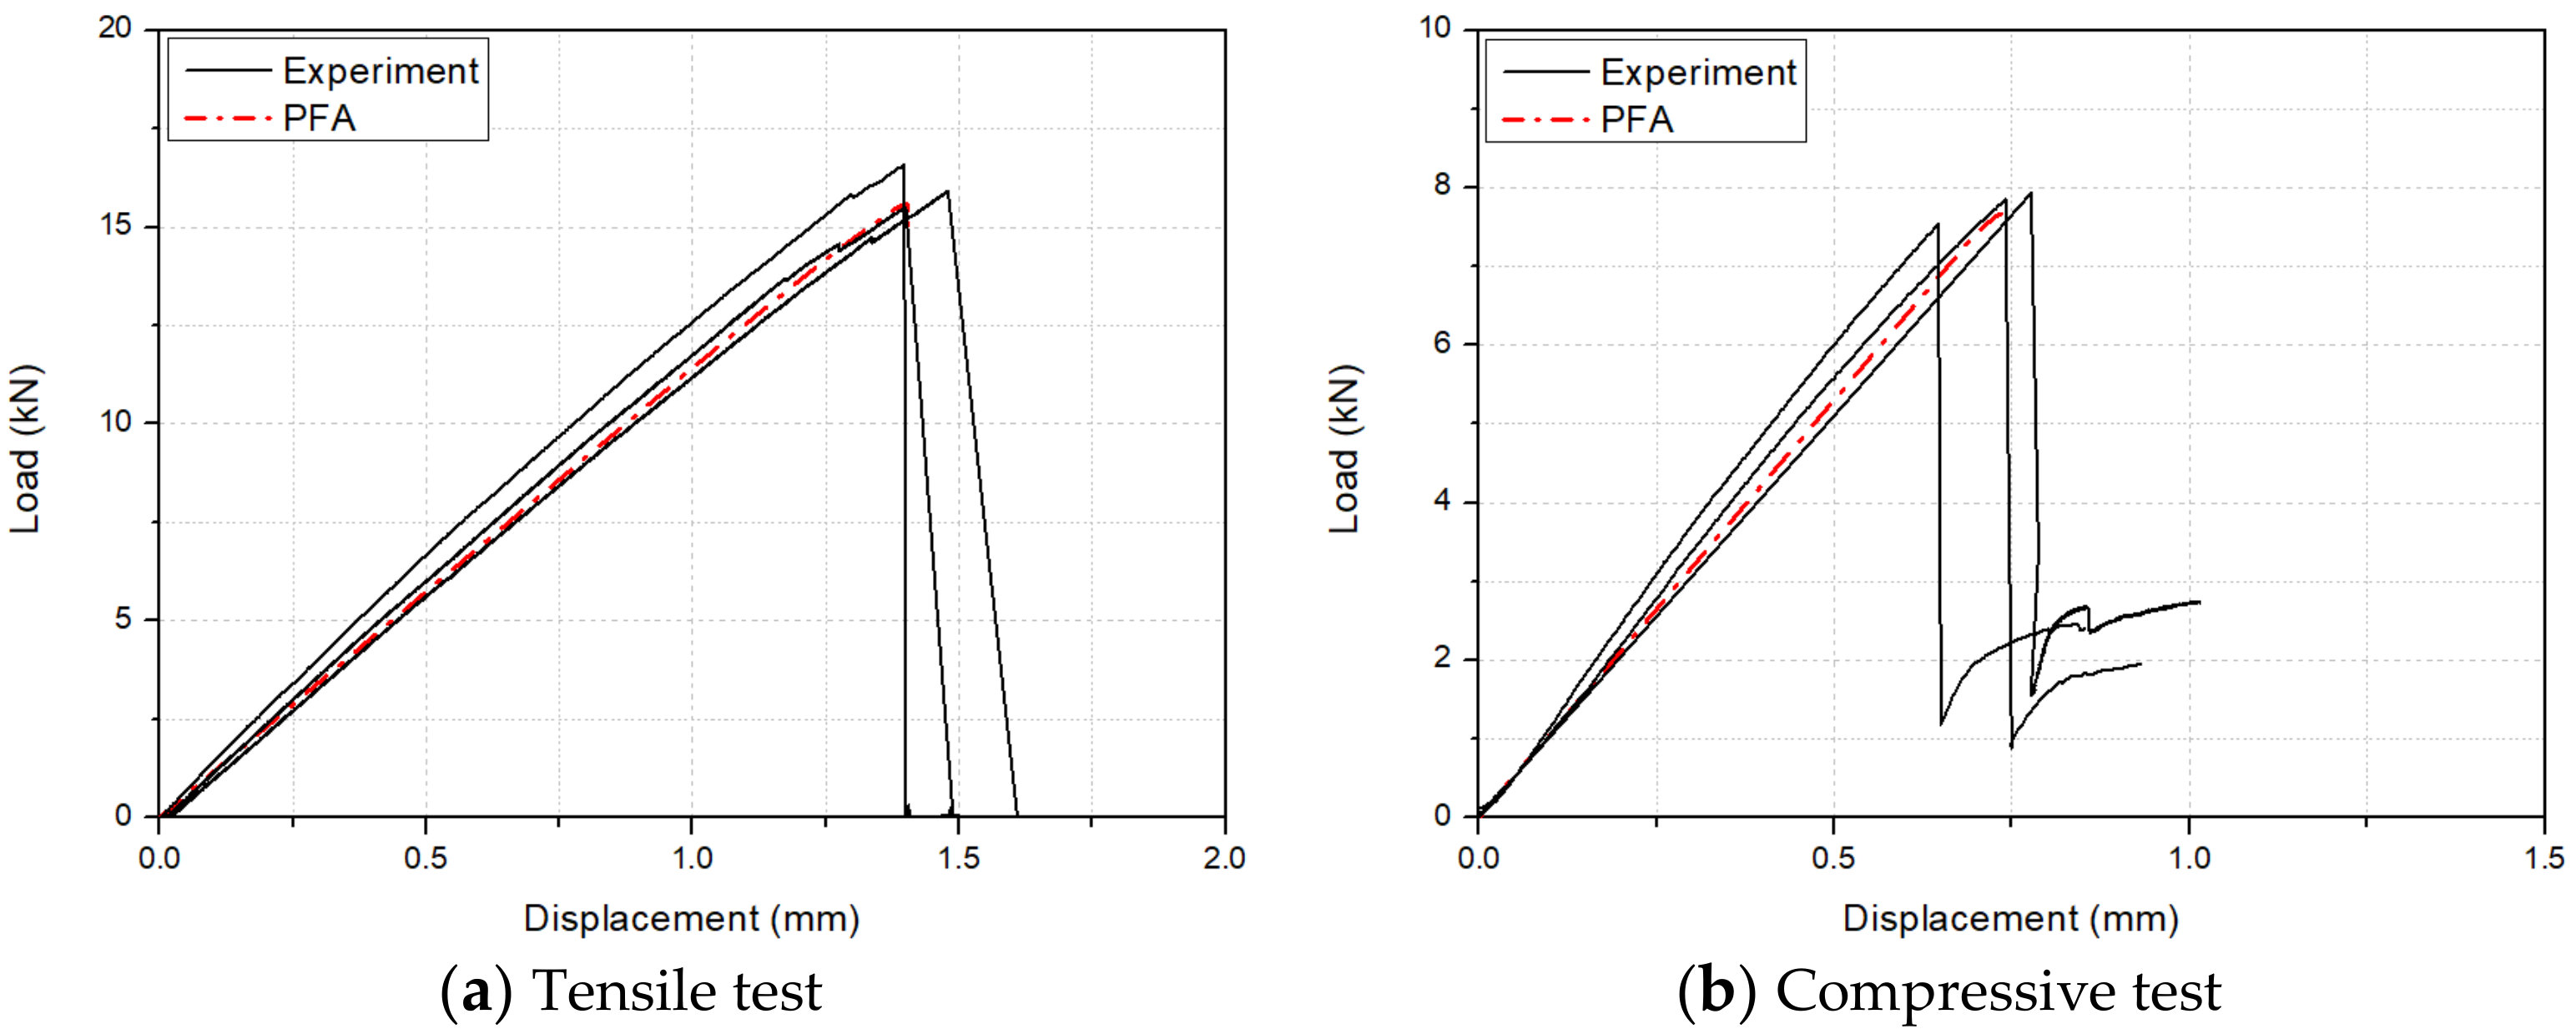
Figure 9 illustrates the tensile load-displacement results of the one-open-hole tensile tests and the PFA. Composite specimens that were fractured at the end demonstrated a sudden decrease in the tensile load. The maximum load of type-1 is lower than type-2; this is because a type-1 specimen contains 90-degree plies in the middle of the laminate. The PFA results indicate the stiffness of the composite material well. The maximum load difference between the experiment and the PFA results was only 2.30% and 0.59% for the type-1 and type-2 specimens, respectively. The stiffness and strength were predicted for all of the specimen cases. This indicates that the suggested PFA model can be applied regardless of the specimen stacking sequence. Figure 10 presents the compressive load-displacement results of the one-open-hole compressive tests and the PFA. The compressive tests displayed a greater variation in the stiffness than the tensile tests. The variation can be induced from the test set-up when assembling the parts of the test fixtures. The predicted stiffness and strength using the PFA was in good agreement with the experimental results. The maximum load difference between the PFA and the experiment results was 1.30%. The small difference shows that the suggested PFA model predicts the compressive strength of the open-hole composite laminate accurately. To evaluate the PFA model with a notch effect, two-open-hole composite laminates were tested. Figure 11 shows the test and analysis results for the two-open-hole composite specimens under the tensile and compressive loading conditions. Similar to the one-open-hole cases, the suggested PFA model accurately predicted the stiffness and strength regardless of the loading conditions. The PFA model predicted the strength accurately in the range of 2.58% and 0.79%, respectively, under tensile and compressive loading conditions. The stiffness values were also accurately predicted in the range of 3.47% for the tensile test condition and 3.15% for compressive test condition. These results show that the developed PFA model can predict the strength and stiffness of the composite laminate accurately regardless of the stacking sequence, load direction condition, and notch effect.
4.3. Evaluation of Strain Behavior
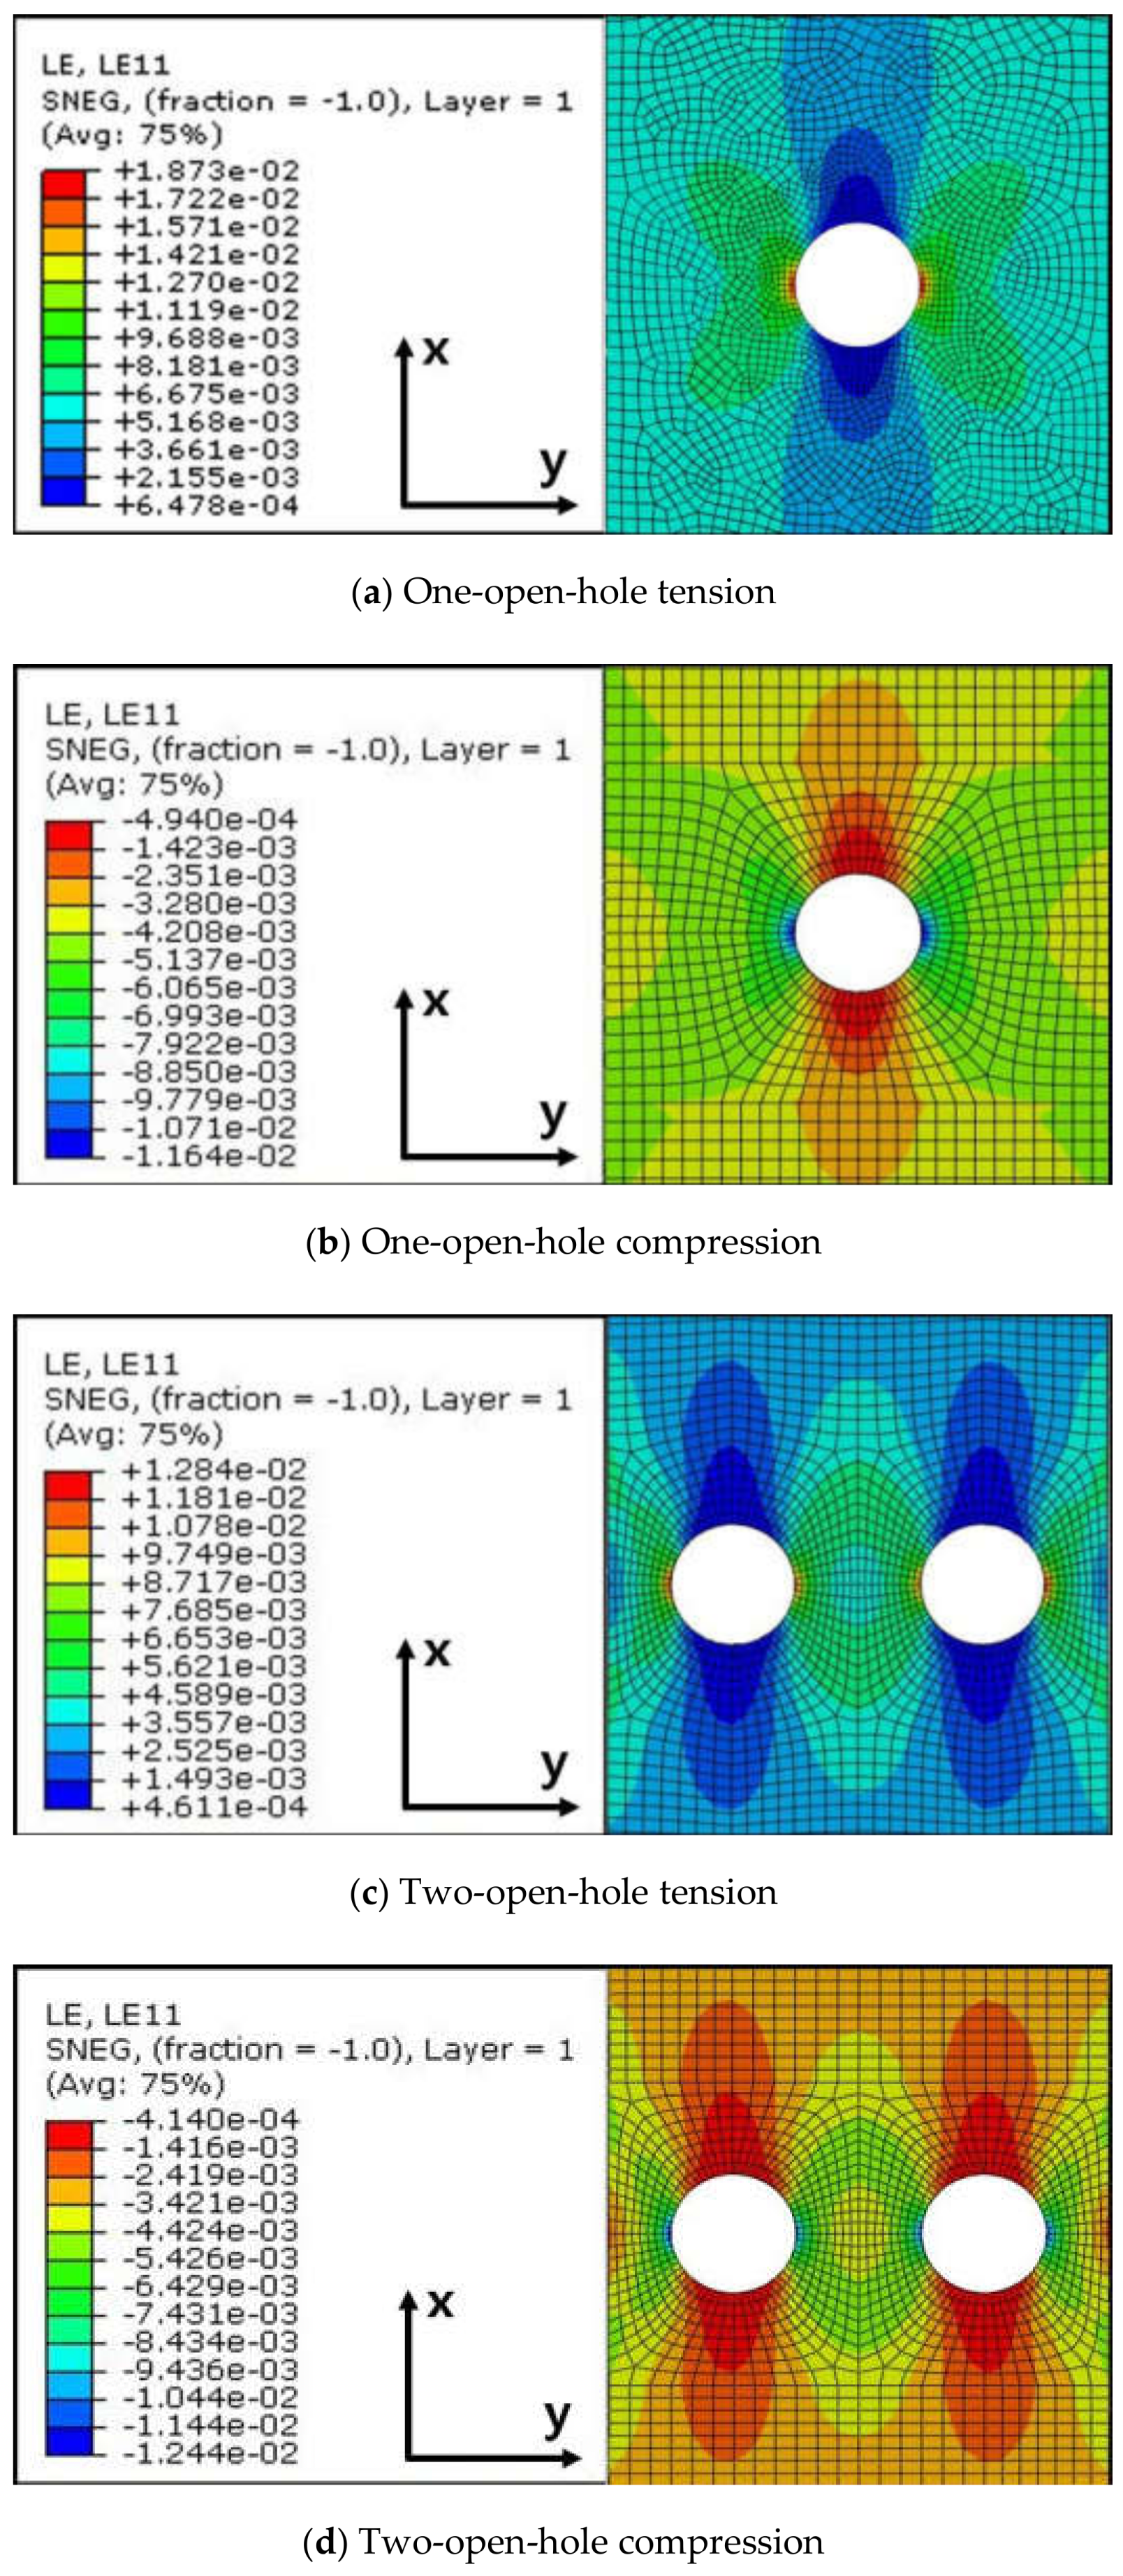
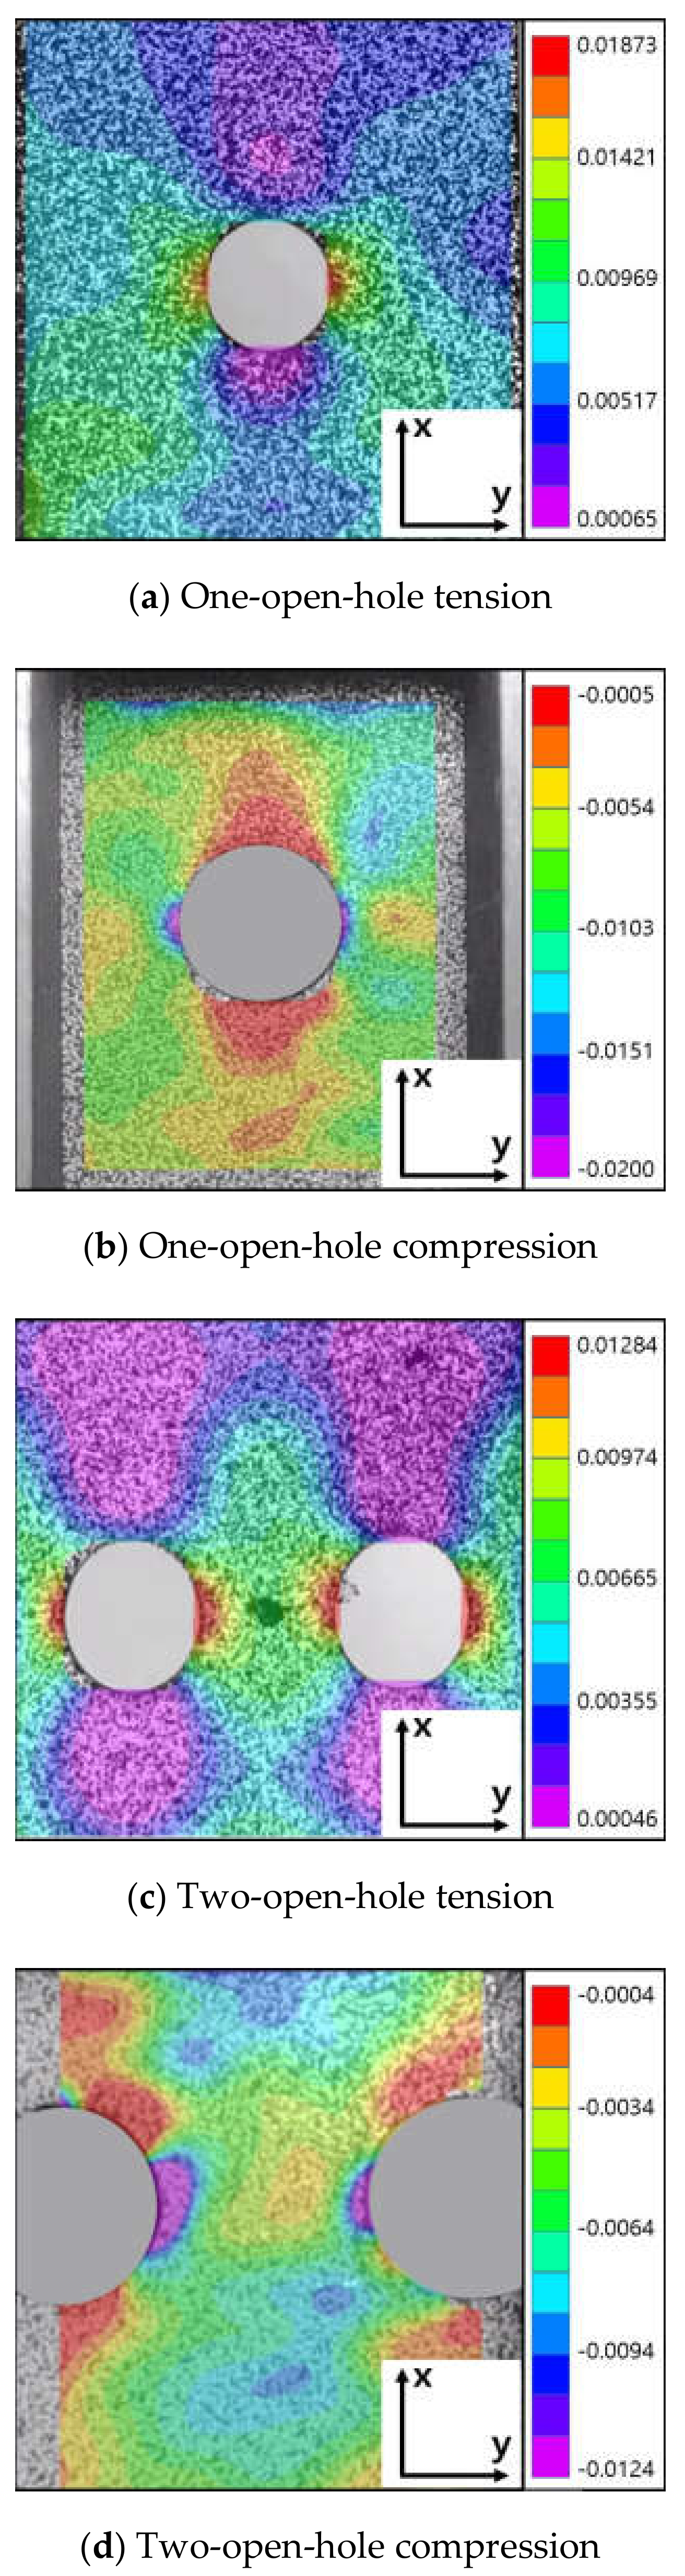
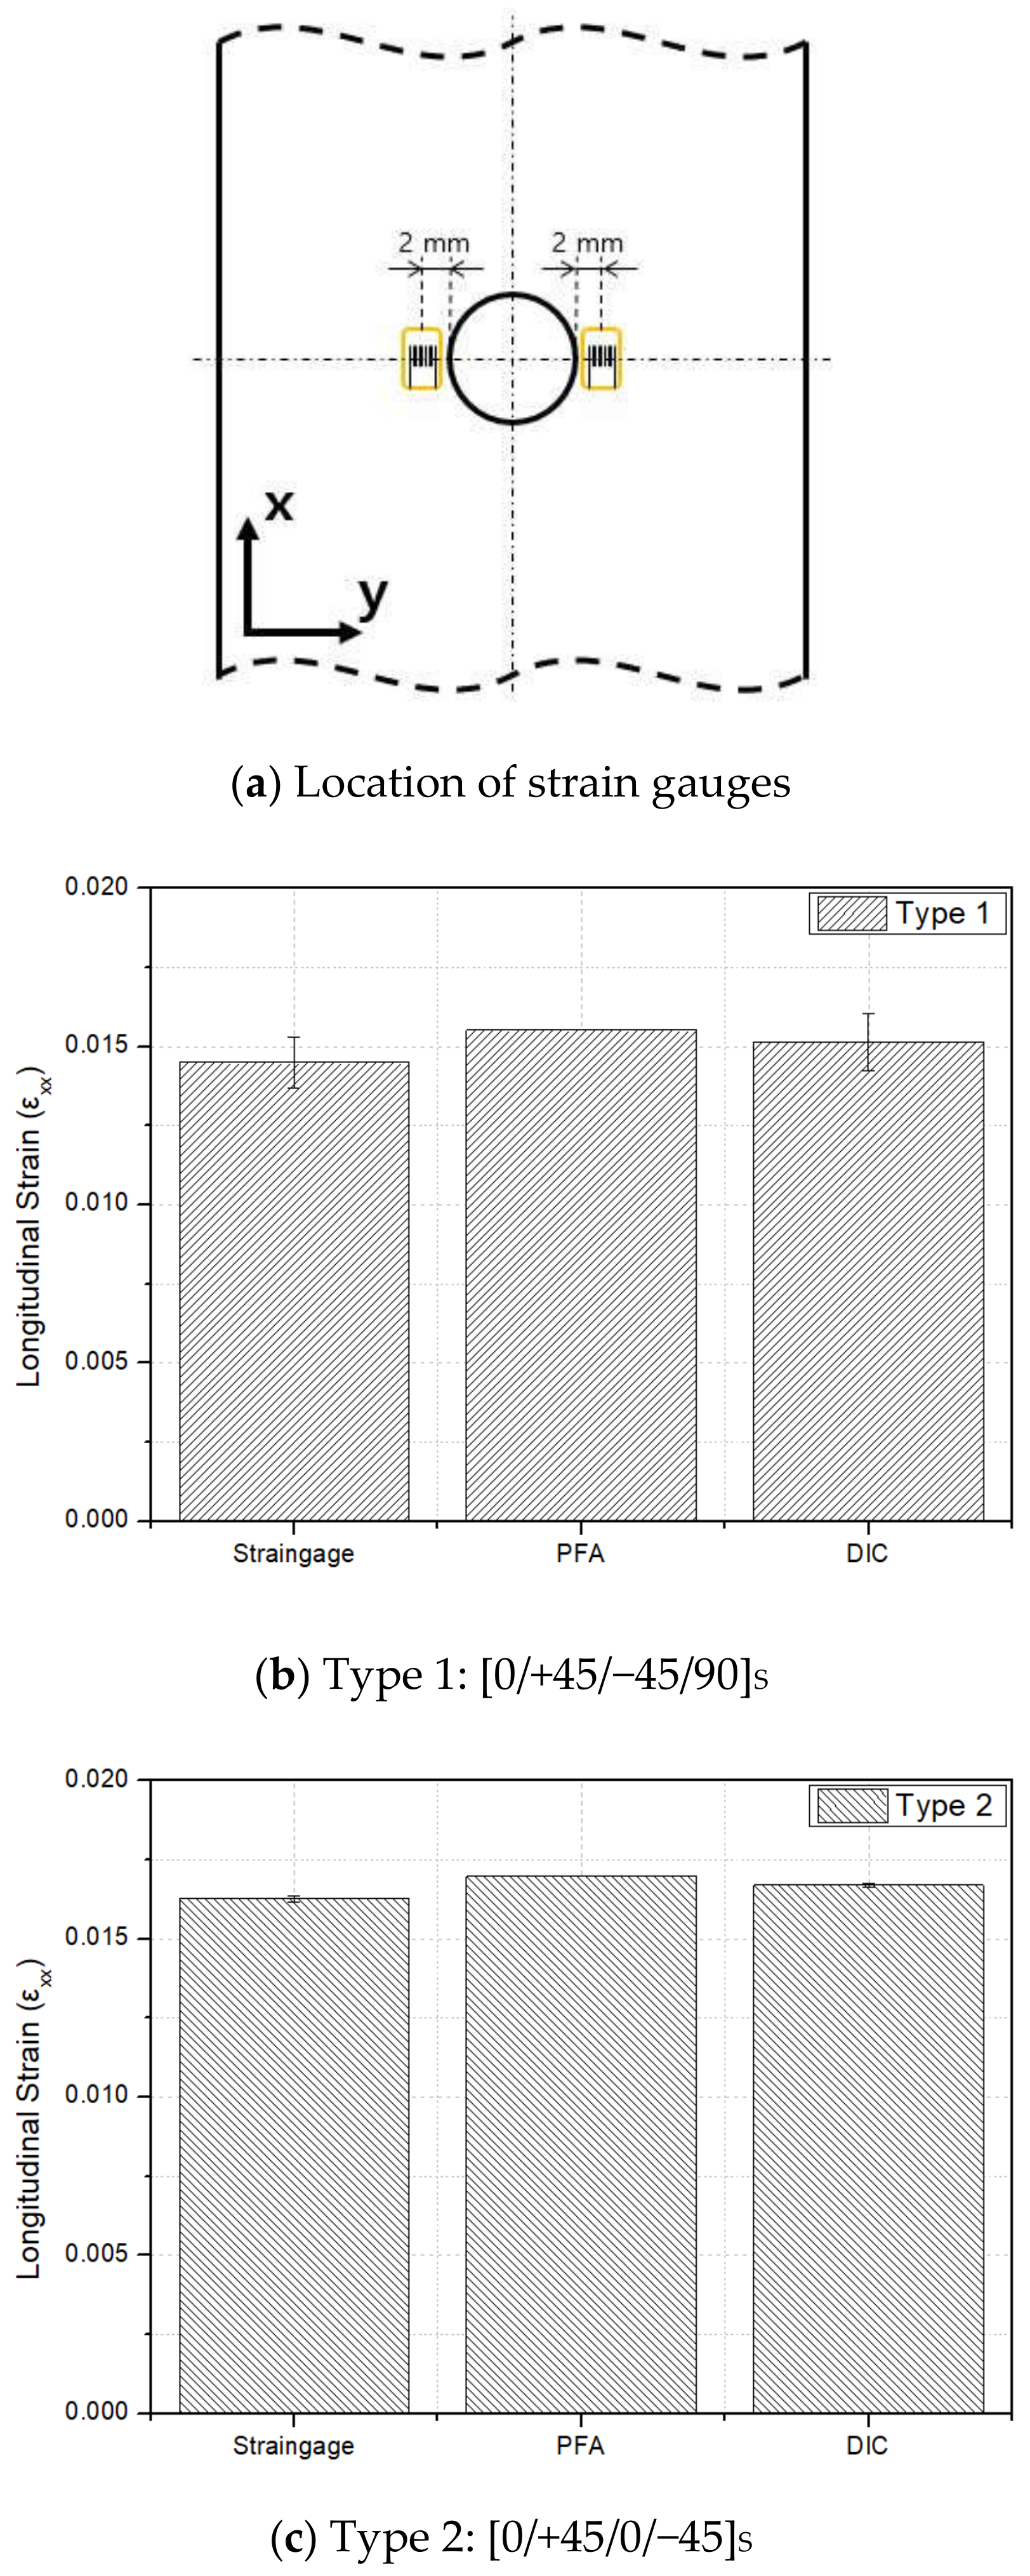
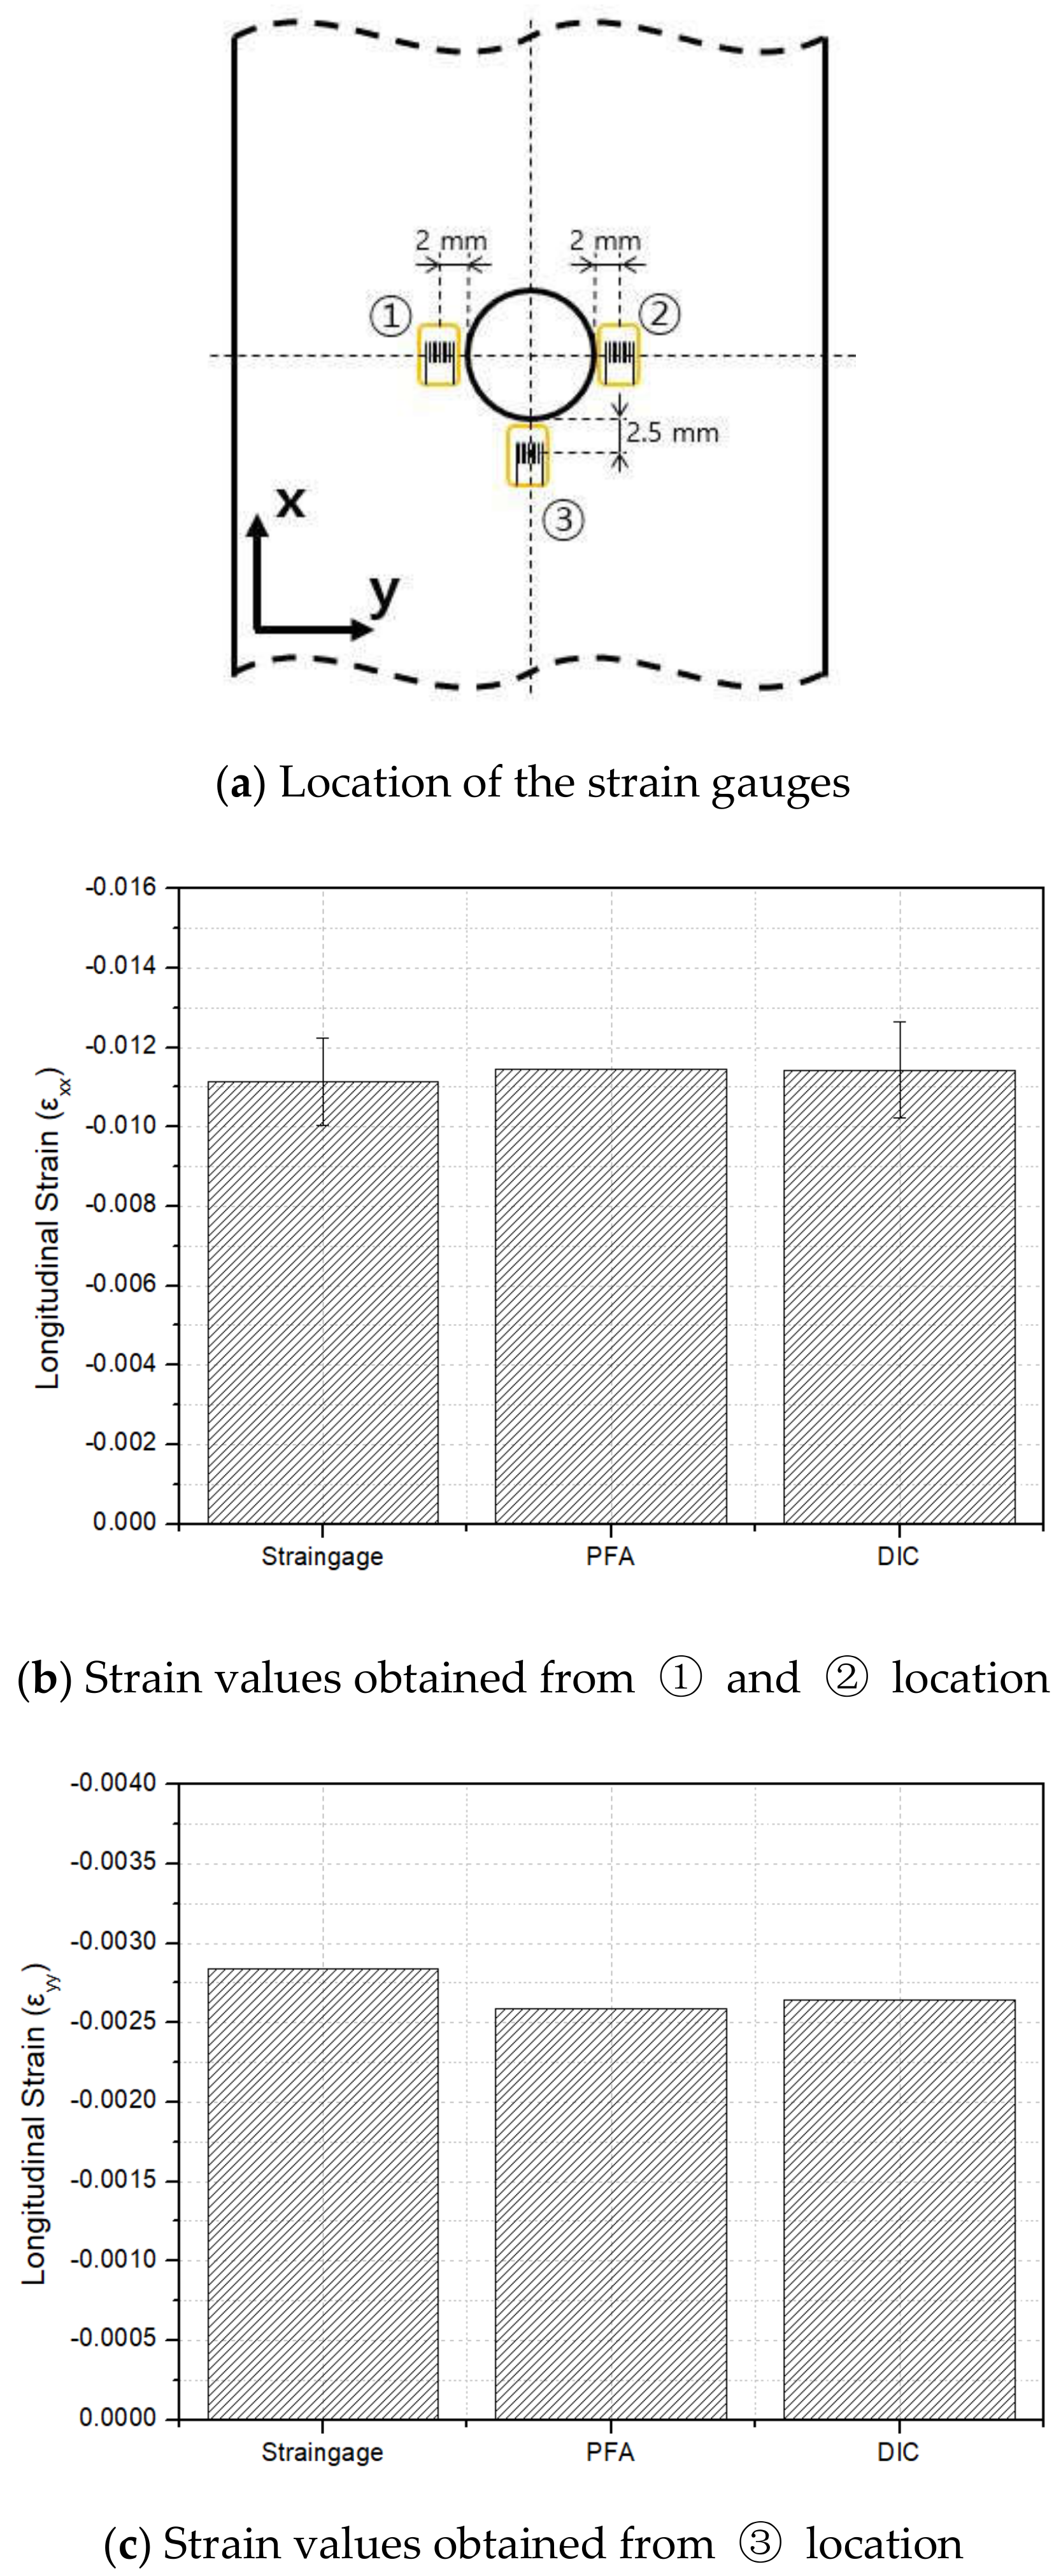
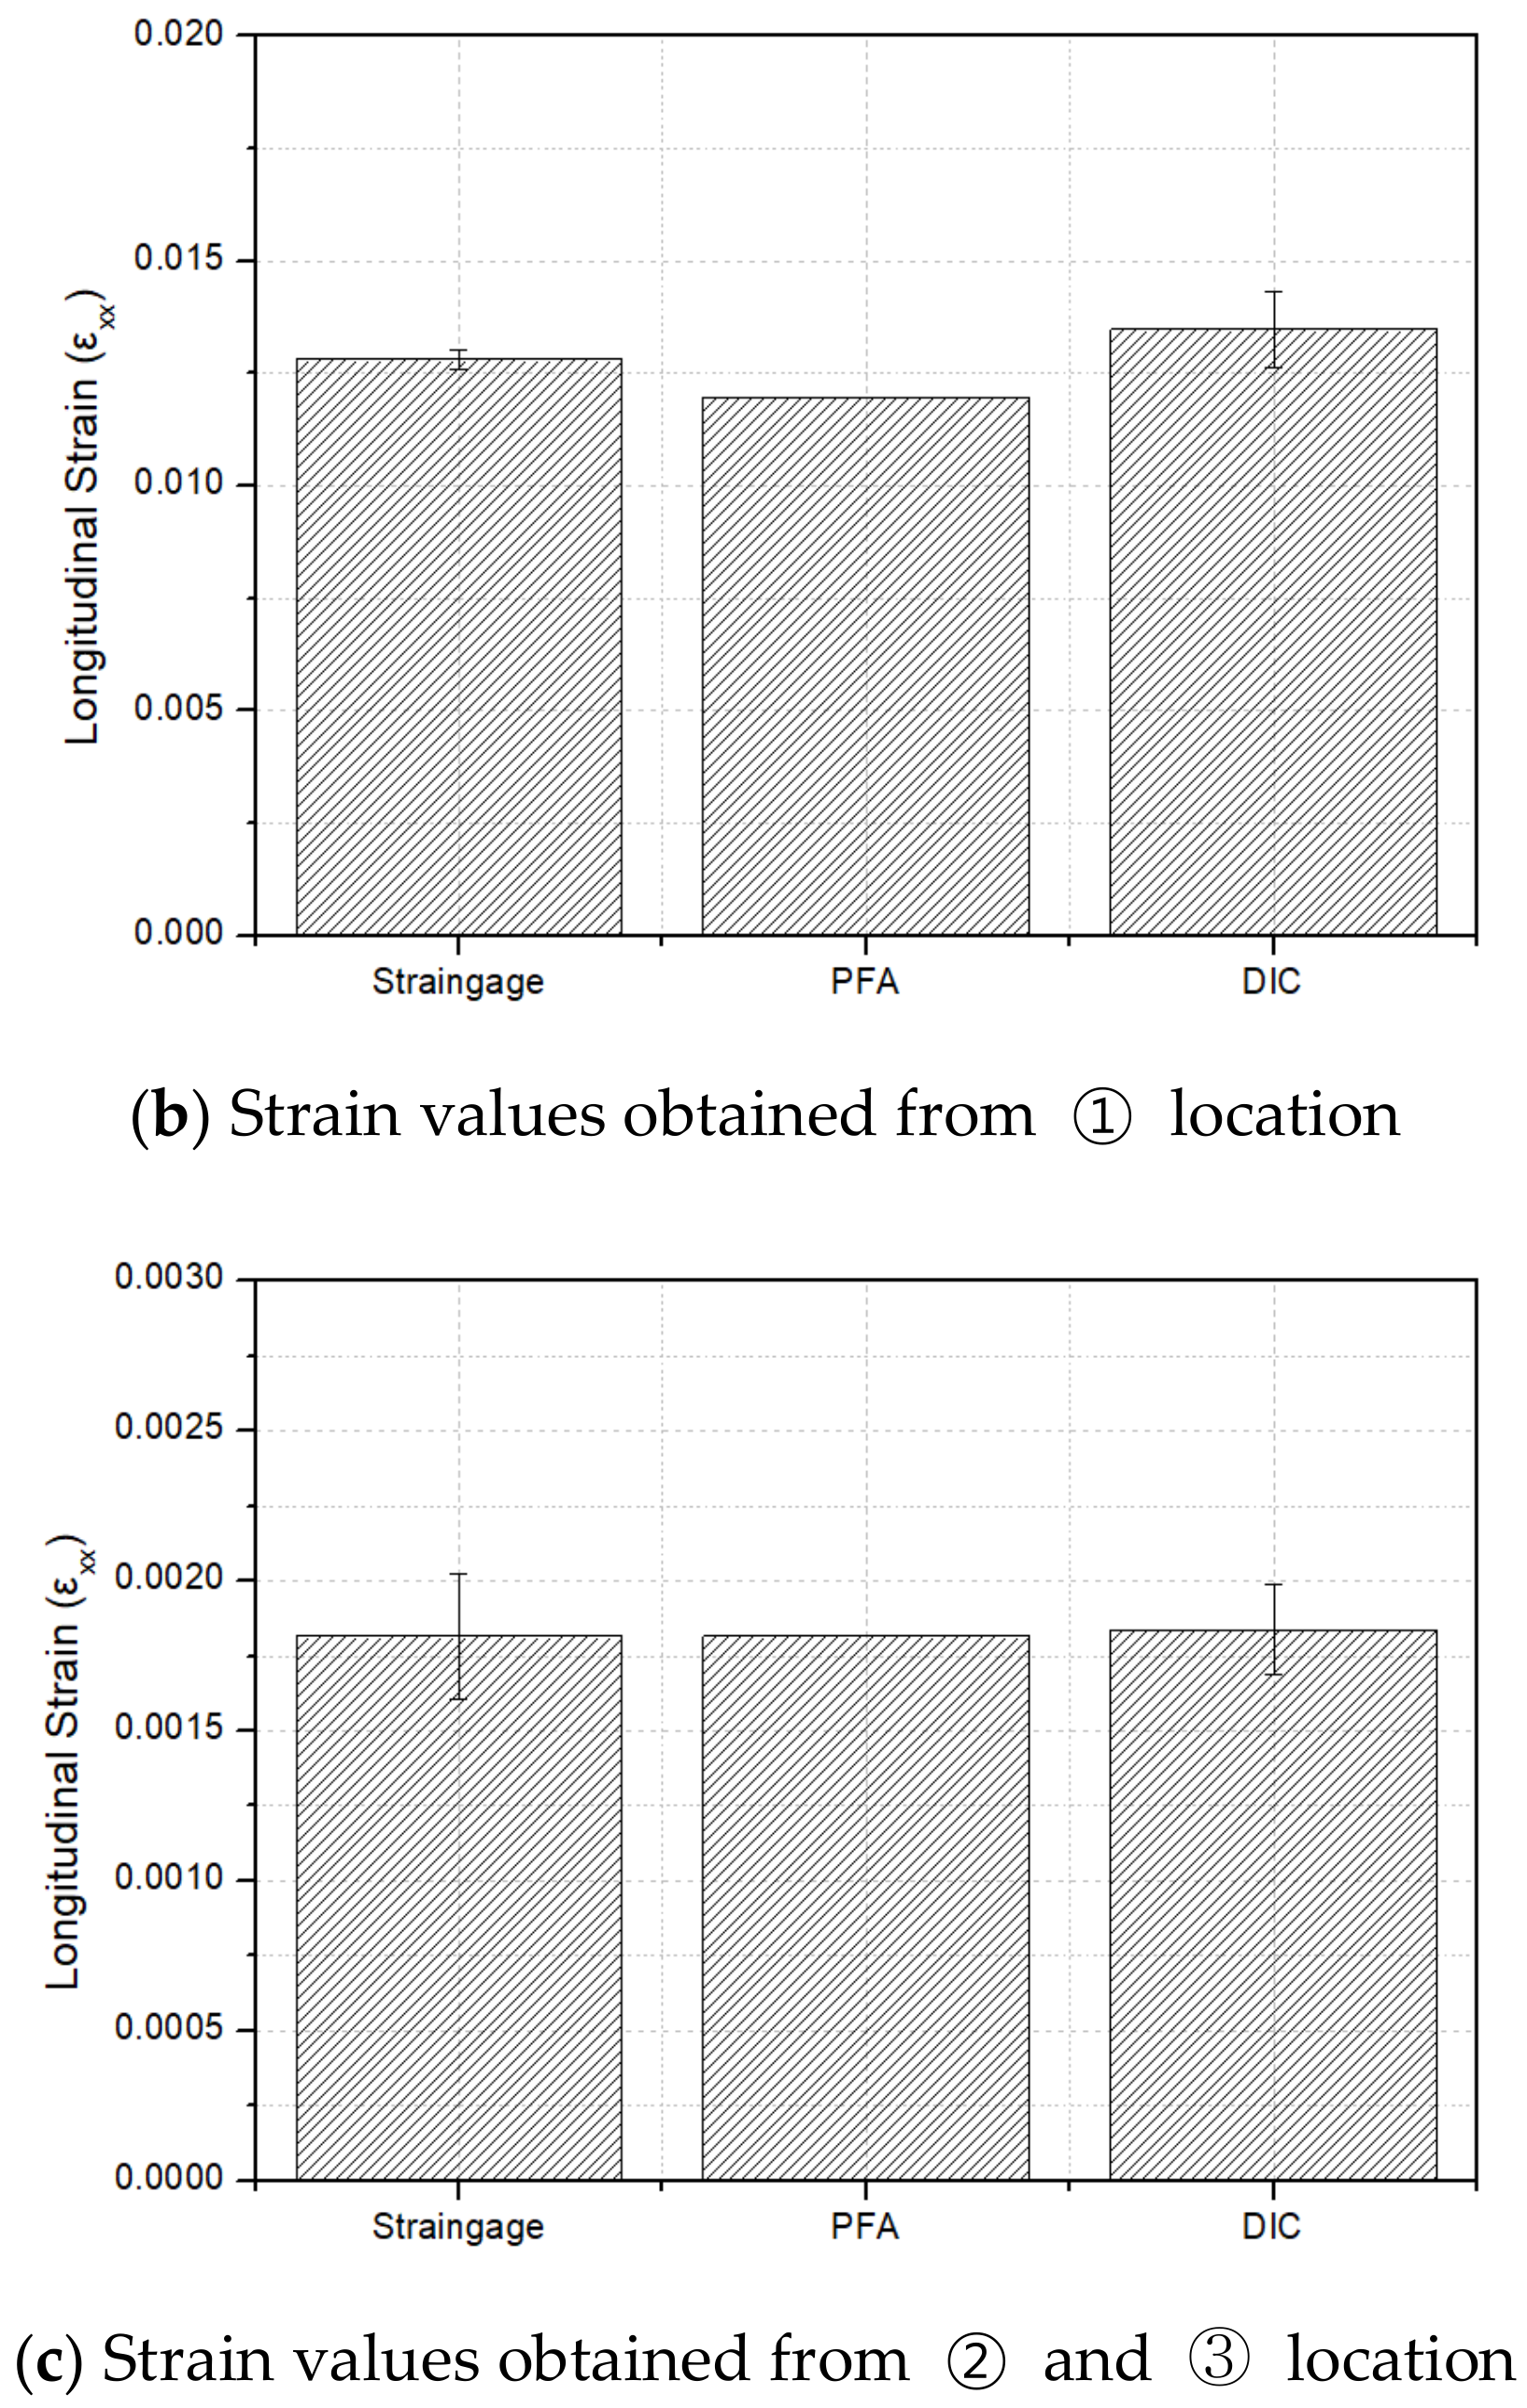
To evaluate the strain behavior predicted by the developed PFA method, strain values were compared to those obtained from the DIC. Figure 12 and Figure 13 show the longitudinal strain () contour obtained from the PFA and DIC results at the fracture moment, respectively. The applied displacement direction is up and down. The strain values were concentrated near the open hole because of the stress concentration induced from the geometric discontinuity. When comparing the PFA and DIC results, the legend range of DIC was matched with the PFA result contour and it can be verified that the overall strain distribution was similar for the PFA and DIC. For the one-open-hole tensile case, the maximum value observed from the PFA result was 0.01873 while the DIC result was 0.01804. Likewise, in all other cases, the strain values obtained from the PFA were compared to those of the DIC; the values were observed similarly. Furthermore, the strain values obtained from the PFA and DIC were compared to the measured values by strain gauges. Figure 14, Figure 15, Figure 16 and Figure 17 show the maximum longitudinal strain values obtained from the strain gauge, PFA, and DIC at the same point for open-hole tests. Figure 14a, Figure 15a, Figure 16a and Figure 17a show the location of the attached strain gauges. The point was selected based on the position of the strain gauge. Figure 14b,c, Figure 15b,c, Figure 16b,c and Figure 17b,c show the mean values of the strain values measured by the strain gauges. The maximum error was 9.74%, which was observed in the two-open-hole compressive test case; other cases had a lower error. According to this comparison for specific strain values at each location, it can be verified that the developed PFA model is effective in predicting the strain behavior of the notched composite laminate regardless of the tensile or compressive loading conditions and stacking sequences.
4.4. Failure Behavior Observation
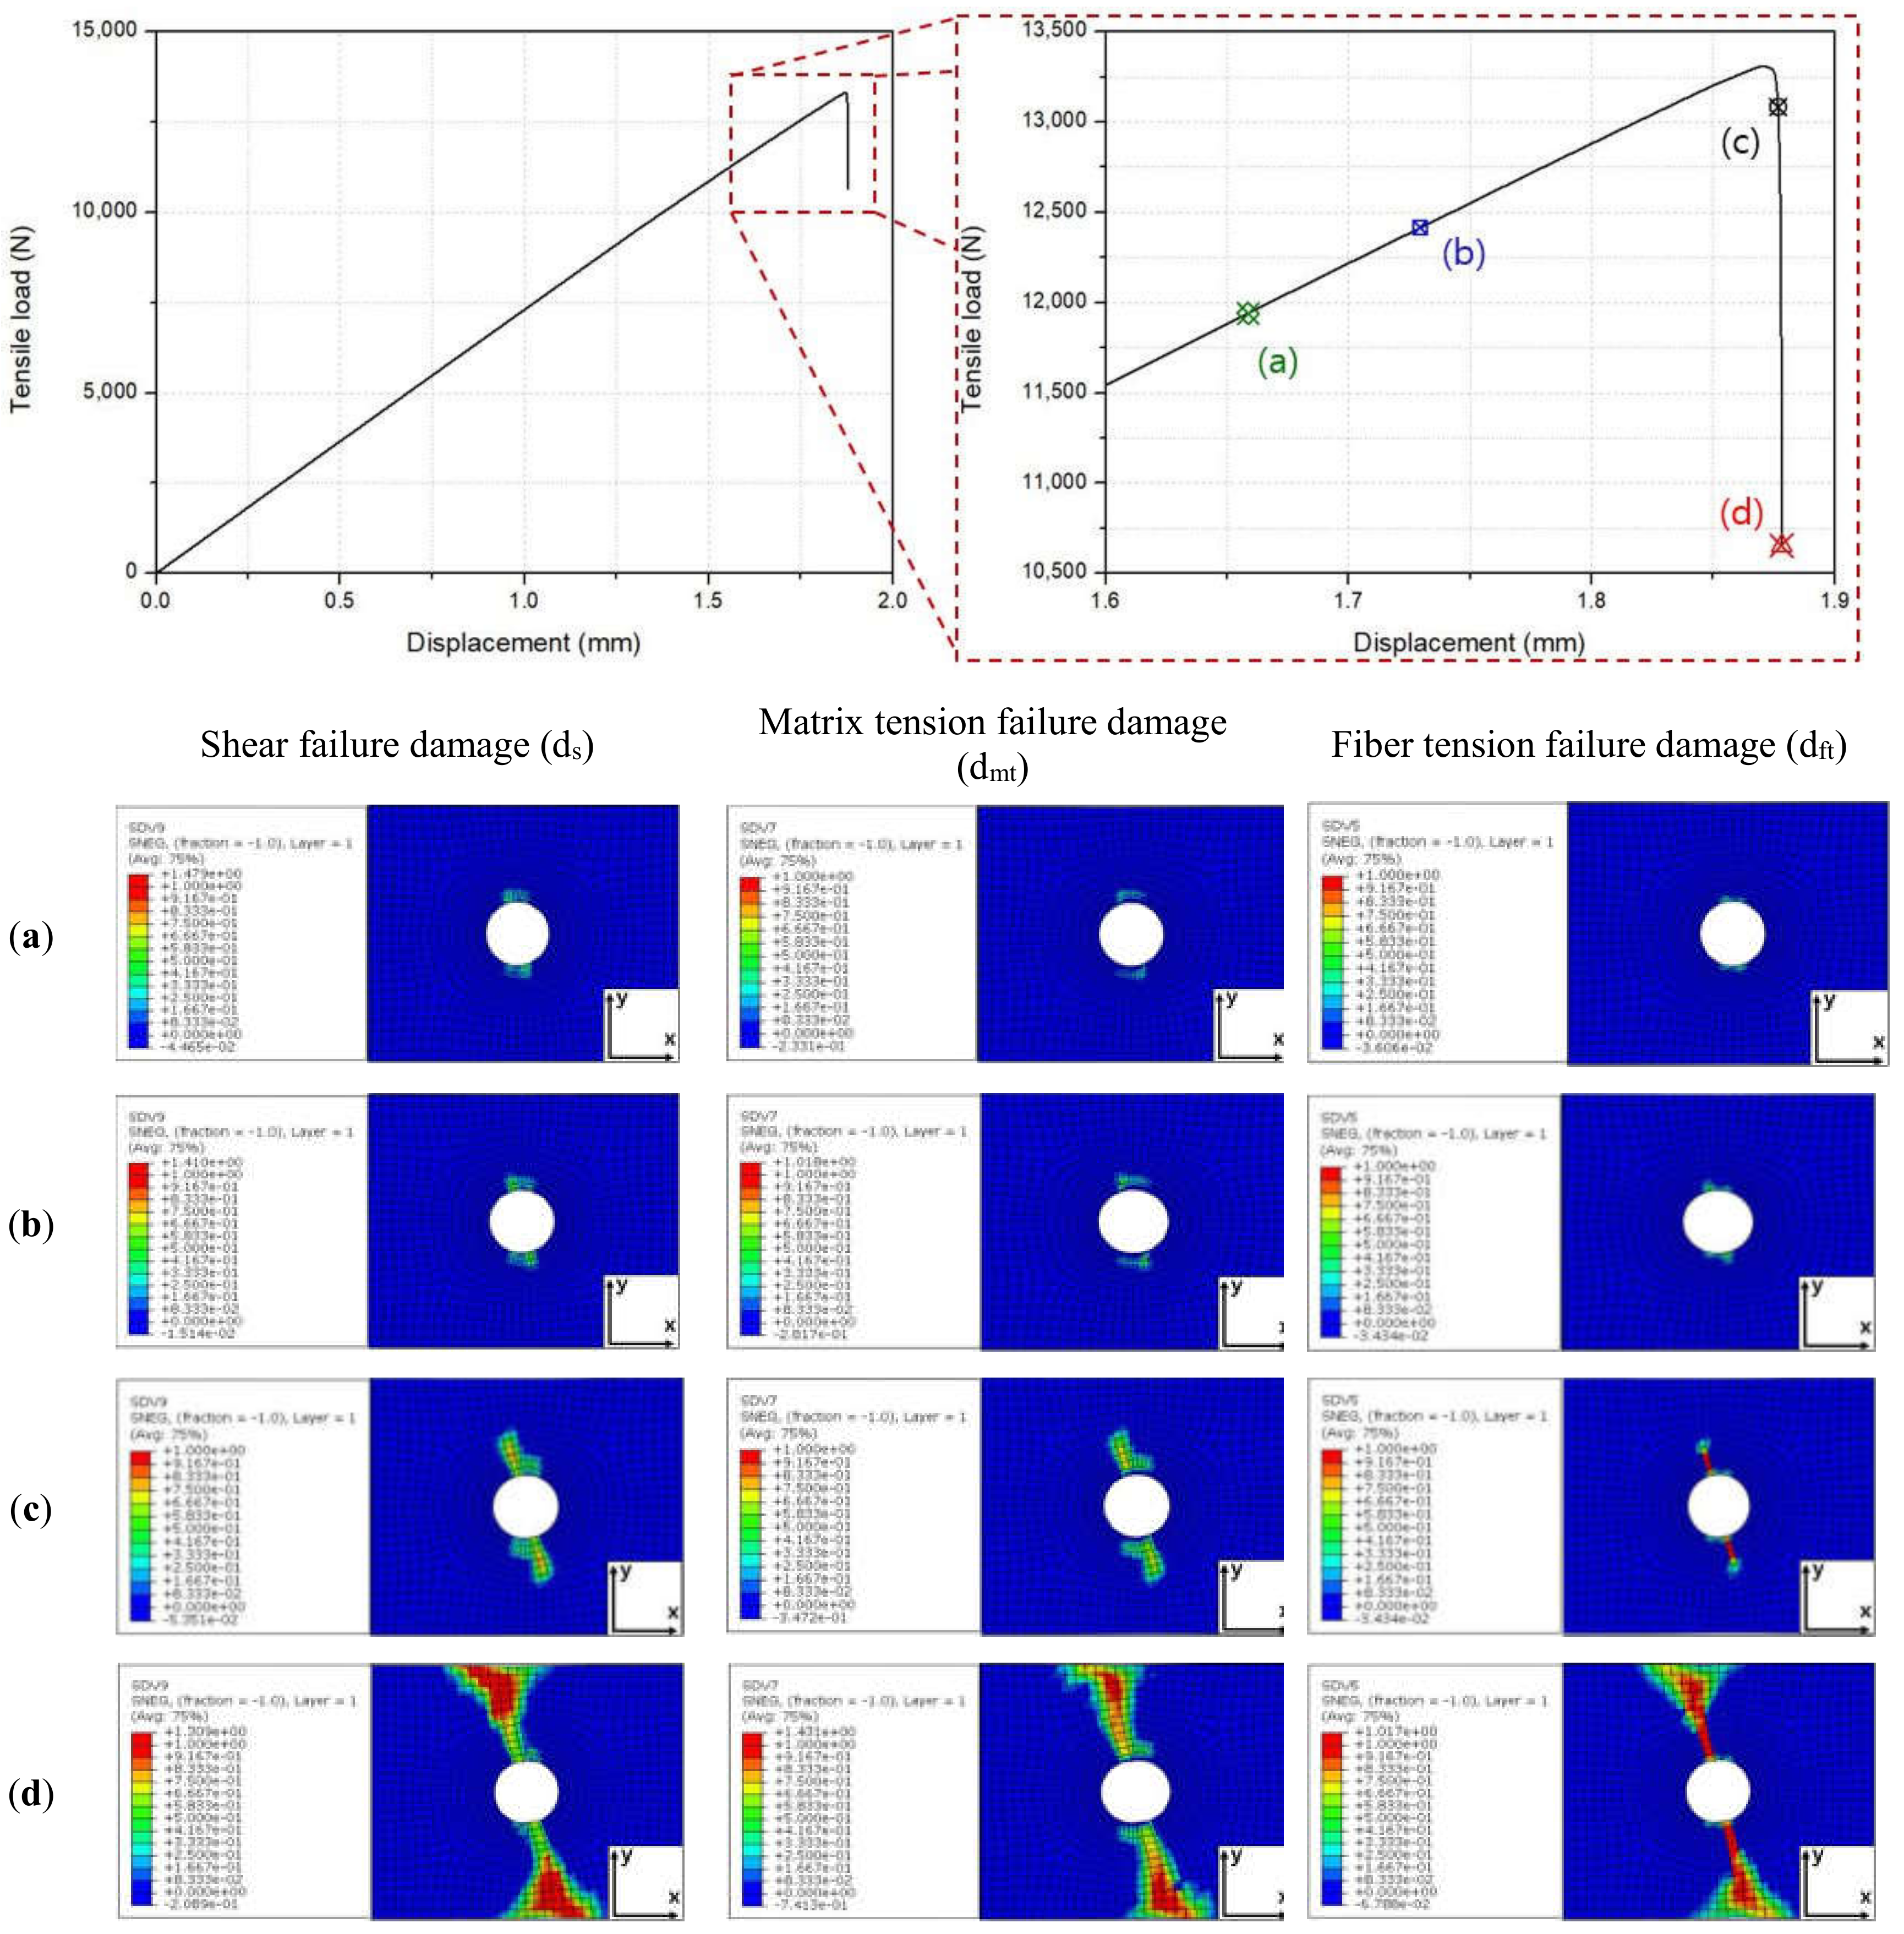
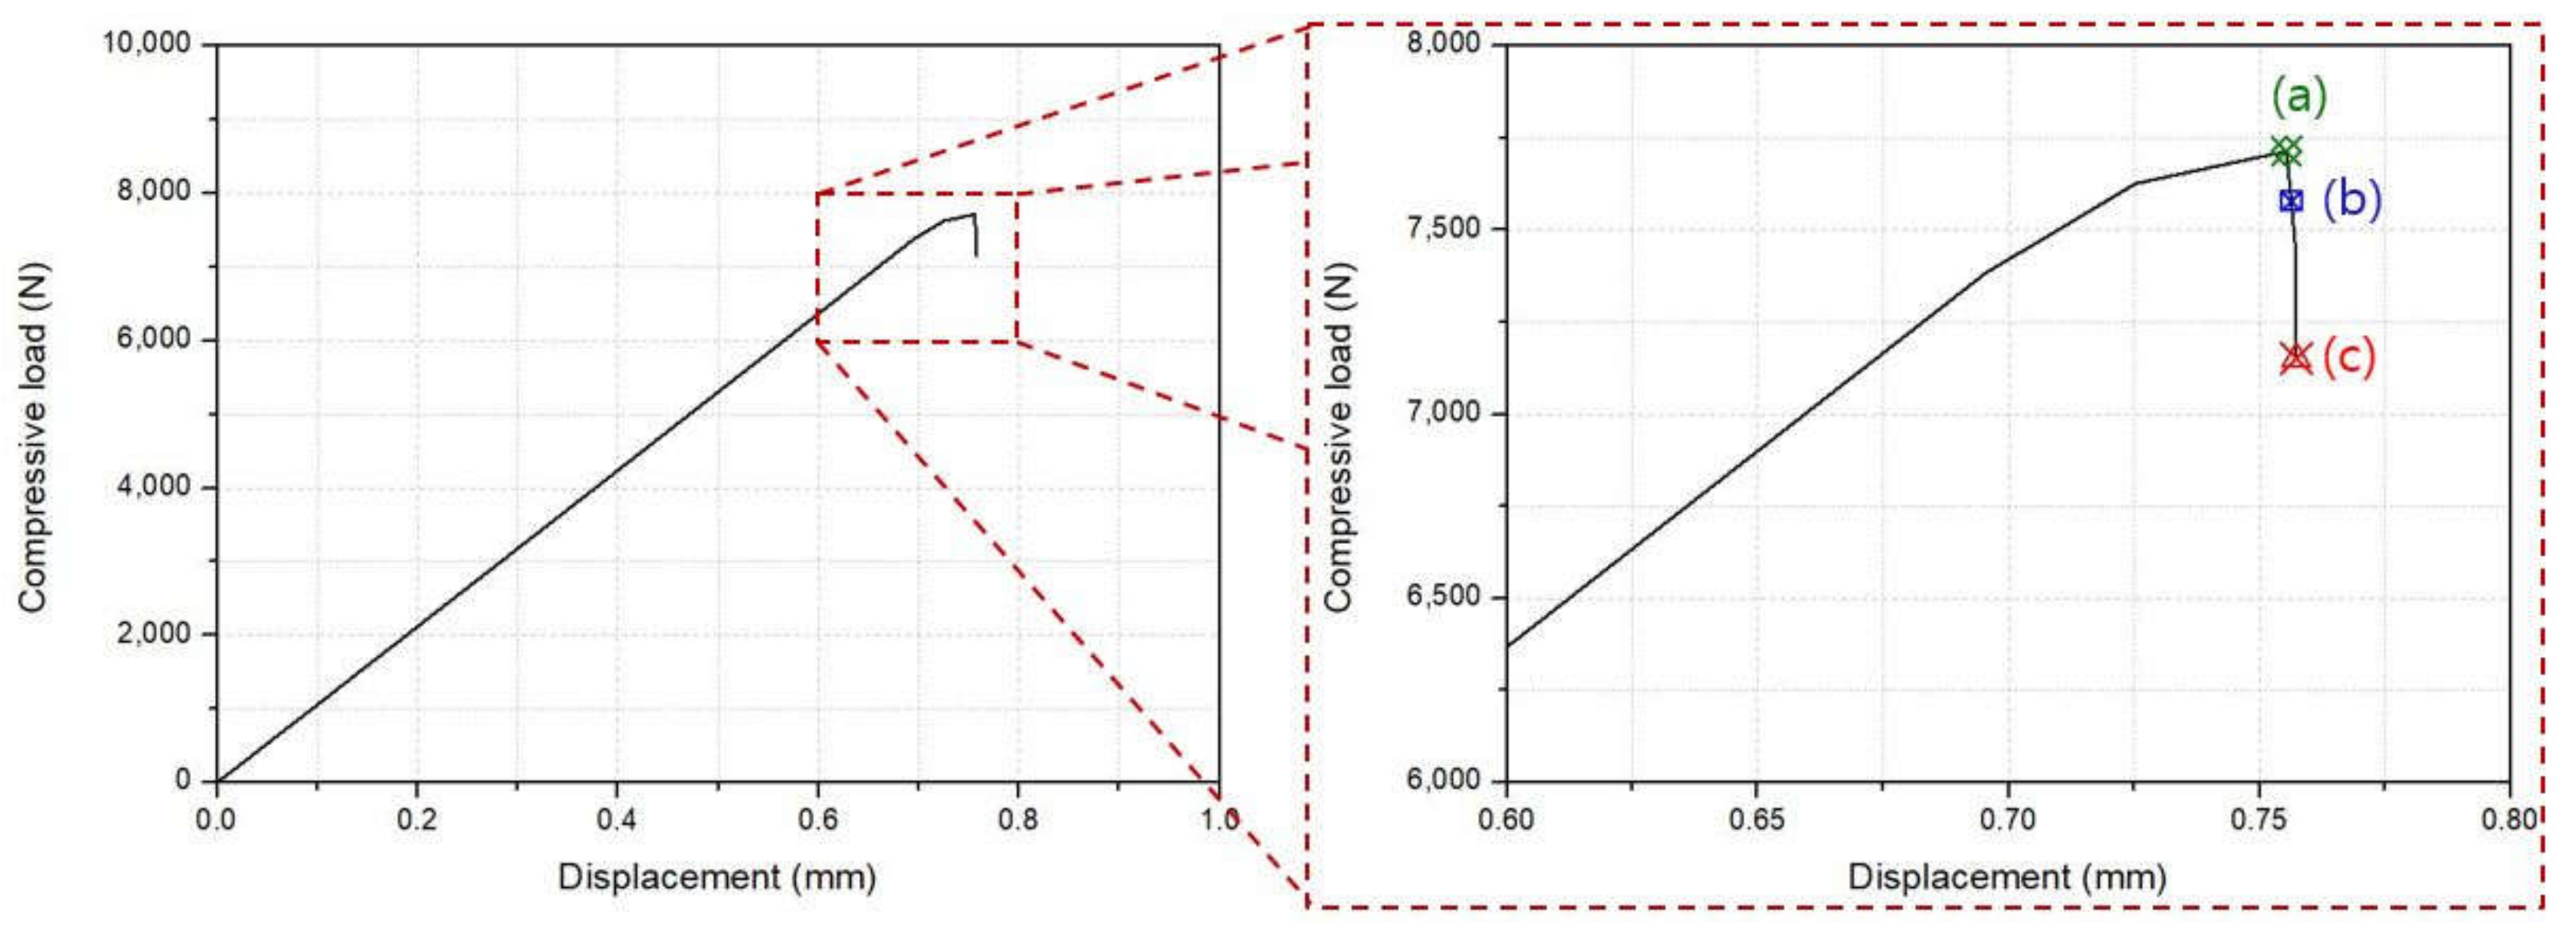
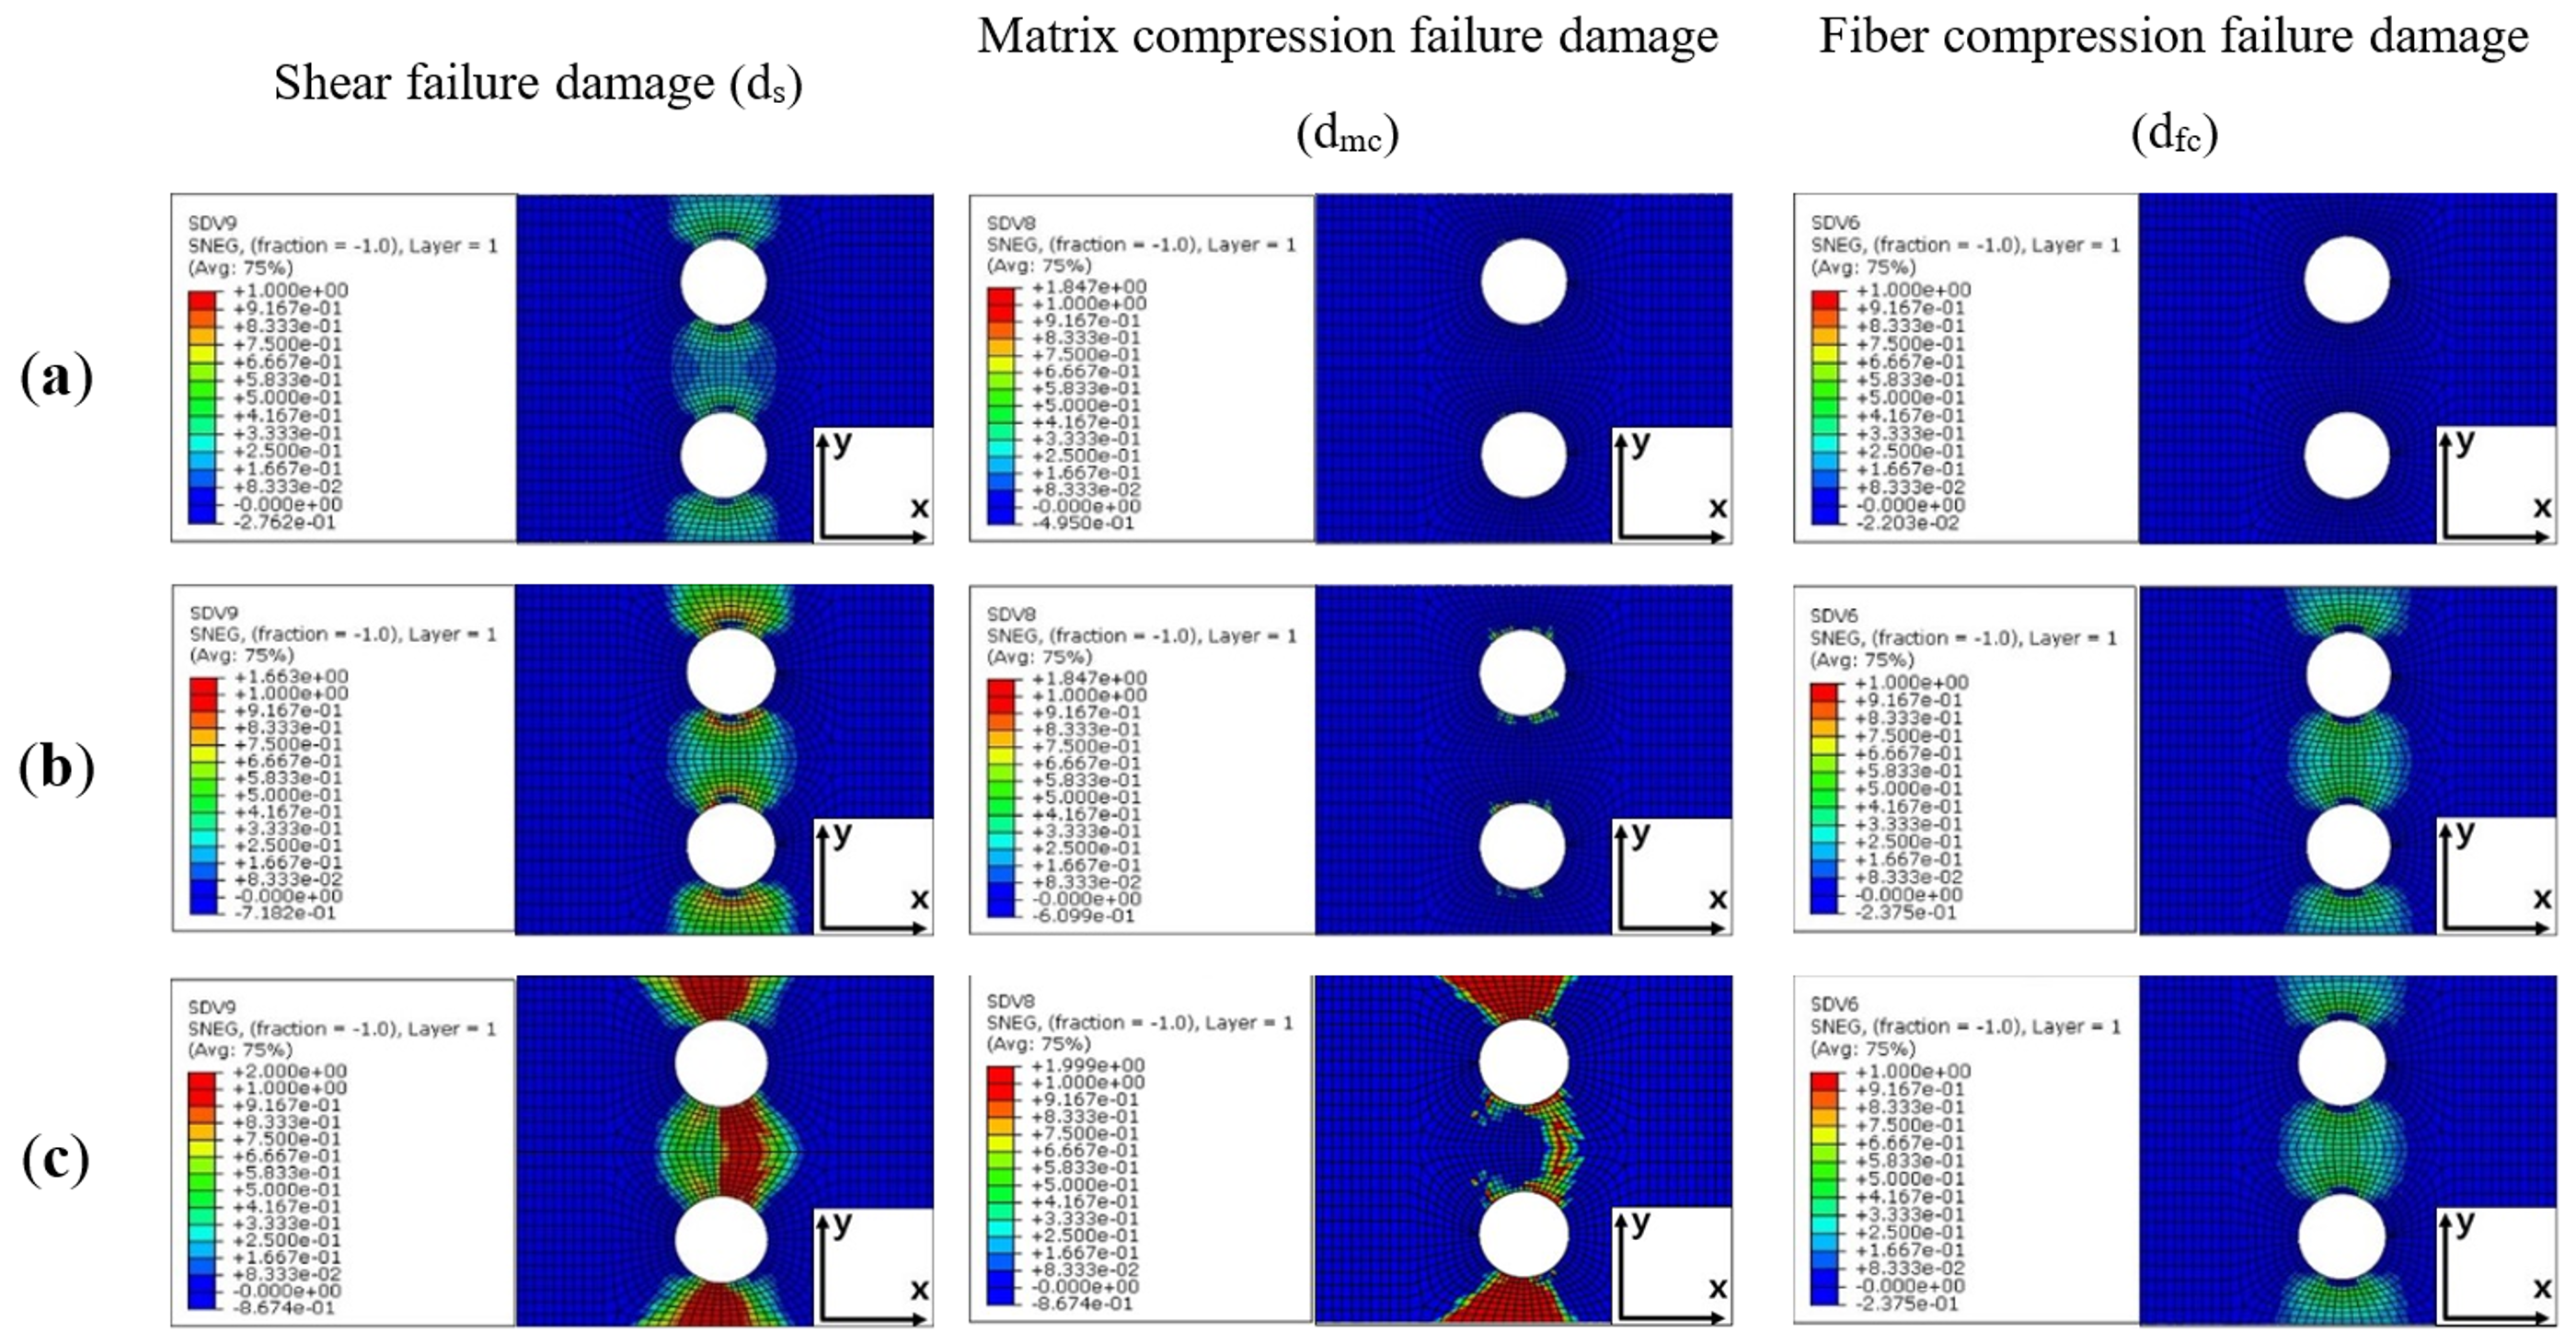
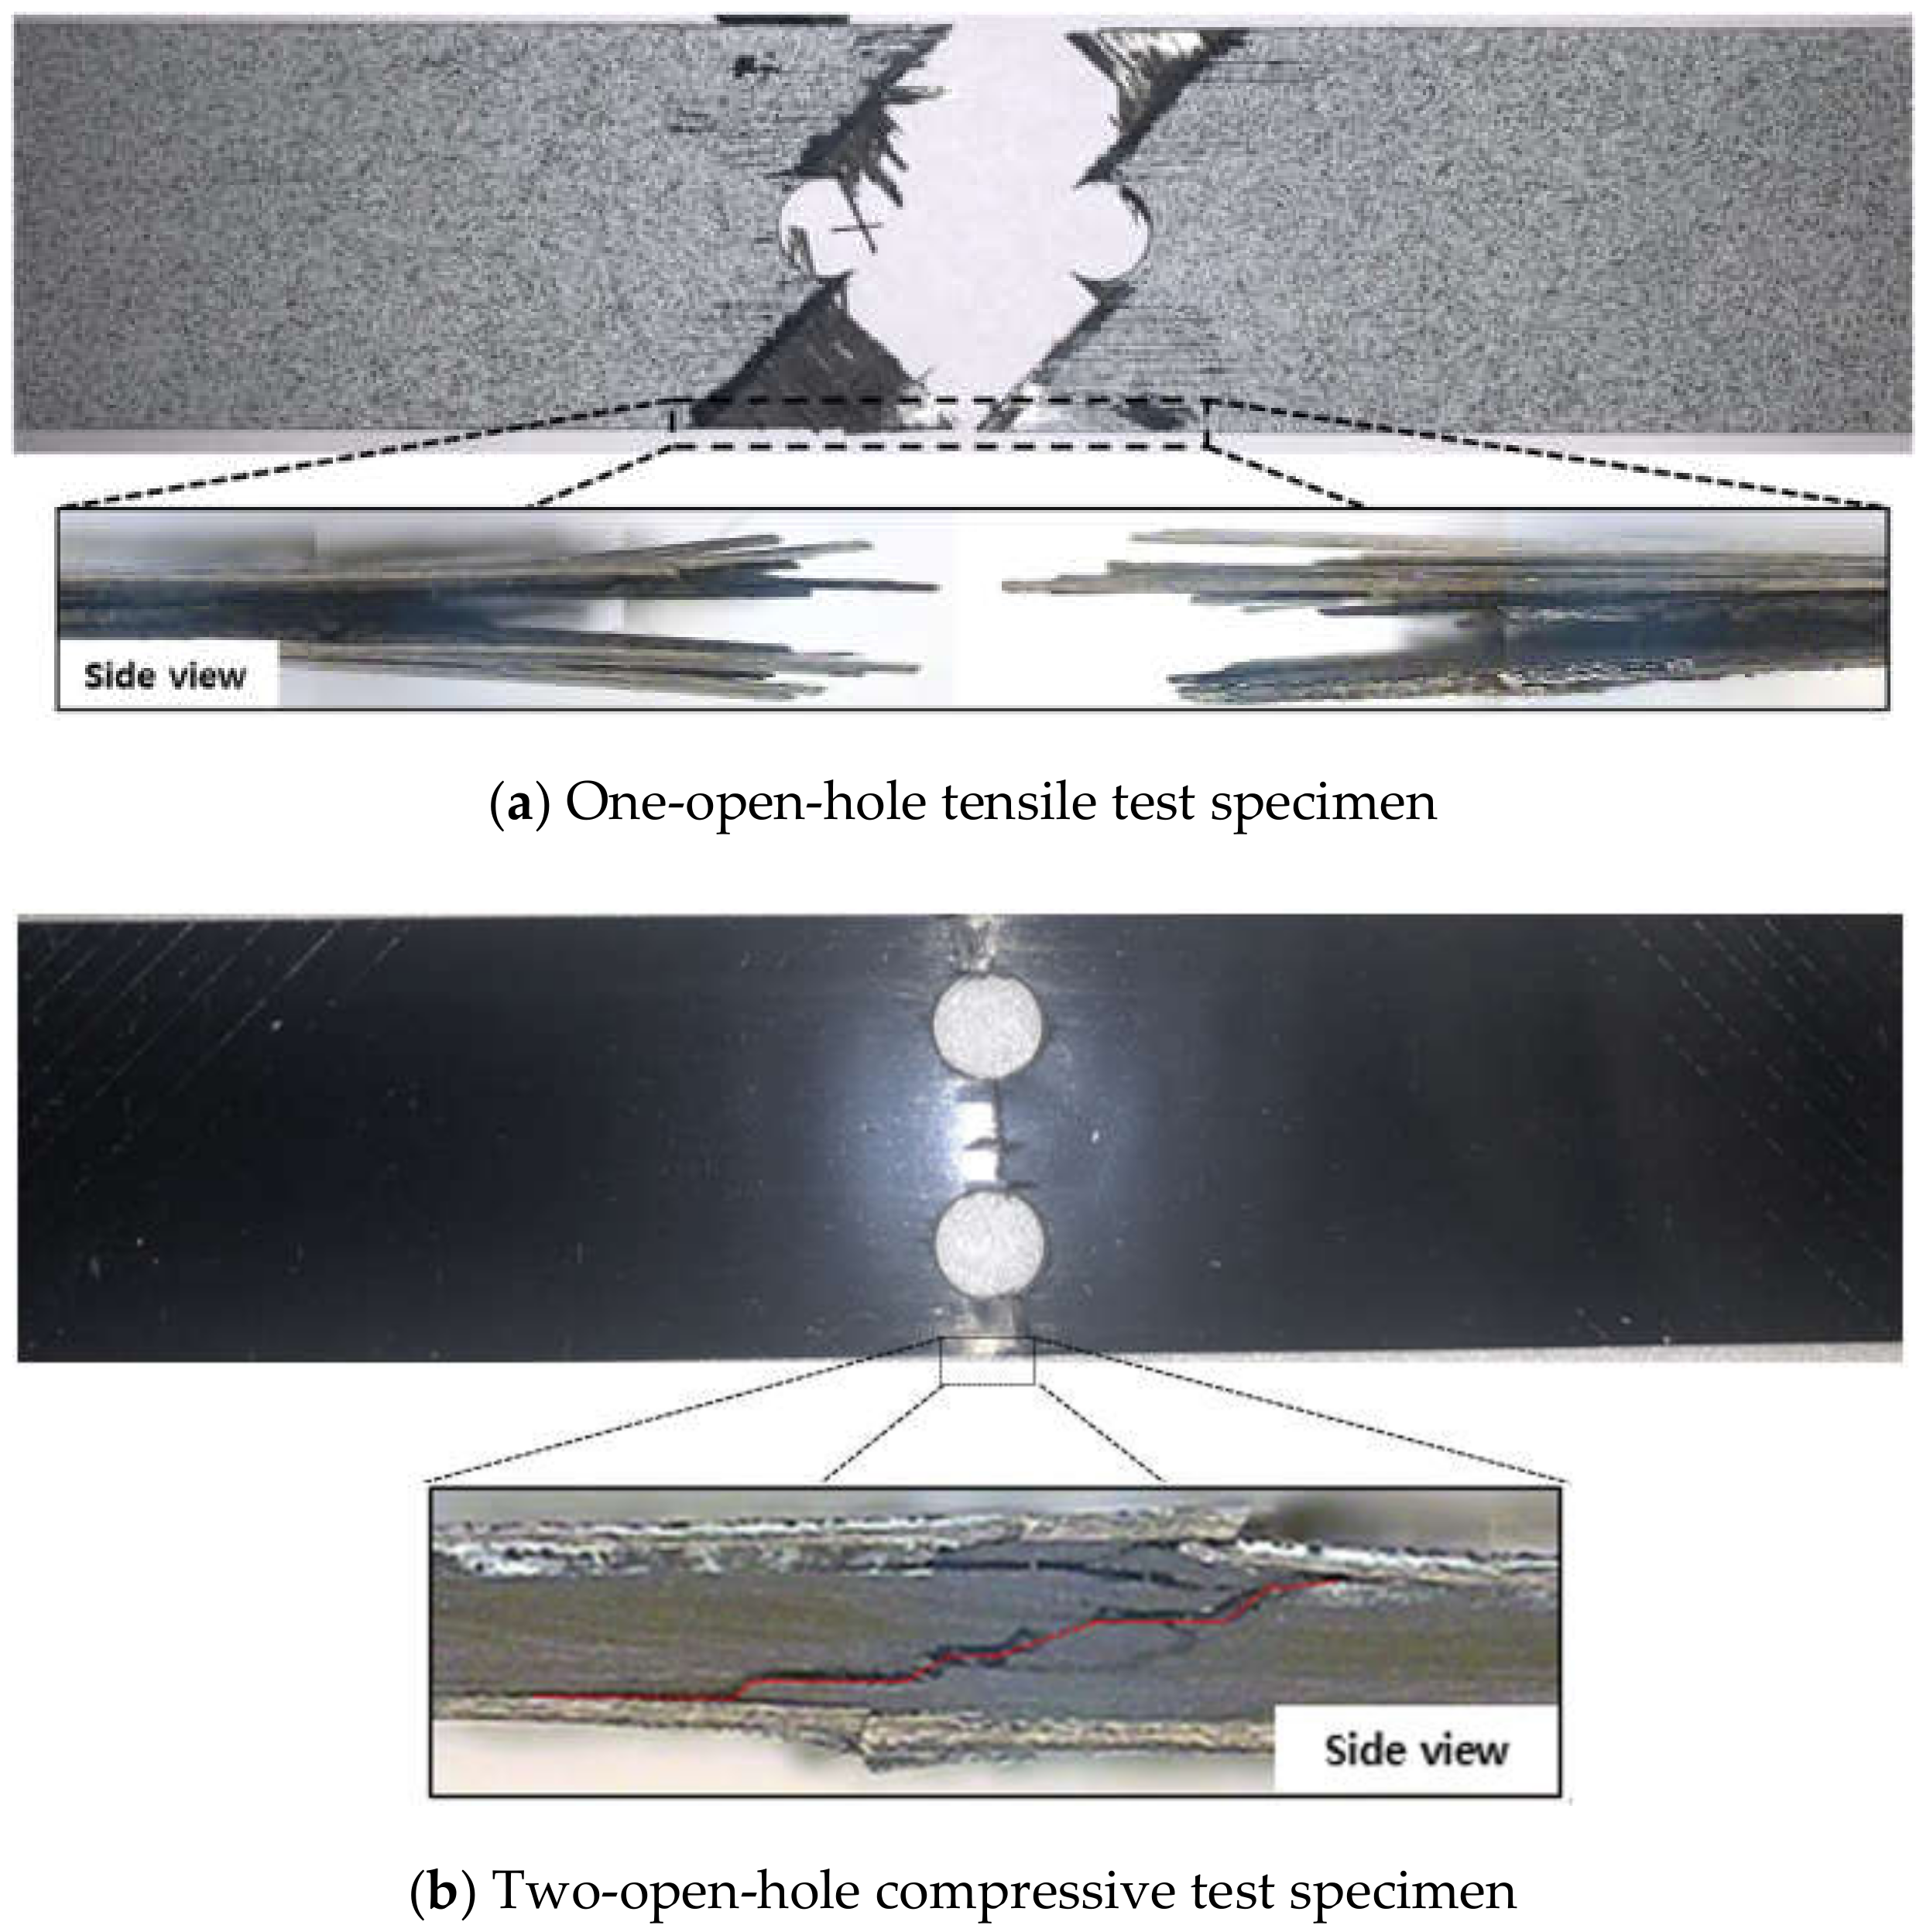
Using the developed PFA model, the failure behavior of the composite laminate was observed. Figure 18 shows a magnified load-displacement curve for the type-1, one-open-hole tensile PFA result with the calculated damage variable contour. If the calculated damage variable is “1,” it implies that it is fractured completely at the corresponding failure mode. Figure 18a–d are pointed on the graph according to the time when each damage variable became 1 or greater and when final fracture occurs. First, it was observed that the shear failure damage variable becomes “1” or more before the displacement reaches 1.6 mm. As the displacement exceeds 1.6 mm, the damage variable is “1” at the matrix tension failure mode. At the fiber tension failure mode, the damage variable became “1” after the maximum load; thus, resulting in the complete fracture of the composite specimen. Fracture was initiated from the open-hole edge because of the stress concentration. Figure 19 shows a load-displacement curve for the type-1, two-open-hole compressive PFA result with the calculated damage variable contour. Figure 19a–c was selected to observe the damage behavior during the analysis. Figure 19a,b is the point where the shear and matrix compression failure damage becomes “1” or greater, respectively. Figure 19c is a point where the final fracture occurs. Compressive damage behavior displays some different behavior from the tensile analysis result. Tensile failure behavior shows the final load drop with fiber failure damage; however, compressive failure behavior shows the final load drop occurred with shear and matrix failure damage. After the maximum compressive load point, the shear and matrix compression failure damage variable became “1” or greater; hence, final fracture occurred as the displacement increased. At the final load drop state, the fiber compression failure damage variable did not reach “1”. These behaviors can also be observed with the test specimens. Figure 20 shows the fractured test specimens for the tensile and compressive tests, respectively. Figure 20a demonstrates that the specimen was completely fractured in two pieces while Figure 20b illustrates that the fractured specimen is in one piece. It is because at the final fracture of the compressive test, the fibers did not completely fracture. The fracture was initiated from the open-hole edge because the stress concentration was similar to the tensile cases. The side view for the tensile specimen exhibits catastrophic fracture, as evidenced by the fiber breakage shown in Figure 20a. However, as shown in Figure 20b, the compressive test specimen was mainly fractured in the shear failure mode [25,34,35], and the fibers were not completely broken. These results confirm again that the developed PFA model can accurately predict the failure of the composite laminates.
5. Conclusions
In this study, the PFA model was developed using a crack band model. Using the Hashin criteria, failure initiation was detected at various failure modes. The damage evolution behavior was calculated based on the crack-band-model-implemented damage variables. To verify the effectiveness of the suggested PFA model, the test results of the open-hole composite laminate were compared to the analysis results. The conclusions drawn from this study are as follows.
- (1)
- The developed PFA model demonstrated results that were less-mesh-dependent in comparison to the MLT-PFA model that has been used in various studies. The lower mesh dependency occurred because each element failed when considering the constant fracture energy regardless of the element size when using the damage variable in the crack-band-model.
- (2)
- The analysis results were in good agreement with the experimental ones regardless of the stacking sequences, the number of notches, and the loading direction. This conclusion was determined by examining the load-displacement behavior and the strain distribution of the PFA results while doing a comparison to the experimental results.
- (3)
- Using the developed PFA model, the failure behavior of the composite laminate containing open holes was studied. Tensile failure behavior shows a final load-drop induced from the fiber failure damage while the compressive failure behavior shows that the final load-drop occurred by shear and matrix failure damage. The different fracture mechanism according to the loading direction was confirmed by comparing the fractured specimens.
As a result, it was verified that the developed PFA model can accurately predict the failure behavior of the composite laminate with less mesh dependency. The suggested model, which allows for a good representation of behavior of the notched geometry and less mesh dependency, is expected to benefit the design process of complex composite structures. In addition, it is considered that such advantages may be useful in predicting the structural health in the field of sound absorption that uses the geometrical discontinuities as a design factor (e.g., rigid inclusions and cavities in a host material [1,36,37,38]).
Author Contributions
Conceptualization, D.Y., J.K. and Y.D.; Methodology, D.Y. and Y.D.; Validation, D.Y. and S.K.; Formal analysis, S.K. and Y.D.; Investigation, D.Y. and S.K.; Resources, J.K. and Y.D.; Writing-original draft, D.Y.; Writing-review and editing, D.Y. and J.K.; Visualization, D.Y. and S.K.; Supervision, J.K. and Y.D. All authors have read and agreed to the published version of the manuscript.
Funding
This research received no external funding.
Conflicts of Interest
The authors declare no conflicts of interest.
References
- Skvortsov, A.; MacGillivray, I.; Sharma, G.S.; Kessissoglou, N. Sound scattering by a lattice of resonant inclusions in a soft medium. Phys. Rev. E 2019, 99, 063006. [Google Scholar] [CrossRef]
- Matzenmiller, A.; Lubliner, J.; Taylor, R.L. A constitutive model for anisotropic damage in fiber-composites. Mech. Mater. 1995, 20, 125–152. [Google Scholar] [CrossRef]
- Chang, F.K.; Chang, K.Y. A progressive damage model for laminated composites containing stress concentrations. J. Compos. Mater. 1987, 21, 834–855. [Google Scholar] [CrossRef]
- Su, Z.C.; Tay, T.E.; Ridha, M.; Chen, B.Y. Progressive damage modeling of open-hole composite laminates under compression. Compos. Struct. 2015, 122, 507–517. [Google Scholar] [CrossRef]
- Chen, B.Y.; Tay, T.E.; Maiz, P.M.; Pinho, S.T. Numerical analysis of size effects on open-hole tensile composite laminates. Compos. Part. A Appl. Sci. Manuf. 2013, 47, 52–62. [Google Scholar] [CrossRef]
- Bažant, Z.P.; Oh, B.H. Crack band theory for fracture of concrete. Matér. Constr. 1983, 16, 155–177. [Google Scholar] [CrossRef] [Green Version]
- Lapczyk, I.; Hurtado, J.U. Progressive damage modeling in fiber-reinforced materials. Compos. Part. A Appl. Sci. Manuf. 2007, 38, 2333–2341. [Google Scholar] [CrossRef]
- Riccio, A.; Costanzo, C.D.; Gennaro, P.D.; Sellitto, A.; Raimondo, A. Intra-laminar progressive failure analysis of composite laminates with a large notch damage. Eng. Fail. Anal. 2017, 73, 97–112. [Google Scholar] [CrossRef]
- Kodagali, K. Progressive Failure Analysis of composite Materials using the Puck Failure Criteria. Master’s Thesis, College of Engineering and Computing, University of South Carolina, Columbia, SC, USA, 2017. [Google Scholar]
- Jiang, Y. Measurement of J-integral Values of Dental Ceramics by Digital Image Correlation. Master’s Thesis, Department of Mechanical Engineering, Case Western Reserve University, Cleveland, OH, USA, 2016. [Google Scholar]
- Catalanotti, G.; Camanho, P.P.; Xavier, J.; Dávila, C.G.; Marques, A.T. Measurement of resistance curves in the longitudinal failure of composites using digital image correlation. Compos. Sci. Technol. 2010, 70, 1986–1993. [Google Scholar] [CrossRef] [Green Version]
- Camanho, P.P.; Ercin, G.H.; Catalanotti, G.; Mahdi, S.; Linde, P. A finite fracture mechanics model for the prediction of the open-hole strength of composite laminates. Compos. Part. A Appl. Sci. Manuf. 2012, 43, 1219–1225. [Google Scholar] [CrossRef] [Green Version]
- Bao, H.; Liu, G. Progressive failure analysis on scaled open-hole tensile composite laminates. Compos. Struct. 2016, 50, 173–180. [Google Scholar] [CrossRef]
- Joseph, A.P.K.; Davinson, P.; Waas, A.M. Open hole and filled hole progressive damage and failure analysis of composite laminates with a countersunk hole. Compos. Struct. 2018, 203, 523–538. [Google Scholar] [CrossRef]
- Tohaga, V.; Skovsgaard, S.P.H.; Jensen, H.M. Micromechanics of kink band formation in open-hole fibre composites under compressive loading. Compos. Part. B Eng. 2018, 149, 66–73. [Google Scholar] [CrossRef]
- Pierron, F.; Green, B.; Wisnom, M.R. Full-field assessment of the damage process of laminated composite open-hole tensile specimens. Part I: Methodology. Compos. Part. A Appl. Sci. Manuf. 2007, 38, 2307–2320. [Google Scholar] [CrossRef]
- Zhou, S.; Zhang, J.; Sun, Y.; Tian, K. Experimental and numerical investigation of open hole carbon fiber composite laminates under compression with three different stacking sequences. J. Mater. Res. Technol. 2019, 8, 2957–2968. [Google Scholar] [CrossRef]
- Caminero, M.A.; Lopez-Pedrosa, M.; Pinna, C.; Soutis, C. Damage monitoring and analysis of composite laminates with an open hole and adhesively repairs using digital image correlation. Compos. Part. B Eng. 2013, 53, 76–91. [Google Scholar] [CrossRef]
- Moure, M.M.; Otero, F.; Garcia-Castillo, S.K.; Sanchez-Saez, S.; Barbero, E.; Barbero, E.J. Damage evolution in open-hole laminated composite plates subjected to in-plane loads. Compos. Struct. 2015, 133, 1048–1057. [Google Scholar] [CrossRef] [Green Version]
- Zhang, D.; Zheng, X.; Wu, T. Damage characteristics of open-hole laminated composites subjected to longitudinal loads. Compos. Struct. 2019, 230, 111474. [Google Scholar] [CrossRef]
- Liu, H.; Falzon, B.G.; Li, S.; Tan, W.; Liu, J.; Chai, H.; Blackman, B.R.K.; Dear, J.P. Compressive failure of woven fabric reinforced thermoplastic composites with an open-hole: An experimental and numerical study. Compos. Struct. 2019, 213, 108–117. [Google Scholar] [CrossRef] [Green Version]
- Hashin, Z. Failure criteria for unidirectional fiber composites. J. Appl. Mech. 1980, 47, 329–334. [Google Scholar] [CrossRef]
- Hashin, Z.; Rotem, A. A fatigue failure criterion for fiber-reinforced materials. J. Compos. Mater. 1973, 7, 448–464. [Google Scholar] [CrossRef] [Green Version]
- Standard, A.S.T.M. Standard Test Method for Tensile Properties of Polymer Matrix Composite Materials; ASTM D3039/D3039M-14; ASTM International: Philadelphia, PA, USA, 2014. [Google Scholar]
- Standard, A.S.T.M. Standard Test Method for Compressive Properties of Polymer Matrix Composite Materials with Unsupported Gage Section by Shear Loading; ASTM D3410/D3410M-16; ASTM International: Philadelphia, PA, USA, 2016. [Google Scholar]
- Standard, A.S.T.M. Standard Test Method for Shear Properties of Composite Materials by the V-Notched Beam Method; ASTM D5379/D5379M-12; ASTM International: Philadelphia, PA, USA, 2012. [Google Scholar]
- Pinho, S.T.; Robinson, P.; Iannucci, L. Fracture toughness of the tensile and compressive fibre failure modes in laminated composites. Compos. Sci. Technol. 2006, 66, 2069–2079. [Google Scholar] [CrossRef] [Green Version]
- Laffan, M.J.; Pinho, S.T.; Robinson, P.; Iannucci, L. Measurement of the in situ ply fracture toughness associated with mode I fibre tensile failure in FRP. Part I: Data reduction. Compos. Sci. Technol. 2010, 70, 606–613. [Google Scholar] [CrossRef]
- Laffan, M.J.; Pinho, S.T.; Robinson, P.; Iannucci, L. Measurement of the in situ ply fracture toughness associated with mode I fibre tensile failure in FRP. Part II: Size and lay-up effects. Compos. Sci. Technol. 2010, 70, 614–621. [Google Scholar] [CrossRef]
- Standard, A.S.T.M. Standard Test Method for Open-Hole Compressive Strength of Polymer Matrix Composite Laminates; ASTM D6484/D6484M-14; ASTM International: Philadelphia, PA, USA, 2014. [Google Scholar]
- Hundley, J.M.; Hahn, H.T.; Yang, J.M.; Facciano, A.B. Three-dimensional progressive failure analysis of bolted titanium graphite fiber metal laminate joints. J. Compos. Mater. 2011, 45, 751–769. [Google Scholar] [CrossRef]
- Wang, Y.; Tong, M.; Zhu, S. Three Dimensional Continuum Damage Mechanics Model of Progressive Failure Analysis in Fibre-Reinforced Composite Laminates. In Proceedings of the 50th AIAA/ASME/ASCE/AHS/ASC Structures, Structural Dynamics, and Materials Conference, Palm Springs, CA, USA, 4–7 May 2009; p. 2629. [Google Scholar]
- Jung, K.H.; Kim, D.H.; Kim, H.J.; Park, S.H.; Jhang, K.Y.; Kim, H.S. Finite element analysis of a low-velocity impact test for glass fiber-reinforced polypropylene composites considering mixed-mode interlaminar fracture toughness. Compos. Struct. 2017, 160, 446–456. [Google Scholar] [CrossRef]
- Paiva, J.M.F.D.; Mayer, S.; Rezende, M.C. Evaluation of Mechanical Properties of Four Different Carbon/Epoxy Composites Used in Aeronautical Field. Mat. Res. 2005, 8, 91–97. [Google Scholar] [CrossRef] [Green Version]
- Gutkin, R.; Pinho, S.T. Combining damage and friction to model compressive damage growth in fibre-reinforced composites. J. Compos. Mater. 2015, 49, 2483–2495. [Google Scholar] [CrossRef] [Green Version]
- Sharma, G.S.; Skvortsov, A.; MacGillivray, I.; Kessissoglou, N. Sound absorption by rubber coatings with periodic voids and hard inclusions. Appl. Acoust. 2019, 143, 200–210. [Google Scholar] [CrossRef]
- Sharma, G.S.; Skvortsov, A.; MacGillivray, I.; Kessissoglou, N. Sound transmission through a periodically voided soft elastic medium submerged in water. Wave Motion 2017, 70, 101–112. [Google Scholar] [CrossRef]
- Sharma, G.S.; Skvortsov, A.; MacGillivray, I.; Kessissoglou, N. Acoustic performance of periodic steel cylinders embedded in a viscoelastic medium. J. Sound Vib. 2019, 443, 652–665. [Google Scholar] [CrossRef]
Figure 1.
Material property degradation behavior in damaged composite laminates.

Figure 2.
Stress-displacement relationship for progressive failure analysis.

Figure 3.
Geometry and dimensions for open-hole specimen (unit: mm).

Figure 4.
Test configuration for tensile and compressive tests of open-hole composite laminate.

Figure 5.
3D FEM model for open-hole tensile specimen.

Figure 6.
Controlled mesh number near the open hole to verify the mesh dependency of PFA.

Figure 7.
Load-displacement curves for different mesh cases.

Figure 8.
Maximum Load value according to total number of elements.

Figure 9.
Tensile load-displacement curves for one-open-hole tensile tests and the PFA.

Figure 10.
Compressive load-displacement curves for one-open-hole compressive tests and the PFA.

Figure 11.
Load-displacement curves for two-open-hole tests and PFA results under (a) tensile, and (b) compressive loading conditions.
Figure 11.
Load-displacement curves for two-open-hole tests and PFA results under (a) tensile, and (b) compressive loading conditions.

Figure 12.
Longitudinal strain () contour at fracture moment obtained from PFA.

Figure 13.
Longitudinal strain () contour at fracture moment obtained from DIC.

Figure 14.
Location of attached strain gauges and longitudinal strain () value comparison for one-open-hole tensile tests: (a) Location of strain gauges, (b) strain comparison results for Type 1, and (c) strain comparison results for Type 2 stacking sequences.
Figure 14.
Location of attached strain gauges and longitudinal strain () value comparison for one-open-hole tensile tests: (a) Location of strain gauges, (b) strain comparison results for Type 1, and (c) strain comparison results for Type 2 stacking sequences.

Figure 15.
Location of attached strain gauges and longitudinal strain () value comparison for one-open-hole compressive tests: (a) Location of strain gauges, (b) strain comparison results for location ① and ②, and (c) strain comparison results for location ③ of the specimens.
Figure 15.
Location of attached strain gauges and longitudinal strain () value comparison for one-open-hole compressive tests: (a) Location of strain gauges, (b) strain comparison results for location ① and ②, and (c) strain comparison results for location ③ of the specimens.

Figure 16.
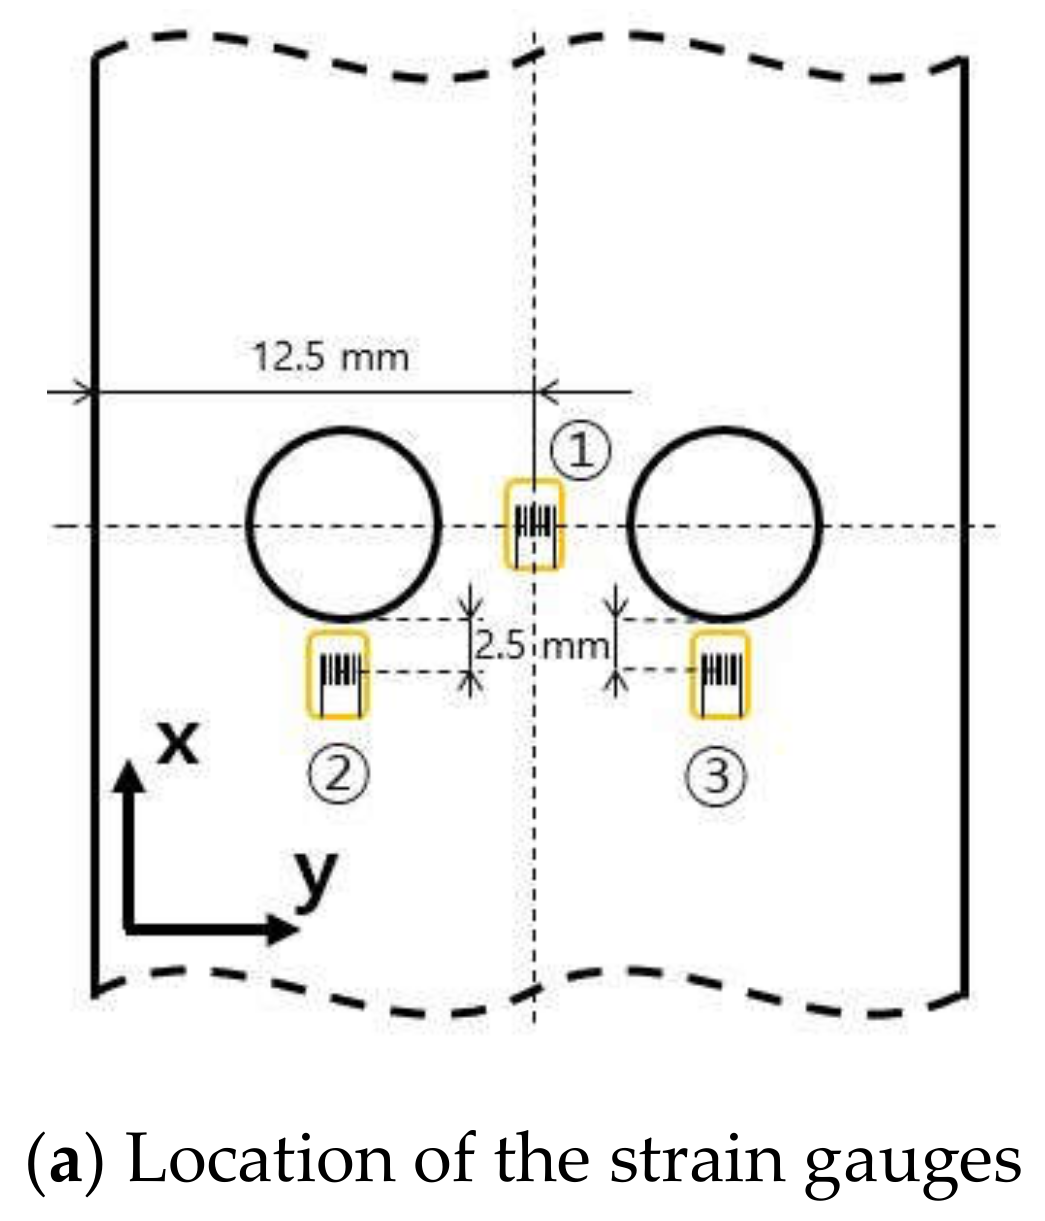
Location of attached strain gauges and longitudinal strain () value comparison for two-open-hole tensile tests: (a) Location of strain gauges, (b) strain comparison results for location ①, and (c) strain comparison results for location ② and ③ of the specimens.
Figure 16.
Location of attached strain gauges and longitudinal strain () value comparison for two-open-hole tensile tests: (a) Location of strain gauges, (b) strain comparison results for location ①, and (c) strain comparison results for location ② and ③ of the specimens.


Figure 17.
Location of attached strain gauges and longitudinal strain () value comparison for two-open-hole compressive tests: (a) Location of strain gauges, (b) strain comparison results for location ①, and (c) strain comparison results for location ② and ③ of the specimens.
Figure 17.
Location of attached strain gauges and longitudinal strain () value comparison for two-open-hole compressive tests: (a) Location of strain gauges, (b) strain comparison results for location ①, and (c) strain comparison results for location ② and ③ of the specimens.


Figure 18.
Load-displacement curve for one-open-hole tensile analysis result with each damage points and the corresponding calculated damage contour when the (a) shear failure, (b) matrix tension failure, and (c) fiber tension failure damage variable become 1 or greater, and (d) final fracture occurs.

Figure 19.
Load-displacement curve for two-open-hole compressive analysis result with each damage points and the corresponding calculated damage contour when the (a) shear failure and (b) matrix tension failure damage variable become 1 or greater and (c) final fracture occurs.
Figure 19.
Load-displacement curve for two-open-hole compressive analysis result with each damage points and the corresponding calculated damage contour when the (a) shear failure and (b) matrix tension failure damage variable become 1 or greater and (c) final fracture occurs.


Figure 20.
Fractured test specimen for (a) one-open-hole tensile test and (b) two-open-hole compressive test.
Figure 20.
Fractured test specimen for (a) one-open-hole tensile test and (b) two-open-hole compressive test.


Table 1.
Properties for T700/Epoxy composite material.
| Property | Symbol | Units | Value |
|---|---|---|---|
| Longitudinal modulus | GPa | 147.7 | |
| Transverse modulus | GPa | 8.52 | |
| Shear modulus | GPa | 4.59 | |
| Poisson’s ratio | - | 0.3 | |
| Longitudinal tensile strength | MPa | 2737 | |
| Transverse tensile strength | MPa | 1600 | |
| Longitudinal compressive strength | MPa | 51.32 | |
| Transverse compressive strength | MPa | 201.08 | |
| Shear strength | MPa | 81.0 | |
| Fiber tensile fracture energy | kN/m2 | 180 | |
| Fiber compressive fracture energy | kN/m2 | 100 | |
| Matrix tensile fracture energy | kN/m2 | 0.30 | |
| Matrix compressive fracture energy | kN/m2 | 1.71 |
Table 2.
Specimen types according to stacking sequence.
| Specimen Type | Stacking Sequence |
|---|---|
| Type 1 | [0/+45/−45/90]s |
| Type 2 | [0/+45/0/−45]s |
© 2019 by the authors. Licensee MDPI, Basel, Switzerland. This article is an open access article distributed under the terms and conditions of the Creative Commons Attribution (CC BY) license (http://creativecommons.org/licenses/by/4.0/).
Share and Cite
MDPI and ACS Style
Yoon, D.; Kim, S.; Kim, J.; Doh, Y. Development and Evaluation of Crack Band Model Implemented Progressive Failure Analysis Method for Notched Composite Laminate. Appl. Sci. 2019, 9, 5572. https://doi.org/10.3390/app9245572
AMA Style
Yoon D, Kim S, Kim J, Doh Y. Development and Evaluation of Crack Band Model Implemented Progressive Failure Analysis Method for Notched Composite Laminate. Applied Sciences. 2019; 9(24):5572. https://doi.org/10.3390/app9245572
Chicago/Turabian StyleYoon, Donghyun, Sangdeok Kim, Jaehoon Kim, and Youngdae Doh. 2019. "Development and Evaluation of Crack Band Model Implemented Progressive Failure Analysis Method for Notched Composite Laminate" Applied Sciences 9, no. 24: 5572. https://doi.org/10.3390/app9245572
Note that from the first issue of 2016, this journal uses article numbers instead of page numbers. See further details here.