SMOTE-ENC: A Novel SMOTE-Based Method to Generate Synthetic Data for Nominal and Continuous Features


School of Computer Science, University of Sydney, Sydney, NSW 2006, Australia
*
Author to whom correspondence should be addressed.
Appl. Syst. Innov. 2021, 4(1), 18; https://doi.org/10.3390/asi4010018
Submission received: 25 December 2020
/
Revised: 17 February 2021
/
Accepted: 18 February 2021
/
Published: 2 March 2021
(This article belongs to the Collection Feature Paper Collection in Applied System Innovation)
Abstract
:Real-world datasets are heavily skewed where some classes are significantly outnumbered by the other classes. In these situations, machine learning algorithms fail to achieve substantial efficacy while predicting these underrepresented instances. To solve this problem, many variations of synthetic minority oversampling methods (SMOTE) have been proposed to balance datasets which deal with continuous features. However, for datasets with both nominal and continuous features, SMOTE-NC is the only SMOTE-based oversampling technique to balance the data. In this paper, we present a novel minority oversampling method, SMOTE-ENC (SMOTE—Encoded Nominal and Continuous), in which nominal features are encoded as numeric values and the difference between two such numeric values reflects the amount of change of association with the minority class. Our experiments show that classification models using the SMOTE-ENC method offer better prediction than models using SMOTE-NC when the dataset has a substantial number of nominal features and also when there is some association between the categorical features and the target class. Additionally, our proposed method addressed one of the major limitations of the SMOTE-NC algorithm. SMOTE-NC can be applied only on mixed datasets that have features consisting of both continuous and nominal features and cannot function if all the features of the dataset are nominal. Our novel method has been generalized to be applied to both mixed datasets and nominal-only datasets.
1. Introduction
Class imbalance is one of the major obstacles in classification problems to achieve high accuracy for minority class data points. In the real world, datasets are very often heavily skewed; e.g., in medical datasets [1] for cancer detection, benign tumors significantly outnumber cancerous tumors [2,3,4,5,6,7], while in financial datasets [8] legitimate transactions outnumber fraudulent transactions [9]. When statistical models are constructed on these extremely skewed datasets, the model tends to predict every instance as a member of the overrepresented class, making the model inefficient when used to identify underrepresented class instances, which is especially critical when classifying minority instances is the point of interest.
In order to solve this problem, in machine learning algorithms, different approaches are adopted which broadly can be divided into three categories: tuning cost function [10], sampling [11] and modifying learning algorithm [12]. Among these, sampling techniques are one of the widely accepted methods to balance the skewed dataset. Two of the earliest proposed sampling methods were random undersampling [13] and random oversampling: the former samples majority class data points to form a representative set of similar size to the underrepresented class and discards the rest while the latter replicates some of the minority class data points to balance the dataset. However, by adding additional copies to some minority class instances, random oversampling leads to overfitting and by removing samples removes potentially valuable data [14], while random undersampling causes underfitting. Hence, both of them exhibit poor generalization of unseen data.
As an alternative, in 2002, Chawla et al. [15] proposed a novel oversampling method, SMOTE, where instead of replicating existing instances, new instances were synthesized to balance the dataset. In SMOTE, for each underrepresented instance, a predetermined number of neighbors were calculated, then some minority class instances were randomly chosen for synthetic data point creation. Finally, artificial observations were created along the line between the selected minority instance and its closest neighbors. Chawla et al. experimented with SMOTE on a wide range of datasets which showed that SMOTE can improve classifier performance for minority class. By virtue of being trained on more underrepresented examples, SMOTE decreased generalization errors.
Since then, different variations of SMOTE have been proposed [16,17,18,19,20,21]. Based on the SMOTE method, Han et al., proposed BorderLine-SMOTE, [22] where minority instances close to the class boundary were synthesized. In 2004, Batista et al. [11] proposed SMOTE-ENN and SMOTE-Tomek, which considered distribution overlap and class boundaries while generating synthetic data. In 2008, He et al., proposed ADASYN [23], which focused on difficult minority class instances and simulated synthetic data by understanding pattern of those instances. In 2016, Torres et al., proposed a variant of SMOTE, SMOTE-D [24], which, unlike SMOTE, deterministically synthesized artificial data points for underrepresented classes. All of these methods were developed considering continuous variables and when applied on datasets with categorical features, failed to identify nominal features, which resulted in creating new labels for these attributes.
To solve this problem, Chawla et al., proposed a method called SMOTE-NC [15] (SMOTE-Nominal Continuous), which treated nominal attributes differently than continuous attributes and preserved the original labels of categorical features in the resampled data. However, for multi-label nominal features, SMOTE-NC failed to interpret the difference in association between each label and minority class target. Additionally, the SMOTE-NC method can only function when the dataset has at least one continuous attribute.
In this paper, we propose a novel algorithm, SMOTE-ENC, which, irrespective of the presence of continuous features, will comprehend that different labels of nominal features have a different affinity towards minority classes. We compare this new algorithm with SMOTE-NC and our experiments indicate that this new method performs better than SMOTE-NC for datasets with numerous multi-label nominal features.
2. Materials and Methods
Since the SMOTE method is based on the k-nearest neighbor algorithm, distance calculation between two instances is the most important aspect of generating synthetic samples. In the feature space, deriving the distance between continuous variables is straightforward; however, for categorical variables, calculating the distance between two labels can be complex. In SMOTE-NC, if a label of a categorical attribute differs between an instance and its nearest neighbors, then a fixed-value, i.e., median of standard deviations of continuous features, is added in the distance calculation. Hence, in this method, for a multi-label categorical feature, the distance between any two labels is the same.
Now, let us consider a dataset where the target is to identify a potential buyer of a life insurance plan. Suppose the dataset has a nominal feature, marital status, with three labels—single, married and divorced—and the following is the percentage distribution of people who bought life insurance plan: single → 18%, divorced → 22% and married → 60%. In SMOTE-NC, the distance between married–divorced and divorced–single is considered to be the same. However, based on the data, it seems people who are divorced or single are less interested in buying life insurance than married people. So, considering the similar affinity towards the target, single and divorced labels should be closer to each other than to the married label; i.e., the distance between married–divorced should be more than that between single–divorced. In SMOTE-ENC, labels of a categorical variable are represented by their affinity of association with the minority class target.
We explain our algorithm (Algorithm 1) using a sample training dataset (Table 1) with three continuous features (C1, C2, C3) and a categorical feature (N). The dataset is imbalanced where we have 2 instances of minority class labelled as min and 3 instances of majority class labelled as maj.
| Algorithm 1. SMOTE-ENC algorithm |
| Input: t = number of minority class samples in training set; n% = amount of oversampling; k = number of nearest neighbors to be considered, s = total number of instances in training set, c = number of continous variables in the dataset, m = median of standard deviation of continuous features when c > 0 ir = t/s for each categorical feature, do for each “l” in distinct labels, do e = total number of “l” labeled instances in training set e′ = ; o = number of “l” labeled minority class instances in training set χ = ; if c > 0, l = χ * m; else, l = χ; end end Apply SMOTE (t, n, k) For the synthetic data points, the categorical attribute’s value is decided as the value in the majority of its nearest neighbors. Inverse-encode categorical values to their original labels. |
In SMOTE-NC, the distance between i1–i2 is calculated as follows:
The standard deviations of the three continuous features (C1, C2, C3) associated with minority class min, are 70.71, 31.82 and 21.92 respectively, and the median m, of these numbers is 31.82. The distance between the two instances i1 and i2 are calculated as:
In our algorithm (SMOTE-ENC), we do the encoding of nominal labels as follows (alphabetical notations are same as Algorithm 1):
Imbalance ratio (ir) = 2/5 = 0.4.
Total ‘a’ label in our training dataset (e) = 2.
Total ‘a’ label associated with minority class (min) o = 1.
If ‘a’ label had equal affinity towards min and maj class, then the total number of ‘a’ labeled instances in minority samples would be = 2 × 0.4 = 0.8.
Encoding of ‘a’ for all target min = .
Total ‘b’ label in our training dataset (e) = 3.
Total ‘b’ label associated with minority class (min) o = 1.
If ‘b’ label had equal affinity towards min and maj class, then total number of ‘b’ labeled instances in minority samples would be = 3 × 0.4 = 1.2.
Encoding of ‘b’ for all target min = = −5.30.
We can see that the distance between two data rows in our sample dataset is reduced when calculated by SMOTE-ENC. Hence, it can be said that, in SMOTE-NC, inter and intra level distance of categorical levels are always the same; whereas in SMOTE-ENC, nominal features are encoded as numeric values and the difference between two such numeric value reflects the amount of change of association with minority classes and hence seems to produce better result than SMOTE-NC.
By applying this algorithm on the nominal features, we can encode each label as a numeric value where a higher value of a label indicates stronger association with a minority class. This encoding is inspired by Pearson’s chi-squared test [25], which can confirm if two categorical variables are related. However, in this method, our objective is not to determine if the nominal features of the samples are related to the target, but rather to quantify the distance between two data points when the label of a categorical variable is changed. Hence, we do not use the chi-squared test, i.e., χ2, but rather use chi (χ) for each label of a nominal feature to measure the amount of association of that label with the minority class target. The magnitude of χ (i.e., chi) is a fraction and when included in the distance calculation between two samples can become insignificant as the difference between two values of a continuous feature is often significantly higher. For this reason, if the dataset has continuous features, χ is multiplied by the median of the standard deviation of the continuous variable to make the value comparable to other continuous attributes. However, if the dataset has only nominal features, chi (χ) is directly used in distance calculation.
We compared our proposed method, SMOTE-ENC, with SMOTE-NC on five different datasets. These datasets have diverse minority to majority ratio, which offers a broad range for testing this algorithm’s efficiency. Among these datasets, forest cover data had 7 classes. We evaluated our model on a pair of classes of the original dataset and discarded the rest of the instances.
The metrics used in our study to evaluate the models’ performance were precision, recall, F-beta score, area under precision recall curve and area under ROC curve. Accuracy was not used as an evaluation metric in this paper, as accuracy is not able to capture model performance for a highly imbalanced dataset. F-beta score is the weighted average of precision (ratio of correctly predicted positive observations to the total predicted positive observations) and recall (ratio correctly predicted positive observations to the total positive observations).
Choice of β signifies the weightage of precision and recall while 0 < β < 1 assigns more weightage to precision, 1 < β < +∞ assigns more weightage to recall. β = 1 assigns equal weightage to precision and recall and is known as the F1-score. ROC is a probability curve and the area under the ROC curve represents the degree of separability. It identifies how well the model can differentiate between classes as it balances between precision and recall. As the AUC gets higher, the model gives better prediction. This curve is plotted with true positive rate/recall against the false positive rate. However, the ROC plot can be misleading when applied to heavily imbalanced datasets as adding a lot of majority class observations can improve the AUC significantly without any improvement in precision and recall of minority class instances. For imbalanced class problems, the precision–recall curve offers better insight [26]. PRC shows the relationship between precision and recall, and its baseline moves with class distribution; e.g., for a dataset with imbalance ratio 1:10, the baseline moves to 0.09, i.e., 1/(1 + 10).
Stratified cross-validation was performed during oversampling to resolve the overoptimization problem [27]. Random forest was used as the classification algorithm on the resampled data. We created a combined estimator by using the pipeline to be applied on the data, which consisted of the oversampling method and the random forest classifier.
In this study, we used a two-tailed t-test to show that the improved results obtained using our proposed oversampling method and the model using existing oversampling method were statistically significant. The statistical test performed on precision, recall and f1-score results. The p-value of 0.05 has been used as a threshold for the statistical significance.
3. Results
We compared SMOTE-ENC’s performance with SMOTE-NC’s precision, recall, F1-score, and area under PRC and ROC on five different datasets. The performance of each one is discussed below in Table 2.
3.1. Evaluation on Banking Telemarketing Dataset
This is a publicly available dataset to predict the success of telemarketing.
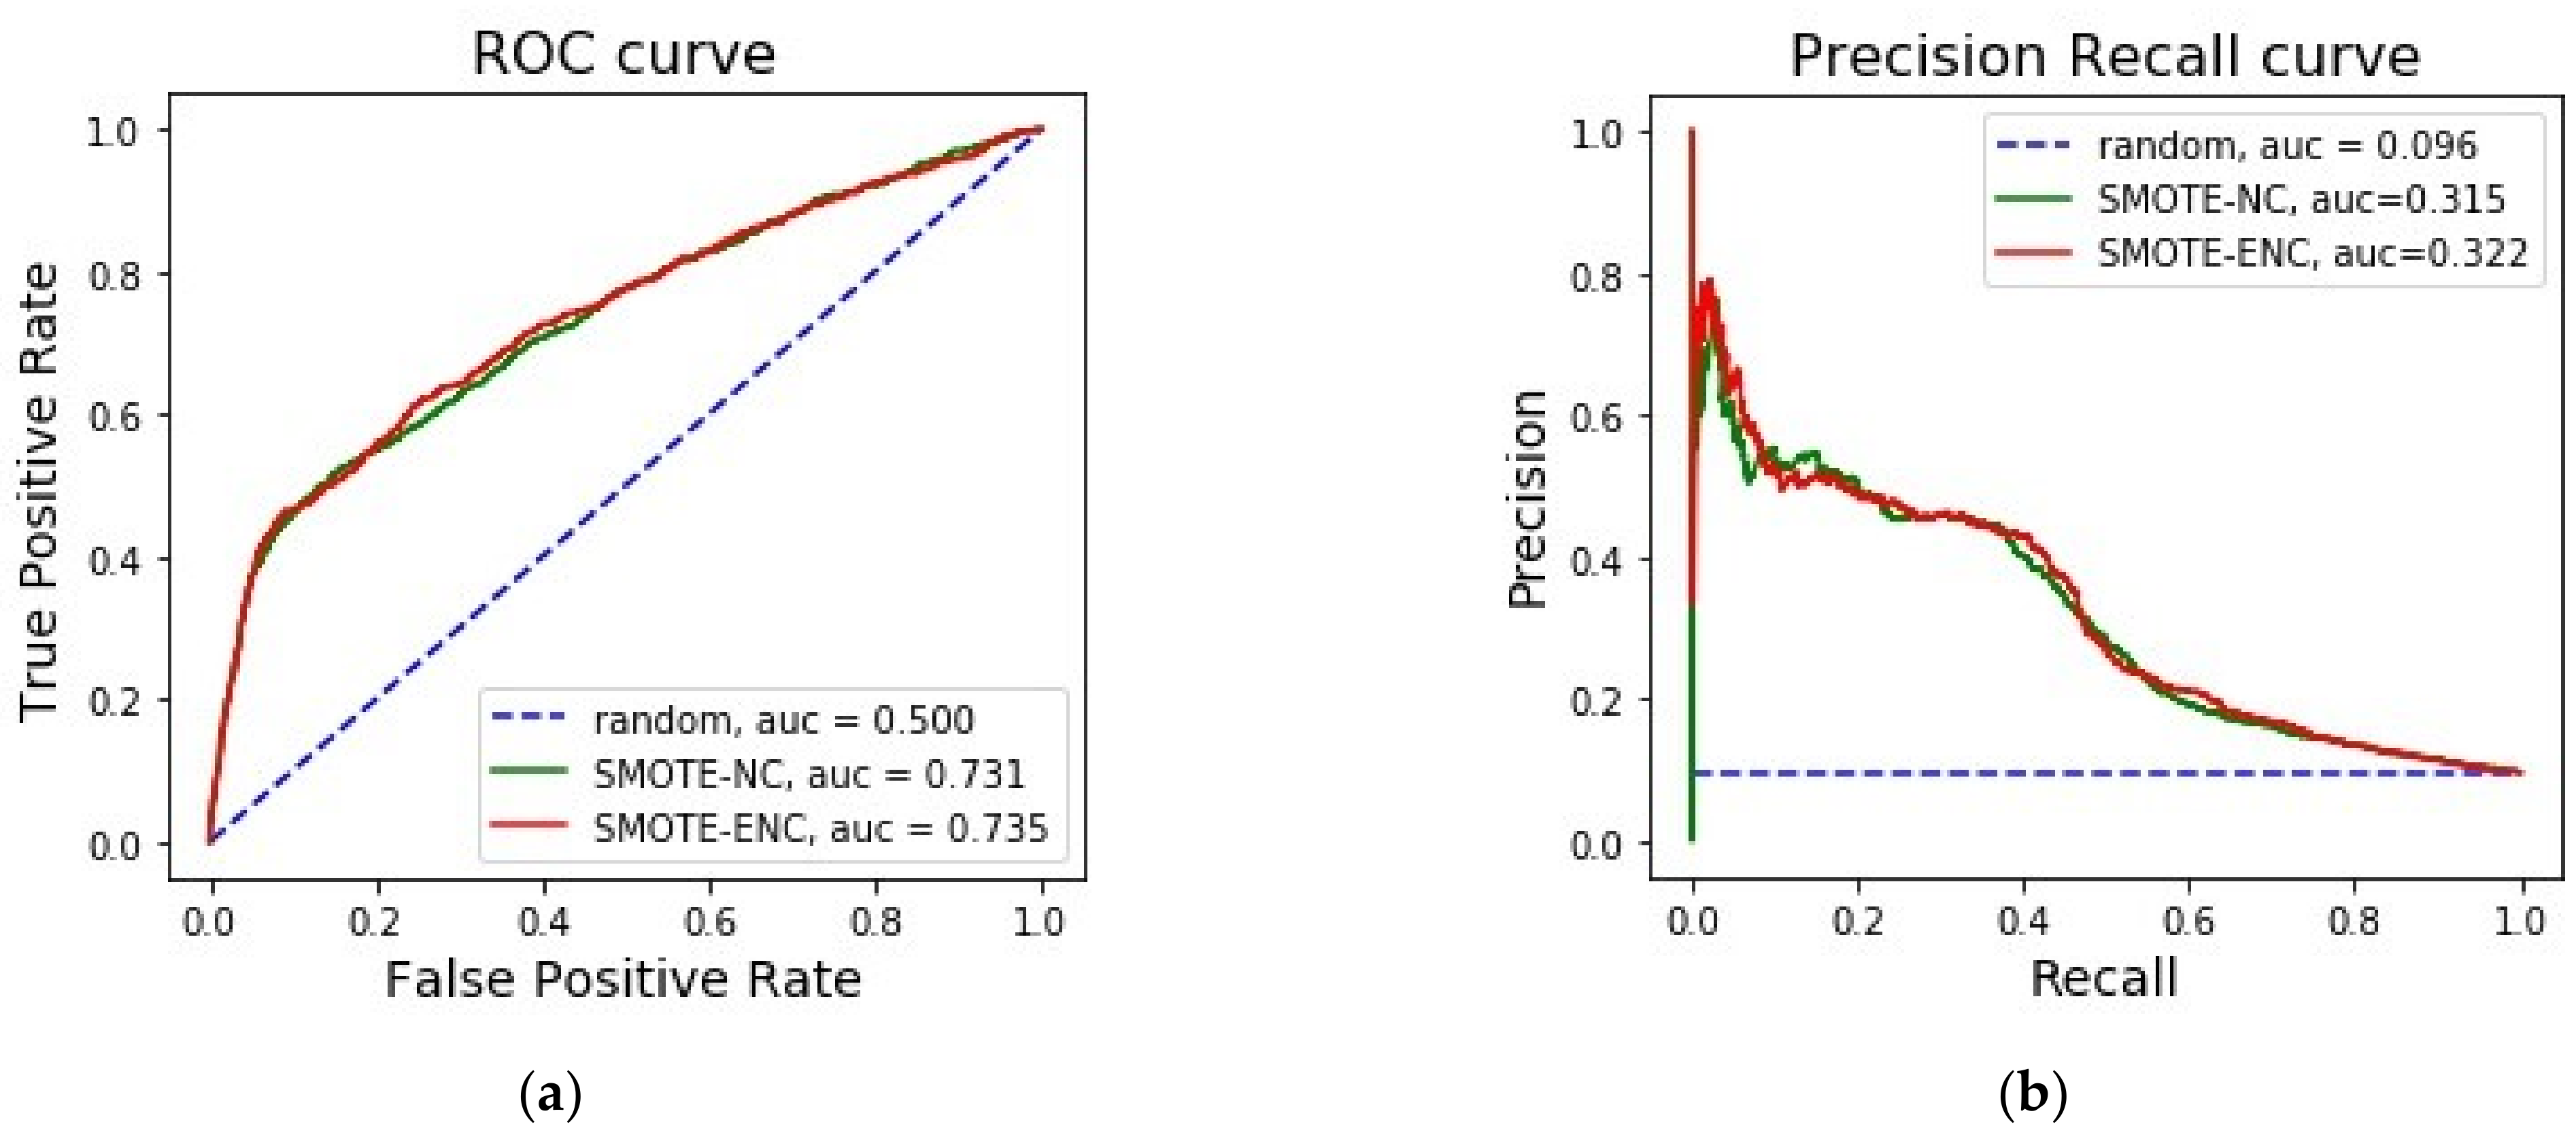
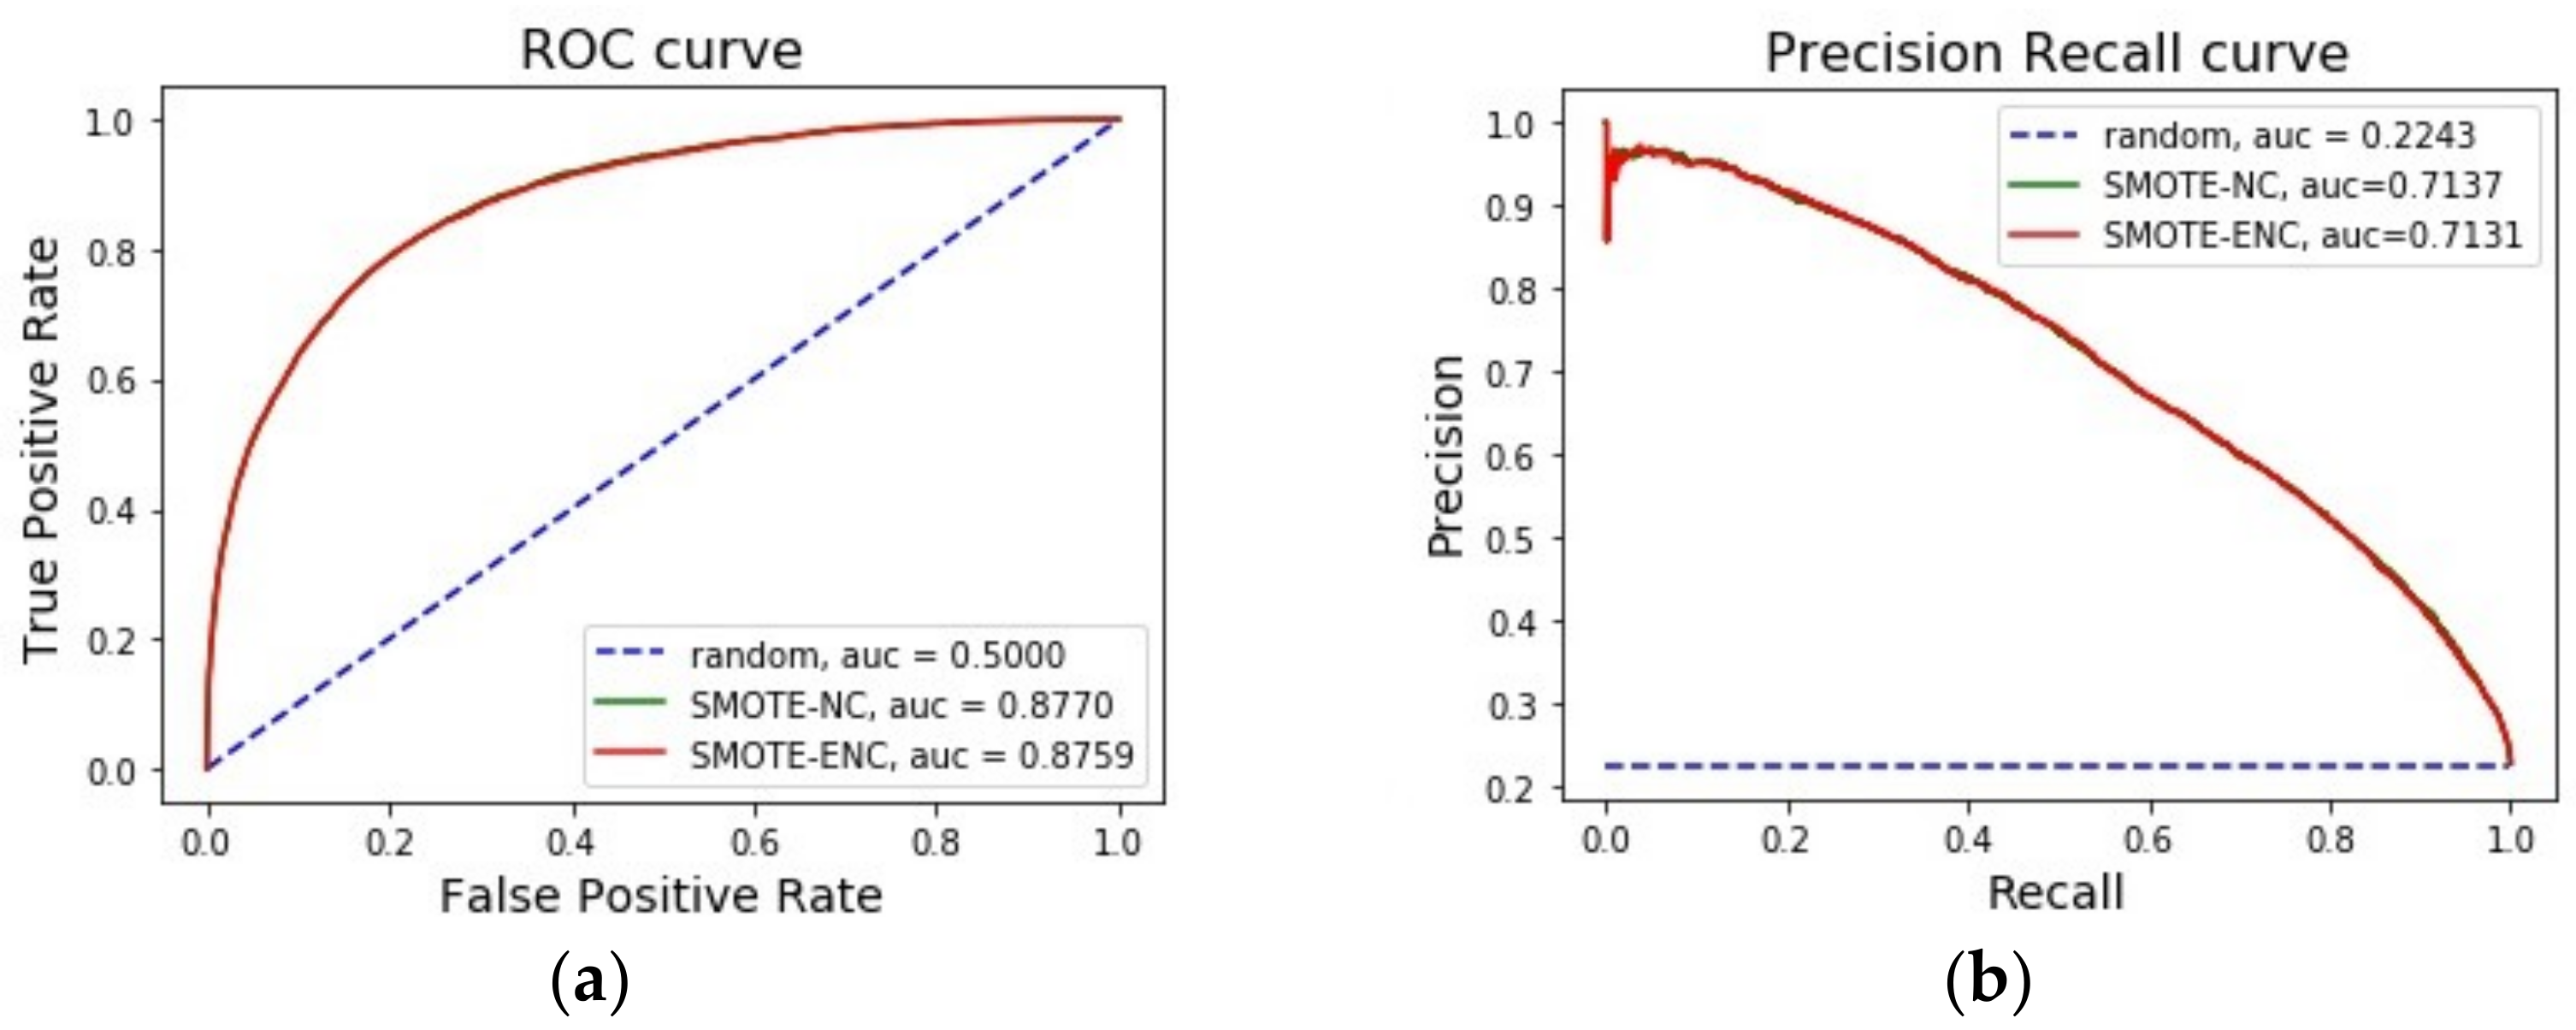
From Table 2, it is observed that, for the bank dataset, SMOTE-ENC achieved a significantly greater improvement in precision and F1-score at threshold 0.5 than SMOTE-NC on minority class instances. We further compared these two methods using ROC and precision–recall curve. Figure 1 demonstrates that SMOTE-ENC was a better sampling method than SMOTE-NC for the banking dataset when identifying minority class instances was the focus of interest. We further looked at the statistical significance of our improved results and identified that the p-value from the two tailed t-test was less than 0.002 for precision, recall and f1-score. This shows that our improved performance was statistically significant. Therefore, it can be said SMOTE-ENC has been able to interpret nominal features more accurately while generating synthetic data points. We further looked at whether SMOTE-ENC had any effect on the change of importance of features (Figure 2).
In the banking dataset, euribor3m, cons.price.idx, cons.conf.idx, age and campaign were continuous features. Figure 2 shows that the top three important features were continuous variables, which remained unchanged, contributing >0.55 importance towards classification. A slight shift in the importance of low-ranked features was observed.
3.2. Evaluation on Credit Card Dataset
This is a publicly available dataset to predict churning customers.
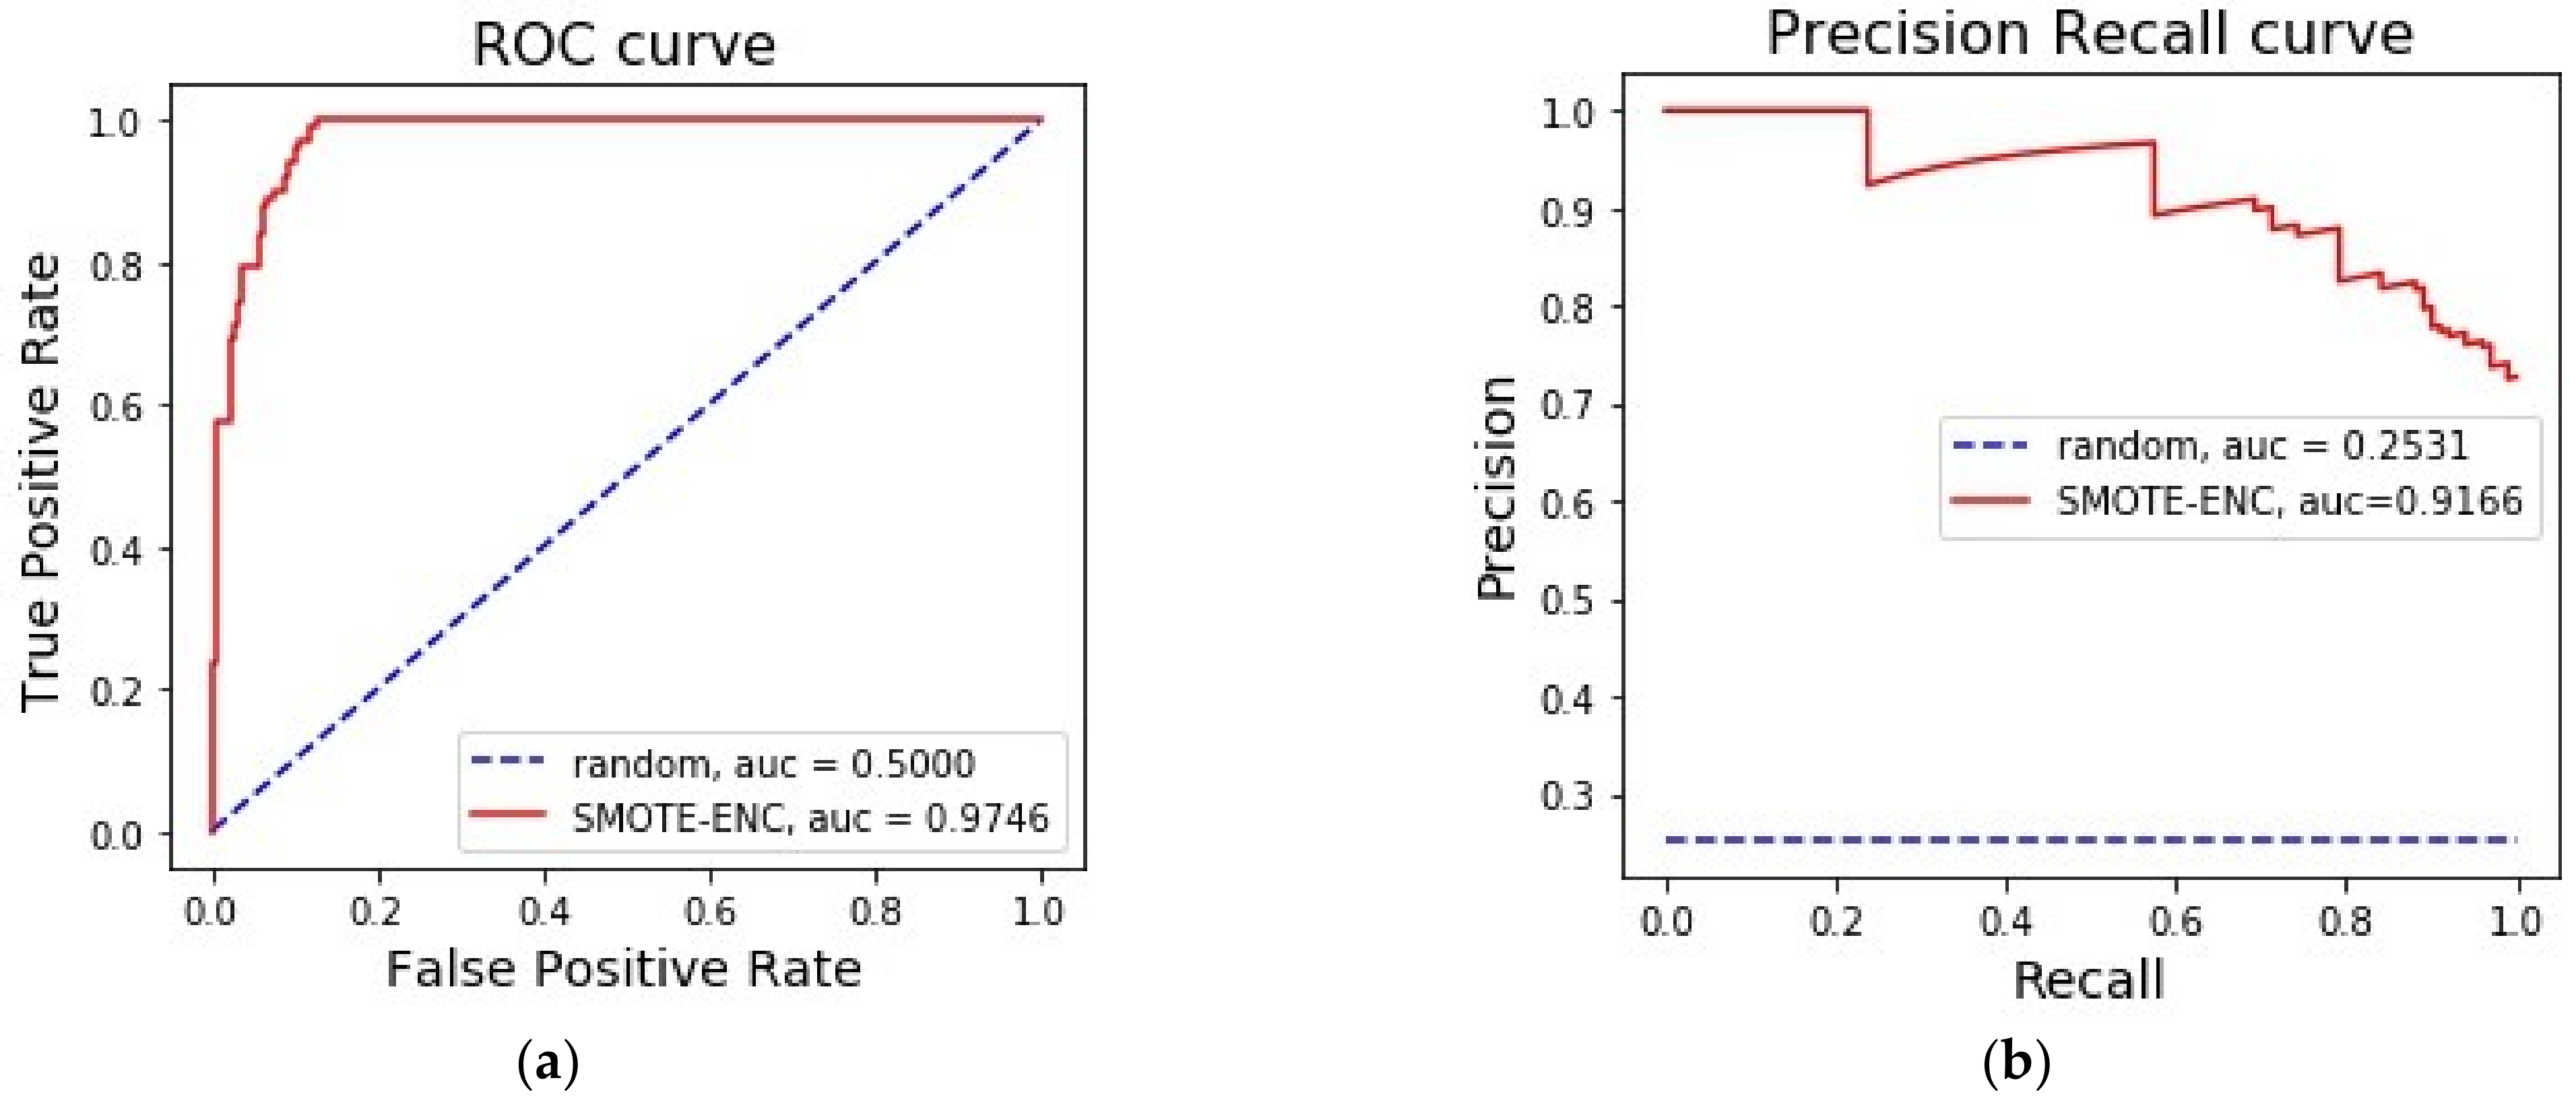
Table 2 demonstrates that SMOTE-ENC yielded significantly better results than SMOTE-NC in terms of precision and F1-score at threshold 0.5 on minority class instances for this dataset, and Figure 3 shows that SMOTE-ENC attained higher ROC and PRC scores than SMOTE-NC. The difference between these two models’ performances was statistically significant as the p-value from the two tailed t-test was less than 0.004 for precision, recall and f1-score. Hence, it can be said that the new SMOTE-ENC method was a better sampling method than SMOTE-NC for this credit card dataset when identifying minority class instances was the point of interest. We further looked at whether SMOTE-ENC had any effect on the change of importance of features (Figure 4).
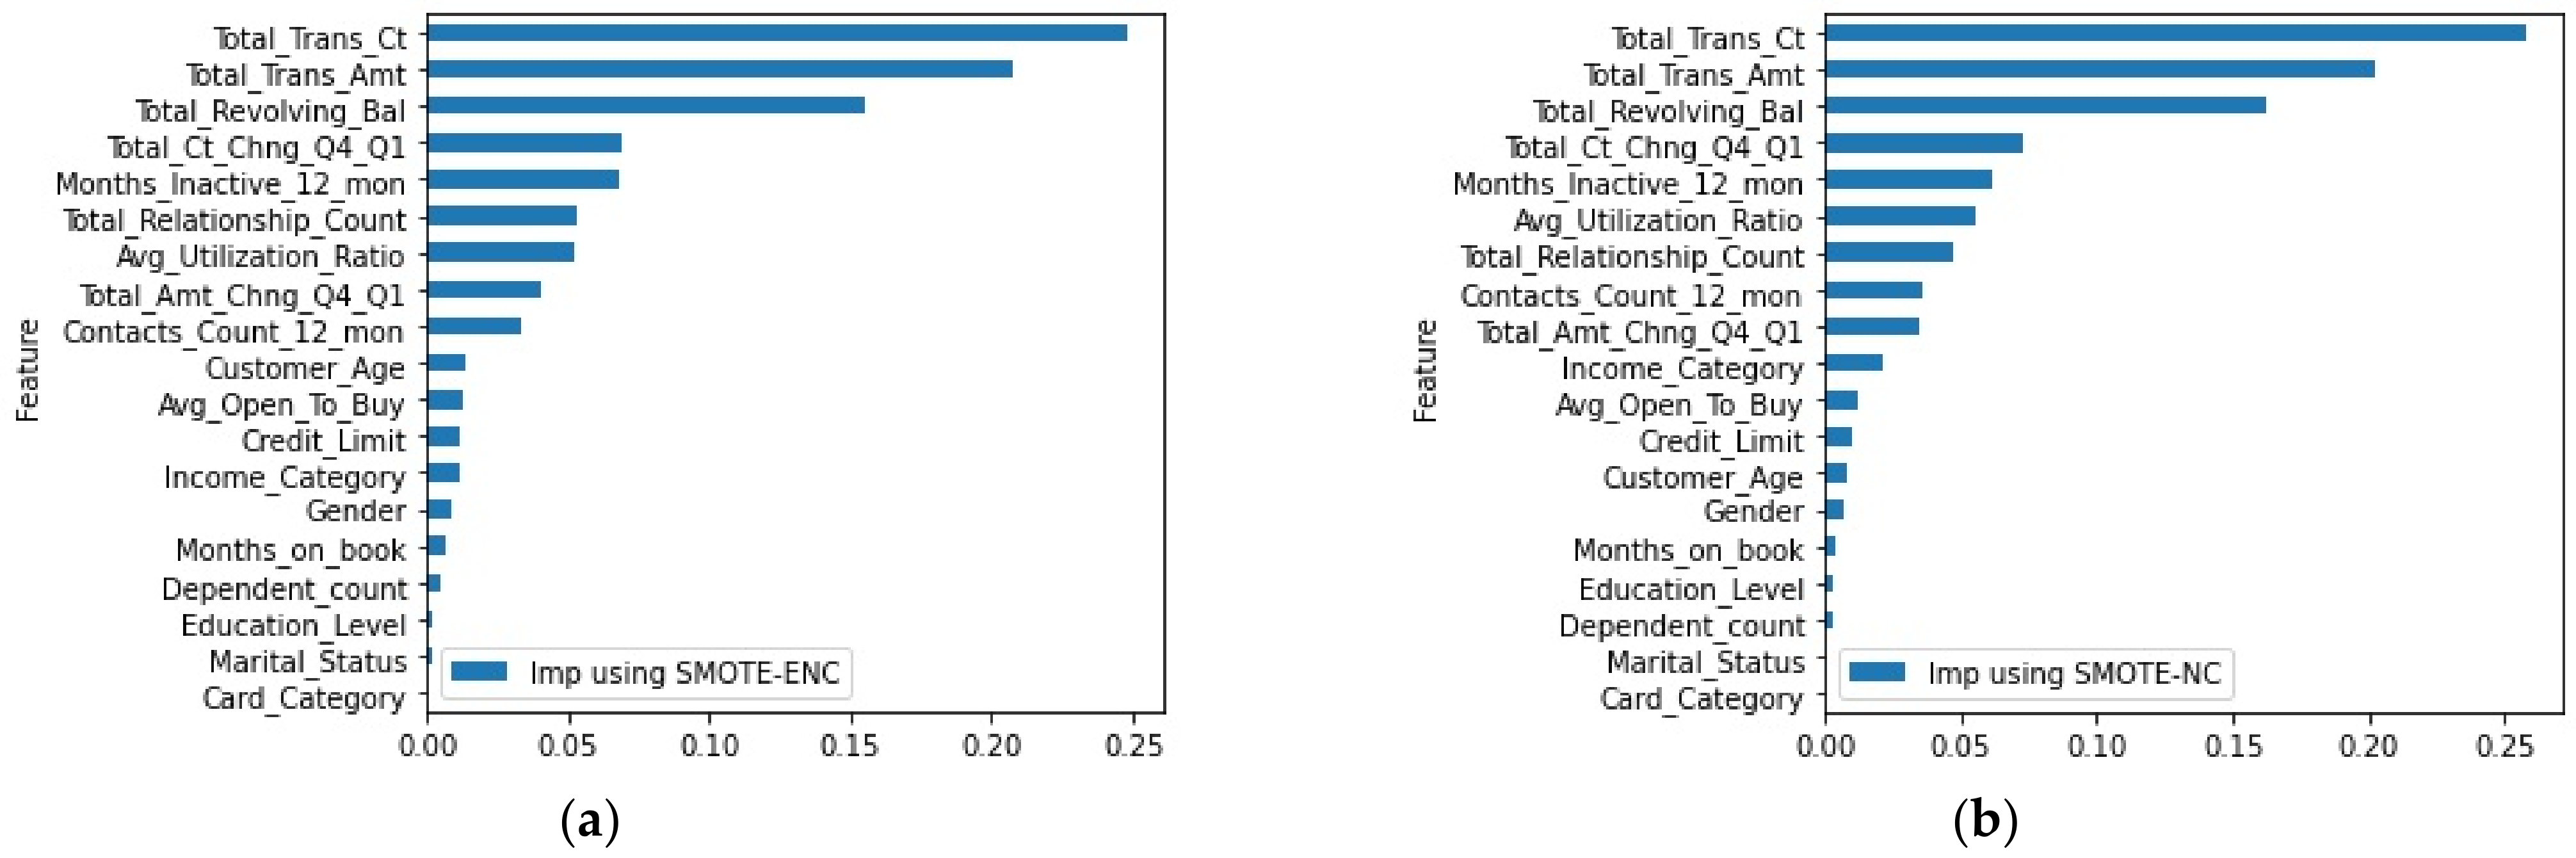
From Figure 4, it can be observed that none of the five nominal features of this dataset came up in the top 10 feature importance ranking using the random forest classifier. Application of our method, SMOTE-ENC, did not change this ranking showing that our SMOTE-ENC improved performance by interpreting nominal features in a different way; however, it did not diminish the continuous features’ contribution in model prediction.
3.3. Evaluation on Car Dataset
This is a publicly available dataset to evaluate cars.
In SMOTE-NC, the distance between two levels of a categorical feature is the median of standard deviations of all continuous features for the minority class. So, and in order for SMOTE-NC to work, datasets need to have at least one continuous feature.
The car dataset used in this study did not have any continuous features to predict the target outcome. All of its attributes were multi-level categorical features. For this reason, SMOTE-NC could not handle this dataset.
However, the new SMOTE-ENC method could be applied to this dataset because, in our SMOTE-ENC algorithm, inter-level distance of a nominal feature is not dependent on a continuous feature’s presence and hence has been generalized to handle both mixed datasets (i.e., datasets containing nominal and continuous features) and nominal-only datasets.
3.4. Evaluation on Forest Cover Dataset with Class 2 and 6
This is a publicly available dataset to predict forest cover type.
For the forest cover dataset with class 2 and 6, it was observed from Table 2 that, while precision was consistent for both of the sampling techniques, using SMOTE-ENC increased recall of the minority class observations, which resulted in marginal improvement of the F1-score for SMOTE-ENC at threshold 0.5.
The precision–recall curve (Figure 6) showed that SMOTE-ENC was marginally better than SMOTE-NC for this dataset. However, the area under ROC and PR curve being high implied that the classes were easily separable, which makes the importance of sampling method less prominent. For this reason, we one-hot encoded the categorical features and applied SMOTE to resample the data. In this dataset, we had two categorical features, soil type and wilderness_area. While the former contained 40 labels, the latter had four labels.
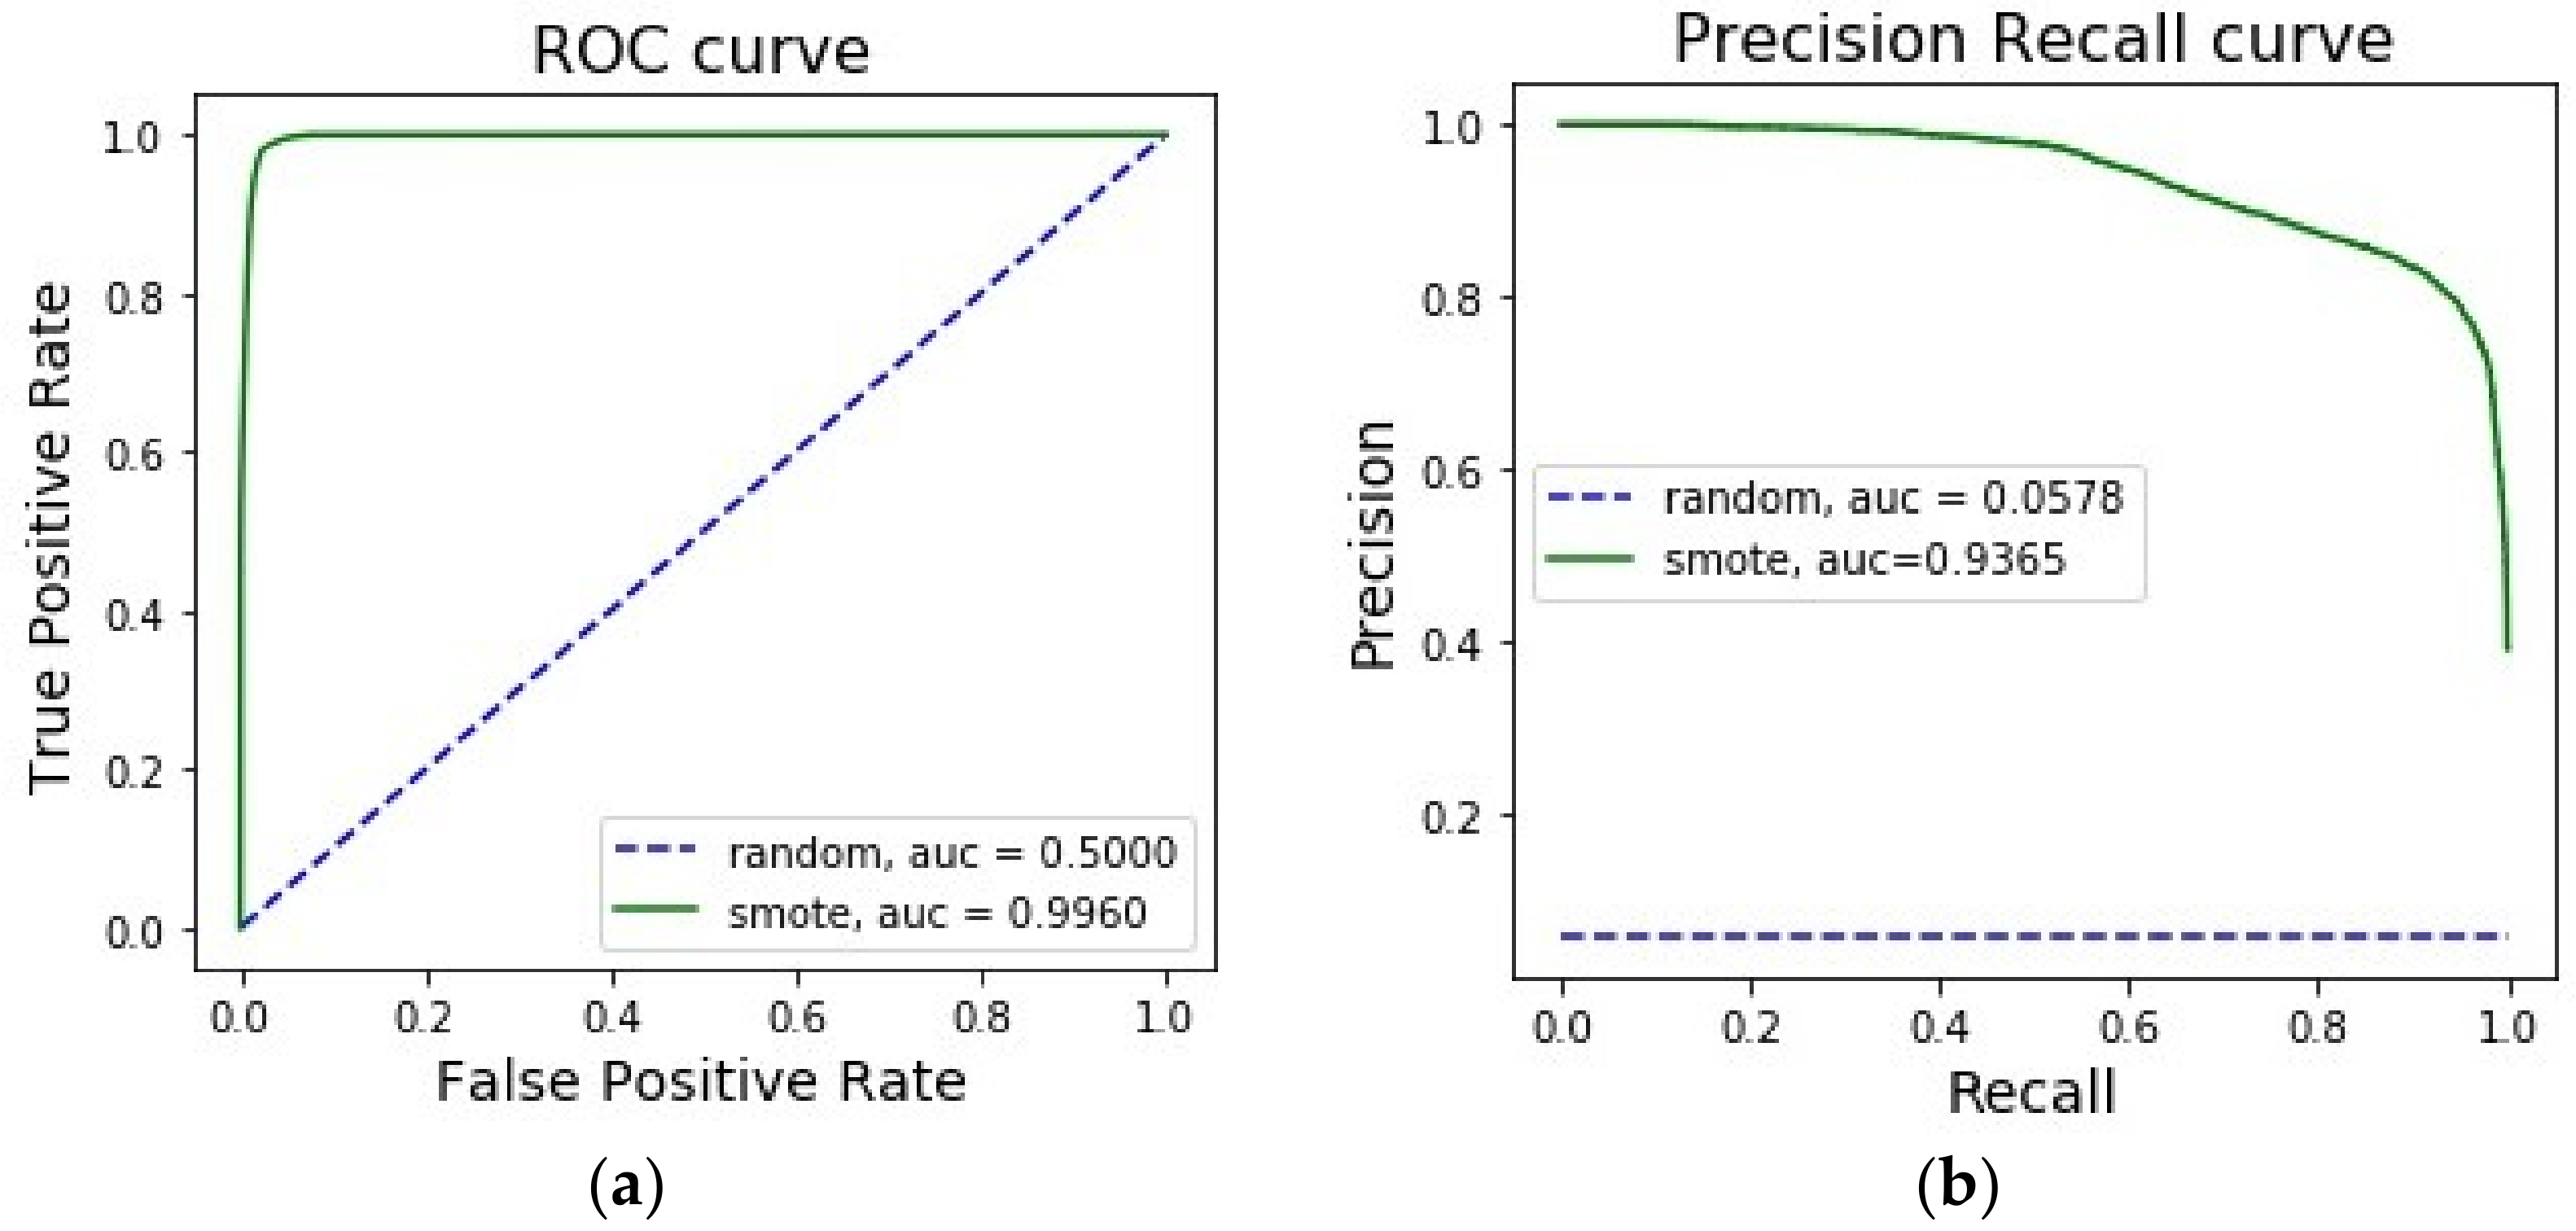
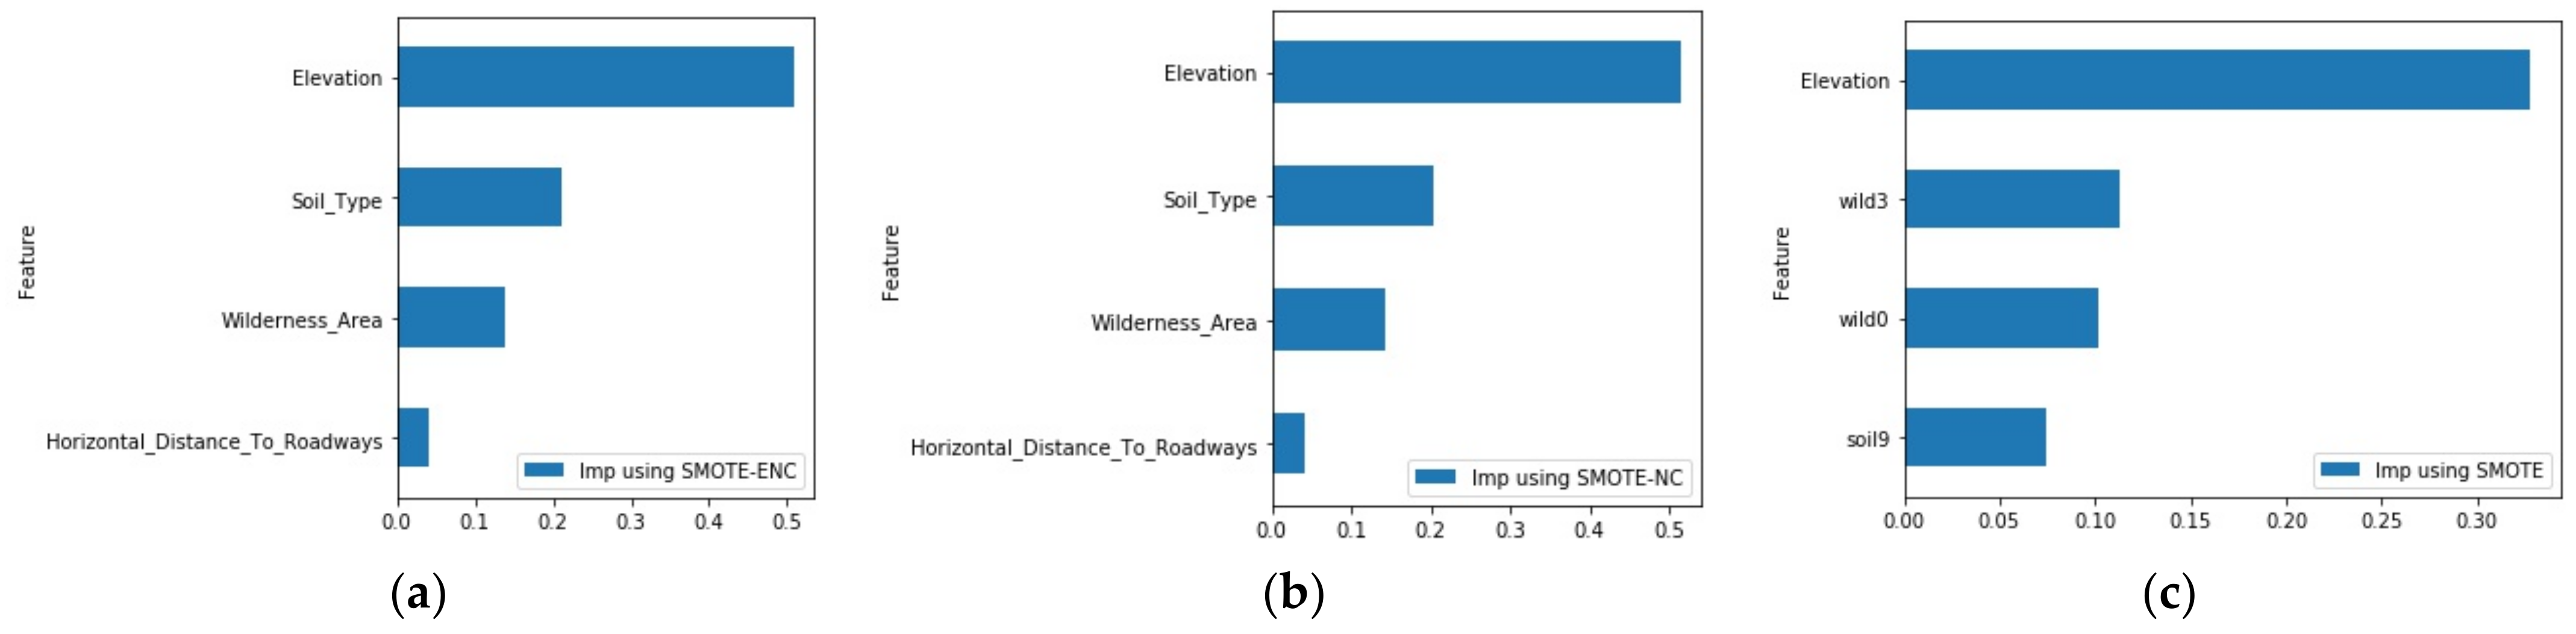
From Figure 7, it was observed that one-hot encoding of multi-label features decreased the area under ROC and PR curve. Thus, the importance of interpreting nominal features in a different way than interpreting continuous features in over-sampling method can be ascertained. We further showed that the importance of categorical features (soil type and wilderness_area) was picked up by SMOTE-ENC and SMOTE-NC but not by SMOTE (Figure 8).
3.5. Evaluation on Rain Dataset
This is a publicly available dataset to predict occurrence of rainfall on the next day based on today’s weather attributes.
SMOTE-ENC provided better precision while reducing recall (Table 2). The magnitude of reduction in recall being higher than the magnitude of improvement in precision made the harmonic mean of precision and recall—the F1 score—reduced.
ROC and precision–recall curves (Figure 9) showed that SMOTE-NC yielded marginally better performance than SMOTE-ENC.
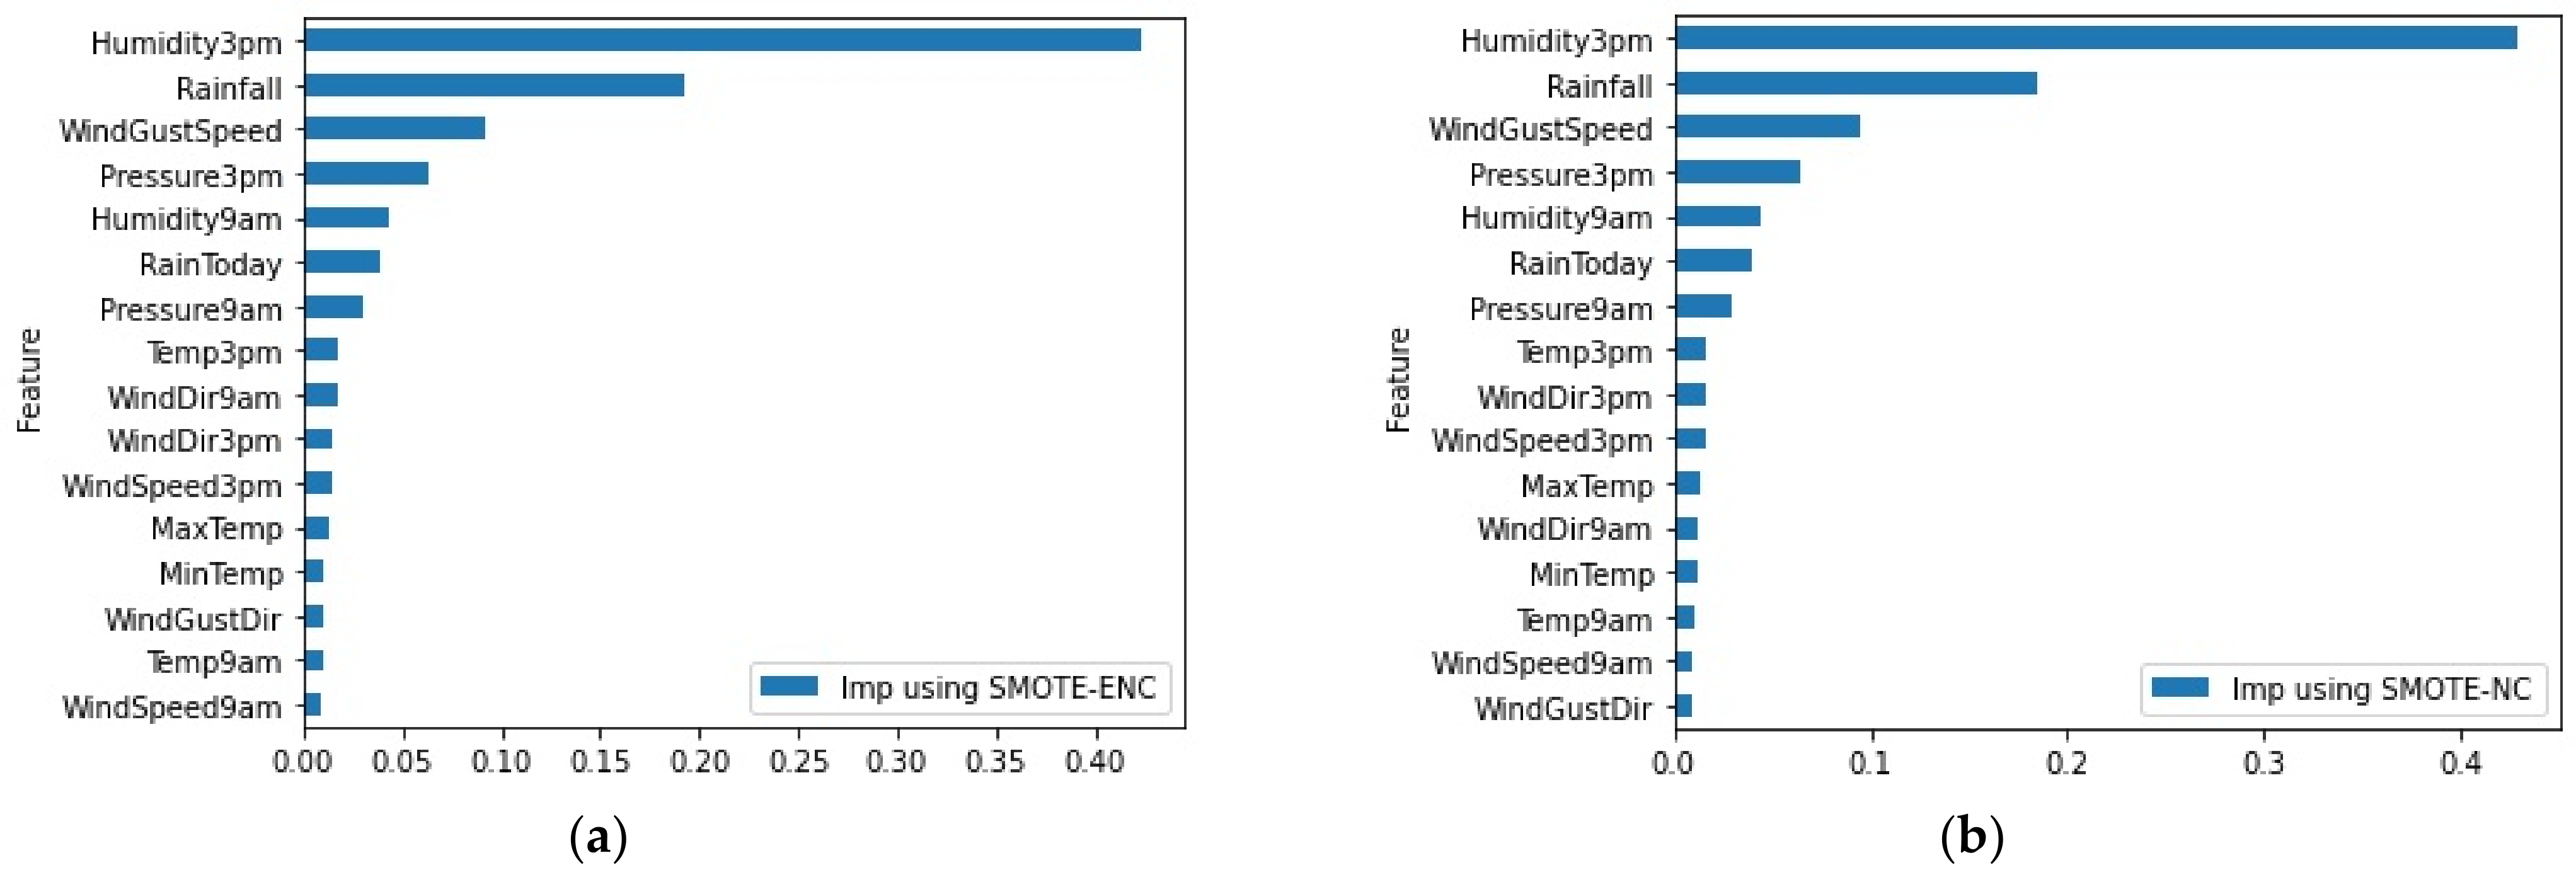
In this dataset, there were only three nominal features—WindGustDir, WindDir9am and WindDir3pm—and from Figure 10, it can be observed that none of the three features came up in the top five feature importance ranking using the random forest classifier. Application of our method, SMOTE-ENC, did not change this ranking, showing that our SMOTE-ENC improved performance when there was a reasonable amount of association between the nominal feature and the class outcome.
4. Discussion
SMOTE and its different variant methods, including Borderline-SMOTE, ADASYN, SMOTE-Tomek, etc., only deal with continuous features. However, in the real world, datasets often consist of both continuous and categorical features. One way to use variants of these SMOTE techniques on such datasets is by one-hot encoding categorical features first and then applying the oversampling method to them. However, it generates two major problem: firstly, in cases where the dataset contains several multi-label nominal features, one-hot encoding increases data dimension significantly, which in turn brings the curse of dimensionality [33]. Secondly, being unaware of nominal features, these SMOTE variants produce multiple new labels of these attributes in the synthetically generated resampled data, which do not have any physical significance. SMOTE-NC resolves these problems, but each label is considered to have equal propensity towards the target class, muddling the feature’s contribution towards distance calculation, whereas our developed variation, SMOTE-ENC, differentiates the label of association between labels of a particular nominal feature, capturing the nominal feature’s contribution in distance calculation more precisely. For example, let us suppose there is a dataset which contains two multi-level categorical features (c1 and c2) along with a few continuous features. In the SMOTE-NC algorithm, the inter-level distance of c1 feature will be the same as the inter-level distance of the c2 feature because in SMOTE-NC, distance between any two levels of the nominal attributes is the median of standard deviations of the continuous features of the data. In other words, inter-level distance of the nominal feature is not dependent on that feature, rather on the continuous attributes of the dataset. In contrast, in our version of the SMOTE algorithm, inter-level distance of the c1 feature will be different than that of the c2 feature and the distance will not be dependent on the continuous features, rather on that particular nominal feature’s distribution. Hence, if the inter-level distance of c1 is more than that of c2, c1 will have a higher contribution while calculating distance between two data points.
ROC and precision–recall curves in the Section 3 shows, SMOTE-ENC yielded better results in four out of five datasets. In these cases, when resampled data was applied to the random forest classifier, nominal features turned out to be significant drivers. From this observation, it can be inferred that SMOTE-ENC is likely to yield better results when there is some association between the categorical features and the target class. When the association is poor, SMOTE-ENC is not able to yield better results than SMOTE-NC.
From the Table 2, it can be observed that, even when ROC and precision–recall curves show SMOTE-ENC and SMOTE-NC to yield similar performance, there was a difference between these methods’ performance in terms of precision and recall. For banking, credit card and rain datasets, SMOTE-ENC generated better precision, for forest cover dataset, it produced improved recall. Thus, SMOTE-ENC and SMOTE-NC can be differentiated when either precision or recall had higher priority and score was a better evaluator than F1-score.
From Figure 1 and Figure 3, it is also evident that SMOTE-ENC outperformed SMOTE-NC method substantially on banking and on credit card datasets. For the rest of the datasets, the new algorithm could not attain significant improvement. It was observed that in these two datasets (Table 2), the proportion of the number of nominal features to total number of features was more than 25%, whereas for rest of the datasets this proportion was less than 20%. From this observation, it can be inferred that, in these two datasets, a change in interpretation of the nominal features could bring a considerable amount of change in interpretation of the whole dataset. This might be the reason why SMOTE-ENC was able to achieve substantial improvement on these datasets.
When a dataset has one or more multi-label nominal features, SMOTE-NC fails to identify if one or few labels are more associated towards minority class instances than others and thus muddles the significance of the feature in distance calculation. In our method, SMOTE-ENC, when the data has multiple nominal features, for each nominal feature the distance between its labels is calculated in isolation, thus the inter-label distance for each nominal feature is different. In contrast, in SMOTE-NC, the inter-label distance between every nominal feature is considered the same.
From Table 2, it can also be observed that SMOTE-NC could not be applied on the car dataset. The car dataset used in this study did not have any continuous feature but only multi-level categorical features and the SMOTE-NC algorithm can only function when there is at least one continuous feature. In the SMOTE-NC algorithm, the distance between two levels of a nominal feature is the median of standard deviations of all continuous features for the minority class. Therefore, if the dataset does not have any continuous features, median of standard deviations of the continuous features cannot be calculated and the algorithm fails to generate synthetic data points to balance the dataset. In contrast, our new SMOTE-ENC algorithm has been generalized to handle both mixed (i.e., datasets with continuous and categorical features) and categorical-only datasets.
5. Conclusions
From the experimental results, it can be inferred that the proposed method outperforms the existing method when the dataset has a substantial number of categorical features. SMOTE-ENC is an extension of SMOTE and can be enhanced further and implemented with other variants of SMOTE, e.g., SVMSMOTE, ADASYN, SMOTEENN, SMOTE Tomek, etc. This algorithm is equipped to handle datasets with only nominal features as well, which is not possible in the existing SMOTE-NC method. SMOTE-ENC implements one way to interpret the relationship between nominal feature and target class by encoding each label as χ. There are various other ways to calculate amount of association between two nominal features and those can be implemented and evaluated on skewed datasets in future. The code is available at https://mkhushi.github.io/ (accessed on 5 January 2021).
Author Contributions
Conceptualization, M.M. and M.K.; methodology, M.M. and M.K.; software, M.M.; validation, M.M. and M.K.; formal analysis, M.M.; investigation, M.M. and M.K.; data curation, M.M.; writing—original draft preparation, M.M.; writing—review and editing, M.K.; visualization, M.M.; supervision, M.K. All authors have read and agreed to the published version of the manuscript.
Funding
This research received no external funding.
Institutional Review Board Statement
Not applicable.
Informed Consent Statement
Not applicable.
Data Availability Statement
The data presented in this study are openly available in (Moro, S., P. Cortez, and P. Rita, A data-driven approach to predict the success of bank telemarketing. Decision Support Systems, 2014. 62: p. 22–31 doi:10.1016/j.dss.2014.03.001). Publicly available datasets were also analyzed in this study. This data can be found here: (Asuncion, A. and D. Newman, UCI machine learning repository. 2007), (Young, J. and Adam young, Rain Dataset: Commonwealth of Australia 2010, Bureau of Meteorology. 2018], [Sakshi, G., Credit Card customers—Predict Churning customers. 2020) and at (Dua, D.a.G., C, [31] Machine Learning Repository. 2017).
Conflicts of Interest
The authors declare no conflict of interest.
References
- Naseem, U.; Khushi, M.; Khan, S.K.; Waheed, N.; Mir, A.; Qazi, A.; Alshammari, B.; Poon, S.K. Diabetic Retinopathy Detection Using Multi-layer Neural Networks and Split Attention with Focal Loss. In Proceedings of the International Conference on Neural Information Processing, Bangkok, Thailand, 18–22 November 2020; Springer: Cham, Switzerland, 2020; pp. 26–37. [Google Scholar]
- Panta, A.; Khushi, M.; Naseem, U.; Kennedy, P.; Catchpoole, D. Classification of Neuroblastoma Histopathological Images Using Machine Learning. In Proceedings of the International Conference on Neural Information Processing, Bangkok, Thailand, 18–22 November 2020; Springer: Cham, Switzerland, 2020; pp. 3–14. [Google Scholar]
- Huang, X.; Khushi, M.; Latt, M.; Loy, C.; Poon, S.K. Machine Learning Based Method for Huntington’s Disease Gait Pattern Recognition. In Proceedings of the International Conference on Neural Information Processing, Sydney, NSW, Australia, 12–15 December 2019; Springer: Cham, Switzerland, 2019; pp. 607–614. [Google Scholar]
- Khushi, M.; Choudhury, N.; Arthur, J.W.; Clarke, C.L.; Graham, J.D. Predicting Functional Interactions Among DNA-Binding Proteins. In Proceedings of the International Conference on Neural Information Processing, Siam Reap, Cambodia, 13–16 December 2018; Springer: Cham, Switzerland, 2018; pp. 70–80. [Google Scholar]
- Khushi, M.; Clarke, C.L.; Graham, J.D. Bioinformatic analysis of cis-regulatory interactions between progesterone and estrogen receptors in breast cancer. PeerJ 2014, 2, e654. [Google Scholar] [CrossRef] [PubMed] [Green Version]
- Khushi, M.; Napier, C.E.; Smyth, C.M.; Reddel, R.R.; Arthur, J.W. MatCol: A tool to measure fluorescence signal colocalisation in biological systems. Sci. Rep. 2017, 7, 1–9. [Google Scholar] [CrossRef] [PubMed] [Green Version]
- Barlow, H.; Mao, S.; Khushi, M. Predicting High-Risk Prostate Cancer Using Machine Learning Methods. Data 2019, 4, 129. [Google Scholar] [CrossRef] [Green Version]
- Alam, T.M.; Shaukat, K.; Mushtaq, M.; Ali, Y.; Khushi, M.; Luo, S.; Wahab, A. Corporate Bankruptcy Prediction: An Approach Towards Better Corporate World. Comput. J. 2020. [Google Scholar] [CrossRef]
- Alam, T.M.; Shaukat, K.; Hameed, I.A.; Luo, S.; Sarwar, M.U.; Shabbir, S.; Li, J.; Khushi, M. An Investigation of Credit Card Default Prediction in the Imbalanced Datasets. IEEE Access 2020, 8, 201173–201198. [Google Scholar] [CrossRef]
- Sun, Y.; Kamel, M.S.; Wong, A.K.; Wang, Y.J.P.R. Cost-sensitive boosting for classification of imbalanced data. Pattern Recognit. 2007, 40, 3358–3378. [Google Scholar] [CrossRef]
- Batista, G.E.; Prati, R.C.; Monard, M.C. A study of the behavior of several methods for balancing machine learning training data. ACM SIGKDD Explor. Newsl. 2004, 6, 20–29. [Google Scholar] [CrossRef]
- Zadrozny, B.; Elkan, C. Learning and making decisions when costs and probabilities are both unknown. In Proceedings of the Seventh ACM SIGKDD International Conference on Knowledge Discovery and Data Miningn, San Diego, CA, USA, 26–29 August 2001; pp. 204–213. [Google Scholar]
- Yen, S.-J.; Lee, Y.-S. Under-sampling approaches for improving prediction of the minority class in an imbalanced dataset. In Intelligent Control and Automation; Springer: Berlin/Heidelberg, Germany, 2006; pp. 731–740. [Google Scholar] [CrossRef]
- Ganganwar, V. An overview of classification algorithms for imbalanced datasets. Int. J. Emerg. Technol. Adv. Eng. 2012, 2, 42–47. [Google Scholar]
- Chawla, N.V.; Bowyer, K.W.; Hall, L.O.; Kegelmeyer, W.P. SMOTE: Synthetic minority over-sampling technique. J. Artif. Intell. Res. 2002, 16, 321–357. [Google Scholar] [CrossRef]
- Fernández, A.; Garcia, S.; Herrera, F.; Chawla, N.V. SMOTE for learning from imbalanced data: Progress and challenges, marking the 15-year anniversary. J. Artif. Intell. Res. 2018, 61, 863–905. [Google Scholar] [CrossRef]
- O’Brien, R.; Ishwaran, H. A random forests quantile classifier for class imbalanced data. Pattern Recognit. 2019, 90, 232–249. [Google Scholar] [CrossRef] [PubMed]
- Sharma, S.; Bellinger, C.; Krawczyk, B.; Zaiane, O.; Japkowicz, N. Synthetic oversampling with the majority class: A new perspective on handling extreme imbalance. In Proceedings of the 2018 IEEE International Conference on Data Mining (ICDM), Singapore, 17–20 November 2018; pp. 447–456. [Google Scholar]
- Katuwal, R.; Suganthan, P.N.; Zhang, L. Heterogeneous oblique random forest. Pattern Recognit. 2020, 99, 107078. [Google Scholar] [CrossRef]
- Xu, Z.; Shen, D.; Nie, T.; Kou, Y. A hybrid sampling algorithm combining M-SMOTE and ENN based on Random Forest for medical imbalanced data. J. Biomed. Inform. 2020, 107, 103465. [Google Scholar] [CrossRef] [PubMed]
- Mullick, S.S.; Datta, S.; Das, S. Generative adversarial minority oversampling. In Proceedings of the IEEE/CVF International Conference on Computer Vision, Seoul, Korea, 27 October–2 November 2019; pp. 1695–1704. [Google Scholar]
- Han, H.; Wang, W.-Y.; Mao, B.-H. Borderline-SMOTE: A new over-sampling method in imbalanced data sets learning. In Proceedings of the International Conference on Intelligent Computing, Hefei, China, 23–26 August 2005; Springer: Berlin/Heidelberg, Germany, 2005; pp. 878–887. [Google Scholar]
- He, H.; Bai, Y.; Garcia, E.A.; Li, S. ADASYN: Adaptive synthetic sampling approach for imbalanced learning. In Proceedings of the 2008 IEEE International Joint Conference on Neural Networks (IEEE World Congress on Computational Intelligence), Hong Kong, China, 1–8 June 2008; pp. 1322–1328. [Google Scholar]
- Torres, F.R.; Carrasco-Ochoa, J.A.; Martínez-Trinidad, J.F. SMOTE-D a deterministic version of SMOTE. In Proceedings of the Mexican Conference on Pattern Recognition, Guanajuato, Mexico, 22–25 June 2016; Springer: Cham, Switzerland, 2016; pp. 177–188. [Google Scholar]
- Rao, C. Karl Pearson chi-square test the dawn of statistical inference. In Goodness-of-Fit Tests and Model Validity; Birkhäuser: Boston, MA, USA, 2002; pp. 9–24. [Google Scholar] [CrossRef]
- Saito, T.; Rehmsmeier, M. The precision-recall plot is more informative than the ROC plot when evaluating binary classifiers on imbalanced datasets. PLoS ONE 2015, 10, e0118432. [Google Scholar] [CrossRef] [PubMed] [Green Version]
- Santos, M.S.; Soares, J.P.; Abreu, P.H.; Araujo, H.; Santos, J. Cross-Validation for Imbalanced Datasets: Avoiding Overoptimistic and Overfitting Approaches [Research Frontier]. IEEE Comput. Intell. Mag. 2018, 13, 59–76. [Google Scholar] [CrossRef]
- Moro, S.; Cortez, P.; Rita, P. A data-driven approach to predict the success of bank telemarketing. Decis. Support Syst. 2014, 62, 22–31. [Google Scholar] [CrossRef] [Green Version]
- Sakshi, G. Credit Card Customers-Predict Churning Customers. Available online: https://www.kaggle.com/sakshigoyal7/credit-card-customers/ (accessed on 26 February 2021).
- Dua, D.; Graff, C. UCI Machine Learning Repository. Available online: https://archive.ics.uci.edu/ml/datasets/car+evaluation/ (accessed on 5 January 2021).
- Asuncion, A.; Newman, D. UCI Machine Learning Repository. Available online: https://archive.ics.uci.edu/ml/datasets/covertype/ (accessed on 11 January 2021).
- Young, J.; Adamyoung. Rain Dataset: Commonwealth of Australia 2010, Bureau of Meteorology. 2018. Available online: https://www.kaggle.com/jsphyg/weather-dataset-rattle-package/ (accessed on 26 February 2019).
- Bellman, R.J.N.J. Dynamic Programming; Princeton University Press: Princeton, NJ, USA, 1957; p. 95. [Google Scholar]
Figure 1.
(a) Comparison between SMOTE-ENC and SMOTE-NC on banking dataset by area under ROC curve. (b) Comparison between SMOTE-ENC and SMOTE-NC on banking dataset by area under PR curve.
Figure 1.
(a) Comparison between SMOTE-ENC and SMOTE-NC on banking dataset by area under ROC curve. (b) Comparison between SMOTE-ENC and SMOTE-NC on banking dataset by area under PR curve.

Figure 2.
(a) Feature importance obtained from random forest classifier using SMOTE-ENC on banking dataset. (b) Feature importance obtained from random forest classifier using SMOTE-NC on banking dataset.
Figure 2.
(a) Feature importance obtained from random forest classifier using SMOTE-ENC on banking dataset. (b) Feature importance obtained from random forest classifier using SMOTE-NC on banking dataset.

Figure 3.
(a) Comparison between SMOTE-ENC and SMOTE-NC on credit card dataset by area under ROC curve. (b) Comparison between SMOTE-ENC and SMOTE-NC on credit dataset by area under PR curve.
Figure 3.
(a) Comparison between SMOTE-ENC and SMOTE-NC on credit card dataset by area under ROC curve. (b) Comparison between SMOTE-ENC and SMOTE-NC on credit dataset by area under PR curve.

Figure 4.
(a) Feature importance obtained from random forest classifier using SMOTE-ENC on credit card dataset. (b) Feature importance obtained from random forest classifier using SMOTE-NC on credit card dataset.
Figure 4.
(a) Feature importance obtained from random forest classifier using SMOTE-ENC on credit card dataset. (b) Feature importance obtained from random forest classifier using SMOTE-NC on credit card dataset.

Figure 5.
(a) Application of SMOTE-ENC to car dataset by area under ROC curve. (b) Application of SMOTE-ENC to credit card dataset by area under PR curve.
Figure 5.
(a) Application of SMOTE-ENC to car dataset by area under ROC curve. (b) Application of SMOTE-ENC to credit card dataset by area under PR curve.

Figure 6.
(a) Comparison between SMOTE-ENC and SMOTE-NC on forest cover dataset with class 2 and 6 by area under ROC curve. (b) Comparison between SMOTE-ENC and SMOTE-NC on forest cover dataset with class 2 and 6 by area under PR curve.
Figure 6.
(a) Comparison between SMOTE-ENC and SMOTE-NC on forest cover dataset with class 2 and 6 by area under ROC curve. (b) Comparison between SMOTE-ENC and SMOTE-NC on forest cover dataset with class 2 and 6 by area under PR curve.

Figure 7.
(a) ROC curve for forest cover dataset with class 2 and 6 using SMOTE. (b) PR curve for forest cover dataset with class 2 and 6 using SMOTE.
Figure 7.
(a) ROC curve for forest cover dataset with class 2 and 6 using SMOTE. (b) PR curve for forest cover dataset with class 2 and 6 using SMOTE.

Figure 8.
(a) Top four important features of random forest using SMOTE-ENC. (b) Top four important features of random forest using SMOTE-NC. (c) Top four important features of random forest using SMOTE.
Figure 8.
(a) Top four important features of random forest using SMOTE-ENC. (b) Top four important features of random forest using SMOTE-NC. (c) Top four important features of random forest using SMOTE.

Figure 9.
(a) Comparison between SMOTE-ENC and SMOTE-NC on rain dataset by area under ROC curve. (b) Comparison between SMOTE-ENC and SMOTE-NC on rain dataset by area under PR curve.
Figure 9.
(a) Comparison between SMOTE-ENC and SMOTE-NC on rain dataset by area under ROC curve. (b) Comparison between SMOTE-ENC and SMOTE-NC on rain dataset by area under PR curve.

Figure 10.
(a) Feature importance of random forest using SMOTE-ENC on rain dataset. (b) Feature importance of random forest using SMOTE-NC on rain dataset.
Figure 10.
(a) Feature importance of random forest using SMOTE-ENC on rain dataset. (b) Feature importance of random forest using SMOTE-NC on rain dataset.


Table 1.
Sample dataset to explain our algorithm (SMOTE-ENC).
| C1 | C2 | C3 | N | Target | |
|---|---|---|---|---|---|
| Instance 1 (i1) | 100 | 20 | 85 | a | min |
| Instance 2 (i2) | 200 | 65 | 54 | b | min |
| Instance 3 (i3) | 166 | 24 | 38 | a | maj |
| Instance 4 (i4) | 344 | 67 | 89 | b | maj |
| Instance 5 (i5) | 200 | 30 | 75 | b | maj |
Table 2.
Comparison between SMOTE-ENC (new method) and SMOTE-NC on minority class data points at threshold 0.5.
Table 2.
Comparison between SMOTE-ENC (new method) and SMOTE-NC on minority class data points at threshold 0.5.
| Dataset | IR 1 | N 2 | C 3 | Sampling Method | Precision | Recall | F1-Score |
|---|---|---|---|---|---|---|---|
| Banking telemarketing dataset [28] | 9:1 | 12 | 5 | SMOTE-ENC | 31.95 | 46.84 | 37.99 |
| SMOTE-NC | 27.33 | 50.40 | 35.45 | ||||
| Credit card dataset [29] | 12:1 | 5 | 14 | SMOTE-ENC | 65.61 | 81.75 | 72.79 |
| SMOTE-NC | 59.78 | 84.92 | 70.16 | ||||
| Car dataset [30] | 3:1 | 6 | 0 | SMOTE-ENC | 87.91 | 79.21 | 83.33 |
| SMOTE-NC | NA 4 | NA4 | NA 4 | ||||
| Forest cover dataset (class 2 and 6) [31] | 17:1 | 2 | 12 | SMOTE-ENC | 74.76 | 99.84 | 85.50 |
| SMOTE-NC | 74.76 | 99.82 | 85.49 | ||||
| Rain in Australia dataset [32] | 4:1 | 3 | 13 | SMOTE-ENC | 58.45 | 72.24 | 64.62 |
| SMOTE-NC | 58.30 | 72.51 | 64.63 |
1 IR (imbalance ratio) = total number of samples in training set/number of minority class samples. 2 N = number of nominal features in the dataset. 3 C = number of continuous features in the dataset. 4 NA = SMOTE-NC cannot be applied to this dataset.
Publisher’s Note: MDPI stays neutral with regard to jurisdictional claims in published maps and institutional affiliations. |
© 2021 by the authors. Licensee MDPI, Basel, Switzerland. This article is an open access article distributed under the terms and conditions of the Creative Commons Attribution (CC BY) license (http://creativecommons.org/licenses/by/4.0/).
Share and Cite
MDPI and ACS Style
Mukherjee, M.; Khushi, M. SMOTE-ENC: A Novel SMOTE-Based Method to Generate Synthetic Data for Nominal and Continuous Features. Appl. Syst. Innov. 2021, 4, 18. https://doi.org/10.3390/asi4010018
AMA Style
Mukherjee M, Khushi M. SMOTE-ENC: A Novel SMOTE-Based Method to Generate Synthetic Data for Nominal and Continuous Features. Applied System Innovation. 2021; 4(1):18. https://doi.org/10.3390/asi4010018
Chicago/Turabian StyleMukherjee, Mimi, and Matloob Khushi. 2021. "SMOTE-ENC: A Novel SMOTE-Based Method to Generate Synthetic Data for Nominal and Continuous Features" Applied System Innovation 4, no. 1: 18. https://doi.org/10.3390/asi4010018