1. Introduction
Subtropical squall lines commonly affect southern China in the summer time. They are also known as “Shi Hu Feng” by local people (
https://www.hko.gov.hk/education/edu01met/wxphe/ele_squalle.htm) and can bring damaging wind to natural vegetation and man-made objects/structures, such as the collapsing of trees or the falling of empty containers at container terminals.
Despite the commonality of this phenomenon, systematic studies of subtropical squall lines are rather limited, especially for wind engineering applications. An example of this limited research is a numerical simulation that was performed to further understand the squall line over southern China [
1]. Additionally, observational wind studies have not been extended to wind applications either. Surface observations are common, but are mostly focused on the high wind gust following the passage of the squall line. Furthermore, the structure of the squall line is not well understood for wind engineering applications. In particular, the vertical structure above the ground is predominantly observed by remote sensing instruments, such as the Doppler weather radar wind profiler and acoustic radar. Though available at high temporal resolution, one major limitation of these remote sensing instruments is that they only provide the mean wind speed over a period of time, at least in the order of ≥1 min. Thus, the high frequency or variability of the wind is not captured, which limits our understanding of the impact of squall lines on man-made structures/buildings, such as the vertical variability of gust factor and turbulence intensity, which are important for wind engineering applications.
The availability of the 356 m-high wind tower in Shenzhen, China, provides the much-needed and valuable high temporal resolution wind data at heights above the ground. Sonic anemometers are installed at four levels and they provide three-dimensional wind data at 10 Hz. By using the data captured by this tower, the parameters required for wind engineering applications can be calculated for the first time for weather phenomena over the Pearl River Delta (PRD) region. This paper documents the wind observations in subtropical squall lines or six cases over Shenzhen and Hong Kong, China in the summer of 2019. Though the number of cases is not large, this is the first time that observations of subtropical squall lines in this region with high temporal resolution have been supplied by a meteorological tower. In other studies, e.g., in Singapore, gusty winds associated with thunderstorm outflows have been examined in larger numbers, e.g., 50 cases in the research of Choi [
2]. In the present study, we focus more specially on subtropical squall lines, which do not occur as frequently as ordinary thunderstorm outflows, and thus the number of samples is much more limited. As more cases will be accumulated over the years, the statistical analysis of a larger sample will be reported in a future paper for the PRD region.
Apart from presentation of the vertical wind profile, the statistical property of the upper air winds (winds above the ground) in the subtropical squall is presented in this paper following the method of Solari et al. [
3] and Burlando et al. [
4]. Winds of up to about 360 m above ground are considered. Previously, such analysis was only possible for ground-based measurements from sonic anemometers at high frequencies. With the Shenzhen wind tower, it is possible to analyze the wind at upper levels (up to about 360 m above ground level). Thus, the applicability of an inertial subrange of wind turbulence can now be examined at heights above the ground.
Another feature of this paper is a review of the application of the gust nowcasting method, as discussed in Chan and Hon [
5]. A very limited sample is presented in that paper using the gust nowcasting algorithm based on a wind profiler and microwave radiometer, providing the upper-air wind and the thermodynamic profile of the atmosphere, respectively. The upper-air wind comes from the wind profiler measurements of up to 9 km above ground. The thermodynamic profiles come from the microwave radiometer, and they include the temperature and humidity profiles measured by the radiometer up to 10 km above ground. For the sake of simplicity, only the final wind gust estimates are shown, without showing the individual upper-air wind profile and upper-air thermodynamic profile. The performance of this nowcasting algorithm is reviewed using the limited samples of squall lines available in this paper.
2. Equipment
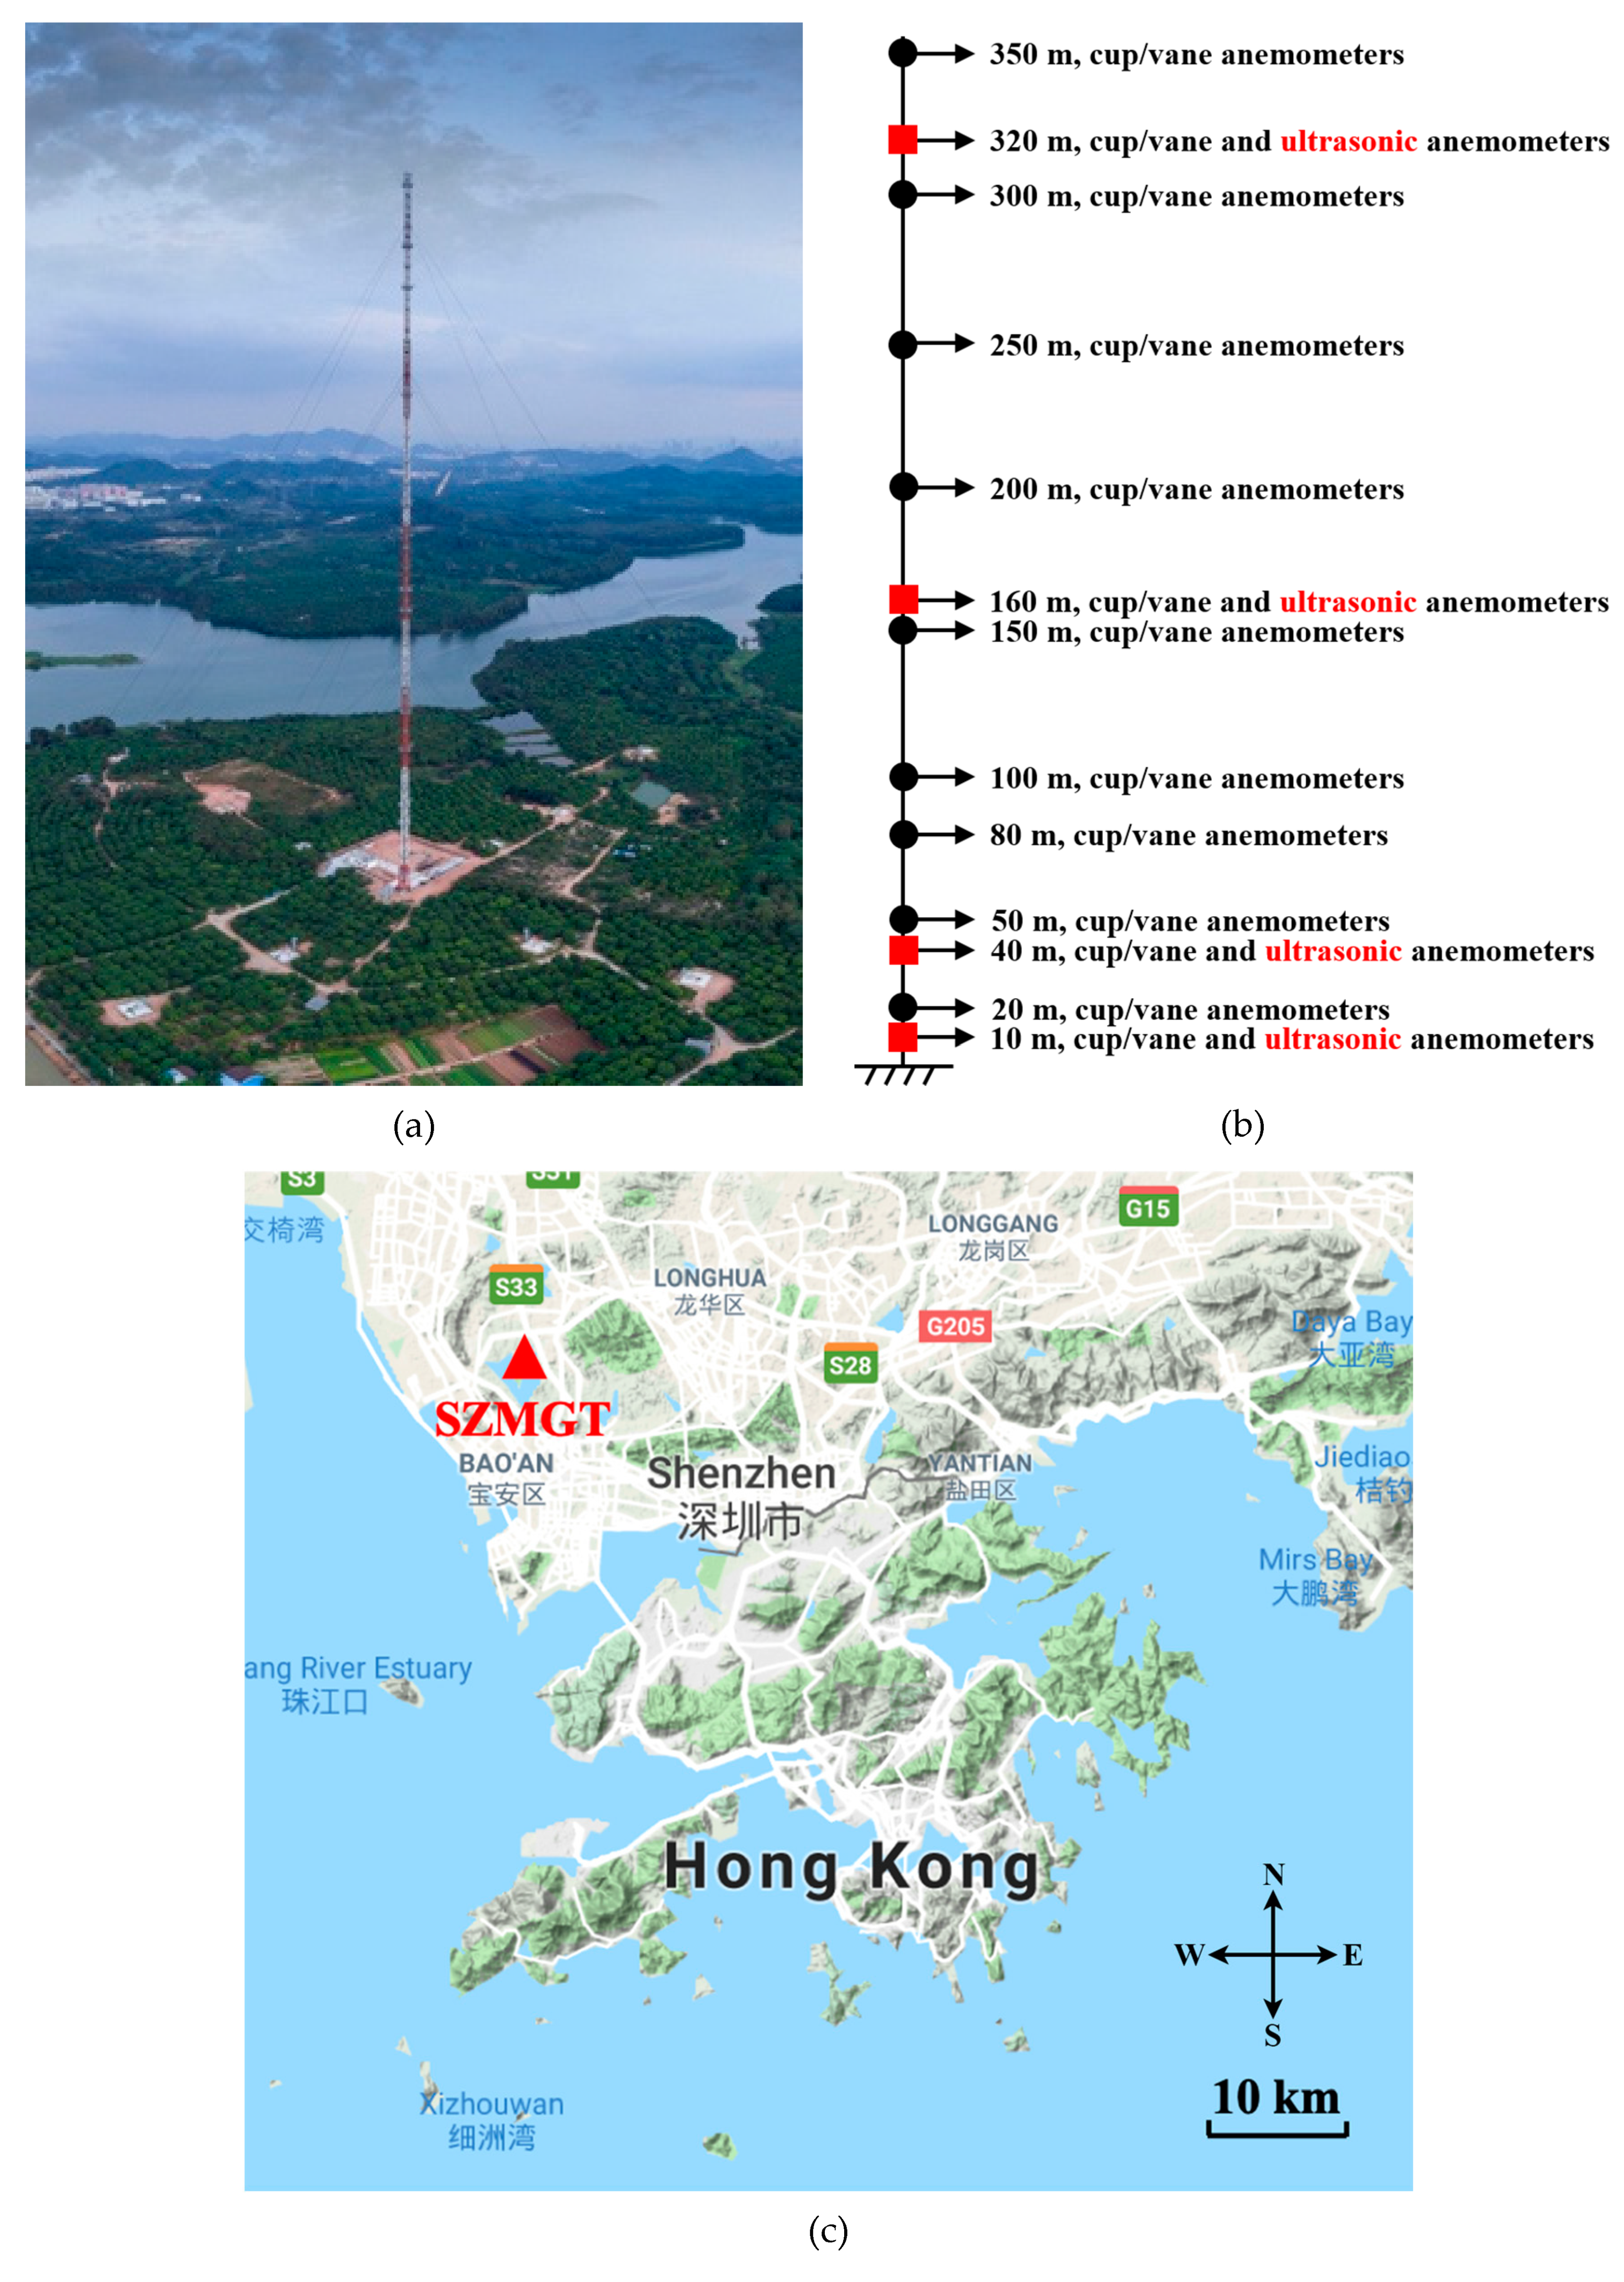
The Shenzhen Meteorological Gradient Tower (SZMGT) is located in Shenzhen, Guangdong Province, which is one of the most rapidly developing cities in China [
6]. A photograph of the tower and the locations of the anemometer installation are shown in
Figure 1. Mean wind is measured at 13 height levels, including 10, 20, 40, 50, 80, 100, 150, 160, 200, 250, 300, 320, and 350 m. The measurement instrument is the Wind Set WA-25 (Vaisala, Vantaa, Finland), consisting of a Vaisala Anemometer WAA252 and a Vaisala Wind Vane WAV252 (Vaisala, Vantaa, Finland). The measurement ranges of wind speed and direction are 0.4~75 m/s and 0~360, respectively. The accuracies of wind speed and direction measurement are ±0.17 m/s and ±3, respectively. This set of equipment records 2 min mean wind speed and direction every 10 s. Turbulent wind is measured at 4 height levels, including 10, 40, 160, and 320 m. The measurement instrument is a Vaisala WINDCUP Ultrasonic Wind Sensor WMT703 (Vaisala, Vantaa, Finland). The measurement ranges of wind speed and direction are 0~75 m/s and 0~360, respectively. The accuracies of wind speed and direction measurement are ±0.1 m/s and ±2, respectively. This set of equipment provides high-resolution wind measurements sampled at 10 Hz, that is, wind speed and direction every 0.1 s.
Before application to wind turbulence analysis, data pre-processing is required to detect any anomalies and remove invalid data points. Firstly, wind speed time series were divided into non-overlapping samples, each with a length of 30 s. Then, abnormal data points were determined by the so-called multiple truncation variance method, following the same procedures as Lin et al. [
7]:
where
U(t) is the wind speed at
t-th time point, and
c = 4 in Equation (5). If the absolute difference between the value of a point and the mean value of the sample is greater than ∆, the point will be identified as an unreasonable point, which will be removed. For instance, for a squall line with gust wind speed of about 35 m/s (case 6 in the present study), a typical value of ∆ is around 20 m/s, i.e., data larger than 55 m/s or lower than 15 m/s will be considered unreasonable. Such data only amount to a small portion of the whole (less than 5% of the whole). In the case that the continuous missing or abnormal data points are fewer than or equal to 3, a linear interpolation will be applied to make up the data; otherwise, they will be discarded.
In the latter part of this paper, the wind gust nowcasting algorithm based on measurements by ground-based remote-sensing meteorological instruments, namely, a radar wind profiler and a microwave radiometer, is considered. The wind profiler is a boundary layer-type instrument that operates at a central frequency of 1299 MHz. It operates by Doppler swinging of three beams—one vertical and two oblique beams—at an angle of 15 degrees around the vertical. The three components of the wind are obtained from about 300 m up to about 9000 m above ground, with a spatial resolution of around 200 m. Mean wind profiles are available every 10 min. For the microwave radiometer, it operates at 14 channels to measure the brightness temperatures of oxygen and water vapor at the air. Temperature and dew point profiles are obtained every 10 min, up to a height of around 10 km above ground.
3. Cases under Consideration
The six cases under consideration occur on four days in the summer of PRD in 2019. The time periods are given below (all times in local times, HKT = UTC + 8 h):
- (1)
21:00~21:40, 11 April 2019
- (2)
21:40~22:30, 11 April 2019
- (3)
12:00~12:40, 19 April 2019
- (4)
12:40~13:30, 19 April 2019
- (5)
13:05~13:45, 20 April 2019
- (6)
17:20~18:00, 10 June 2019
There are two cases for 11 April 2019 and 19 April 2019. For each day, the two cases refer to two recorded events in a single squall line.
The above does not mean to be a comprehensive summary of the occurrence of subtropical squall lines in the PRD region in summer of 2019. They just represent the samples in which the squall line passed through the Shenzhen meteorological tower so that a high wind gust was observed at that location, and therefore the structure of the squall line could be analyzed. The high wind gust occurred at about the middle of each time period, as given above, and data around 20 min before and after the high wind gust were included in the statistical study of the wind associated with the squall lines.
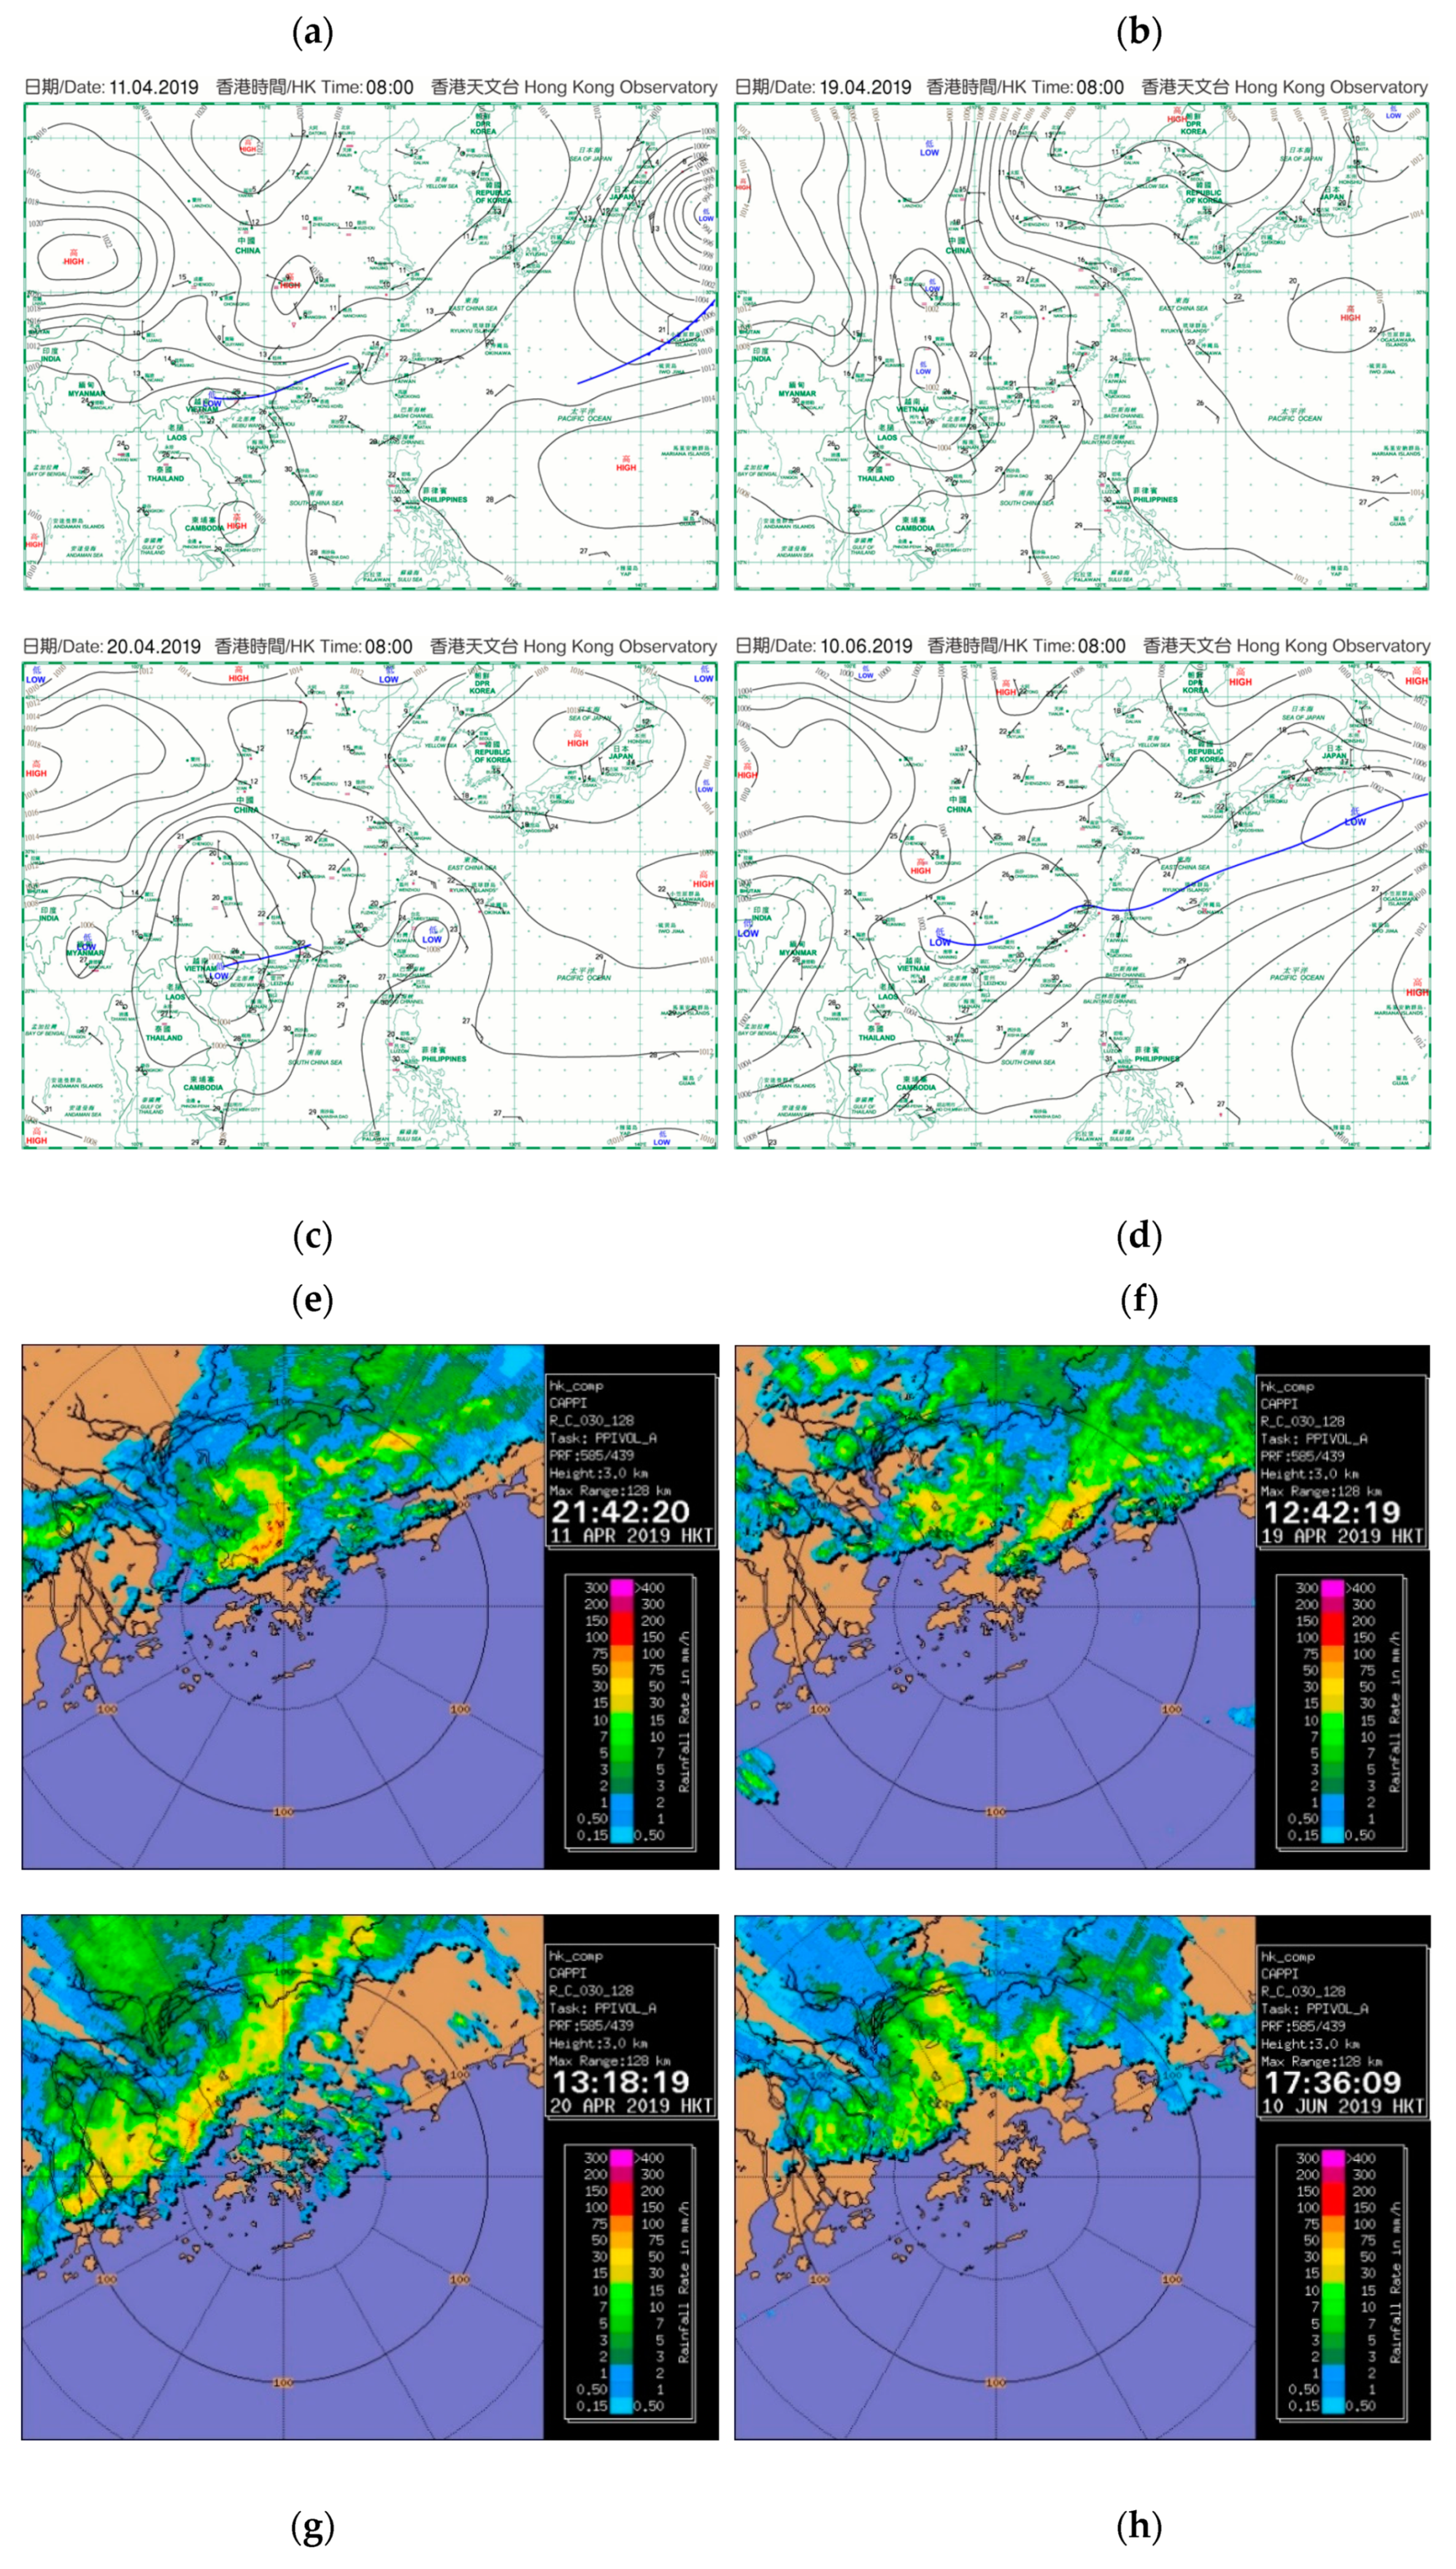
As a summary of the meteorological situation during the squall line occurrence, the surface weather chart at 00 UTC on the above-mentioned days and a typical weather radar imagery of each event are given in
Figure 2. Synoptically, the PRD region was affected by either a southwest monsoon or a surface trough of low pressure. Squall lines could be found near the Shenzhen tower, as given in the radar imagery. Surface weather observations are not shown in order to save space, but low-level wind convergence was noticeable around the squall line. Sometimes, low-level wind jet was observed at the rear of the squall line itself.
4. Mean Wind Structure
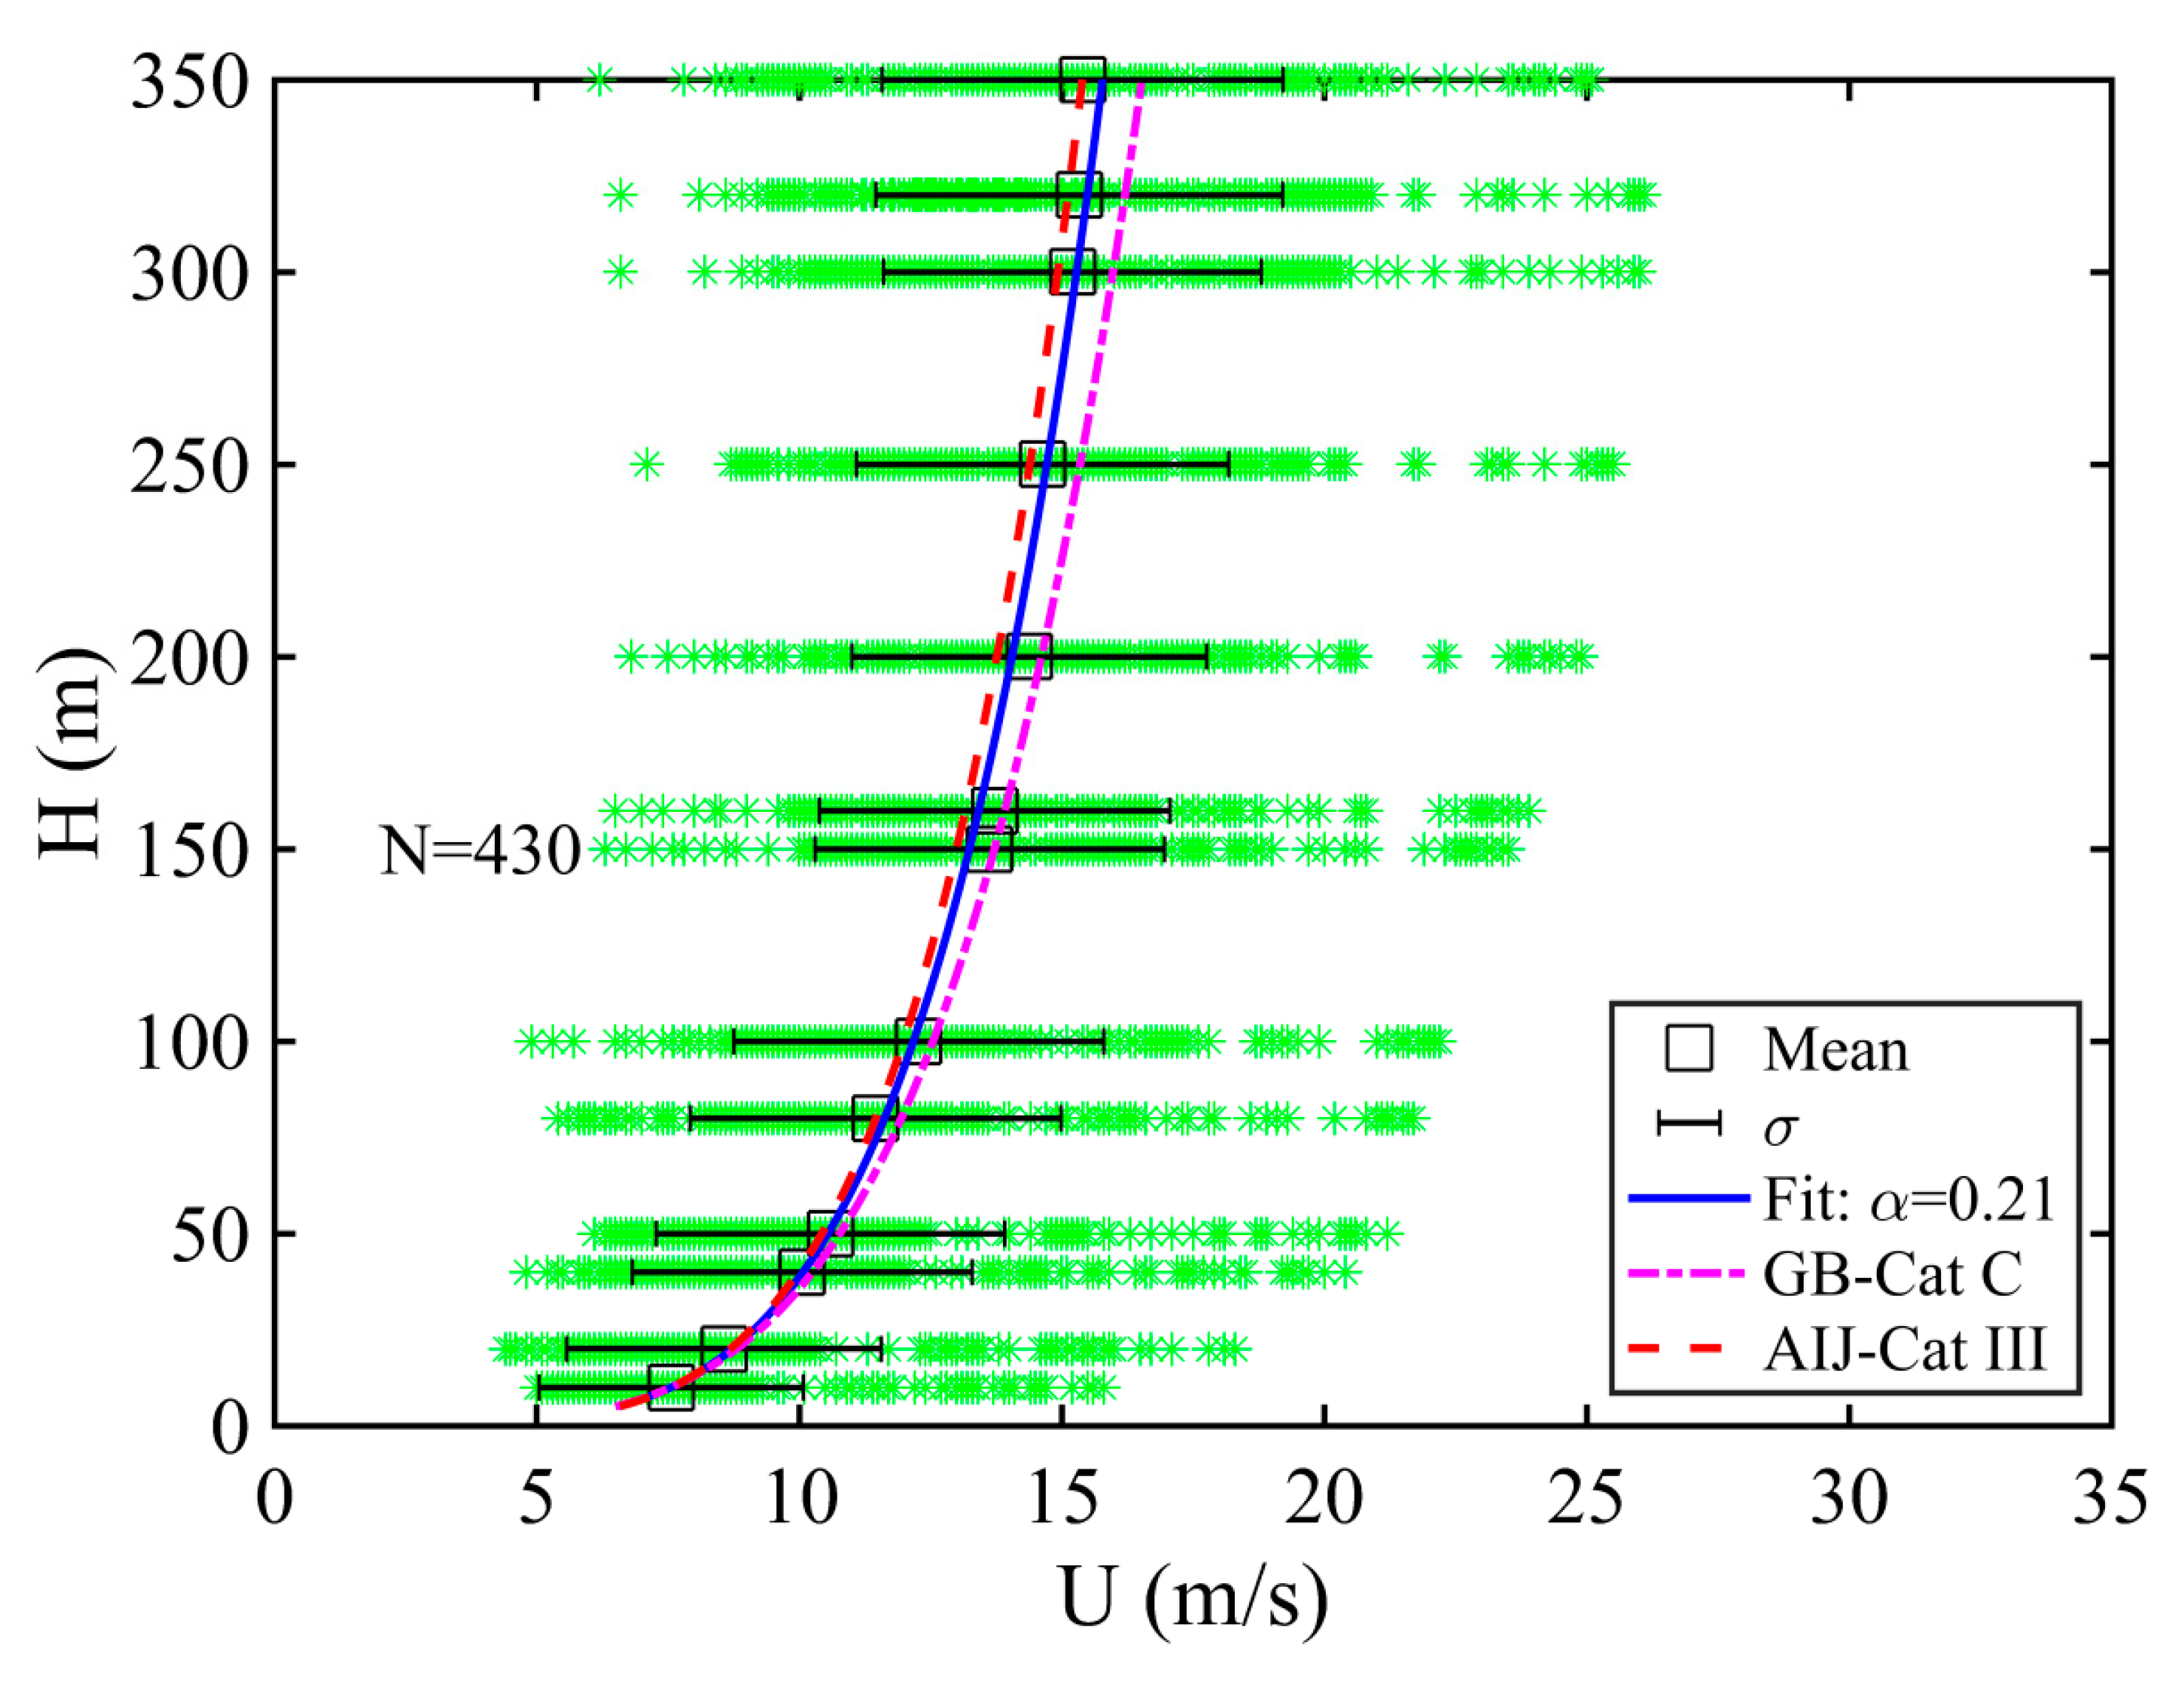
The mean vertical wind profiles for the 6 cases are given in
Figure 3, which can be seen to be consistent with the power law, with an alpha of 0.21. The profiles also follow the standards GB50009-2012 [
8] and AIJ-RLB-2004 [
9], which are the Chinese Code and the Japanese Code for the design of building structures, respectively. These codes formulate wind loadings and dynamic responses of structures based on the profiles of mean wind speed, gust factors, turbulence intensity, etc. It is noteworthy that the wind and turbulence profiles stipulated in these codes are generally based on observations during synoptic strong winds, while thunderstorm outflows (specifically for squall lines) have not yet been considered. For wind profiles, the empirical power law profile is used:
For urban terrain with few tall buildings, the Japanese Code (AIJ-RLB-2004) stipulate α = 0.2, while for the Chinese Code (GB50009-2012), α = 0.22. No low-level jet was observed in the mean profile, which is not consistent with the study of Choi [
2]. This may be due to the limited number of cases.
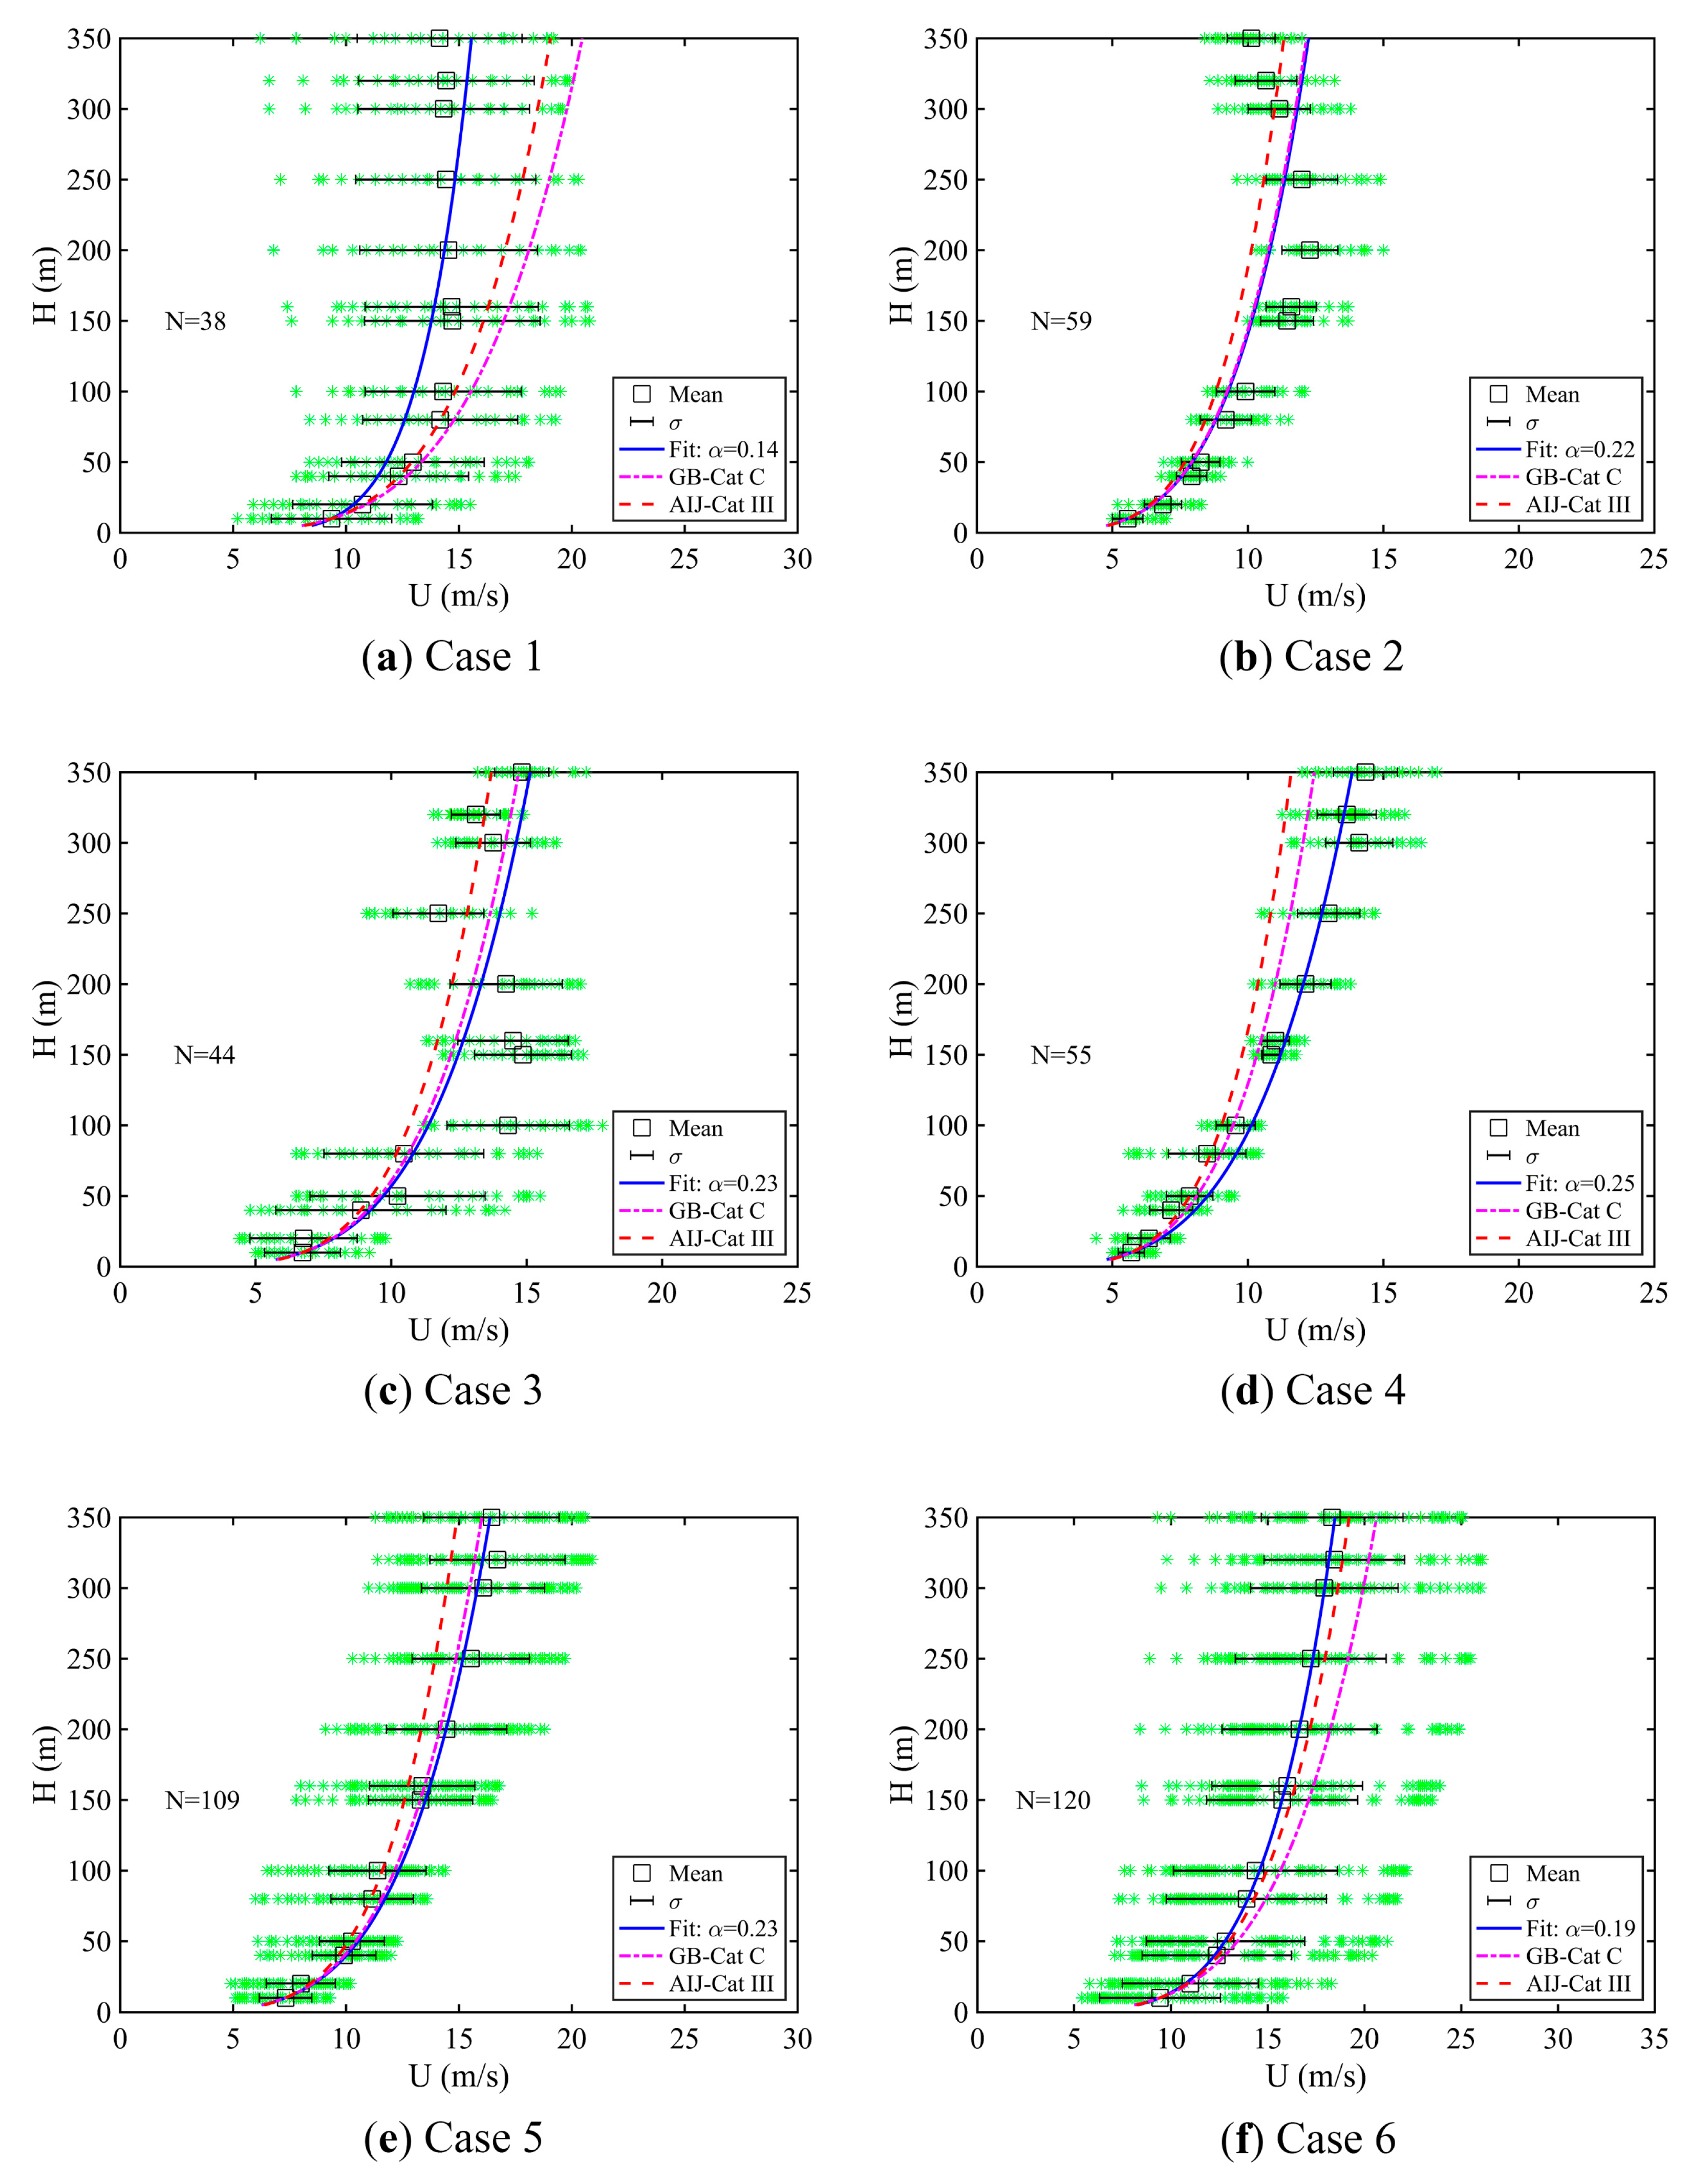
The individual cases are shown in
Figure 4. Low-level jets deviating from the power law could be observed in some of the cases, notably between 100 and 200 m above ground in case 3 (
Figure 4c). Low-level jet has been reported in previous studies of thunderstorm outflow [
2,
10,
11]. At the height of the jet, the mean wind can be a few times greater than the mean winds above and below the jet. For instance, in one of the cases considered in this paper (
Figure 4c), the jet has a mean wind of around 15 m/s, whereas the mean wind above and below the jet is in the order of 10 m/s. However, they do not occur in all of the cases. In particular, case 5 is a very typical subtropical squall line (typical in the sense of the appearance in the radar imagery, based on the experience of the weather forecasters over southern China) with an extended band of thunderstorm, as shown in the weather radar image, but the mean wind profile follows the power law very well (
Figure 4e), without any low-level jet, e.g., rear inflow jet in a conceptual model of the squall line [
1]. The occurrence of low-level jet for squall lines in the PRD region would need to be further studied with both a much larger data sample and numerical simulation in order to understand why it is not so common.
5. Turbulence Intensity and Gust
Turbulence intensity represents the ratio between the fluctuating component and the mean component of wind speed and is determined as follows:
where
Ū(t) is the mean wind speed and σ is the standard deviation of the wind speed. Considering the non-stationary feature of thunderstorm wind records, a non-overlapping moving window of 30 s was adopted for calculating the turbulence intensity.
Another quantity of interest is the gust factor. It is defined as the ratio between 1-s gust wind speed and the maximum value of 30 s mean wind speed, as recommended by Solari et al. [
3]:
where
û is the 1-s gust wind speed and
ūmax is the maximum value of 30 s mean wind speed. This definition is in accordance with the traditional definition of gust factors for thunderstorm outflows by Choi [
12], Holmes et al. [
13], and Lombardo et al. [
10].
The empirical profile for turbulence intensity is given by:
In the Japanese Code (AIJ-RLB-2004),
c = 0.25 and
d = 0.25; whereas, in the Chinese Code (GB50009-2012),
c = 0.23 and
d = 0.22. The vertical distribution of turbulence intensity for all six cases is given in
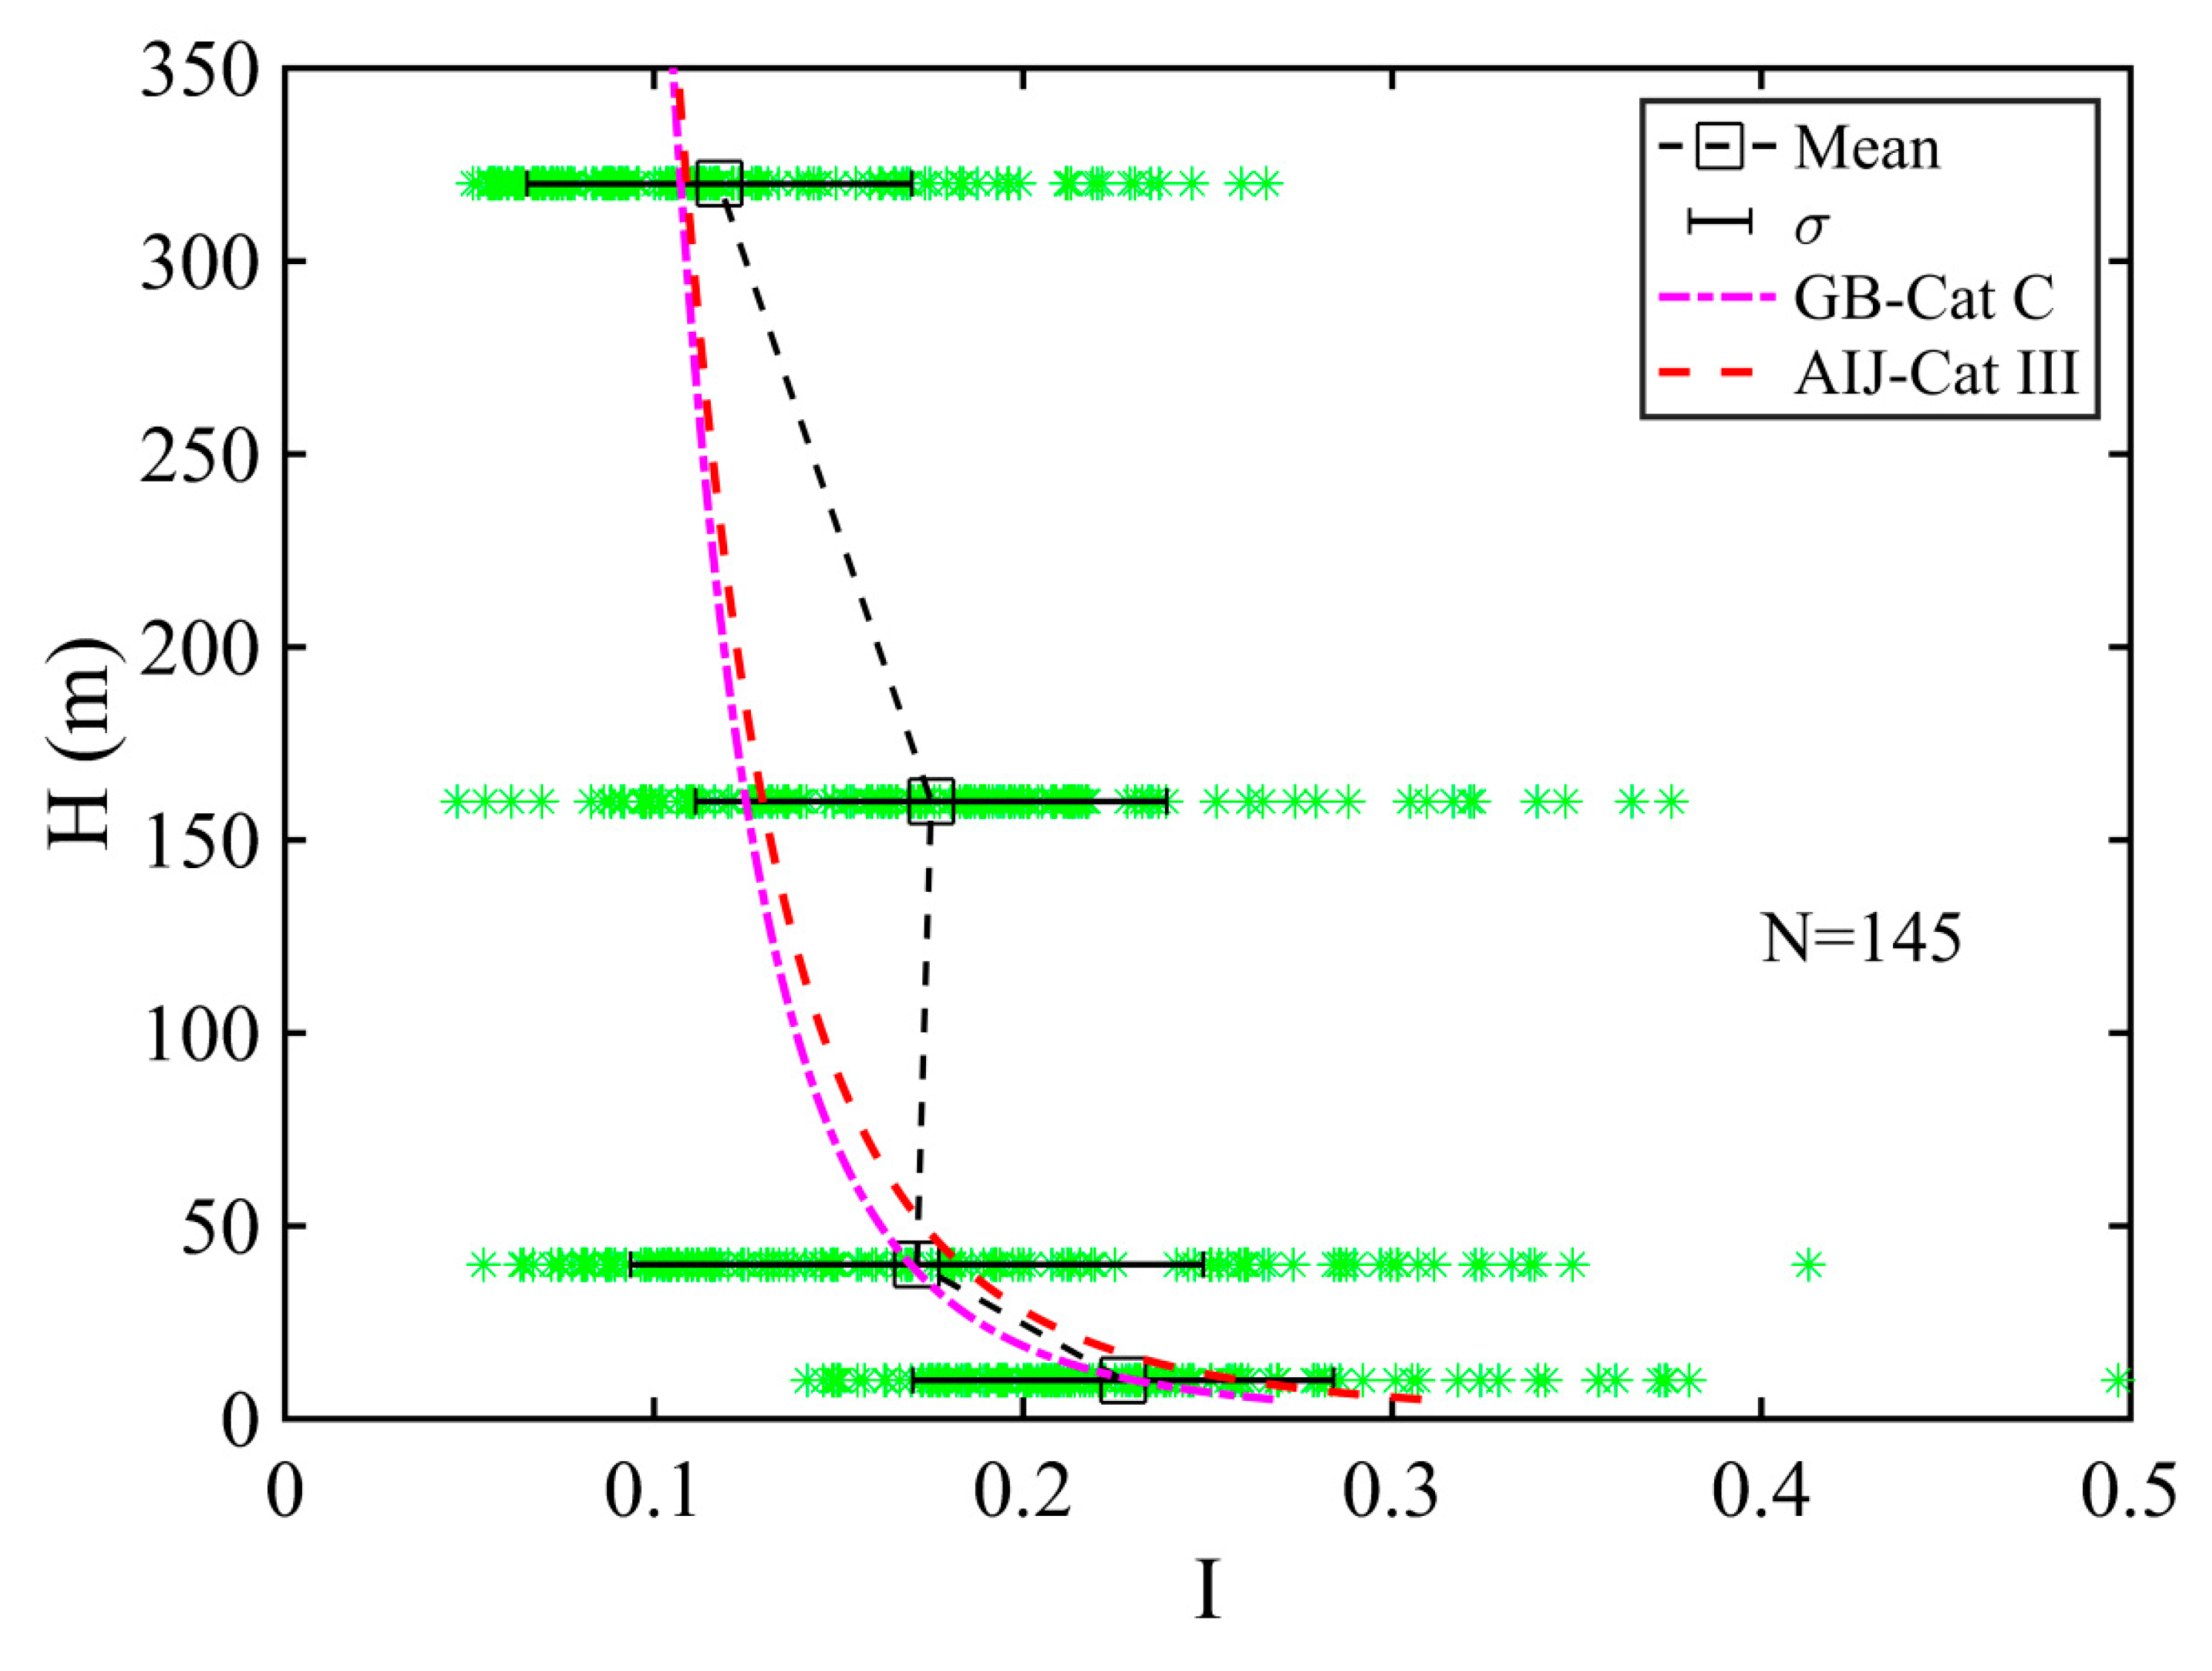
Figure 5. It can be seen that the distribution does not quite follow the international standards of GB50009-2012 and AIJ-RLB-2004. The turbulence intensity profile of subtropical squall lines in the PRD region appears to be quite unique and may have implications regarding the specification of wind standard for wind engineering applications, but this needs to be established using a much larger sample. The occurrence of a new shape of the turbulent intensity profile not consistent with the existing international standard would have great implications for the applicability of such a standard for the southern China area. This is an important issue within the wind engineering community, e.g., the establishment of a wind code for southern China.
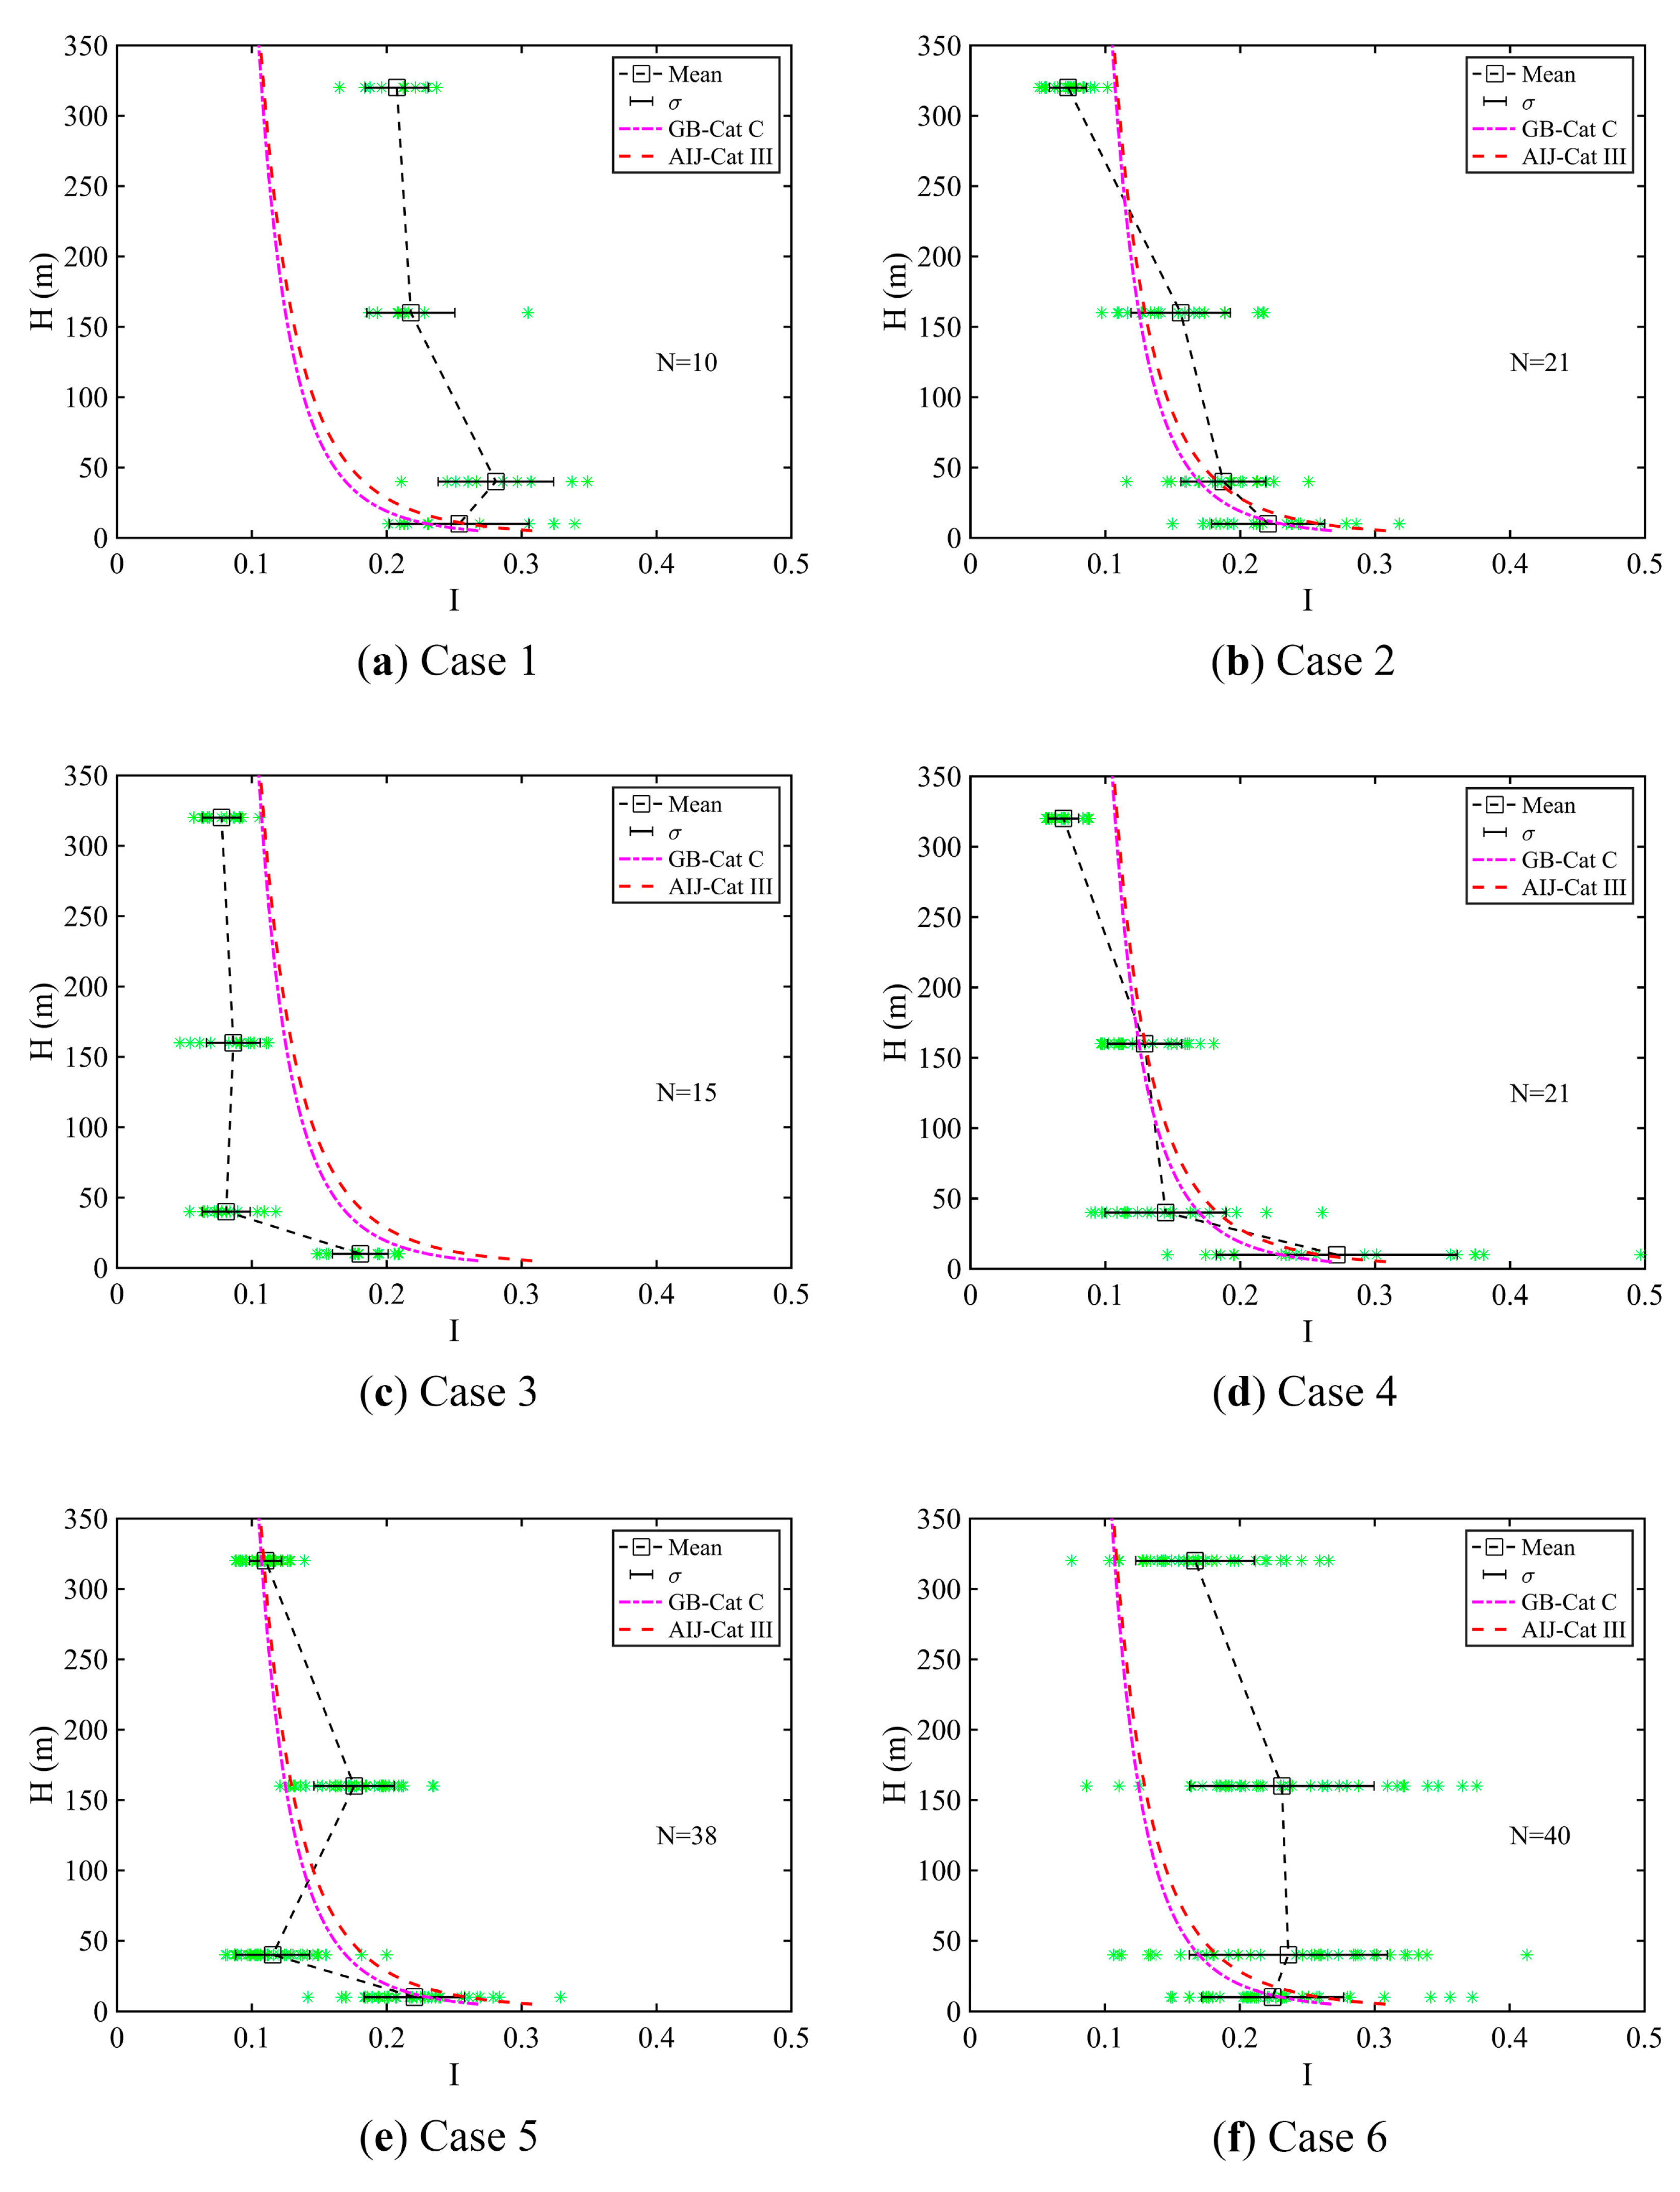
The individual turbulence intensity profiles are shown in
Figure 6. In general, they do not follow the international standards very well.
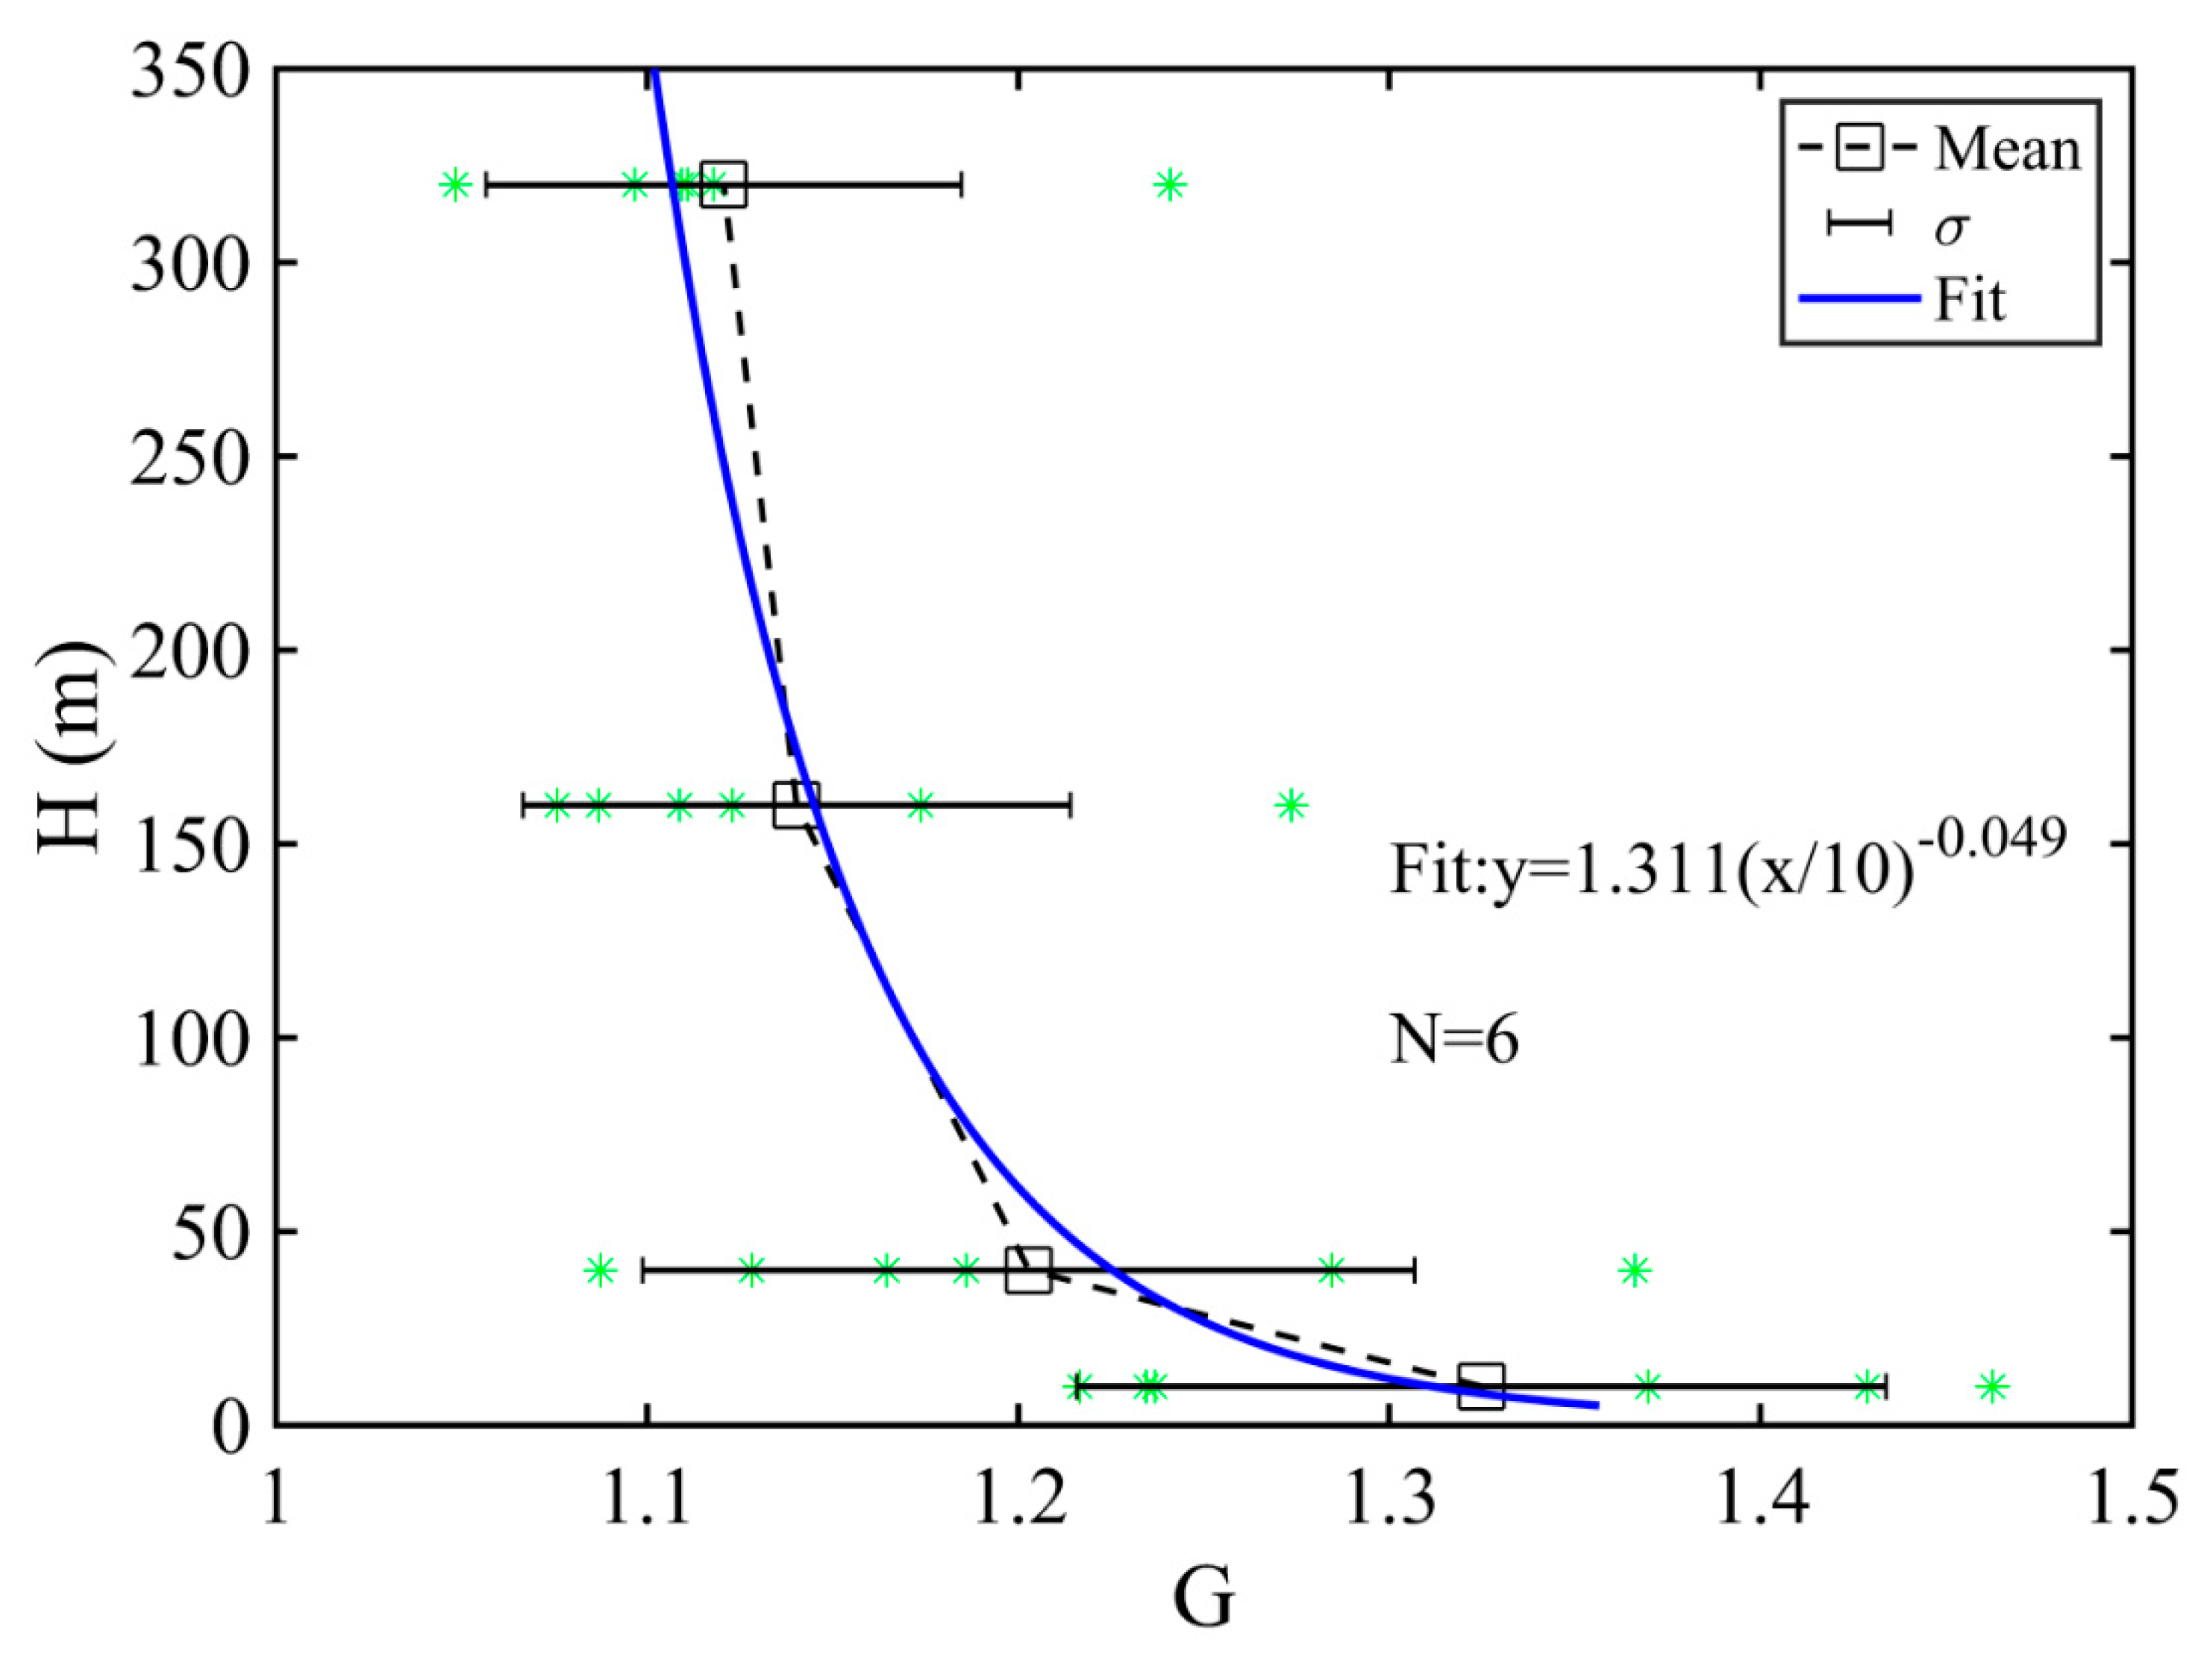
Figure 7 shows the vertical profile of the gust factor. A fitting curve based on the power law could be generated, and it follows quite well the international standards GB50009-2012 and AIJ-RLB-2004.
6. Statistical Analysis of the Wind
The statistical analysis follows the method as described in Solari et al. [
3] and Burlando et al. [
4]. Gaussian distribution of the wind and −5/3 law of the spectral intensity were expected based on the previous studies of thunderstorm outflows. Similar analysis was conducted for the dataset of this study to see if the present data also follow such laws. If such laws were indeed fulfilled, this would give greater confidence to the quality of the data and confirm that the physical laws are consistent with the squall line outflow cases considered in this paper. A summary of the analysis method is given here. The decomposition of wind is given by:
where
Ū(t) is the slowly-varying mean wind velocity extracted here by a running-mean filter with a moving average period T = 30 s.
Ū’(t) is the residual turbulent fluctuation expressed as:
where σ is the slowly-varying standard deviation of
Ū’(t), calculated over a sliding window T = 30 s, and Ur (t) is the reduced turbulence fluctuation. This latter quantity is usually modeled as a stationary Gaussian random process with zero mean and unit standard deviation. The probability density function of a standard Gaussian distribution is given by:
In addition, to overcome the problem of spectrum leakage caused by direct use of the fast Fourier transform (FFT), the power spectral density (PSD) of reduced turbulence fluctuation was calculated by the Welch method [
14].
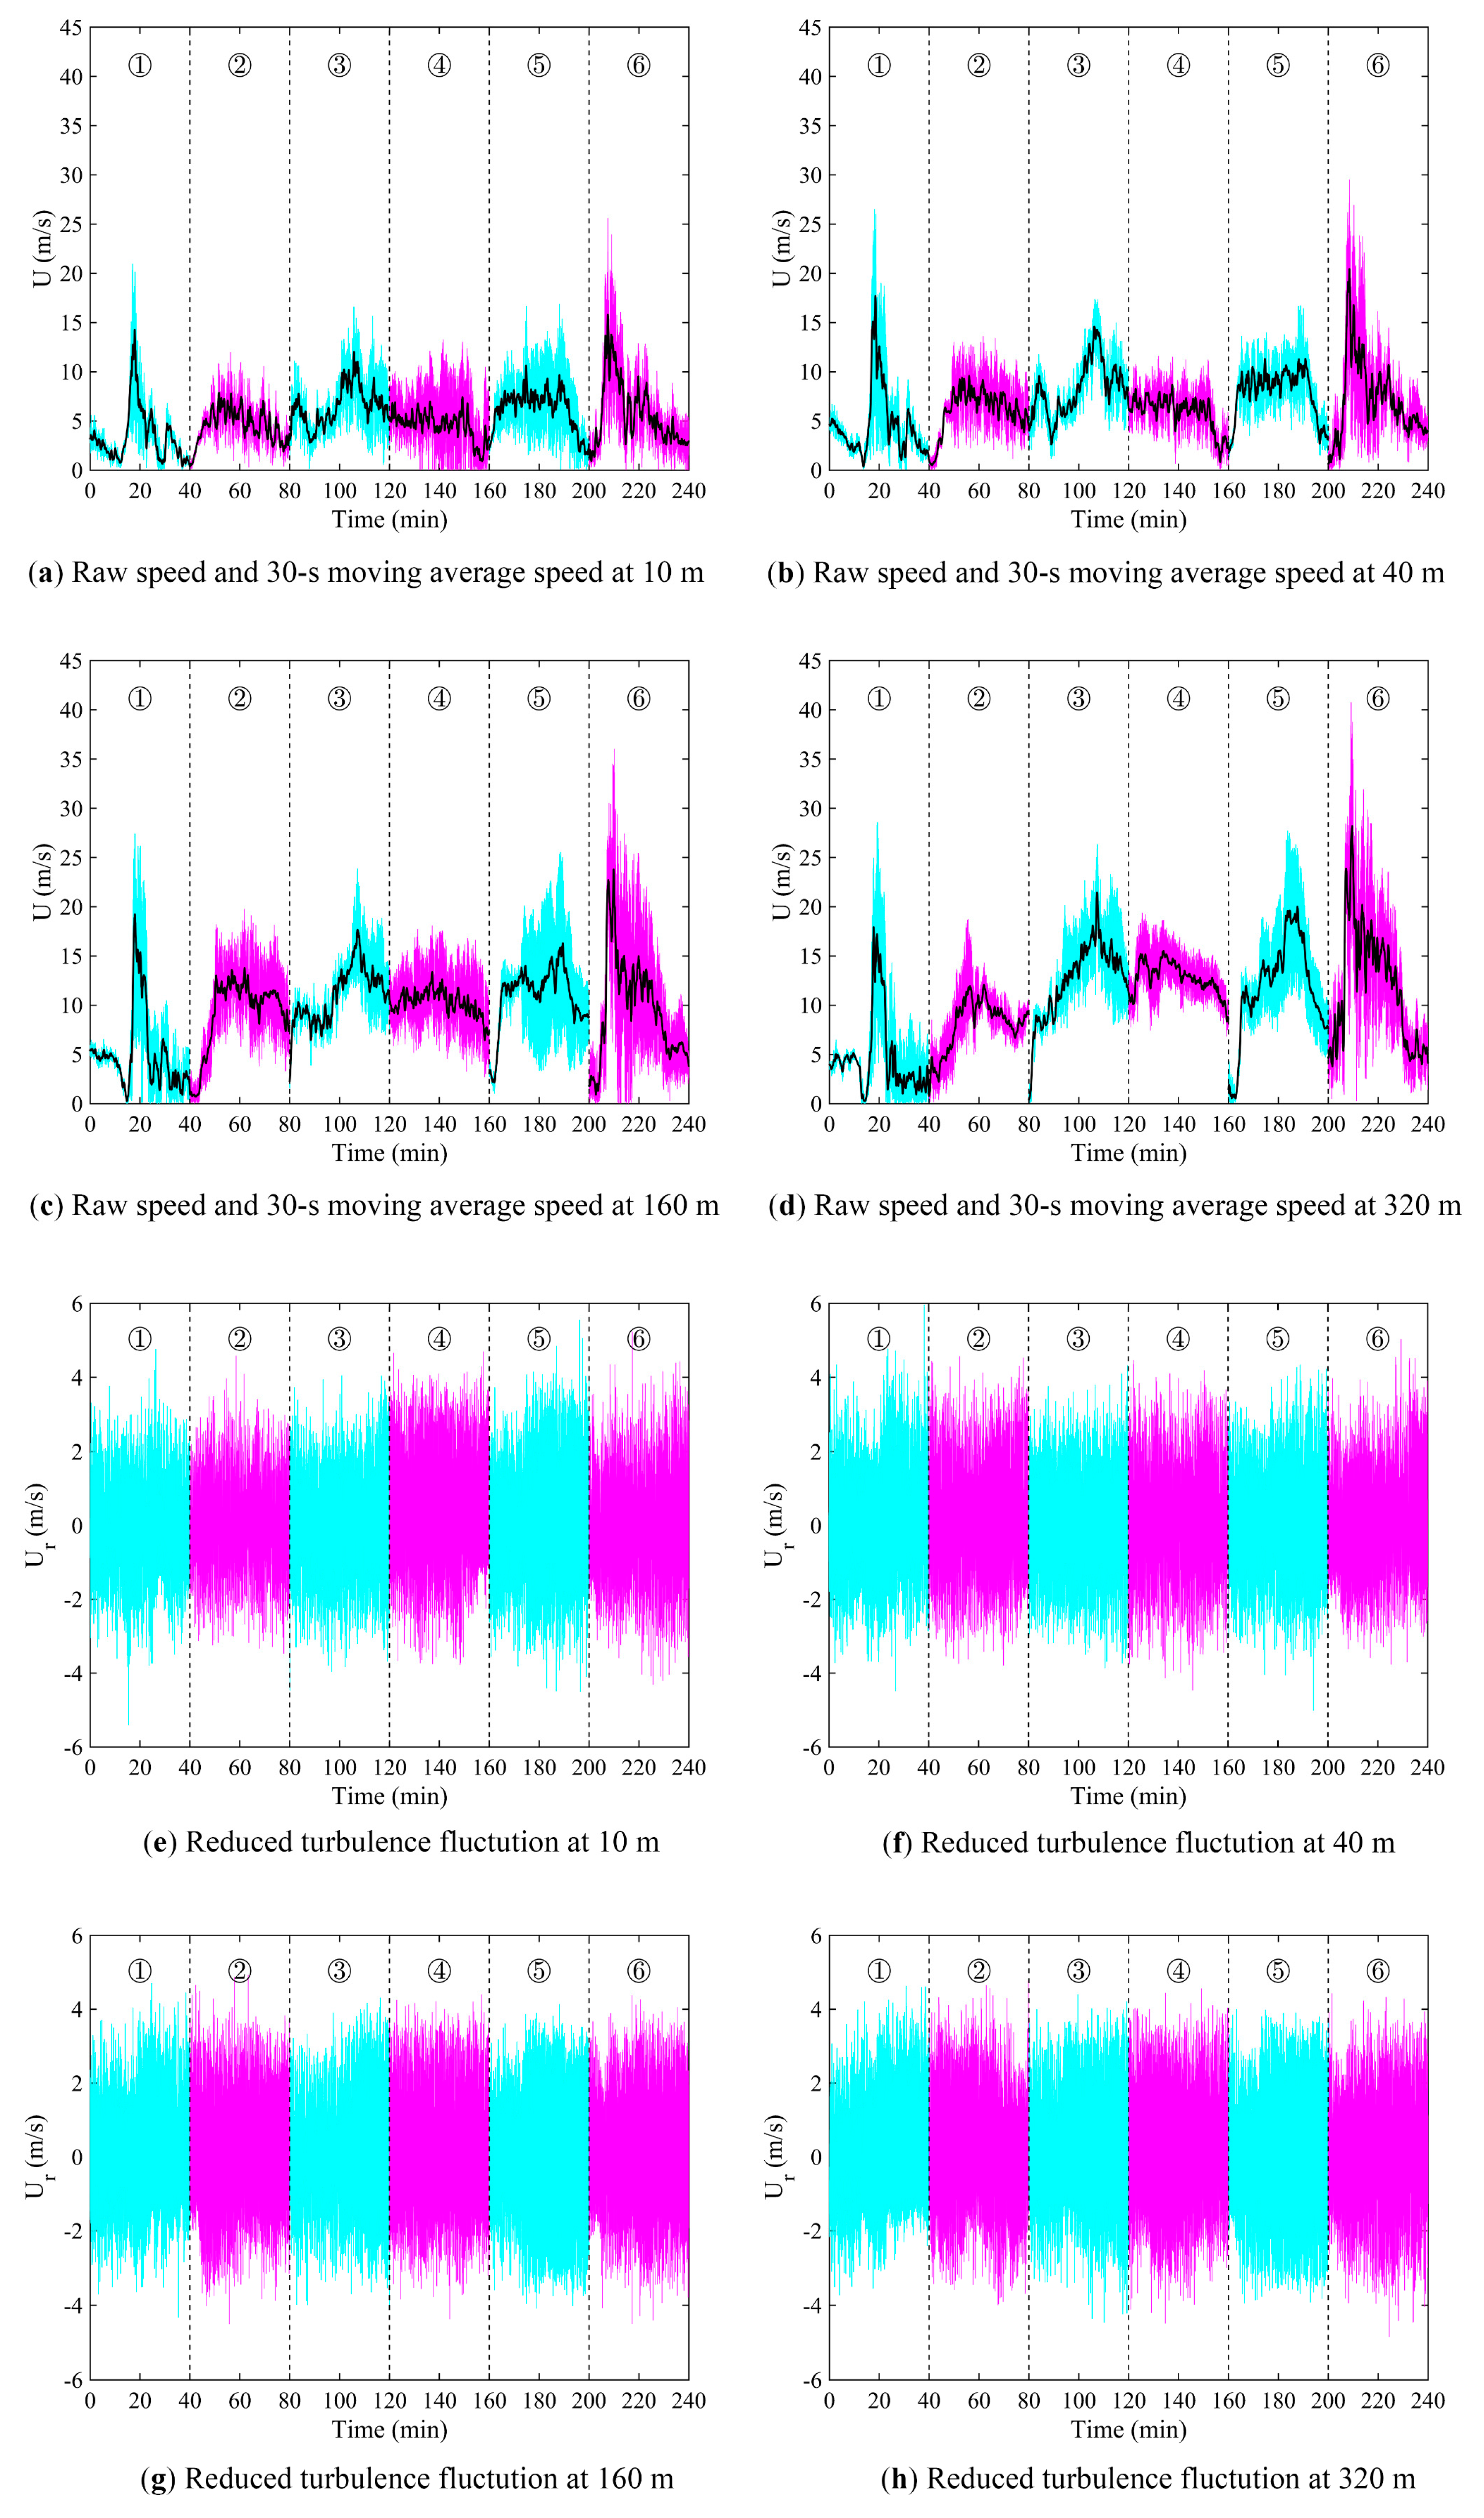
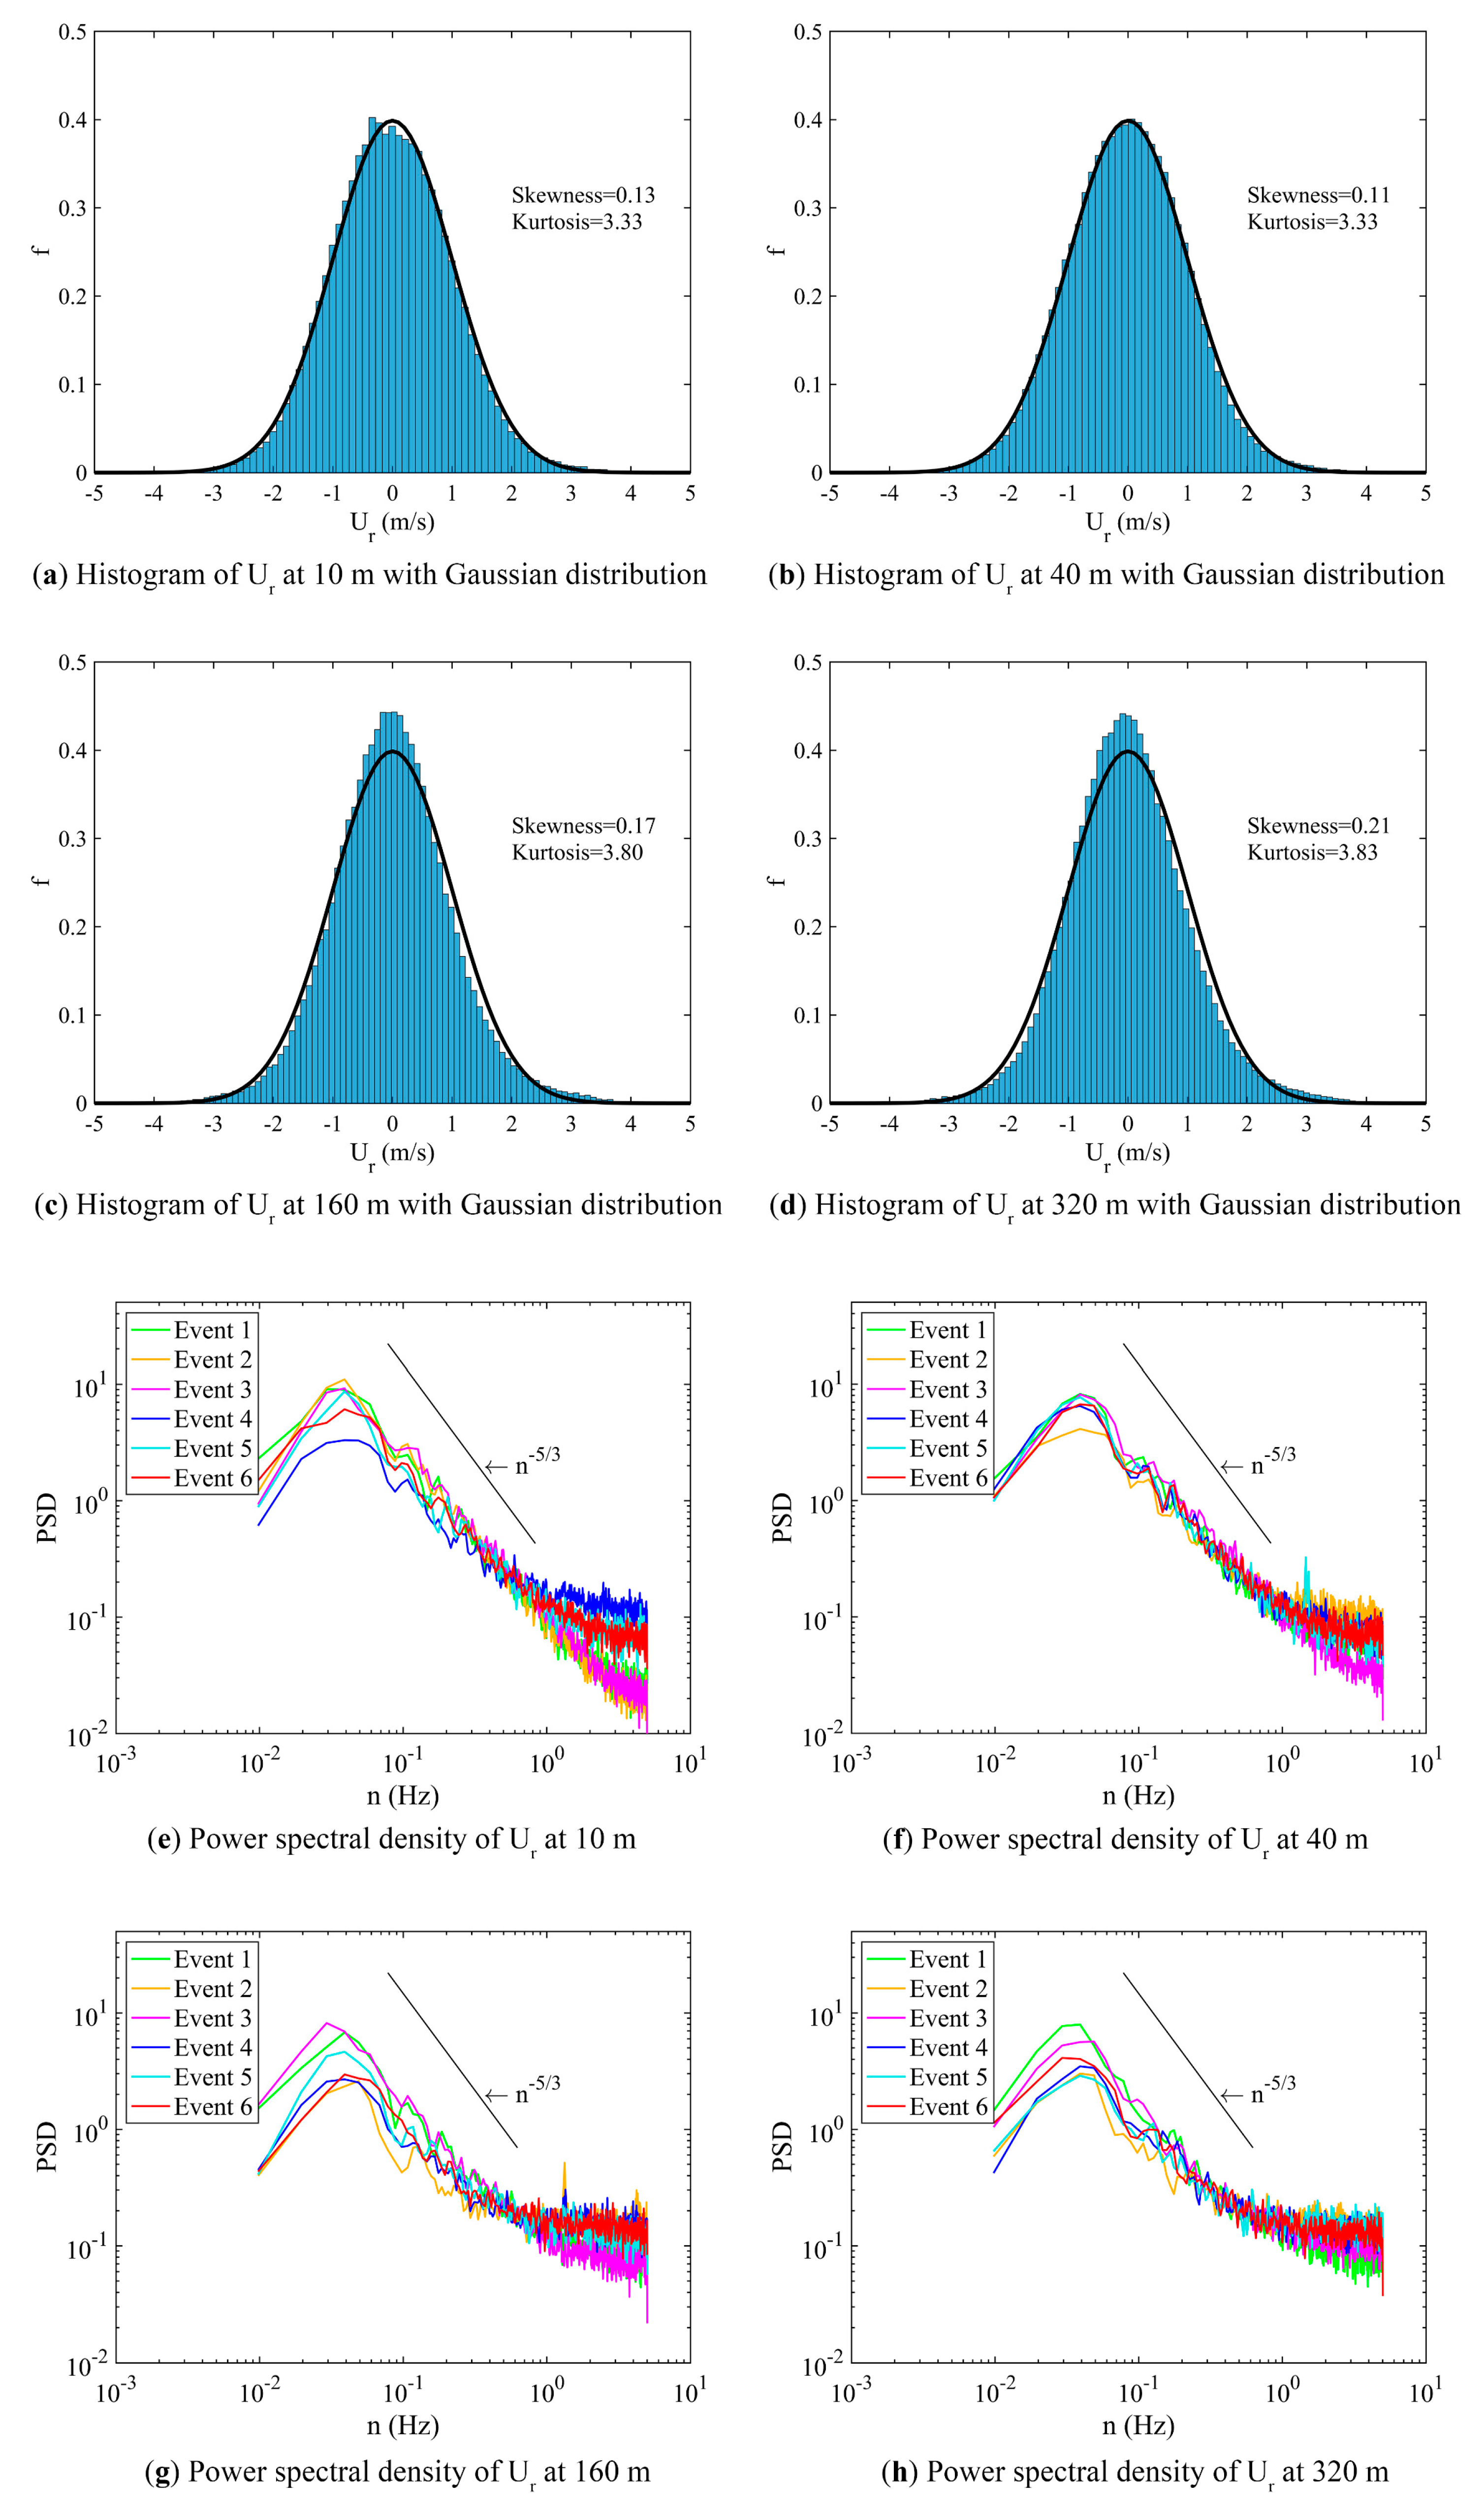
For completeness, the time series of wind at different averaging stages are shown. The raw time series and 30 s average are shown in
Figure 8a–d. The reduced turbulence fluctuations are given in
Figure 8e–h. The resulting Gaussian fits are shown in
Figure 9a–d. It can be seen that, in general, the Gaussian fits the work very well. The corresponding power spectra are shown in
Figure 9e–h. At the various heights, the inertial subrange (−5/3 law) works wells up to about 1 Hz. At higher frequencies, there are deviations from this law, and the power at high frequencies appears to be on the higher side, particularly for cases 4 and 6. More cases would need to be accumulated to see if this is a common feature.
7. Wind Gust Nowcasting
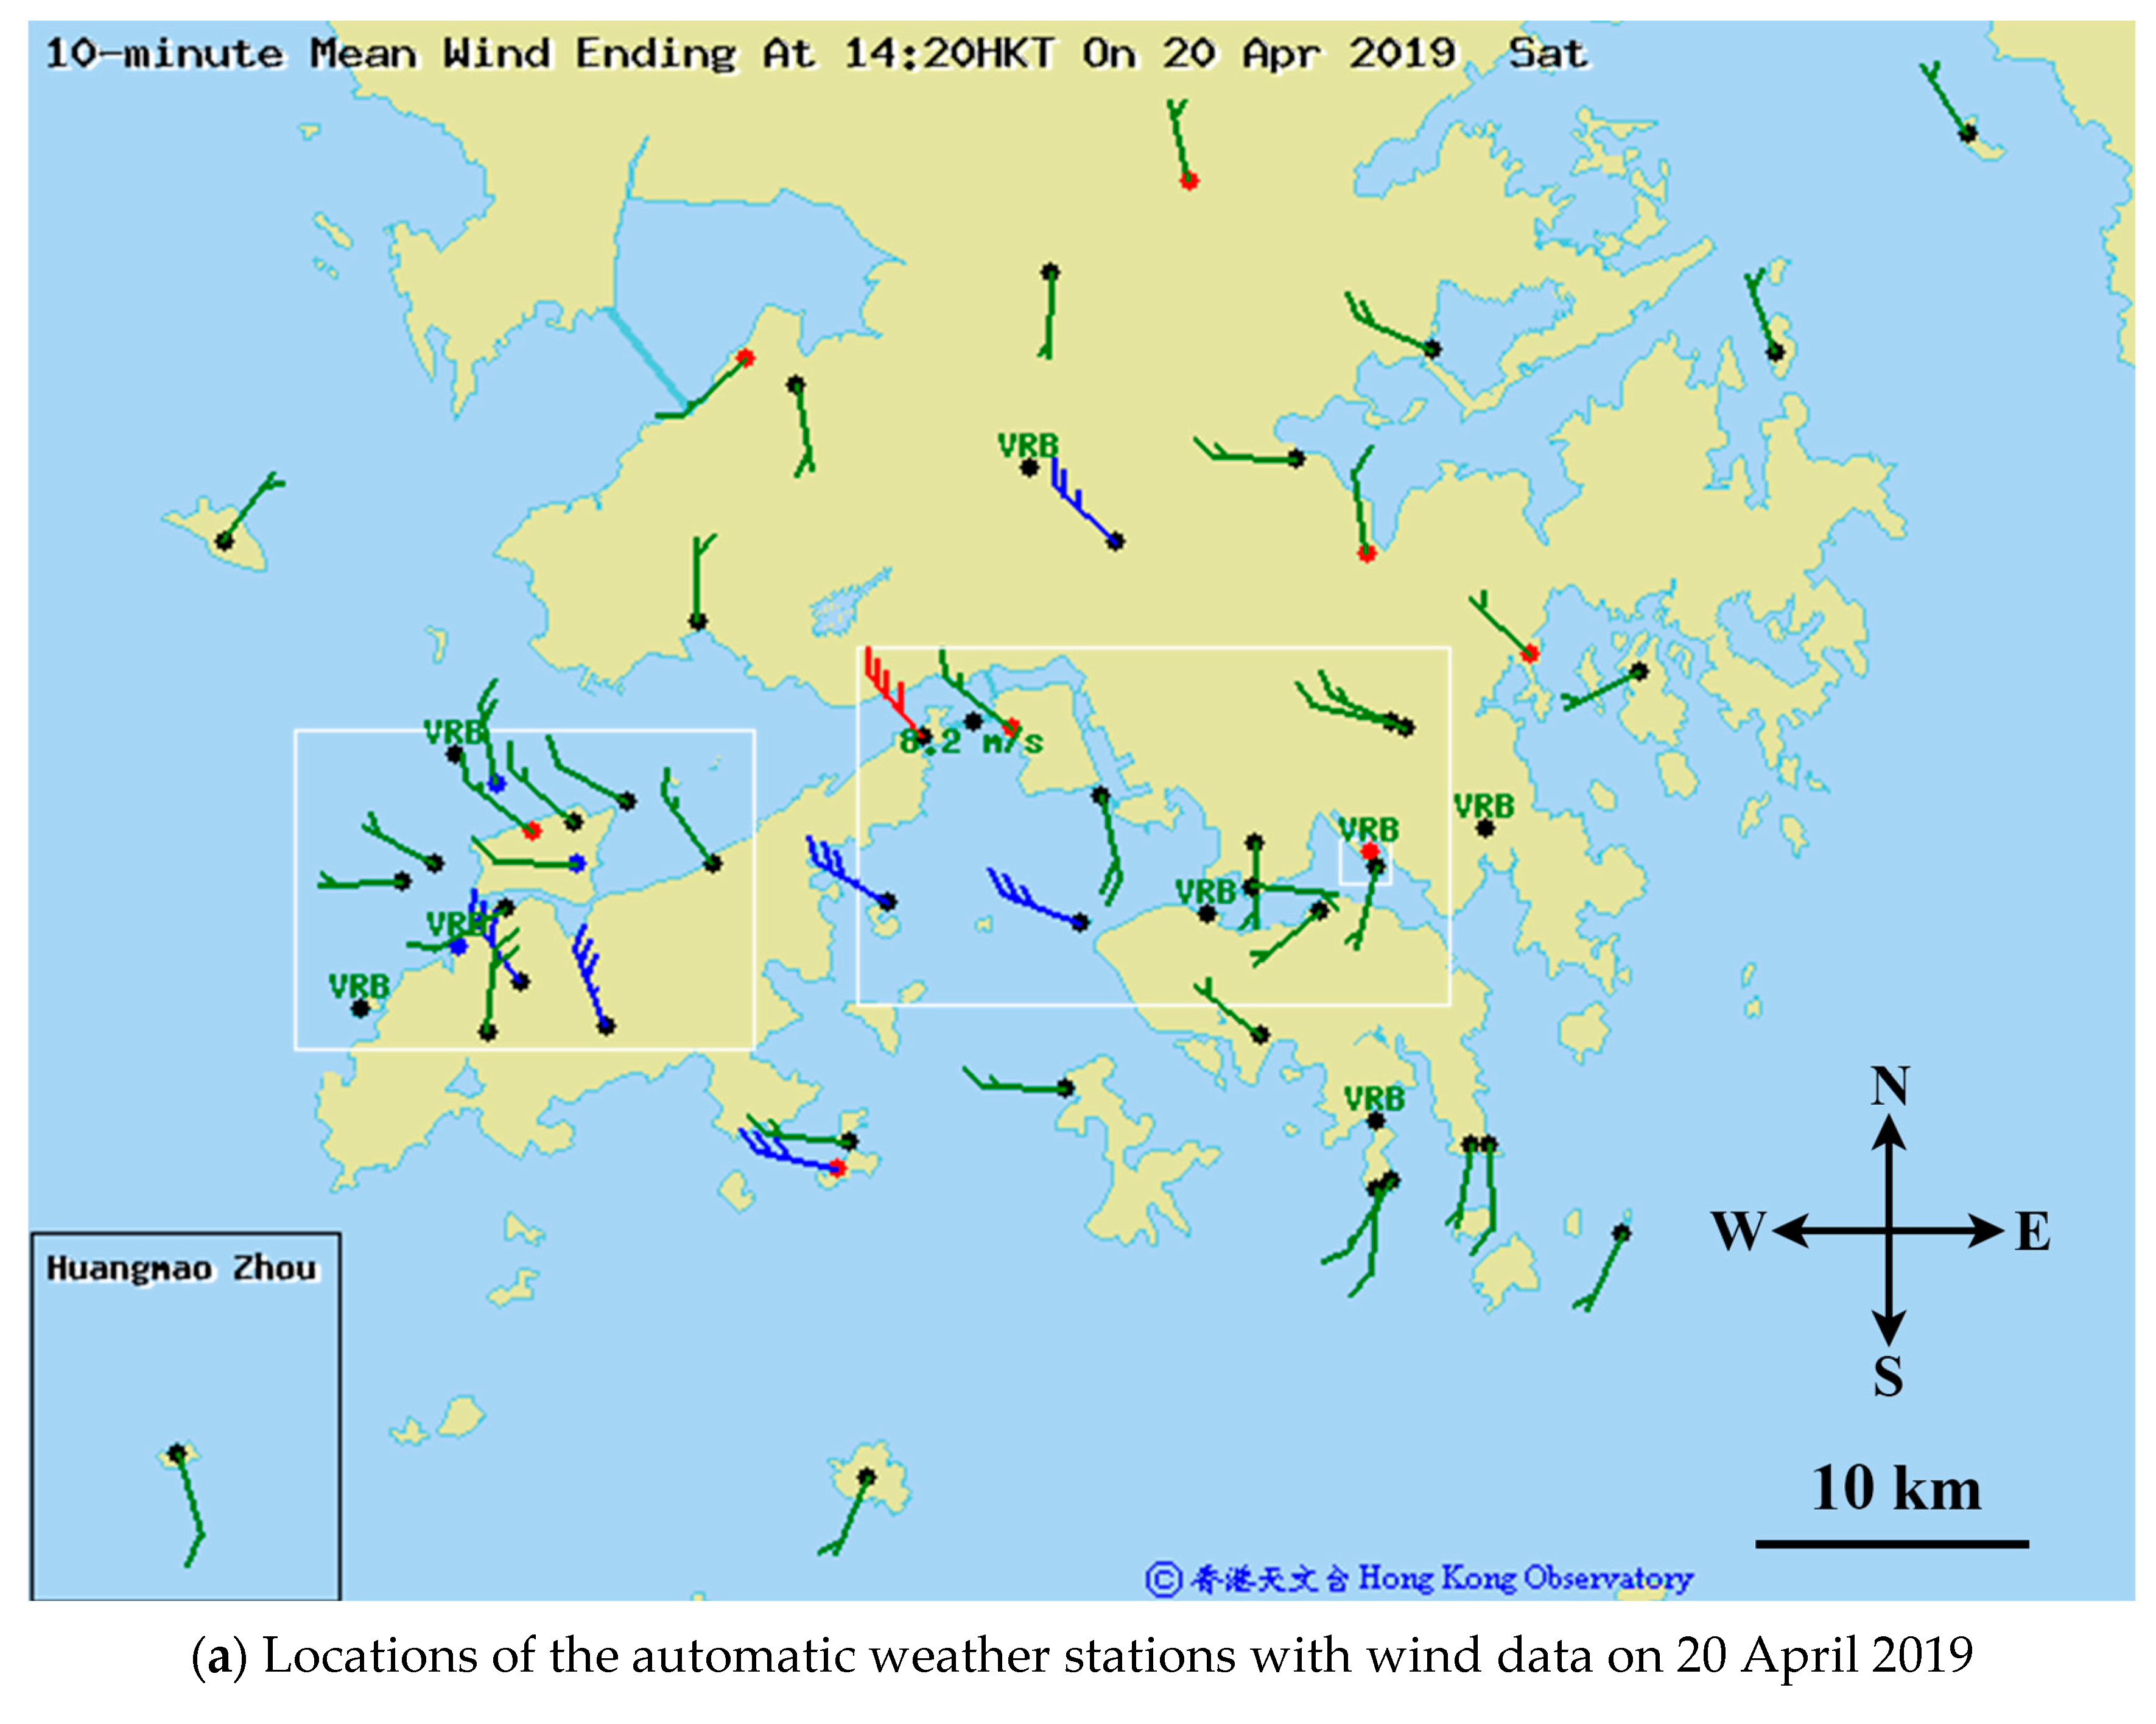
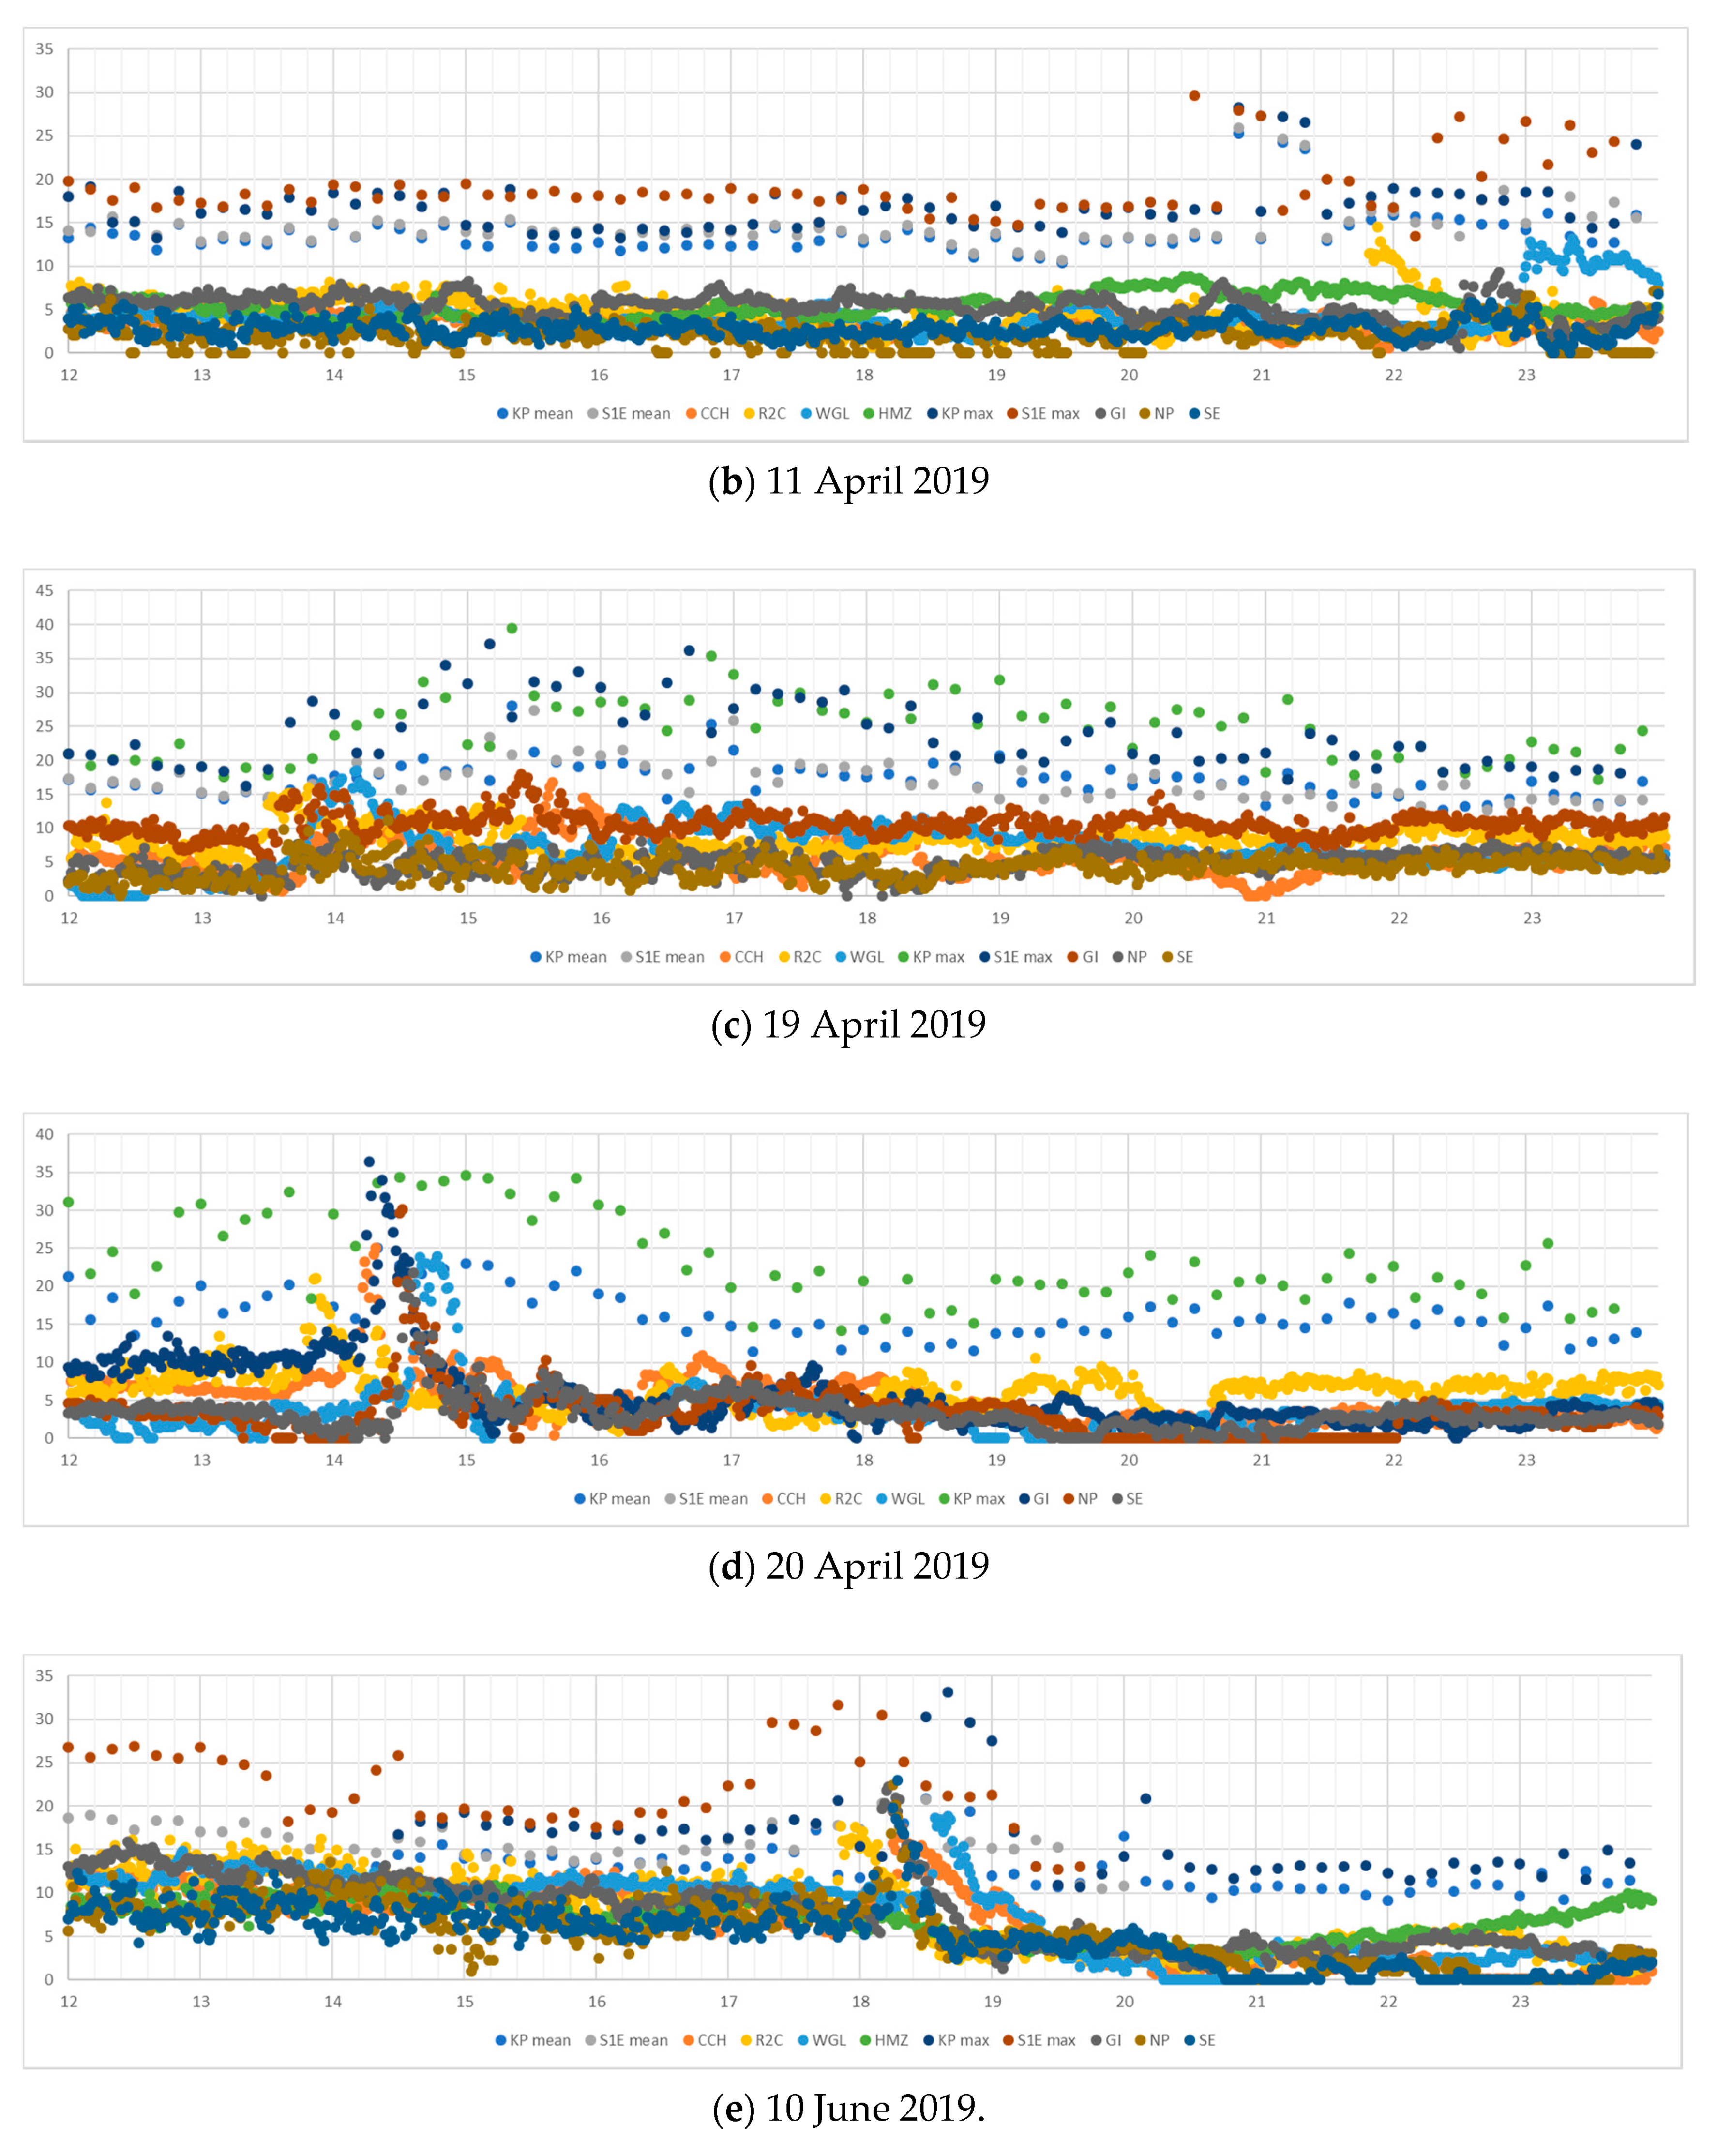
For the six squall line cases, the 1 min (3 s mean) wind gusts, as measured by the anemometers in Hong Kong, were examined. The locations of the surface anemometers are given in
Figure 10a, together with the locations of the microwave radiometers, namely, KP in the urban area and S1E at the airport. The boundary layer-type wind profiler is operated at locations near KP and S1E, respectively, in the derivation of the wind gust estimate. There are two estimates for each site, namely, the mean wind gust estimate and the maximum wind gust estimate. The details could be found in Chan and Hon [
5]. The wind gust estimates serve as nowcasts of the strength of the wind gust, because they show the potential values that the wind gust could reach in order to alert the weather forecasters about the possible strength of the wind gust. They can serve the purpose of nowcasting, though they are observation-based.
Figure 10a also shows the surface anemometer readings (10 min mean wind) during the passage of the squall line through Hong Kong on 20 April 2019, in which wind gust up to 35–40 m/s was registered at some anemometer stations. This is a rather extreme squall line case, and the gust measured is among the top three of the gust climatology of the station, without considering tropical cyclone and strong monsoon cases. For the other cases, the wind gusts are relatively smaller, with a range of 15–20 m/s, and they may be considered to be more “ordinary” squall line cases. The ordinary is in the sense of the gust factor, namely, the gust over the mean wind is in the order of a few times (e.g., 3 to 5 times). For a larger gust factor, the squall line appears to be more special.
The wind gust estimate is plotted with the measured wind gusts at the various stations in the form of a time series in
Figure 10b–e for the various cases studied in this paper. It could be seen that, for ordinary squall line, the mean wind gust is already sufficient for nowcasting the gust magnitude. However, for more extreme cases like the one for 20 April 2019, the maximum wind gust estimate appears to catch the high wind gust at about 20 min before the peak of the wind gust, though the magnitude is still smaller by a few m/s. Nonetheless, the maximum wind gust estimate is considered to be useful in nowcasting the occurrence of gusty winds from squall lines.
8. Conclusions
Subtropical squall lines over the PRD region were studied for the first time using the wind data collected by a 356 m meteorological tower in Shenzhen. Both the mean wind and the turbulence characteristics of the squall lines were examined. The mean wind profile was found to be consistent with the international standards for wind engineering applications, although a low-level jet, which has been reported by previous studies of ordinary thunderstorm outflows (e.g., Choi [
2] and Gunter and Schroeder [
15]), may not be found in individual cases. However, the turbulence intensity profile had quite significant deviations from the international standards, although its characteristics need to be confirmed further with the accumulation of more squall line cases in the PRD region.
The fluctuating wind component of the squall line was analyzed based on the power spectrum method. For all of the six cases considered in this paper, this wind component followed the −5/3 law of inertial subrange up to about 1 Hz, which is similar to ordinary thunderstorm outflows. The power spectrum between 1 and 10 Hz may be suspicious. It is not evident if this is the characteristic of the squall line in this region, or of instrumental issues such as the performance of the sonic anemometers in heavy rain and high wind situations. More systematic studies need to be performed with the accumulation of more squall line cases.
As a meteorological application for weather forecasting, a wind gust nowcast algorithm based on ground-based remote-sensing instruments was studied for the six cases of squall lines. For ordinary squall lines, the mean wind gust estimate appeared to be sufficient in nowcasting the strength of the squall. However, for an extreme wind gust case, the maximum wind gust estimate appeared to be useful in nowcasting the possible occurrence of gusts of 35 to 40 m/s. The results may be useful for similar applications of wind gust estimate for squall line passages.
One major limitation of this paper is that the number of cases was rather small. The meteorological tower has been operated for a relatively short period of time only, and the accumulation of the number of cases of the passage of subtropical squall lines takes time. Thus, further results need to be reported with the accumulation of more cases.
Author Contributions
Conceptualization, P.W.C., J.H. and Q.L.; methodology, P.W.C. and J.H.; formal analysis, P.W.C. and J.H.; investigation, P.W.C. and J.H.; resources, L.L., C.L., L.Z. and H.Y.; data curation, P.W.C.; writing—original draft preparation, P.W.C. and J.H.; writing—review and editing, P.W.C. and J.H.; supervision, Q.L.; funding acquisition, L.L., C.L., L.Z. and H.Y. All authors have read and agreed to the published version of the manuscript.
Funding
This study is supported by National Natural Science Foundation of China (Grant No. 41575005). Data availability. The data in this study are not available for use by others.
Conflicts of Interest
The authors declare no conflict of interest.
References
- Meng, Z.; Zhang, F.; Markowski, P.; Wu, D.; Zhao, K. A modeling study on the development of a bowing structure and associated rear inflow within a squall line over South China. J. Atmos. Sci. 2012, 69, 1182–1207. [Google Scholar] [CrossRef] [Green Version]
- Choi, E.C.C. Field measurement and experimental study of wind speed profile during thunderstorms. J. Wind Eng. Ind. Aerodyn. 2004, 92, 275–290. [Google Scholar] [CrossRef]
- Solari, G.; Burlando, M.; Gaetano, P.; Repetto, M.P. Characteristics of thunderstorms relevant to the wind loading of structures. Wind Struct. 2015, 20, 763–791. [Google Scholar] [CrossRef]
- Burlando, M.; Romanić, D.; Solari, G.; Hangan, H.; Zhang, S. Field Data Analysis and Weather Scenario of a Downburst Event in Livorno, Italy, on 1 October 2012. Mon. Weather Rev. 2017, 145, 3507–3527. [Google Scholar] [CrossRef]
- Chan, P.W.; Hon, K.K. Application of ground-based, multi-channel microwave radiometer in the nowcasting of intense convective weather through instability indices of the atmosphere. Meteorol. Z. 2011, 20, 431–440. [Google Scholar] [CrossRef]
- Li, L.; Chan, P.W.; Wang, D.L.; Tan, M.Y. Rapid urbanization effect on local climate: Intercomparison of climate trends in Shenzhen and Hong Kong, 1968−2013. Clim. Res. 2015, 63, 145–155. [Google Scholar] [CrossRef] [Green Version]
- Lin, L.; Chen, K.; Xia, D.; Wang, H.; Hu, H.; He, F. Measurement of wind field data in Southeast China. Data Brief 2018, 21, 328–333. [Google Scholar] [CrossRef] [PubMed]
- GB50009-2012. Load Code for the Design of Building Structures; China Architecture & Building Press: Beijing, China, 2012. [Google Scholar]
- AIJ-RLB-2004. Recommendations for Loads on Buildings; Architecture Institute of Japan: Tokyo, Japan, 2004. [Google Scholar]
- Lombardo, F.T.; Smith, D.A.; Schroeder, J.L.; Mehta, K.C. Thunderstorm characteristics of importance to wind engineering. J. Wind Eng. Ind. Aerodyn. 2014, 125, 121–132. [Google Scholar] [CrossRef]
- Shu, Z.R.; Li, Q.S.; He, Y.C.; Chan, P.W. Vertical wind profiles for typhoon, monsoon and thunderstorm winds. J. Wind Eng. Ind. Aerodyn. 2017, 168, 190–199. [Google Scholar] [CrossRef]
- Choi, E.C.C. Wind characteristics of tropical thunderstorms. J. Wind Eng. Ind. Aerodyn. 2000, 84, 215–226. [Google Scholar] [CrossRef]
- Holmes, J.D.; Hangan, H.M.; Schroeder, J.L.; Letchford, C.W.; Orwig, K.D. A forensic study of the Lubbock-Reese downdraft of 2002. Wind Struct. 2008, 11, 137–152. [Google Scholar] [CrossRef]
- Welch, P.D. The use of fast Fourier transform for the estimation of power spectra: A method based on time averaging over short, modified periodograms. IEEE Trans. Audio Electroacoust. 1967, AU-15, 70–73. [Google Scholar] [CrossRef] [Green Version]
- Gunter, W.S.; Schroeder, J.L. High-resolution full-scale measurements of thunderstorm outflow winds. J. Wind Eng. Ind. Aerodyn. 2015, 138, 13–26. [Google Scholar] [CrossRef]
Figure 1.
(a) Bird view of Shenzhen Meteorological Gradient Tower (SZMGT), (b) locations of anemometer installation, and (c) the geographical location of SZMGT (red triangle) in Google Map.
Figure 1.
(a) Bird view of Shenzhen Meteorological Gradient Tower (SZMGT), (b) locations of anemometer installation, and (c) the geographical location of SZMGT (red triangle) in Google Map.
Figure 2.
The upper four panels (a–d) are the surface isobaric charts at 00 UTC of the squall line days, and the lower four panels (e–h) are the weather radar imagery when the squall line passed through Shenzhen, China.
Figure 2.
The upper four panels (a–d) are the surface isobaric charts at 00 UTC of the squall line days, and the lower four panels (e–h) are the weather radar imagery when the squall line passed through Shenzhen, China.
Figure 3.
Ensemble mean wind profile of all 6 events. N is the number of individual profile members. Individual measurements (green dots), mean (black squares) and standard deviation (horizontal bars) are shown for each height bin. Power law fitting and empirical profiles are also shown.
Figure 3.
Ensemble mean wind profile of all 6 events. N is the number of individual profile members. Individual measurements (green dots), mean (black squares) and standard deviation (horizontal bars) are shown for each height bin. Power law fitting and empirical profiles are also shown.
Figure 4.
Wind profiles of each individual event, total = 6. N refers to number of samples.
Figure 4.
Wind profiles of each individual event, total = 6. N refers to number of samples.
Figure 5.
Ensemble mean turbulence intensity profile of all 6 events.
Figure 5.
Ensemble mean turbulence intensity profile of all 6 events.
Figure 6.
Turbulence intensity profiles of each individual event, total = 6. N refers to the number of samples in each panel.
Figure 6.
Turbulence intensity profiles of each individual event, total = 6. N refers to the number of samples in each panel.
Figure 7.
Gust factor profile of all 6 events.
Figure 7.
Gust factor profile of all 6 events.
Figure 8.
Time histories of (a–d) measured and slowly varying mean wind speed, and (e–h) reduced turbulence fluctuation, at height levels of 10, 40, 160 and 320 m during 6 events.
Figure 8.
Time histories of (a–d) measured and slowly varying mean wind speed, and (e–h) reduced turbulence fluctuation, at height levels of 10, 40, 160 and 320 m during 6 events.
Figure 9.
(a–d) Histograms of reduced turbulence fluctuation compared with Gaussian distribution, and (e–h) power spectral densities compared with −5/3 law, at height levels of 10, 40, 160 and 320 m during 6 events.
Figure 9.
(a–d) Histograms of reduced turbulence fluctuation compared with Gaussian distribution, and (e–h) power spectral densities compared with −5/3 law, at height levels of 10, 40, 160 and 320 m during 6 events.
Figure 10.
(a) The locations of the automatic weather stations with wind data (locations with wind barbs) and the two stations equipped with the microwave radiometer (KP and S1E), together with the winds over Hong Kong during the passage of the squall line on 20 April 2019; (b–e) are the time series of the wind gust at the weather stations and the nowcast wind gusts (including maximum and mean) determined from the wind profiler and microwave radiometer data. The x axis is time in HKT and y axis is the gust in m/s.
© 2020 by the authors. Licensee MDPI, Basel, Switzerland. This article is an open access article distributed under the terms and conditions of the Creative Commons Attribution (CC BY) license (http://creativecommons.org/licenses/by/4.0/).


