Disdrometer, Polarimetric Radar, and Condensation Nuclei Observations of Supercell and Multicell Storms on 11 June 2018 in Eastern Nebraska


Department of Earth and Atmospheric Sciences, University of Nebraska-Lincoln, Lincoln, NE 68588, USA
Atmosphere 2020, 11(7), 770; https://doi.org/10.3390/atmos11070770
Submission received: 12 June 2020
/
Revised: 15 July 2020
/
Accepted: 18 July 2020
/
Published: 21 July 2020
(This article belongs to the Special Issue Measurement and Modeling of the Precipitation Particle Size Distribution)
Abstract
:Disdrometer and condensation nuclei (CN) data are compared with operational polarimetric radar data for one multicell and one supercell storm in eastern Nebraska on 11 June 2018. The radar was located ~14.3 km from the instrumentation location and provided excellent observation time series with new low-level samples every 1–2 min. Reflectivity derived by the disdrometer and radar compared well, especially in regions with high number concentration of drops and reflectivity <45 dBZ. Differential reflectivity also compared well between the datasets, though it was most similar in the supercell storm. Rain rate calculated by the disdrometer closely matched values estimated by the radar when reflectivity and differential reflectivity were used to produce the estimate. Concentration of CN generally followed precipitation intensity for the leading convective cell, with evidence for higher particle concentration on the edges of the convective cell associated with outflow. The distribution of CN in the supercell was more complex and generally did not follow precipitation intensity.
1. Introduction
Supercell thunderstorms are complex and impactful. They are responsible for a large proportion of significant severe weather events in the United States [1,2] and often contain novel drop size distributions (DSDs) and mixtures of particle types [3,4]. Their microphysics are influenced by condensation nucleus (CN) concentrations in their environment [5,6], with larger inflow CN concentration possibly associated with stronger convective updrafts. Polarimetric radar observations provide a means to infer microphysical properties of supercell storms [7]. A challenge of this approach is validation of radar-derived particle distributions, which can be accomplished using airborne or ground-based sensors. The primary goal of this paper is to provide a comparison of polarimetric radar and disdrometer datasets from a supercell storm which passed over a ground-based disdrometer and was near an operational S-band radar. Secondary goals are to compare radar and disdrometer observations in a multicell storm which occurred earlier, and to present CN observations from both storms.
Polarimetric radar signatures of supercell storms are well-known ([8,9,10,11] and many others). The focal signatures sampled in this study include the differential reflectivity (ZDR) arc and the specific differential phase (KDP) foot. The ZDR arc [8] is a shallow, often narrow band of sparse liquid drops with large median diameter located along a supercell’s forward flank. It develops in response to size sorting in the storm-relative inflow [8,12,13] and may change markedly through time, perhaps indicating changes in the storm-relative wind profile [14,15]. ZDR arc characteristics have been explored as a possible indicator of a storm’s tornadic potential [16,17]. The KDP foot [9] is an area of large KDP values typically found in a storm’s reflectivity (ZHH) core downwind from where hail falls out and may indicate high liquid water content (LWC) in melting hail. Large quantities of small hail are known to produce high KDP values [18], as are extreme rainfall rates associated with flooding [19].
Several prior studies have reported disdrometer measurements from supercells and compared those datasets with polarimetric radar observations. [20] reported video disdrometer measurements of forward-flank DSDs from a short-lived Oklahoma supercell located ~41.5 km from the polarimetric S-band Cimarron radar. Large drops were present in low number concentration along the forward flank and drops with diameter < 1 mm became much more common as the precipitation core moved overhead. The band of large drops sampled by the disdrometer along the forward flank corresponded to radar measurements of ZDR > 3 dB. Disdrometer observations of hail also corresponded to radar measurements of ZDR < 1 dB. The authors noted that close agreement between the radar and disdrometer measurements was not anticipated given the rapid changes of precipitation characteristics in space and time, and since strong wind likely contributed to undercatchment of particles by the disdrometer, e.g., [21]. Carey et al. [22] reported video disdrometer measurements from a tornadic cool-season supercell and compared them with observations from a C-band radar located 14 km from the disdrometer. The storm produced an EF-2 tornado and passed over the disdrometer just prior to tornadogenesis. Radar-derived ZDR values of 5–8 dB in the ZDR arc were confirmed to be large drops (mass weighted mean diameter 3 mm; maximum drop size > 6 mm) by disdrometer measurements. Large drops in low concentration were observed throughout the forward flank. Hail and large drops distinguished by the disdrometer were not readily distinguishable in the C-band radar dataset. Giant liquid drops observed in a core of an Oklahoma supercell ~55 km away from the nearest Weather Surveillance Radar-1988 Doppler (WSR-88D), the same radar network as used in the current study, were collocated with large ZDR and KDP values, and were possibly associated with melting hail [23]. Supercell DSDs have recently been observed above the surface using an airborne video disdrometer [24].
Ott particle size and velocity (PARSIVEL; OTT HydroMet, Kempten, Germany) disdrometers such as that used in the current research have also been used in prior supercell studies. [25] reported PARSIVEL observations from a Verification of the Origin of Rotation in Tornadoes Experiment-2 (VORTEX2) isolated tornadic supercell located ~76 km from a WSR-88D, though few radar observations were reported by [25]. The disdrometer indicated large drops and small hailstones in the forward flank region. Additional VORTEX2 PARSIVEL disdrometer observations of supercells were discussed by [26], including two storms for which forward flank observations were collected. These storms were ≥123 km from a WSR-88D, precluding comparison. Disdrometer datasets were instead compared with mobile X-band radar observations and an agreement of 38–45% was found between the two datasets, which was within the PARSIVEL’s sampling uncertainty. The need to perform quality control on PARSIVEL data collected in high wind conditions has been discussed in prior studies [3,25].
Observations were collected by a ground-based PARSIVEL disdrometer under a supercell and leading convective cell. The supercell exhibited strong low-level rotation and produced severe hail. The ZDR arc and KDP foot regions were sampled at a location ~14.3 km from the S-band WSR-88D radar KOAX (Omaha/Valley, Nebraska). The radar sampled the low levels every 1–2 min throughout the event. This represents the closest supercell disdrometer dataset to an operational S-band radar with the best temporal resolution of which the author is aware, allowing detailed comparison of the polarimetric radar characteristics and similar disdrometer-derived variables. Measurements of the ZDR arc and forward flank of a supercell at close range to an operational radar were also helpful for understanding the microphysics of this storm region, which is indicative of the storm-relative wind field. CN changes at high temporal resolution are also examined in the near-convection environment for perhaps the first time in the literature.
2. Data and Methods
The disdrometer dataset was collected from 2116–2256 UTC on 11 June 2018. The instrument was in an open area near the Fremont Middle School (41.433° N, −96.450° W) in Fremont, Nebraska, ~14.3 km northwest of KOAX. Assuming standard radar beam propagation, the radar beam centerline altitude was ~155 m above the surface at the disdrometer location. While the disdrometer was collecting data, a young and developing convective cell passed overhead between ~2130–2150 UTC accompanied by a short burst of heavy rain. Then, a supercell passed over the instrument from ~2226–2253 UTC, including the ZDR arc and storm core.
Quality control was performed on the disdrometer dataset following the procedure of Friedrich et al. [25] since it was collected in an environment which often contained strong wind and heavy rainfall. The template presented by Friedrich et al. [25]; their Figure B1 was used to separate margin fallers (drops which fall through the edge of the laser beam, and thus are removed), rain (correctly sampled liquid drops), hail and graupel (correctly sampled ice particles), drops produced by splashing on the instrument heads (and thus removed), and to remove the effects of strong wind manifest as drops with unnaturally low fall velocities. The “rain” category was expanded to include additional bins not included in the original template of [25] because these bins often contained detections contiguous to the “rain” range when rain was known to be falling. The quality control template used in this study is shown in Figure 1.
KOAX collected data using volume coverage pattern (VCP)-212 [27] throughout the event. This VCP is characterized by frequent low-level samples and produced a low-level scan of reflectivity factor (ZHH) approximately every 1–2 min. Low-level scans of differential reflectivity (ZDR), copolar cross-correlation coefficient (ρhv), and differential phase (φDP) were produced approximately every two minutes. ZDR is a variable which indicates the average reflectivity-weighted horizontal to vertical aspect ratio of scatterers in a sample volume, while ρhv is a measure of scatterer diversity in a sample volume. φDP is a measure of the phase shift between the horizontally- and vertically-polarized transmitted energy [28] and can be used to estimate liquid water content.
ZDR data from the WSR-88D were calibrated following the procedure of [29], which is also applied by [17,30]. From the radar dataset, the low-level scan nearest the midpoint of the disdrometer dataset was selected (~2206 UTC) and all pixels ~1.5 km above the ambient 0 °C level in convective anvil regions with 20 dBZ ≤ ZHH ≤ 35 dBZ were selected. Within this region, the expected ZDR value for dry snow aggregates is ~0.15 dB. The actual value was found to be 0.228 dB, leading to a calibration factor of 0.078 dB, which was subtracted from all the ZDR fields analyzed herein. ZDR was calculated from the disdrometer measurements using all particles detected (Figure 1). A power-weighted mean drop diameter was calculated at each measurement time, and this diameter was converted to a power-weighted mean axis ratio following [31]:
where is the power-weighted mean axis ratio and D is the power-weighted mean drop diameter. Then, the ZDR was estimated following [32]:
Two methods were used to calculate the ZHH from the measured particle distributions. First, a mean droplet axis ratio was calculated for each particle size bin following [33], valid for raindrops in PARSIVEL measurements:
where (b/a) represents the drop axis ratio and Deq is the equivalent volume diameter (mm). Once the mean drop axis ratio was known, the horizontal and vertical dimensions of a drop were calculated using Deq, which is a standard disdrometer output:
where a is the radius of the major axis and b is the radius of the minor axis. Then, substituting a value in for b from Equation (3), we obtain:
Once a is known, Equation (3) was used to get a value for b. Then, ZHH was calculated using a standard equation for Rayleigh scattering, keeping in mind that a and b are major and minor radii rather than diameter values (e.g., 2a = DHH):
where n = the number of drops measured in each size class i with a mean diameter of Di (mm), and Vi is the sample volume representative of a particular raindrop, calculated as [20]:
where wt is the terminal velocity of a particular raindrop size [m s−1], A = a constant sampling area for the disdrometer (0.0054 m2), and T(s) = the 60-s sample time. All ice particles were assumed to be water-coated, which is reasonable at low levels in a warm environment, and the axis ratio was applied to all particles in a particular size bin. No ice particles were large enough to introduce substantial error if Rayleigh scattering was assumed (e.g., largest ice particle size of 13 mm).
The PARSIVEL also estimates ZHH (dBZ) directly for each measurement interval (10 s) using another typical equation:
where ΔDi = the width of a particle size class [25]. This represents a second method to calculate a value for ZHH which can be compared with radar observations. The ZHH values estimated using Equation (8) were averaged in the one minute surrounding the radar scan time, and ZHH values resulting from Equations (6) and (8) were compared with the radar-derived ZHH estimate [20]. Radar-estimated ZDR was also compared directly with disdrometer estimates. These comparisons also utilized 1-min averages of disdrometer-measured quantities as by [20].
Rain rate is estimated by the PARSIVEL disdrometer from the measured distribution of drops using:
Rain rate can be derived from WSR-88D observations by plugging measured values of the polarimetric variables into equations which have been developed for various scenarios. This supercell storm was dominated by convective rainfall with occasional hail. A rain rate equation based on ZHH and ZDR is typically appropriate for pure rain [34]. Adding specific differential phase (KDP), the range derivative of φDP is appropriate when hail may be present since KDP is insensitive to particle phase. Thus, R(ZHH, ZDR) and R(KDP) were calculated for all times sampled by the disdrometer using the following equations [34,35]:
where lin indicates the linear value of a variable. These equations were derived using measurements in typical Oklahoma rainfall. Error is potentially introduced since drop size distributions in supercell storms may be novel [3,4], and average Oklahoma rainfall may not be representative of Nebraska rainfall on this day.
CN data were collected by a recently calibrated condensation particle counter (CPC) 3007 manufactured by TSI Incorporated [36]. The instrument detects particles with diameter from 10 nm to >1 μm with a concentration accuracy of ±20% and 95% response time of 9 s. CN concentration values were recorded once per second from 2125–2256 UTC, and the instrument was collocated with the disdrometer at the Fremont Middle School. Thus, the CN data were representative of the air mass just ahead of the leading convective cell, the rain-free air mass representing supercell inflow, and the air masses beneath the leading convective cell and supercell storm.
3. Results
3.1. Supercell Storm Overview
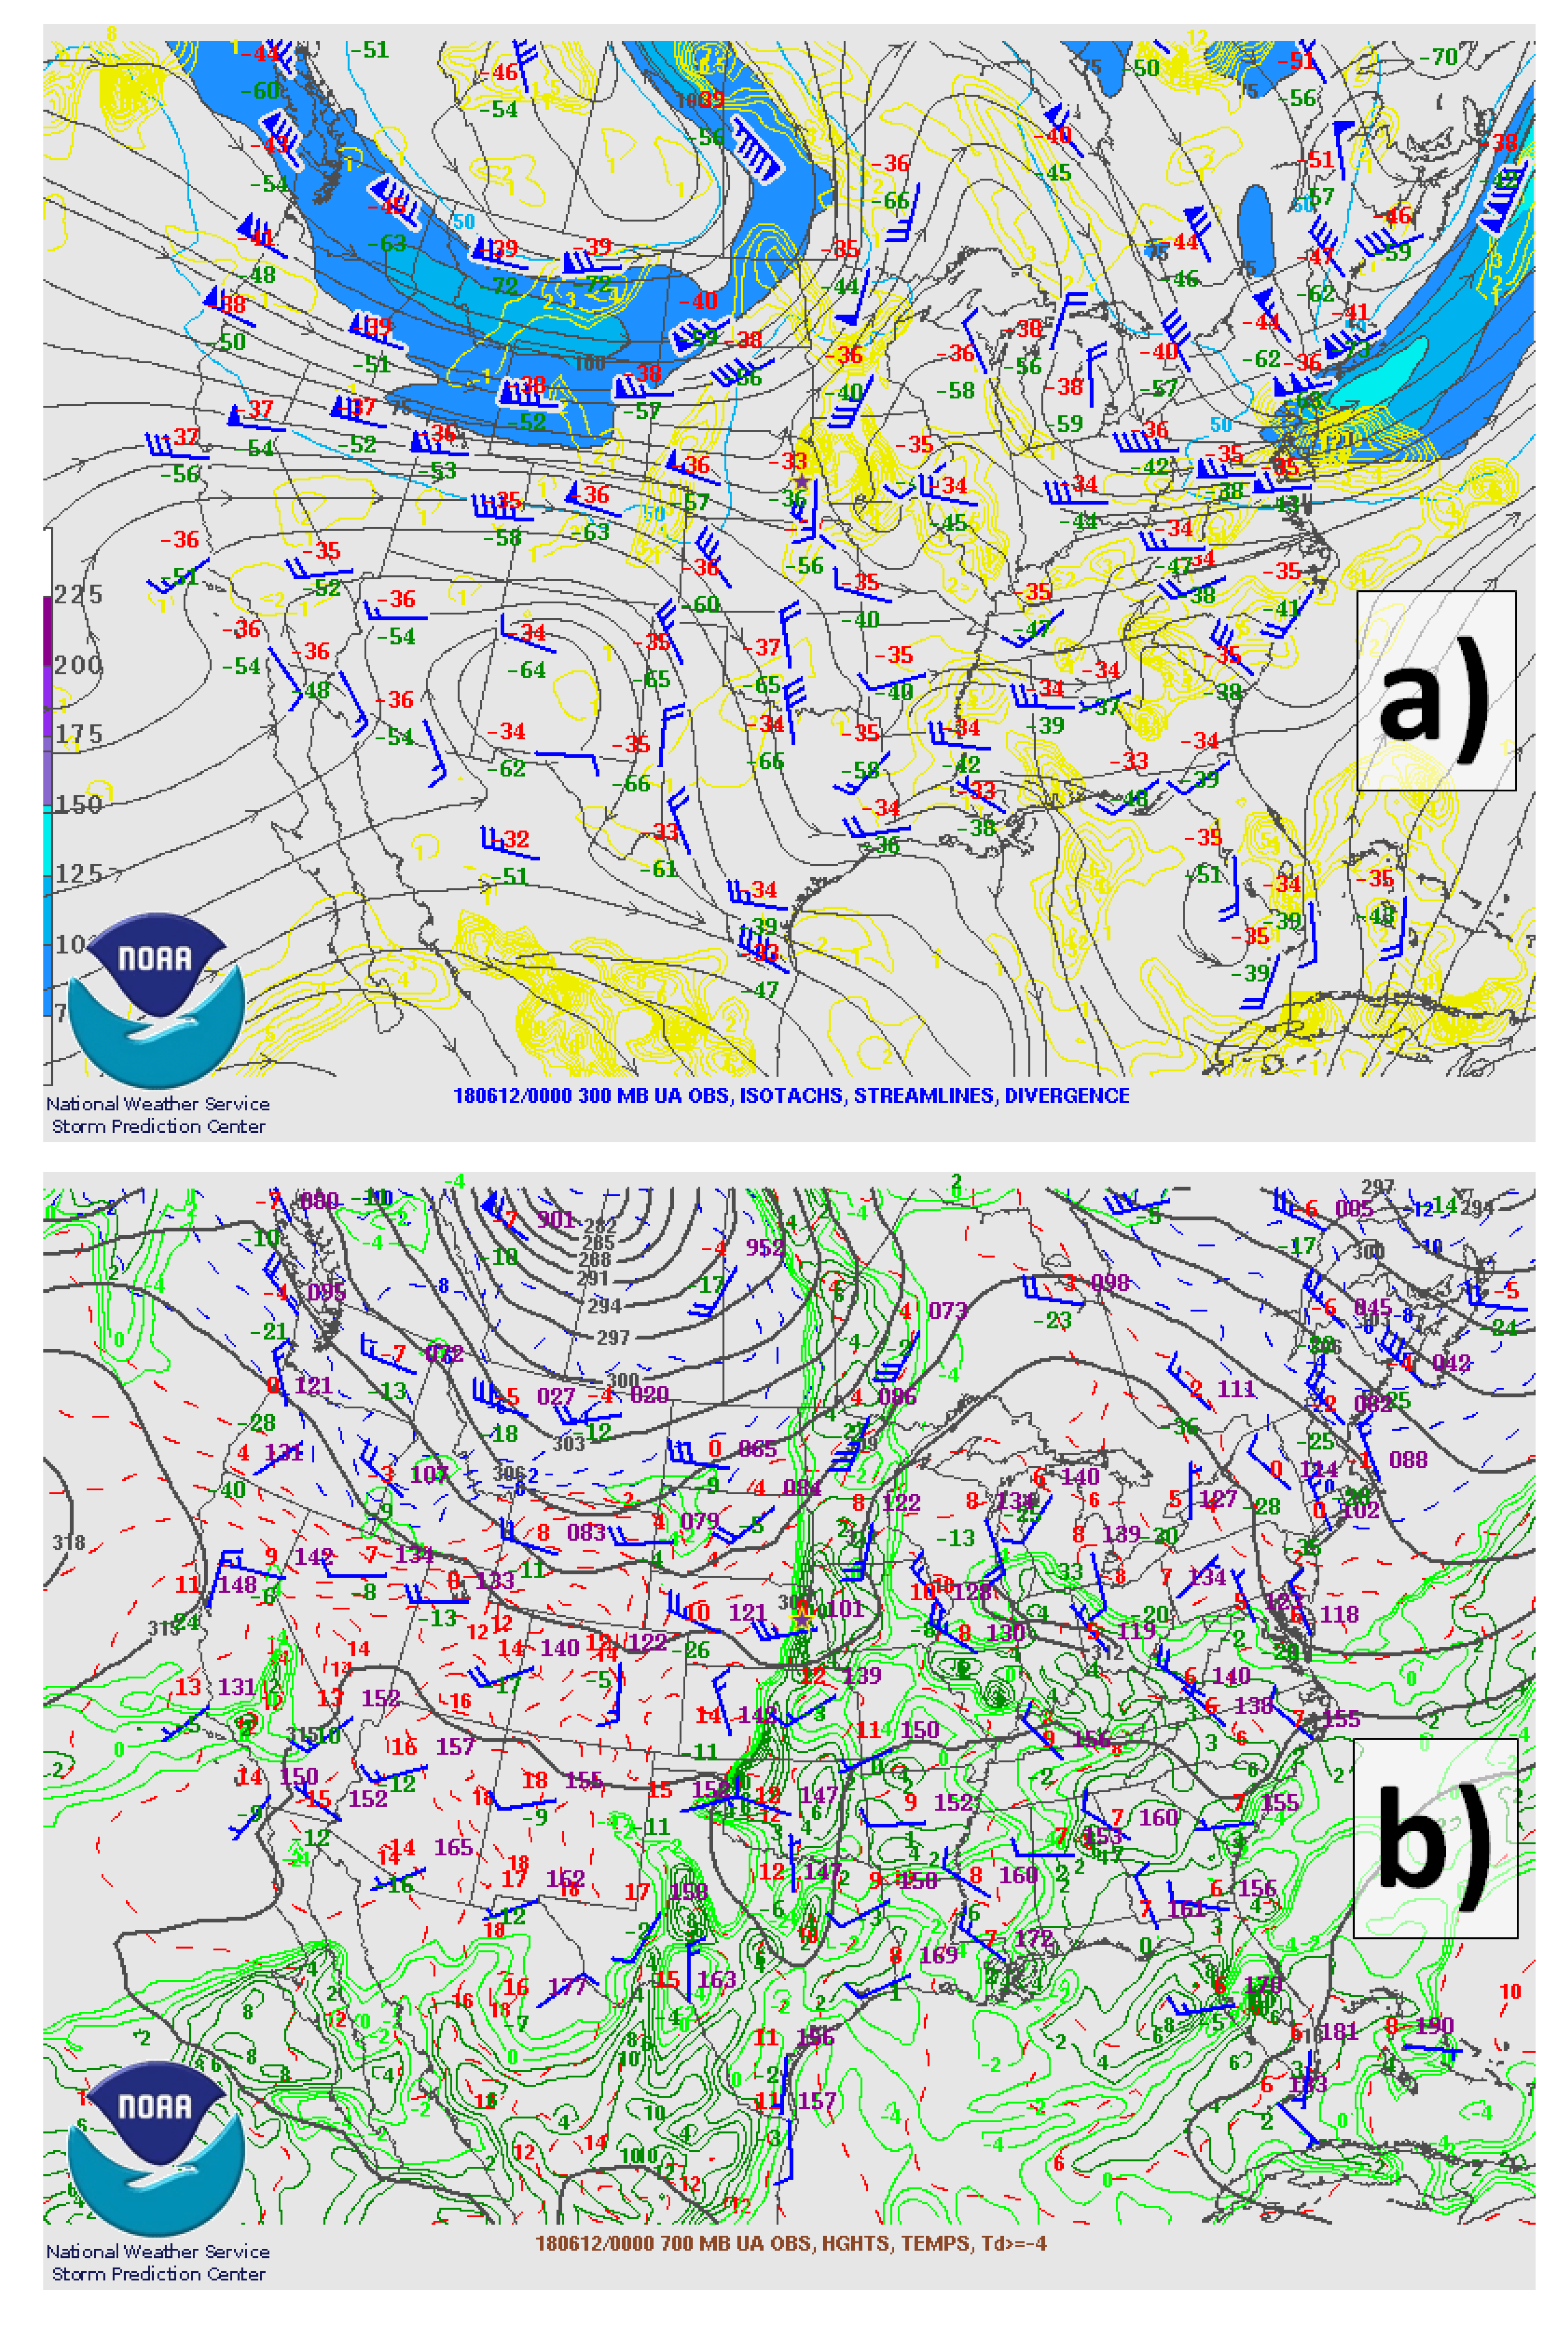
A synoptic shortwave crossed the northern Great Plains on 11 June 2018, with its axis at 300 hPa located through eastern Nebraska at 00 UTC on 12 June (Figure 2a). A 700-hPa wind shift and sharp moisture gradient were collocated (Figure 2b), and a surface cold front moved south across Nebraska on 11 June. Convection initiated along the front around 21 UTC, moving south and east as the cold front advanced. When convection initiated, the sharp frontal boundary was located from northcentral Kansas to northeast Nebraska (Figure 2c).
The storm’s environment was characterized by large instability and modest vertical wind shear. A special 19 UTC sounding from Omaha, Nebraska (KOAX) indicated 2889 J kg−1 of mixed-layer convective available potential energy (MLCAPE) and an effective inflow layer shear value of 21 kt (10.8 m s−1) in a vertical wind profile characterized by veering with height (Figure 2d). Around the time when the supercell was mature, a pool of >4000 J kg−1 MLCAPE was present ahead of the cold front with effective bulk shear of 30–40 kt (15.4–20.6 m s−1; not shown). This environment was consistent with known supercell environments, e.g., [37], though low-level shear was relatively weak compared to prior tornado environments, e.g., [38].
The supercell of interest initiated around 2117 UTC to the west of the advancing cold front. Its low-level reflectivity increased quickly in magnitude and the storm became more collocated with the surface cold front over time. By 2201 UTC the storm began to exhibit an echo appendage and low-level rotation. This rotation was maximized around 2220 UTC, though the appendage region through this time was generally dominated by strong flow toward the radar. A tornado report was received from the storm at 2210 UTC which was not later included in the Storm Events Database and has not been verified by the author. Several reports of severe hail were also received (1.75 in/4.45 cm at 2229 UTC, 1.00 in/2.54 cm at 2230 UTC, and 1.50 in/3.81 cm at 2236 UTC). These reports were within 2–2.5 km of the disdrometer deployment location, and at the disdrometer, hail was reported up to 1.00 in/2.54 cm in diameter by the disdrometer operator. The disdrometer operator also estimated a wind speed around 50 kts (25.7 m s−1) while the supercell was overhead. As a reminder, the supercell passed over the disdrometer from ~2226–2253 UTC when the storm was mature and just after the period of maximum low-level rotation.
3.2. Comparison of Disdrometer, Polarimetric Radar, and CN Datasets
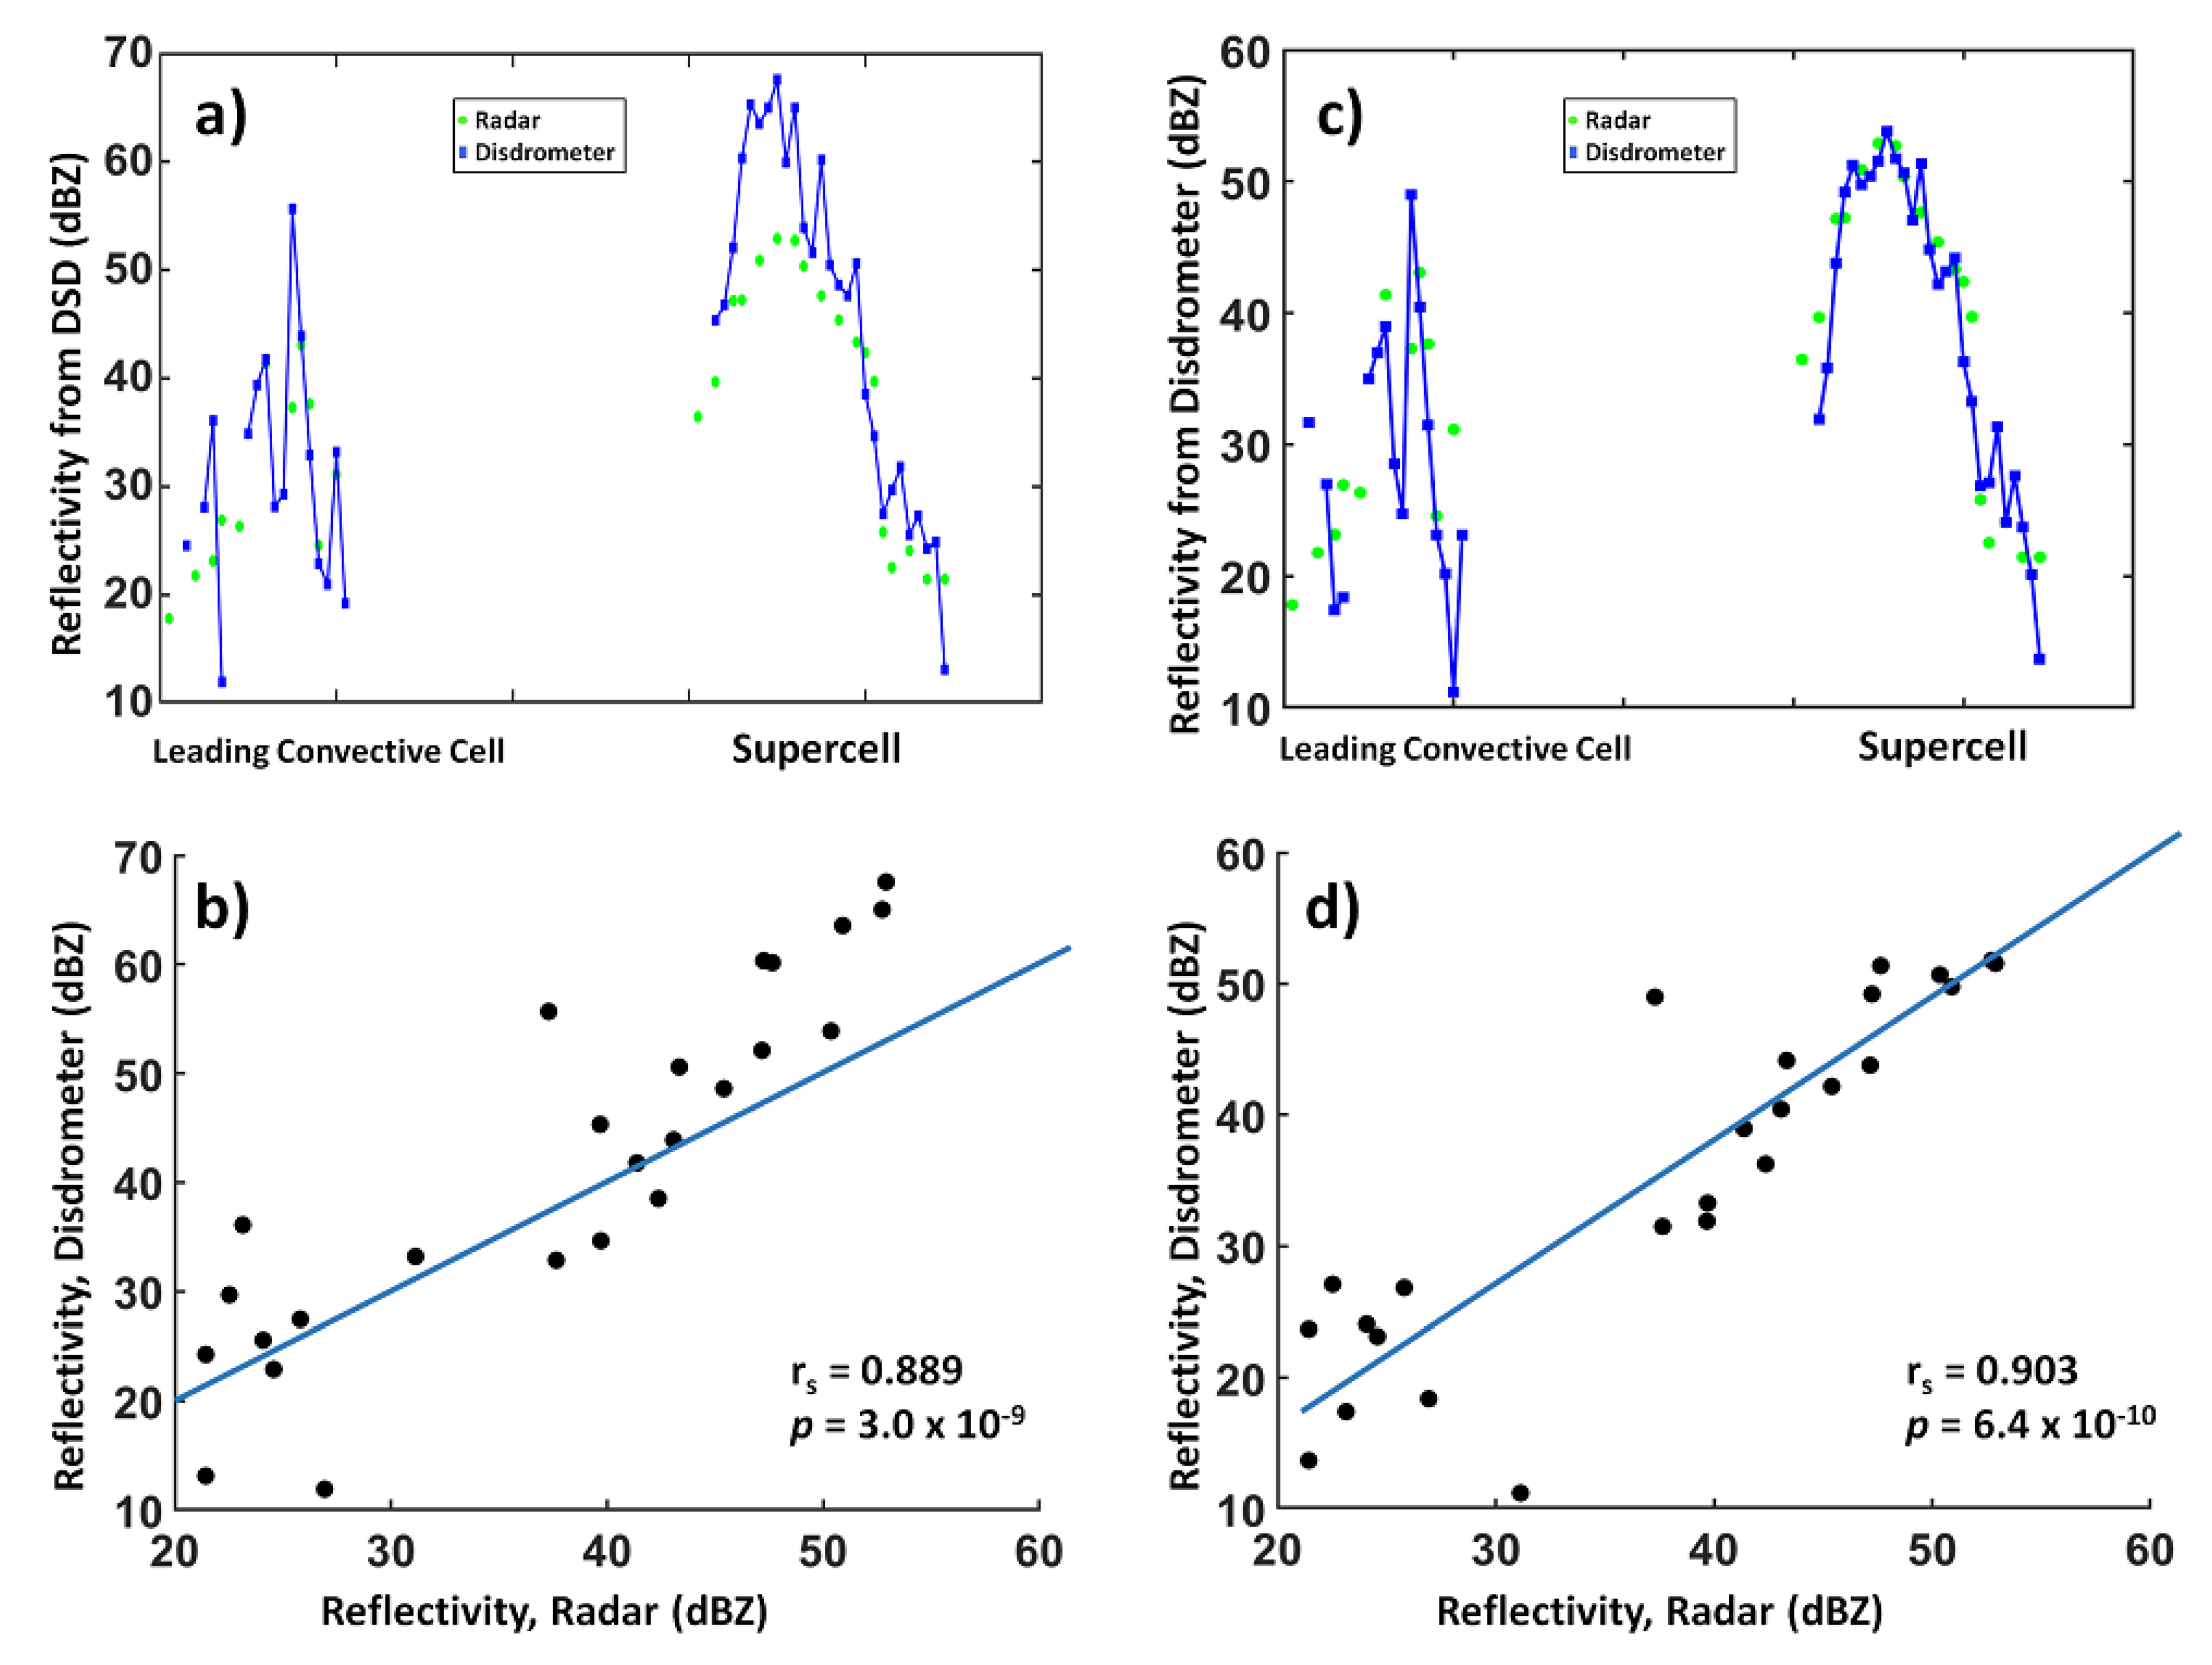
Reflectivity from KOAX was compared with a value calculated from the DSD measured by the PARSIVEL (Equation (6)) and with a value calculated directly by the PARSIVEL (Equation (8)), and both agreed relatively well on general trends. The magnitude of values was often incorrect when values were calculated using Equation (6) (Figure 3a,b), though the coefficient of determination (calculated using Spearman’s correlation) between the two time series was strong (rs2 = 0.790). Errors were generally largest when radar-estimated ZHH was <25 dBZ or >45 dBZ (Figure 3a,b), possibly related to low drop sampling rates in light precipitation and the presence of hail with high ZHH values. The best comparison with radar-estimated ZHH was obtained when the raw ZHH calculation from the PARSIVEL was used (Equation (8)). Though the coefficient of determination was only slightly higher (rs2 = 0.815), the magnitude of the difference between values was typically much smaller (Figure 3c,d). This comparison was variable, however, between the leading convective cell and the supercell. Whereas the coefficient of determination between the two ZHH series was 0.600 for the leading convective cell, it was 0.899 for the supercell. The much higher value in the supercell was unexpected since this cell contained a substantial quantity of melting hail. The observed better agreement using Equation (8) was expected since this equation does not make assumptions about the fall velocity and equivolume diameter of particles, which could change between the radar beam altitude and the surface.
Differential reflectivity estimated by KOAX was compared with ZDR calculated from the DSD using Equation (2) (Figure 4). This comparison was reasonably robust (rs2 = 0.225; Figure 4b), though the comparison between radar- and disdrometer-estimated ZDR was more robust for the supercell (rs = 0.684) than for the leading convective cell (rs = −0.086).
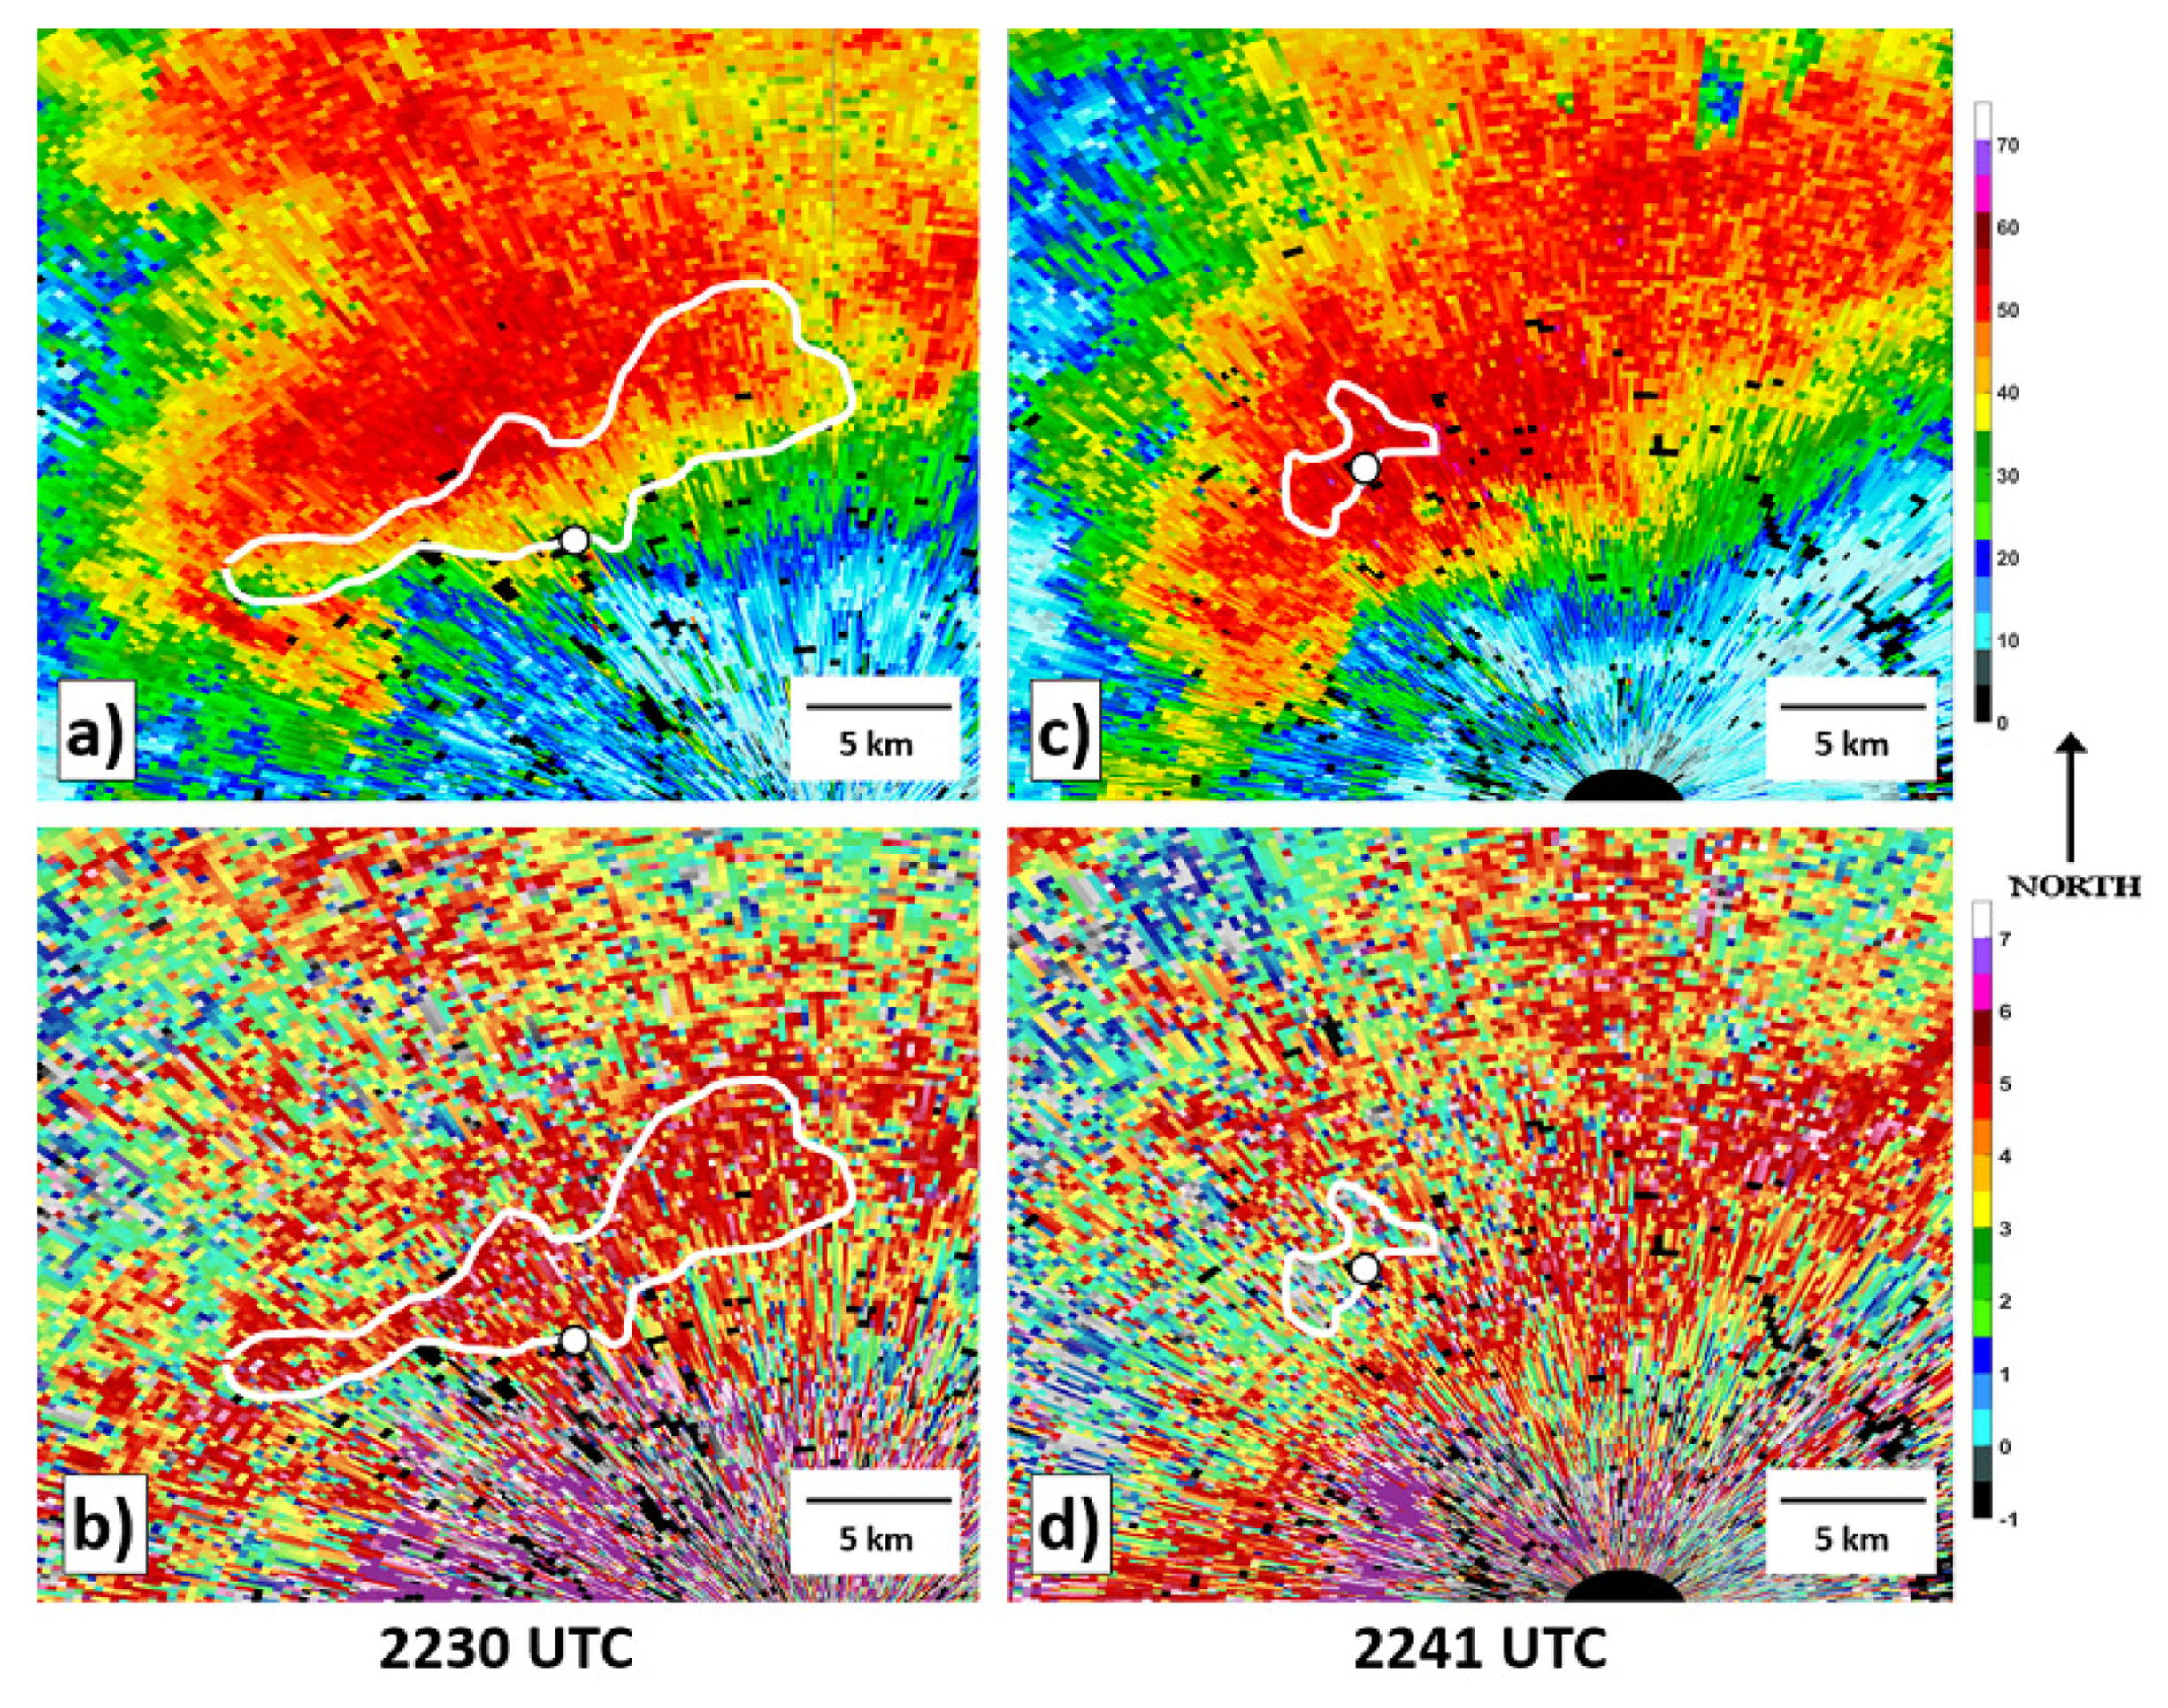
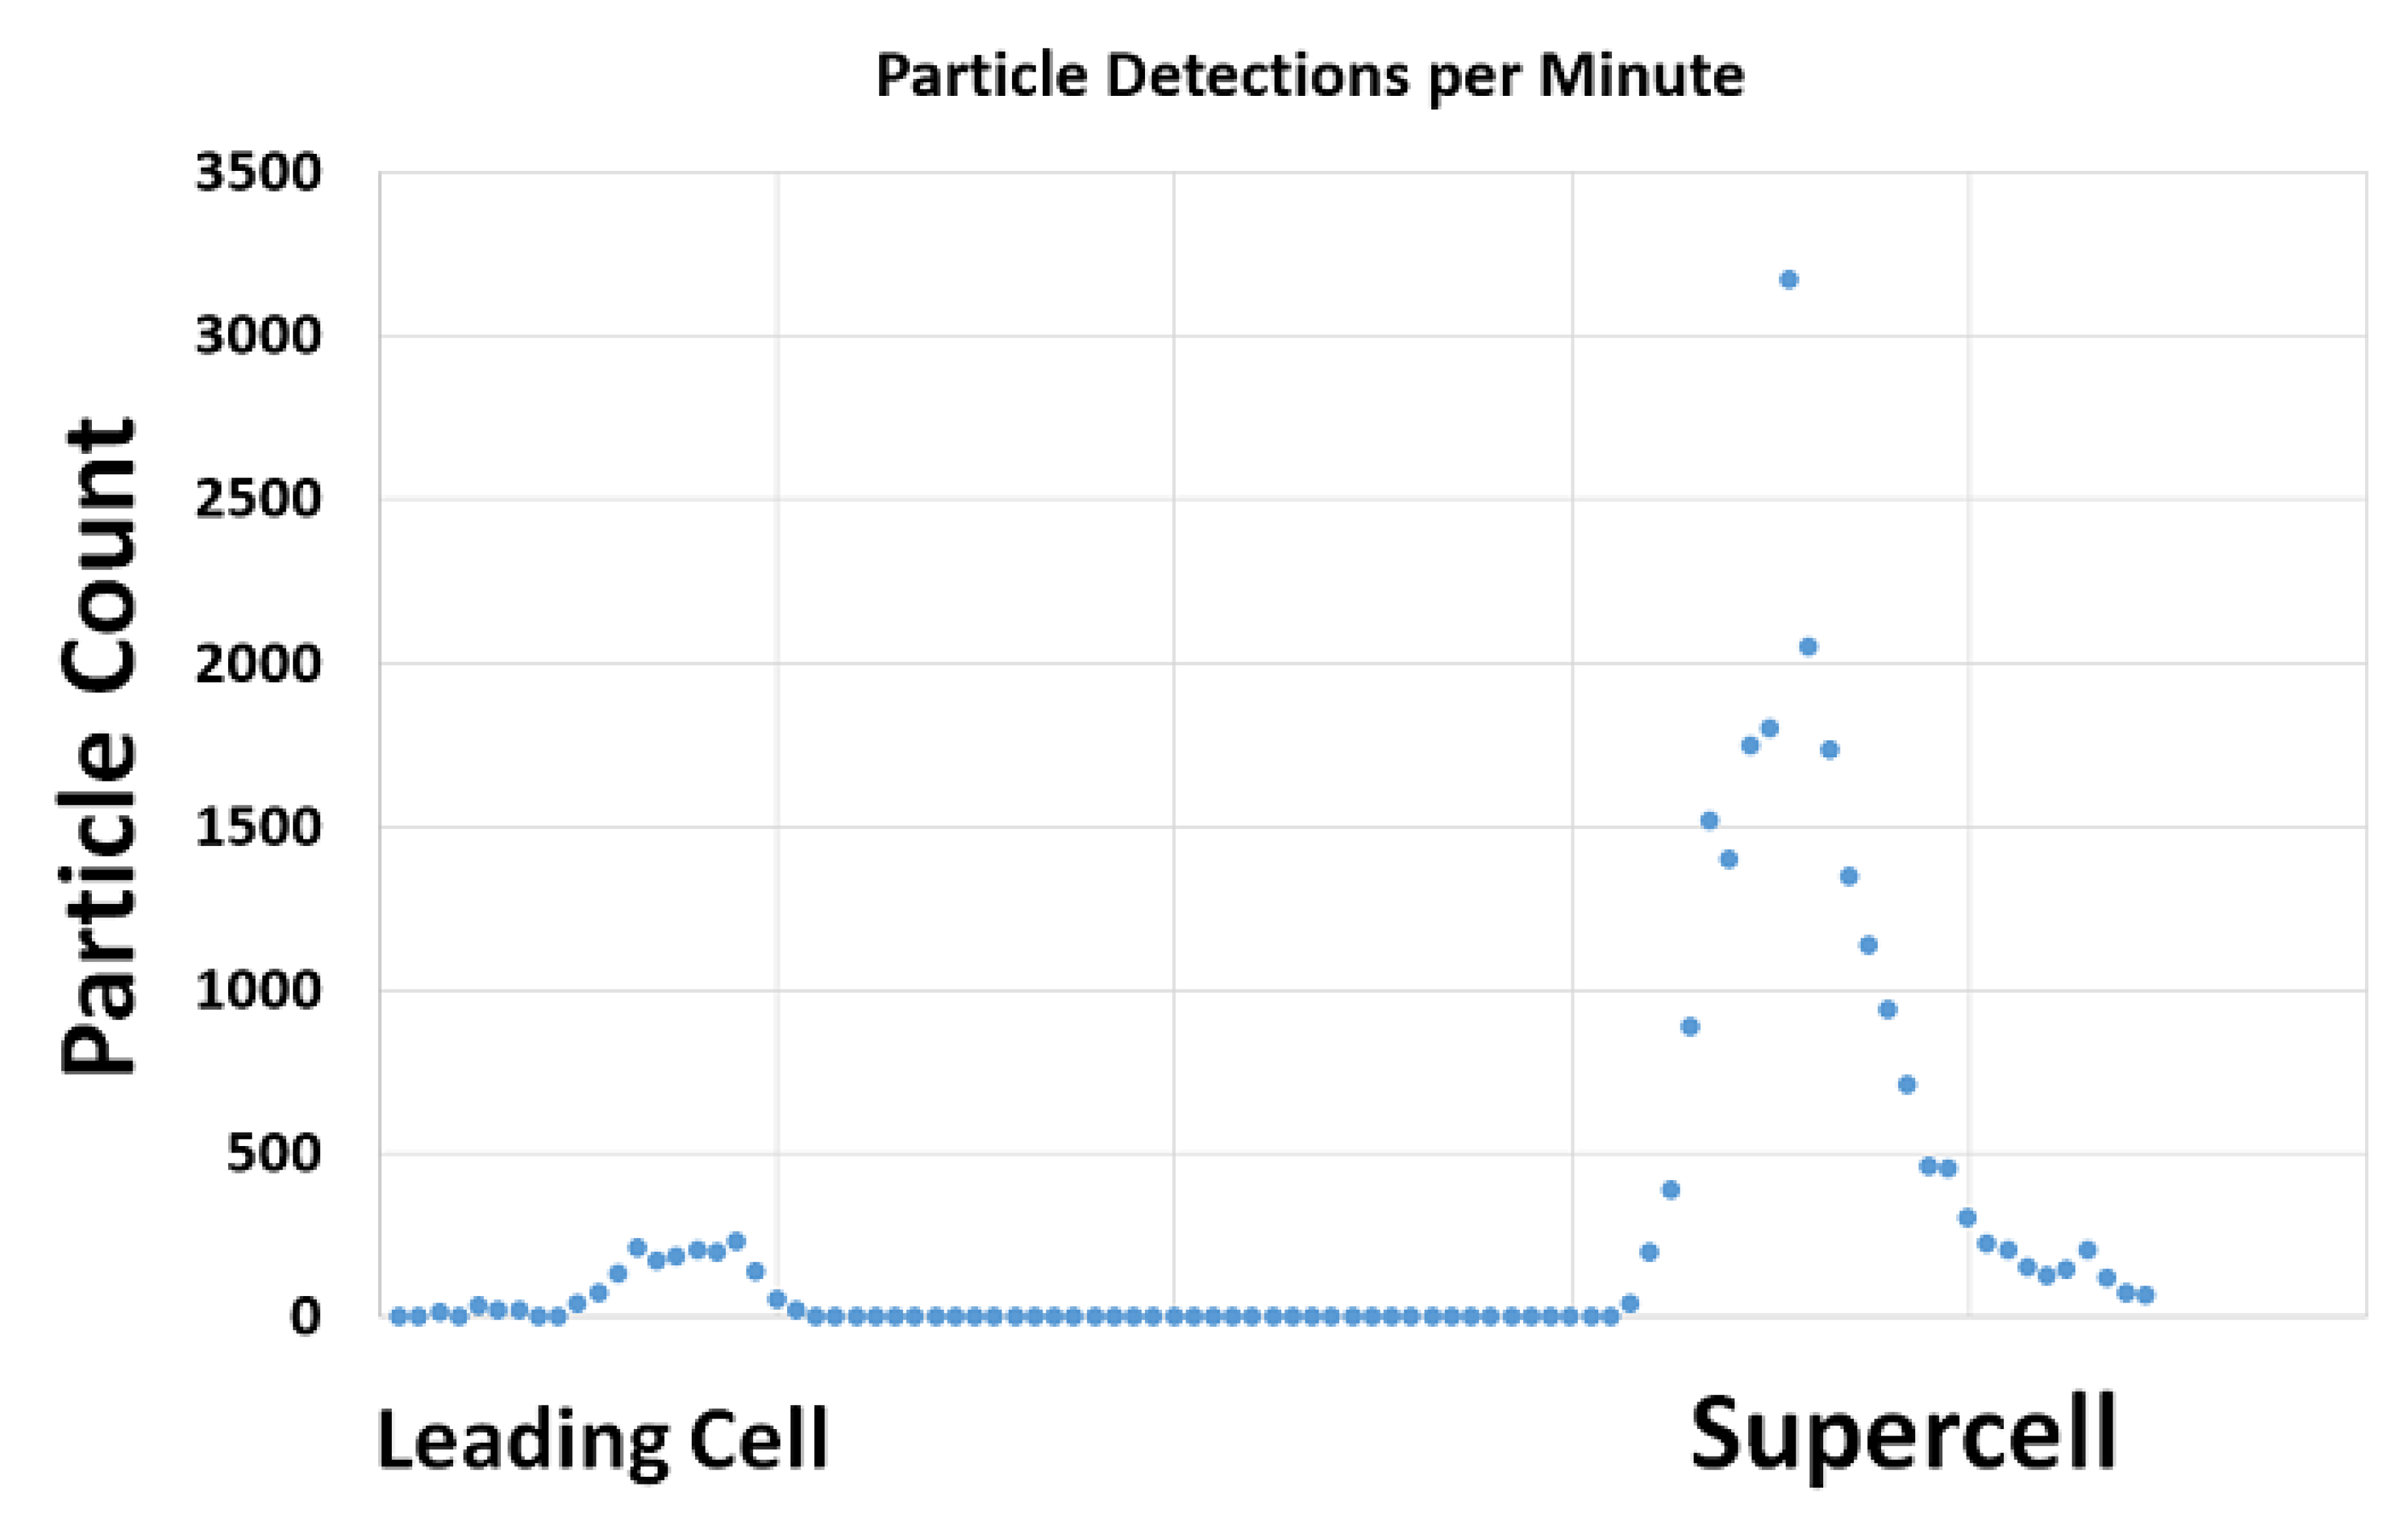
The ZDR distribution was also compared in the supercell’s ZDR arc region. The ZDR arc was classified as the continuous region along the supercell’s forward flank in which the ZDR value was relatively uniformly >3.5 dB (Figure 5a,b) [8,15]. According to this definition, the disdrometer deployment location was within the supercell’s ZDR arc from ~2228–2234 UTC. Large drops were likely present from 2235–2240 UTC (2 dB < ZDR < 3.5 dB) in the KDP foot region, while there was evidence for some hail at the altitude of the radar beam around 2241 UTC as lower ZDR values and high ZHH values passed overhead (Figure 5c,d). From ~2243 UTC to the end of the measurement period, lighter precipitation was present north of the supercell’s precipitation core. These distinct precipitation periods allow an assessment of disdrometer performance in regimes typically characterized by varying drop size distributions [13,39]. In the ZDR arc region, KOAX captured a band of higher ZDR values as expected (Figure 5b), though this feature was only weakly reflected in the disdrometer dataset (Figure 4a). This is likely because large drops are sparse in the ZDR arc [40] and may not have been adequately sampled by the disdrometer. Figure 6 provides evidence for small particle number concentration along the leading edge of the ZDR arc in agreement with prior studies. ZDR values in heavy rain within the supercell’s core were generally similar between both datasets. The magnitude of ZDR was also similar in light precipitation toward the end of the supercell dataset (Figure 4a).
Rain rate was calculated by the PARSIVEL from the DSD (Equation (9)), and this ground-truth estimate was compared with two other common methods of rain rate estimation using polarimetric radar data. The first estimates rain rate using KDP (Equation (11)). Disdrometer estimates of rain rate ranged up to ~25 mm h−1 in the leading convective cell to >80 mm h−1 in the supercell’s core (Figure 7a,b). Radar estimates of rain rate using KDP generally followed trends in the disdrometer-derived values (Figure 7a), though radar estimates tended to be higher in both storms (Figure 7b; Spearman’s r-squared = 0.175). Note that relatively few radar estimates are available because of the noisiness of KDP measurements in WSR-88D data, particularly in light precipitation [41]. This can be a strongly limiting factor when estimating rain rate using radar-derived KDP data. Radar-derived rain rate estimates using ZHH and ZDR, however, closely followed the disdrometer estimate (Figure 7c,d; Spearman’s r-squared = 0.701). Agreement between the two datasets is especially remarkable for the supercell, when disdrometer observations of rain rate > 60 mm h−1 are reasonably well-matched in the radar dataset (Figure 7c). Given the one-minute sampling of the disdrometer dataset and the challenges of ensuring exact overlap between the radar and disdrometer dataset samples (e.g., storm motion and precipitation drift from the radar sampling level to the surface), the highest rain rate on a very short temporal scale was likely not sampled by either instrument. The disdrometer dataset provides evidence that the maximum surface rain rate in the supercell core was ~85 mm h−1, which occurred at a time that was not sampled by the radar (Figure 7c). From this comparison, a rain rate estimate based on ZHH and ZDR appears to closely follow the “ground-truth” value, and thus this is the preferred method for rainfall estimation. Note that the correlation between radar and disdrometer rain rate estimates is likely unusually high in this case because the disdrometer was located close to the radar (e.g., sampling of the DSD was occurring at relatively similar altitudes without much potential for large changes to the DSD between the two measurements).
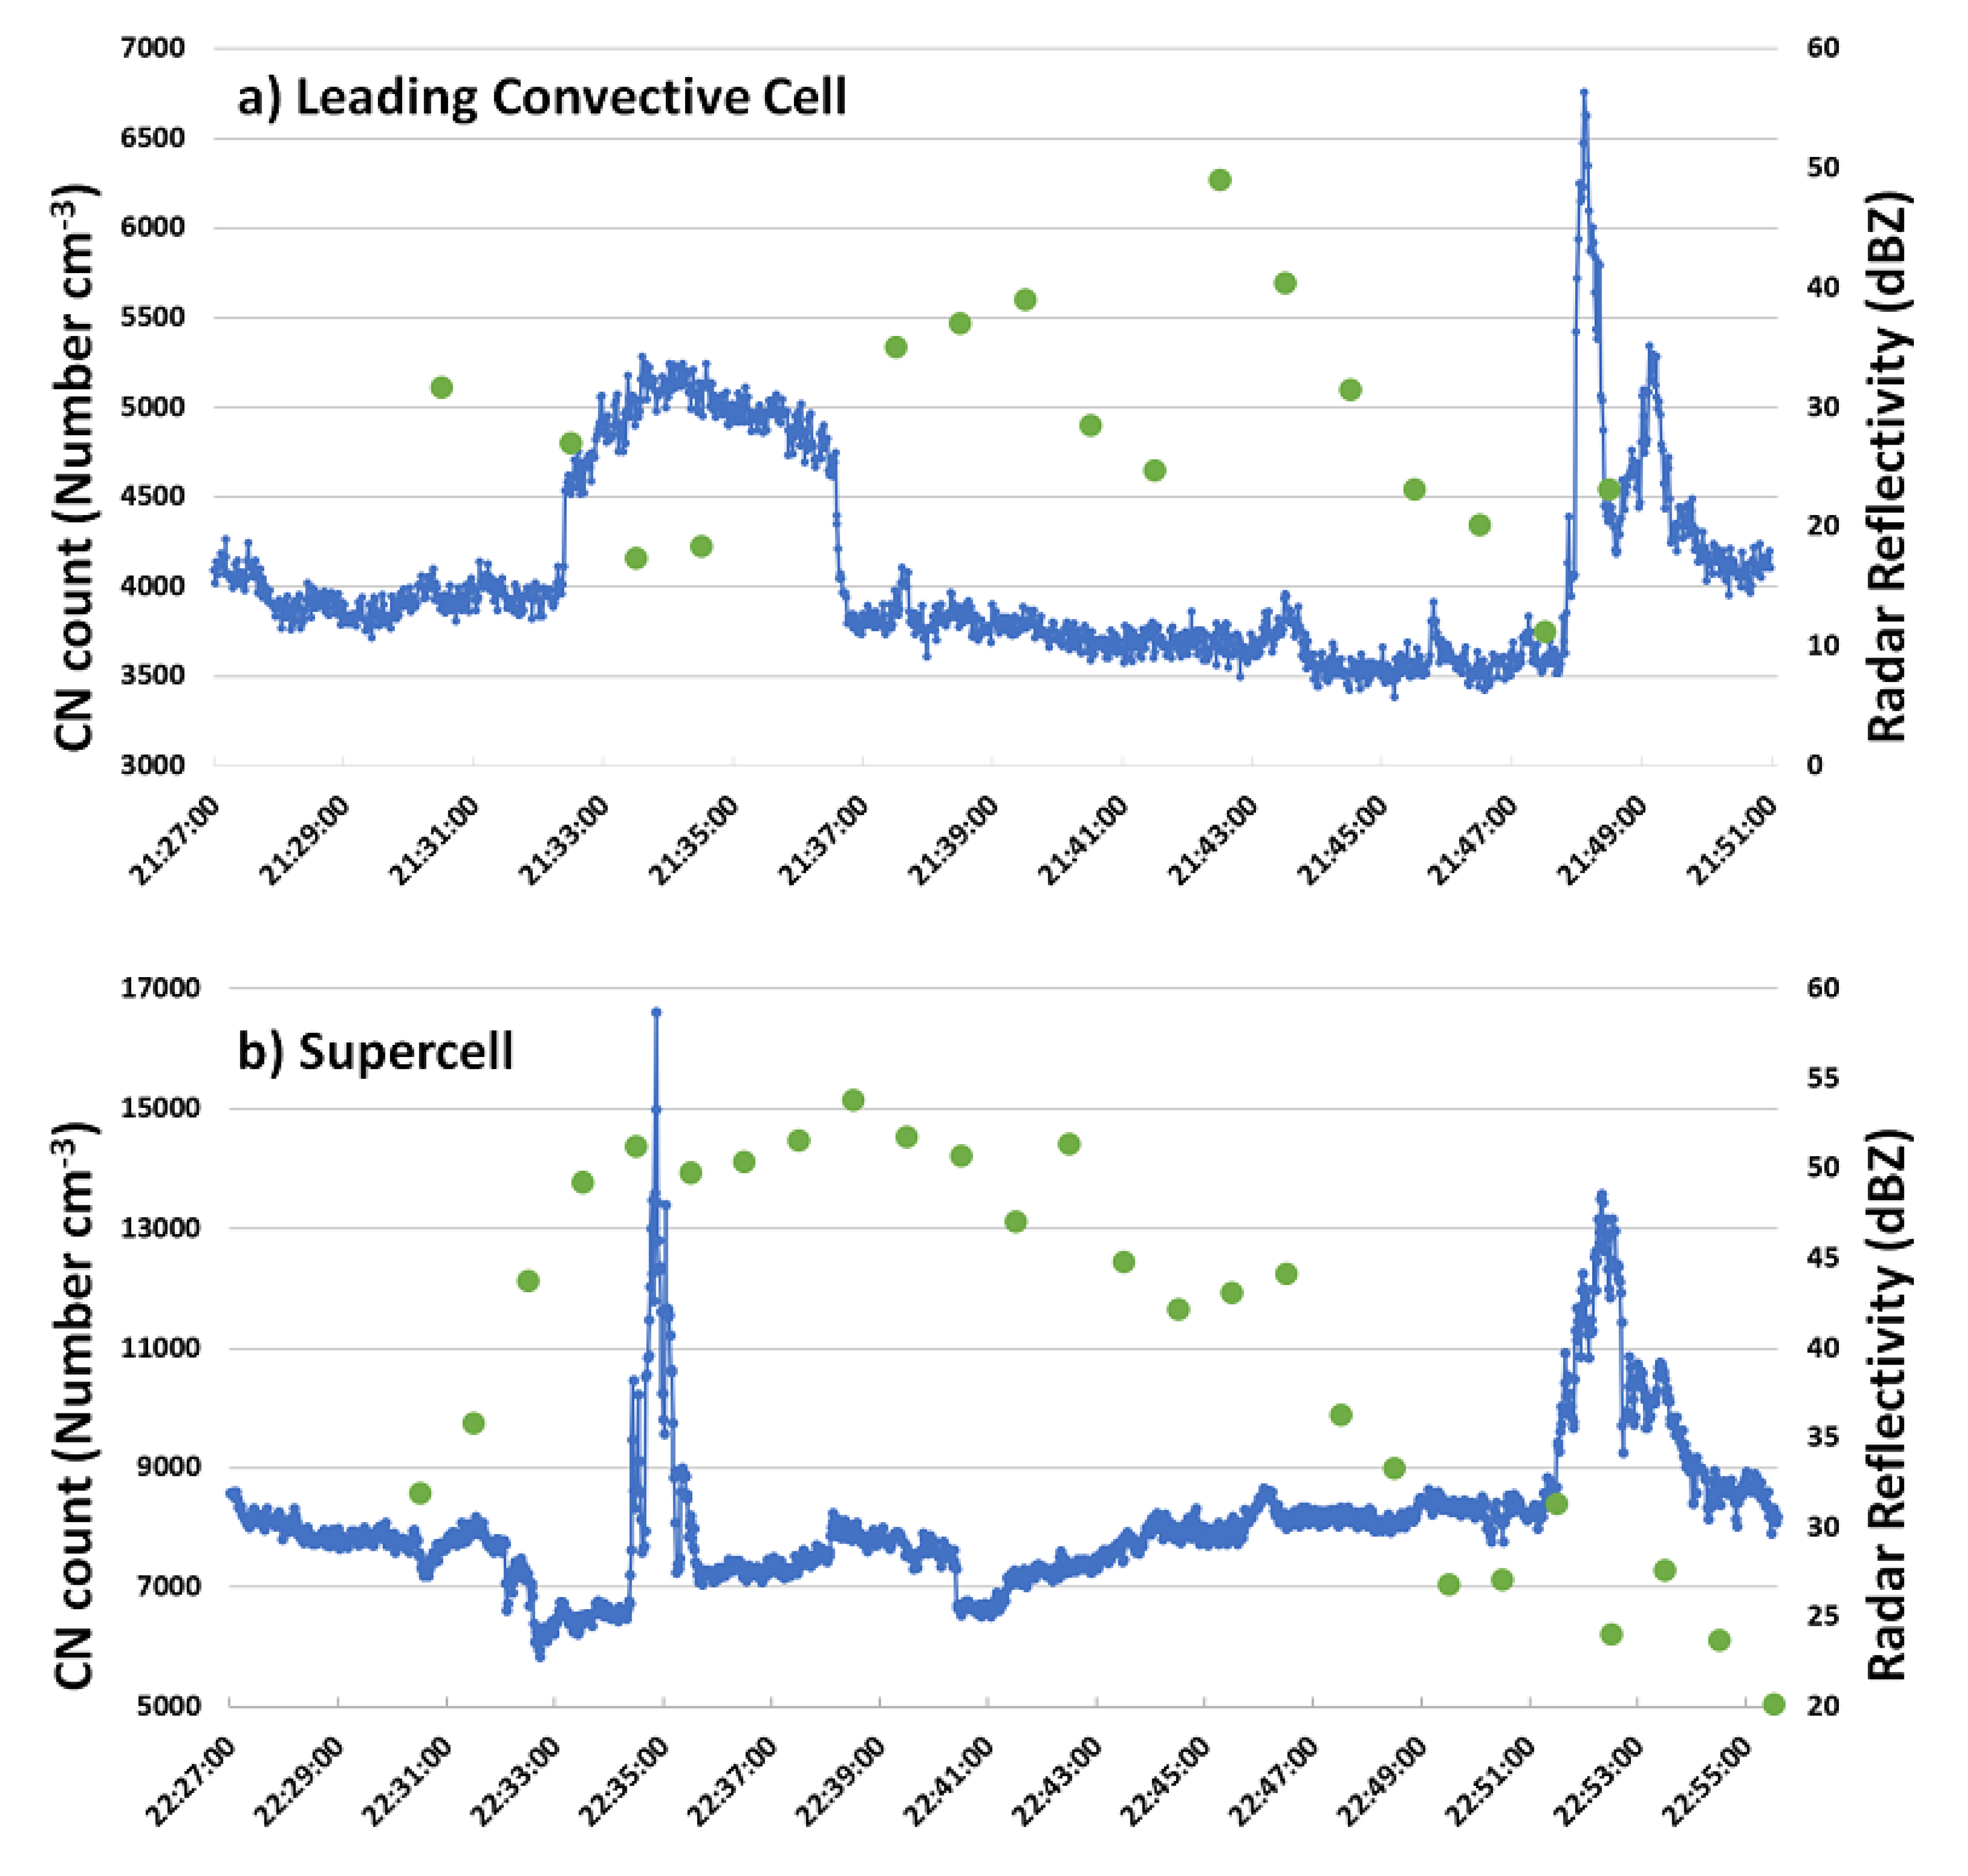
For the first time of which we are aware, CN observations are shown in comparison with collocated ZHH values calculated by the disdrometer. Notable changes occur as the two convective cells pass overhead, but the changes are not always related to precipitation intensity. Prior to arrival of the leading convective cell, CN concentration averaged ~4000 cm−3 (Figure 8a). Values did not change much in the first 2 min of precipitation but then increased to 4500–5000 cm−3 during a ~4-min lessening of precipitation intensity (Figure 8a). Once precipitation intensity increased again around 2138 UTC, CN concentration decreased to prior levels. It is unknown why there was a period of relatively high CN concentration during the leading convective cell. Wind associated with the convection may have lofted additional dust and precipitation may have been light enough during this time that CN concentration was not appreciably reduced. CN concentration then gradually decreased to ~3500 cm−3 as moderate to intense rainfall continued, possibly reflecting removal of particles from the air by liquid drops. A sharp increase in CN concentration was noted as precipitation was ending, followed by a return to the pre-convection baseline value of ~4000 cm−3 (Figure 8a). We speculate that this increase may have been related to convergence on the edge of the convective cell. High particle concentration has been noted previously along convective outflow boundaries [42,43].
The pre-supercell environmental CN concentration had increased to ~8000 cm−3 (Figure 8b). As precipitation began under the ZDR arc, where sparse but large drops were present, CN concentration briefly decreased to ~6000 cm−3. It is speculated that this brief decrease may have been caused by particle removal by rainfall. As heavy precipitation (ZHH > 45 dBZ) arrived at the instruments, however, there was a marked spike of CN concentration lasting ~90 s (Figure 8b). It is unclear whether this is representative or if there was interference by, e.g., a passing vehicle, since after the spike the CN concentration trend again seemed to follow the gradual increase noted prior to the spike. CN concentration during the supercell core and associated heavy precipitation was fairly stable around 8000 cm−3, comparable to the value prior to precipitation onset. As precipitation intensity decreased near the end of the event, a large and relatively long-lived peak was noted in CN concentration (Figure 8b). This peak lasted ~3 min, which seems less likely to have been an effect of environmental influence by an anthropogenic source. It is speculated that it may represent increased particle concentration in a convergence zone on the west side of the supercell, but this would need to be verified by additional observations, e.g., aerosol particle size and composition in addition to concentration.
4. Conclusions and Discussion
PARSIVEL disdrometer and CN data are presented for two storms in eastern Nebraska on 11 June 2018. One was a young convective cell and the other was a well-developed supercell storm, the ZDR arc and precipitation core/KDP foot of which passed over the location of the ground-based instrumentation. These datasets are compared with observations from a WSR-88D located only ~14.3 km from the ground-based observations, making these the closest observations of a supercell storm of which the author is aware for which PARSIVEL and WSR-88D data are comparable. Though the radar beam centerline is estimated to be only ~155 m above the surface, changes in the DSD between the altitude of the radar beam and the surface could lead to discrepancies between DSD parameters measured by the disdrometer and estimated by the radar. These are also the first storms of which the author is aware for which CN concentration and precipitation intensity are compared.
Reflectivity calculated by the disdrometer (Equation (8)) compared well with the radar-derived estimate (r2 = 0.815; Figure 3c,d). This similarity indicates relatively little change in the DSD between the altitude at which the radar measured precipitation and the surface, including relatively minimal change in the concentration of large drops, which strongly affects the ZHH value. Values were most comparable in regimes with high number concentration of drops and ZHH < 45 dBZ, indicating the importance of sampling enough drops with the disdrometer to lead to a representative estimate, and the importance of avoiding ice-phase particles. Agreement between the radar and disdrometer datasets was best for the supercell storm, possibly related to its larger drop concentration in the storm core. Radar estimates of ZDR compared reasonably well with the disdrometer estimates calculated using Equation (2). Within the ZDR arc region, the disdrometer did not strongly indicate a band of larger drops as indicated by the WSR-88D data, possibly a result of undersampling, though drop concentration was small as expected in this region. The ZDR comparison was generally best when many particles were present, for example, in the supercell core, likely because a more representative sample of the total DSD was obtained. Rain rate compared well between the disdrometer and radar datasets, especially when the radar-derived rain rate was estimated using ZHH and ZDR. Results indicate that a ZHH-ZDR method of estimating rain rate may be robust near the radar location across a range of precipitation regimes. Short-term changes in rain rate may not be captured well by either radar or disdrometer observations.
CN concentration in the leading convective cell was more closely related to precipitation intensity, with generally decreased CN concentration when rainfall was more intense. Increases in CN concentration on the edges of the convective cell may have been related to convergence along the storm’s outflow boundary. In association with the supercell, however, CN concentration changes were less clearly related to precipitation intensity. Large spikes in CN concentration occurred shortly after the ZDR arc passed overhead (which may have represented anthropogenic contamination) and as precipitation intensity was decreasing toward the end of the storm (which did not appear to be anthropogenic). CN concentration under the ZDR arc did not seem substantially different from that in the pre-storm environment, until heavier precipitation arrived and appeared to briefly reduce the CN concentration. The CN measurement location was well separated from any obvious source of anthropogenic particles (e.g., the nearest road with consistent traffic was ~0.4 km away), so it is unclear whether peaks in the data are genuine meteorological phenomena or if they represent brief times when the wind was favorable to bring larger particle concentration from a nearby source such as a road.
The microphysics sampled by the disdrometer appear to corroborate prior observations in the literature. One challenge, however, is the lack of ability to sample a large number of drops with the PARSIVEL given its relatively small sampling area. Thus, disdrometer-sampled DSDs are likely to match microphysical theories most closely where the number concentration of drops is large, e.g., in a region of moderate-ZHH precipitation without hail contamination. In the precipitation regimes sampled in this study, results were poorest in the ZDR arc region which is unique for its large but sparse drops. In areas with small drop number concentration, radars are likely to provide better estimates of microphysical processes, though disdrometer observations are likely to provide valuable insight in regions with unique microphysics and poor radar sampling (e.g., in terrain), or if airborne.
The work described in this paper could be extended to other precipitation regimes, possibly including winter weather situations, and a larger number of cases should be collected. With additional sampling and research on the value of disdrometer observations in particular precipitation regimes, disdrometer observations may be a valuable source of data to fill in radar fields, including polarimetric radar fields, at low levels. Such observations may have value, e.g., for hydrologic assessments. In the future, as mesoscale and storm-scale numerical modeling capabilities advance, there may also be value in ingesting such observations to help better represent low-level precipitation microphysics.
Funding
This research was funded by the National Science Foundation, grant numbers 1539070 and 1748012, and partially by the National Oceanic and Atmospheric Administration, grant number NA18OAR4590307.
Acknowledgments
Kun-Yuan Lee is acknowledged for collecting the disdrometer and CN datasets. Regan Kerkman is acknowledged for initial visualization and analysis of the disdrometer dataset. Five peer reviewers are acknowledged for contributions which strengthened the manuscript.
Conflicts of Interest
The author declares no conflict of interest. The funders had no role in the design of the study; in the collection, analyses, or interpretation of data; in the writing of the manuscript; or in the decision to publish the results.
References
- Duda, J.D.; Gallus, W.A. Spring and summer Midwestern severe weather reports in supercells compared to other morphologies. Weather Forecast. 2010, 25, 190–206. [Google Scholar] [CrossRef] [Green Version]
- Smith, B.T.; Thompson, R.L.; Grams, J.S.; Broyles, C.; Brooks, H.E. Convective modes for significant severe thunderstorms in the contiguous United States. Part I: Storm classification and climatology. Weather Forecast. 2012, 27, 1114–1135. [Google Scholar] [CrossRef] [Green Version]
- Friedrich, K.; Kalina, E.A.; Masters, F.J.; Lopez, C.R. Drop-size distributions in thunderstorms measured by optical disdrometers during VORTEX2. Mon. Weather Rev. 2013, 141, 1182–1203. [Google Scholar] [CrossRef]
- French, M.M.; Burgess, D.W.; Mansell, E.R.; Wicker, L.J. Bulk hook echo raindrop sizes retrieved using mobile, polarimetric Doppler radar observations. J. Appl. Meteorol. Clim. 2015, 54, 423–450. [Google Scholar] [CrossRef]
- Lerach, D.G.; Cotton, W.R. Comparing aerosol and low-level moisture influences on supercell tornadogenesis: Three-dimensional idealized simulations. J. Atmos. Sci. 2012, 69, 969–987. [Google Scholar] [CrossRef]
- Kalina, E.A.; Friedrich, K.; Morrison, H.; Bryan, G.H. Aerosol effects on idealized supercell thunderstorms in different environments. J. Atmos. Sci. 2014, 71, 4558–4580. [Google Scholar] [CrossRef]
- Kumjian, M.R. Principles and applications of dual-polarization weather radar. Part II: Warm- and cold-season applications. J. Oper. Meteorol. 2013, 1, 243–264. [Google Scholar] [CrossRef]
- Kumjian, M.R.; Ryzhkov, A.V. Polarimetric signatures in supercell thunderstorms. J. Appl. Meteorol. Clim. 2008, 47, 1940–1961. [Google Scholar] [CrossRef]
- Romine, G.S.; Burgess, D.W.; Wilhelmson, R.B. A dual-polarization-radar-based assessment of the 8 May 2003 Oklahoma City area tornadic supercell. Mon. Weather Rev. 2008, 136, 2849–2870. [Google Scholar] [CrossRef]
- Van Den Broeke, M.S.; Straka, J.M.; Rasmussen, E.N. Polarimetric radar observations at low levels during tornado life cycles in a small sample of classic Southern Plains supercells. J. Appl. Meteorol. Clim. 2008, 47, 1232–1247. [Google Scholar] [CrossRef] [Green Version]
- Kumjian, M.R.; Ryzhkov, A.V.; Melnikov, V.M.; Schuur, T.J. Rapid-scan super-resolution observations of a cyclic supercell with a dual-polarization WSR-88D. Mon. Weather Rev. 2010, 138, 3762–3786. [Google Scholar] [CrossRef]
- Kumjian, M.R.; Ryzhkov, A.V. Storm-relative helicity revealed from polarimetric radar measurements. J. Atmos. Sci. 2009, 66, 667–685. [Google Scholar] [CrossRef] [Green Version]
- Dawson, D.T.; Mansell, E.R.; Jung, Y.; Wicker, L.J.; Kumjian, M.R.; Xue, M. Low-level ZDR signatures in supercell forward flanks: The role of size sorting and melting of hail. J. Atmos. Sci. 2014, 71, 276–299. [Google Scholar] [CrossRef]
- Palmer, R.D.; Bodine, D.; Kumjian, M.; Cheong, B.; Zhang, G.; Cao, Q.; Bluestein, H.B.; Ryzhkov, A.; Yu, T.; Wang, Y. Observations of the 10 May 2010 tornado outbreak using OU-PRIME: Potential for new science with high-resolution polarimetric radar. Bull. Am. Meteorol. Soc. 2011, 92, 871–891. [Google Scholar] [CrossRef] [Green Version]
- Van Den Broeke, M.S. Polarimetric variability of classic supercell storms as a function of environment. J. Appl. Meteorol. Clim. 2016, 55, 1907–1925. [Google Scholar] [CrossRef]
- Crowe, C.; Schultz, C.; Kumjian, M.; Carey, L.; Petersen, W. Use of dual-polarization signatures in diagnosing tornadic potential. Elec. J. Oper. Meteorol. 2012, 13, 57–78. [Google Scholar]
- Van Den Broeke, M.S. Polarimetric radar metrics related to tornado life cycles and intensity in supercell storms. Mon. Weather Rev. 2017, 145, 3671–3686. [Google Scholar] [CrossRef]
- Ward, A.; Kumjian, M.; Bunkers, M.J.; Bieda III, S.W.; Simpson, R.J. Using polarimetric radar to identify potentially hazardous hail accumulations. In Proceedings of the 34th Conference on Environmental Information Processing Technologies, Austin, TX, USA, 7–11 January 2018. [Google Scholar]
- Ogden, F.L.; Sharif, H.O.; Senarath, S.U.S.; Smith, J.A.; Baeck, M.L.; Richardson, J.R. Hydrologic analysis of the Fort Collins, Colorado, flash flood of 1997. J. Hydrol. 2000, 228, 82–100. [Google Scholar] [CrossRef]
- Schuur, T.J.; Ryzhkov, A.V.; Zrnić, D.S.; Schönhuber, M. Drop size distributions measured by a 2D video disdrometer: Comparison with dual-polarization radar data. J. Appl. Meteorol. Clim. 2001, 40, 1019–1034. [Google Scholar] [CrossRef]
- Bringi, V.; Thurai, M.; Baumgardner, D. Raindrop fall velocities from an optical array probe and 2-D video disdrometer. Atmos. Meas. Tech. 2018, 11, 1377–1384. [Google Scholar] [CrossRef] [Green Version]
- Carey, L.D.; Petersen, W.A.; Thurai, M.; Anderson, M.E.; Schultz, E.V.; Schultz, C.J.; Knupp, K.K. Precipitation properties of a cool-season tornadic storm inferred from C-band dual-polarimetric radar and 2D-video disdrometer observations. In Proceedings of the 25th Conference Severe Local Storms, Denver, CO, USA, 11–14 October 2010. [Google Scholar]
- Thurai, M.; Gatlin, P.; Bringi, V.N.; Carey, L. Very large rain drops from 2D video disdrometers and concomitant polarimetric radar observations. In Proceedings of the 8th European Conference on Radar in Meteorology and Hydrology, Garmisch-Partenkirchen, Germany, 1–5 September 2014. [Google Scholar]
- Waugh, S.M.; Ziegler, C.L.; MacGorman, D.R. In situ microphysical observations of the 29-30 May 2012 Kingfisher, OK, supercell with a balloon-borne video disdrometer. J. Geophys. Res. Atmos. 2018, 123, 5618–5640. [Google Scholar] [CrossRef]
- Friedrich, K.; Higgins, S.; Masters, F.J.; Lopez, C.R. Articulating and stationary PARSIVEL disdrometer measurements in conditions with strong winds and heavy rainfall. J. Atmos. Ocean. Technol. 2013, 30, 2063–2080. [Google Scholar] [CrossRef]
- Kalina, E.A.; Friedrich, K.; Ellis, S.; Burgess, D. Comparison of disdrometer and X-band mobile radar observations in convective precipitation. Mon. Weather Rev. 2014, 142, 2414–2435. [Google Scholar] [CrossRef] [Green Version]
- Office of the Federal Coordinator for Meteorological Services and Supporting Research (OFCM). Federal Meteorological Handbook No. 11: WSR-88D Meteorological Observations. Part A: System Concepts, Responsiblities, and Procedures. 2012; FCM-H11A-2016; 25p. Available online: https://www.ofcm.gov/publications/fmh/FMH11/2016FMH11PTA.pdf (accessed on 2 June 2020).
- Kumjian, M.R. Principles and applications of dual-polarization weather radar. Part I: Description of the polarimetric radar variables. J. Oper. Meteorol. 2013, 1, 226–242. [Google Scholar] [CrossRef]
- Picca, J.; Ryzhkov, A. A dual-wavelength polarimetric analysis of the 16 May 2010 Oklahoma City extreme hailstorm. Mon. Weather Rev. 2012, 140, 1385–1403. [Google Scholar] [CrossRef] [Green Version]
- Van Den Broeke, M.S. A preliminary polarimetric radar comparison of pretornadic and nontornadic supercell storms. Mon. Weather Rev. 2020, 148, 1567–1584. [Google Scholar] [CrossRef]
- Andsager, K.; Beard, K.V.; Laird, N.F. Laboratory measurements of axis ratios for large raindrops. J. Atmos. Sci. 1999, 56, 2673–2683. [Google Scholar] [CrossRef]
- Jameson, A.R. Microphysical interpretation of multi-parameter radar measurements in rain. Part I: Interpretation of polarization measurements and estimation of raindrop shapes. J. Atmos. Sci. 1983, 40, 1792–1802. [Google Scholar] [CrossRef] [Green Version]
- Battaglia, A.; Rustemeier, E.; Tokay, A.; Blahak, U.; Simmer, C. PARSIVEL snow observations: A critical assessment. J. Atmos. Ocean. Technol. 2010, 27, 333–344. [Google Scholar] [CrossRef]
- Giangrande, S.E.; Ryzhkov, A.V. Estimation of rainfall based on the results of polarimetric echo classification. J. Appl. Meteorol. Clim. 2008, 47, 2445–2462. [Google Scholar] [CrossRef]
- Bringi, V.N.; Tolstoy, L.; Thurai, M.; Petersen, W.A. Estimation of spatial correlation of drop size distribution parameters and rain rate using NASA’s S-band polarimetric radar and 2D video disdrometer network: Two case studies from MC3E. J. Hydrometeorol. 2015, 16, 1207–1221. [Google Scholar] [CrossRef] [Green Version]
- Mordas, G.; Manninen, H.E.; Petäjä, T.; Aalto, P.P.; Hämeri, K.; Kulmala, M. On operation of the ultra-fine water-based CPC TSI 3786 and comparison with other TSI models (TSI 3776, TSI 3772, TSI 3025, TSI 3010, TSI 3007). Aerosol Sci. Technol. 2008, 42, 152–158. [Google Scholar] [CrossRef]
- King, A.T.; Kennedy, A.D. North American supercell environments in atmospheric reanalyses and RUC-2. J. Appl. Meteorol. Clim. 2019, 58, 71–92. [Google Scholar] [CrossRef]
- Thompson, R.L.; Mead, C.M.; Edwards, R. Effective storm-relative helicity and bulk shear in supercell thunderstorm environments. Weather Forecast. 2007, 22, 102–115. [Google Scholar] [CrossRef]
- Kumjian, M.R.; Lebo, Z.J.; Morrison, H.C. On the mechanisms of rain formation in an idealized supercell storm. Mon. Weather Rev. 2015, 143, 2754–2773. [Google Scholar] [CrossRef] [Green Version]
- Kumjian, M.R.; Ryzhkov, A.V. The impact of size sorting on the polarimetric radar variables. J. Atmos. Sci. 2012, 69, 2042–2060. [Google Scholar] [CrossRef]
- Ryzhkov, A.V.; Giangrande, S.E.; Melnikov, V.M.; Schuur, T.J. Calibration issues of dual-polarization radar measurements. J. Atmos. Ocean. Technol. 2005, 22, 1138–1155. [Google Scholar] [CrossRef] [Green Version]
- Seigel, R.B.; van den Heever, S.C. Dust lofting and ingestion by supercell storms. J. Atmos. Sci. 2012, 69, 1453–1473. [Google Scholar] [CrossRef] [Green Version]
- Van Den Broeke, M.S.; Alsarraf, H. Polarimetric radar observations of dust storms at C- and S-band. J. Oper. Meteorol. 2016, 4, 123–131. [Google Scholar] [CrossRef]
Figure 1.
Template used to quality control the disdrometer dataset. Each cell represents one possible combination of drop diameter (left axis; mm) and fall velocity (top axis; m s−1) reported by the PARSIVEL. White cells indicate unrealistic values which are removed if reported. Dark blue and tan cells indicate erroneous data which are also removed if reported. Particles assigned to combinations represented by sky-blue cells are classified as graupel and by red cells as hail. Particles within light green cells are classified as rain in this study and by Friedrich et al. [25], while particles in dark green cells are classified as rain in this study, but not by Friedrich et al. [25].

Figure 2.
Environmental data representative of the 11 June 2018 supercell. (a) 300 hPa observations from 00 UTC 12 June 2018; (b) 700 hPa observations from 00 UTC 12 June 2018; (c) surface station observations from 21 UTC on 11 June 2018 (all temperature values are in °C and data locations around the station plot are standard); and (d) sounding from KOAX taken at 19 UTC 11 June 2018 in the unstable environment east of the advancing cold front. Purple star in eastern Nebraska (panels a and b) indicate approximate radar/disdrometer site. In panel (c), the purple star is the disdrometer location and the orange star is KOAX location. Panels (a), (b), and (d) courtesy of the Storm Prediction Center; panel (c) courtesy of Plymouth State University.


Figure 3.
Reflectivity (ZHH) comparisons between radar and disdrometer datasets. (a) and (b) contain radar estimates of ZHH compared to values calculated from the disdrometer dataset using Equation (6), while (c) and (d) are a comparison between radar estimates of ZHH and raw disdrometer ZHH estimates (Equation (8)). Green dots and blue rectangles in (a) and (c), respectively, are radar and disdrometer estimates, and blue lines are broken when no precipitation was recorded by the disdrometer. In (b) and (d), the blue 1:1 line indicates where points would fall given exact correspondence between ZHH estimates. Spearman’s correlation (rs) is indicated along with its p-value.

Figure 4.
As in Figure 3, except for a differential reflectivity (ZDR) comparison between radar and disdrometer datasets. Blue line in (a) is broken when no precipitation was recorded by the disdrometer. In (b), black dots are from the leading convective cell and green dots are from the supercell. Spearman’s correlation (rs) is indicated along with its p-value for all points.

Figure 5.
(a,b) show base-scan radar features of the supercell storm at 2230 UTC. (a) is ZHH (dBZ) and (b) is ZDR (dB). White outline indicates the approximate boundary of the ZDR arc region. (c,d) show similar data at 2241 UTC. In these panels, the white outline is the approximate region within which polarimetrically-inferred hail is occurring. In all panels, the white dot is the location of the ground-based instrumentation.

Figure 6.
Total number of precipitation particles detected per minute by the disdrometer after quality control was applied.
Figure 6.
Total number of precipitation particles detected per minute by the disdrometer after quality control was applied.

Figure 7.
As in Figure 3, except for rain rate comparisons between radar and disdrometer datasets. (a,b) contain disdrometer measurements of rain rate compared with values estimated from the radar dataset using Equation (11), while (c,d) are a comparison between disdrometer measurements of rain rate and a radar-estimated value using Equation (10). Spearman’s correlation (rs) is indicated along with its p-value.

Figure 8.
CN concentration (blue line) and disdrometer-calculated radar reflectivity (green dots) for (a) the leading convective cell and (b) the supercell.
Figure 8.
CN concentration (blue line) and disdrometer-calculated radar reflectivity (green dots) for (a) the leading convective cell and (b) the supercell.

© 2020 by the author. Licensee MDPI, Basel, Switzerland. This article is an open access article distributed under the terms and conditions of the Creative Commons Attribution (CC BY) license (http://creativecommons.org/licenses/by/4.0/).
Share and Cite
MDPI and ACS Style
Van Den Broeke, M. Disdrometer, Polarimetric Radar, and Condensation Nuclei Observations of Supercell and Multicell Storms on 11 June 2018 in Eastern Nebraska. Atmosphere 2020, 11, 770. https://doi.org/10.3390/atmos11070770
AMA Style
Van Den Broeke M. Disdrometer, Polarimetric Radar, and Condensation Nuclei Observations of Supercell and Multicell Storms on 11 June 2018 in Eastern Nebraska. Atmosphere. 2020; 11(7):770. https://doi.org/10.3390/atmos11070770
Chicago/Turabian StyleVan Den Broeke, Matthew. 2020. "Disdrometer, Polarimetric Radar, and Condensation Nuclei Observations of Supercell and Multicell Storms on 11 June 2018 in Eastern Nebraska" Atmosphere 11, no. 7: 770. https://doi.org/10.3390/atmos11070770
Note that from the first issue of 2016, this journal uses article numbers instead of page numbers. See further details here.