Emission of Methyl Ethyl Ketone and 2-Butanol Converted from Methyl Vinyl Ketone in Plant Leaves

Department of Environmental Sciences, School of Food and Nutritional Sciences, University of Shizuoka, 52-1, Yada, Suruga-ku, Shizuoka 422-8526, Japan
*
Author to whom correspondence should be addressed.
Atmosphere 2020, 11(8), 793; https://doi.org/10.3390/atmos11080793
Submission received: 3 July 2020
/
Revised: 21 July 2020
/
Accepted: 23 July 2020
/
Published: 27 July 2020
(This article belongs to the Special Issue Emissions, Transport and Fate of Pollutants in the Atmosphere)
Abstract
:Methacrolein (MACR) and methyl vinyl ketone (MVK) are key intermediate compounds in isoprene-initiated reactions, and they cause the formation of secondary organic aerosols and photochemical ozone. The importance of higher plants as a sink of these compounds and as a source of volatiles converted from these compounds was addressed in the present study. We exposed four non-isoprene-emitting plant species to MACR and MVK at concentrations of several to several hundred ppb, measured their uptake rates, and analyzed the volatiles converted from MACR and MVK by these plants. We used a flow-through chamber method to determine the exchange rates. Both MACR and MVK were absorbed by all plants via stomata. Two metabolites, methyl ethyl ketone (MEK) and 2-butanol, were detected when MVK was fumigated. The conversion ratio was 26–39% for MEK and 33–44% for all volatiles. Combined with the results of two previous relevant reports, our results suggest that MEK conversion from MVK normally occurs in a wide range of plant species, but the conversion ratio may depend on plant type, i.e., if plant species are isoprene-emitting or non-emitting, as well as on the fumigation concentrations. This finding also emphasizes the importance of bilateral exchange measurements of these compounds at lower concentrations close to ambient levels.
1. Introduction
Volatile organic compounds (VOC) and NOx are involved in the formation of photochemical ozone and degradation of air quality in urban and sub-urban areas [1]. VOC reactions also cause the formation of secondary organic aerosol (SOA), which affects human health and climate [2]. SOA absorbs and scatters shortwave radiation and affects cloud properties by acting as cloud condensation nuclei (CCN) or ice nuclei [2]. VOCs are degraded in the atmosphere by a number of reactions with OH, ozone, NO3, and HO2 [3]. These oxidized products undergo gas-particle conversion processes such as nucleation, condensation, and heterogeneous and multiphase chemical reactions. The formation and growth of SOA depends on the original oxidized products. By mass balance calculation, Goldstein and Galbally [4] estimated that 510–910 Tg C yr−1 of SOA was formed from globally emitted VOCs, with an annual emission of 1300 Tg C yr−1.
Isoprene is a biogenic VOC (b.p. = 34 °C) which is most abundantly emitted into the atmosphere, and it is mainly produced by many broad-leaved and several coniferous trees as a secondary metabolite. Several models have estimated that the annual global emission of isoprene is 459–601 Tg C [5], which is higher than the annual emission estimates of anthropogenic VOCs.
As isoprene is very reactive with OH radicals in the atmosphere [6], it is easily oxidized into methacrolein (MACR), methyl vinyl ketone (MVK), glycolaldehyde, and other compounds [3]. Further reactions of these compounds can lead to the formation of SOA and ozone. Even if the SOA yield from isoprene is ~1%, the large global source strength of isoprene may significantly contribute to the formation of SOA [3]. In the formation of SOA and photochemical ozone originating from isoprene, MACR and MVK are the key intermediate compounds because of their high yields from isoprene-initiated reactions [7].
MVK and MACR are bilaterally exchanged between plants and the atmosphere [8]. These compounds were detected in emissions from vegetation [9], suggesting that they are not only produced by atmospheric oxidation of isoprene but also formed in leaves by isoprene reaction under oxidative stress. The compensation point of these compounds within leaves might vary depending on their atmospheric concentrations and the degree of oxidative stress imposed on plants [10].
MACR and MVK are absorbed by trees via stomata [11]. Within the tree canopy, leaf uptake is an important and significant sink of MACR and MVK, in addition to losses by chemical reactions with OH radicals and ozone [11]. At ppb to several tens of ppb levels, the uptake rates of ketones and aldehydes, including MACR and MVK, increase linearly with the increase in stomatal conductance when light intensity is increased [11,12,13], suggesting that this uptake is controlled by stomatal opening. The total uptake of aldehydes and ketones by houseplants was found to be 30–100 times higher than the amount partitioned into leaf water [12], suggesting that VOCs are metabolized in these plants. Muramoto et al. [14] estimated that MACR is metabolized in tissues to produce glutathione conjugates and highly volatile compounds, including isobutyl aldehyde, isobutyl alcohol, and methallyl alcohol when tomato plants were fumigated to MACR at ppm level.
Cappellin et al. [15] recently reported that exogenous MVK was reduced in the leaves of an isoprene-emitting tree (Quercus rubra) to produce methyl ethyl ketone (MEK) or 3-buten-2-ol. These compounds are emitted from leaves to the atmosphere, which is interesting because after acetone, MEK is the second most abundant ketone in the atmosphere [16,17] and it is highly reactive with OH radicals [18]. Although the fumigation concentration of MVK applied by Cappellin et al. [15] was too high to represent natural conditions (~300 ppbv), metabolic conversions might occur even at ambient concentrations of these compounds. In this case, MVK might be a significant source of atmospheric MEK. However, there are no available data on other plant species, and it is unclear if these conversions occur in leaves of a wide range of plant species. The concentration-dependency of the conversions needs to be addressed to evaluate the importance of these conversions in the lower troposphere.
In the present study, we exposed four non-isoprene-emitting plant species to MACR and MVK, measured the uptake rates of these compounds by plants, and analyzed the volatile compounds converted from MACR and MVK. We investigated the concentration-dependency of the conversions within the MVK concentration range from several ppb to several hundred ppb. We indicated that the conversion ratios from MVK to MEK and to 2-butanol, as well as the conversion ratio from MEK to 2-butanol, were not largely different among the plant species and almost constant among the fumigation concentrations, but they were lower than those reported on an isoprene-emitting tree species.
2. Experiments
2.1. Plant Materials
The four plant species used in the present study included two evergreen broad-leaved tree species (Quercus myrsinifolia and Osmanthus fragrans var. aurantiacus), one deciduous broad-leaved tree species (Quercus acutissima), and one houseplant species (Spathiphyllum clevelandii). These tree species are widely planted in urban areas in Japan [19] and in some countries in East Asia [20]. The houseplant is also one of the most popular ones, meaning that they are ubiquitous. Q. myrsinifolia and Q. acutissima have been reported to be non-isoprene-emitting trees [21]. In a preliminary experiment, we measured the emissions from Osmanthus fragrans var. aurantiacus and S. clevelandii, and we confirmed that they were also non-isoprene-emitting plants. Five three-year-old saplings of each tree species and five adult house plants were obtained from local nurseries in Toyohashi city, Aichi Prefecture, and from Shizuoka City, Shizuoka Prefecture, Japan. The saplings were potted in pots with 18 L of soil composed of 30% leaf mold, 30% Kanuma soil, 20% andosol, and 20% sharp sand. The plants were used in experiments at least six months after potting. The tree height of the three tree species was 60–80 cm, and the plant height of the houseplants was ~50 cm.
2.2. VOC Exposure Experiments
The VOC exposure and measurement system used in this study is shown in Figure S1. This system has been described in detail in our previous studies [11,22] and therefore, it is only briefly described here.
By using a gas diffusion device and dilution lines, several ppb of target VOC were produced. Compounds used in the series of experiments were isoprene oxidation products MACR and MVK. MEK was also used to determine whether it is converted to other compounds emitted to the atmosphere. The chemical characteristics of these compounds are shown in Table S1. An aliquot of the standard liquid (~10 μL, purity > 98%) was injected into a glass tube (1.5 or 2 mm diameter and 10 cm length) and installed into the permeator (PD-1B-2, GASTEC, Japan). Clean air purified by platinum catalysis heated to 400 °C was sent to the permeator at the rate of 1 L min−1, and the inside temperature of the permeator was maintained at 30 ± 0.1 °C. Ten to 20 mL min−1 of the outflowing air from the permeator was mixed with purified air stream (2 L min−1) in order to produce several tens of ppbv of the target VOC, and the rest was vented outside. As the liquid level in the diffusion tube decreased with time, VOC concentration gradually decreased, at most by 15% after 24 h.
We used two fumigation bags: a sample bag and a blank bag. They were transparent, fluorinated ethylene-propylene copolymer (FEP) bags (20–40 L volume each). A live branch of trees or a leaf of a houseplant with a total projected leaf area of approximately 100–200 cm2 was enclosed in the sample bag. The blank bag was empty, without plant leaves. The VOC air was sent to the two bags at a flow rate of 1 L min−1. The outflowing air was sent to a proton-transfer-reaction time-of-flight mass spectrometer (PTR-TOF-MS) (PTR-TOF 1000, Ionicon GmbH, Innsbruck, Austria) to measure the concentration of the target VOC. We also measured the carbon dioxide and water vapor concentrations in the sample and blank bags with an infrared gas analyzer (LI820, Li-Cor, USA), and we calculated the net photosynthetic rate and transpiration rate of the enclosed leaves. Two three-port solenoid valves were set to automatically and synchronously change the gas flow every 15 min in opposite directions (i.e., when the air from the blank bag was monitored with PTR-TOF-MS, the air from the sample bag was sent to the infrared gas analyzer).
The protonated molecular ion m/z 71 was monitored for MACR and MVK concentrations, and m/z 73 was monitored for MEK concentration. Ions originating from impurities of standard liquids had molecular weights different from those of the target VOC compounds, and therefore did not interfere with the PTR-TOF-MS measurement of the target VOC compounds.
Plants were illuminated with a 400 W metal halide lamp (D400, Toshiba LiTec, Japan). The photosynthetic photon flux density (PPFD) was measured with a quantum sensor (LI190, Li-Cor, USA) and varied by adjusting the distance between the lamp and the leaves to be within a range of 80–800 μmol m−2·s−1. Leaf temperature in the bag was measured with Teflon-coated T-type fine-wire thermocouples, and it ranged from 24 to 28 °C during the fumigation experiments. VOC uptake measurements were repeated for three different pots for each plant species. In order to investigate the relationship between VOC uptake and plant physiological parameters (such as stomatal conductance), PPFD was varied using light-shading sheets in one of the three measurements for each plant species.
Additional measurements were conducted to investigate the concentration-dependency of MVK conversion ratio to MEK by S. clevelandii leaves. The concentration of the fumigated MVK was increased in four steps from zero to several hundred ppbv by changing the dilution ratio. MEK conversion to 2-butanol was also monitored with PTR-TOF-MS and a gas chromatograph mass spectrometer (GC-MS) when MEK was fumigated to S. clevelandii leaves at a concentration of ~8 ppbv. The conversion ratio was determined using the GC-MS analytical data.
2.3. PTR-TOF-MS
The ratio of electric field strength (E) to buffer gas number density (N) in the drift tube of the PTR-TOF-MS was held at ~140 Td by maintaining the drift tube voltage, temperature, and pressure at 600 V, 80 °C, and 2.2 mbar, respectively. The apparent VOC concentration was calculated using the ion signals obtained from PTR-TOF-MS and the drift tube pressure and temperature. We monitored mass 37 (H3O+H2O) throughout the experiment to calculate the water vapor concentration in both bags [22]. If the water vapor concentration in the sample bag is close to a saturated one, water vapor may condense onto the inner surface of the sample bag and tubes, and the fumigated VOCs may dissolve in the condensed water. However, in this fumigation experiment, the concentration was kept much lower than saturation, preventing water vapor from condensing. The H3O+H2O ion was also used to correct the apparent concentrations of target VOCs for humidity [23], as it affects the sensitivity of PTR-TOF-MS and fragment patterns of fragile compounds [24]. We finally determined VOC concentrations using the ratio of VOC concentration determined by GC-MS to the apparent concentration measured with PTR-TOF-MS. The corrected concentrations of MVK, MACR, and MEK during the fumigation experiments were 1.4–400 ppbv, 10 ppbv, and 8 ppbv, respectively.
2.4. GC-MS Analysis
Emissions from the plants were also identified and quantified by GC-MS (QP5050A, Shimadzu, Japan). The air inside the two bags was individually collected into adsorbent tubes containing 200 mg of Tenax-TA and 100 mg of Carbotrap at least 24 h after the start of fumigation experiments. The air was drawn at a flow rate of 200 mL min−1 for 10 min, using a sampling pump (MP-∑30NII, Shibata, Japan). Triplicate gas sampling was conducted to check the variation in the determined concentrations. The samples collected in the adsorbents underwent a two-stage thermal desorption (TurboMatrix 650ATD, Perkin-Elmer, Japan), and compound separation was achieved using an SPB-5 capillary column (60 m × 0.25 mm, 1 µm film thickness, Supelco, USA). The GC-MS analytical procedures and parameters were described in detail in Mochizuki et al. [25]. The detection limit (S/N = 3) of the GC-MS system was 0.03–0.04 pmol.
2.5. Determination of Uptake and Emission Rates of VOCs
The calculation of the VOC uptake rate A (mol m−2·s−1) by the exposed leaves was described previously by Tani et al. [22], and therefore, only a brief description is given here. A was determined by mass balance in the enclosure bag and calculated using the following equation:
where LA is the leaf area (m2), and Massb and Masss are VOC efflux from the blank bag and the sample bag, respectively, per second (mol s−1). Massb and Masss were determined using the following equations:
where Vb and Vs are the flow rates of the air flowing out from the blank bag and the sample bag, respectively (mol s−1), and Cb and Cs are the VOC concentrations in the blank bag and the sample bag, respectively (mol mol−1). The concentrations were corrected for humidity when the concentrations were determined with PTR-TOF-MS. When the VOC concentration determined with GC-MS was used for these calculations, it did not require humidity correction. Vs was calculated considering the water vapor increase as follows:
where Wb and Ws are water vapor concentrations in the blank bag and the sample bag, respectively (mol mol−1), measured with the infra-red gas analyzer. Stomatal conductance gs, leaf boundary layer conductance gb, and intercellular VOC concentration Ci were determined following the calculation procedure for CO2 described in Appendix 2 in Caemmerer and Farquhar [26].
A × LA = Mass − Masss
Massb = Vb × Cb
Masss = Vs × Cs
Vs = Vb(1 − Wb)/(1 − Ws)
2.6. Statistical Analysis
The statistical significance of the conversion ratio between plant species, compounds, and their interactions was analyzed using analysis of variance (ANOVA) with the Excel Statistics 2008 program for Windows (SSRI, Japan). When a significant difference was observed in the ANOVA tests, the Tukey–Kramer multiple range test was applied to identify the significant differences between plant species.
3. Results
3.1. MVK and MACR Uptake by Plants
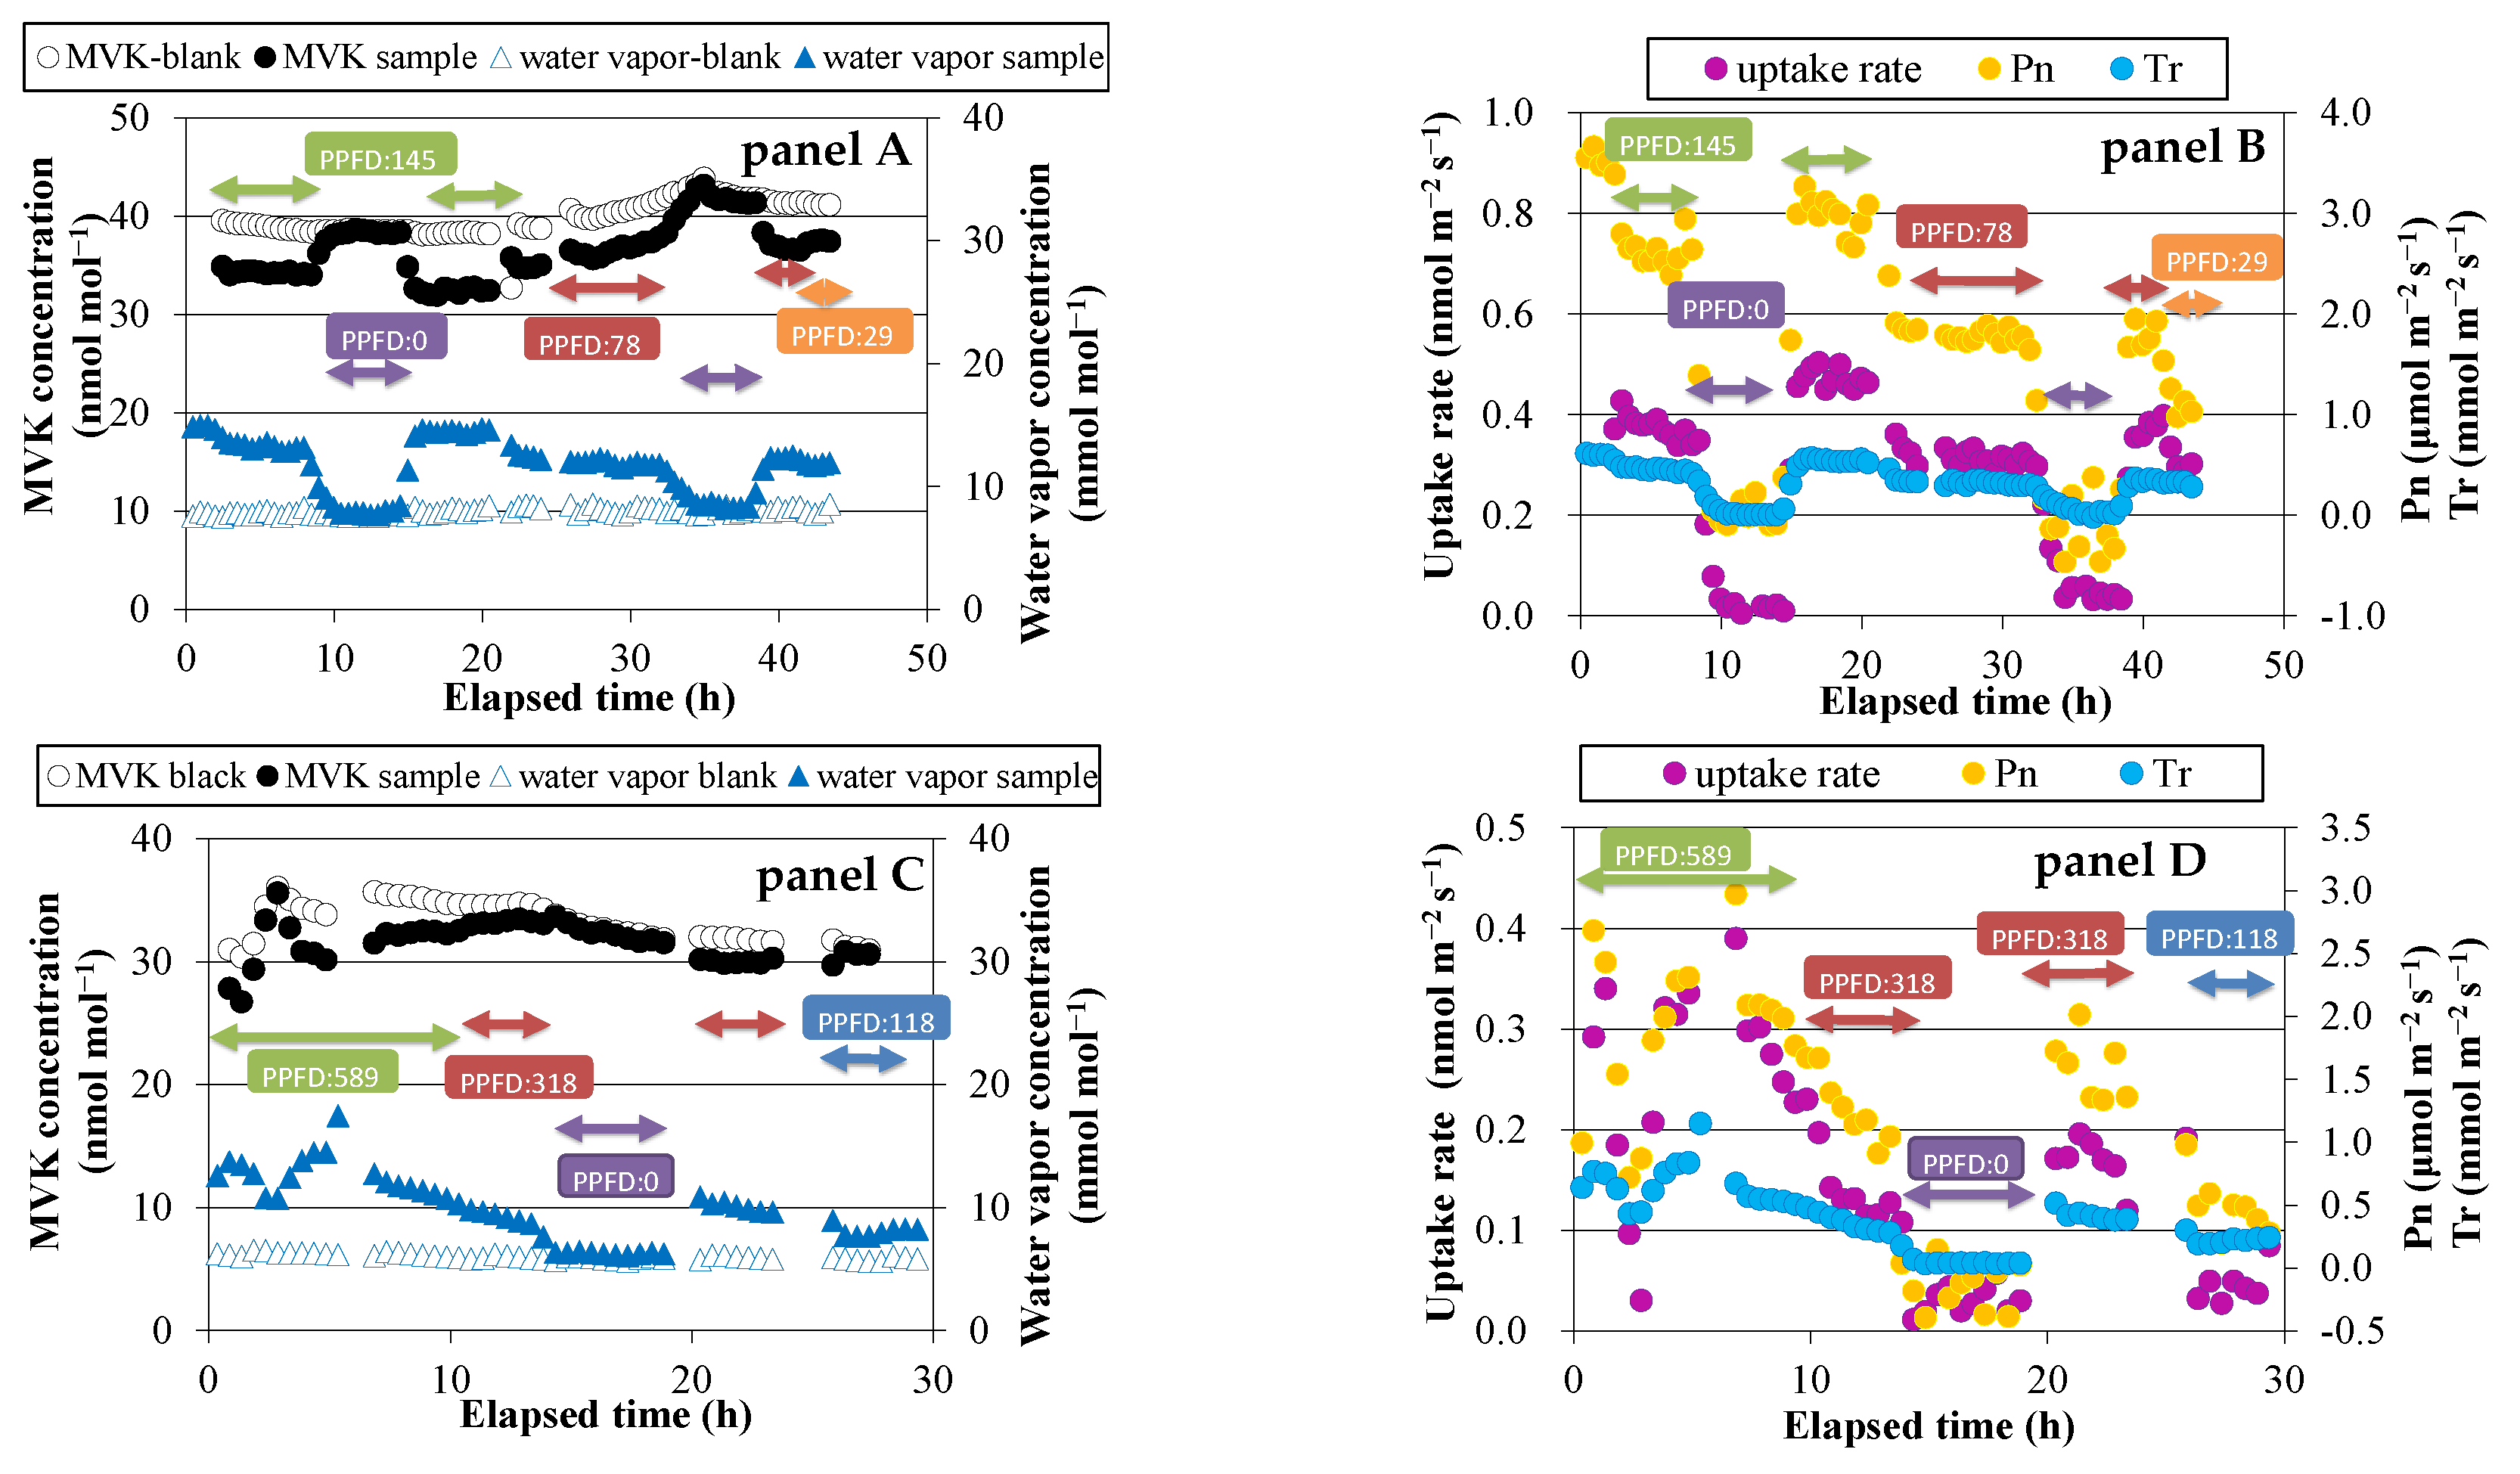
Before exposing the plants to either MVK or MACR, blank measurements were conducted for the two empty enclosure bags. The average concentrations of MVK and MACR for 15 min were not significantly different between the bags. The difference was <0.1 ppbv, and therefore it was not considered in the fumigation experiments. During the light periods of the fumigation experiment, a lower concentration of MVK was observed in the sample bag than in the blank bag (Figure 1, panel A,C). During the dark period, the concentration difference was small (<0.3 ppbv). On the other hand, water vapor concentration was higher in the sample bag than in the blank bag, because of transpiration through stomata. The concentration differences of MVK and water vapor between the two bags suggest that MVK is mostly absorbed through stomata. The same trends were observed in case of MACR fumigation (Figure 1, panel E), indicating that MACR is also absorbed through stomata.
Daytime changes in the uptake rate of MVK or MACR, net photosynthetic rate (Pn), and transpiration rate (Tr) were similar to each other (Figure 1, panel B,D,F). These values were likely to be higher at higher PPFD. During dark periods, the calculated uptake rate was very low (<0.03 nmol m−2·s−1 in most cases), and Pn had negative values because of dark respiration.
3.2. MEK and 2-butanol Emissions in Fumigation Experiments
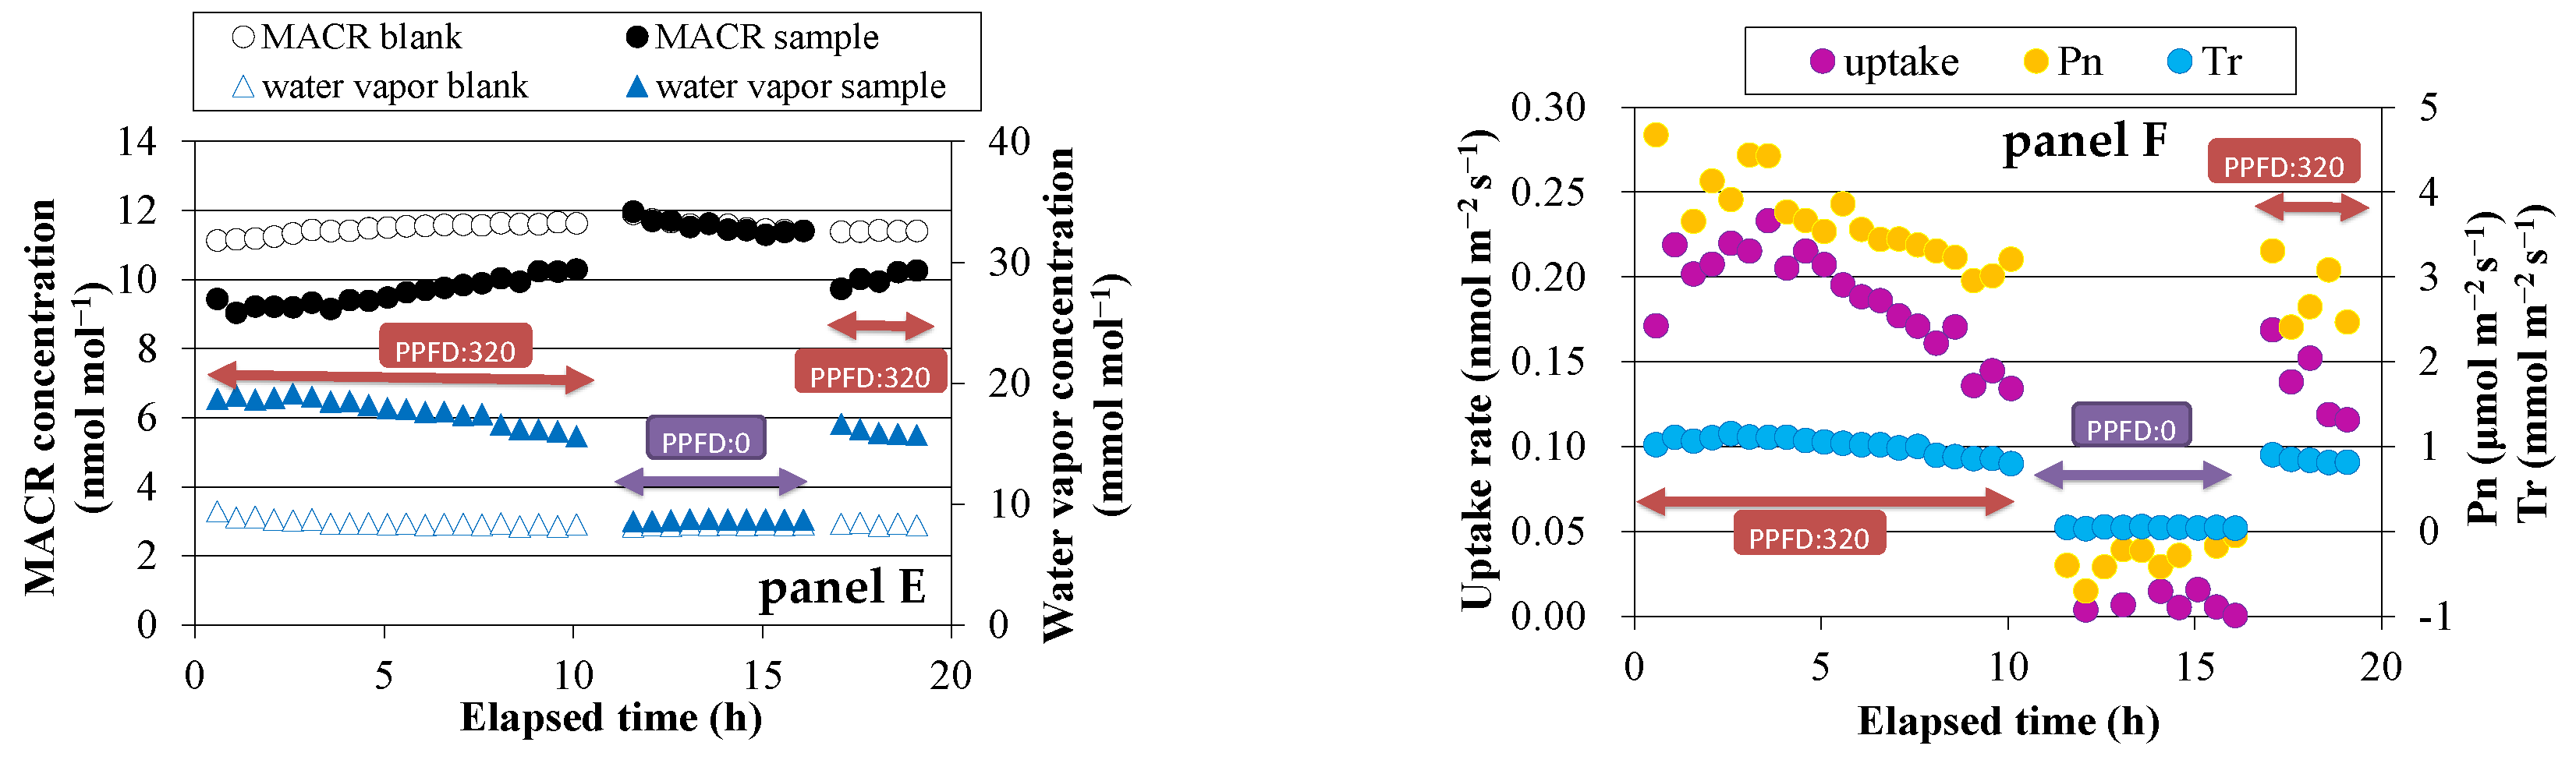
During the MVK fumigation experiments, an ion of m/z 73 was detected in the sample bag. GC-MS analysis of the air collected from the sample bag revealed that MEK was emitted from all plant species. The MVK uptake rate and MEK emission rate changed similarly with time (Figure 2, panel A,C), and good correlations were observed between these two factors (Figure 2, panel B,D). The slopes of the regression lines indicated the conversion ratio of MVK to MEK, and the average value for each plant species was not largely different, ranging from 26% for S. clevelandii to 39% for Q. myrsinifolia (Table 1). A small peak of 2-butanol was also detected in GC-MS chromatograms obtained for S. clevelandii, Q. acutissima, and Q. myrsinifolia. The conversion ratio of MVK to 2-butanol was calculated to be 4–9%. No emission of 2-butanol was detected in the gas collected from the bag enclosing the branch of O. fragrans var. aurantiacus.
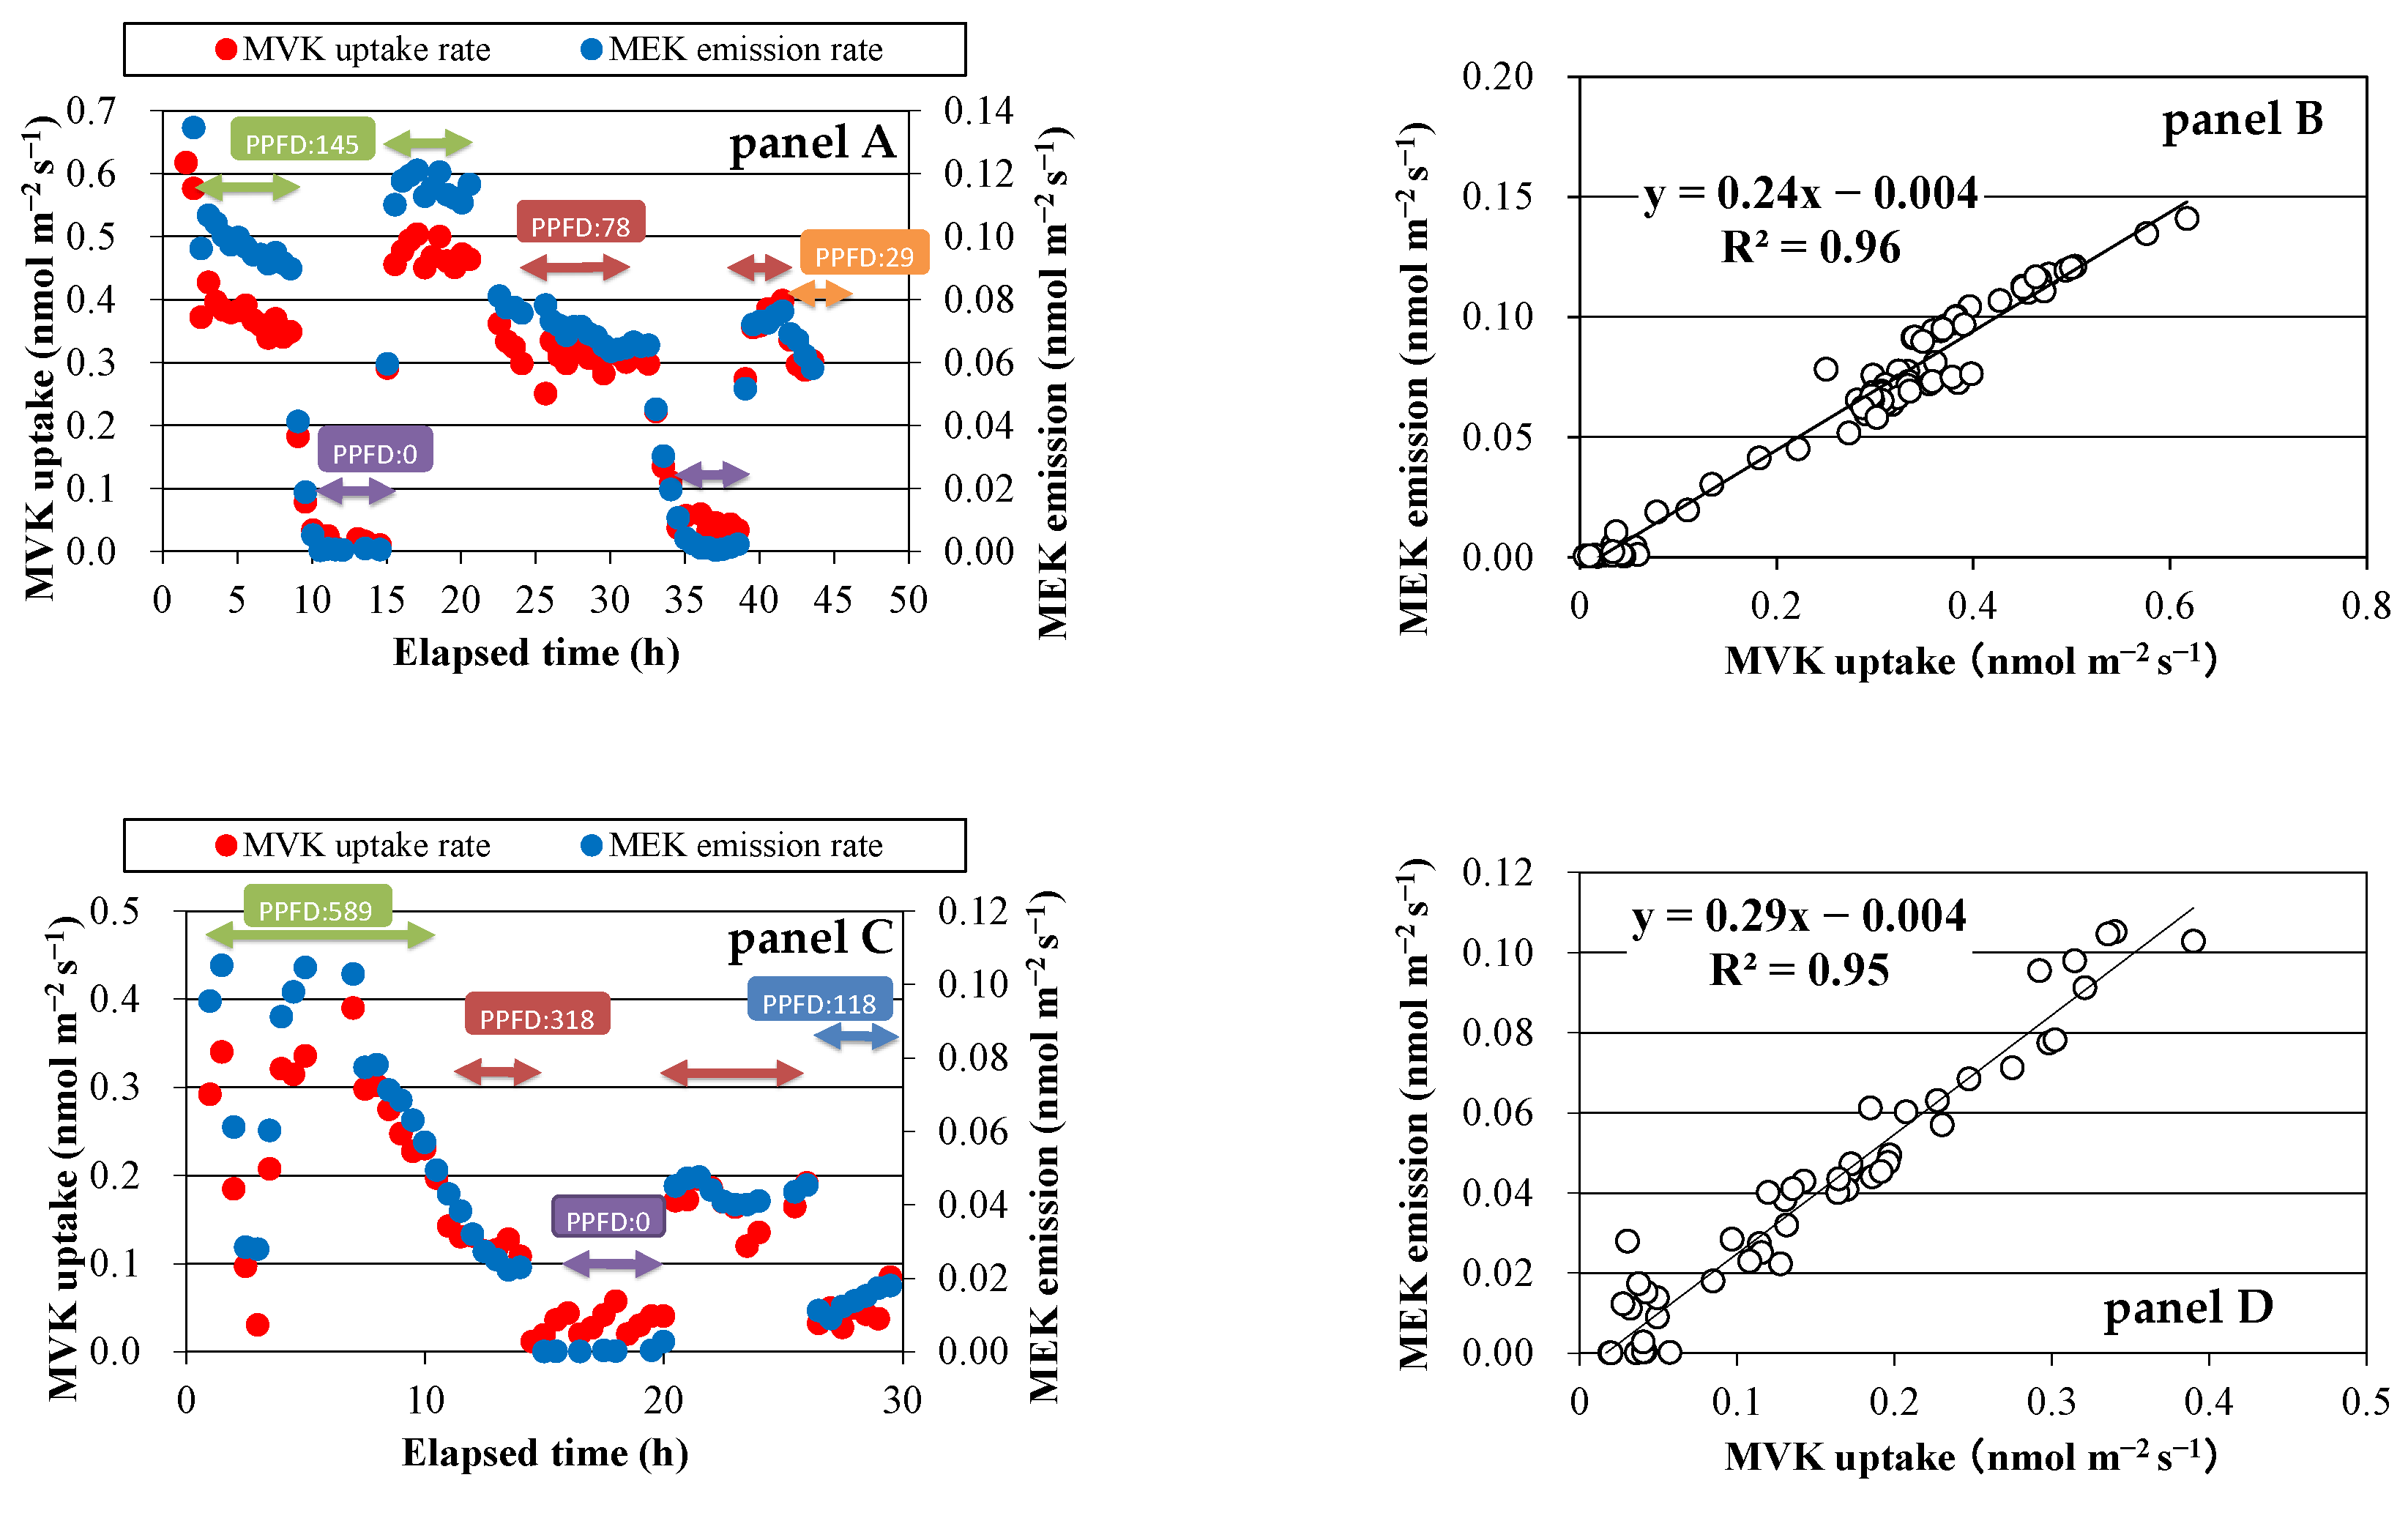
Both MVK uptake and MEK emission were closely correlated with gS (Figure 3, panel A,C), as PN was correlated with gS (Figure 3, panel B,D), indicating that their uptake and emission were governed by stomatal opening. MACR uptake was also correlated with stomatal opening.
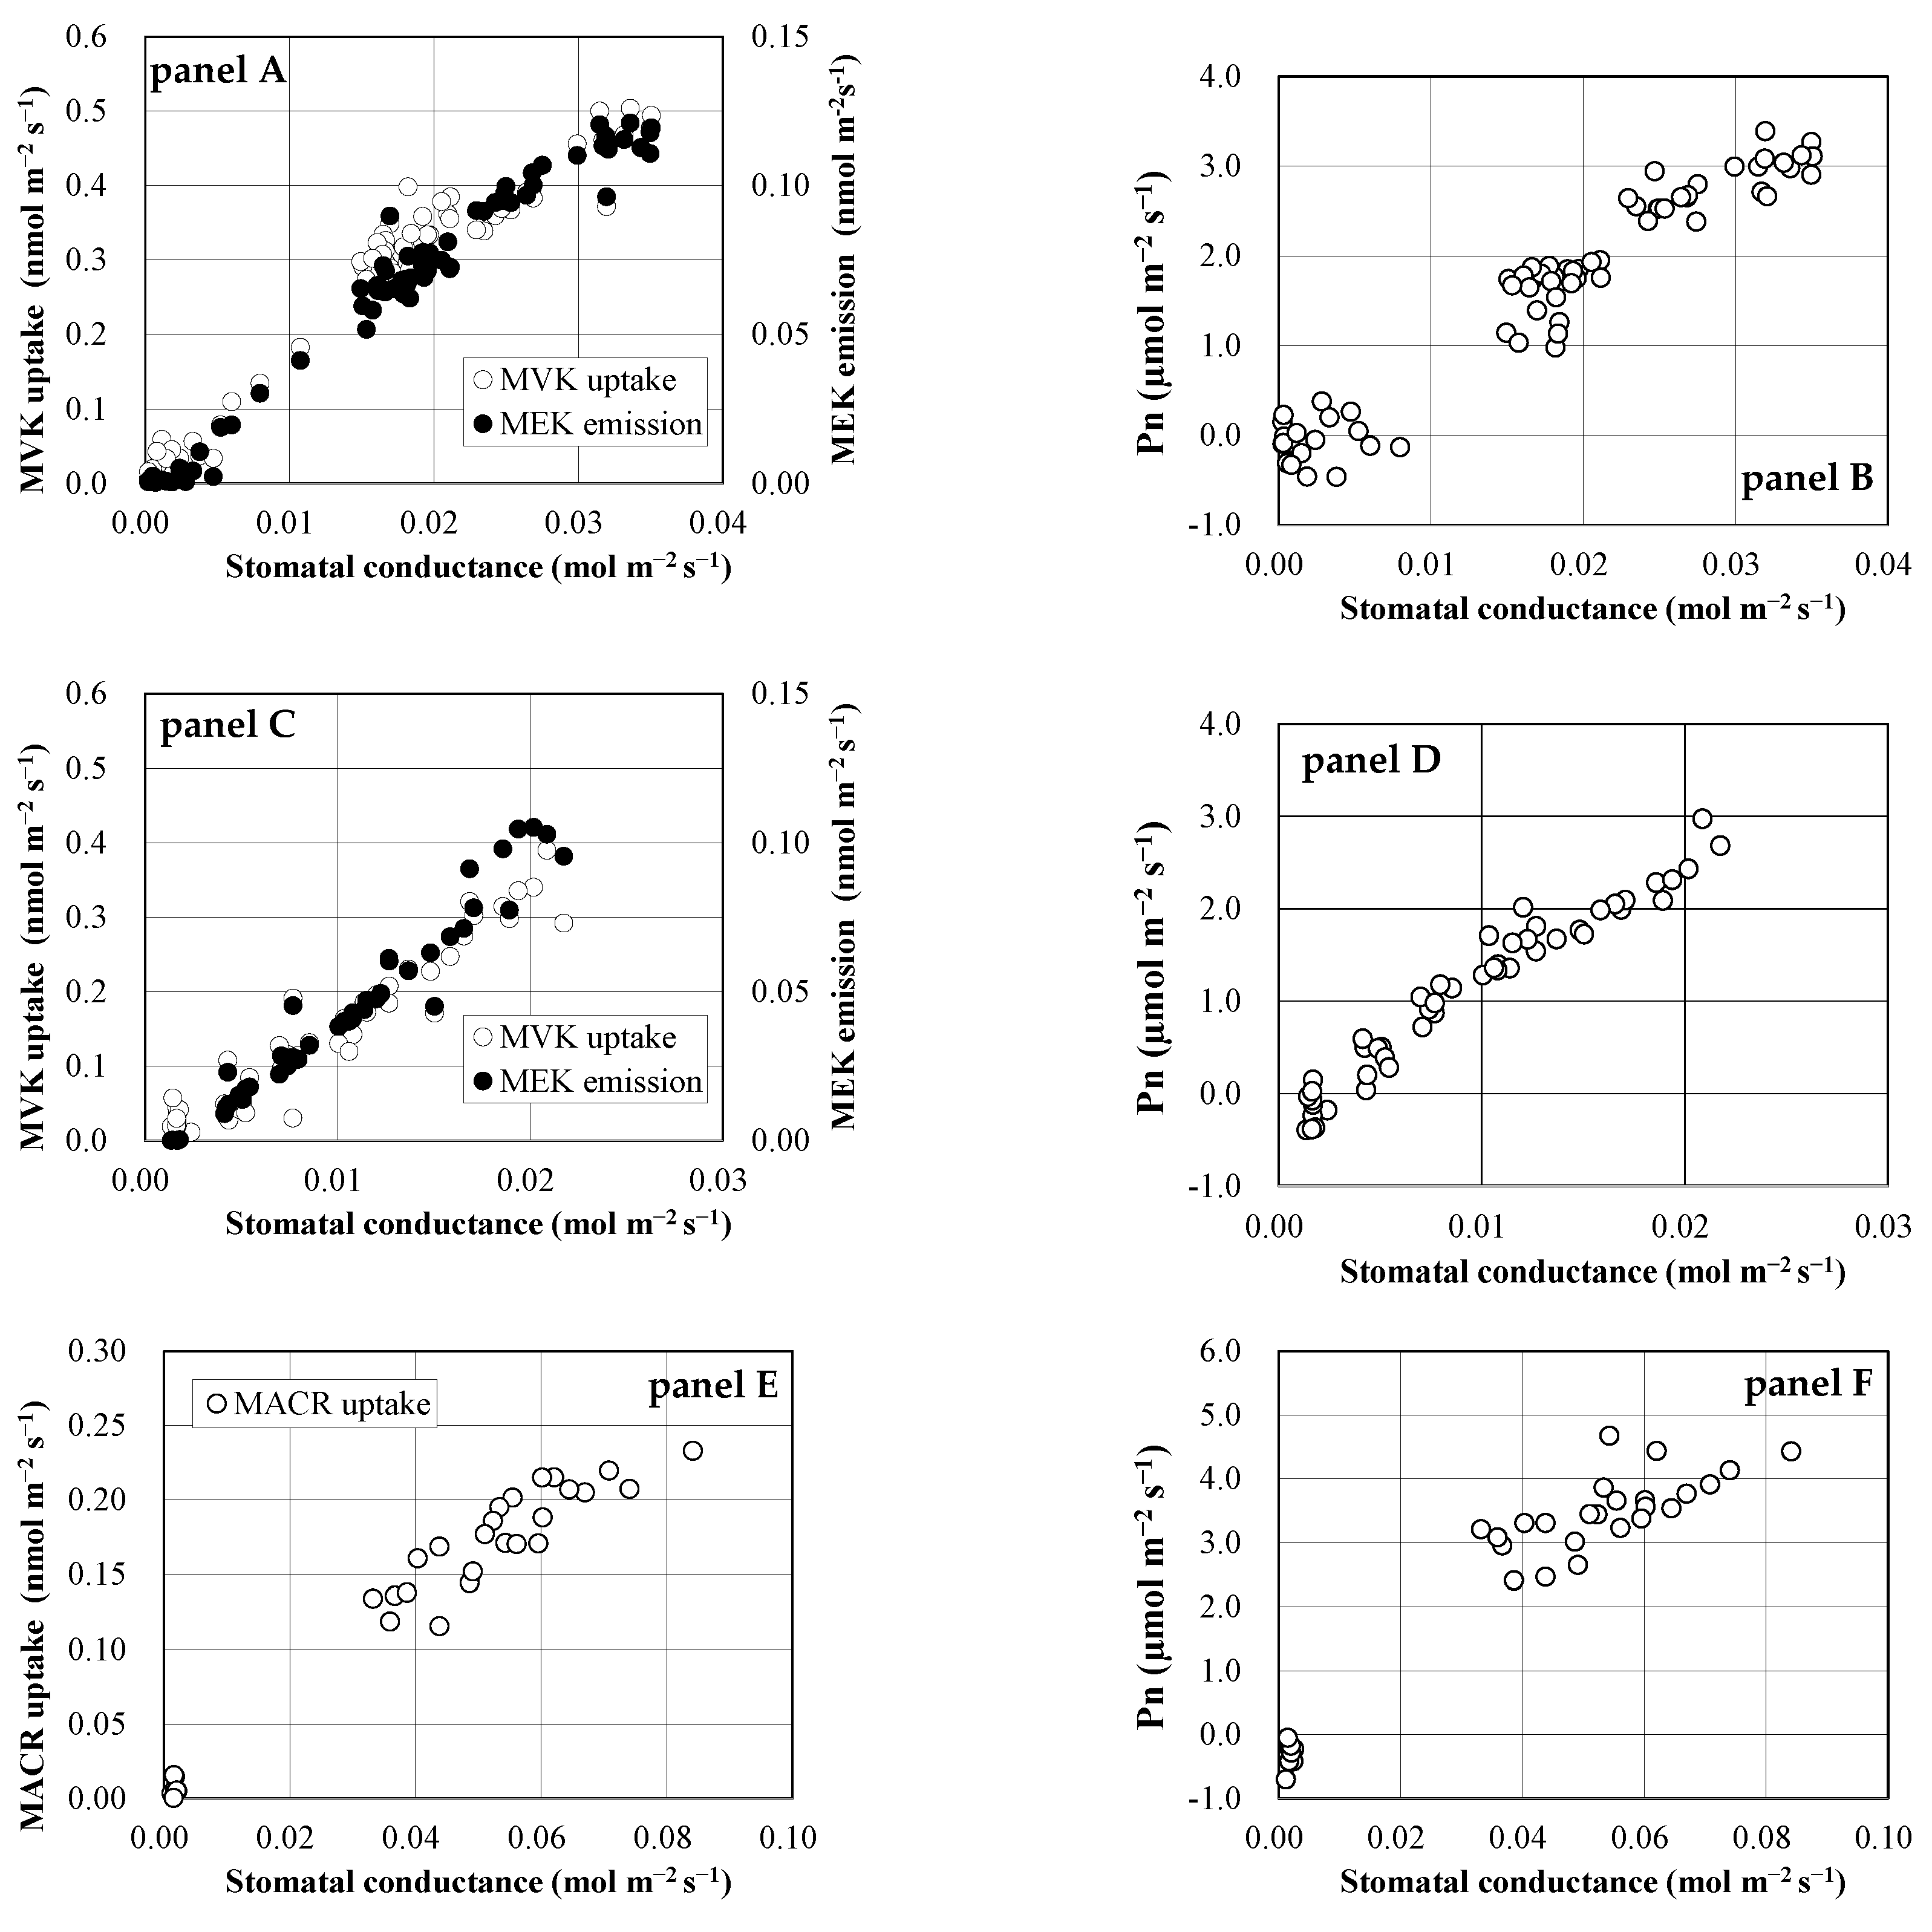
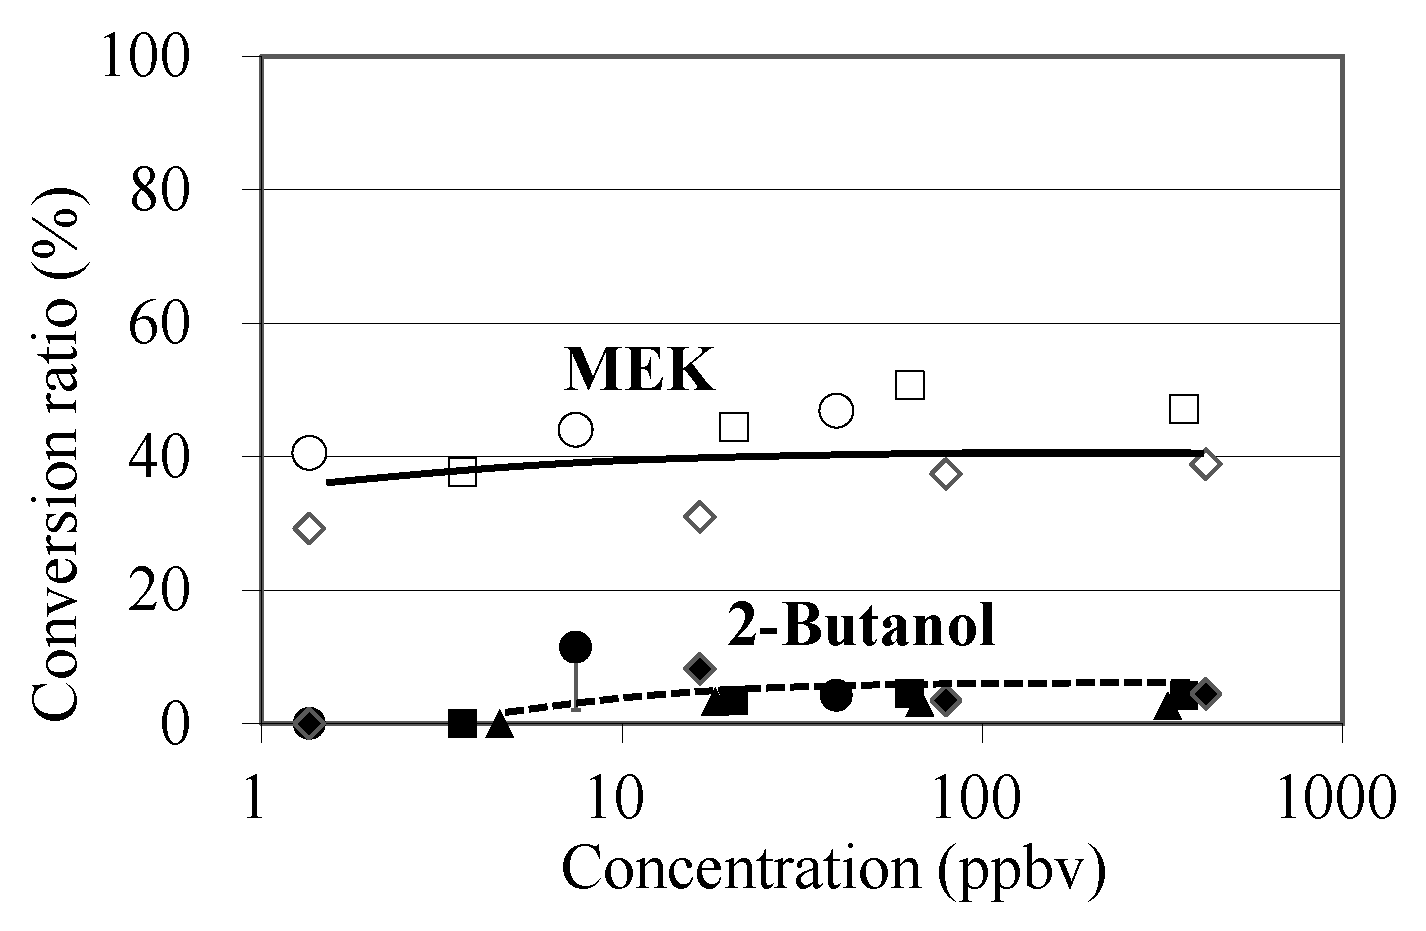
The concentration-dependency of MVK conversions to MEK and 2-butanol was investigated using S. clevelandii leaves (Figure 4). The conversion ratio of MVK to MEK was 29–50% at a concentration range of 1.4–400 ppbv, showing that MEK yield was not concentration-dependent. The yield of 2-butanol was lower than that of MEK at the medium and high concentration ranges (7.4–362 ppbv), and no emission was detected at the low concentration range (<5 ppbv).
When MEK at a concentration of ~8 ppbv was fumigated to S. clevelandii, MEK was absorbed by the plants, and the emission of 2-butanol was detected. The mean conversion ratio from MEK to 2-butanol was 22.6%, with a standard deviation of 11.3%. This value was higher than that from MVK to 2-butanol.
4. Discussion
Low-molecular-weight carbonyls, including ketones and aldehydes, have been reported to be taken up by plants via stomata [12,13,27]. At a low concentration range of ppb to several tens of ppb, the PTR-MS-based measurement system provided more precise data than GC-MS-based analysis [22]. In the present study, we used PTR-TOF-MS and GC-MS to analyze VOC, and we showed that isoprene oxygenates MACR and MVK were also absorbed by the four investigated species (Figure 1). This result was consistent with the results of our previous study on other plant species [11], and with the results of a previous report conducted in a forest [28]. In our previous study [11], we estimated the fate of MACR and MVK within the forest canopy, and we showed that the loss rates by tree uptake were the highest, followed by the reaction with OH radicals and reaction with ozone, suggesting that tree uptake provides a significant sink of MACR and MVK. In the present study, the uptake rate of MVK and MACR of the four plant species increased linearly with the increase in gS, indicating that this uptake was controlled by stomatal opening (Figure 3). This result was also in accordance with our previous results [11,13]. Other isoprene oxygenates, such as isoprene hydroxy hydroperoxides (ISOPOOH) and isoprene epoxy diols (IEPOX), have been reported to be deposited in a temperate forest [29].
It has been reported that some VOCs are bilaterally exchanged between plants and the atmosphere [8]. Low-molecular-weight oxygenated VOCs, including acetaldehyde, formaldehyde, and acetic and formic acids, were reported to be both emitted and taken up by plants [30]. MVK and MACR were also detected to be emitted from plants [9], suggesting that these compounds are not only formed by atmospheric oxidation of isoprene, but also produced in leaves by endogenous isoprene oxidation reaction under stress conditions.
Cappellin et al. [15] recently reported that MVK absorbed by leaves of two-year-old red oak (Quercus rubra) was reduced to MEK or 3-buten-2-ol. Further reactions reduced MEK and 3-buten-2-ol to 2-butanol. Our results were similar to theirs, but we did not observe 3-buten-2-ol emission from the four plant species. Cappellin et al. [15] determined the conversion ratio of MVK to MEK to be 73%, and that of MVK to all volatiles (including MEK, 3-buten-2-ol, and 2-butanol) to be 97.6%, suggesting that the absorbed MEK was mostly converted to volatiles and scarcely remained in leaves. The conversion ratios in the present experiment were 26–39% for MEK and 33–44% for all volatiles, independent of stomatal opening, and weakly dependent on plant species (Table 1). These values were much lower than those reported by Cappellin et al. [15].
The difference in the abundance of volatiles converted from MVK between the results of our study and those of Cappellin et al. [15] might be attributed to plant materials. Cappellin et al. [15] used the isoprene-emitting plant Quercus rubra, but we used four non-emitting species, including three tree species and one houseplant species. Isoprene-emitting trees may have more active enzymes for converting MVK to volatiles than non-emitting plants, because cells of the isoprene-emitting plants are always exposed to high concentrations of isoprene and its oxygenates, including MVK, during daytime. Reactive carbonyl species, especially α,β-unsaturated carbonyls (including MVK and MACR) are deleterious to plants at high concentrations [31,32]. Under such conditions, it may be safer for the isoprene-emitting plants to release the oxygenates into the atmosphere in the form of other volatiles because the pool size used for accumulating these oxygenates and their metabolites within plant tissues is limited, particularly at unusually high concentrations (>hundreds of ppbv). In the present experiment, more than 50% of the absorbed MVKs were estimated to be converted to heavier and nonvolatile compounds. Candidates converted from MVK may be glutathione conjugates, as Muramoto et al. [14] reported that MACR is metabolized in tissues to produce glutathione conjugates in addition to highly volatile compounds. Other enzymes involved in the detoxification of reactive carbonyls include cytochrome P450 monooxygenase, glycosyltransferases, and acyltransferases [33]. The reservoirs of these metabolites may be the vacuole, cellulose, hemi-cellulose, and lignin, depending on the physicochemical properties of the metabolites [34]. In the present experiment, glutathione conjugates and other adduct reactions with MVK may have occurred in non-emitting plants at low and medium concentrations of MVK (1.7–400 ppbv).
In MACR fumigation, we detected no emission of volatiles converted from MACR. Muramoto et al. [14] reported that, in a closed chamber measurement at unusually high MACR concentrations of 560 and 2240 ppmv, MACR was metabolized in plant tissues to produce highly volatile compounds, including isobutyl aldehyde, isobutyl alcohol, and methallyl alcohol. They estimated that the enzymes involved in this conversion are alkenal/one oxidoreductase (AOR) and aldo-keto reductase (AKR). Cappellin et al. [15] recently reported that a transient release of such products was detected for 2 h after the start of the MACR fumigation experiment at a concentration of 140 ppbv. Although the emission was no longer detected 2 h later, isobutyl aldehyde emission accounted for 6.5% of the MACR uptake, which was in accordance with the 6.4% conversion ratio of tomato plants reported by Muramoto et al. [14]. The fumigation concentration in two previous experiments was >0.1 ppmv, but this concentration in the present experiment was one order of magnitude lower (~10 ppbv) and more realistic for representing current atmospheric conditions. Muramoto et al. [14] also reported that efficient removal of MACR through glutathionylation within plant tissues was observed at the lowest MACR concentration (112 ppmv), when the reduction to form isobutyl aldehyde was not observed. They also employed a flow-through chamber method to fumigate MACR at a low concentration range (20–100 ppbv), and found that as much as ~40% of the MACR supplied in airflow was absorbed by the tomato plants and converted into GSH adducts. Our results and those of previous studies suggest that the conversion of MACR to volatiles is concentration-dependent, and in typical ambient atmospheric conditions where MACR concentration is at sub-ppbv levels, MACR may be mainly converted to heavier compounds, which remain in leaf tissues and are scarcely converted to volatiles.
In the present study, 2-butanol was also detected when MVK was fumigated to S. clevelandii, Q. acutissima, and Q. myrsinifolia (Table 1). When MEK was fumigated to S. clevelandii, 2-butanol emission was observed (Table 2), and its yield (23%) was higher than that in the case of MVK fumigation. These results suggest that 2-butanol is reduced from MEK, which is in accordance with the results of Cappellin et al. [15]. However, the conversion ratio from MEK to 2-butanol was low (23%), suggesting that 3/4 of MEK may also be converted to nonvolatile compounds. When MVK was fumigated to O. fragrans var. aurantiacus, no emission of 2-butanol was observed, but substantial emission of MEK was detected (Table 1), indicating that the activity of the enzymes converting MEK to 2-butanol was different in different plant species.
Although the available data from our study and previous reports are limited, our results suggest that MEK conversion from MVK normally occurs in a wide range of plant species, but the conversion ratio may depend on plant type, that is, if plant species are isoprene-emitting plants or non-emitting plants, as well as on fumigation concentrations. In terms of atmospheric chemistry, MVK, MACR, and MEK are important carbonyls originating from volatile isoprene. Therefore, bilateral exchanges of these compounds should be investigated at ambient concentration levels because the conversion ratios from MVK and MACR to volatiles, including MEK, might be lower at lower fumigation concentrations.
5. Conclusions
As a result of MACR and MVK fumigation experiments, we observed that both MACR and MVK were absorbed by all plants via stomata. Two metabolites, MEK and 2-butanol, were detected when MVK was fumigated, but no volatile compounds were detected in the case of MACR fumigation. The conversion ratio was 26–39% for MEK, and 33–44% for all volatiles. When MEK was fumigated to S. clevelandii, it was absorbed by the plant, and 2-butanol was emitted. The conversion ratio was ~23%. We compared our results with those of two previous relevant reports and found that isoprene-emitting plants might have higher enzymatic activity for converting MVK to volatiles than non-emitting plants, because cells of the isoprene-emitting plants are always exposed to high concentrations of isoprene and its oxygenates, including MVK, during daytime. In such cases, it may be safer for the plants to release these oxygenates into the atmosphere in the form of other volatiles, because the pool size used for accumulating these oxygenates and their metabolites within plant tissues is limited. Our results suggest that MVK conversion to MEK normally occurs in a wide variety of plant species, but the conversion ratio may depend on plant type, that is, if plant species are isoprene-emitting or non-emitting plants, as well as on the fumigation concentrations. Our findings also emphasize the importance of bilateral exchange measurements of these compounds at lower concentrations close to ambient levels.
Supplementary Materials
The following are available online at https://www.mdpi.com/2073-4433/11/8/793/s1: Figure S1: Schematic diagram of the VOC fumigation and measurement system; Table S1: Aldehydes and ketones used in the experiments.
Author Contributions
Cconceptualization: A.T.; methodology: A.T.; validation: A.T.; formal analysis: K.M. and T.M.; investigation: K.M. and A.T.; data curation: A.T.; writing—original draft preparation: A.T.; writing—review and editing: A.T. and T.M.; visualization: A.T.; supervision: A.T.; project administration: A.T.; funding acquisition: A.T. All authors have read and agreed to the published version of the manuscript.
Funding
This work was funded by MEXT KAKENHI, Grant Number 19H04257, 19H05666 and 18K18181.
Acknowledgments
The authors would like to thank Moeko Koike of University of Shizuoka for her technical support in this study.
Conflicts of Interest
The authors declare no conflicts of interest.
References
- Finlayson-Pitts, B.J.; Pitts, J.N., Jr. Tropospheric air pollution: Ozone, airborne toxics, polycyclic aromatic hydrocarbons, and particles. Science 1997, 276, 1045–1051. [Google Scholar] [CrossRef] [Green Version]
- Shrivastava, M.; Cappa, C.D.; Fan, J.; Goldstein, A.H.; Guenther, A.B.; Jimenez, J.L.; Kuang, C.; Laskin, A.; Martin, S.T.; Ng, N.L.; et al. Recent advances in understanding secondary organic aerosol: Implications for global climate forcing. Rev. Geophys. 2017, 55, 509–559. [Google Scholar] [CrossRef] [Green Version]
- Carlton, A.G.; Wiedinmyer, C.; Kroll, J.H. A review of Secondary Organic Aerosol (SOA) formation from isoprene. Atmos. Chem. Phys. 2009, 9, 4987–5005. [Google Scholar] [CrossRef] [Green Version]
- Goldstein, A.H.; Galbally, I.E. Known and unexplored organic constituents in the Earth’s atmosphere. Environ. Sci. Technol. 2007, 40, 1514–1521. [Google Scholar] [CrossRef] [PubMed] [Green Version]
- Arneth, A.; Monson, R.K.; Schurgers, G.; Niinemets, Ü.; Palmer, P.I. Why are estimates of global terrestrial isoprene emissions so similar (and why is this not so for monoterpenes)? Atmos. Chem. Phys. 2008, 8, 4605–4620. [Google Scholar] [CrossRef] [Green Version]
- Atkinson, R.; Arey, J. Gas-phase tropospheric chemistry of biogenic volatile organic compounds: A review. Atmos. Environ. 2003, 37, S197–S219. [Google Scholar] [CrossRef]
- Liu, Y.J.; Herdlinger-Blatt, I.; McKinney, K.A.; Martin, S.T. Production of methyl vinyl ketone and methacrolein via the hydroperoxyl pathway of isoprene oxidation. Atmos. Chem. Phys. 2013, 13, 5715–5730. [Google Scholar] [CrossRef] [Green Version]
- Niinemets, Ü.; Fares, S.; Harley, P.; Jardine, K.J. Bidirectional exchange of biogenic volatiles with vegetation: Emission sources, reactions, breakdown and deposition. Plant Cell Environ. 2014, 37, 1790–1809. [Google Scholar] [CrossRef]
- Jardine, K.; Abrell, L.; Kurc, S.A.; Huxman, T.; Ortega, J.; Guenther, A. Volatile organic compound emissions from Larrea tridentata (creosotebush). Atmos. Chem. Phys. 2010, 10, 12191–12206. [Google Scholar] [CrossRef] [Green Version]
- Fares, S.; Paoletti, E.; Loreto, F.; Brilli, F. Bidirectional flux of methyl vinyl ketone and methacrolein in trees with different isoprenoids emission under realistic ambient concentrations. Environ. Sci. Technol. 2015, 49, 7735–7742. [Google Scholar] [CrossRef]
- Tani, A.; Tobe, S.; Shimizu, S. Uptake of methacrolein and methyl vinyl ketone by tree saplings and implications for forest atmosphere. Environ. Sci. Technol. 2010, 44, 7096–7101. [Google Scholar] [CrossRef] [PubMed]
- Tani, A.; Hewitt, C.N. Uptake of aldehydes and ketones at typical indoor concentrations by houseplants. Environ. Sci. Technol. 2009, 43, 8338–8343. [Google Scholar] [CrossRef] [PubMed]
- Tani, A.; Tobe, S.; Shimizu, S. Leaf uptake of methyl ethyl ketone and croton aldehyde by Castanopsis sieboldii and Viburnum odoratissimum saplings. Atmos. Environ. 2013, 70, 300–306. [Google Scholar] [CrossRef]
- Muramoto, S.; Matsubara, Y.; Mwenda, C.M.; Koeduka, T.; Sakami, T.; Tani, A.; Matsui, K. Glutathionylation and reduction of methacrolein in tomato plants account for its absorption from the vapor phase. Plant Physiol. 2015, 169, 1744–1754. [Google Scholar] [CrossRef] [Green Version]
- Cappellin, L.; Loreto, F.; Biasioli, F.; Pastore, P.; McKinney, K. A mechanism for biogenic production and emission of MEK from MVK decoupled from isoprene biosynthesis. Atmos. Chem. Phys. 2019, 19, 3125–3135. [Google Scholar] [CrossRef] [Green Version]
- Grosjean, E.; Grosjean, D.; Fraser, M.P.; Cass, G.R. Air quality model evaluation data for organics: 2. C1–C14 carbonyls in Los Angeles air. Environ. Sci. Technol. 1996, 30, 2687–2703. [Google Scholar] [CrossRef] [Green Version]
- Feng, Y.; Wen, S.; Chen, Y.; Wang, X.; Lv, H.; Bi, X.; Sheng, G.; Fu, J. Ambient levels of carbonyl compounds and their sources in Guangzhou, China. Atmos. Environ. 2005, 39, 1789–1800. [Google Scholar] [CrossRef]
- Chew, A.A.; Atkinson, R. OH radical formation yields from the gas-phase reactions of O3 with alkenes and monoterpenes. J. Geophys. Res. Atmos. 1996, 101, 28649–28653. [Google Scholar] [CrossRef]
- Guidebook for Urban Tree Planting. Available online: https://tokyogrown.jp/learning/library/img/roadsidetree_guide.pdf (accessed on 20 July 2020).
- Nagase, A.; Nomura, M. An evaluation of one example of biotope roof in Japan: Plant development and invertebrate colonisation after 8 years. Urban For. Urban Green. 2014, 13, 714–724. [Google Scholar] [CrossRef]
- Tani, A.; Kawawata, Y. Isoprene emission from the major native Quercus spp. in Japan. Atmos. Environ. 2008, 42, 4540–4550. [Google Scholar] [CrossRef]
- Tani, A.; Kato, S.; Kajii, Y.; Wilkinson, M.; Owen, S.; Hewitt, N. A proton transfer reaction mass spectrometry based system for determining plant uptake of volatile organic compounds. Atmos. Environ. 2007, 41, 1736–1746. [Google Scholar] [CrossRef]
- Tani, A.; Hayward, S.; Hewitt, C.N. Measurement of monoterpenes and related compounds by proton transfer reaction mass spectrometry (PTR-MS). Int. J. Mass Spectrom. 2003, 223, 561–578. [Google Scholar] [CrossRef]
- Tani, A.; Hayward, S.; Hansel, A.; Hewitt, C.N. Effect of water vapour pressure on monoterpene measurements using proton transfer reaction-mass spectrometry (PTR-MS). Int. J. Mass Spectrom. 2004, 239, 161–169. [Google Scholar] [CrossRef]
- Mochizuki, T.; Tani, A.; Takahashi, Y.; Saigusa, N.; Ueyama, M. Long-term measurement of terpenoid flux above a Larix kaempferi forest using a relaxed eddy accumulation method. Atmos. Environ. 2014, 83, 53–61. [Google Scholar] [CrossRef]
- Von Caemmerer, S.; Farquhar, G.D. Some relationships between the biochemistry of photosynthesis and the gas exchange of leaves. Planta 1981, 153, 376–387. [Google Scholar] [CrossRef]
- Omasa, K.; Tobe, K.; Hosomi, M.; Kobayashi, M. Absorption of ozone and seven organic pollutants by Populus nigra and Camellia sasanqua. Environ. Sci. Technol. 2000, 34, 2498–2500. [Google Scholar] [CrossRef]
- Karl, T.; Harley, P.; Emmons, L.; Thornton, B.; Guenther, A.; Basu, C.; Turnipseed, A.; Jardine, K. Efficient atmospheric cleansing of oxidized organic trace gases by vegetation. Science 2010, 330, 816–819. [Google Scholar] [CrossRef] [Green Version]
- Nguyen, T.B.; Crounse, J.D.; Teng, A.P.; Clair, J.M.S.; Paulot, F.; Wolfe, G.M.; Wennberg, P.O. Rapid deposition of oxidized biogenic compounds to a temperate forest. Proc. Natl. Acad. Sci. USA 2015, 112, E392–E401. [Google Scholar] [CrossRef] [Green Version]
- Kesselmeier, J. Exchange of short-chain oxygenated volatile organic compounds (VOCs) between plants and the atmosphere: A compilation of field and laboratory studies. J. Atmos. Chem. 2001, 39, 219–233. [Google Scholar] [CrossRef]
- Mano, J. Reactive carbonyl species: Their production from lipid peroxides, action in environmental stress, and the detoxification mechanism. Plant Physiol. Biochem. 2012, 59, 90–97. [Google Scholar] [CrossRef]
- Farmer, E.E.; Mueller, M.J. ROS-mediated lipid peroxidation and RES activated signaling. Annu. Rev. Plant Biol. 2013, 64, 429–450. [Google Scholar] [CrossRef] [PubMed]
- Schäffner, A.; Messner, B.; Langebartels, C.; Sandermann, H. Genes and enzymes for in-planta phytoremediation of air, water and soil. Acta Biotechnol. 2002, 22, 51–141. [Google Scholar] [CrossRef]
- Trapp, S.; Karlson, U. Aspects of phytoremediation of organic pollutants. J. Soils Sediments 2001, 1, 37–43. [Google Scholar] [CrossRef]
Figure 1.
Time course of volatile organic compounds (VOCs) and water vapor concentrations, exchange rates of VOCs, net photosynthetic rate (Pn), and transpiration rate (Tr). Panels A and B: methyl vinyl ketone (MVK) fumigation experiment using Spathiphyllum clevelandii; panels C and D: MVK fumigation experiment using Quercus acutissima; panels E and F: methacrolein (MACR) fumigation experiments using Quercus myrsinifolia.


Figure 2.
Time course of exchange rates of VOCs and their relationship. Panels A and B: MVK fumigation experiment using Spathiphyllum clevelandii; panels C and D: MVK fumigation experiment using Quercus acutissima.
Figure 2.
Time course of exchange rates of VOCs and their relationship. Panels A and B: MVK fumigation experiment using Spathiphyllum clevelandii; panels C and D: MVK fumigation experiment using Quercus acutissima.

Figure 3.
Relationship of exchange rates of VOCs and net photosynthetic rate (Pn) to stomatal conductance. Panels A and B: MVK fumigation experiment using Spathiphyllum clevelandii; panels C and D: MVK fumigation experiment using Quercus acutissima; panels E and F: MACR fumigation experiment using Quercus myrsinifolia.

Figure 4.
Concentration-dependency of MVK conversions to MEK and 2-butanol. Open and filled symbols indicate conversion ratios from MVK to MEK and to 2-butanol, respectively. Circle, square, and triangle symbols show the 1st, 2nd, and 3rd experiments, respectively. The GC-MS analysis was conducted in triplicate for the air collected into the adsorbent tubes, and standard deviations were all less than 30% of each plotted data point.


Table 1.
Conversion ratios of MVK to methyl ethyl ketone (MEK) and to 2-butanol.
| Plant Name | Conversion to MEK | Conversion to 2-Butanol |
|---|---|---|
| Spathiphyllum clevelandii | 26.0 ± 1.0 | 3.7 ± 2.6 |
| Quercus acutissima | 31.9 ± 19.3 | 9.4 ± 8.6 |
| Quercus myrsinifolia | 39.4 ± 4.3 | 4.3 ± 0.6 |
| Osmanthus fragrans var. aurantiacus | 35.9 ± 5.8 | 0.0 ± 0.0 |
| Two-way ANOVA | ||
| species × compounds: n.s. | species: n.s. | compounds: ** |
* and ** indicate a significant difference at 5% and 1% level by ANOVA test, respectively; n.s. indicates no significant difference. No significant difference was observed between the plant species with respect to each conversion (p > 0.05). n = 3.
Table 2.
MEK uptake rate, 2-butanol emission rate, and conversion ratio of MEK to 2-butanol of S. clevelandii.
Table 2.
MEK uptake rate, 2-butanol emission rate, and conversion ratio of MEK to 2-butanol of S. clevelandii.
| Date of Gas Sampling | MEK Uptake Rate (nmol m−2 s−1) | 2-Butanol Emission Rate (nmol m−2 s−1) | Conversion Ratio (%) |
|---|---|---|---|
| 15 November 2018 | 0.24 ± 0.12 | 0.031 ± 0.005 | 13.8 ± 4.1 |
| 16 November 2018 | 0.28 ± 0.14 | 0.031 ± 0.001 | 13.5 ± 7.5 |
| 14 December 2018 | 0.25 ± 0.01 | 0.045 ± 0.001 | 26.1 ± 13.9 |
| 20 December 2018 | 0.03 ± 0.00 | 0.011 ± 0.000 | 37.0 ± 1.2 |
| Average | 0.20 | 0.030 | 22.6 |
| Standard deviation | 0.11 | 0.010 | 11.3 |
© 2020 by the authors. Licensee MDPI, Basel, Switzerland. This article is an open access article distributed under the terms and conditions of the Creative Commons Attribution (CC BY) license (http://creativecommons.org/licenses/by/4.0/).
Share and Cite
MDPI and ACS Style
Tani, A.; Muramatsu, K.; Mochizuki, T. Emission of Methyl Ethyl Ketone and 2-Butanol Converted from Methyl Vinyl Ketone in Plant Leaves. Atmosphere 2020, 11, 793. https://doi.org/10.3390/atmos11080793
AMA Style
Tani A, Muramatsu K, Mochizuki T. Emission of Methyl Ethyl Ketone and 2-Butanol Converted from Methyl Vinyl Ketone in Plant Leaves. Atmosphere. 2020; 11(8):793. https://doi.org/10.3390/atmos11080793
Chicago/Turabian StyleTani, Akira, Kana Muramatsu, and Tomoki Mochizuki. 2020. "Emission of Methyl Ethyl Ketone and 2-Butanol Converted from Methyl Vinyl Ketone in Plant Leaves" Atmosphere 11, no. 8: 793. https://doi.org/10.3390/atmos11080793
Note that from the first issue of 2016, this journal uses article numbers instead of page numbers. See further details here.