Article

Microbiological Aerosol, Particulate Matter Concentrations and Antibiotic Resistant Staphylococcus spp. in the Premises of Poland’s Oldest Agricultural School

1
Department of Microbiology and Biomonitoring, Faculty of Agriculture and Economics, University of Agriculture in Krakow, Mickiewicza Ave. 24/28, 30-059 Krakow, Poland
2
Faculty of Biotechnology and Horticulture, 29 Listopada Ave. 54, 31-425 Krakow, Poland
3
Faculty of Agriculture and Economics, University of Agriculture in Krakow, Mickiewicza Ave. 21, 31-120 Krakow, Poland
*
Author to whom correspondence should be addressed.
Atmosphere 2021, 12(8), 934; https://doi.org/10.3390/atmos12080934
Submission received: 21 June 2021 / Revised: 18 July 2021 / Accepted: 19 July 2021 / Published: 21 July 2021
(This article belongs to the Special Issue Particulate Matter Content and Health Risk Assessment)

Abstract

:
Bioaerosol, particulate matter concentration and antibiotic resistance of airborne Staphylococcus was assessed in animal and public premises (classroom, sports hall, horse stable, cowshed, newborn calf shed and outdoor background control site) of Poland’s oldest agricultural school. The concentration and size distribution of bacteria, fungi, actinomycetes and staphylococci were assessed with a six stage Andersen impactor. Particulate matter (PM10, PM4, PM2.5 and PM1) was determined using the DustTrak aerosol monitor. The Staphylococcus species were determined with MALDI-TOF mass spectrometry and antimicrobial resistance was assessed using disk diffusion. Bioaerosol concentrations differed significantly between sampling points, with the highest levels of all microorganisms occurring in the newborn calf shed. The proportion of respirable fraction exceeded 60% in all sites, indicating potential harmfulness to exposed people. Mean concentrations of particulate matter were the smallest in school rooms and the highest in the newborn calf shed. Neither particulate matter nor microbial aerosol exceeded threshold values for workplaces. Among thirty-four isolated staphylococcal strains, S. equorum (35%), S. succinus (26%) and S. xylosus (15%) were the most prevalent. Resistance to macrolides (erythromycin) and lincosamides (clindamycin) was the most frequent. One strain was methicillin-resistant. Farm animals are significant sources of bioaerosol and therefore attention should be paid with respect to maintaining appropriate sanitary conditions and hygiene of premises and animals.

1. Introduction

Airborne contaminants that are associated with agricultural environment have detrimental effects on air quality and pose health hazards to exposed people. The contaminants include toxic gases, such as ammonia or hydrogen sulfide; inorganic particulates, such as soil dusts; non-viable organic particles, such as feed or feces droplets, feathers and dandruff; and finally viable particulates such as bacteria and fungi and their fragments and toxins. They are sometimes referred to as bioaerosols [1]. Working in agriculture has been associated with increased risk in terms of exposure to biological agents [1,2,3] and, in particular, bioaerosols [4]. Both occupational and non-occupational exposure to organic dusts and bioaerosols result in the frequent occurrence of respiratory system and skin diseases, infections, toxic reactions, or syndromes associated with poor indoor air quality, such as sick building syndrome. The most common health effects can be encountered in places where particulate matter is associated with microorganisms or microbial particles which—as bioaerosol components—are transmitted by air-droplet or air-dust pathway and enter the body, e.g., through the respiratory tract [3].
Livestock buildings are characterized by microclimatic conditions that favor the occurrence and proliferation of microorganisms both inside the buildings and in their surroundings. Animals dwelling in livestock buildings, their feces, secretions and fodder are sources of many microorganisms, including human pathogens [5]. Moreover, dust that is generated during agricultural work contributes to increased numbers of airborne microorganisms. In some types of environment, the diameter of organic dust particles present in bioaerosol of 4 µm, which is the size at which they are capable of reaching the alveoli within the human respiratory tract, may reach approximately 40%. Therefore, the allergic and/or toxic effect of these particles may be even more dangerous than those of larger particle sizes [6,7]. The bioaerosol particle size plays an important role not only in the penetration depth within the respiratory tract but also determines the retention time within the body, which affects the level of toxicity and harmfulness to humans. For this reason, determining the size classes (i.e., fractions) is the commonly used criterion for the exposure thresholds and is an important factor in the air quality studies [7]. In agricultural livestock farming, most airborne microorganisms are found in much larger particle size or mass fractions (>PM10) than to be expected from the size of individual microbial cells. However, the distribution of different bioaerosol components can vary and does not always simply correlate with the distribution of dust fractions [8]. Many studies demonstrated that livestock buildings are characterized by increased concentrations of particulate matter and associated microorganisms than compared to atmospheric air. According to Dutkiewicz et al. [4], the air of agricultural settings can be heavily polluted with bacteria and endotoxins. Moreover, livestock buildings have been proved to be the source of outdoor air contamination in their direct surroundings [9].
The skin and fur of animals are colonized by various and multiple microorganisms. Among these, staphylococci appear to be a suitable group as a specific indicator in animal husbandry and potentially also contains pathogen groups. This group consists of several potential pathogens with the best known being Staphylococcus aureus, however, this group is detected in low numbers in animal husbandry premises [8]. Nevertheless, occupational exposure to S. aureus and methicillin-resistant S. aureus (MRSA) among farm workers is of special concern due to the resistance of these bacteria to beta-lactam antibiotics, which renders the resulting infections difficult to treat [10]. Madsen et al. [10] detected S. aureus and MRSA in pig farms with the highest concentrations found during high-pressure cleaning. Moreover, all farms examined in their study were MRSA positive. As suggested by Clauß [11], staphylococci can be considered as particularly characteristic of emissions from agricultural livestock farming since they originate directly from animals and have almost always been detected in large numbers in the air of livestock buildings. Actinomycetes, which can be released in large numbers during animal feeding, are also a substantial component of bioaerosol in animal breeding facilities [12]. They are etiological factors of the “farmer’s lung” or opportunistic infections in immunocompromised people or in those with dysfunctions of the immune system [8]. Airborne mold fungi, which may be etiological factors of allergies or immunotoxic diseases (including allergic rhinitis, bronchial asthma, skin mycoses or organic dust toxic syndrome) can also be found in animal breeding facilities [13]. The numbers and composition of mold species depend largely on the presence and quality of litter. The groups most often detected in cattle and horses include Aspergillus spp., Alternaria spp., Cladosporium spp., Penicillium spp., Fusarium spp., Scopulariopsis spp. or Mucor [7,9,13]. Out of these, Aspergillus spp., Alternaria spp., Cladosporium spp. and Penicillium spp. pose an occupational hazard as a source of allergens, mycotoxins and volatile organic compounds [4].
Among premises located in the rural environment, schools are peculiar types of facilities. Poland’s oldest agricultural school, located in Czernichów, southern Poland, provides a unique opportunity to study the combination of a number of types of micro-environments, such as classrooms, gyms, various animal breeding facilities as well as the outdoor surroundings where a number of agricultural and non-agricultural activities take place. The school is located in the manor house and palace complex built in the 19th century, along with auxiliary buildings consisted of farmhouses (stable, cowshed, newborn calf house, fodder silos, a workshop and a garage for agricultural machinery), old power plant, the teacher’s house and a few residential houses. The school buildings include the main building with classrooms, a gym, a dormitory with a canteen and the entire complex is surrounded by a park with a running track and sports ground for students and a pasture for cows and paddock for horses and a few farmlands. With all the above, the aim of this study was to determine the bioaerosol components along with the particulate matter distribution in the air of various types of premises of this agricultural school. The seasonal variation within the tested parameters was also examined and—due to the fact that Staphylococcus spp. may potentially be the most significant pathogenic species and thus might have the most detrimental health effects—particular attention was paid to the presence of this genus, its species composition and the susceptibility to the most commonly administered antibiotics.

2. Materials and Methods

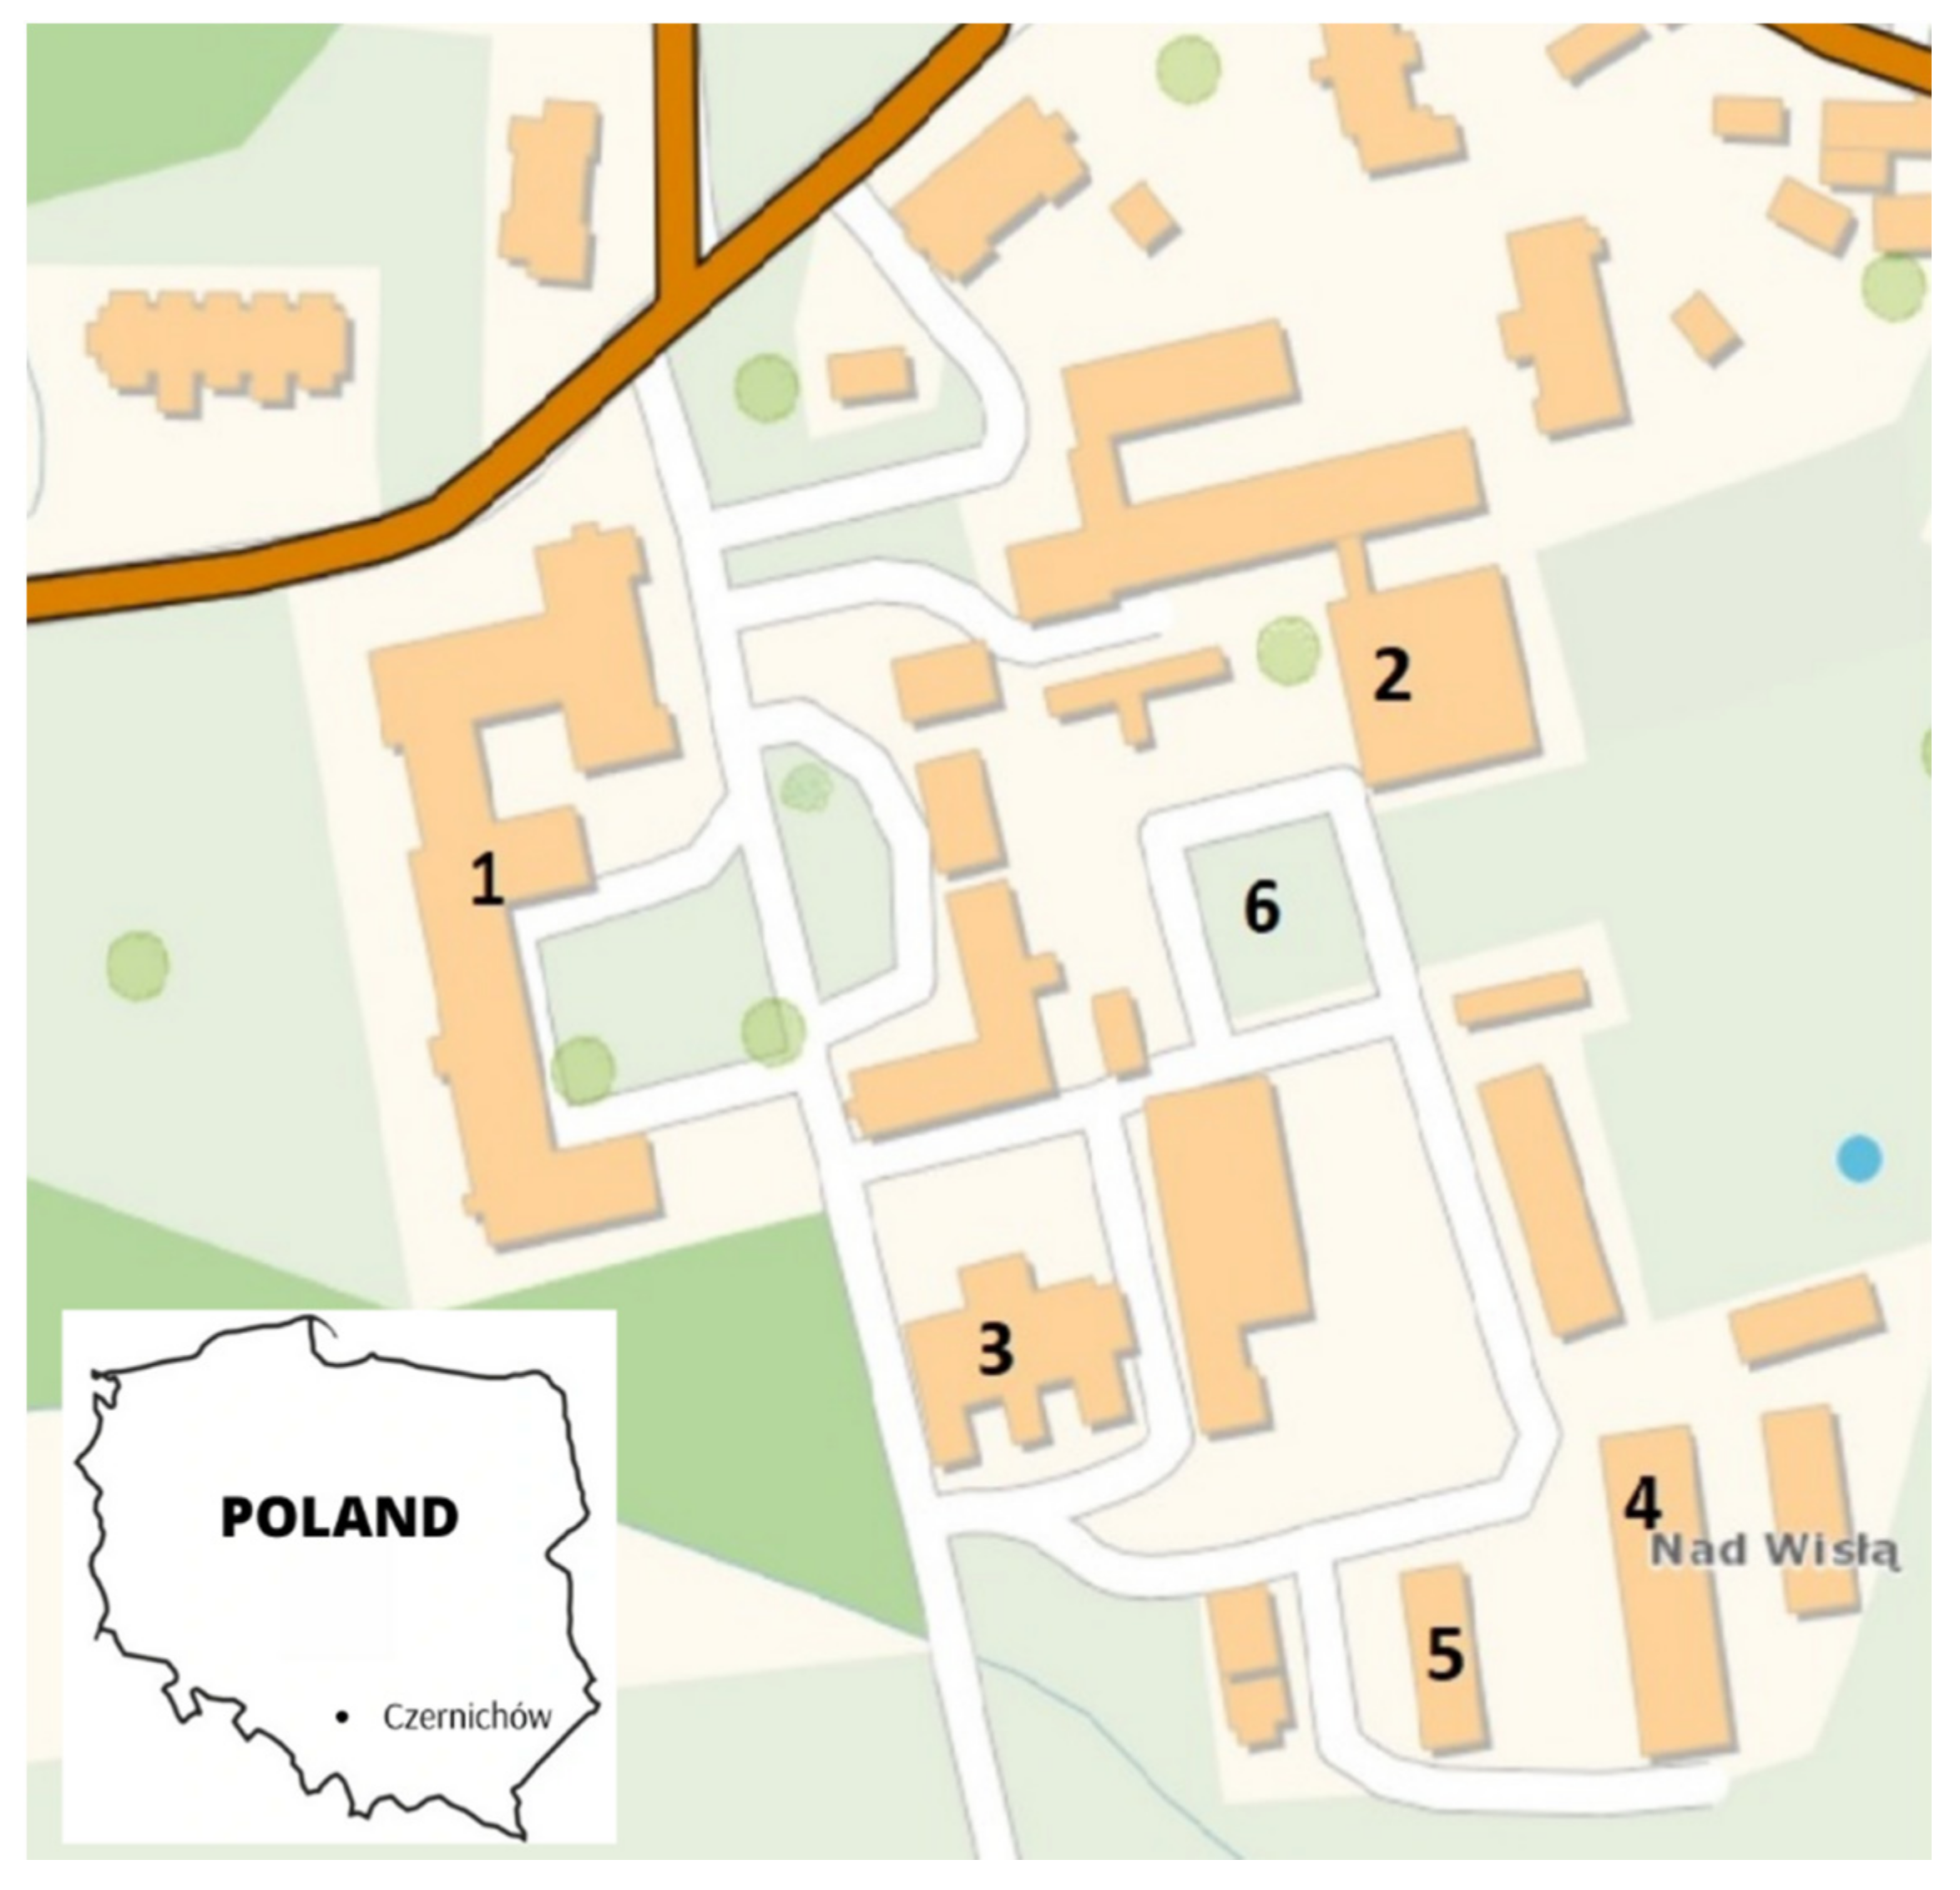
2.1. Study Site and Study Design

The study was conducted in the Poland’s oldest agricultural school in Czernichów (southern Poland). It was conducted as part of the microbiological methods’ demonstration classes with the participation of the school’s students. In order to ensure the most comprehensive approach to the sampled types of premises, six sampling points were designated throughout the facility (Figure 1 and Table 1) and included classrooms, sports hall, horse stable, cowshed and newborn calf shed and outdoor air was considered as a background sample. The samples were collected over one year during four days (once per each season: winter—10 February; spring—20 April; summer—25 August; and autumn—20 November). The sampling dates were selected based on the consideration of microclimatic parameters (i.e., temperature, relative humidity and precipitation,) in order to conduct analyses on dates that were the most possibly representative of each season of the year.

2.2. Bioaerosol Measurements

The microbiological aerosol concentration was measured using the 6-stage Andersen cascade impactor (model WES-710, Westech Instrument, Essex, UK). It enables distinguishing of the following aerodynamic diameters of bioaerosol: 7 µm and above (stage one), 4.7–7 µm (stage two), 3.3–4.7 µm (stage three), 2.1–3.3 µm (stage four), 1.1–2.1 µm (stage five) and 0.65–1.1 µm (stage six). Particles smaller than 4.7 µm (i.e., stage three, four and six) were considered as respirable fraction (RF) [14]. Sampling time was from 3 to 5 min depending on the preliminary assessment of air contamination based on the dust concentration. With the constant flow rate of 28.3 L/min, the examined air volume was from 84.9 to 141.5 L. The air sampler was placed at a height of 1.5 m above the ground to collect the air from the human breathing zone. The following microorganisms were examined with microbiological media and culture conditions as follows: bacteria (Trypticasein Soy Agar (Biomaxima, Lublin, Poland) incubated at 37 °C for 1 day, followed by 3 days at 22 °C and another 3 days at 4 °C), fungi (Malt Extract Agar (Biomaxima, Lublin, Poland) incubated at 30 °C for 4 days followed by another 4 days at 22 °C). The prolonged incubation of plates for bacteria and fungi enables the growth of slowly growing strains at a lower temperature range [15,16]. Actinomycetes were incubated on Gauze agar, at 28 °C for 7 days and Staphylococcus spp. on Mannitol Salt Agar (Biomaxima, Lublin, Poland) incubated at 37 °C for 2 days. After incubation, the colonies characteristic of individual microbial groups were counted and the results were expressed as the number of colony forming units per m3 of air (CFU/m3). Three measurements were conducted at each sampling site for each of the examined microbial group, resulting in 432 samples for each season (1728 examined samples in total). The results are presented as mean values of the three replicates.

2.3. Airborne Dust Concentration and Physical Parameter Measurements

Particulate matter concentration was measured using a DustTrakTM II Aerosol Monitor 8530 (TSI Inc., Shoreview, MN, USA) laser photometer. Four fractions of particulate matter were measured: PM10 (i.e., dust particles not larger than 10 µm), PM4, PM2.5 and PM1 (i.e., dust particles with diameters ≤ 4, 2.5 and 1 µm, respectively). Sampling time for each fraction was 1 min. The respirable fraction of particulate matter was assumed as smaller than 4 µm. Temperature and relative humidity were measured using the Kestrel 400 Weather Meter (Nielsen-Kellerman, Boothwyn, PA, USA).

2.4. Species Identification of Staphylococcus spp.

In the case of Staphylococcus spp., yellow, pale, pink or red colonies grown on Mannitol Salt agar with a diameter no larger than 5 mm were selected for further analyses. The cultures were purified with plate streaking. Preliminary identification of Staphylococcus spp. was based on microscopic observations of Gram stained smears. Their species was confirmed using MALDI-TOF spectrometry [17,18,19]. Thirty-four staphylococcal strains were then selected for antimicrobial resistance examinations.

2.5. Antimicrobial Resistance Testing

Antimicrobial resistance of Staphylococcus spp. was tested using the disk diffusion method based on the recommendations of the European Committee on Antimicrobial Susceptibility Testing. The cartridges of antimicrobial disks were obtained from Oxoid (Basingstoke, Great Britain). The following antimicrobial disks were used: cefoxitin (for methicillin resistance testing, FOX 30 µg), erythromycin (E 15 µg), clindamycin (DA 2 µg), tetracycline (TE 30 µg), ciprofloxacin (CIP 5 µg), gentamycin (CN 10 µg) and trimethoprim/sulfamethoxazole (1.25/23.75 µg). The diameters of growth inhibition zones were compared with the breakpoint values recommended by the EUCAST. Quality control was performed using the S. aureus strain ATCC 25923.

2.6. Data Interpretation and Statistical Analysis

Due to absence of guidelines, the recorded concentrations of microbial aerosol were referred to the proposal of the Team of Experts on Biological Factors (pol. ZECB) [20] on the recommended concentrations of airborne microorganisms by treating animal rooms as working premises contaminated with organic dust and treating classroom and the sports hall as public utility premises.
Statistical analysis was performed using Statistica v. 13 software (TIBCO, Palo Alto, CA, USA). The normality of data distribution was tested using the Shapiro–Wilk test. As the collected data were not normally distributed, further tests were based on non-parametric analyses. The Kruskal–Wallis analysis of variance was used to assess the significance of differences in the bioaerosol and particulate matter concentrations as well as temperature and relative humidity between the examined premises and seasons of the year. Spearman’s correlation analysis was used to assess whether there are statistically significant relationships between bioaerosol concentrations and other air parameters (temperature, relative humidity and particulate matter levels) in the examined premises.

3. Results and Discussion

3.1. Microclimatic Parameters

Analysis of microclimatic conditions prevailing in the examined sites suggests that high relative humidity of air in the livestock rooms allowed for a convenient growth of microorganisms. The higher the temperature and relative humidity, the more favorable the conditions for microorganisms and the more intensive the multiplication of bacteria and fungi [21]. Relative humidity of air indoors ranged from 44.8 to 93.8% throughout the year and the temperature ranged from 7.7 to 24.4 °C (Table 1). The highest humidity was recorded in livestock premises in the period from autumn to spring. The air temperatures inside the school premises (classroom and sports hall) remained constant at around 22 °C. In the case of other sites, the season of the year determines the recorded temperature and therefore the highest temperatures were observed in the spring and summer seasons.

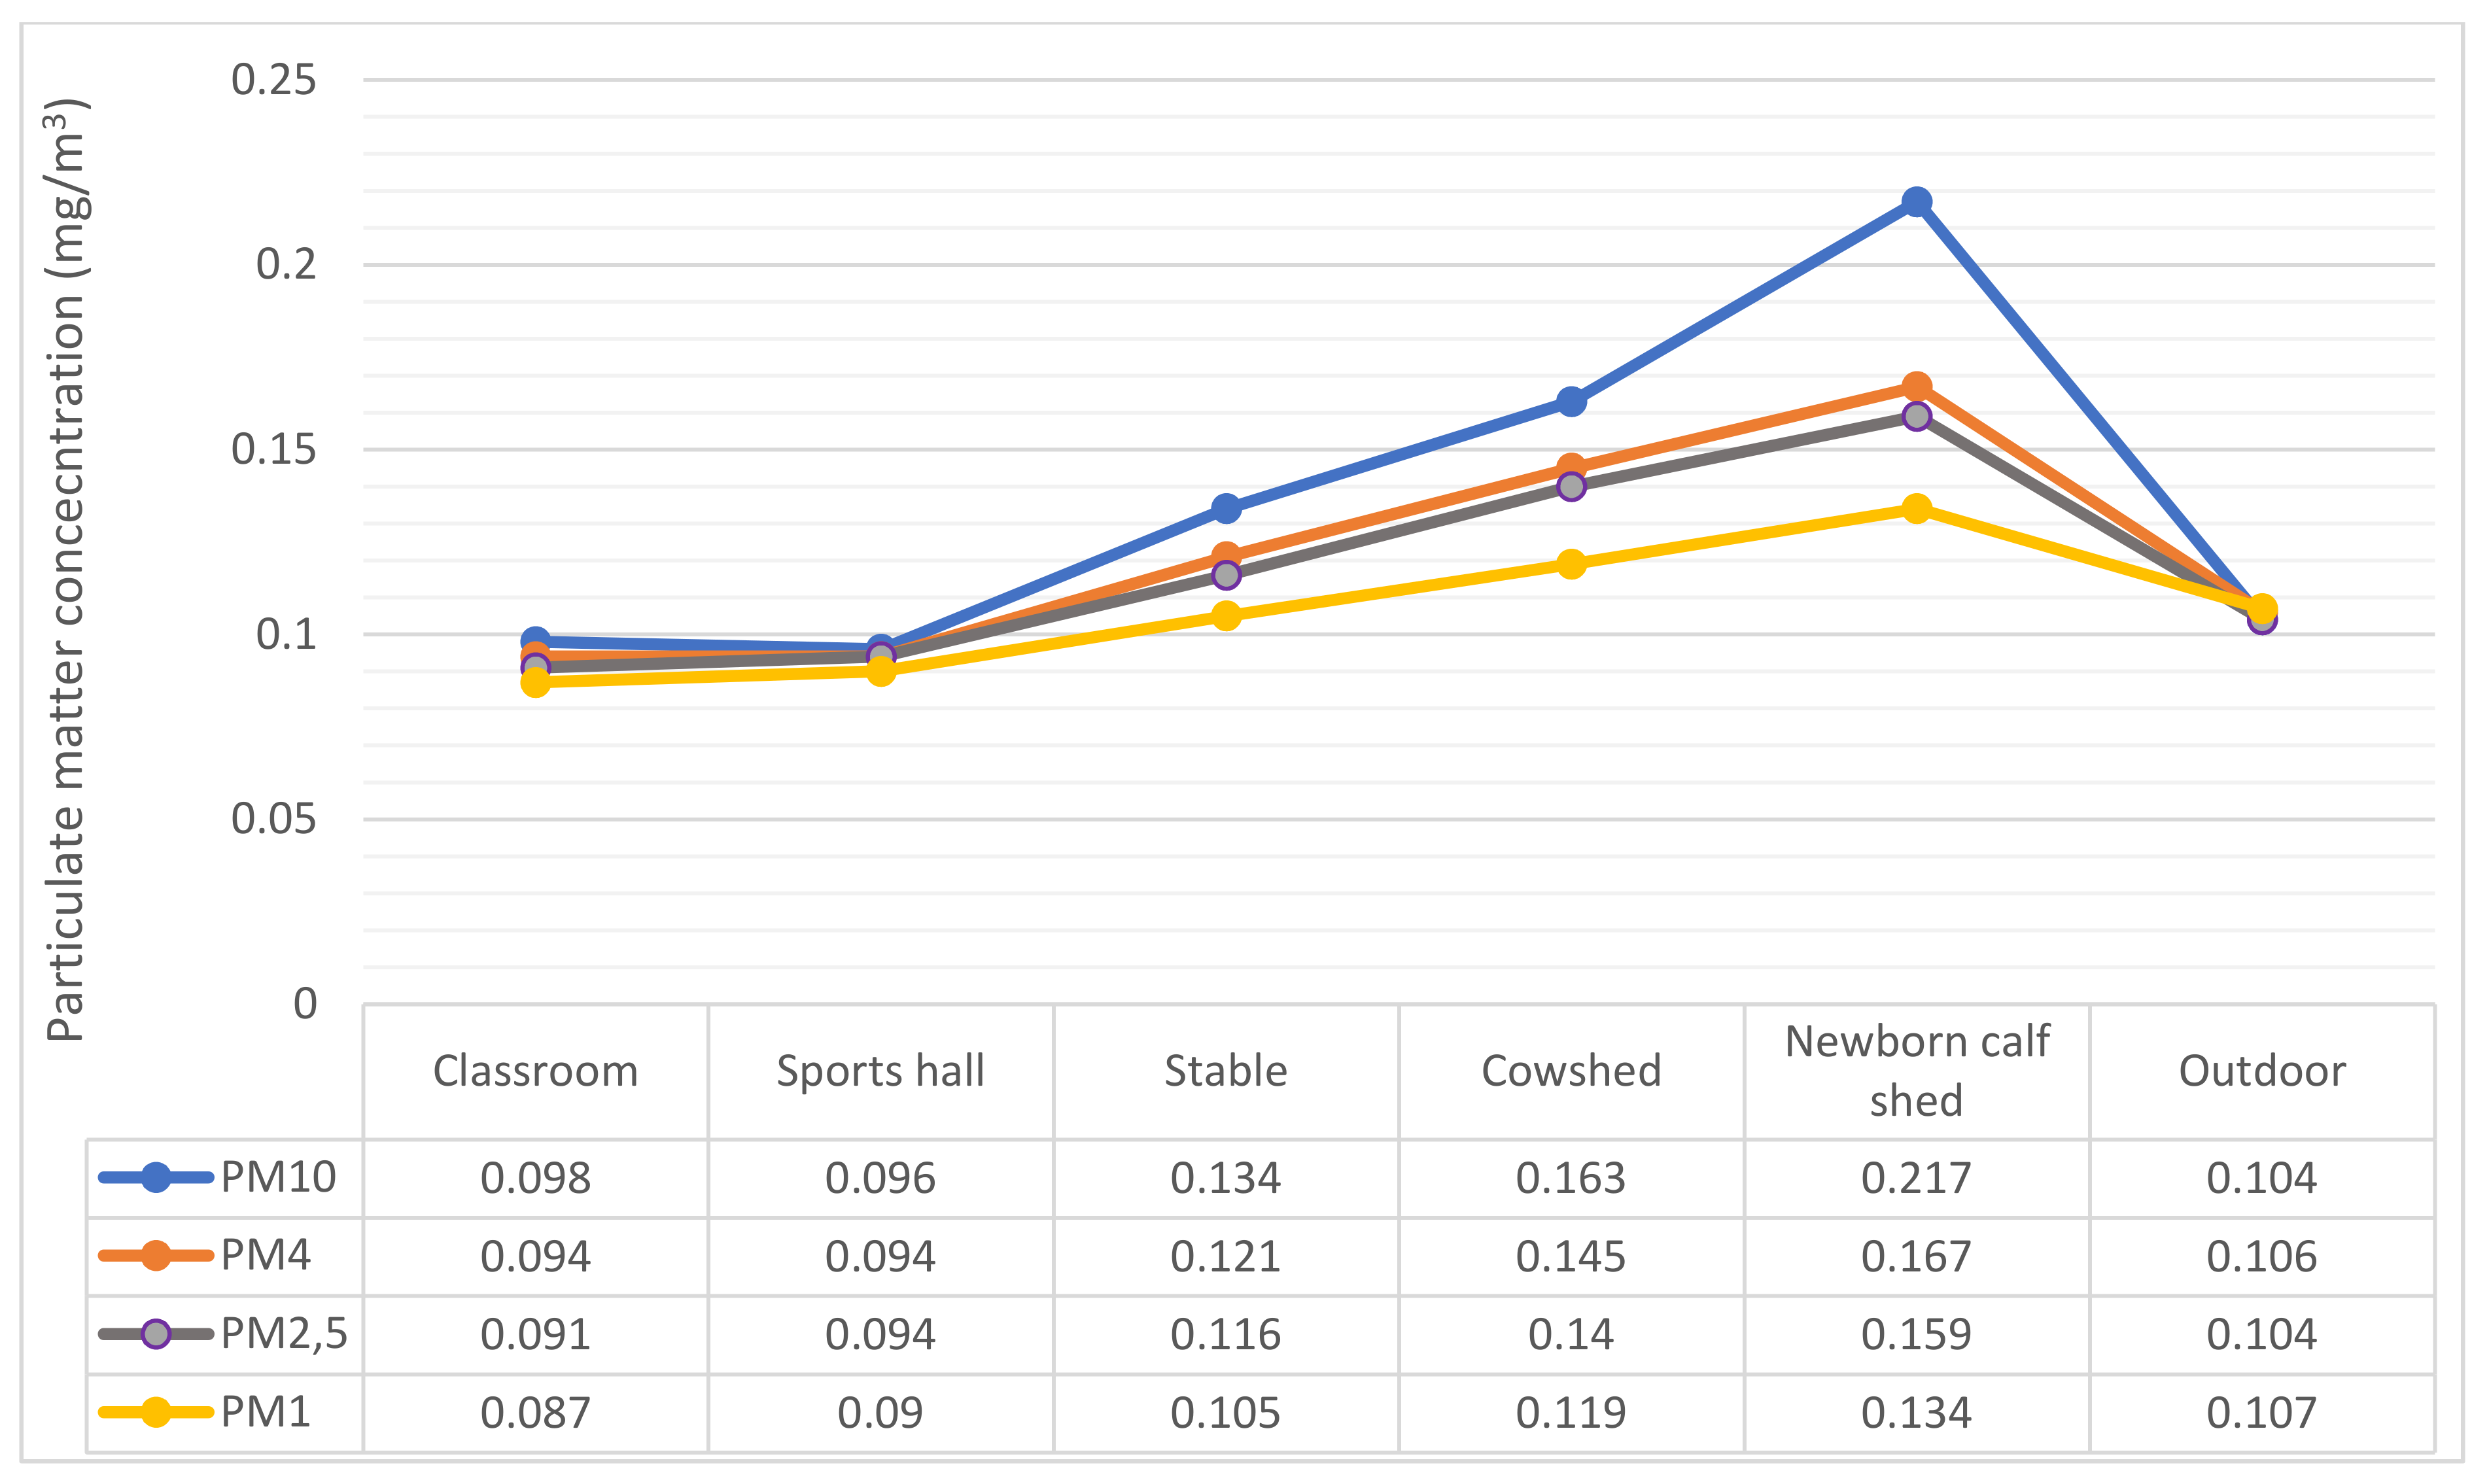
3.2. Particulate Matter Concentrations

The concentration of particulate matter varied in our study depending on the analyzed site and season of the year (Table 2, Figure 2). The highest concentrations throughout the year were observed in the newborn calf shed followed by the cowshed and horse stable; this means that the PM concentrations were visibly higher in animal premises than in other sites and this was also observed by other researchers [22]. The most possible sources of increased PM concentrations in these sites include feed, bedding and dried feces [22]. In the newborn calf shed all these sources are coupled with limited ventilation during cold seasons (autumn and winter), resulting in the highest observed PM concentrations. The possible control measures in the examined animal rooms might include considering the least friable material of bedding, increasing the share of wet feed instead of dried ones and—finally—improved ventilation or internal air cleaners could be considered [22]. What we also observed was that the indoor PM levels recorded in the classroom and sports hall were similar or lower than the one recorded outdoors. What is known from the literature is that indoor particle mass concentration can be expressed as a function of a number of factors, even when significant indoor sources of PM are absent. These factors include the following: outdoor PM levels, air exchange rate, PM penetration efficiency from the outdoor air, PM deposition rate on indoor surfaces and meteorological factor outdoors [23]. What is also meaningful is that the individual outdoor PM10 and PM2.5 concentrations exceed the WHO limit values of 24 h mean [24] by even four times, while the annual mean (i.e., 0.104 mg/m3) exceeds the annual PM10 recommended mean by five times and the annual PM2.5 mean by ten times. This is not an unknown situation, as the air quality in Kraków and its vicinity for several years has been said to be an example of poor air quality that constantly exeeds the recommended PM10 and PM2.5 contents [25]. Even the WHO placed Kraków at the eleventh position on the list of the EU’s 50 most polluted cities [25,26]. This severe air pollution is mostly associated with a continuous problem of solid-fuel burning for house heating purposes and the increasing number of old vehicles.
Regardless of the above, none of the particulate matter concentrations detected in our study exceeded the threshold limits specified for workplaces (for 8 h work shift) according to the Polish legislation [27], which is 4 mg/m3 for the inhalable fraction of organic dust of animal and plant origin, while the respirable fraction should not exceed 2 mg/m3. The distribution of particulate matter fractions was, on the other hand, similar in various sites.
Particulate matter in public utility and livestock buildings is an important air pollution parameter that adversely affects the health and welfare of workers and animals. It can directly reduce the efficiency of animal production while the dust suspended in the air acts as a carrier of odors and irritating gases. It can act as a vector for microorganisms, their metabolites and other bioactive particles that affect its biological activity [28]. Dust pollution generated in livestock buildings can be a direct cause of air pollution in their vicinity. As reported by Cambra˗Lopez et al. [29], livestock production may account for 8% of total PM10 emissions and 4% of primary PM2.5 emissions and, in the future, the share of agriculture is expected to rise to over 25%. Currently, the main sources of dust emissions from agriculture in Europe are poultry and pig farms, which account for as much as 30–50%. Moreover, it is estimated that the dust concentration in livestock housing can be 10–100 times higher than in other indoor environments.
Particulate matter with diameters smaller than 4 µm is considered the most dangerous to humans and animals since it forms respirable fraction which can penetrate and deposit in the lower respiratory tract, mainly in the trachea, bronchi and bronchioles, while the smallest particles are able to penetrate to the alveoli. High concentration of respirable dust in the environment where humans and animals reside on a daily basis can contribute to many diseases and to the occurrence of chronic cough, bronchitis, allergic reactions or asthma [26]. The concentration of PM4 dust fraction in school rooms ranged from 0.062 to 0.161 mg/m3, while in the examined livestock buildings this fraction was in the concentration range from 0.065 to 0.325 mg/m3. The distribution of the sub-micron dust fraction was similar to that of the fine fraction. In the rooms where the animals are kept, the concentration of PM1 dust ranged from 0.063 to 0.256 mg/m3. Such high concentrations of fine dust in the air may pose significant health threats to people and animals staying in these buildings and contribute to the development and intensification of respiratory diseases [29]. The obtained results were similar to those of other researchers. Takai et al. [30] recorded mean concentrations of inhalable dust ranging from 0.22 to 0.65 mg/m3 in livestock buildings, while the concentration of respirable dust ranged from 0.05 to 0.09 mg/m3. The mean concentration of inhalable dust recorded by Winkel et al. 2015 [31] in dairy cattle houses was 0.295 mg/m3, while the concentration of PM2.5 ranged from 0.004 to 0.025 mg/m3.
The PM concentration was characterized by noticeable seasonal variations. According to Cambra-Lopez et al. [29], air humidity higher than 70% may decrease the amount of dusts in the air due to the high equilibrium moisture content. However, we observed an opposite relationship in our study (Spearman’s correlation coefficient of 0.71, 0.69, 0.71 and 0.75 for PM10, PM4, PM2.5 and PM1, respectively, as shown in Table 3. Especially in the autumn and winter period, there was an increase in dust concentration. The mean temperature in the animal rooms in this period was 10.8 °C with a relative air humidity of 80.7%. The reason for such a result could be the ongoing heating season, which in Poland is mainly based on coal combustion, which generates huge emissions of mainly coarse particles into the atmosphere. With respect to this fact, all examined premises are only naturally ventilated (ventilation based on leaving windows and door open) and the increased values of particulate matter indoors may result from PM-contaminated outdoor air entering indoors.

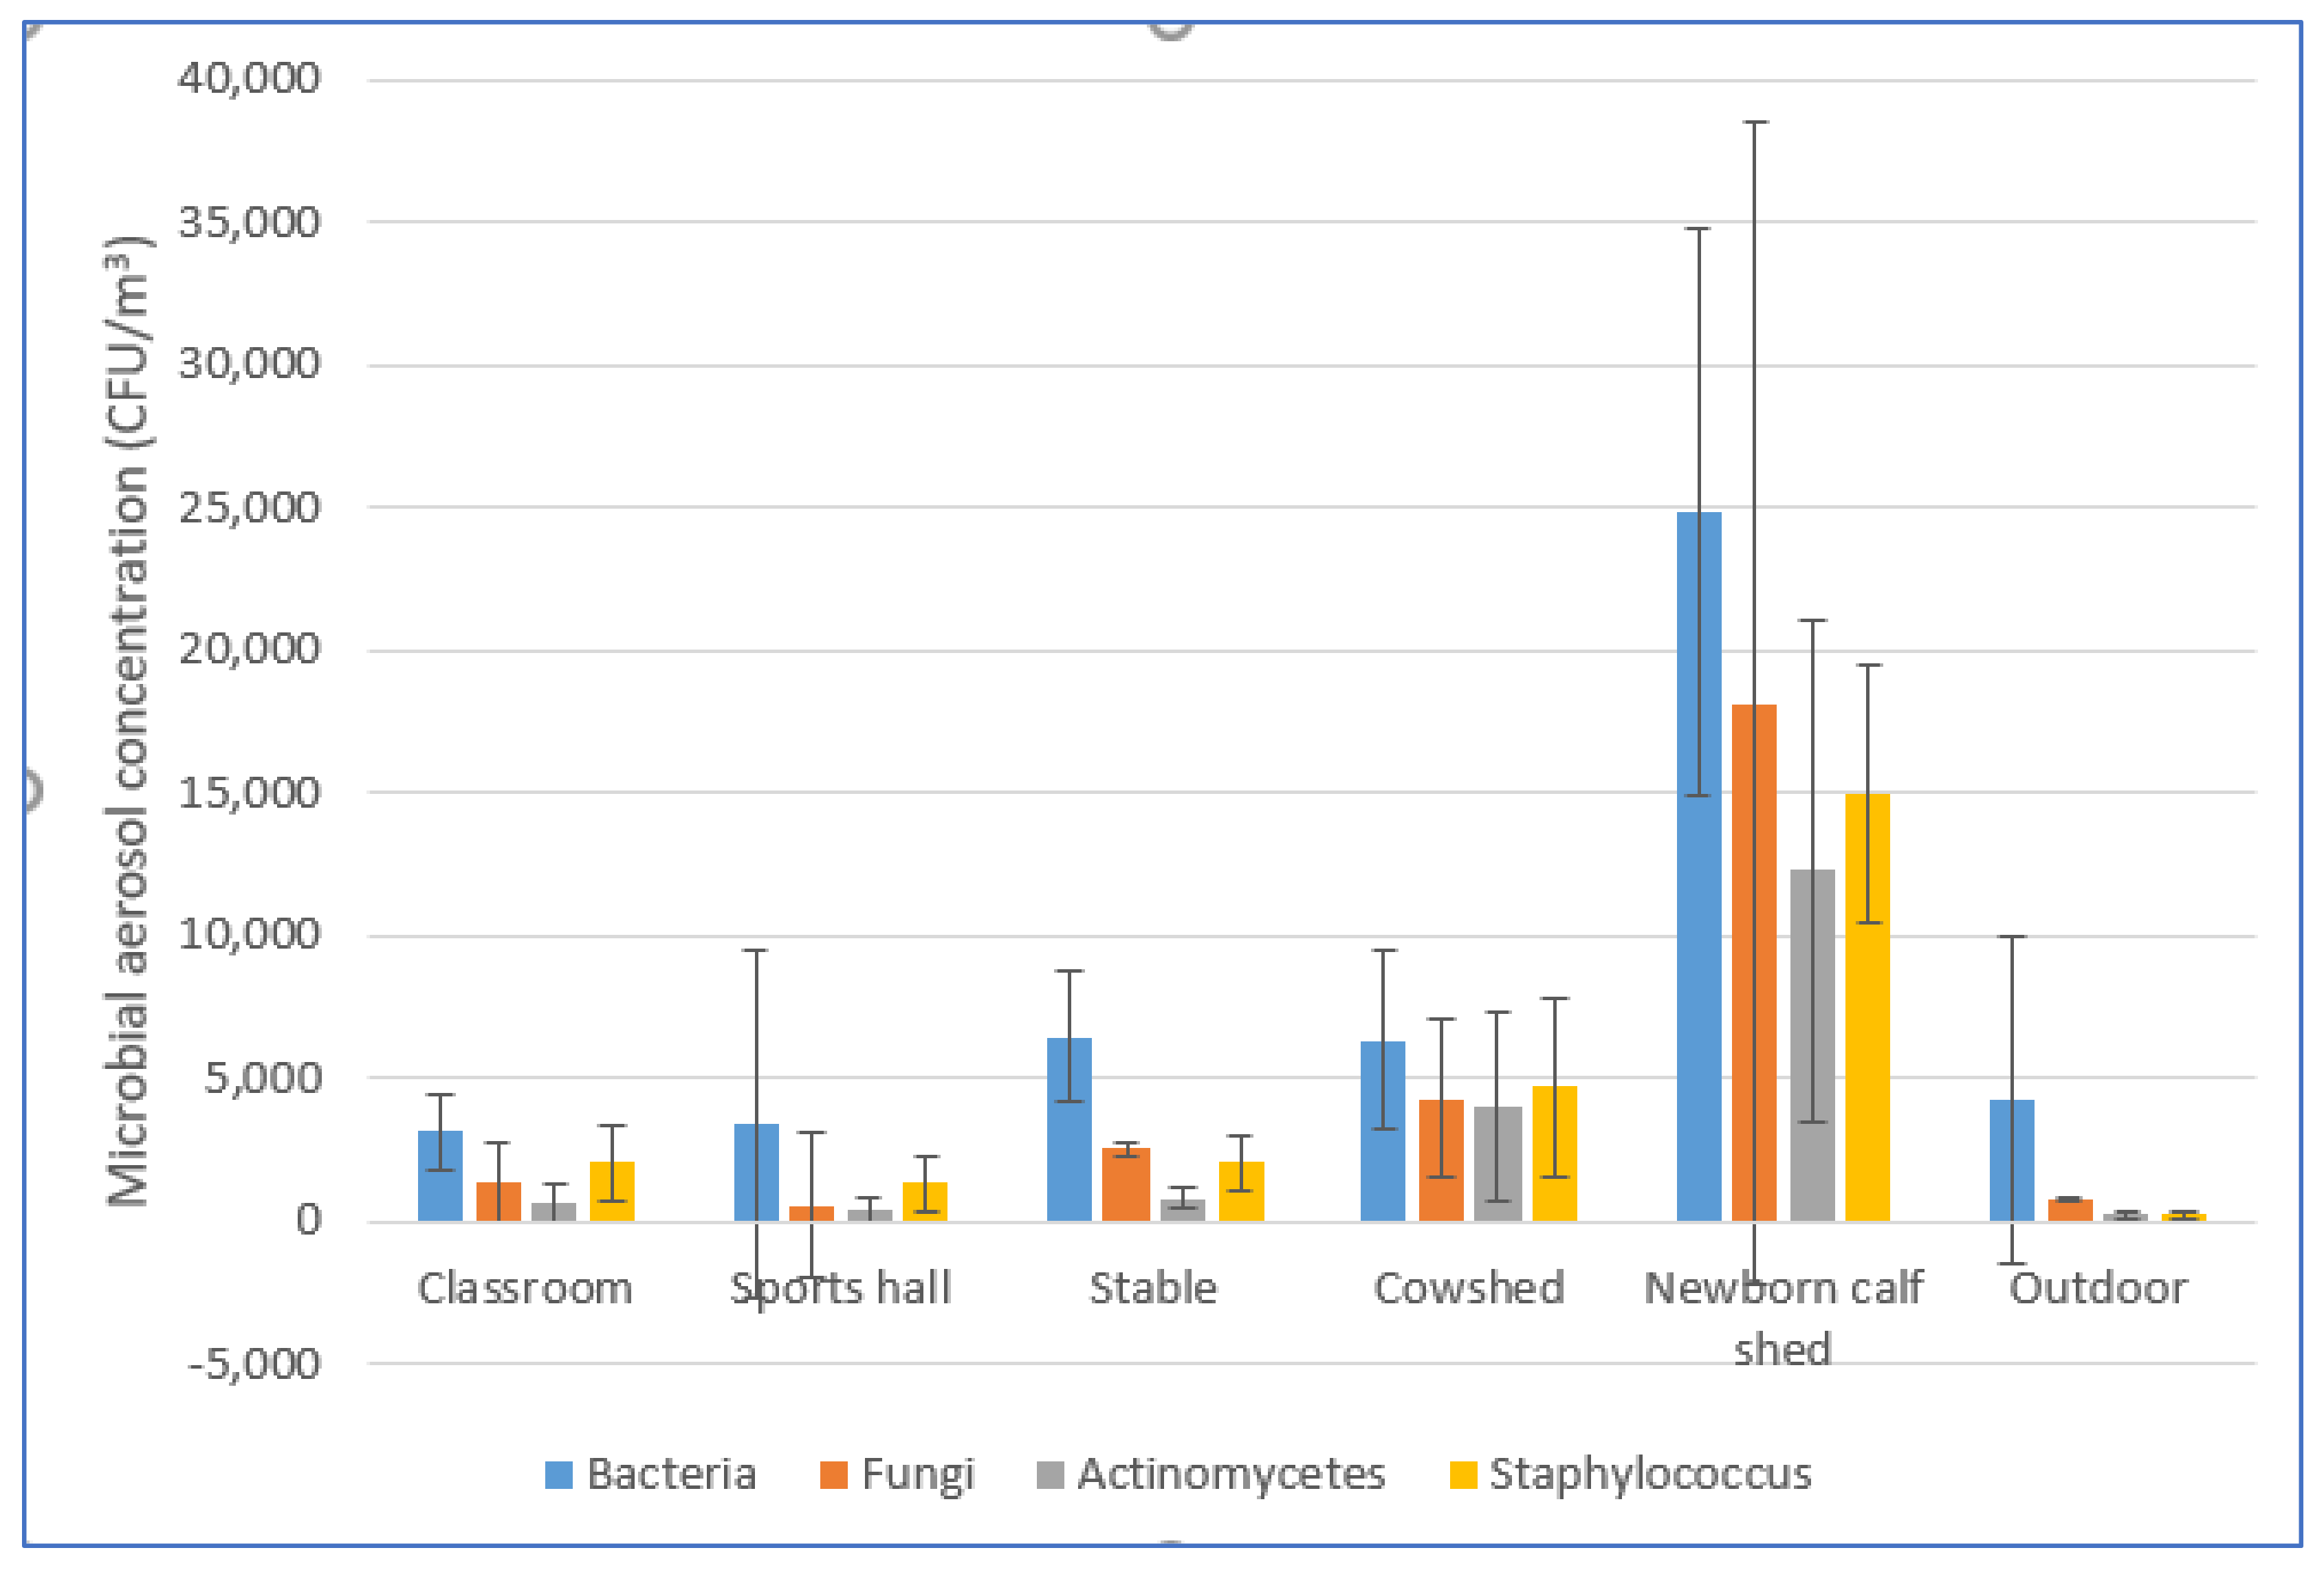
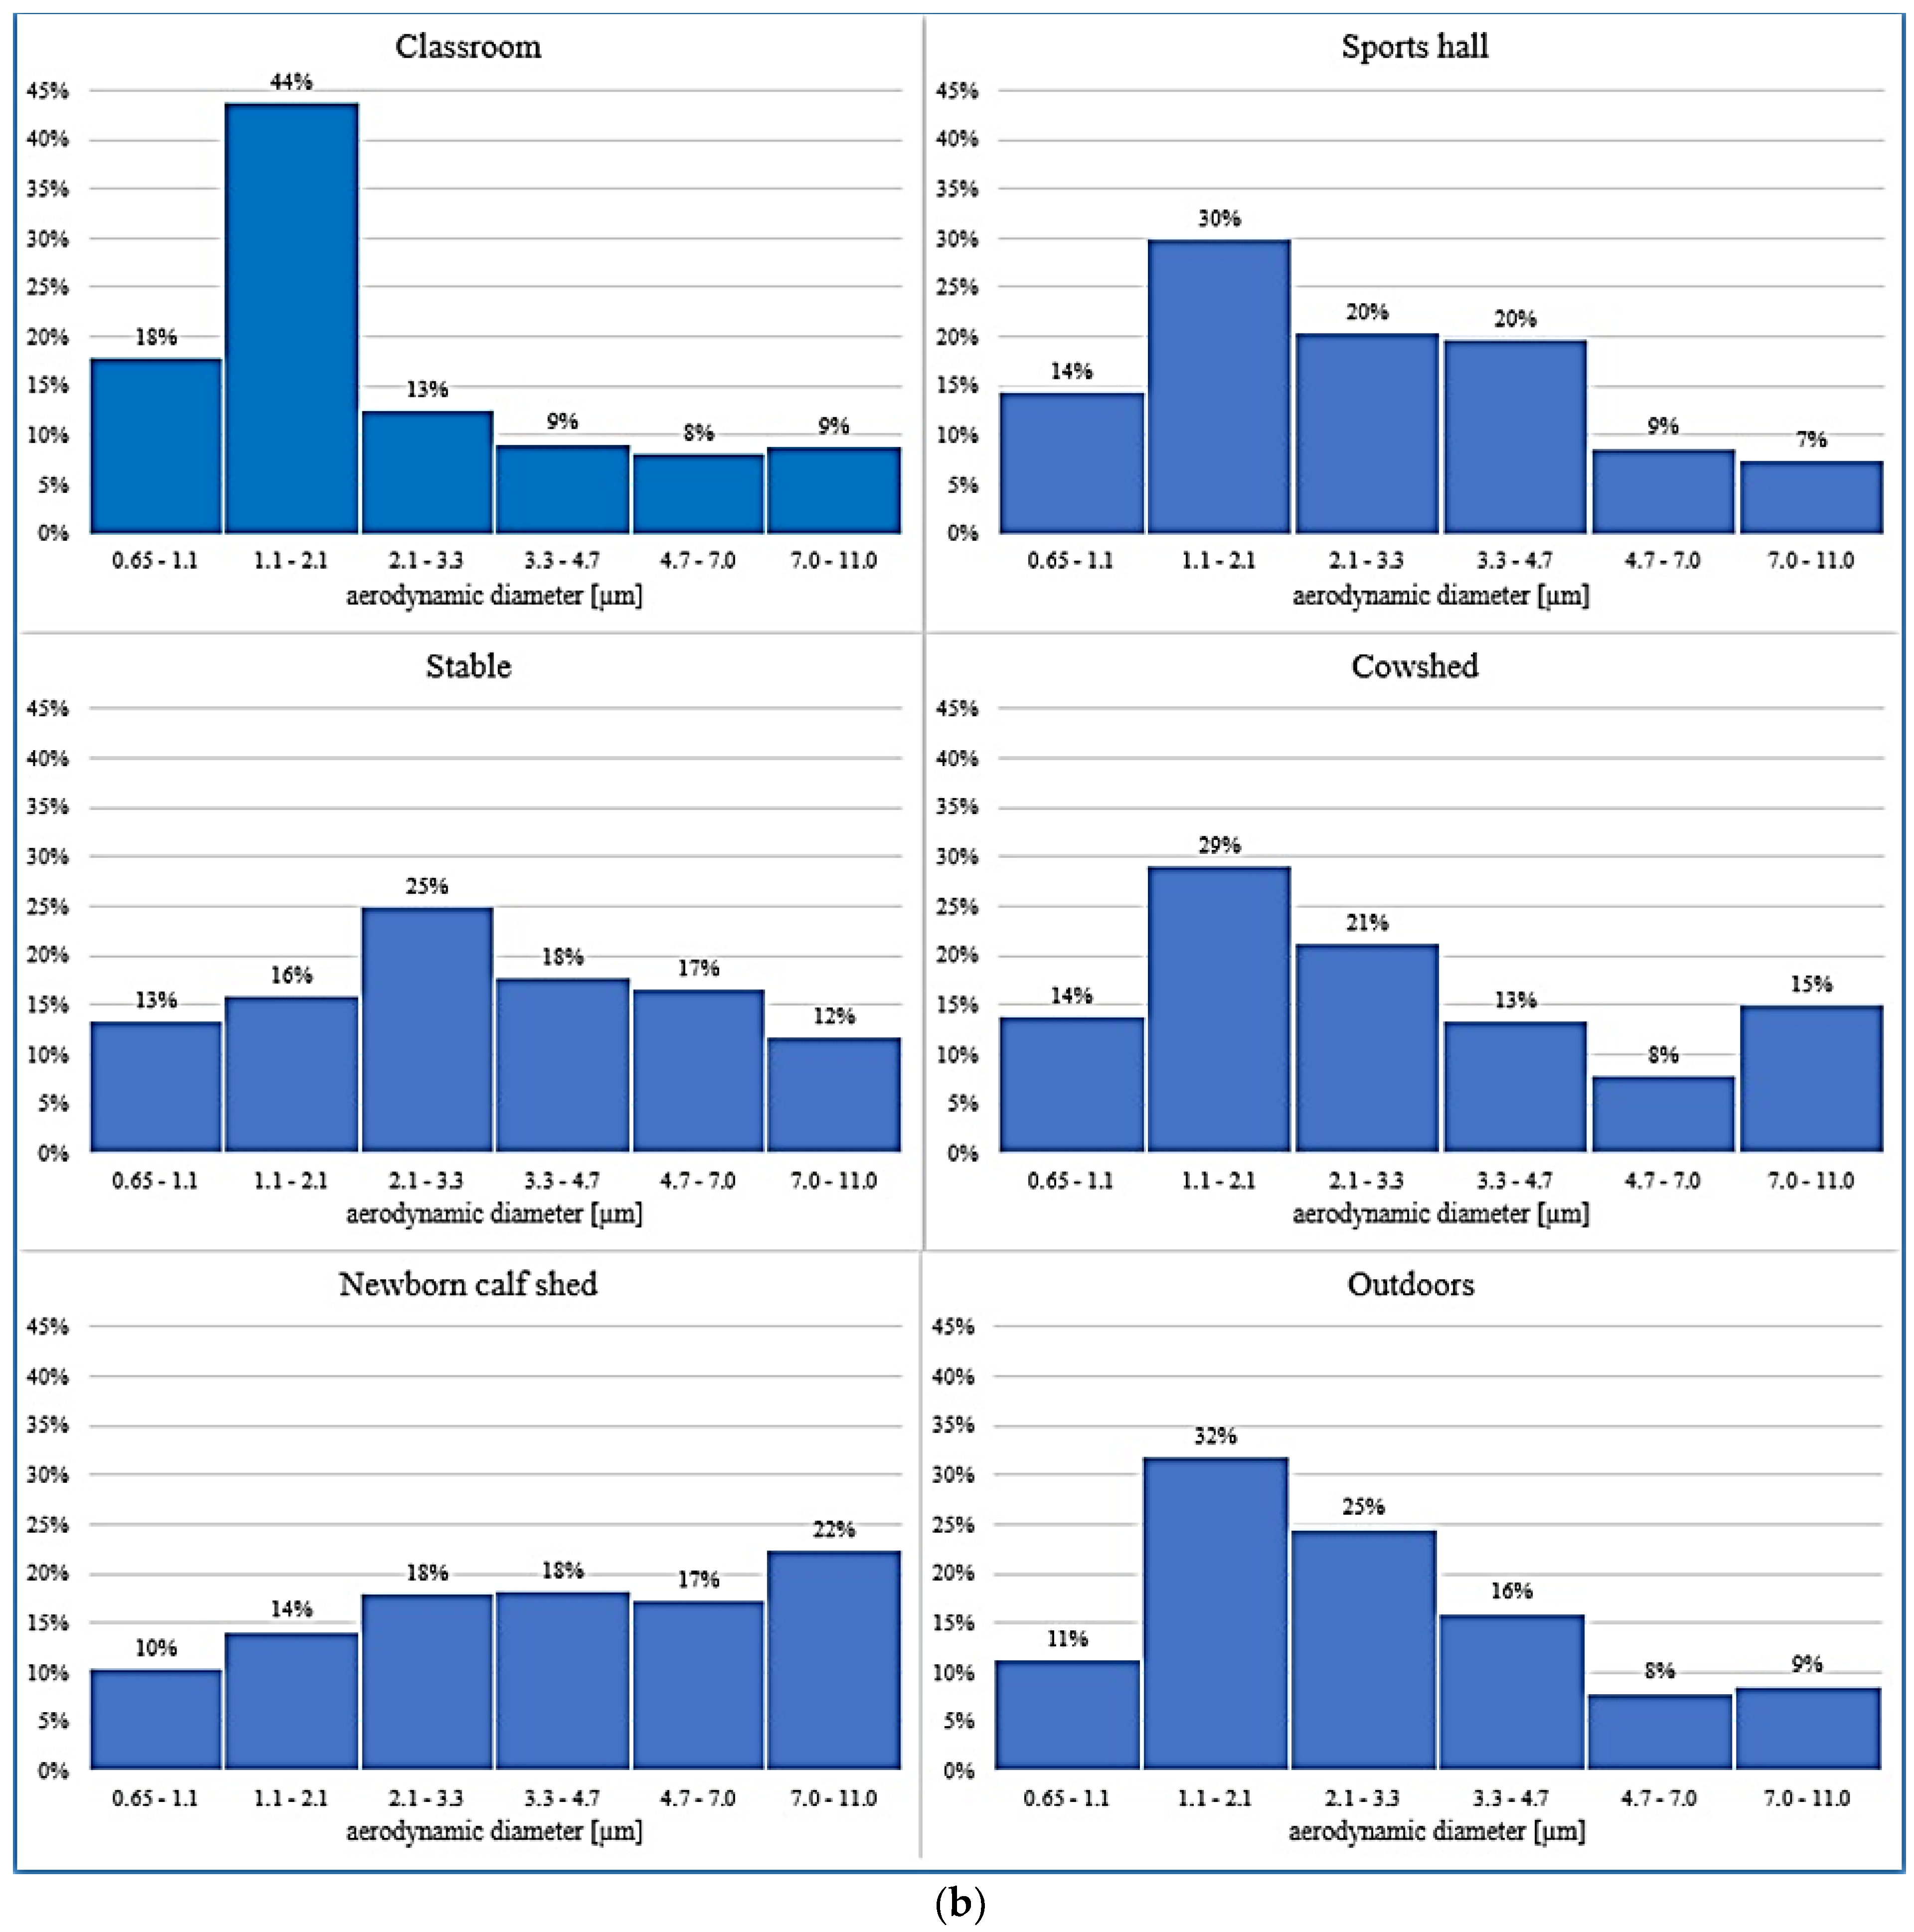
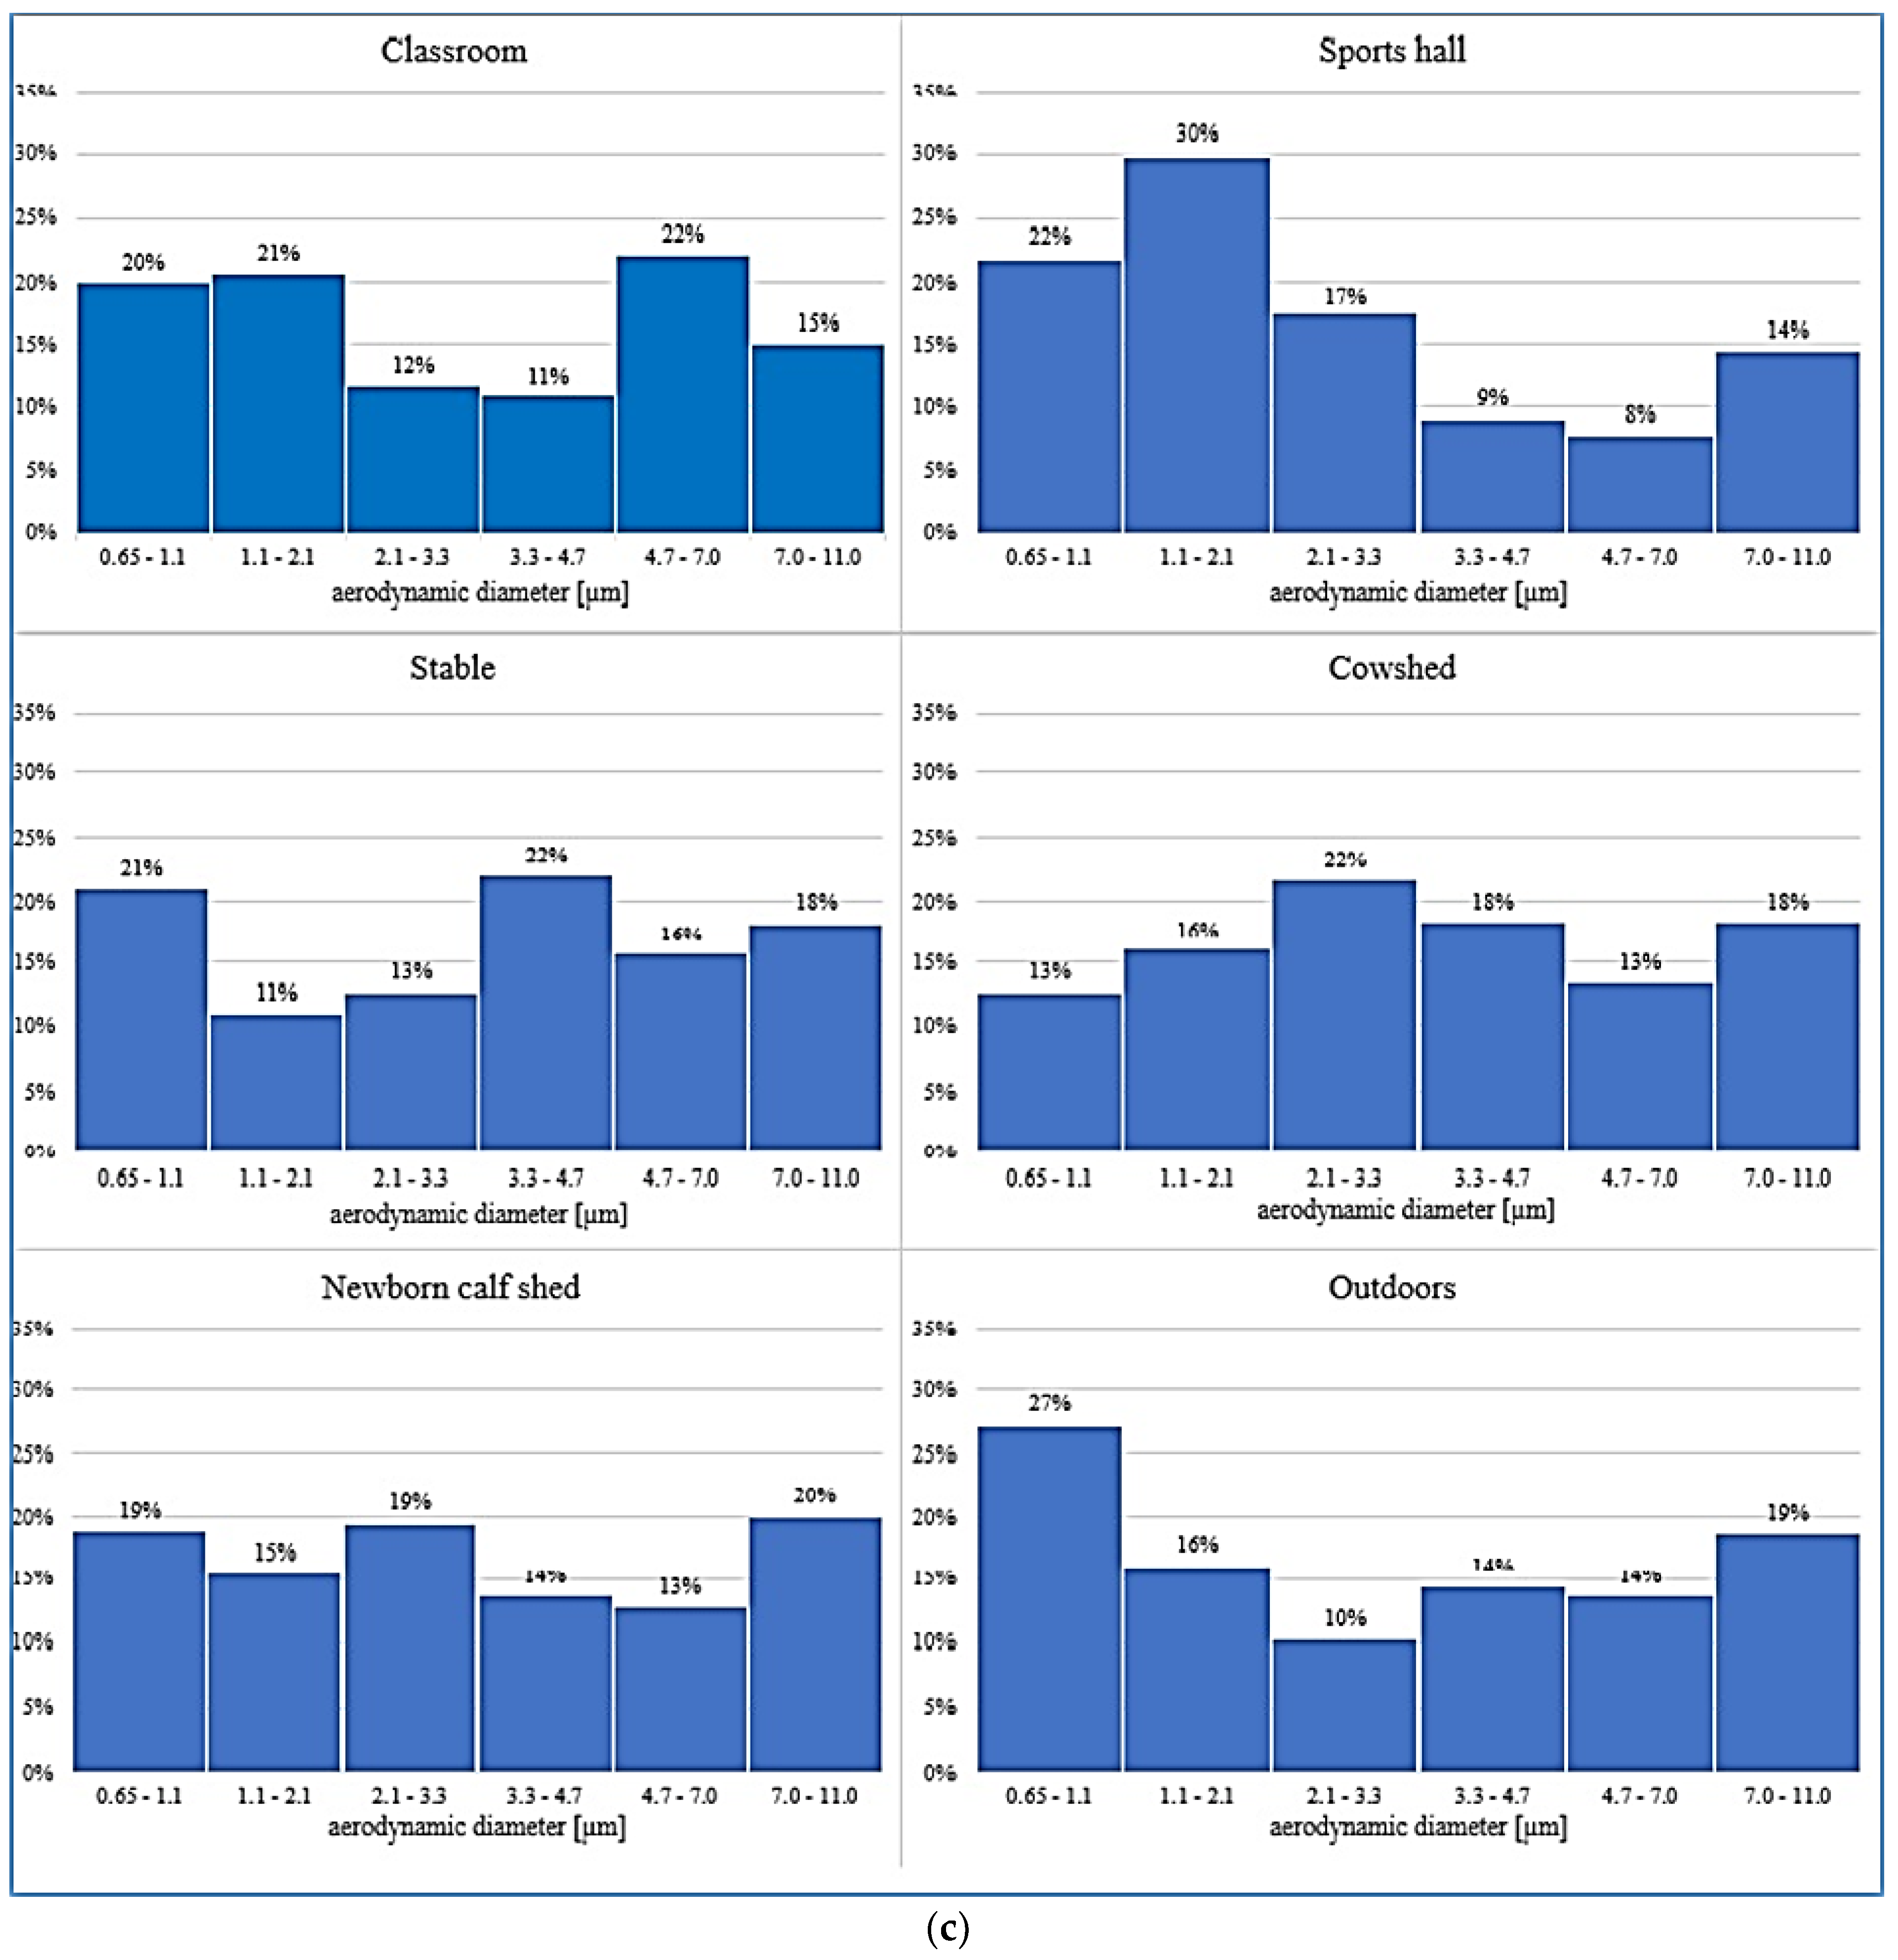
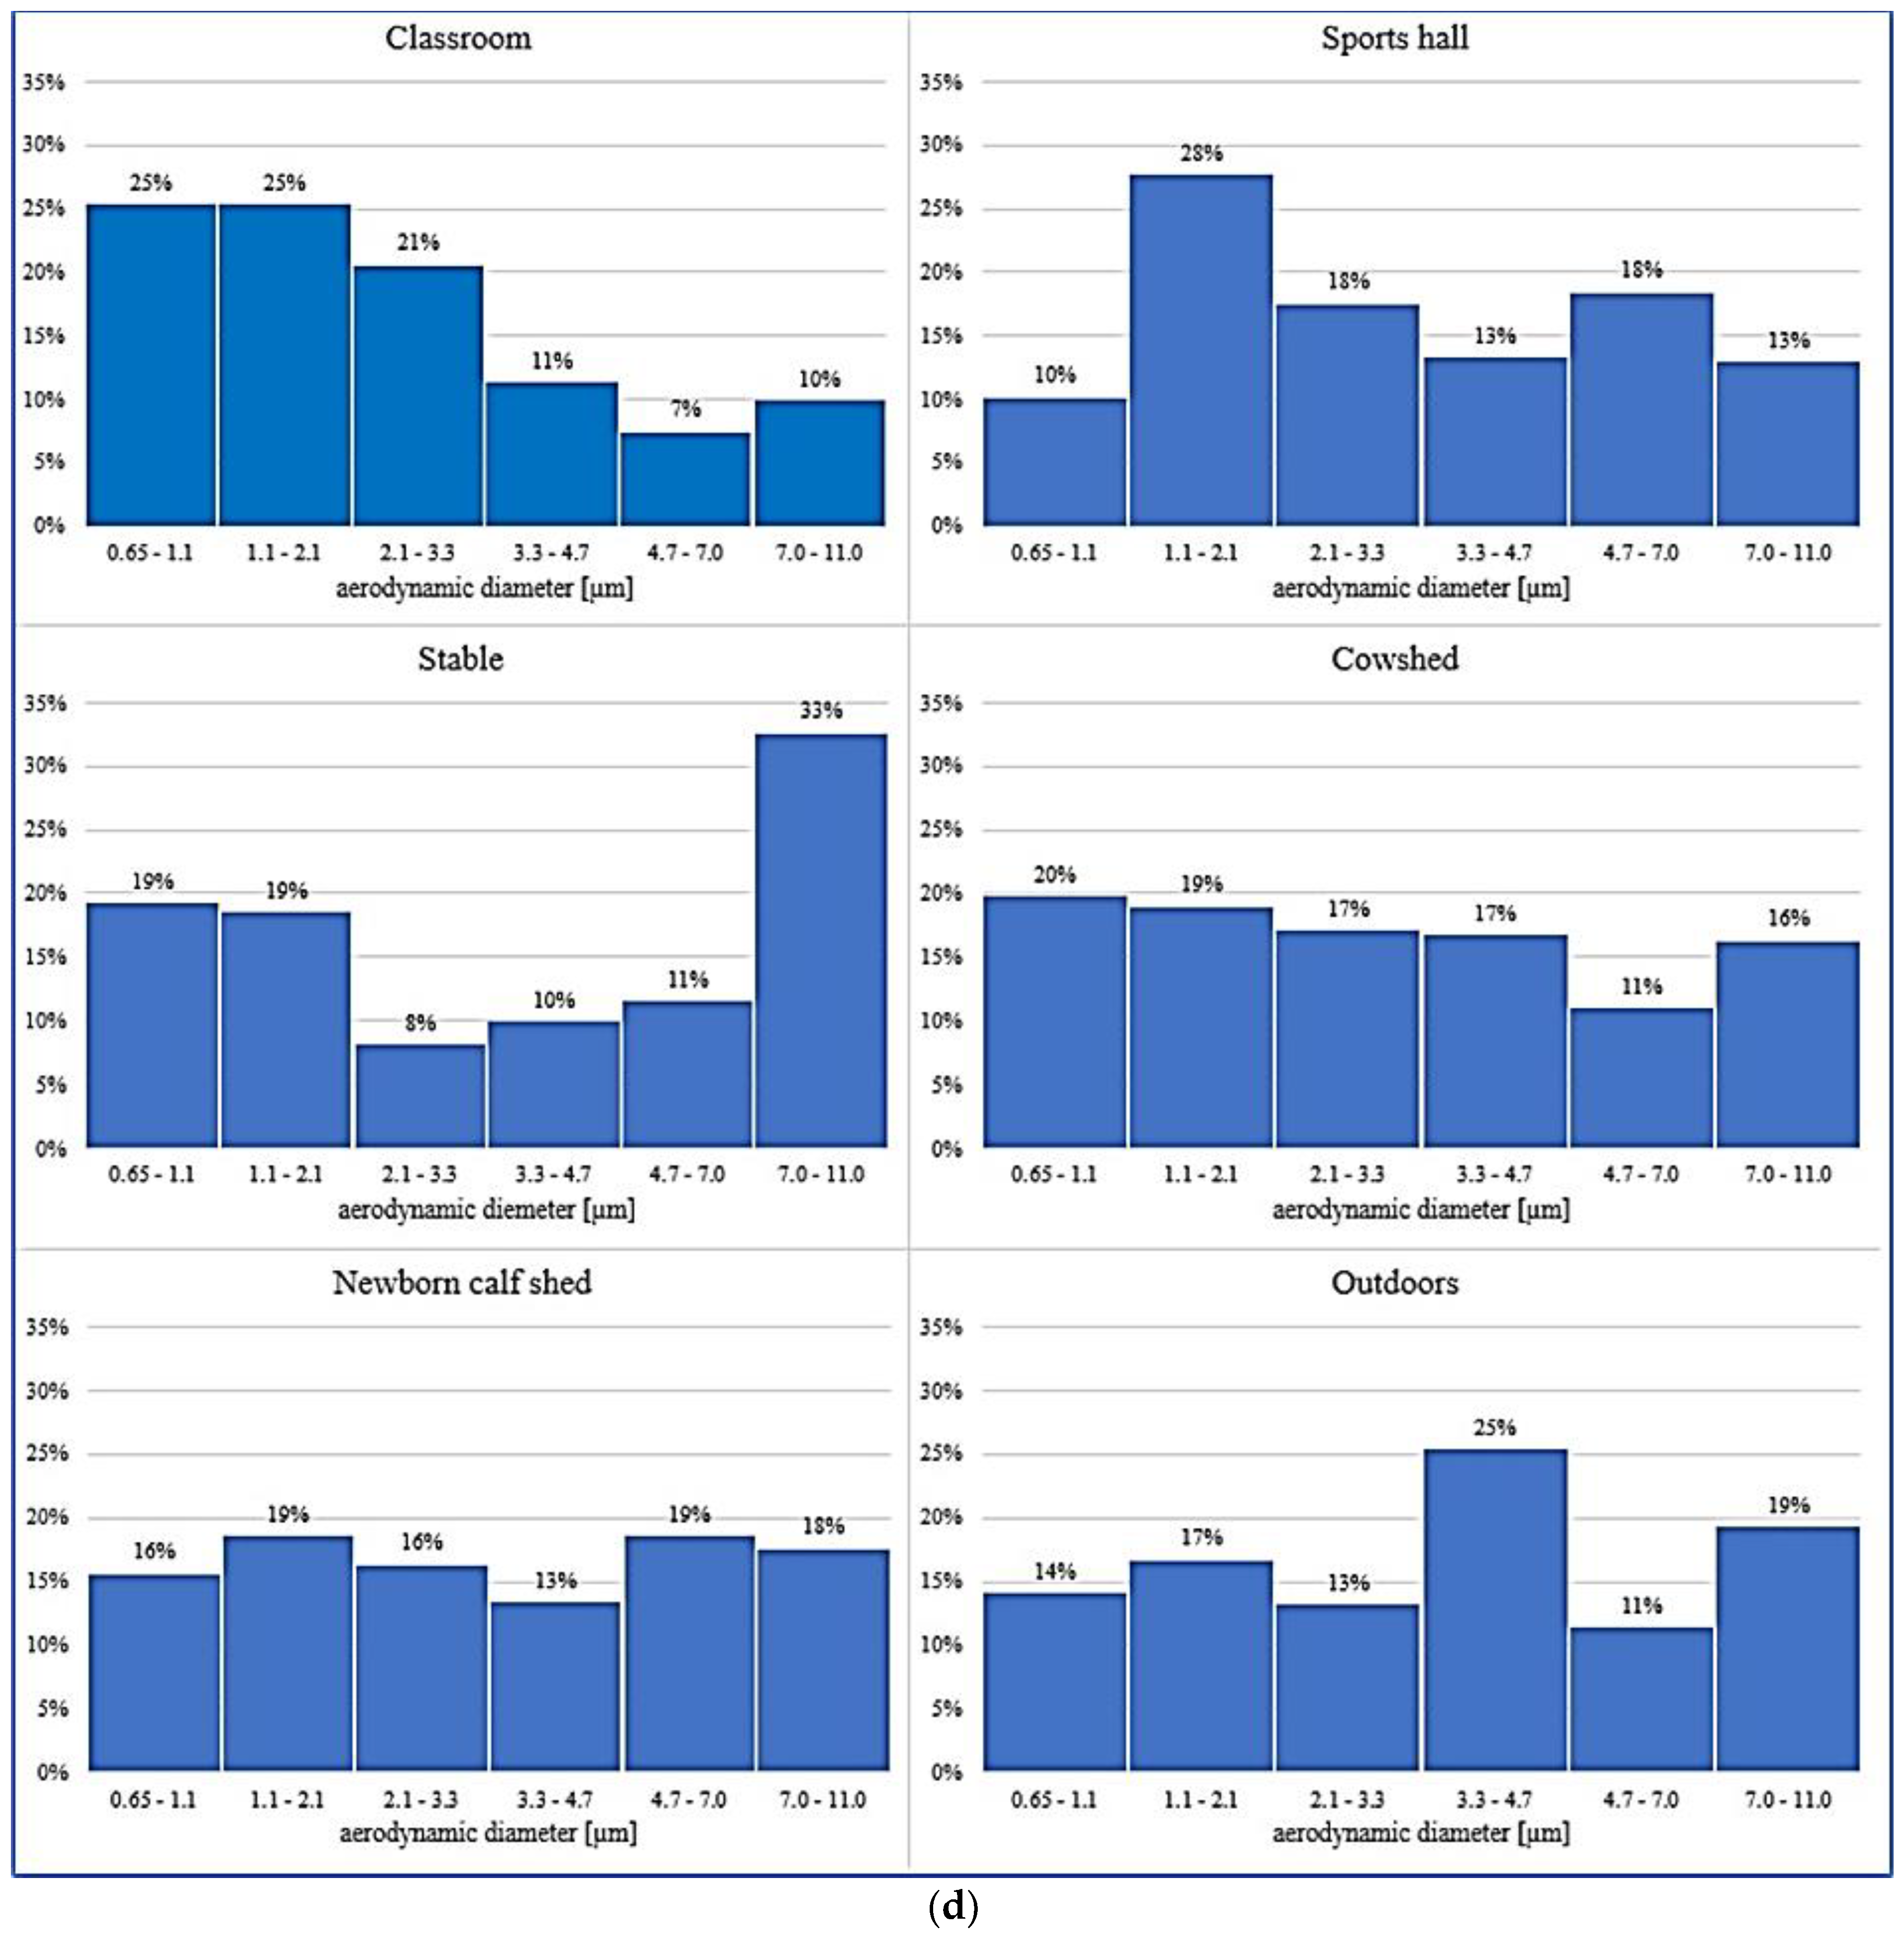
3.3. Bioaerosol Concentration

The presence and counts of microorganisms in the air are determined by numerous factors that may affect their numbers in various manners. In this study, we observed significant differences in the numbers of examined microbial groups, both between the location of the sampling site and season of the year. The mean results of microbial aerosol measurements in the examined premises are summarized in Table 4 and Figure 3.
Bioaerosol concentration indoors largely depends on the intended use of the facility. The results of this study showed that the concentration of aerosol in rooms with animals was much higher than in the case of other points. The concentration of bioaerosol in livestock buildings ranged from 306 to 48,219 CFU/m3, whereas in the public utility rooms it ranged from 37 to 6572 CFU/m3 and in outdoor air it ranged from 37 to 12,725 CFU/m3. The highest concentrations of all groups of microorganisms were recorded in the newborn calf shed. Such high bioaerosol concentration in this facility may be due to housing conditions which may be improved. The high number of cow infants in a relatively small area coupled with lack of proper ventilation promotes the growth of bacteria and even disease spreading among newborn calves. Moreover, in the cowshed and in the horse stable where animals are considered as the main source of microbial contamination of air [5], the concentrations of microbial aerosol components (mainly bacteria) were rather high (e.g., the concentration of bacterial aerosol ranged from 1720 to 15,383 CFU/m3 in the horse stable and from 3746 to 10,821 CFU/m3 in the cowshed, whereas in the classroom bacterial aerosol range of 1543–4384 CFU/m3 was observed). In outdoor air, the concentration of microorganisms was smaller than the one recorded in livestock premises (e.g., bacteria ranged from 951 to 12,726 CFU/m3), therefore, it may be assumed that the main sources of microbial contamination were located inside the examined buildings, which is otherwise than stated by Ropek and Frączek [5] who suggest that the microbiologically contaminated livestock buildings may become sources of contamination of atmospheric air in their surroundings.
The number of bacteria was visibly higher than other microorganisms and differed significantly between the examined sites (Kruskal–Wallis test H = 12.04, p = 0.0342). The highest mean concentration of bacteria was recorded in the newborn calf shed (24,804 CFU/m3, Figure 3). Such high concentrations of these microorganisms in this type of room may be due to the fact that in order not to expose the calves to low temperatures, which could adversely affect their health, the door and windows are constantly closed and this prevents the room from being ventilated. Additionally, the newborn calf shed was where the highest concentration of bacteria of the entire study (i.e., 36,796 CFU/m3 in the summer) was recorded. Concentrations of bacteria observed in the cowshed and horse stable were also high, which may be attributed to the presence of animals, their secretions and the activities related to maintenance of animals [5]. In the case of all livestock rooms, higher concentrations of bacteria were observed in the winter to spring seasons. The air temperature in this period ranged from 7.0 to 17.0 °C and the relative humidity ranged from 53.6 to 83.6%. High water activity, which is associated with increased relative humidity, is usually beneficial for the growth and survival of microorganisms in the air as bacteria can absorb water and use it for metabolism. Moreover, an increase in air humidity may contribute to the aggregation of bacterial cells, which increases their chances of survival [32]. The decrease in bacterial aerosol concentration during the summer period is due to the fact that the animals spend most of their time outdoors during the day and the buildings themselves are more intensively ventilated than in autumn and winter because of low temperatures outside. The obtained results indicate that the time of year in which the test was carried out is one of the factors affecting the concentration of bacterial aerosol in the livestock housing. Nevertheless, the results obtained in our study were lower than those obtained by other researchers. For example, Ropek and Frączek [5] observed the concentration of the total number of bacteria at the level of 8600 to 267,454 CFU/m3 in cowsheds, while Jo and Kang [33], during research in pig housing, recorded the concentration of bacterial aerosol in the range of 32,931 up to 133,887 CFU/m3 and 279,559 CFU/m3 in poultry houses. The numbers of bacteria in public utility rooms (classroom and sports hall) as well as outdoors were clearly lower than in the livestock premises. Mean bacterial aerosol concentration in the classroom was 3113 CFU/m3, whereas in the sports hall it was 3426 CFU/m3. The quality of outdoor air may have a direct effect on the indoor air quality. The contaminants characteristic of a given outdoor environment may enter the rooms while airing and determines the indoor air quality [21]. The bacterial aerosol concentrations observed in this study were similar to the results of other researchers. Basińska and Michałkiewicz [34] in their research conducted in one of the schools in Poznań, recorded the concentrations of bacteria ranging from 1560 to 3120 CFU/m3. Prędecka and Kosut [21], while examining the air quality at the Main School of Fire Service by using the MAS100 air sampler, recorded the concentration of bacteria in the classroom at the level of 6085 CFU/m3, while in the sports hall 9436 CFU/m3 was observed. The observed levels of bacterial aerosol did not exceed the threshold limit value set by the ZECB for the working environment, which is 100,000 CFU/m3 in the organic dust contaminated premises, while for the public utility rooms it should not exceed 5000 CFU/m3.
Mold fungi were the second most numerous group of microorganisms detected in the studied premises. Their mean concentrations ranged from 5518 to 18,152 CFU/m3 for livestock buildings and from 531 to 1357 CFU/m3 for the public utility rooms. The differences in the fungal aerosol concentration between the examined premises were statistically significant (Kruskal–Wallis test H = 16.04, p = 0.0067). The concentrations of fungi indoors were particularly higher during winter and spring season, which may be associated with reduced ventilation and thus higher relative humidity values indoors (Spearman’s correlation coefficient R = 0.19 for p = 0.375), which in the winter–spring season ranged from 53.6 to 83.5% in livestock premises and from 44.8 to 63.4% in public utility rooms. Another factor that could have contributed to higher fungal concentrations could be lower temperatures (R = −0.36, p = 0.083). Similar relationships were observed by Bulski and Korta-Pepłowska [35] in a reptile store. Although the highest temperatures recorded in summer should theoretically promote the growth of microorganisms, fungal aerosol indoors decreased during this season. However, similar results were obtained by Ropek and Frączek [5] in their studies in livestock rooms and they observed a strong increase in fungal aerosol in winter. Furthermore, Roussel et al. [36] observed much higher concentrations of fungal aerosol in winter. In our study, the increased fungal aerosol concentrations along with the lower temperature in colder seasons may be due to the fact that the examined premises are only naturally ventilated (i.e., by opening doors and windows), which in practice means that the doors and windows are hardly ever opened during cold seasons, resulting in nearly no ventilation. The possible sources of fungi in the examined animal premises may be associated with the presence of animal feed, feces and litter along with the activities related to animal maintenance, i.e., changing litter, providing feed and disposal of animal feces. In the case of school premises, the possible sources of indoor fungi may include people present indoors or building materials, particularly due to the fact that the school is located in a manor house constructed in the 19th century. The levels of fungal aerosol did not exceed the limit values set by the ZECB for working premises (i.e., 50,000 CFU/m3) or for public buildings (i.e., 5000 CFU/m3).
Actinomycetes were the least numerous group of airborne microorganisms in the studied school premises (Table 3 and Figure 3). However, the differences in their numbers between the examined sites were very clear (Kruskal–Wallis test H = 14.94, p = 0.01). The highest numbers of actinomycetes were observed in the newborn calf shed followed by a cowshed. Manure and composters can act as sources of actinomycetes, but the increased emission of these microorganisms in newborn calf shed and cowshed can result from the activity of animals which, when moving, could cause the secondary rise of microorganisms from surfaces and bedding. These observations were consistent with the results obtained by other researchers, e.g., Ropek and Frączek [5] during their research in cowsheds recorded the concentration of airborne actinomycetes at the level of 91–37,090 CFU/m3. The number of actinomycetes in the indoor air and in the outdoor environment was characterized by high seasonal variability. A significant increase in the number of these microorganisms was observed in spring and summer, while the lowest numbers of these microorganisms were observed in autumn. Higher bioaerosol concentration in these periods may be associated with field work. During mechanical work, the topsoil is damaged and thus actinomycetes can be more intensively released and carried by air currents [37]. In addition, microclimate conditions during spring and summer were more favorable for multiplication of actinomycetes.
The presence of airborne staphylococci may be an indicator of sanitary contamination of air and it may suggest the co-occurrence of potentially pathogenic bacteria, but the staphyloccal contamination itself may significantly threaten human and animal health. The concentration of staphylococcal aerosol differed significantly between the studied locations (Kruskal–Wallis test H = 18.13, p = 0.0028). In livestock premises, staphylococci may originate mainly from the respiratory tract of animals, from their skin and hair as well as from litter or animal feces [28]. Among animal premises, the lowest numbers of airborne staphylococci were observed in the stable (632–2890 CFU/m3) and the highest numbers were observed in the newborn calf shed (8899–19,770 CFU/m3). Similar results were obtained by Szulc et al. [8] during their study in cattle breeding farms. They obtained values ranging from 180 to 8300 CFU/m3. On the other hand, Bulski and Korta-Pepłowska [35] report that the maximum concentration of staphylococci in the rooms with animals of the reptile store was 4199 CFU/m3.
Airborne microorganisms may be the cause of many diseases of the respiratory system of humans and animals [9]. The type of ailments depends primarily on the type and species of the microorganisms and also on their concentrations in inhaled air as well as on the size of particles and their ability to deposit in the respiratory tract [37]. The use of the six stage Andersen impactor enabled the determination of the grain size distribution of the analyzed microbial groups (Figure 4a–d). The grain size distribution varied depending on the sampling site as well as the analyzed microbial groups. Microorganisms with aerodynamic diameters smaller than 4.7 µm are considered a respirable fraction [14]. They deposit mainly in the trachea, primary and secondary bronchi and bronchioles. Particles below 1.1 µm are even able to reach the alveoli from where they can enter into other systems. Information about the place of deposition of bacterial aerosols is of particular importance because it is possible to assess the effects of harmful factors and the type of their adverse health effects on the basis of that information [38]. The percentage of respirable fraction in animal premises ranged from 63.55 to 77.46% and from 62.43 to 83.47% in the school premises. The observed values do not differ much from the values obtained by other researchers. Chien et al. [1], in their research on bioaerosol released from chicken and pig faeces, reported the percentage of the respirable bacterial fraction at the level of 83.5–88.0%. Moreover, Ropek and Frączek [5] documented that this fraction constituted from 37.4 to 72.3% in cattle buildings during research in livestock housing. Brągoszewska et al. [39] in their research conducted in kindergartens, primary and secondary school showed that the respirable fraction of the bacterial aerosol was from 73 to 84%. The values obtained in our study as well as in other studies were very high, indicating significant problems with air quality that may pose a serious health threats to the people exposed to high concentrations of respirable fractions of bacterial aerosol. In the case of fungi, the maximum share of aerodynamic diameters was observed for 1.1–3.3 µm in all premises except from the newborn calf shed. On the other hand, in the case of the newborn calf shed, the highest numbers of airborne fungi were recorded in the diameter of 7.0–11.0 µm. Large fungal and fungal-dust aggregates in this room accounted for over 57% of the total fungal aerosol. The respirable fraction with a diameter below 4.7 µm in livestock buildings was accounted for from 60.46 to 77.34%. Similar results were obtained by Chien et al. [1] during their research in farm buildings and the results showed that the mean share of respirable fraction of fungal aerosol ranged from 74 to 76.6%. Slightly different results were obtained by Bulski and Korta-Pepłowska [35] during their research in a reptile store where they observed the highest concentration of fungi in the diameter range of 4.7–7.0 µm, while the share of respirable fraction of fungal aerosol was negligible. The share of respirable fraction in the school premises ranged from 83.2 to 84.06% and in outdoor air it was 83.57%. The concentration of the respirable fraction above 80% poses a very serious health threats [32]. The size of the spores of actinomycetes ranges from 0.5 to 1.5 µm and varies greatly depending on the species [37]. In our study, the respirable fractions of actinomycetes were high in the case of the school premises (classroom—82%; 69—sports hall) and in the cowshed (73%). The concentration of the respirable fraction of staphylococci in all livestock rooms was at a similar level and ranged from 66.18 to 68.39% of the total staphylococcal aerosol. On the other hand, Bulski and Korta-Pepłowska [35] obtained different results as the maximum concentrations of staphylococci in the animal rooms in the reptile store were within the diameters of 4.7–7.0 µm. Moreover, respirable fraction of S. aureus and MRSA observed by Madsen et al. [10] in pig farms did not exceed 30% of the total concentration of these two bacterial groups. However, in a Chinese hen house, S. aureus was mostly observed within the size ranges of 2.1–3.2 and 0.6–1.0 µm [40]. The obtained grain size distribution results indicate that staying in livestock facilities may be associated with an increased risk relative to the health of people working there due to the relatively high proportion of the respirable fraction.

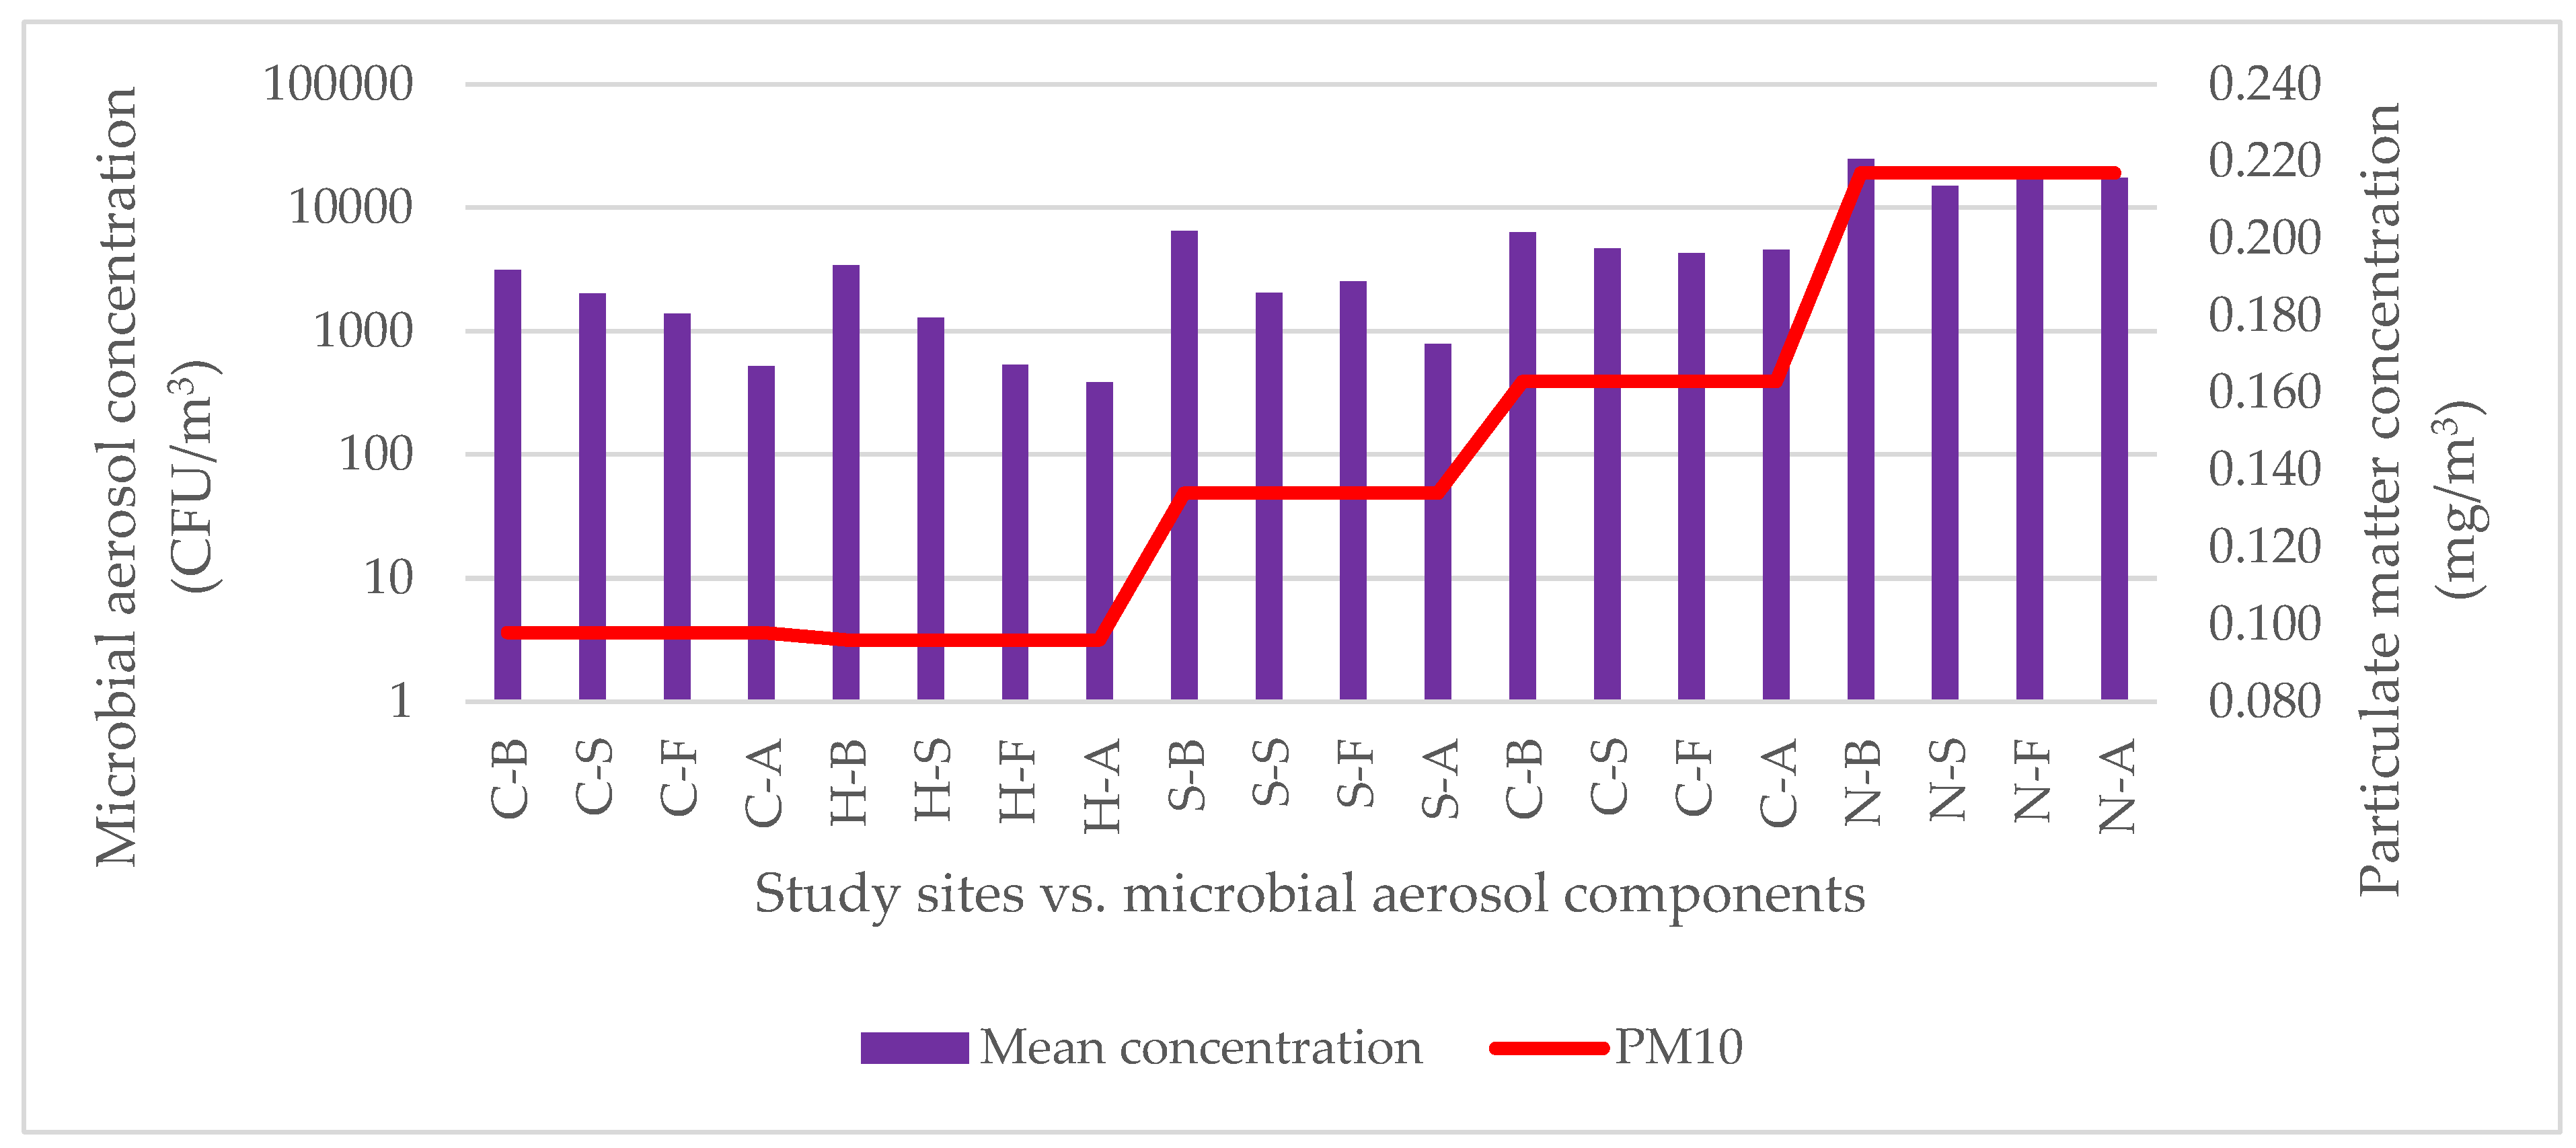
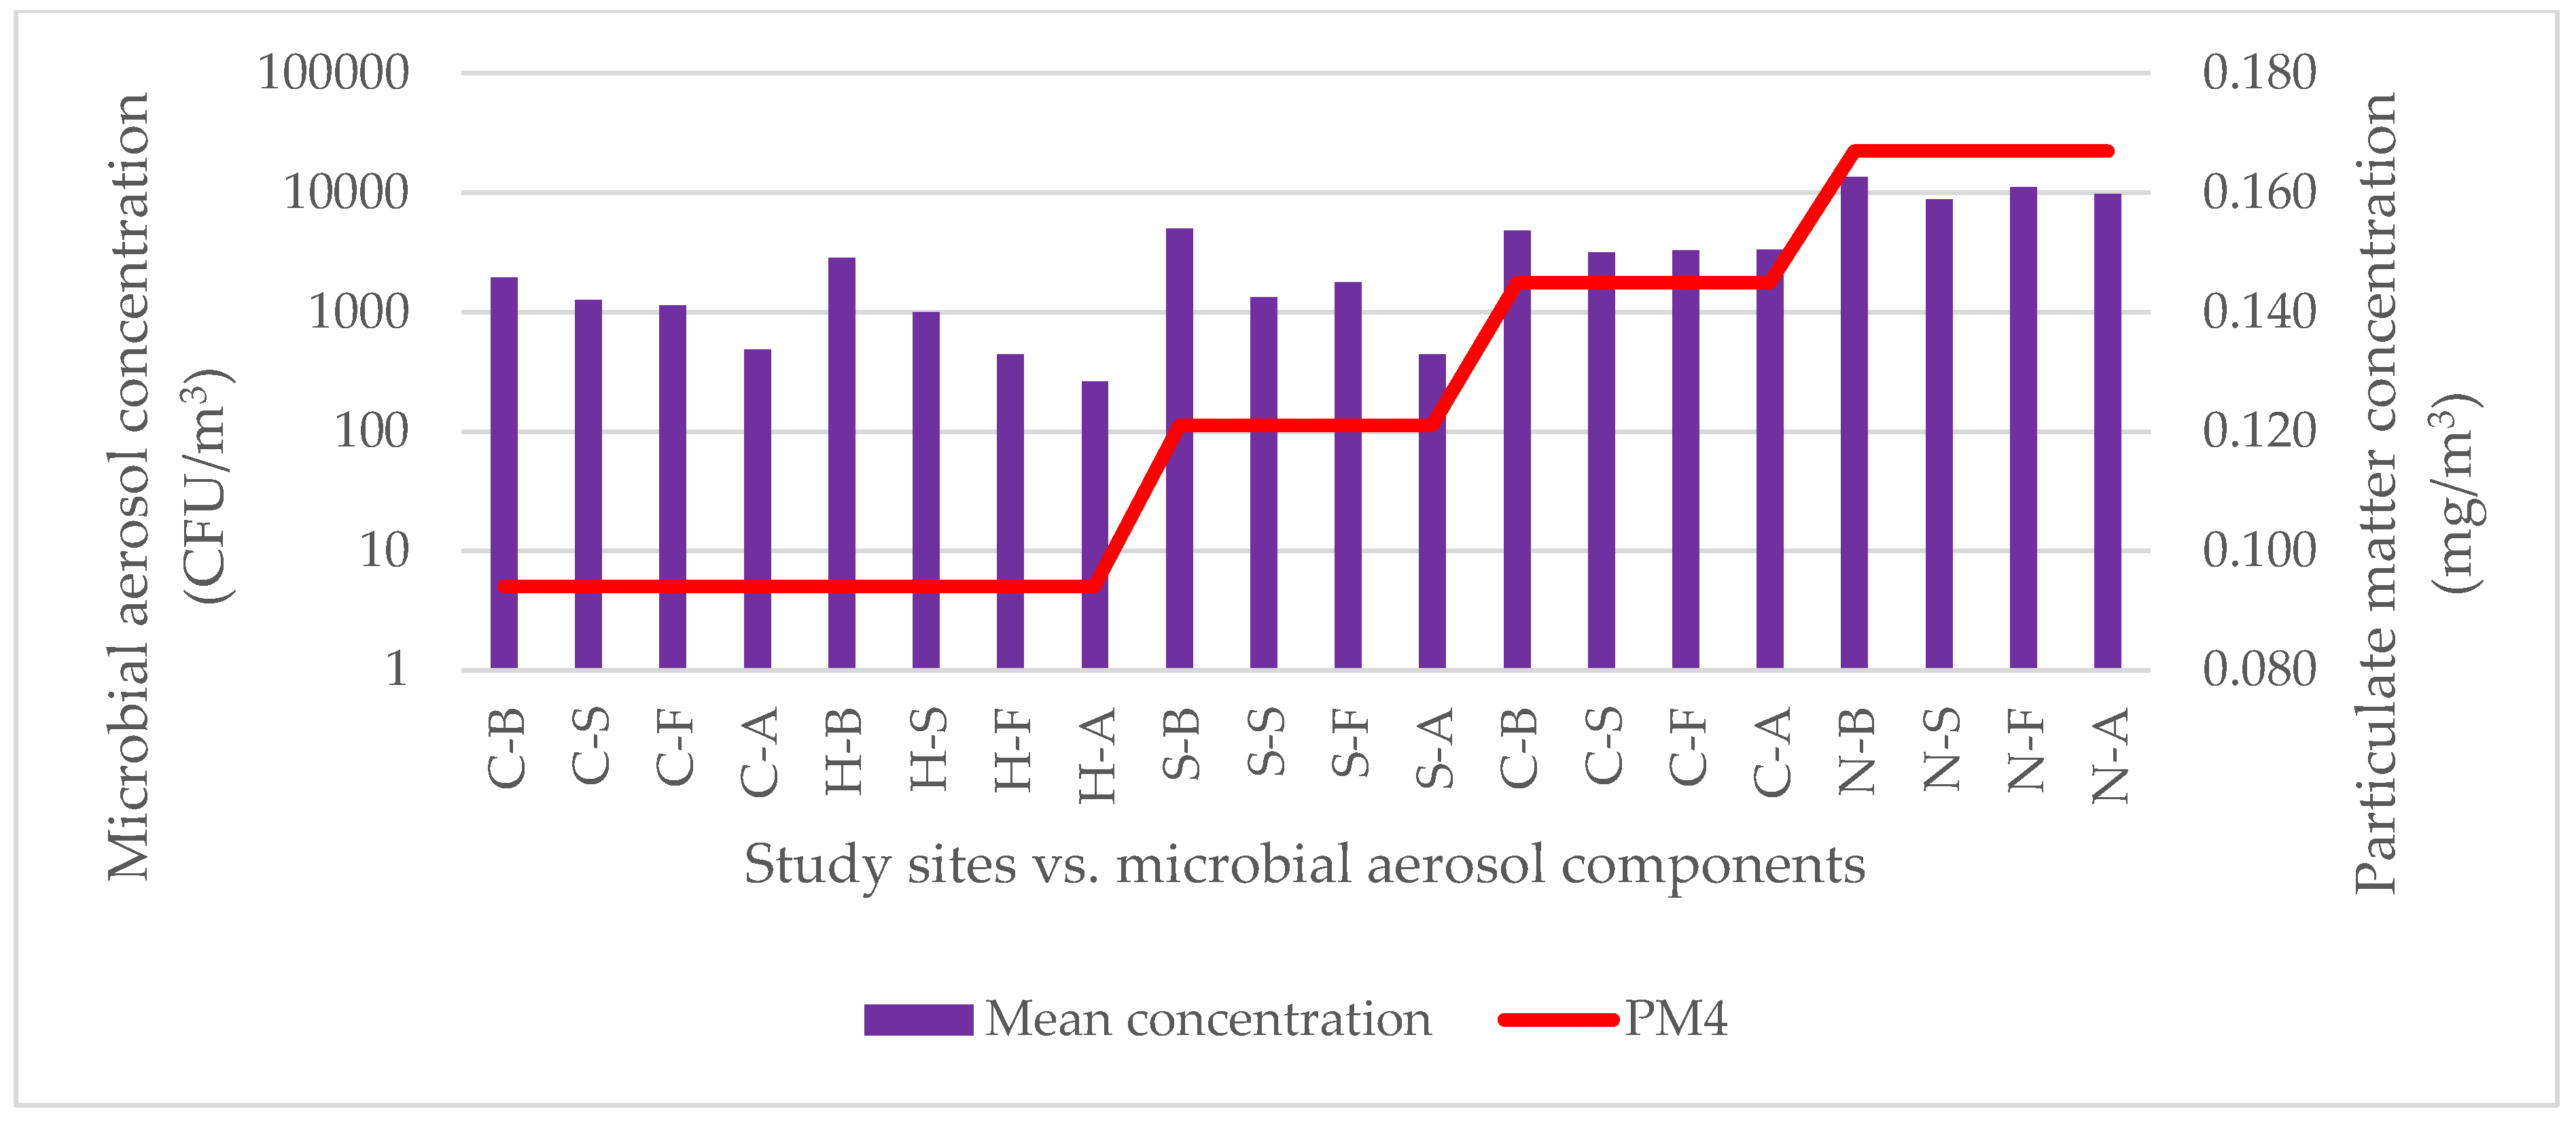
3.4. Bioaerosols vs. Particulate Matter Levels

The dust in livestock housing and its surroundings is usually almost entirely of biological and organic origin. Most often it is composed of a mixture of various solid, liquid and gaseous materials. The dust particles may include, among others, water droplets, animal secretions such as saliva and faeces, fragments of fodder, hair, straw, soil and manure as well as various types of microorganisms [29]. In an environment with increased emission of dust pollutants, numerous microbial cells can be attached to coarse particles of granular aerosol [38]. According to Islam et al. [28], dust particles with a diameter above 2.0 µm present in cowsheds are able to form aggregates with bacteria and fungi. Figure 5 and Figure 6 compare the mean concentration of microbial aerosol and the concentration of respirable fraction of bioaerosol with the concentration of PM10 and PM4. In the livestock rooms where the highest numbers of microorganisms were observed, the concentrations of the analyzed dust fractions were also higher. The relationship between microbial concentrations in the air and solid particles is usually linear [28]. Therefore, the more aerosol particles are suspended in the air, the more bacteria and fungi should be present. However, statistical analysis of correlation did not show any significant relationship between the concentrations of the examined microbial groups with any of the PM diameters (Table 4; p > 0.05). Moreover, Islam et al. [28] did not observe any correlation between airborne microorganisms in dairy barns with particulate matter concentrations. On the other hand, Lee et al. [41] showed that the concentrations of bacteria and fungi were seasonally correlated with the concentrations of solid particles in the air of an agricultural environment.

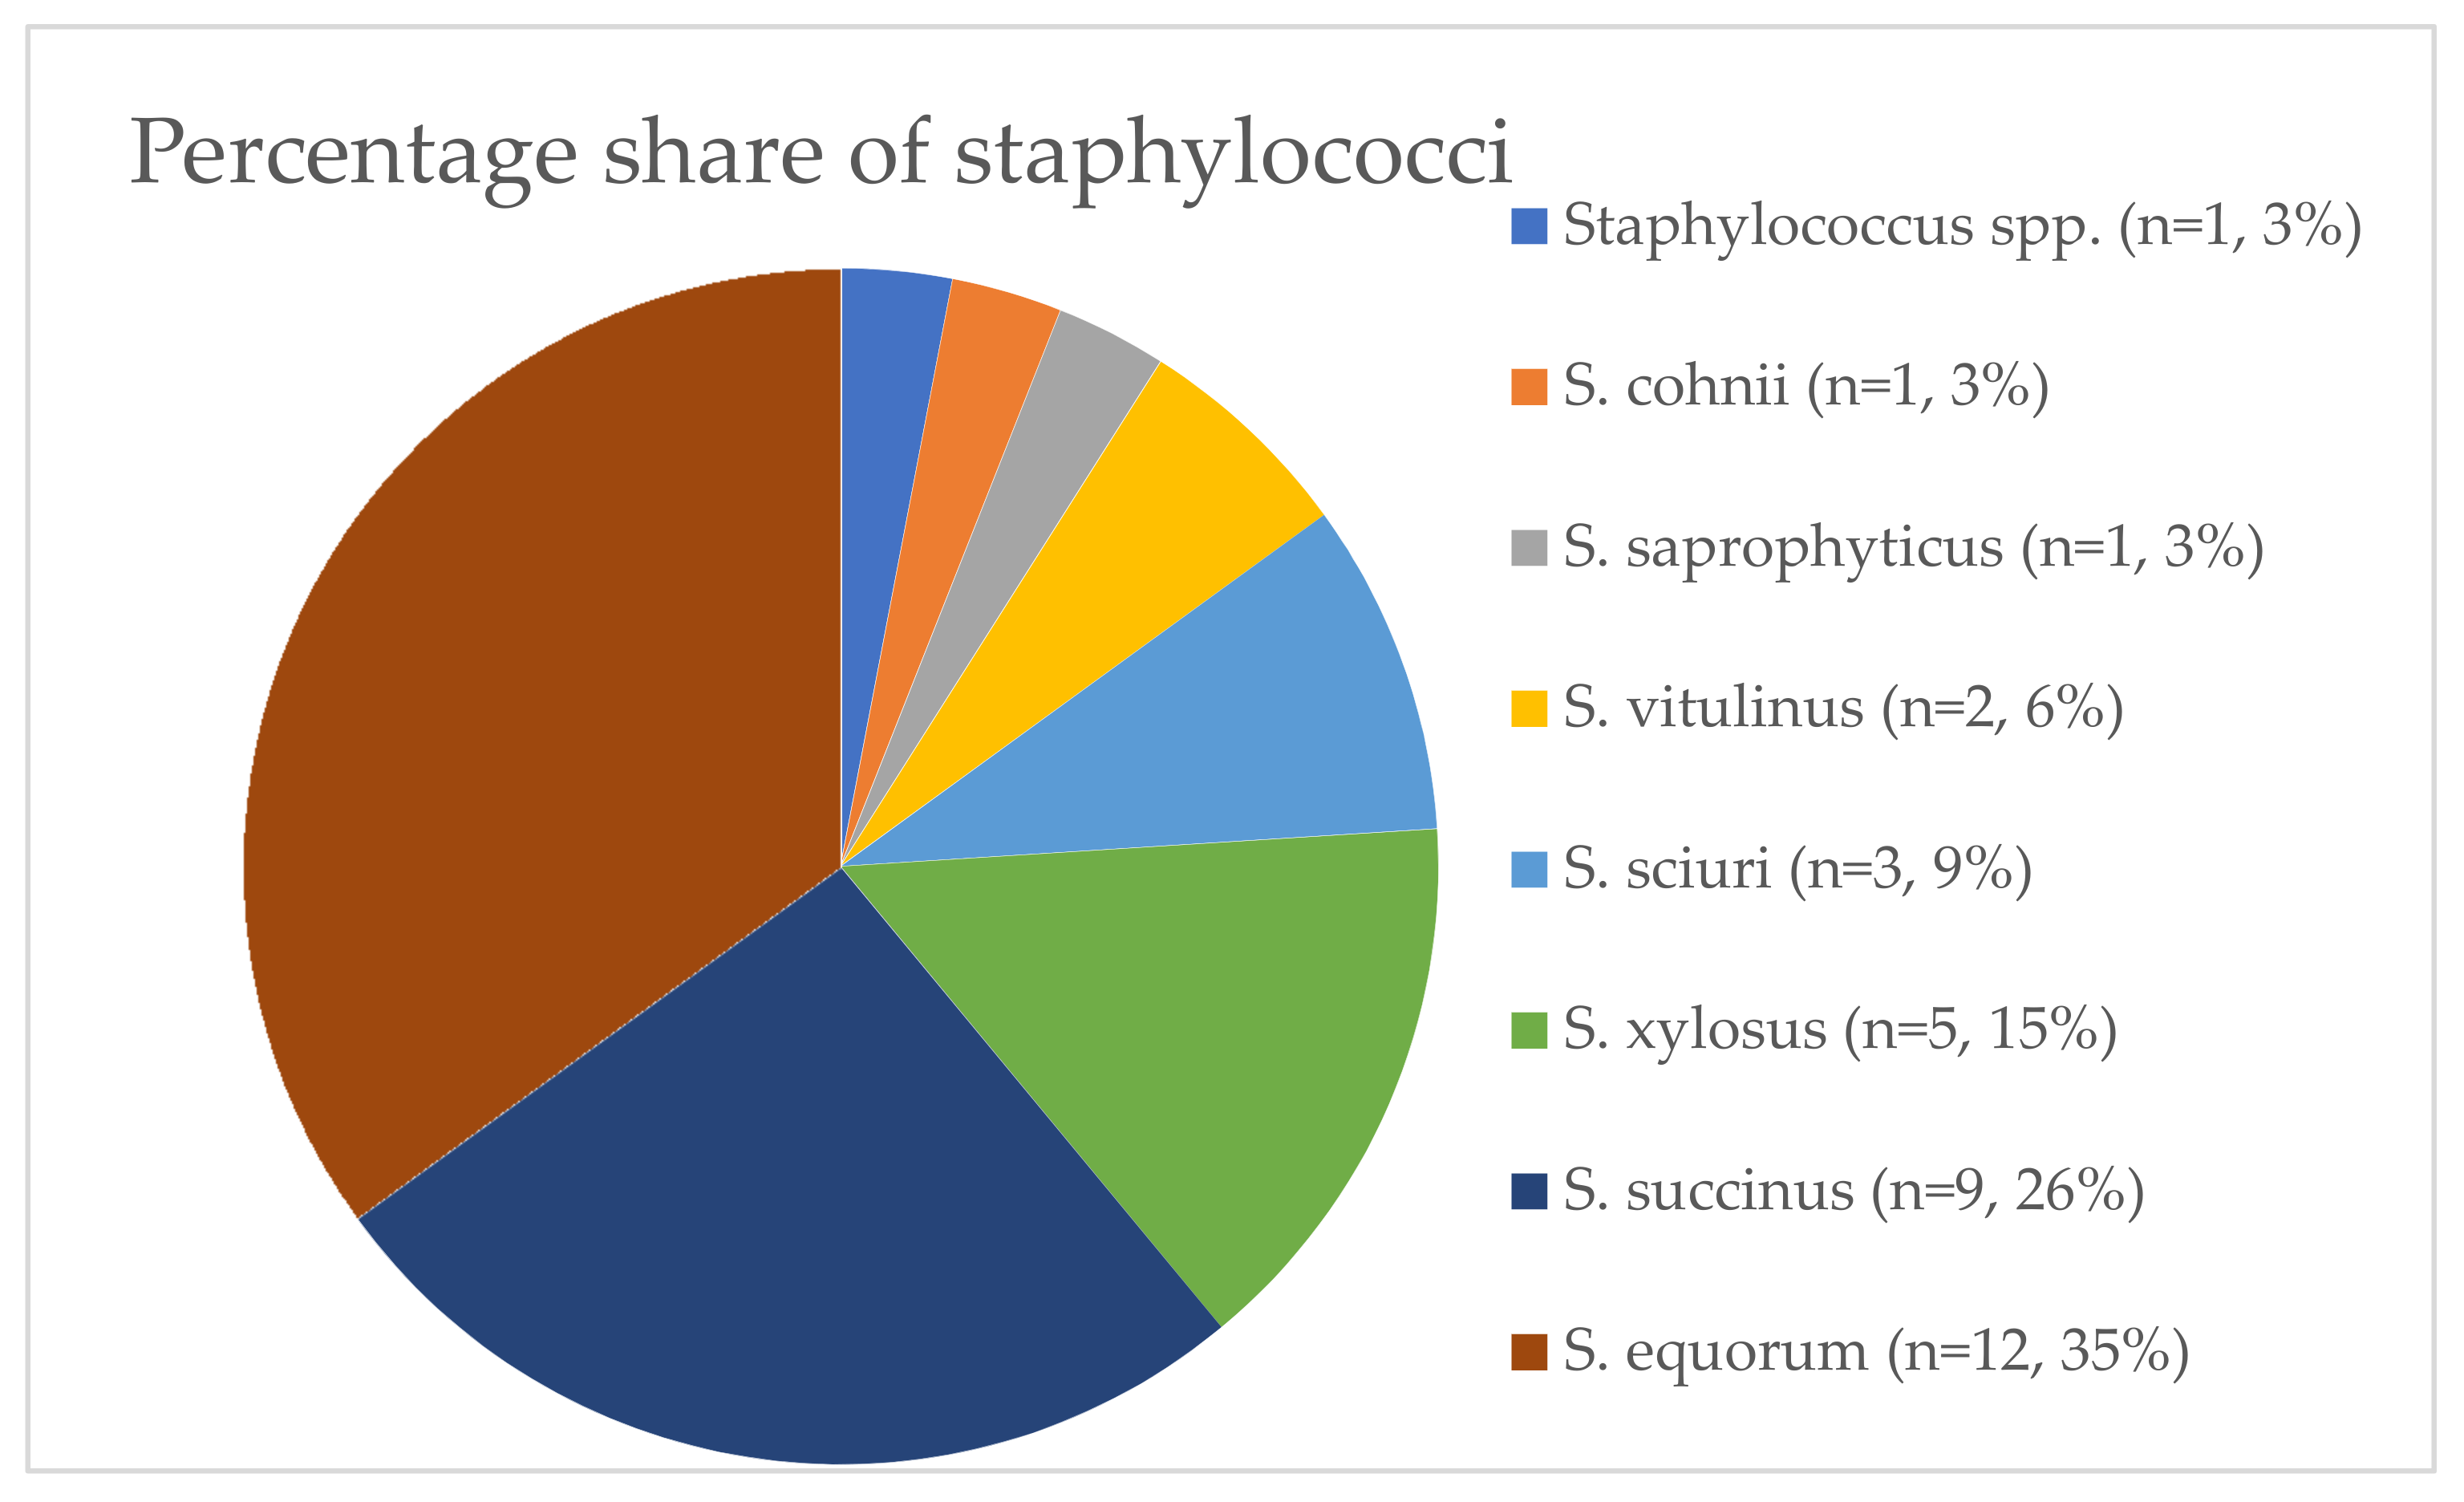
3.5. Species Identification and Antimicrobial Resistance of Staphylococcus spp.

MALDI-TOF mass spectrometry allowed the species identification of 34 strains of staphylococci isolated from the classroom (n = 7), horse stable (n = 5), cowshed (n = 8), newborn calf shed (n = 12) and outdoor air (n = 2). Seven species were identified: S. equorum (n = 12), S. succinus (n = 9), S. xylosus (n = 5), S. sciuri (n = 3), S. vitulinus (n = 2), S. saprophyticus (n = 1) and S. cohnii (n = 1) (Figure 7). One strain was not identified relative to the species level. All identified species are coagulase-negative staphylococci (CoNS) and are commonly found on skin and mucous membranes of different mammals and birds [42]. Although these species are a part of the normal animal microbiota and are generally not considered to be highly virulent, they have been shown to be involved in the etiology of various human and animal infections and have become important pathogens with increasing antibiotic resistance over the past decade. CoNS are also frequently isolated from bovine, goat and sheep milk and dairy products [43]. S. equorum was originally isolated from healthy horses, but there are strains suspected of being involved in bovine mastitis with high prevalence of acquired phenotypes, including antibiotic resistance and hemolysis [44]. S. succinus is typically associated with fermented foods. However, strains resistant against ampicillin, lincomycin and penicillin G have been found in some studies [45]. Although S. xylosus is commonly isolated from animal meat, e.g., from chickens, laboratory mice, pigeons, dogs, pigs, horses and cows, its isolation from human skin is rare. In humans, S. xylosus may play a role in urinary tract infections and, more rarely, may cause endocarditis, pyelonephritis or pneumonia [43]. S. sciuri is considered primarily as an animal species that is commonly present on skin and mucosal surfaces of pets and farm animals and in foods of animal origin. Its clinical relevance increases and S. sciuri has been associated with e.g., endocarditis, peritonitis, septic shock, urinary tract infection or wound infections. What is also important is that this species commonly carries antimicrobial resistance determinants [46]. S. vitulinus is typically associated with animals and food of animal origin, but isolation from humans has been reported as well as the resistance to different antimicrobial agents [47]. S. cohnii has been regarded a commensal bacterium that is commonly found on farms but is not involved in severe animal infections, such as bovine mastitis [48]. Finally S. saprophyticus is the only species widely reported as an opportunistic pathogen. After E. coli, this species is the second most common cause of community-acquired urinary tract infections. It is also a part of normal human microbiota as well as in gastrointenstinal biota of pigs and cows; this may be transferred to humans through food [49].
Disk diffusion tests enabled the determination of the resistance of the examined Staphylococcus spp. strains relative to most commonly administered antibiotics [50] and the detailed results are shown in Table 5. Among the 34 strains, only 15 were susceptible to all antibiotics, whereas 19 (55.88%) were resistant to at least one antimicrobial agent. Out of these, eight strains were resistant to one antibiotic, seven strains were resistant to two antibiotics, one strain was resistant to three antibiotics and three strains were resistant to four antimicrobial agents. The Staphylococcus spp. strains were most commonly resistant to erythromycin (n = 13, 38.23%) followed by clindamycin (n = 11, 32.4%). Only one strain (S. vitulinus which is isolated from the horse stable) was resistant to cefoxitin, indicating its methicillin resistance. Moreover, only one strain was resistant to gentamycin (S. sciuri which is isolated from the cowshed). Although coagulase-negative staphylococci belong to the normal microbiota of human and animal skin and express low pathogenic potential, they can be responsible for serious infections in immunocompromised people. More importantly, as a part of natural human and animal microbiota, antimicrobial resistant strains may be selected during antibiotic therapy and will become a potential source of the resistance genes for pathogenic strains, such as S. aureus [51]. Erythromycin, which proved to be the least affective antibiotic in our study with 38.23% of resistant strains, belongs to the group of macrolide antibiotics and the second least effective antibiotic (clindamycin; 32.4% of resistant strains) belongs to the group of lincosamides. Due to dramatically increasing frequency of methicillin resistance among S. aureus and CoNS, the use macrolides, lincosamides and streptogramins (MLS) is very frequently considered for the treatment of staphylococcal infections [52]. Due to their widespread use, the resistance to macrolides, lincosamids and streptogramins (MLS) is also increasingly reported [52]. Among the 13 erythromycin-resistant strains, seven were also resistant to clindamycin, indicating that MLSB is the constitutive mechanism of resistance, which excludes all MLS antibiotics from therapy. The remaining six strains were susceptible to clindamycin, i.e., they exhibit the MSB phenotype of resistance, and thus excludes 14 and 15-membered macrolides and type B streptogramins [53]. Disturbingly, one of the examined strains exhibited MLSB resistance coupled with methicillin resistance (which also means the resistance to all beta-lactam antibiotics currently used in treatment). The share of MLSB-resistant staphylococci varies between countries, which may reflect national and/or local patterns in antimicrobial usage [54]. Similar to our study, in their study on the occurrence, species distribution and antimicrobial resistance of staphylococci isolated from both pets and farm animals, Bagcigil et al. [54] isolated both methicillin-resistant and erythromycin-resistant staphylococci from horses (50%) and dogs (13%) but not from food animals. They also detected S. sciuri among their isolates and reported the presence of methicillin-resistant S. vitulinus. What needs to be stressed is that the antimicrobial agents and the resistance against which was tested in our study belong to basic and extended antibiogram recommended by the KORLD (Polish National Reference Center on Antimicrobial Susceptibility of Microorganisms [50]). Therefore, they are among the most commonly administered antibiotics used in the treatment of staphylococcal infections and resistance to those antibiotics may result in therapeutic failure.

4. Conclusions

Microbial presence in outdoor and indoor air is inevitable and may constitute a significant health problem. Agricultural schools, such as the one in the subject of our study, are peculiar objects due to the diversity of conditions and factors influencing the particulate matter levels as well as bioaerosol concentration and composition. All premises examined in our study are frequently attended by students, teachers, farm workers or even horse riding learners and instructors. Therefore, it is important to carefully examine the airborne pollution in order to propose the most efficient but also feasible solution to prevent the potential harmful effects of air contamination. The microbial aerosol concentrations did not exceed the threshold values set in Poland for both public utility premises and organic dust contaminated working environment. However, the share of respirable fraction of microbial bioaerosol components was disturbingly high (more than 60% of total bioaerosol), suggesting the possible harmful effects to human and animal health. Although the species composition of airborne staphylococci does not pose a direct threat to the health of people or animals since none of the identified species are major pathogens, their antimicrobial resistance to commonly administered antibiotics is high. This poses the risk of spreading the resistance mechanisms to pathogenic species due to horizontal gene transfer.
What needs to be mentioned is that the culture-based approach used in this study, even though it may be simple and cost-effective, may underestimate the actual bioaerosol concentration because only a small proportion (approximately 10%) of environmental microorganisms can be cultured and identified using the current methods. Moreover, culture conditions, which are generalized in order to allow the growth of the possibly highest number of microorganisms, may still limit the growth of others. Moreover, samples used for particulate matter measurements may also underestimate the actual PM concentrations due to the fact that no sampler is able to collect only particles that are exactly smaller than a given size limit. Particles in animal houses are usually not spherical but possess irregular shapes and various densities. Moreover, particles larger than 10 µm can still penetrate the thorax, but most of them will not be collected by the samplers.
Having all the above in mind, the results of our experiments suggest that gravitational and natural ventilation seem not to be sufficiently effective to ensure the best possible quality of air inside the examined premises. The results obtained in this study could be used by the facility managers while planning future renovations to introduce more efficient mechanical ventilation systems.

Author Contributions

Conceptualization, A.L.-B., D.D. and J.C.; methodology, A.L.-B.; software, A.L.-B. and D.D.; validation, D.D.; formal analysis, D.D.; investigation, A.L.-B., D.D. and J.C.; resources, A.L.-B.; data curation, D.D.; writing—original draft preparation, D.D.; writing—review and editing, A.L.-B. and J.C.; visualization, A.L.-B. and D.D.; supervision, A.L.-B.; project administration, A.L.-B.; funding acquisition, A.L.-B. All authors have read and agreed to the published version of the manuscript.

Funding

This research was funded by the statutory measures of the University of Agriculture in Krakow and granted for the Department of Microbiology, Faculty of Agriculture and Economics (DS 3158/KM).

Institutional Review Board Statement

Not applicable.

Informed Consent Statement

Not applicable.

Data Availability Statement

The data presented in this study are available upon request from the corresponding author.

Acknowledgments

We would like to thank the Director of the Agricultural School (RCKU) in Czernichów, Grzegorz Bylica for the permission to conduct the studies, the Director of the RCKU-Supporting Farm, Juliusz Boroń for providing us with all information needed for the study and for making all farm premises available to us and Iwona Hryniewicz for her support in media preparation and in conducting bioaerosol measurements.

Conflicts of Interest

The authors declare no conflict of interest.

References

  1. Chien, Y.-C.; Chen, C.-J.; Lin, T.-H.; Chen, S.-H.; Chien, Y.-C. Characteristics of microbial aerosols released from chicken and swine feces. J. Air Waste Manag. 2011, 61, 882–889. [Google Scholar] [CrossRef]
  2. Directive 2000/54/EC of the European Parliament and of the Council of 18 September 2000 on the Protection of Workers from Risks Related to Exposure to Biological Agents at Work (Seventh Individual Directive within the Meaning of Article 16 of Directive 89/391/EEC); European Parliament: Brussels, Belgium, 2000.
  3. Douwes, J.; Thorne, P.; Pearce, N.; Heederik, D. Bioaerosol Health Effects and Exposure Assessment: Progress and Prospects. Ann. Occup. Hyg. 2003, 47, 187–200. [Google Scholar] [PubMed] [Green Version]
  4. Dutkiewicz, J.; Cisak, E.; Sroka, J.; Wójcik-Fatla, A.; Zając, V. Biological agents as occupational hazards—Selected issues. Ann. Agric. Environ. Med. 2011, 18, 286–293. [Google Scholar] [PubMed]
  5. Ropek, D.; Frączek, K. Microbiological air quality in livestock farm buildings. Environ. Med. 2016, 19, 16–22. [Google Scholar]
  6. Pavia, D.; Agnew, J.E.; Clarke, S.W. Inhaled aerosols: Deposition and clearance. In Progress Radiopharmacy; Cox, P.H., Mather, S.J., Sampson, C.B., Lazarus, C.R., Eds.; Martinus Nijhoff Publishers: Dordrecht, The Netherlands, 1986; pp. 579–589. [Google Scholar]
  7. Szulc, J.; Otlewska, A.; Okrasa, M.; Majchrzycka, K.; Sulyok, M.; Gutarowska, B. Microbiological contamination at workplaces in a combined heat and power (CHP) station processing plant biomass. Int. J. Environ. Res. Public Health 2017, 14, 99. [Google Scholar] [CrossRef] [Green Version]
  8. Szulc, J.; Okrasa, M.; Dybka-Stępień, K.; Sulyok, M.; Nowak, A.; Otlewska, A.; Szponar, B.; Majchrzycka, K. Assessment of Microbiological Indoor Air quality in cattle breeding farms. Aerosol Air Qual. Res. 2020, 20, 1353–1373. [Google Scholar] [CrossRef] [Green Version]
  9. Plewa-Tutaj, K.; Pietras-Szewczyk, M.; Lonc, E. Attempt to Estimate Spatial Distribution of Microbial Air Contamination on the Territory and in Proximity of a Selected Poultry Farm. Environ. Prot. 2014, 36, 21–28. [Google Scholar]
  10. Madsen, A.M.; Kurdi, I.; Feld, L.; Tendal, K. Airborne MRSA and total Staphylococcus aureus as associated with particles of different sizes on pig farms. Ann. Work Expo. Health 2018, 62, 966–997. [Google Scholar] [CrossRef] [Green Version]
  11. Clauß, M. Emission of Bioaerosols from Livestock Facilities: Methods and Results from Available Bioaerosol Investigations in and Around Agricultural Livestock Farming; Thünen Working Paper, No. 138a; Johann Heinrich von Thünen-Institut: Braunschweig, Germany, 2020. [Google Scholar] [CrossRef]
  12. Evans, C. Bioaerosol Exposures from Three Utah Cattle Operations. Graduate Theses & Non-Theses.112. 2017. Available online: http://digitalcommons.mtech.edu/grad_rsch/112 (accessed on 20 May 2021).
  13. Dave, P.; Mahendra, R.; Pal, M. Etiologic significance of Aspergillus terreus in primary cutaneous mycosis of an agricultural worker. Mol. Microbiol. Res. 2015, 5, 1–4. [Google Scholar] [CrossRef]
  14. Owen, M.K.; Ensor, D.S.; Sparks, L.E. Airborne particle sizes and sources found in indoor air. Atmos. Environ. 1992, 26A, 2149–2162. [Google Scholar] [CrossRef]
  15. Bulski, K.; Frączek, K.; Cendrowska, A.; Chmiel, M.J. Bacteriological Air Quality at Animal Veterinary Practice. Annu. Set Environ. Prot. 2019, 21, 841–945. [Google Scholar]
  16. Harkawy, A.; Górny, R.L.; Ogierman, L.; Wlazło, A.; Ławniczek-Wałczyk, A.; Niesler, A. Bioaerosol assessment in naturally ventilated historical library building with restricted personnel access. Ann. Agric. Environ. Med. 2011, 18, 323–329. [Google Scholar]
  17. Kim, E.; Kim, H.-J.; Yang, S.-M.; Kim, C.-G.; Choo, D.-W.; Kim, H.-Y. Rapid Identification of Staphylococcus Species Isolated from Food Samples by Matrix-Assisted Laser Desorption/Ionization Time-of-Flight Mass Spectrometry. J. Microbiol. Biotechnol. 2019, 29, 548–557. [Google Scholar] [CrossRef] [PubMed]
  18. Wanecka, A.; Król, J.; Twardoń, J.; Mrowiec, J.; Korzeniowska-Kowal, A.; Wzorek, A. Efficacy of MALDI-TOF mass spectrometry as well as genotypic and phenotypic methods in identification of staphylococci other than Staphylococcus aureus isolated from intramammary infections in dairy cows in Poland. J. Vet. Diagn. Investig. 2019, 31, 523–530. [Google Scholar] [CrossRef]
  19. Dubois, D.; Leyssene, D.; Chacornac, J.P.; Kostrzewa, M.; Schmit, P.O.; Talon, R.; Bonnet, R.; Delmas, J. Identification of a Variety of Staphylococcus Species by Matrix-Assisted Laser Desorption Ionization-Time of Flight Mass Spectrometry. J. Clin. Microbiol. 2010, 48, 941–945. [Google Scholar] [CrossRef] [PubMed] [Green Version]
  20. Augustyńska, D.; Pośniak, M. Harmful Factors in the Working Environment—Limit Values. Interdepartmental Commission for Maximum Admissible Concentrations and Intensities for Agents Harmful to Health in the Working Environment; CIOP-PIB: Warsaw, Poland, 2016. (In Polish) [Google Scholar]
  21. Prędecka, S.; Kosut, S. Analysis of microbiological hazards in the indoor air of the selected rooms of the Main School of Fire Service. Zesz. Nauk. SGSP/Szk. Główna Służ. Pożar. 2017, 62, 105–125. [Google Scholar]
  22. Tan, Z.; Zhang, Y. A Review of Effects and Control Methods of Particulate Matter in Animal Indoor Environments. J. Air Waste Manag. 2004, 54, 845–854. [Google Scholar] [CrossRef] [Green Version]
  23. Cyrys, J.; Pitz, M.; Bischof, W.; Wichmann, H.-E.; Heinrich, J. Relationship between indoor and outdoor levels of fine particle mass, particle number concentrations and black smoke under different ventilation conditions. J. Expo. Sci. Environ. Epidemiol. 2004, 14, 275–283. [Google Scholar] [CrossRef] [Green Version]
  24. World Health Organization. Ambient (Outdoor) Air Pollution. Available online: https://www.who.int/news-room/fact-sheets/detail/ambient-(outdoor)-air-quality-and-health (accessed on 17 July 2021).
  25. Traczyk, P.; Gruszecka-Kosowska, A. The Condition of Air Pollution in Kraków, Poland, in 2005–2020, with Health Risk Assessment. Int. J. Environ. Res. Public Health 2020, 17, 6063. [Google Scholar] [CrossRef] [PubMed]
  26. World Health Organization. WHO Ambient Air Pollution Database May 2016; World Health Organization: Geneva, Switzerland, 2016. [Google Scholar]
  27. Regulation of the Minister of Family, Labor and Social Policy of June 12, 2018 on the Maximum Permissible Concentrations of Harmful Factors in the Working Environment (Item 1286); Chancellery of the Prime Minister: Warsaw, Poland, 2018.
  28. Islam, A.; Ikeguchi, A.; Naide, T. Concentration of aerosol numbers and airborne bacteria, and temperature and relative humidity, and their interrelationships in a tie˗stall dairy barn. Animals 2019, 9, 1023. [Google Scholar] [CrossRef] [Green Version]
  29. Cambra-Lopez, M.; Aarnink, A.J.A.; Zhao, Y.; Calvet, S.; Torres, A.G. Airborne particulate matter from livestock production systems: A review of an air pollution problem. Environ. Pollut. 2010, 158, 1–17. [Google Scholar] [CrossRef] [PubMed]
  30. Takai, H.; Pedersen, S.; Johnsen, J.O.; Metz, J.H.M.; Groot Koerkamp, P.W.G.; Uenk, G.H.; Phillips, V.R.; Holden, M.R.; Sneath, R.W.; Short, J.L.; et al. Concentrations and emissions of airborne dust in livestock building in Northern Europe. J. Agric. Eng. Res. 1998, 70, 59–77. [Google Scholar] [CrossRef] [Green Version]
  31. Winkel, A.; Mosquera, J.; Groot Koerkamp, P.W.G.; Ogink, N.W.M.; Aarnink, A.J.A. Emissions of particulate matter from animal houses in the Netherlands. Atmos. Environ. 2015, 111, 202–212. [Google Scholar] [CrossRef]
  32. Brągoszewska, E.; Pastuszka, J.S. Influence of meteorological factors on the level and characteristics of culturable bacteria in the air in Gliwice, Upper Silesia (Poland). Aerobiologia 2018, 34, 241–255. [Google Scholar] [CrossRef] [PubMed] [Green Version]
  33. Jo, W.-K.; Kang, J.-H. Exposure levels of airborne bacteria and fungi in Korean swine and poultry sheds. Arch. Environ. Occup. Health. 2005, 60, 140–146. [Google Scholar] [CrossRef] [PubMed]
  34. Basińska, M.; Michałkiewicz, M. Variability of microbial air pollution and dust concentration inside and outside a selected school in Poznań. J. Ecol. Eng. 2016, 50, 17–25. [Google Scholar] [CrossRef]
  35. Bulski, K.; Korta-Pepłowska, M. Microbiological quality of indoor air at reptile store. Water Environ. Rural Areas 2017, 17, 27–35. [Google Scholar]
  36. Roussel, S.; Sudre, B.; Reboux, G.; Waser, M.; Buchele, G.; Vacheyrou, M.; Dalphin, J.C.; Millon, L.; Braun-Fahrländer, C.; von Mutius, E.; et al. Exposure to moulds and actinomycetes in Alpine farms: A nested environmental study of the PASTURE cohort. Environ. Res. 2011, 111, 744–750. [Google Scholar] [CrossRef]
  37. Reponen, T.A.; Gazenko, S.V.; Grinshpun, S.A.; Willeke, K.; Cole, E.C. Characteristic of airborne actinomycete spores. Appl. Environ. Microbiol. 1998, 64, 3807–3812. [Google Scholar] [CrossRef] [Green Version]
  38. Wlazło, A.; Górny, R.L.; Złotkowska, R.; Ławniczek, A.; Łudzeń-Izbińska, B.; Harkawy, A.S.; Anczyk, E. Workers’ exposure to selected biological agents in libraries of Upper Silesia. Occup. Med. 2008, 59, 159–170. [Google Scholar]
  39. Brągoszewska, E.; Mainka, A.; Pastuszka, J.S.; Lizończyk, K.; Desta, Y.G. Assessment of bacterial aerosol in a preschool, primary school and high school in Poland. Atmosphere 2018, 9, 87. [Google Scholar] [CrossRef] [Green Version]
  40. Clauß, M. Particle size distribution of airborne micro-organisms in the environment—A review. Landbauforsch. Appl. Agric. For. Res. 2015, 65, 77–100. [Google Scholar]
  41. Lee, S.-A.; Adhikari, A.; Grinshpun, S.A.; McKay, R.; Shukla, R.; Reponen, T. Personal exposure to airborne dust and microorganisms in agricultural environments. J. Occup. Environ. Hyg. 2006, 3, 118–130. [Google Scholar] [CrossRef]
  42. Becker, K.; Heilmann, C.; Peters, G. Coagulase-negative staphylococci. Clin. Microbiol. Rev. 2014, 27, 870–926. [Google Scholar] [CrossRef] [PubMed] [Green Version]
  43. Dordet-Frisoni, E.; Dorchies, G.; De Araujo, C.; Talon, R.; Leroy, S. Genomic diversity in Staphylococcus xylosus. Appl. Environ. Microbiol. 2020, 73. [Google Scholar] [CrossRef] [Green Version]
  44. Jeong, D.-W.; Heo, S.; Ryu, S.; Blom, J.; Lee, J.H. Genomic insights into the virulence and salt tolerance of Staphylococcus equorum. Sci. Rep. 2017, 7, 5383. [Google Scholar] [CrossRef] [Green Version]
  45. Heo, S.; Lee, J.H.; Jeong, D.W. Food-derived coagulase-negative Staphylococcus as starter cultures for fermented foods. Food Sci. Biotechnol. 2020, 29, 1023–1035. [Google Scholar] [CrossRef]
  46. Dakić, I.; Morrison, D.; Vuković, D.; Savić, B.; Shittu, A.; Jezek, P.; Hauschild, T.; Stepanović, S. Isolation and molecular characterization of Staphylococcus sciuri in the hospital environment. J. Clin. Microbiol. 2005, 43, 2782–2785. [Google Scholar] [CrossRef] [Green Version]
  47. Ćirković, I.; Hauschild, T.; Ježek, P.; Dimitrijević, V.; Vuković, D.; Stepanović, S. Identification and Antimicrobial Susceptibility Testing of Staphylococcus vitulinus by the BD Phoenix Automated Microbiology System. Curr. Microbiol. 2008, 57, 158–160. [Google Scholar] [CrossRef]
  48. Lienen, T.; Schnitt, A.; Hammerl, J.A.; Marino, S.F.; Maurischat, S.; Tenhagen, B.-A. Multidrug-resistant Staphylococcus cohnii and Staphylococcus urealyticus isolates from German dairy farms exhibit resistance to beta-lactam antibiotics and divergent penicillin-binding proteins. Sci. Rep. 2021, 11, 6075. [Google Scholar] [CrossRef]
  49. Ehlers, S.; Merrill, S.A. Staphylococcus saprophyticus; [Updated 28 June 2020]; StatPearls Publishing: Treasure Island, FL, USA, 2021. Available online: https://www.ncbi.nlm.nih.gov/books/NBK482367/ (accessed on 20 May 2021).
  50. Żabicka, D.; Hryniewicz, W. Recommendations for the Selection of Tests for the Determination of Bacterial Susceptibility to Antibiotics and Chemotherapeutic Agents. Determination of the Susceptibility of Gram-Positive Cocci of the Staphylococcus Species; National Reference Center for Antimicrobial Susceptibility, National Medicines Institute: Warsaw, Poland, 2010. [Google Scholar]
  51. Otto, M. Coagulase-negative staphylococci as reservoirs of genes facilitating MRSA infection: Staphylococcal commensal species such as Staphylococcus epidermidis are being recognized as important sources of genes promoting MRSA colonization and virulence. BioEssays 2013, 35, 4–11. [Google Scholar] [CrossRef] [PubMed] [Green Version]
  52. Petinaki, E.; Papagiannitsis, C. Resistance of Staphylococci to Macrolides-Lincosamides- Streptogramins B (MLSB): Epidemiology and Mechanisms of Resistance. In Staphylococcus aureus; Hemeg, H., Ozbak, H., Afrin, H., Eds.; IntechOpen: London, UK, 2018. [Google Scholar] [CrossRef] [Green Version]
  53. Ross, J.I.; Eady, E.A.; Cove, J.H.; Cunliffe, W.J.; Baumberg, S.; Wootton, J.C. Inducible erythromycin resistance in staphylococci is encoded by a member of the ATP-binding transport super-gene family. Mol. Microbiol. 1990, 4, 1207–1214. [Google Scholar] [CrossRef] [PubMed]
  54. Bagcigil, F.A.; Moodley, A.; Baptiste, K.E.; Jensen, V.F.; Guardabassi, L. Occurrence, species distribution, antimicrobial resistance and clonality of methicillin- and erythromycin-resistant staphylococci in the nasal cavity of domestic animals. Vet. Microbiol. 2007, 121, 307–315. [Google Scholar] [CrossRef] [PubMed]
Figure 1. Study site and sampling points.
Atmosphere 12 00934 g001
Figure 2. Mean concentrations of different particulate matter fractions in the studied premises (mg/m3).
Atmosphere 12 00934 g002
Figure 3. Mean concentration of microbial aerosol (CFU/m3) in the examined sites. Bars represent standard deviations.
Atmosphere 12 00934 g003
Figure 4. (a) Aerodynamic diameter distribution of bacteria in the examined points. (b) Aerodynamic diameter distribution of fungi in the examined points. (c) Aerodynamic diameter of staphylococci in the examined points. (d) Aerodynamic diameter of actinomycetes in the examined points.
Atmosphere 12 00934 g004aAtmosphere 12 00934 g004bAtmosphere 12 00934 g004cAtmosphere 12 00934 g004d
Figure 5. Mean concentration of total microbial aerosol (CFU/m3) in the examined points compared with the concentration of PM10 (mg/m3). Explanation of symbols used: C—classroom; H—sports hall; S—stable; C—cowshed; N—newborn calf shed; B—bacteria; F—fungi; S—staphylococcus; A—actinomycetes.
Atmosphere 12 00934 g005
Figure 6. Mean concentration of respirable fraction of microbial aerosol (CFU/m3) in the examined points compared with the concentration of PM4 (mg/m3). Explanation of symbols: C—classroom; H—sports hall; S—stable; C—cowshed; N—newborn calf shed; B—bacteria; F—fungi; S—staphylococcus; A—actinomycetes.
Atmosphere 12 00934 g006
Figure 7. Share (%) of identified staphylococci isolated from the examined points.
Atmosphere 12 00934 g007
Table 1. Characteristics of the sampling points with physical parameters measured in the course of the annual study. Values of temperature and relative humidity sharing the same letter are not statistically different according to ANOVA followed by Tukey’s test (p < 0.05). Pictures presented in the Table were taken during the study by Dagmara Drab and Justyna Chrobak.
No. Sampling PointDescription Temp (°C)/Relative Humidity (%)
WinterSpringSummerAutumn
1Classroom (in the centre of the room, between tables)A room where didactic classes take place. No air conditioning was present; natural ventilation only. C.a. 60 students stay there every day in groups of 15–20 persons. Atmosphere 12 00934 i00122.0a (±0.7)/44.8a (±1.1)22.6a (±0.5)/63.4b (±1.0)23.8b (±0.8)/54.6c (±1.2)21.8a (±0.5)/60.2d (±1.5)
2Sports hall (in the middle of the hall)Used on a daily basis for physical education of students and tournaments. Natural ventilation was only used based on opening windows and door. Atmosphere 12 00934 i00222.1a (±0.5)/52.8a (±1.4)21.8a (±0.5)/53.1a (±1.5)23.2b (±0.5)/53.6a (±1.0)20.0c (±0.5)/62.6b (±1.1)
3Horse stable (in the aisle between the two rows of stalls)Livestock room, which is a part of the “Kopytko” horse stable. A small building located in the almost central part of the land belonging to the school; c.a. 100 m away from other livestock facilities. The room keeps 12 horses that spend most of the day outside the facility. While the horses are away, the main entrance remains open to facilitate ventilation of the building. Atmosphere 12 00934 i00311.9a (±1.0)/53.6a (±2.1)14.3b (±0.6)/83.5b (±3.2)21.5c (±1.0)/57.0c (±1.1)9.9d (±1.0)/90.3d (±2.0)
4Cowshed (in the aisle between the two rows of stalls)The largest livestock enclosure in which a high number of adult dairy cows are housed 24 h a day (approximately 70 animals). It is not air-conditioned and, during warmer months, ventilation consists in opening the entrance gates located on opposite sides of the building. In the case of very high air temperatures, a fan located at the entrance to the barn is switched on. In addition, a lot of work is carried out in the room related to the maintenance of animals (milking, feeding and changing litter) and the main passage is filled with feed and straw for animals, which means that there is a high level of dust in the facility almost all the time. Atmosphere 12 00934 i0047.7a (±0.8)/73.6a (±2.3)17.0b (±0.9)/72.3a (±2.2)24.4c (±1.0)/46.1b (±1.2)12.9d (±1.0)/93.8c (±2.0)
5Newborn calf shed (in the aisle between the two rows of boxes for calves)A livestock room for keeping young cattle. It is quite a large building divided into two zones: the first is where the animal feed is stored and the second (the actual part) is where the calves are kept. Young animals are kept in separate boxes, 2–3 each. The floor of the boxes is lined with straw, which can be a source of dust and microorganisms that can be released into the air along with the movement of animals. Due to the young age of the animals, it is very rarely ventilated. Atmosphere 12 00934 i0058.9a (±1.2)/80.2a (±2.0)17.0b (±1.1)/78.5b (±1.3)20.5c (±1.0)/64.5c (±1.6)13.4d (±1.0)/92.5d (±2.0)
6Outdoor background (by the bench frequented by students)C. a. 20 m in front of the boarding house, c.a. 150 m from the livestock buildings. Atmosphere 12 00934 i0064.4a (±2.0)/86.6a (±1.5); avg. wind speed 1.0 km/h; precipitation 0 mm 19.2b (±2.0)/69.6b (±1.0); avg. wind speed 1.0 km/h; precipitation 0 mm25.2c (±2.0)/49.7c (±1.0); avg. wind speed 2.4 km/h; precipitation 1.2 mm9.4d (±0.7)/98.1d (±2.1); avg. wind speed 5.0 km/h; precipitation 8.4 mm
Table 2. Mean values of particulate matter concentration (mg/m3) in the examined premises and outdoors. The presented values are means of three replicates. Values in brackets show standard deviation.
SeasonSampling Point
ClassroomSports HallStableCowshedNewborn Calf ShedOutdoor (Average Levels for the Region)
PM10
Winter0.076 (0.004)0.074 (0.006)0.162 (0.031)0.097 (0.006)0.220 (0.060)0.083 (0.023) (0.046)
Spring0.084 (0.009)0.088 (0.003)0.126 (0.004)0.151 (0.037)0.134 (0.008)0.078 (0.003) (0.028)
Summer0.062 (0.001)0.068 (0.004)0.067 (0.008)0.070 (0.044)0.128 (0.276)0.057 (0.003) (0.022)
Autumn0.170 (0.019)0.154 (0.003)0.182 (0.006)0.333 (0.295)0.387 (0.062)0.198 (0.006) (0.039)
PM4
Winter0.073 (0.005)0.066 (0.002)0.113 (0.010)0.093 (0.004)0.132 (0.017)0.080 (0.002)
Spring0.080 (0.005)0.090 (0.004)0.124 (0.004)0.141 (0.009)0.128 (0.005)0.081 (0.006)
Summer0.062 (0.002)0.066 (0.002)0.065 (0.003)0.084 (0.015)0.082 (0.008)0.058 (0.012)
Autumn0.161 (0.023)0.152 (0.003)0.182 (0.005)0.263 (0.003)0.325 (0.059)0.203 (0.004)
PM2.5
Winter0.070 (0.003)0.068 (0.002)0.099 (0.006)0.091 (0.002)0.111 (0.012)0.077 (0.076) (0.041)
Spring0.078 (0.004)0.091 (0.004)0.125 (0.011)0.134 (0.009)0.128 (0.005)0.078 (0.003) (0.017)
Summer0.061 (0.001)0.066 (0.003)0.064 (0.003)0.077 (0.006)0.076 (0.009)0.060 (0.005) (0.016)
Autumn0.156 (0.004)0.149 (0.003)0.177 (0.011)0.257 (0.026)0.321 (0.014)0.202 (0.013) (0.027)
PM1
Winter0.065 (0.001)0.063 (0.003)0.084 (0.009)0.084 (0.002)0.092 (0.017)0.071 (0.001)
Spring0.078 (0.029)0.083 (0.002)0.114 (0.010)0.124 (0.010)0.118 (0.006)0.077 (0.005)
Summer0.060 (0.001)0.067 (0.003)0.063 (0.002)0.066 (0.10)0.068 (0.008)0.057 (0.003)
Autumn0.143 (0.003)0.147 (0.004)0.158 (0.004)0.200 (0.011)0.256 (0.022)0.222 (0.666)
Table 3. Spearman’s correlation coefficient matrix for microbial bioaerosol components, PM fractions, temperature and relative humidity of air. Bolded values are significant at p < 0.05.
TempRHBact.FungiActStaphPM10PM4PM2.5PM1
Temperature-
Relative humidity−0.80-
Bacteria−0.430.20-
Fungi−0.360.190.75-
Actinomycetes−0.110.150.540.68-
Staphylococci−0.200.170.800.710.71-
PM10−0.700.710.330.250.190.39-
PM4−0.620.690.170.140.140.310.95-
PM2.5−0.620.710.110.090.080.240.930.98-
PM1−0.650.750.110.070.100.230.930.970.99-
Table 4. Concentration of microbial aerosol components (CFU/m3) in the premises of the agricultural school and in outdoor air. The presented values are means of three replicates. There are standard deviations provided for each season and site in brackets.
SeasonSampling Site
ClassroomSports HallStableCowshedNewborn Calf ShedOutdoor
Total Bacteria
Winter4384 (2309)6572 (4066)15,383 (12,688)10,821 (2840)27,102 (6623)12,726 (2232)
Spring2523 (269)1783 (620)3954 (759)5803 (123)22,426 (8634)1925 (480)
Summer1543 (785)3614 (2108)4743 (3521)3746 (958)36,796 (17,463)951 (68)
Autumn4005 (889)1739 (581)1720 (488)4829 (1781)12,892 (3783)1220 (312)
Mold Fungi
Winter3366 (5024)774 (413)6219 (2224)5395 (3566)48,220 (7246)794 (311)
Spring1227 (630)664 (141)1885 (347)7310 (2009)7739 (2945)688 (102)
Summer610 (191)424 (42)1099 (217)3620 (3429)12,674 (10,426)725 (47)
Autumn297 (32)264 (172)868 (194)750 (80)3975 (123)688 (61)
Actinomycetes
Winter38 (4)205 (30)982 (526)3553 (233)18,430 (10,556)90 (51)
Spring1555 (577)346 (214)663 (593)8634 (5307)9817 (3005)292 (184)
Summer405 (114)876 (406)1205 (326)3208 (638)20,006 (8130)214 (124)
Autumn367 (137)106 (55)306 (212)738 (1002)871 (531)217 (121)
Staphylococci
Winter1602 (466)2676 (486)2564 (1072)7342 (395)15,402 (8134)346 (241)
Spring1571 (1462)900 (912)2890 (2716)7350 (4154)8899 (1580)38 (10)
Summer977 (213)916 (728)2026 (643)1669 (1682)19,770 (6953)130 (146)
Autumn3920 (2353)627 (220)632 (576)2285 (1160)15,854 (6233)327 (208)
Table 5. Summary of Staphylococcus species and antimicrobial resistance * detected in the examined premises.
OriginSpeciesFOXETECNDASXTCIPNo. of R
ClassroomStaphylococcus spp.SSSSSSS0
S. equorumSRRSRRS4
S. equorumSSSSSSS0
S. equorumSSSSRRR3
S. equorumSRRSSSS2
S. equorumSSSSSSS0
S. sciuriSSSSSSS0
StableS. succinusSSSSSSS0
S. xylosusSSSSSSS0
S. succinusSRSSSSS1
S. vitulinusRRSSRSR4
S. equorumSSSSSSS0
CowshedS. sciuriSSSRRSS2
S. succinusSSSSSSR1
S. succinusSSSSRSS1
S.succinusSSSSSSS0
S. succinusSRSSRSS2
S. succinusSRSSSSS1
S. xylosusSSRSSSS1
S. vitulinusSSSSSSS0
Newborn calf shedS. cohniiSRSSSSS1
S. equorumSRSSRSS2
S. equorumSRSSRSS2
S. equorumSSSSRSS1
S. equorumSRRSSSS2
S. equorumSSSSSSS0
S. saprophyticusSSSSSSS0
S. sciuriSSSSSSS0
S. succinusSSSSSSS0
S. succinusSSSSSSS0
S. xylosusSSSSSSS0
S. xylosusSRRSRSR4
OutdoorS. equorumSRSSSSS1
S. xylosusSRSSRSS2
n/% of resistant strains1/2.9413/38.235/14.71/2.9411/32.42/5.884/11.819/55.88
* R—resistant strains; S—susceptible strains. Resistant strains (R) are shown in bold to improve readability.
Publisher’s Note: MDPI stays neutral with regard to jurisdictional claims in published maps and institutional affiliations.

