
The Unmanned Systems Research Laboratory (USRL): A New Facility for UAV-Based Atmospheric Observations

 , ,
, ,  , , , ,
Abstract
:1. Introduction
2. Description of the Unmanned Systems Research Laboratory (USRL)
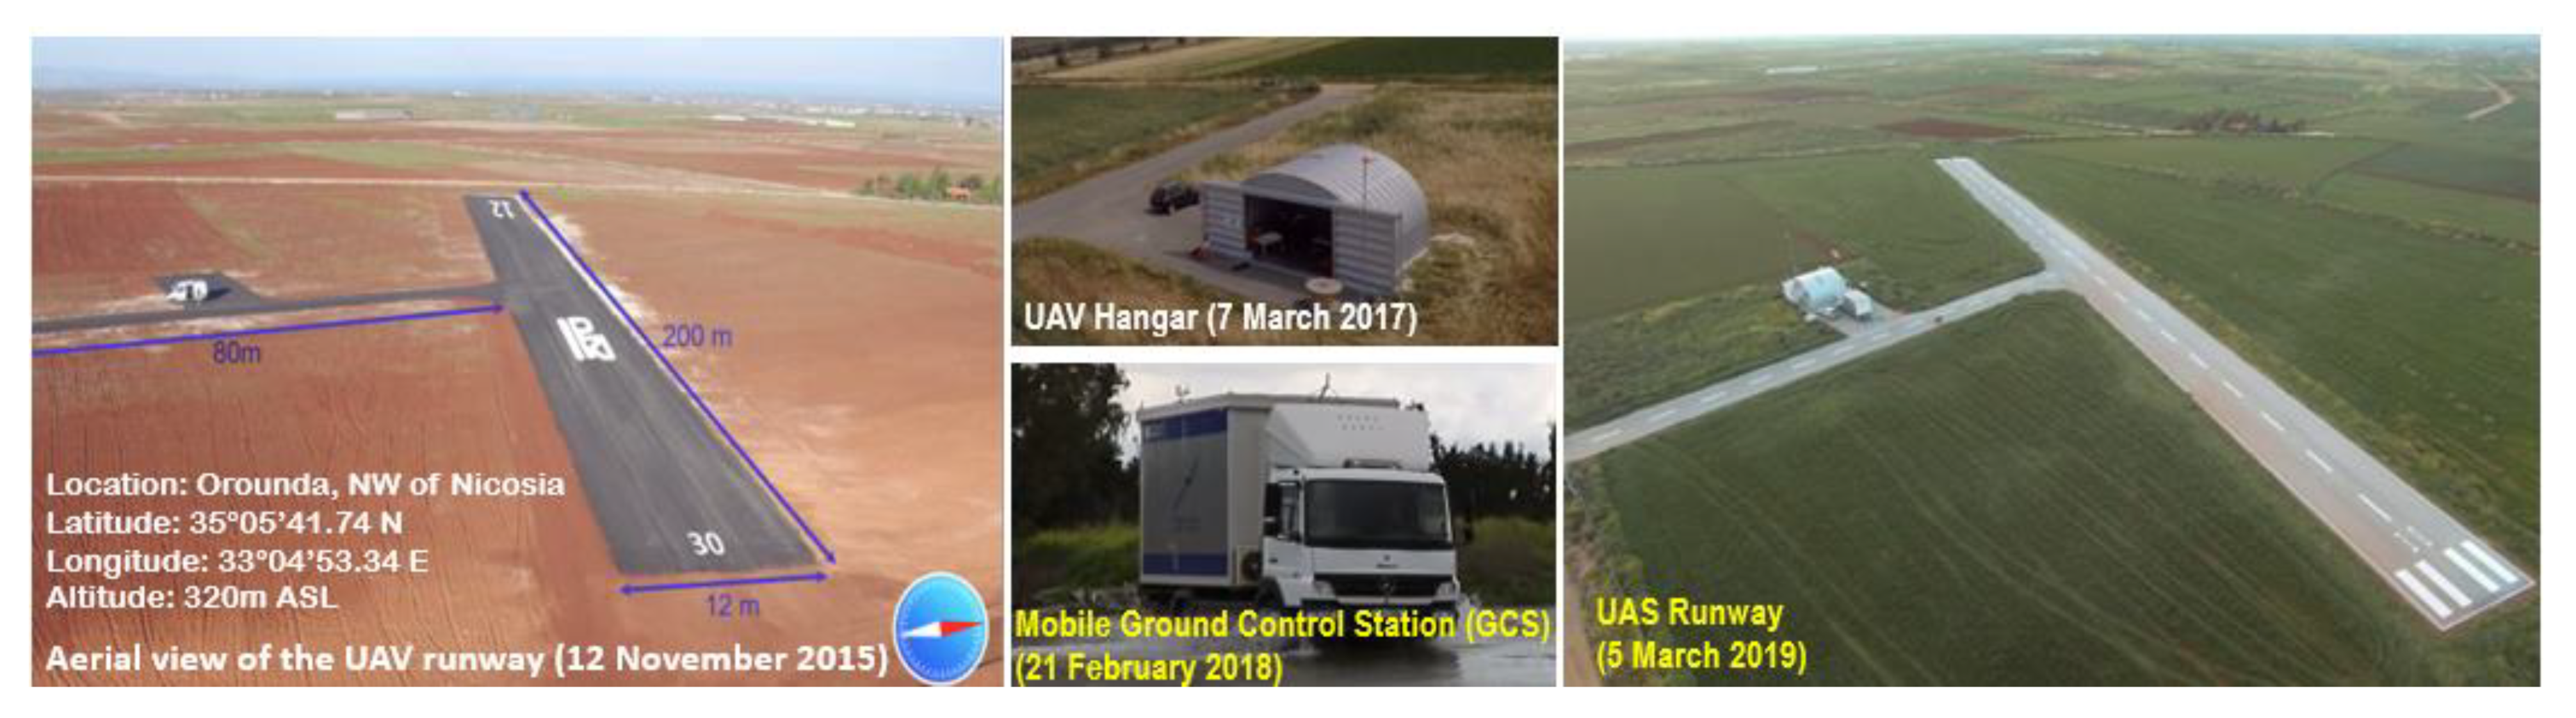
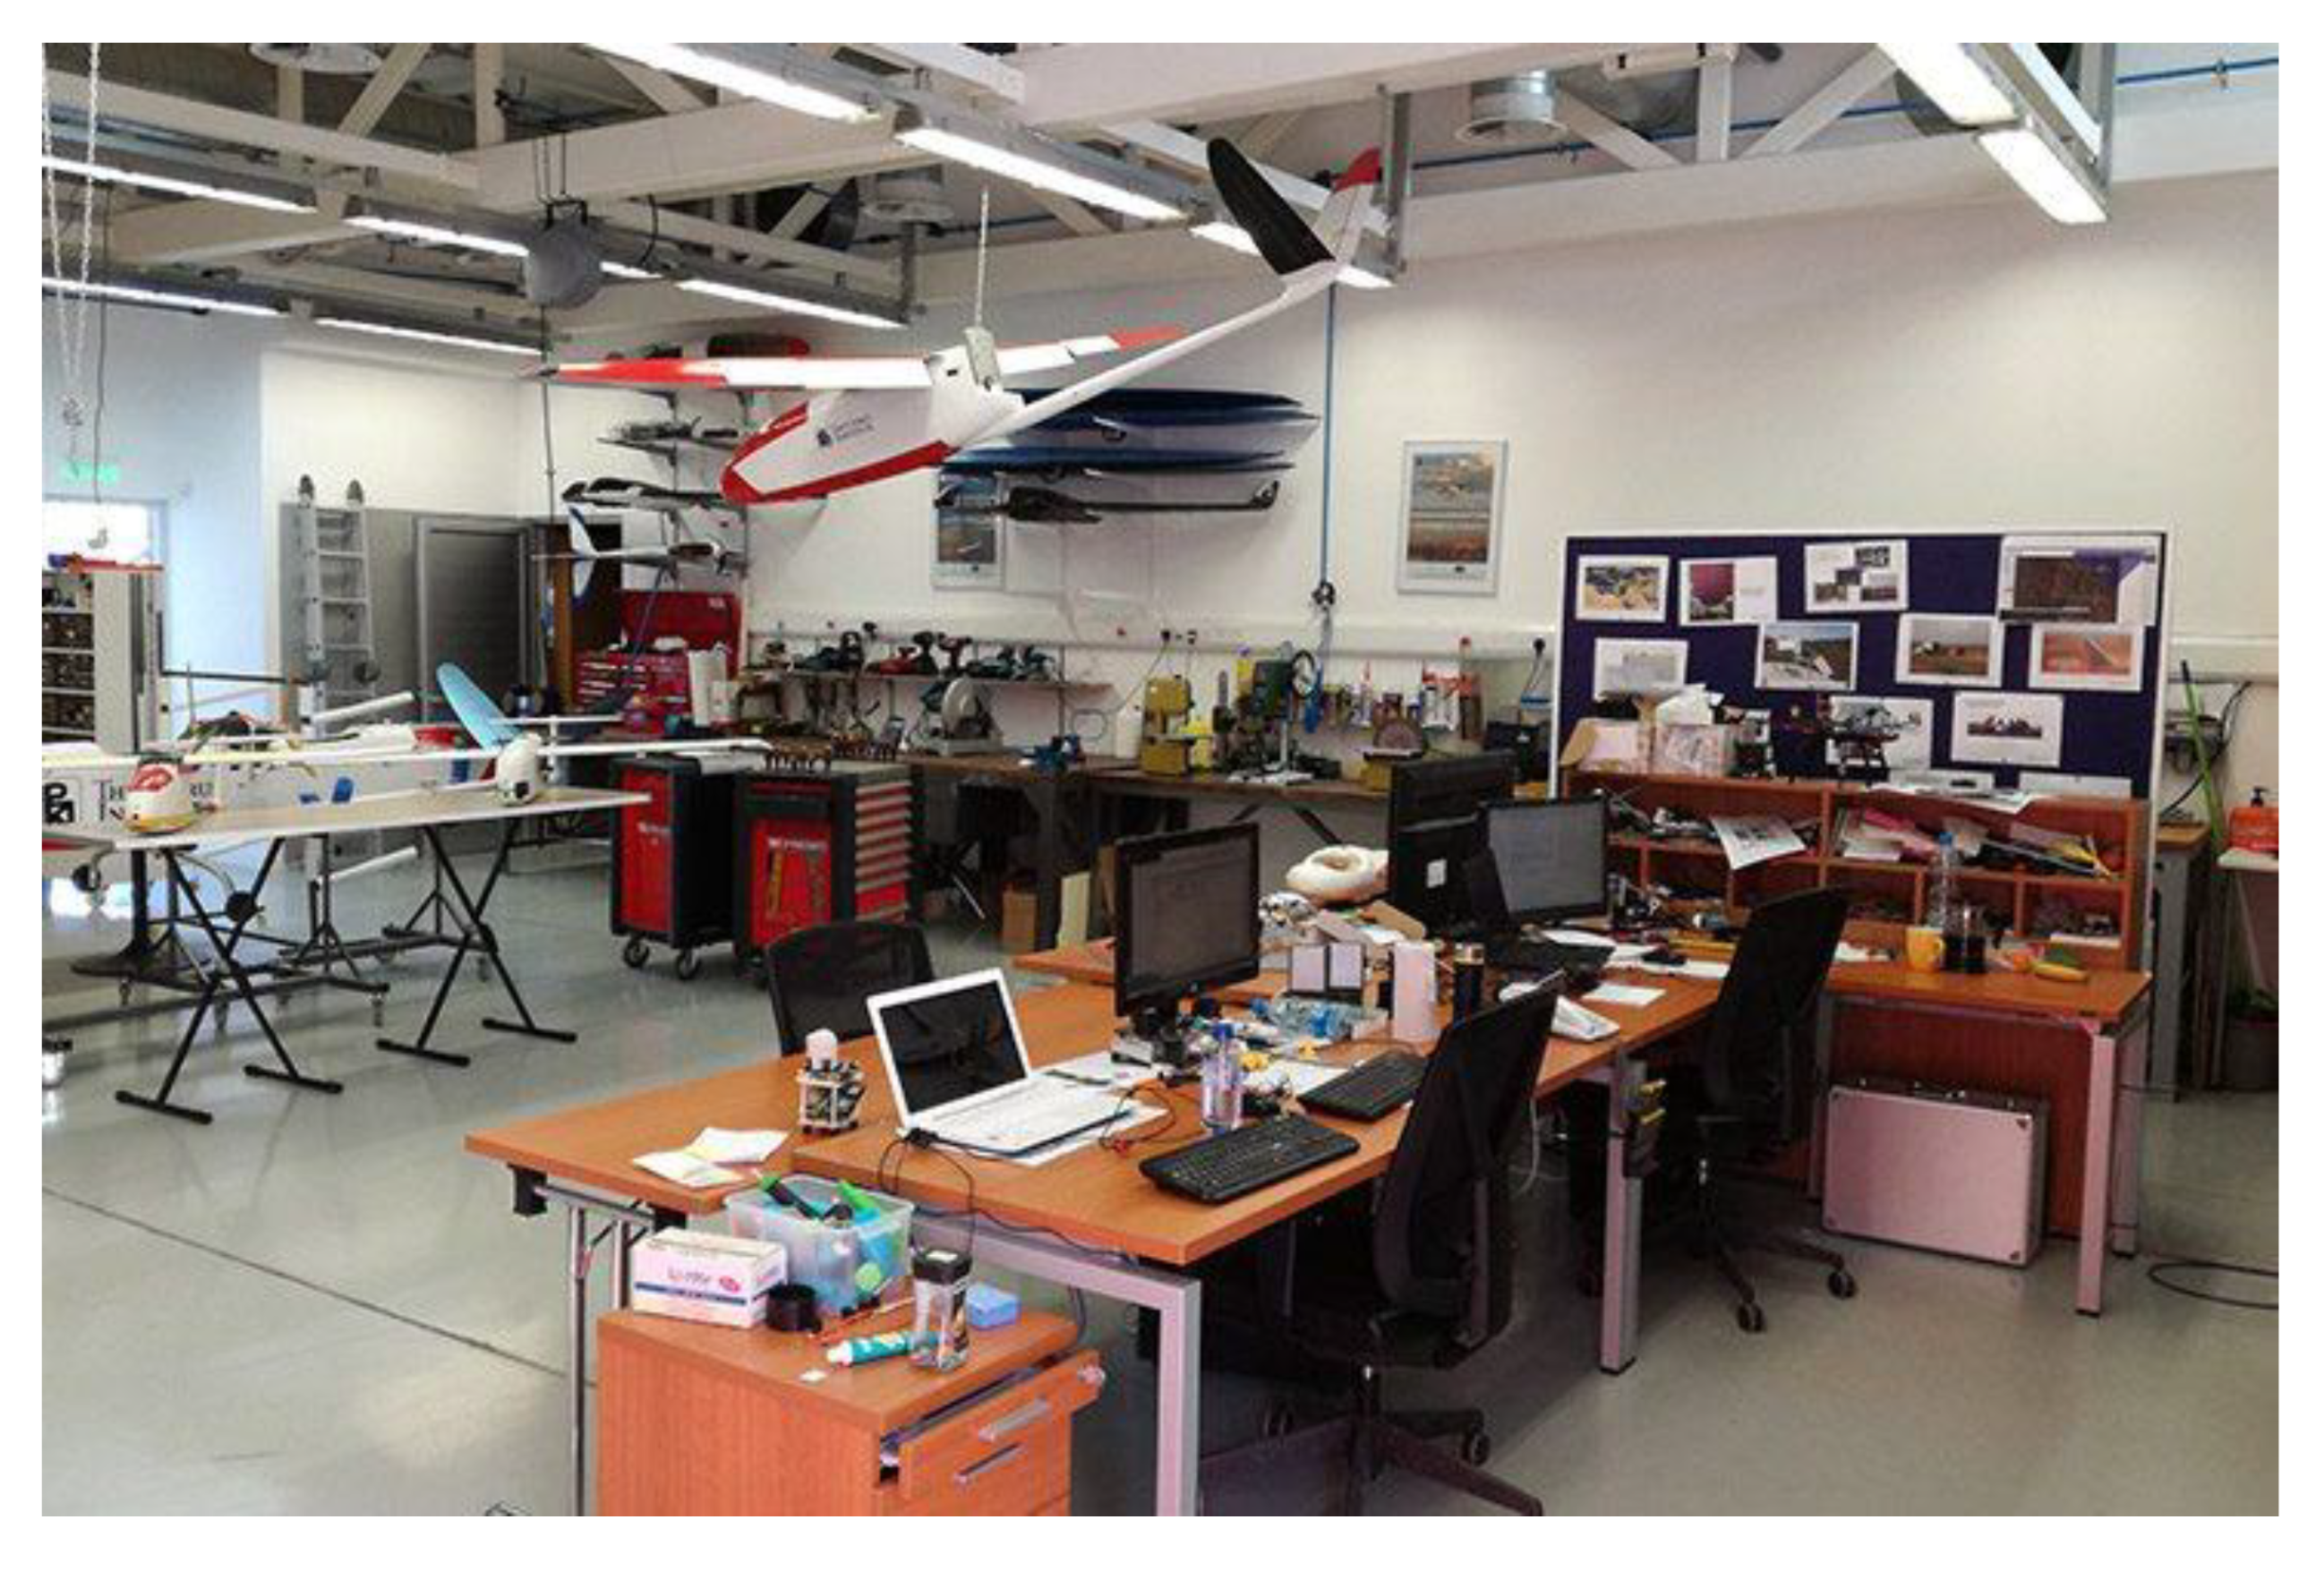
2.1. Description of the USRL Infrastructure
2.2. Description of the UAV Fleet
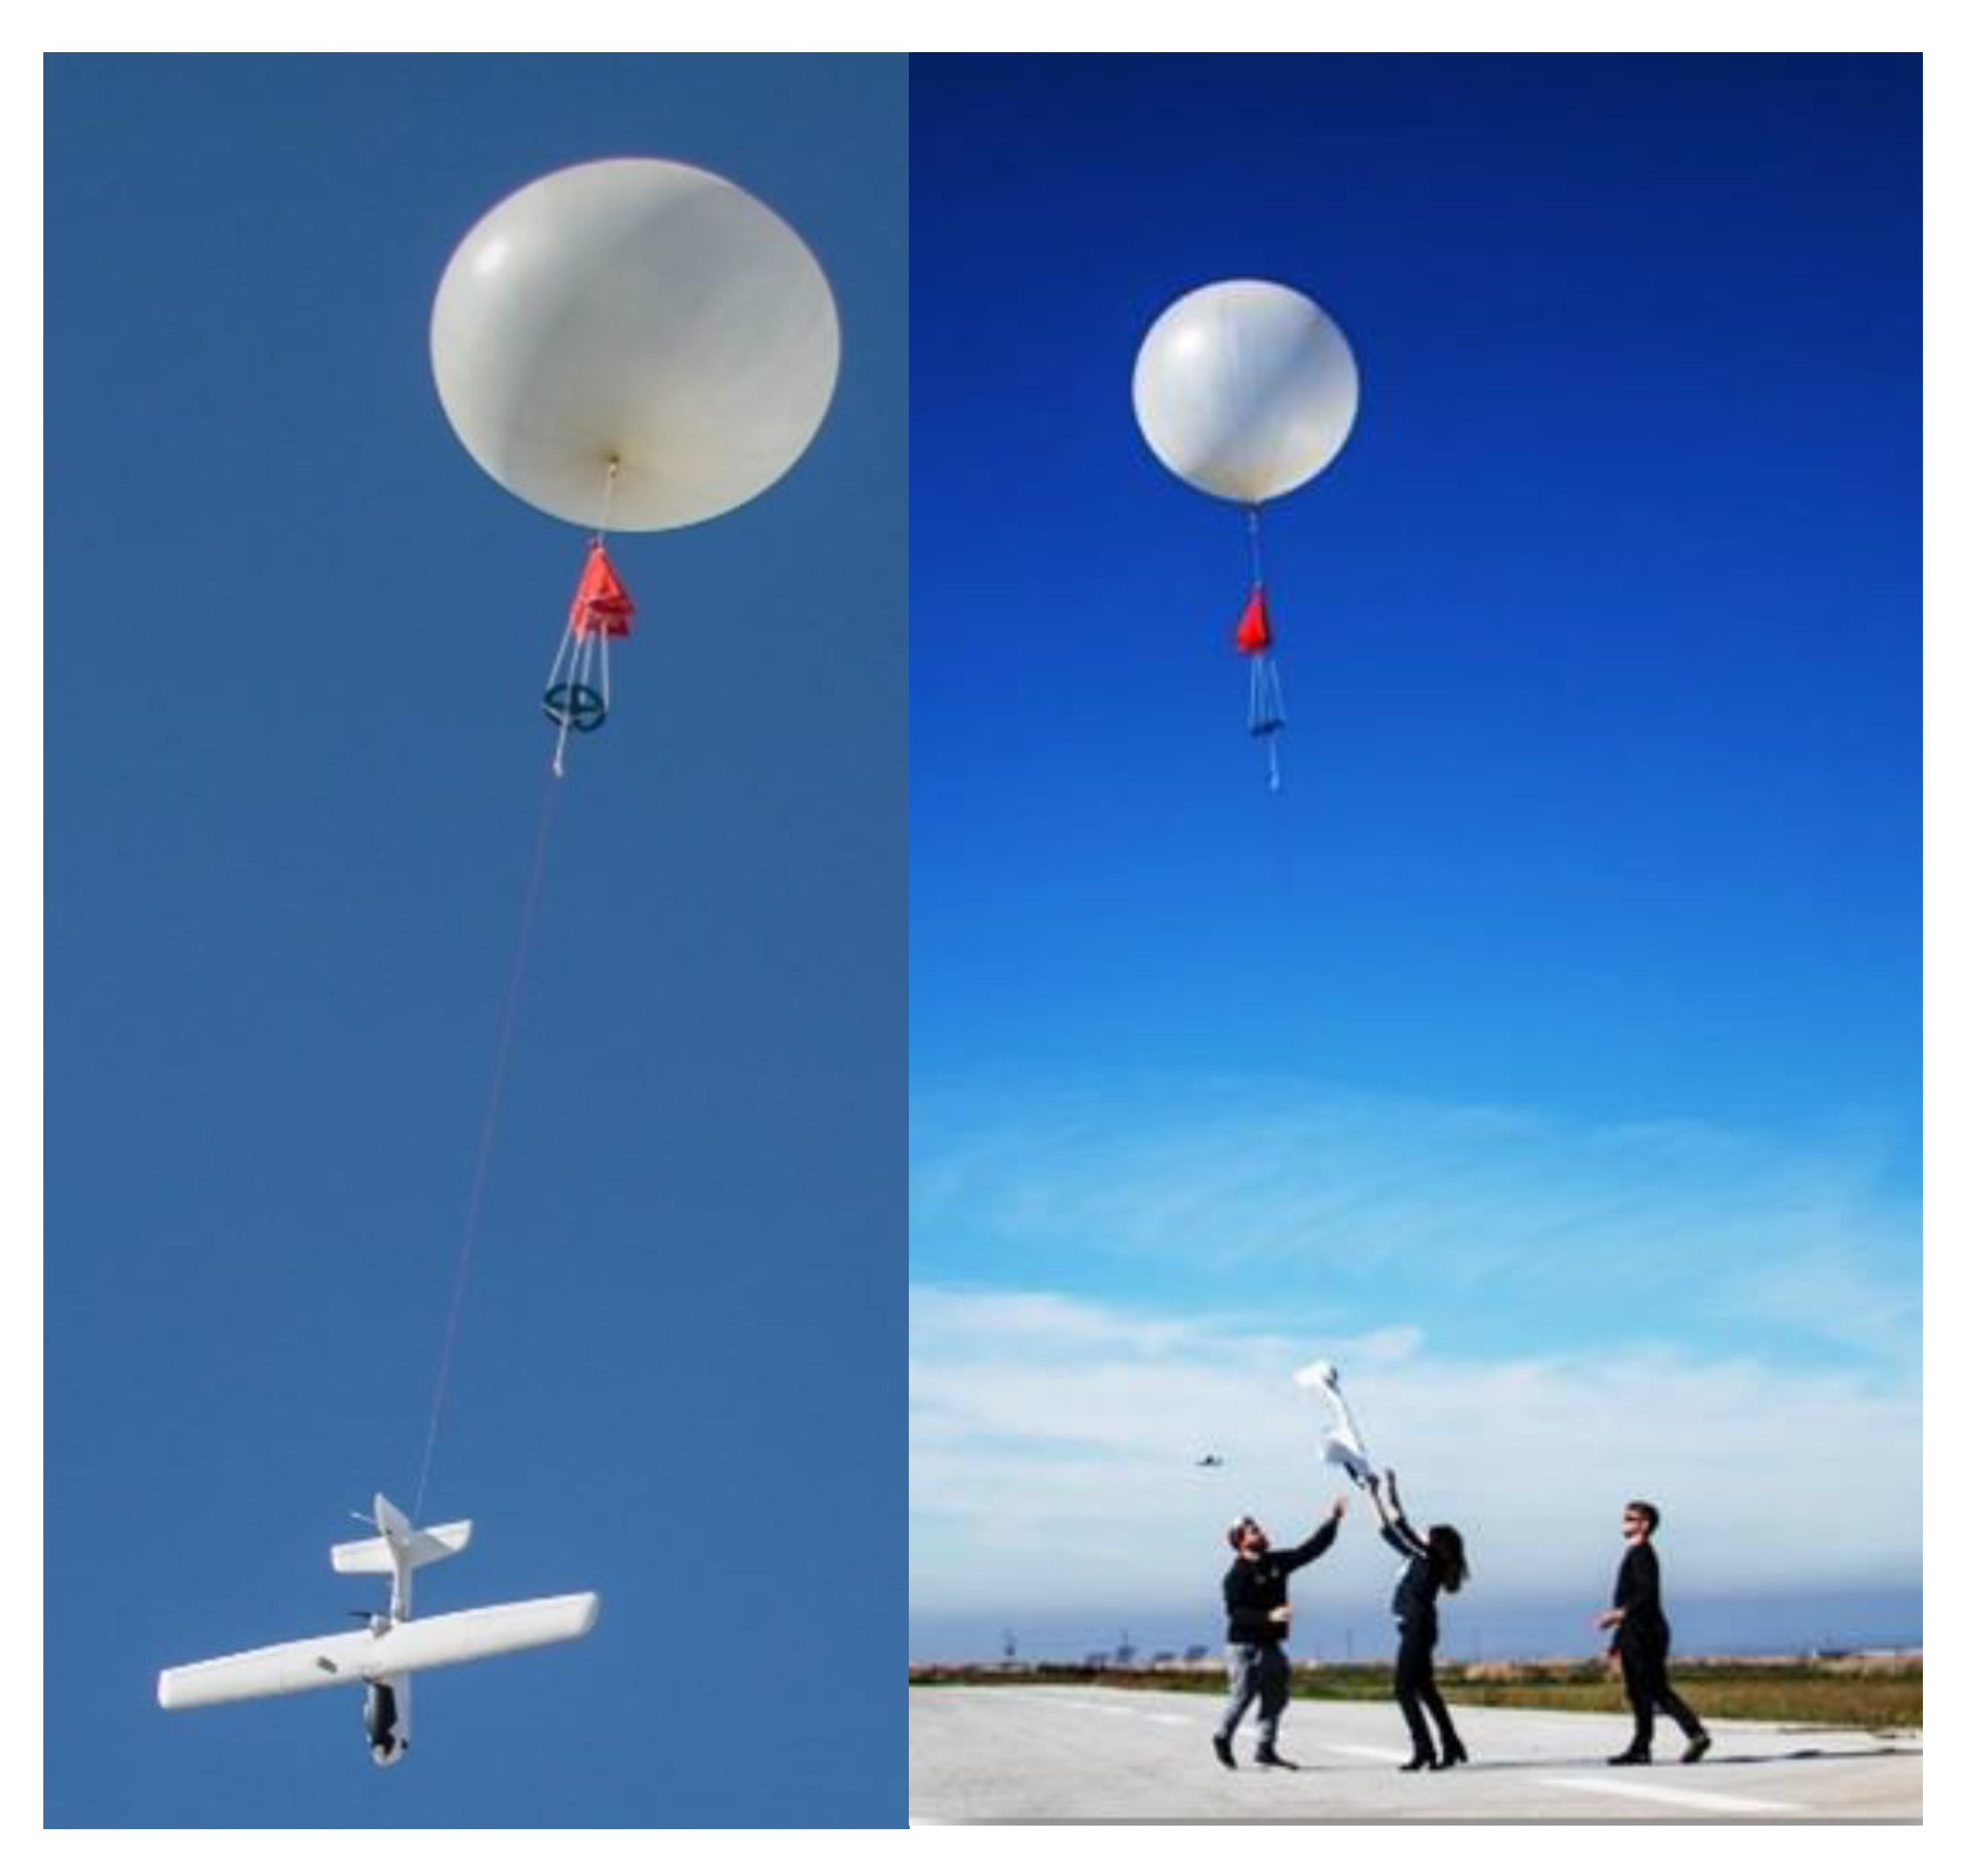
2.3. Description of the UAS-Balloon Systems
2.4. Atmospheric Instrumentation Deployed On-Board the UAVs
2.4.1. Meteorological Sensors
2.4.2. Aerosol Sensors
2.4.3. Atmospheric Gas Sensors
3. Results
3.1. Profiling of INP over Cyprus
3.2. Profiling of Aerosol Light Absorption over Athens (Greece)
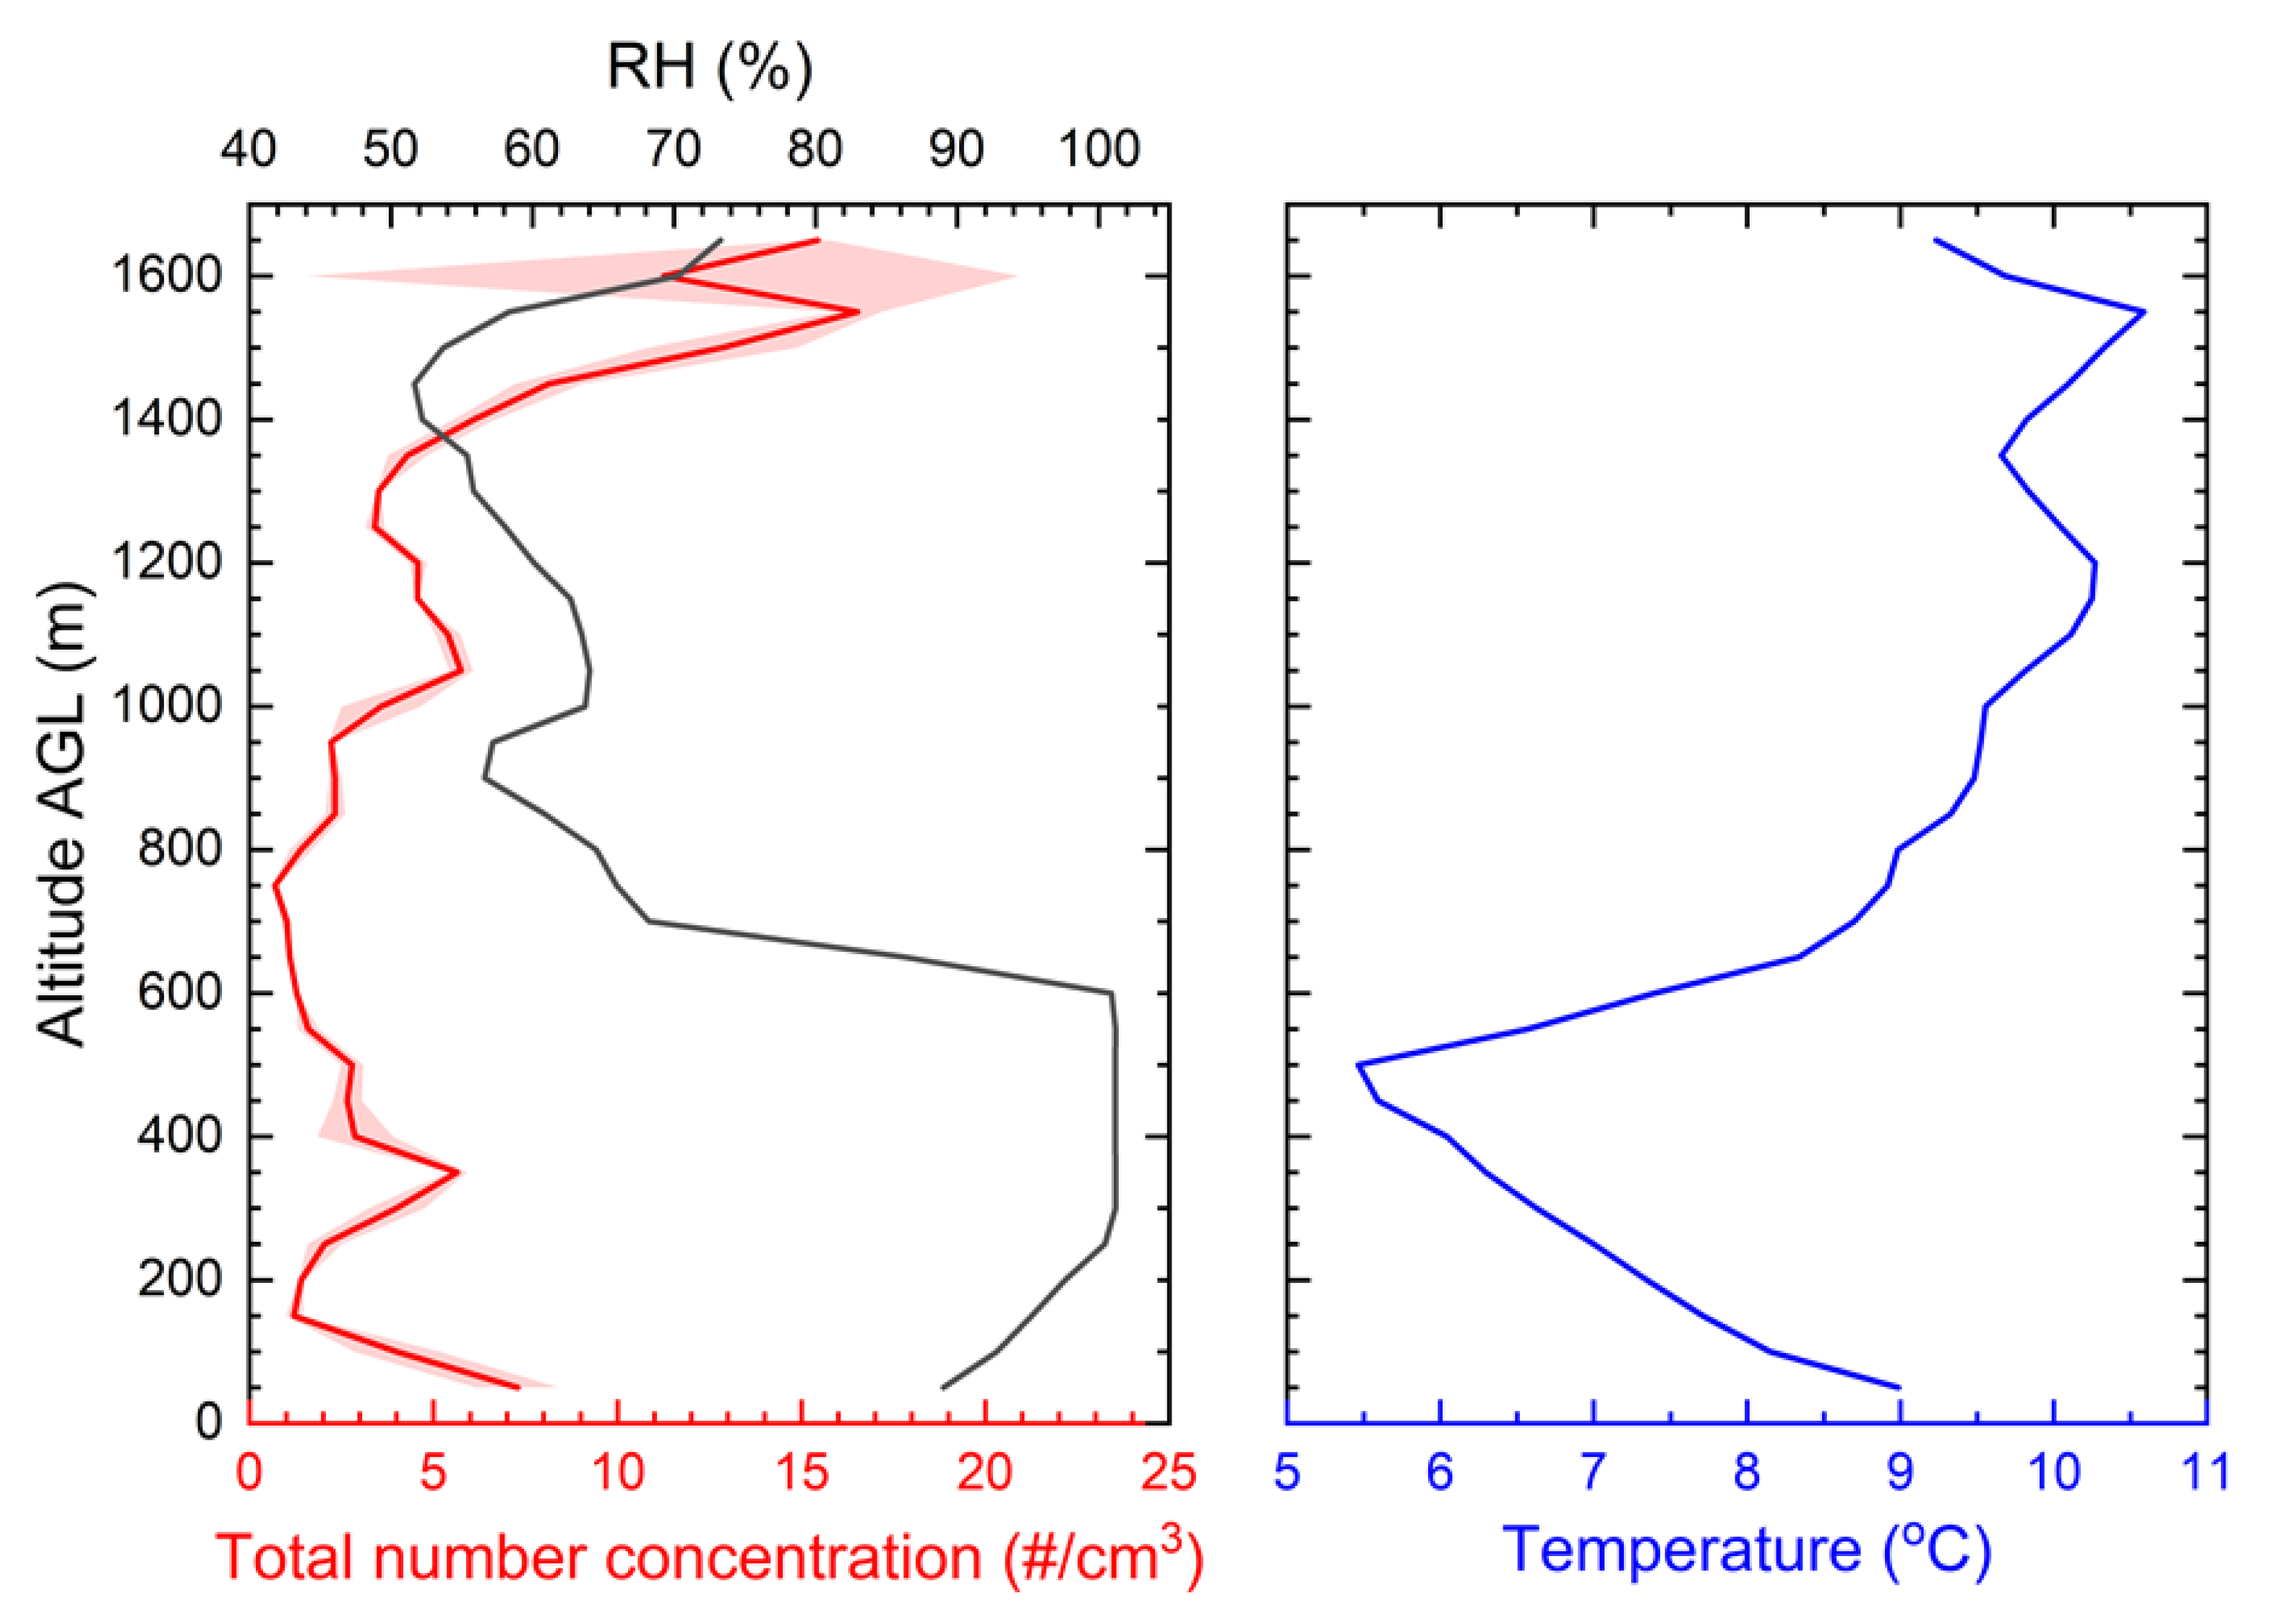
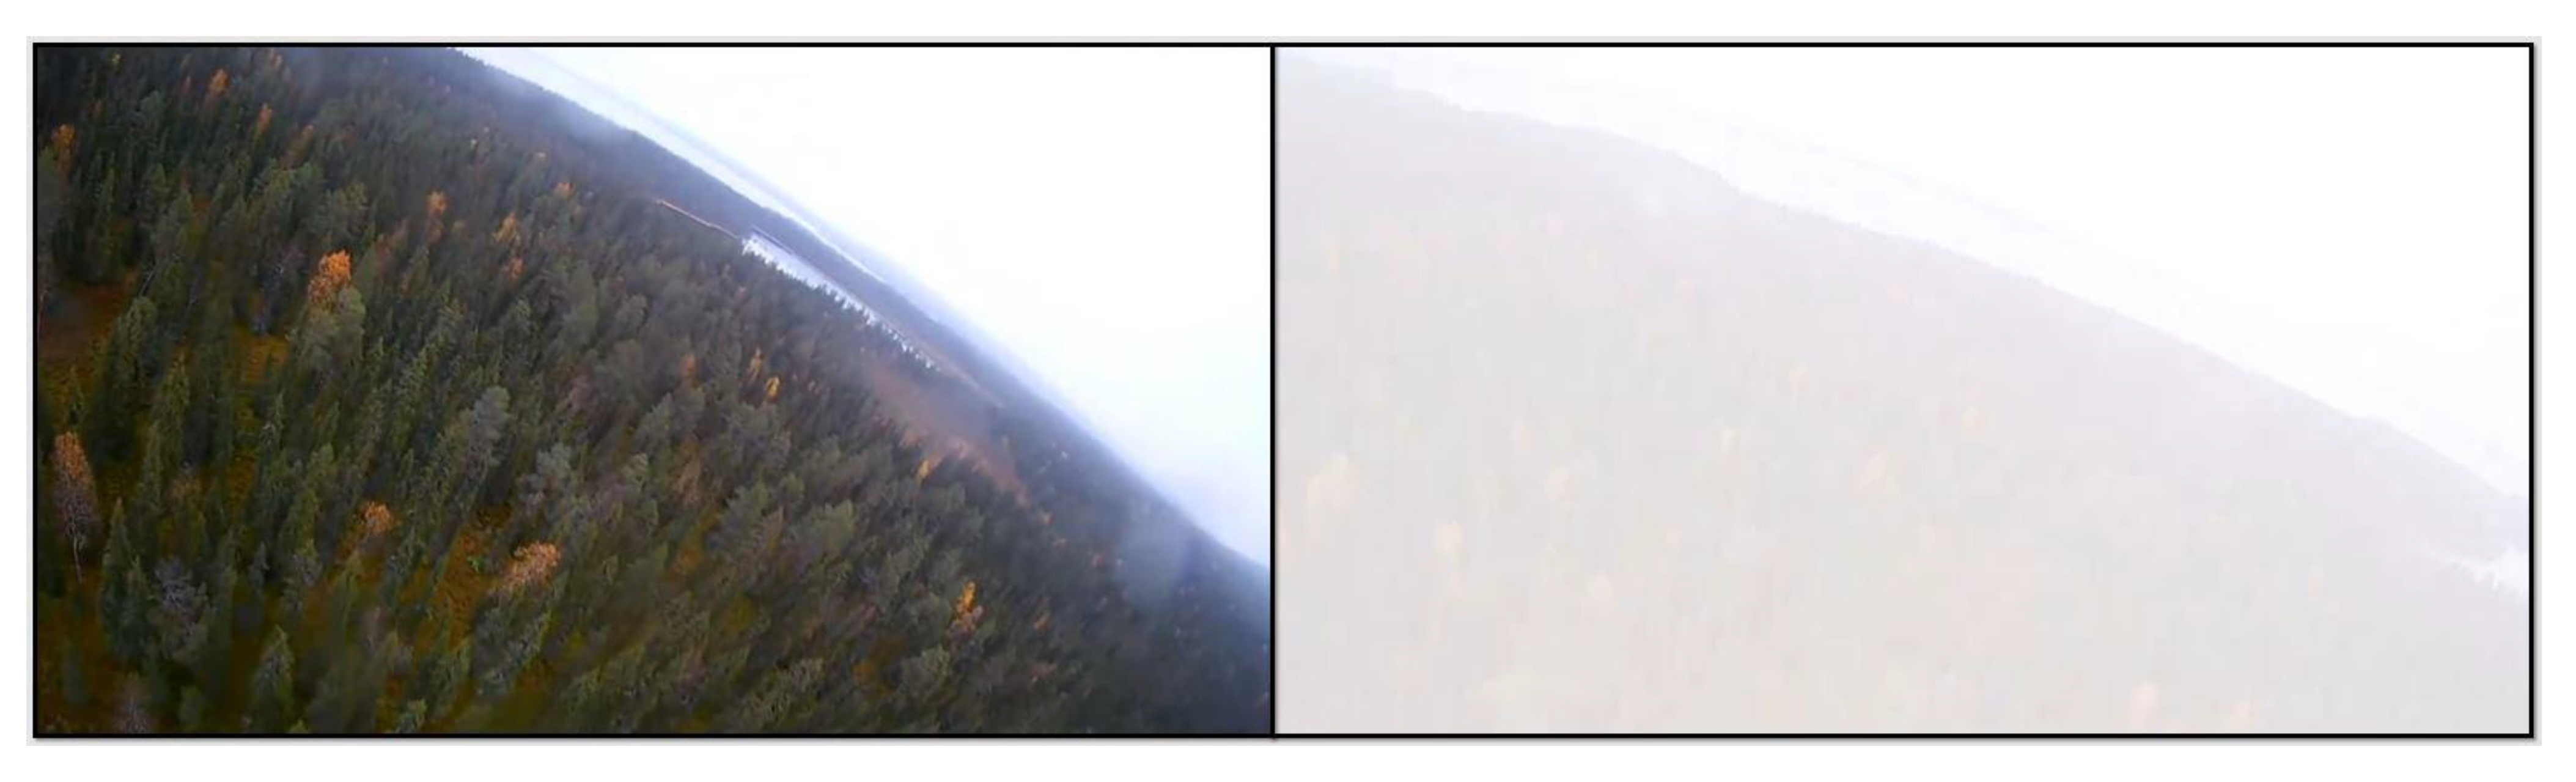
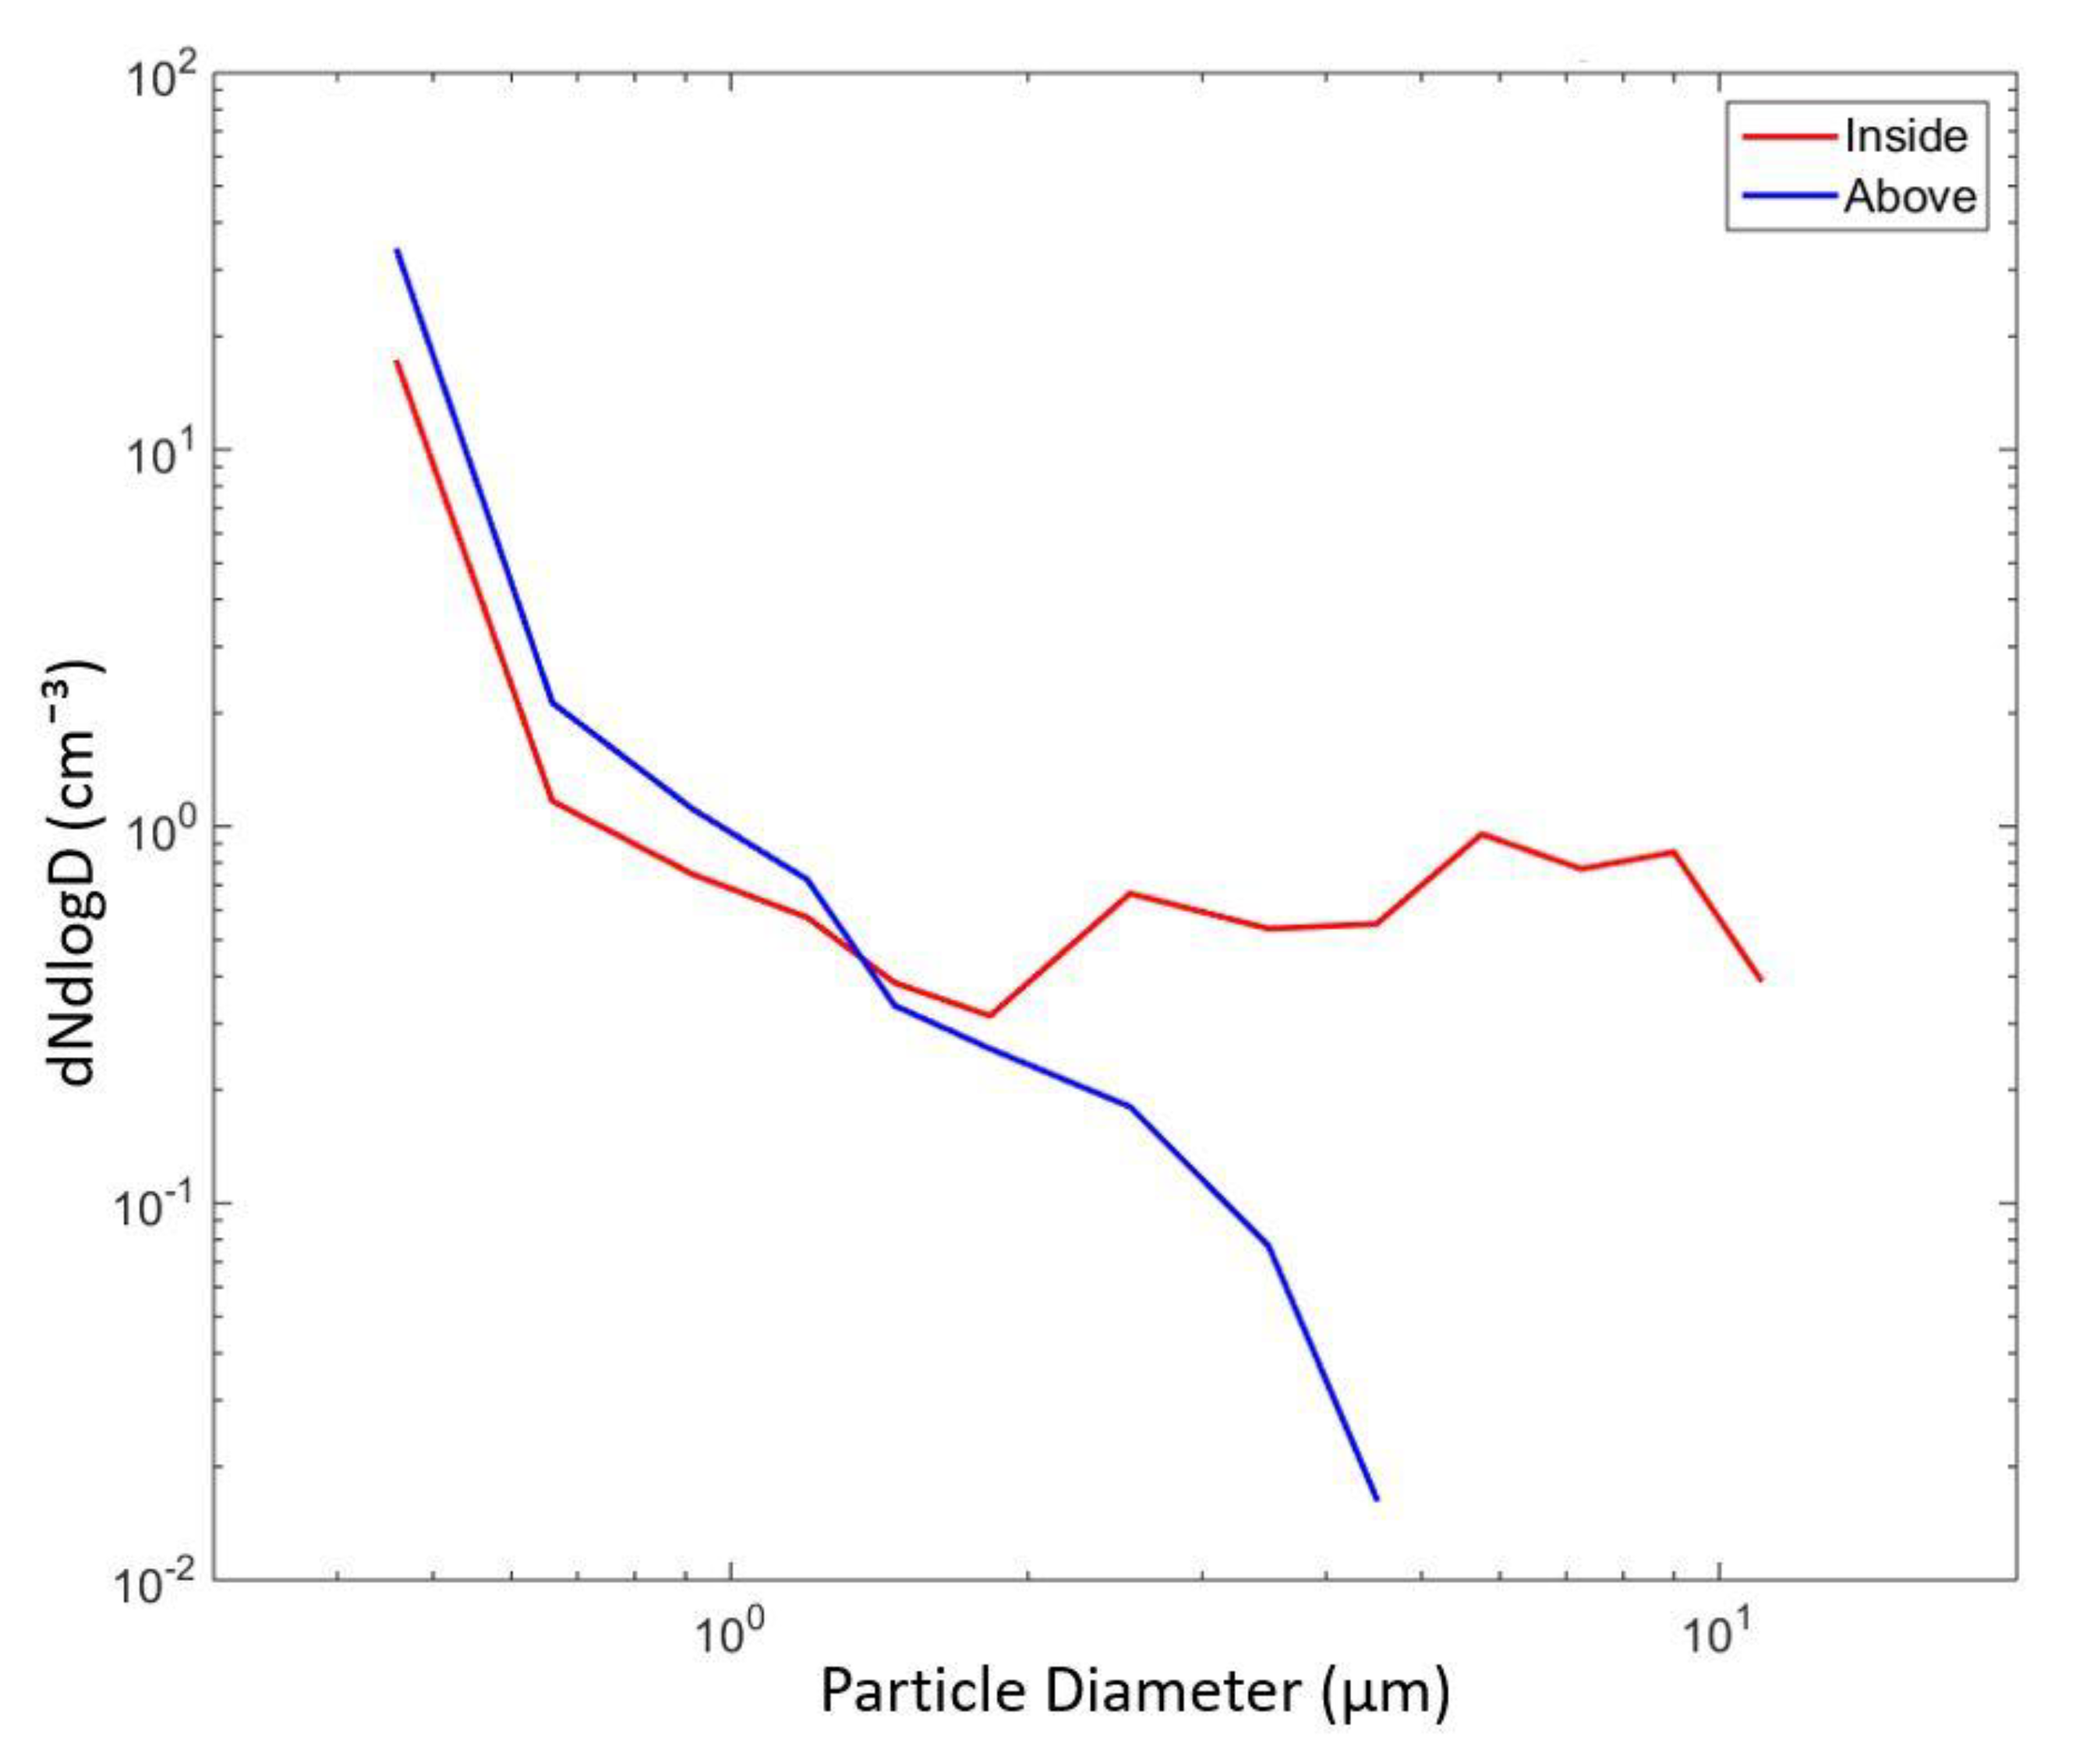
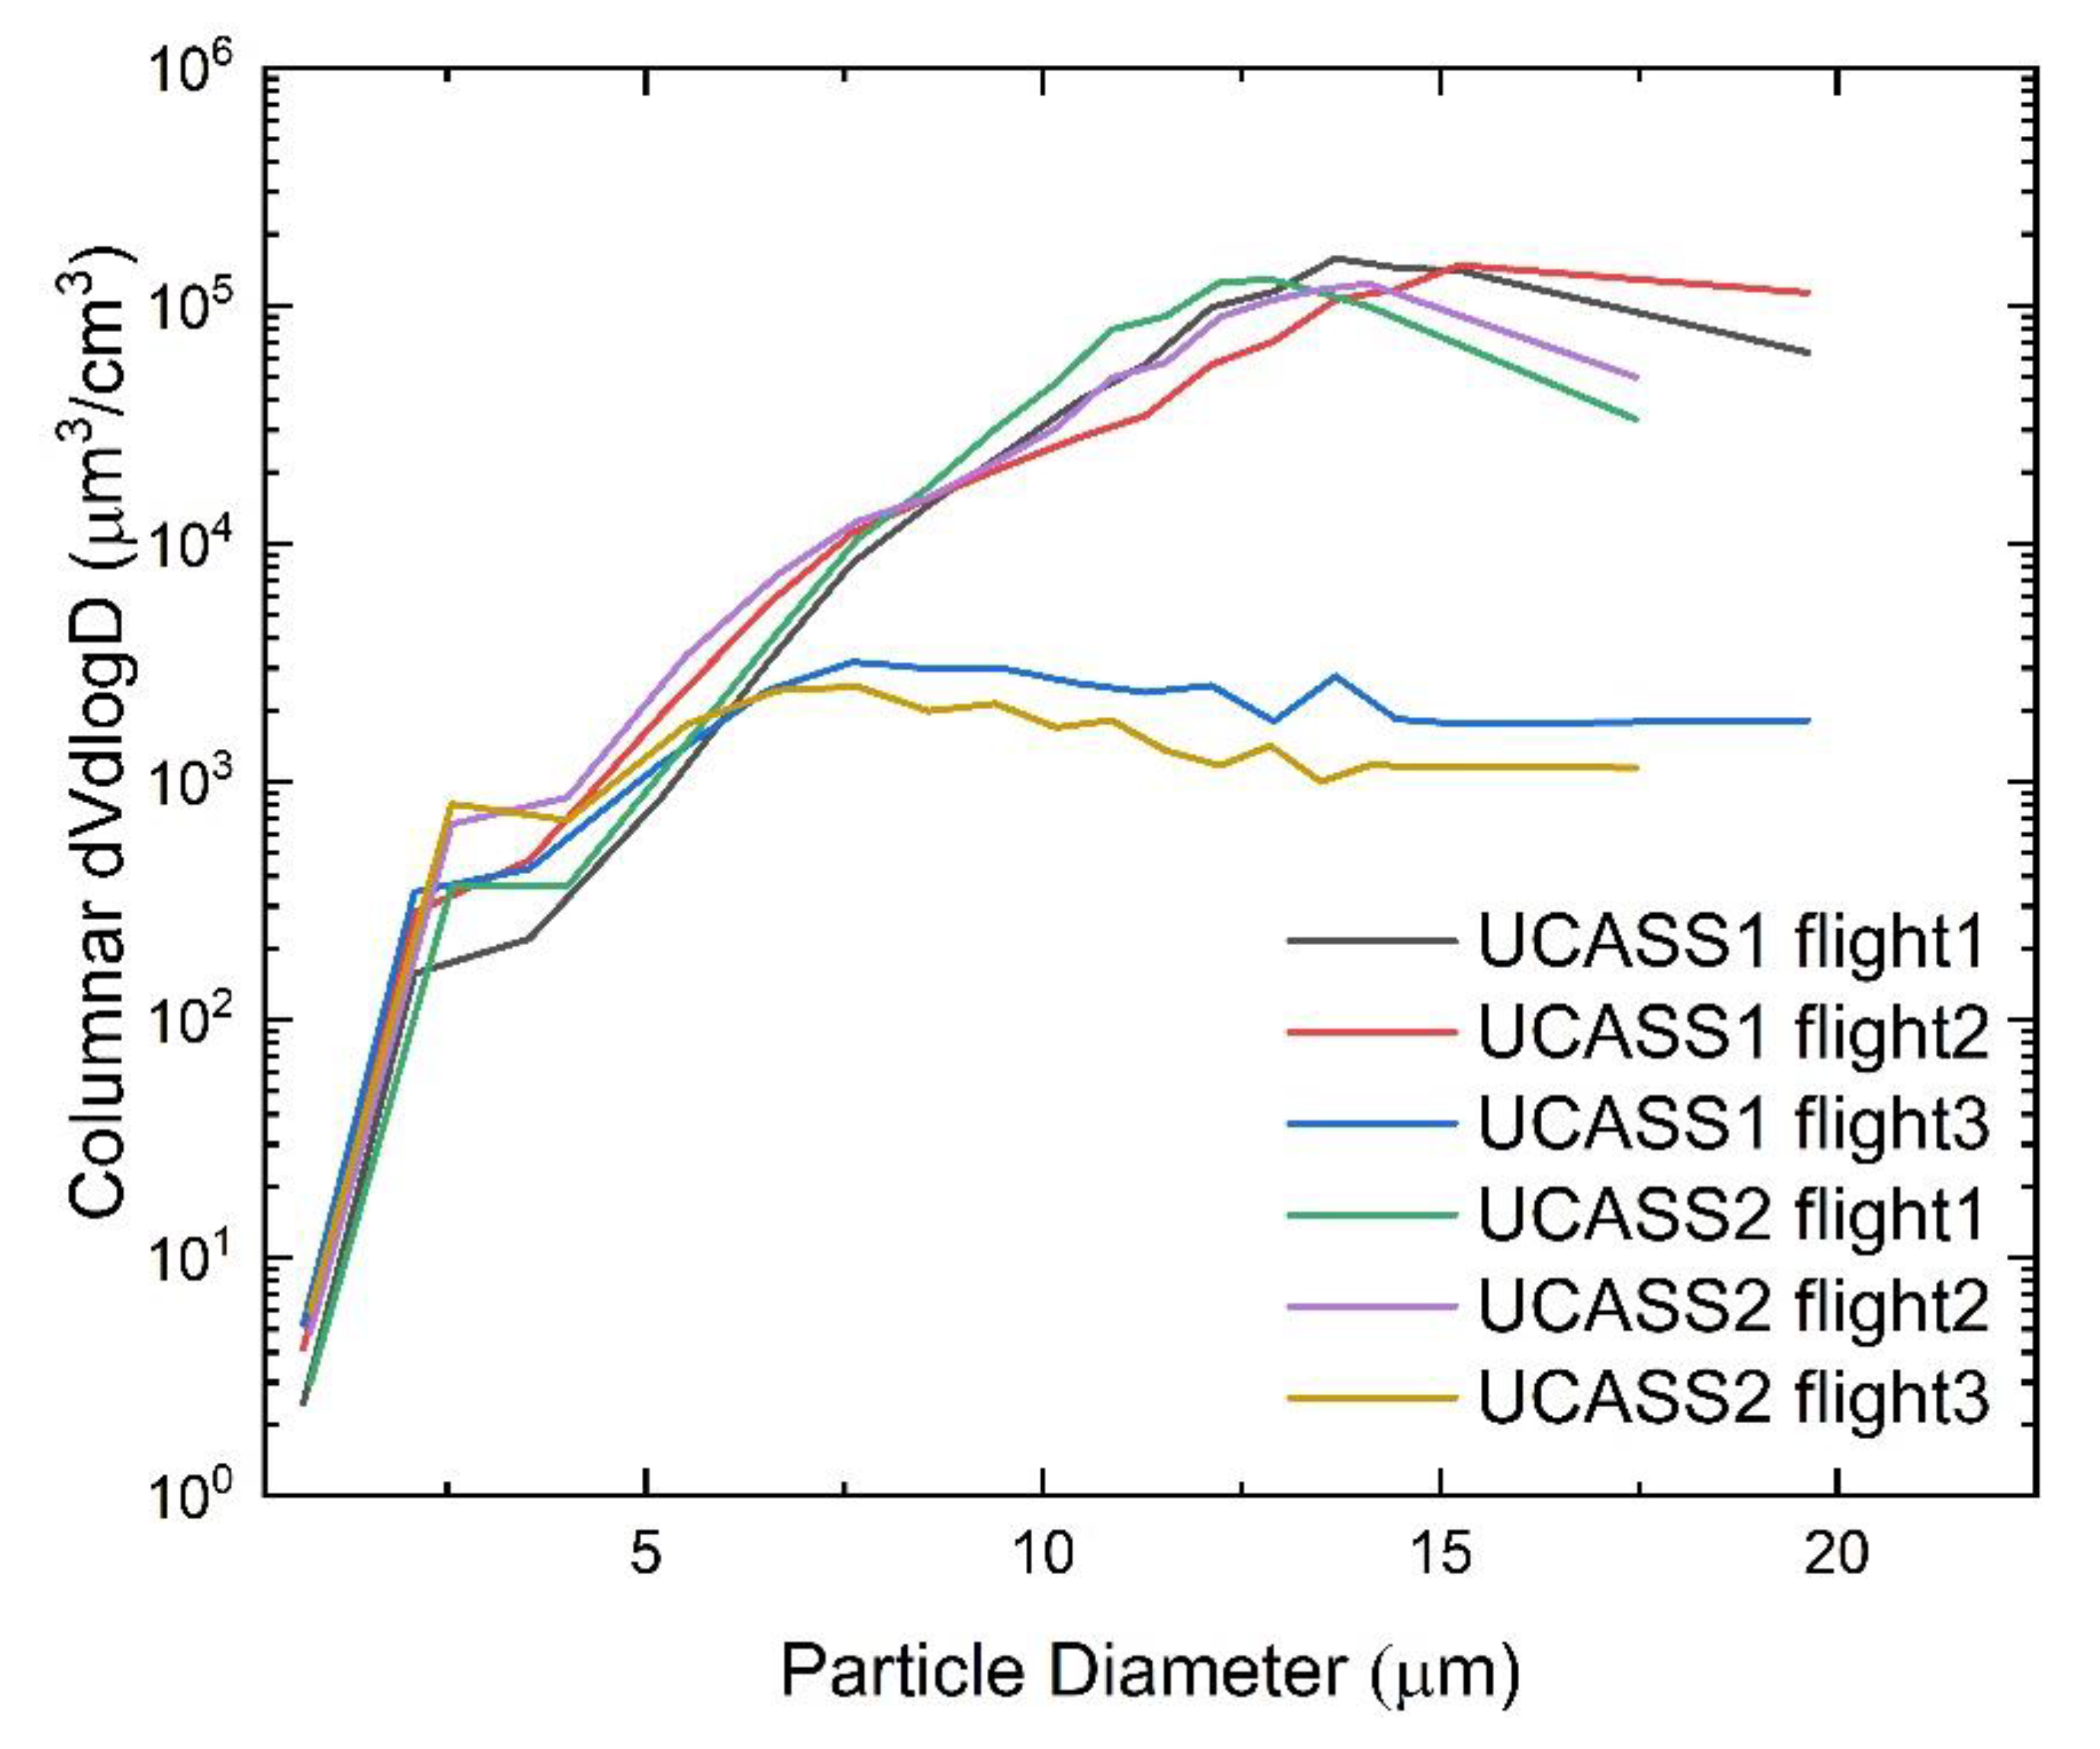
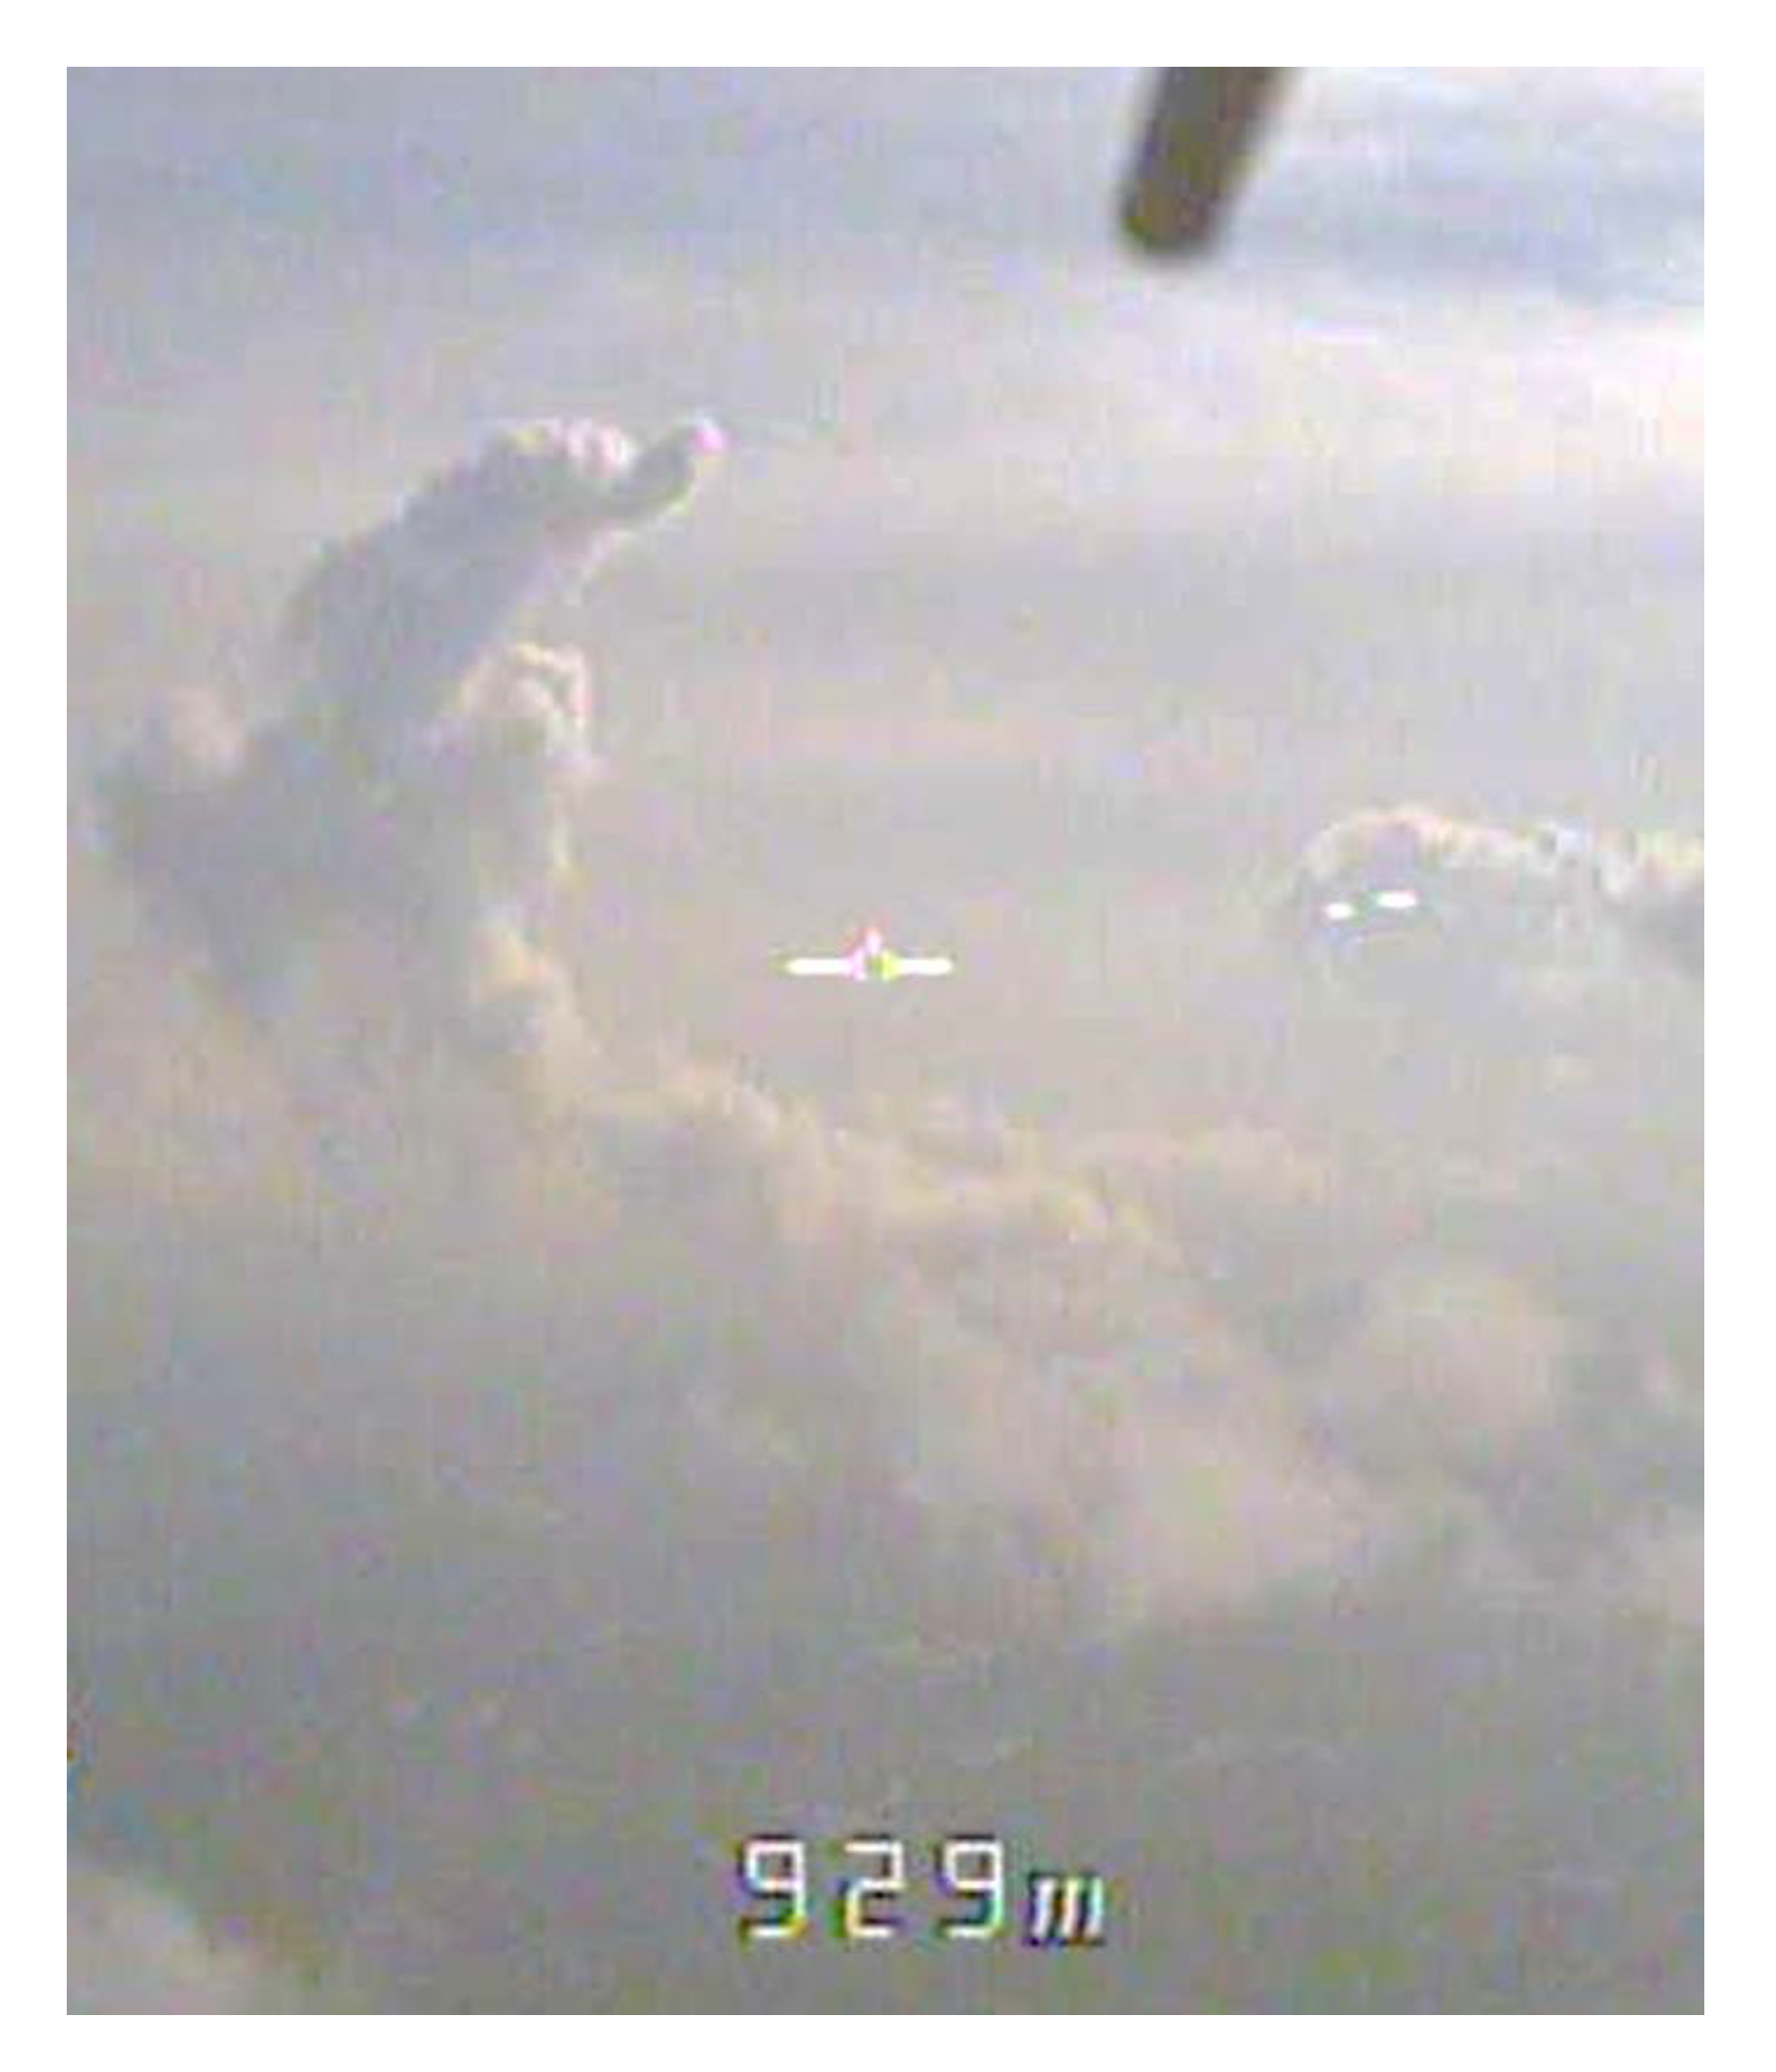
3.3. Profiling of Aerosol-Cloud Interaction Observations over Northern Finland
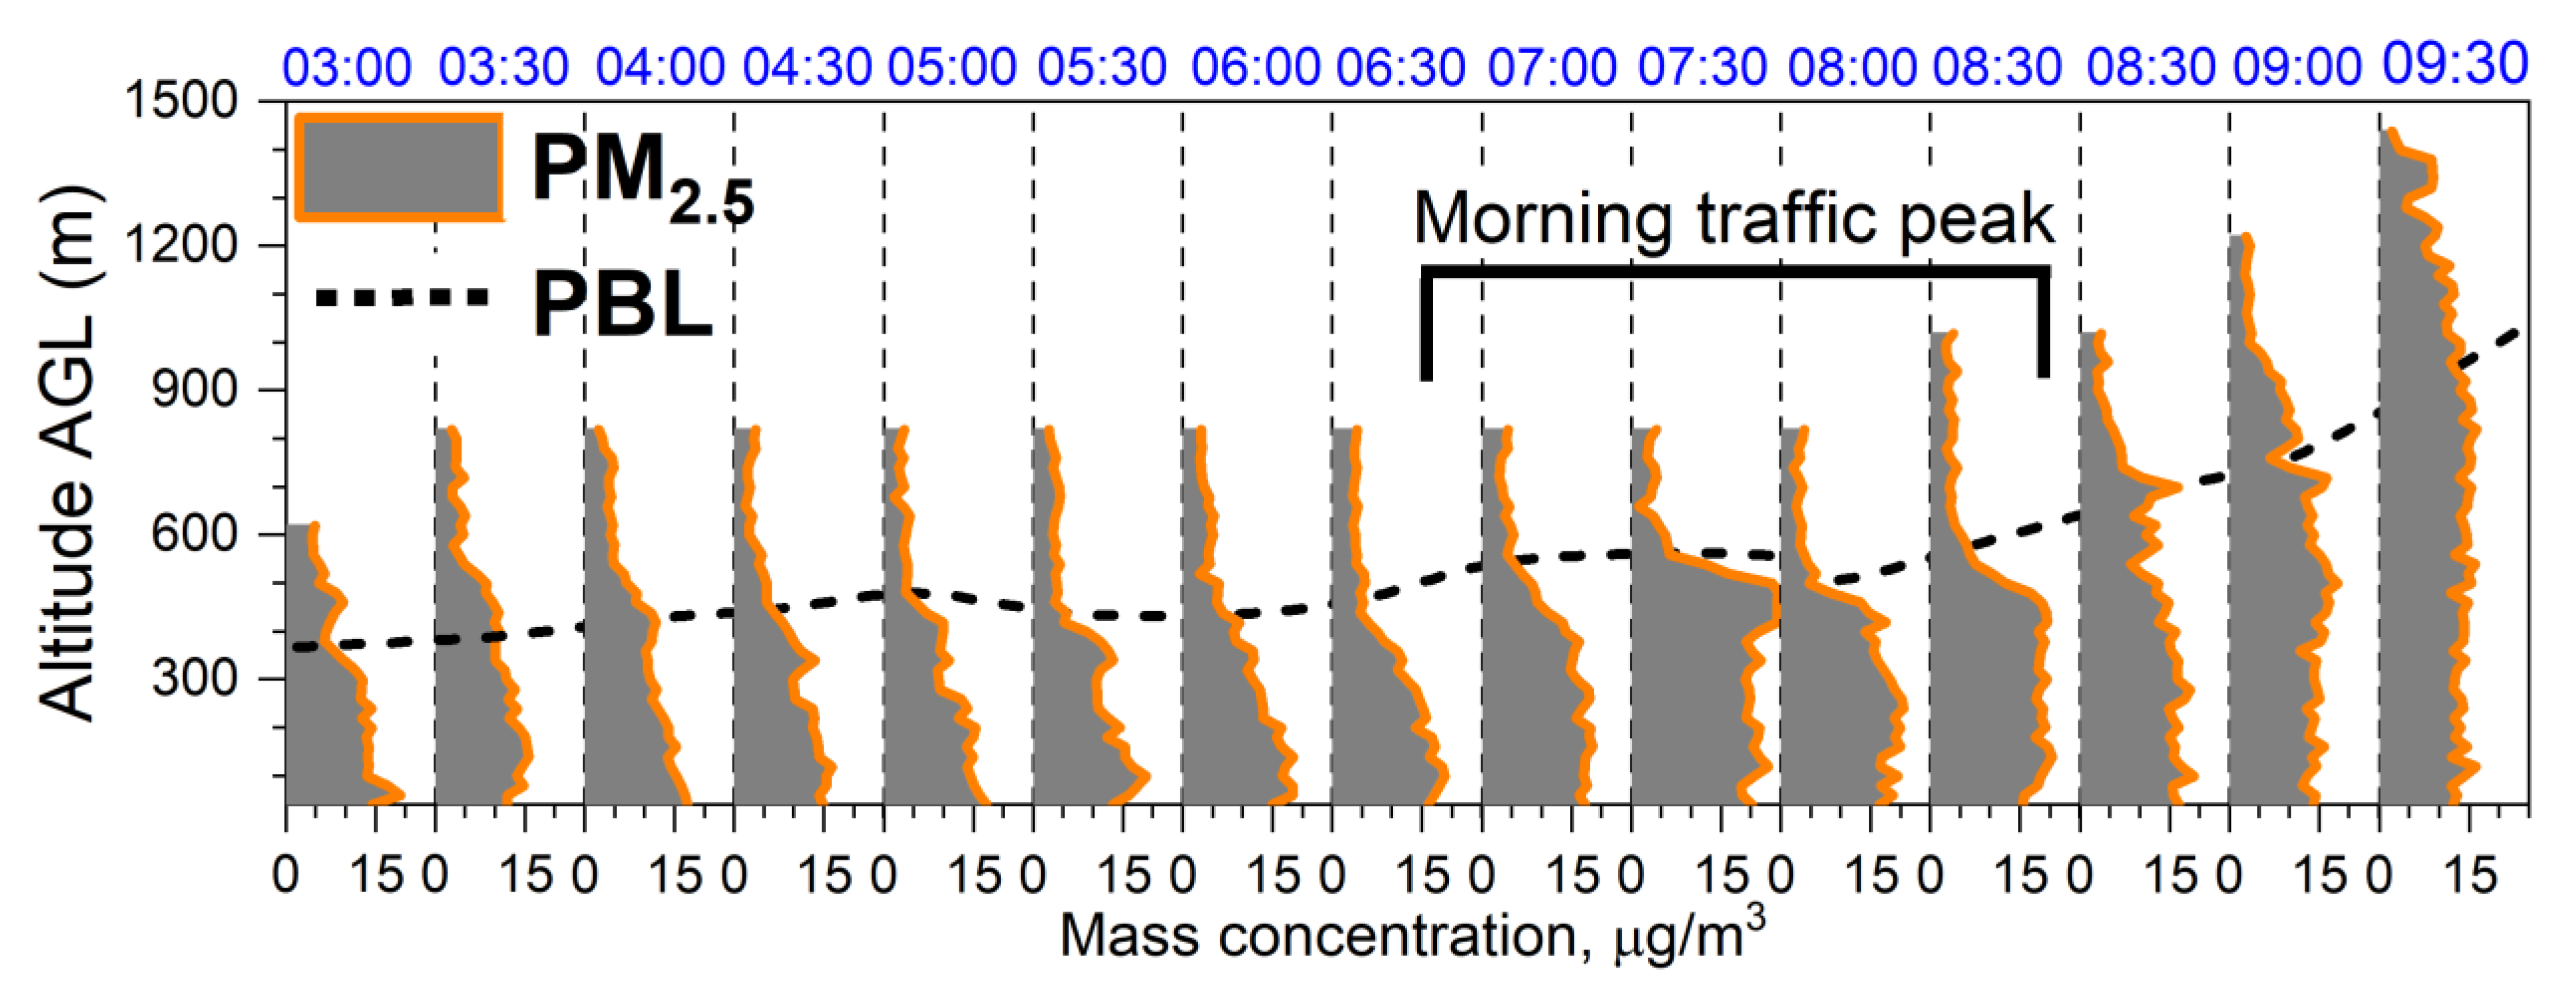
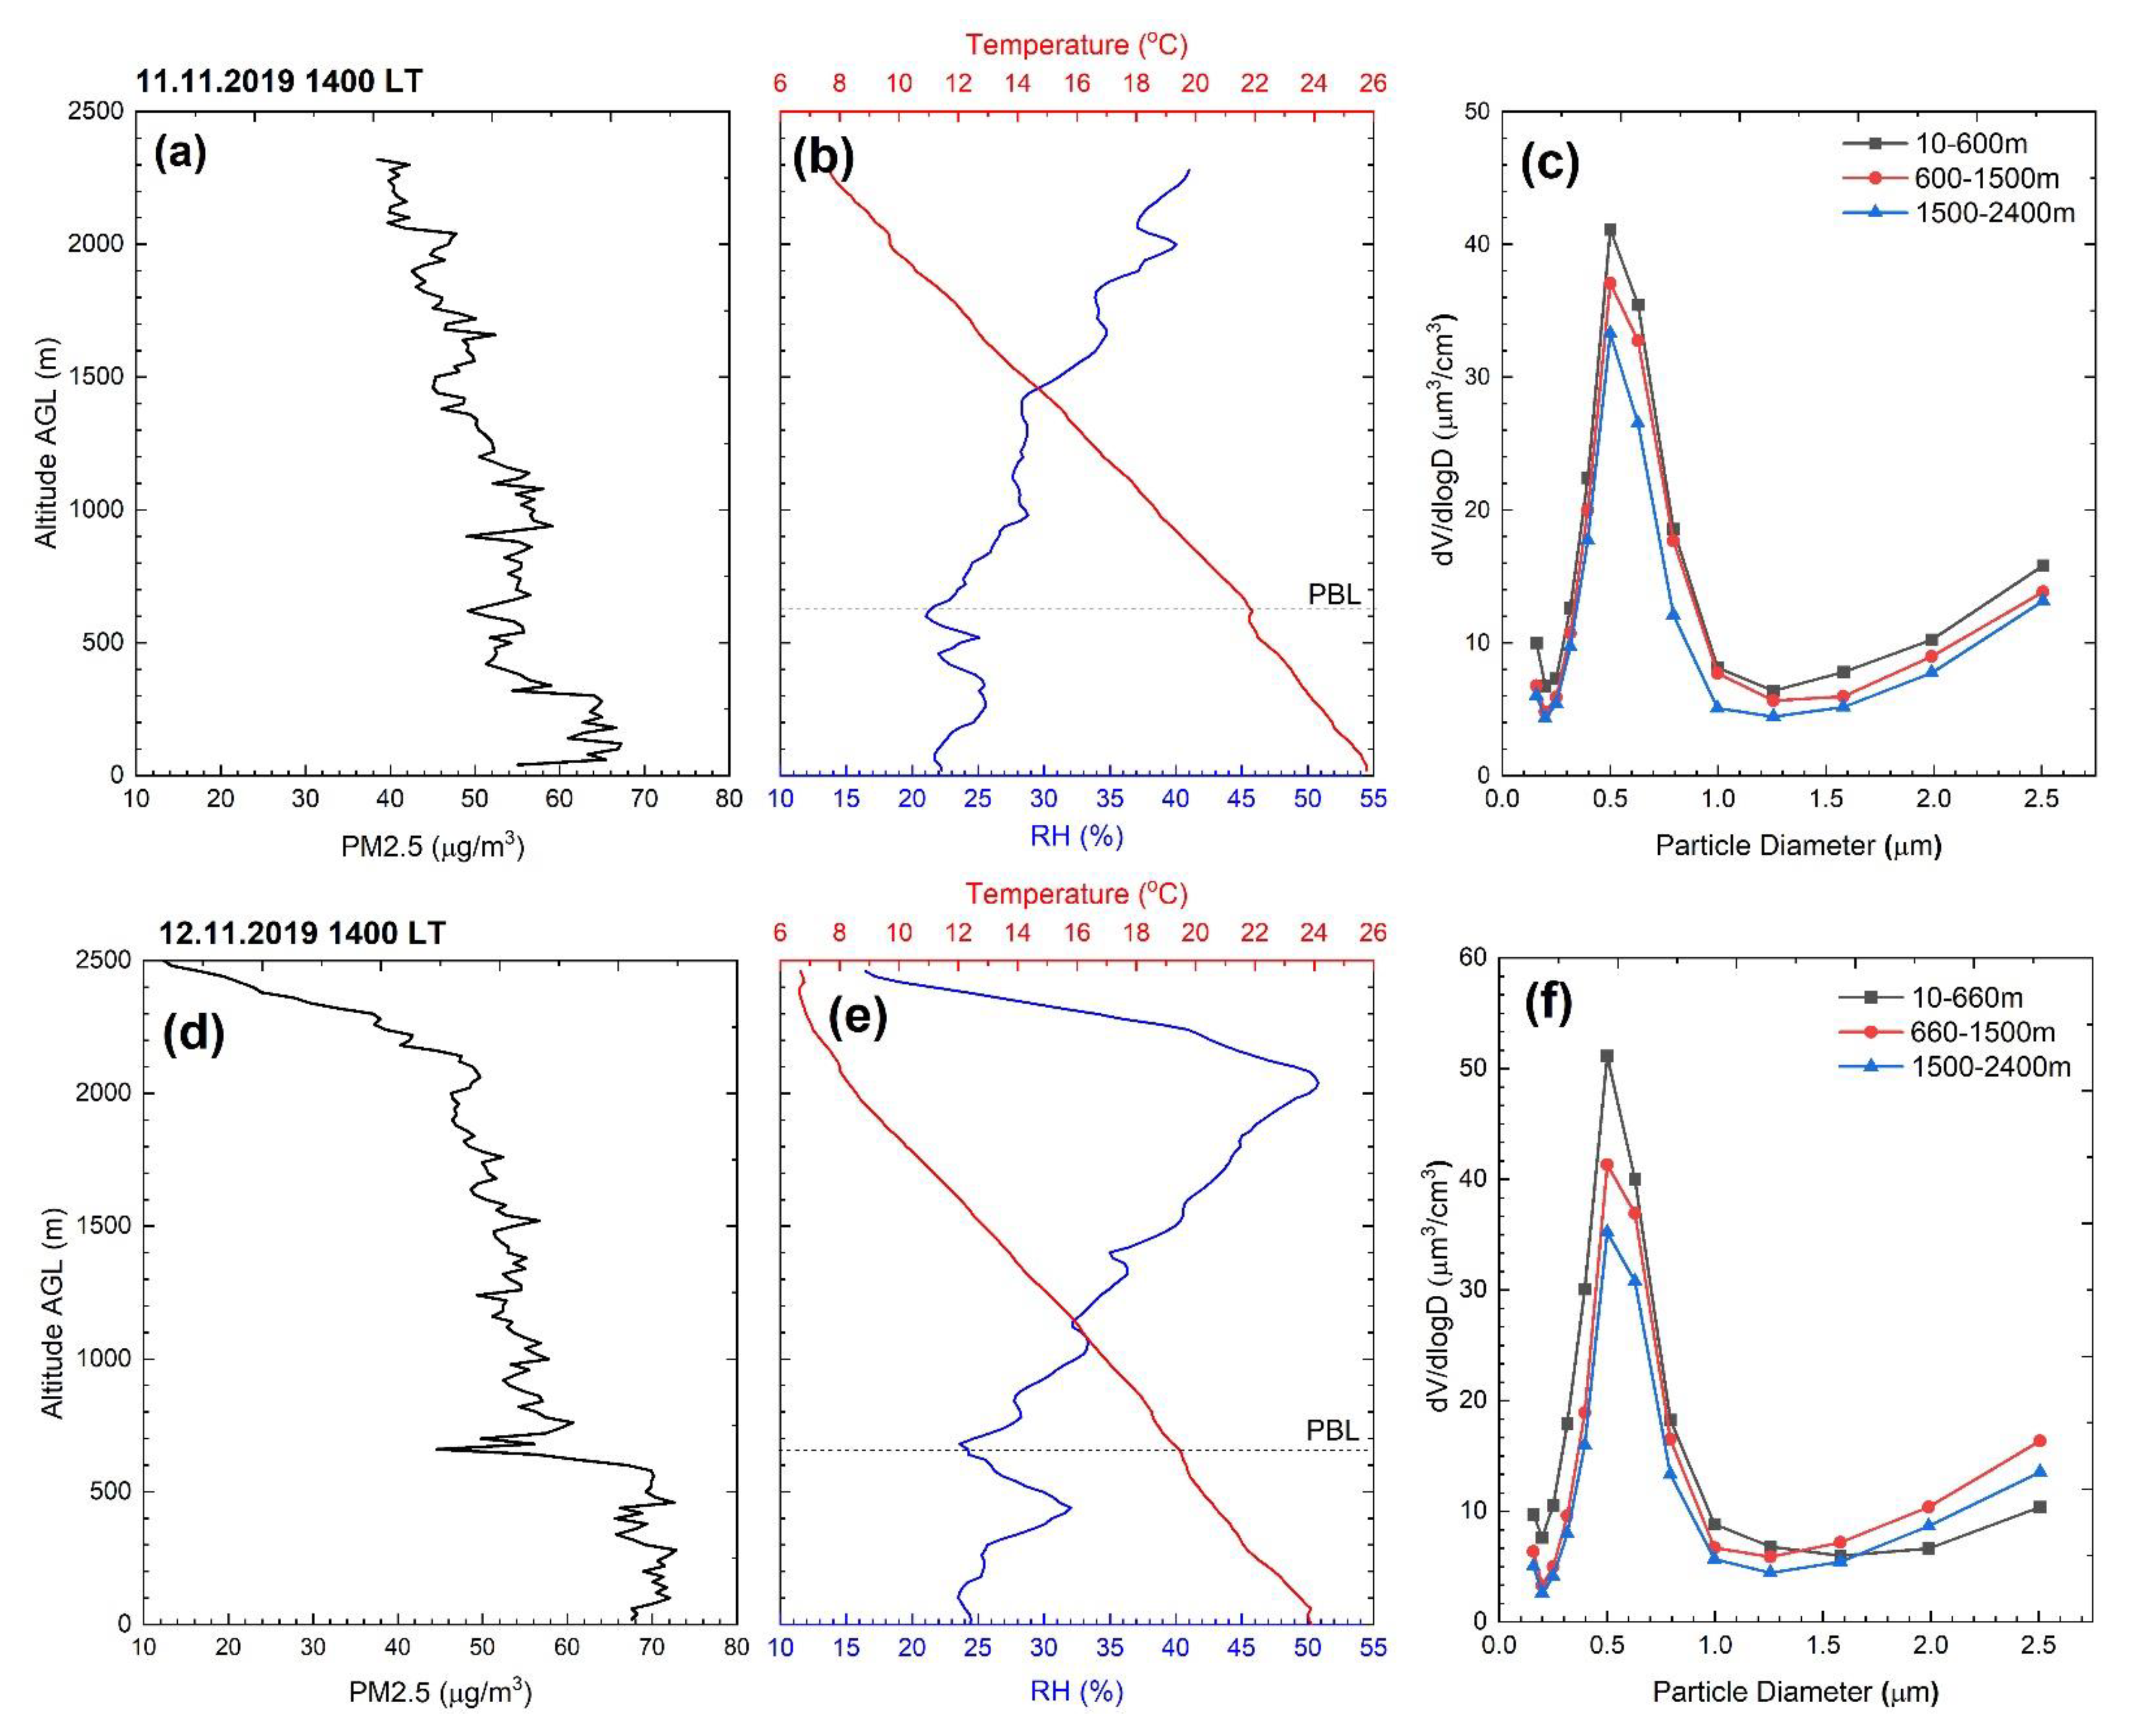
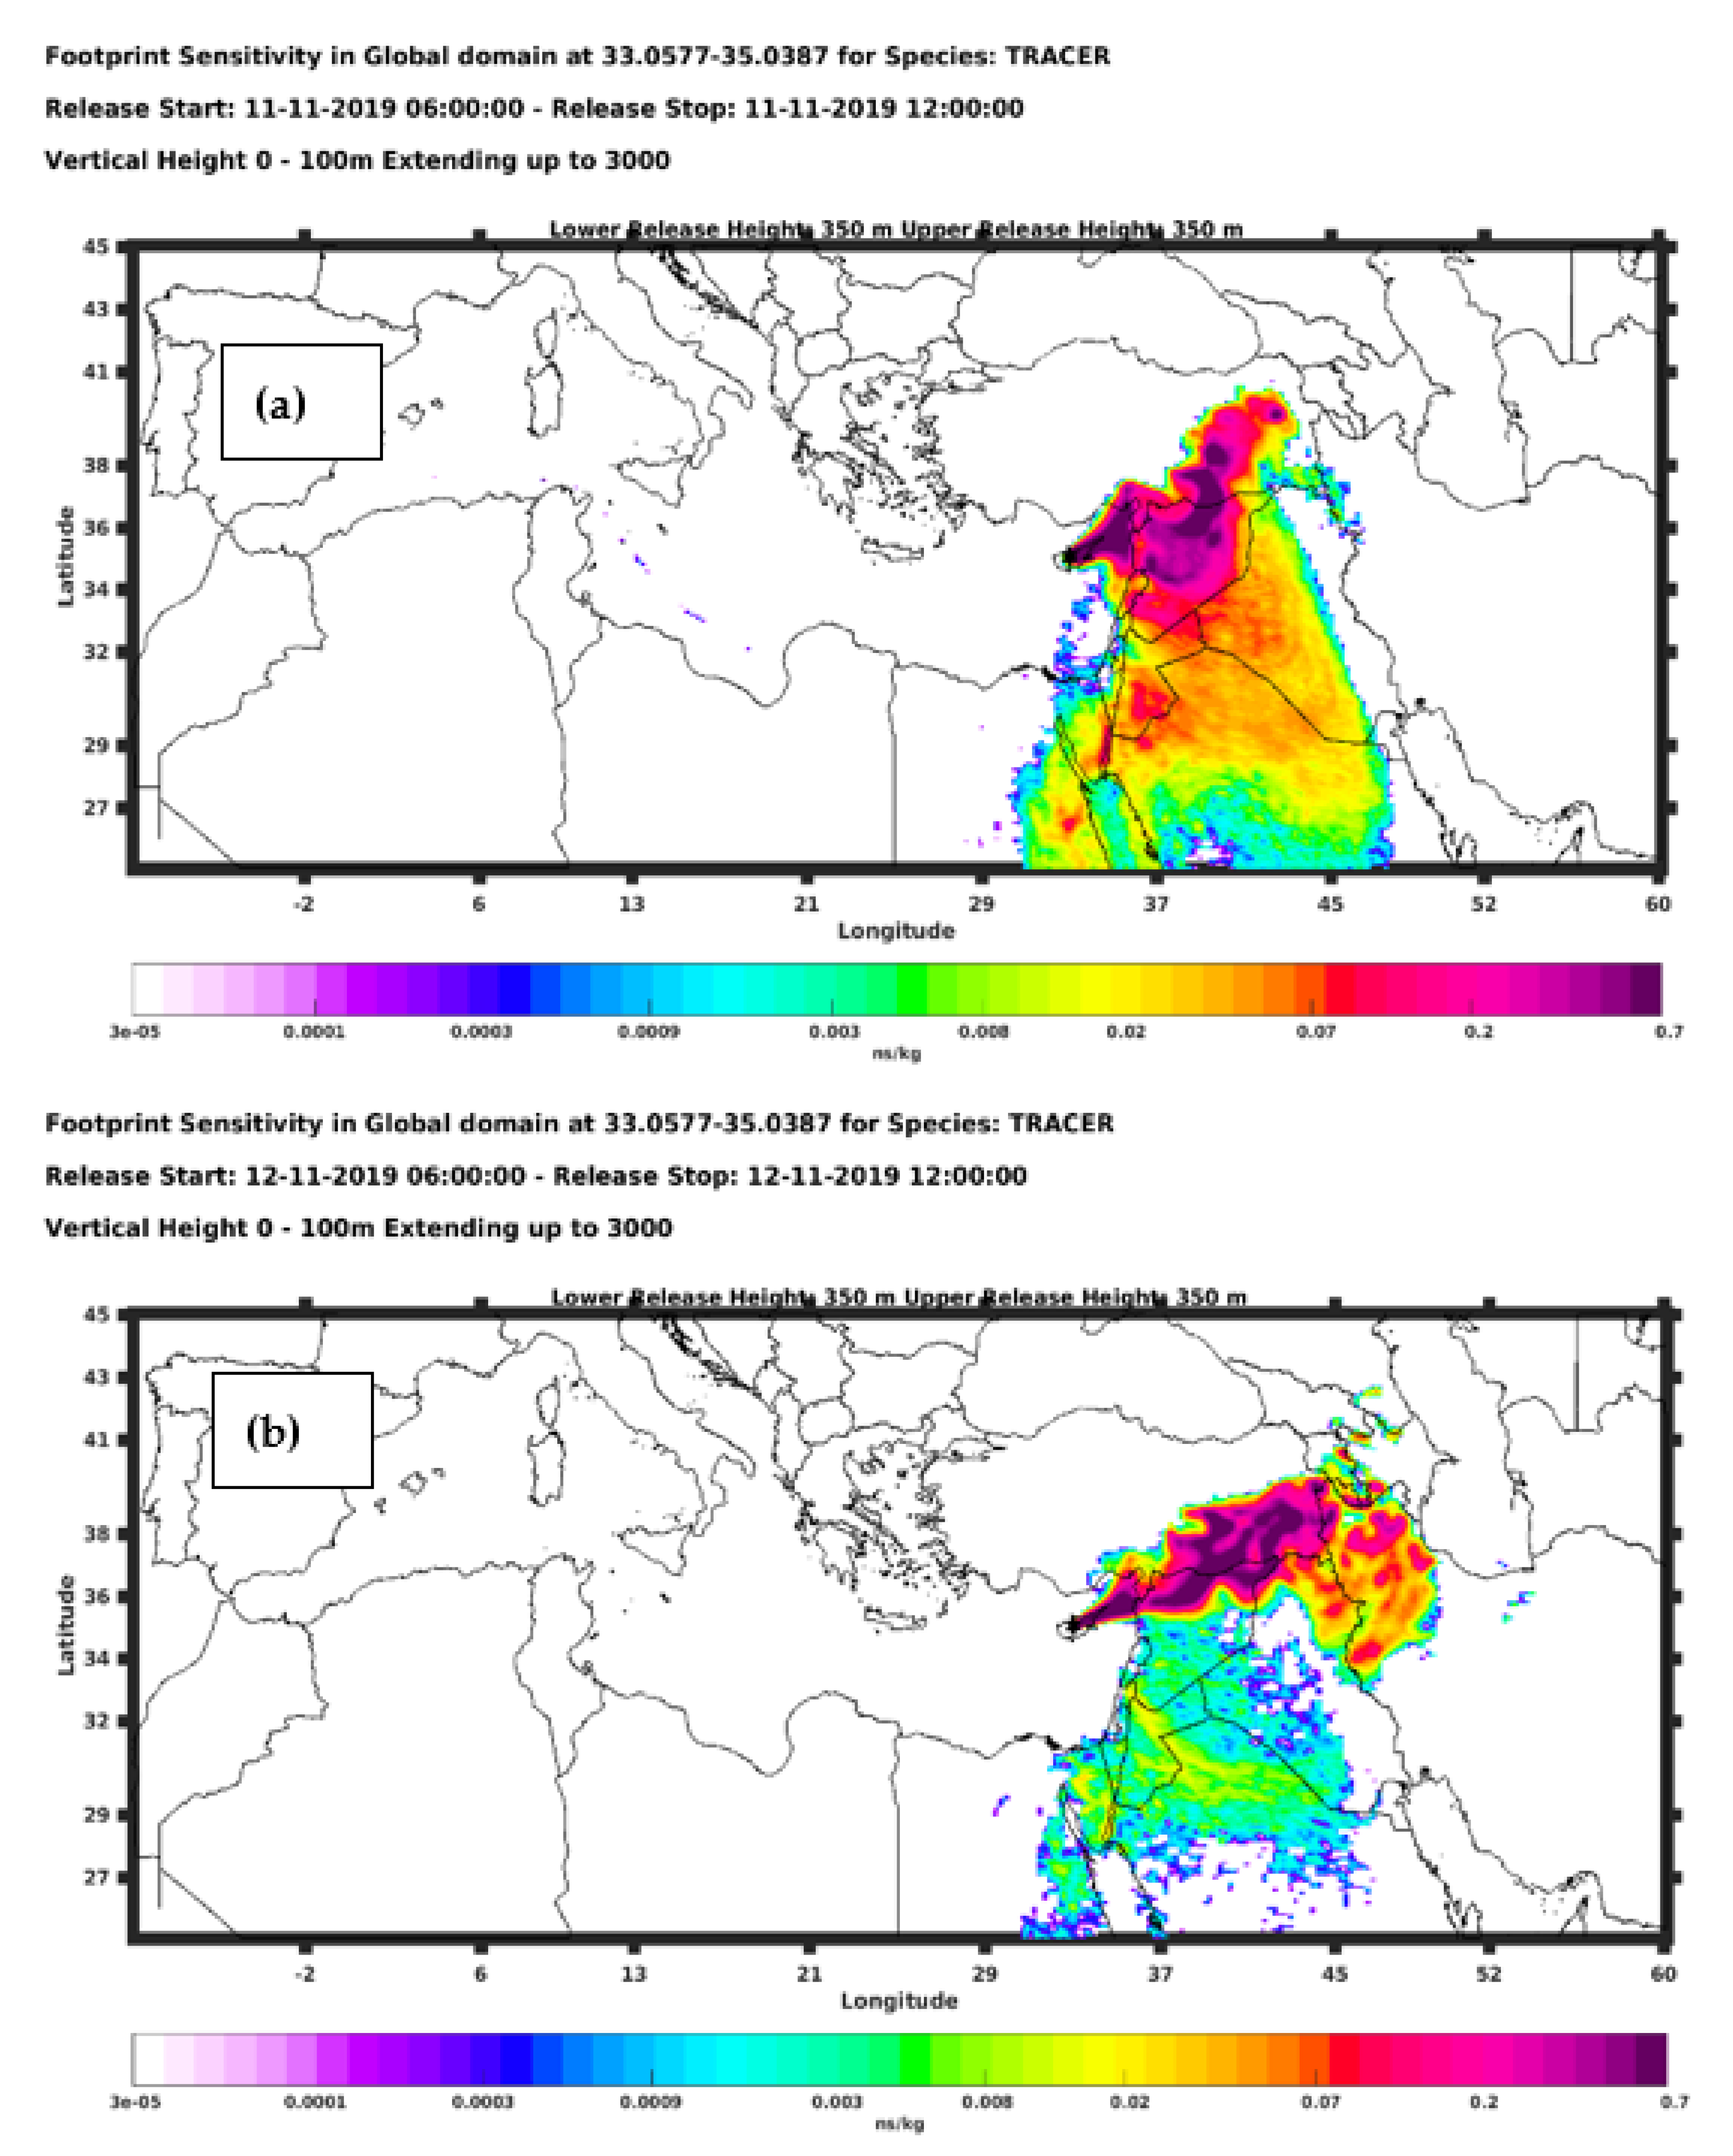
3.4. Intensive Profiling of PM2.5 over Nicosia
3.5. Profiling of Aerosol Properties in Various Marine Regions
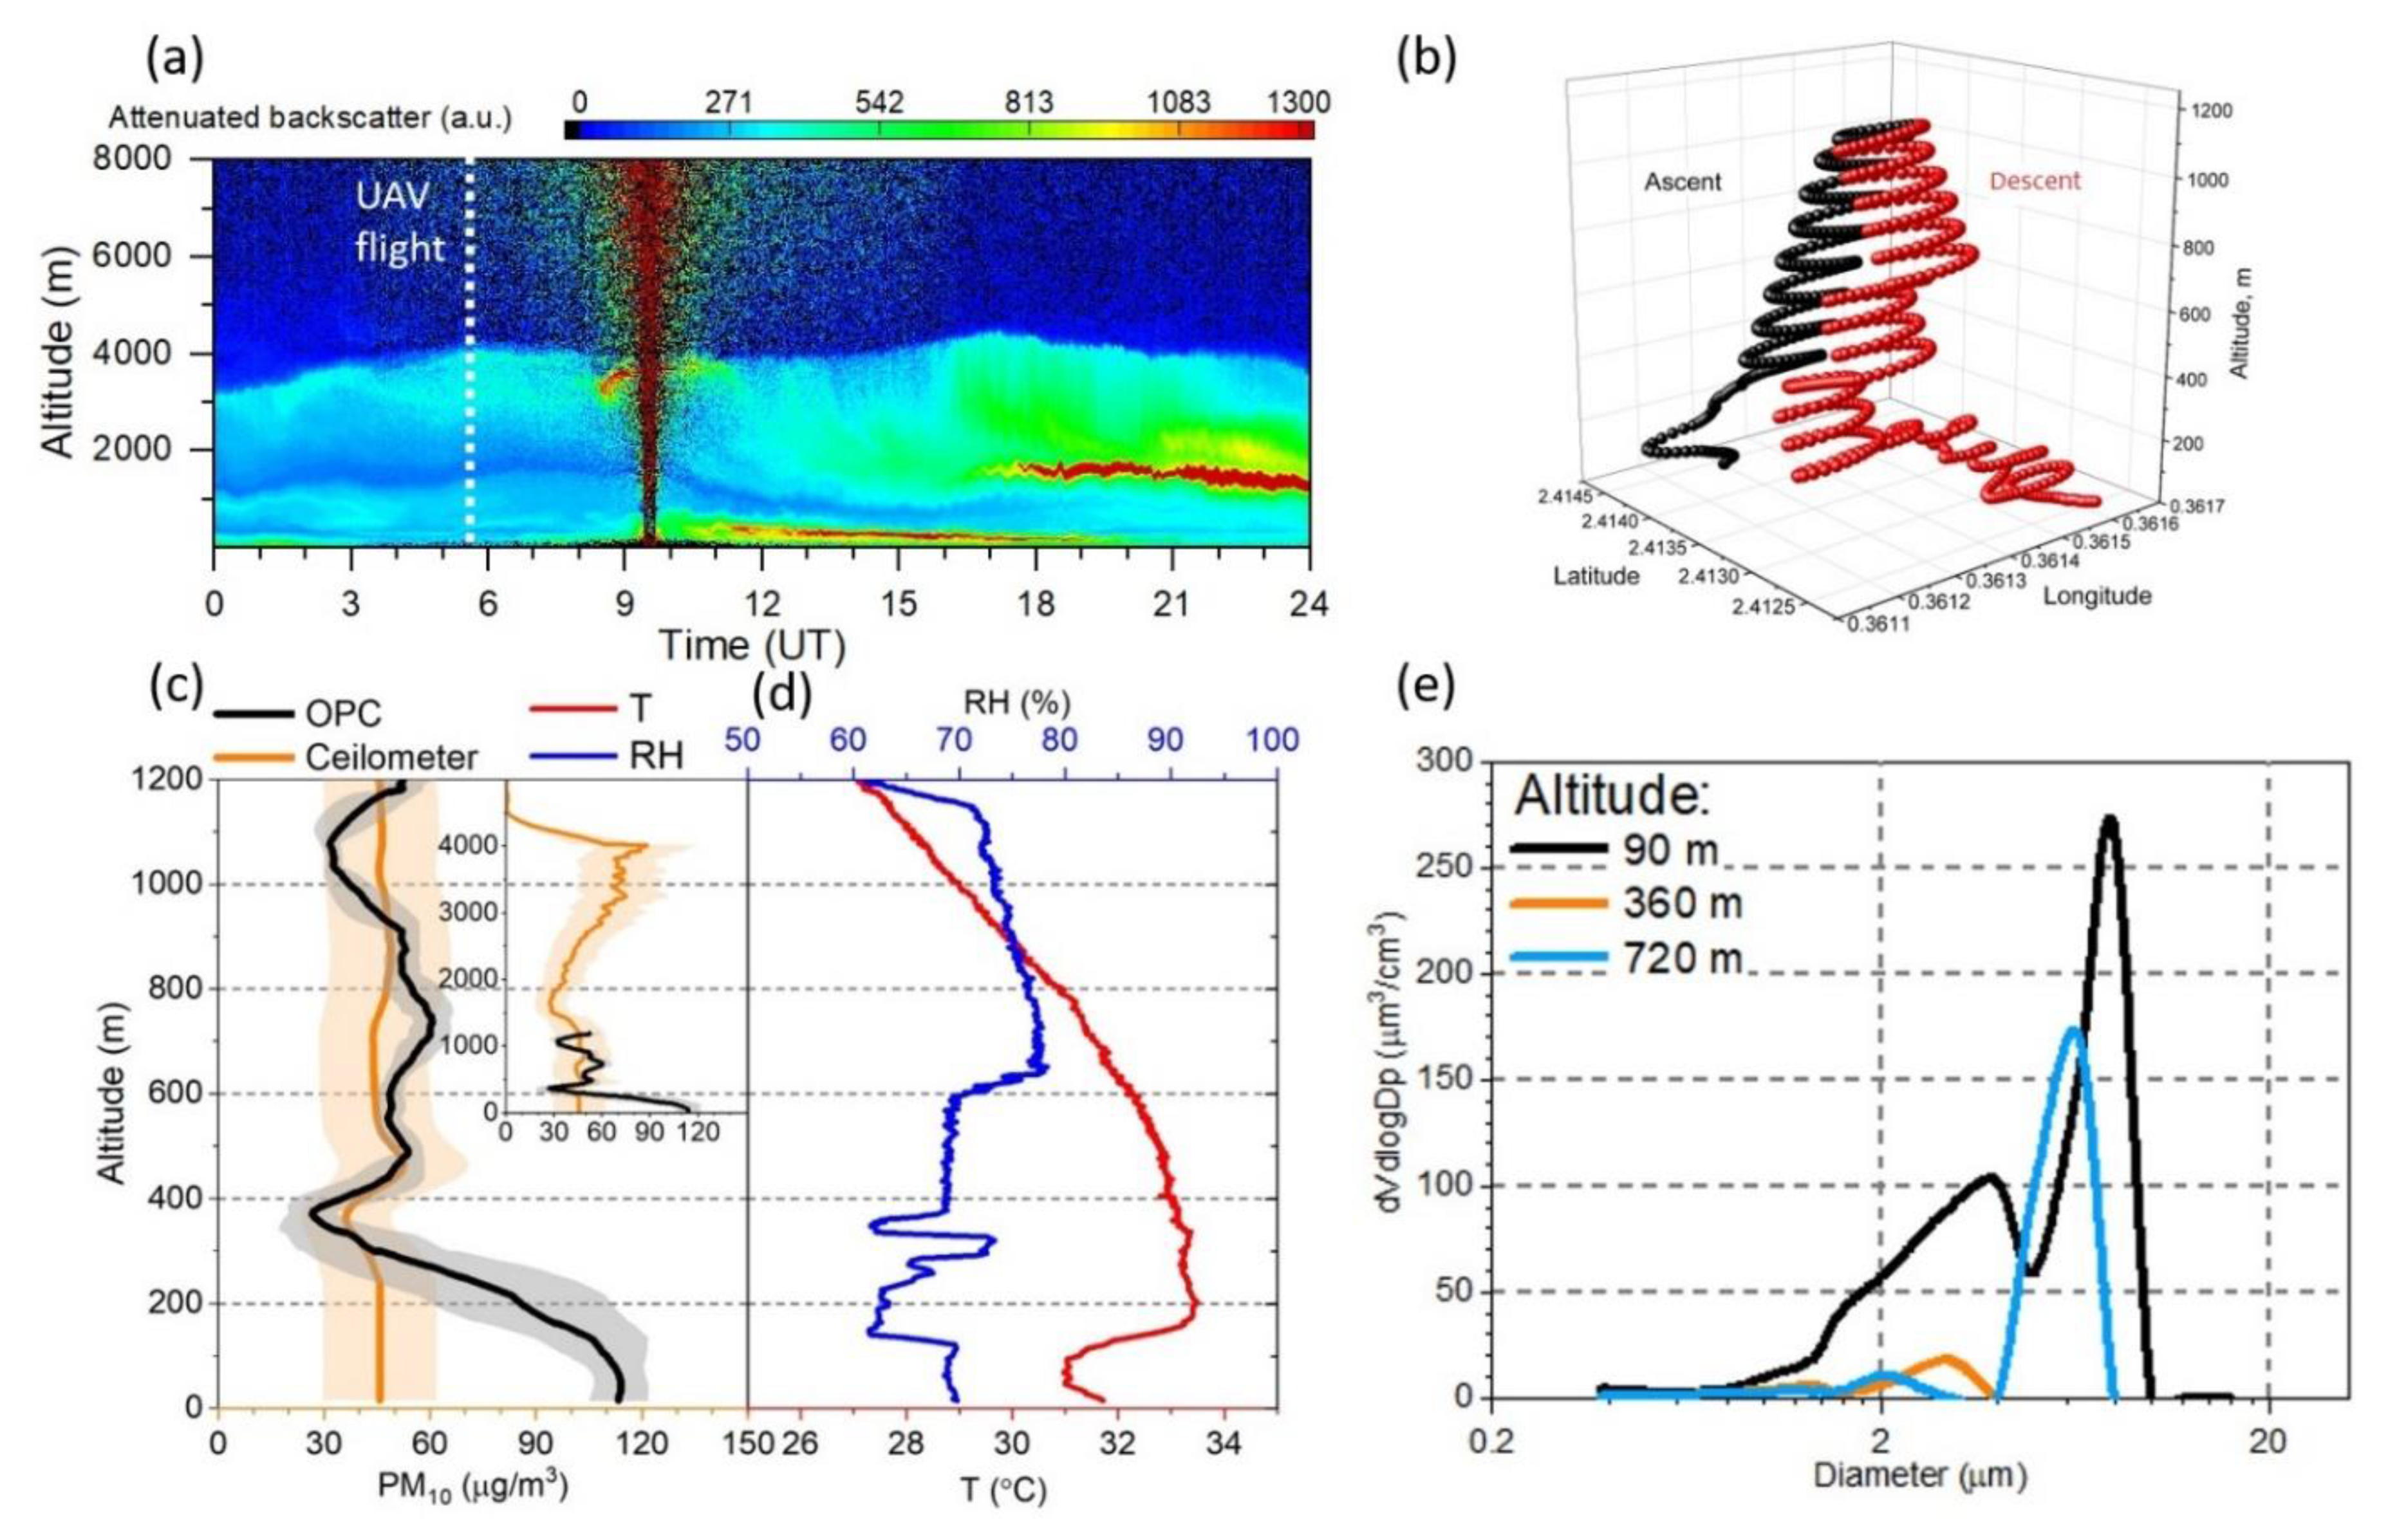
3.6. Profiling of Aerosol Properties during Dust Events over Cyprus
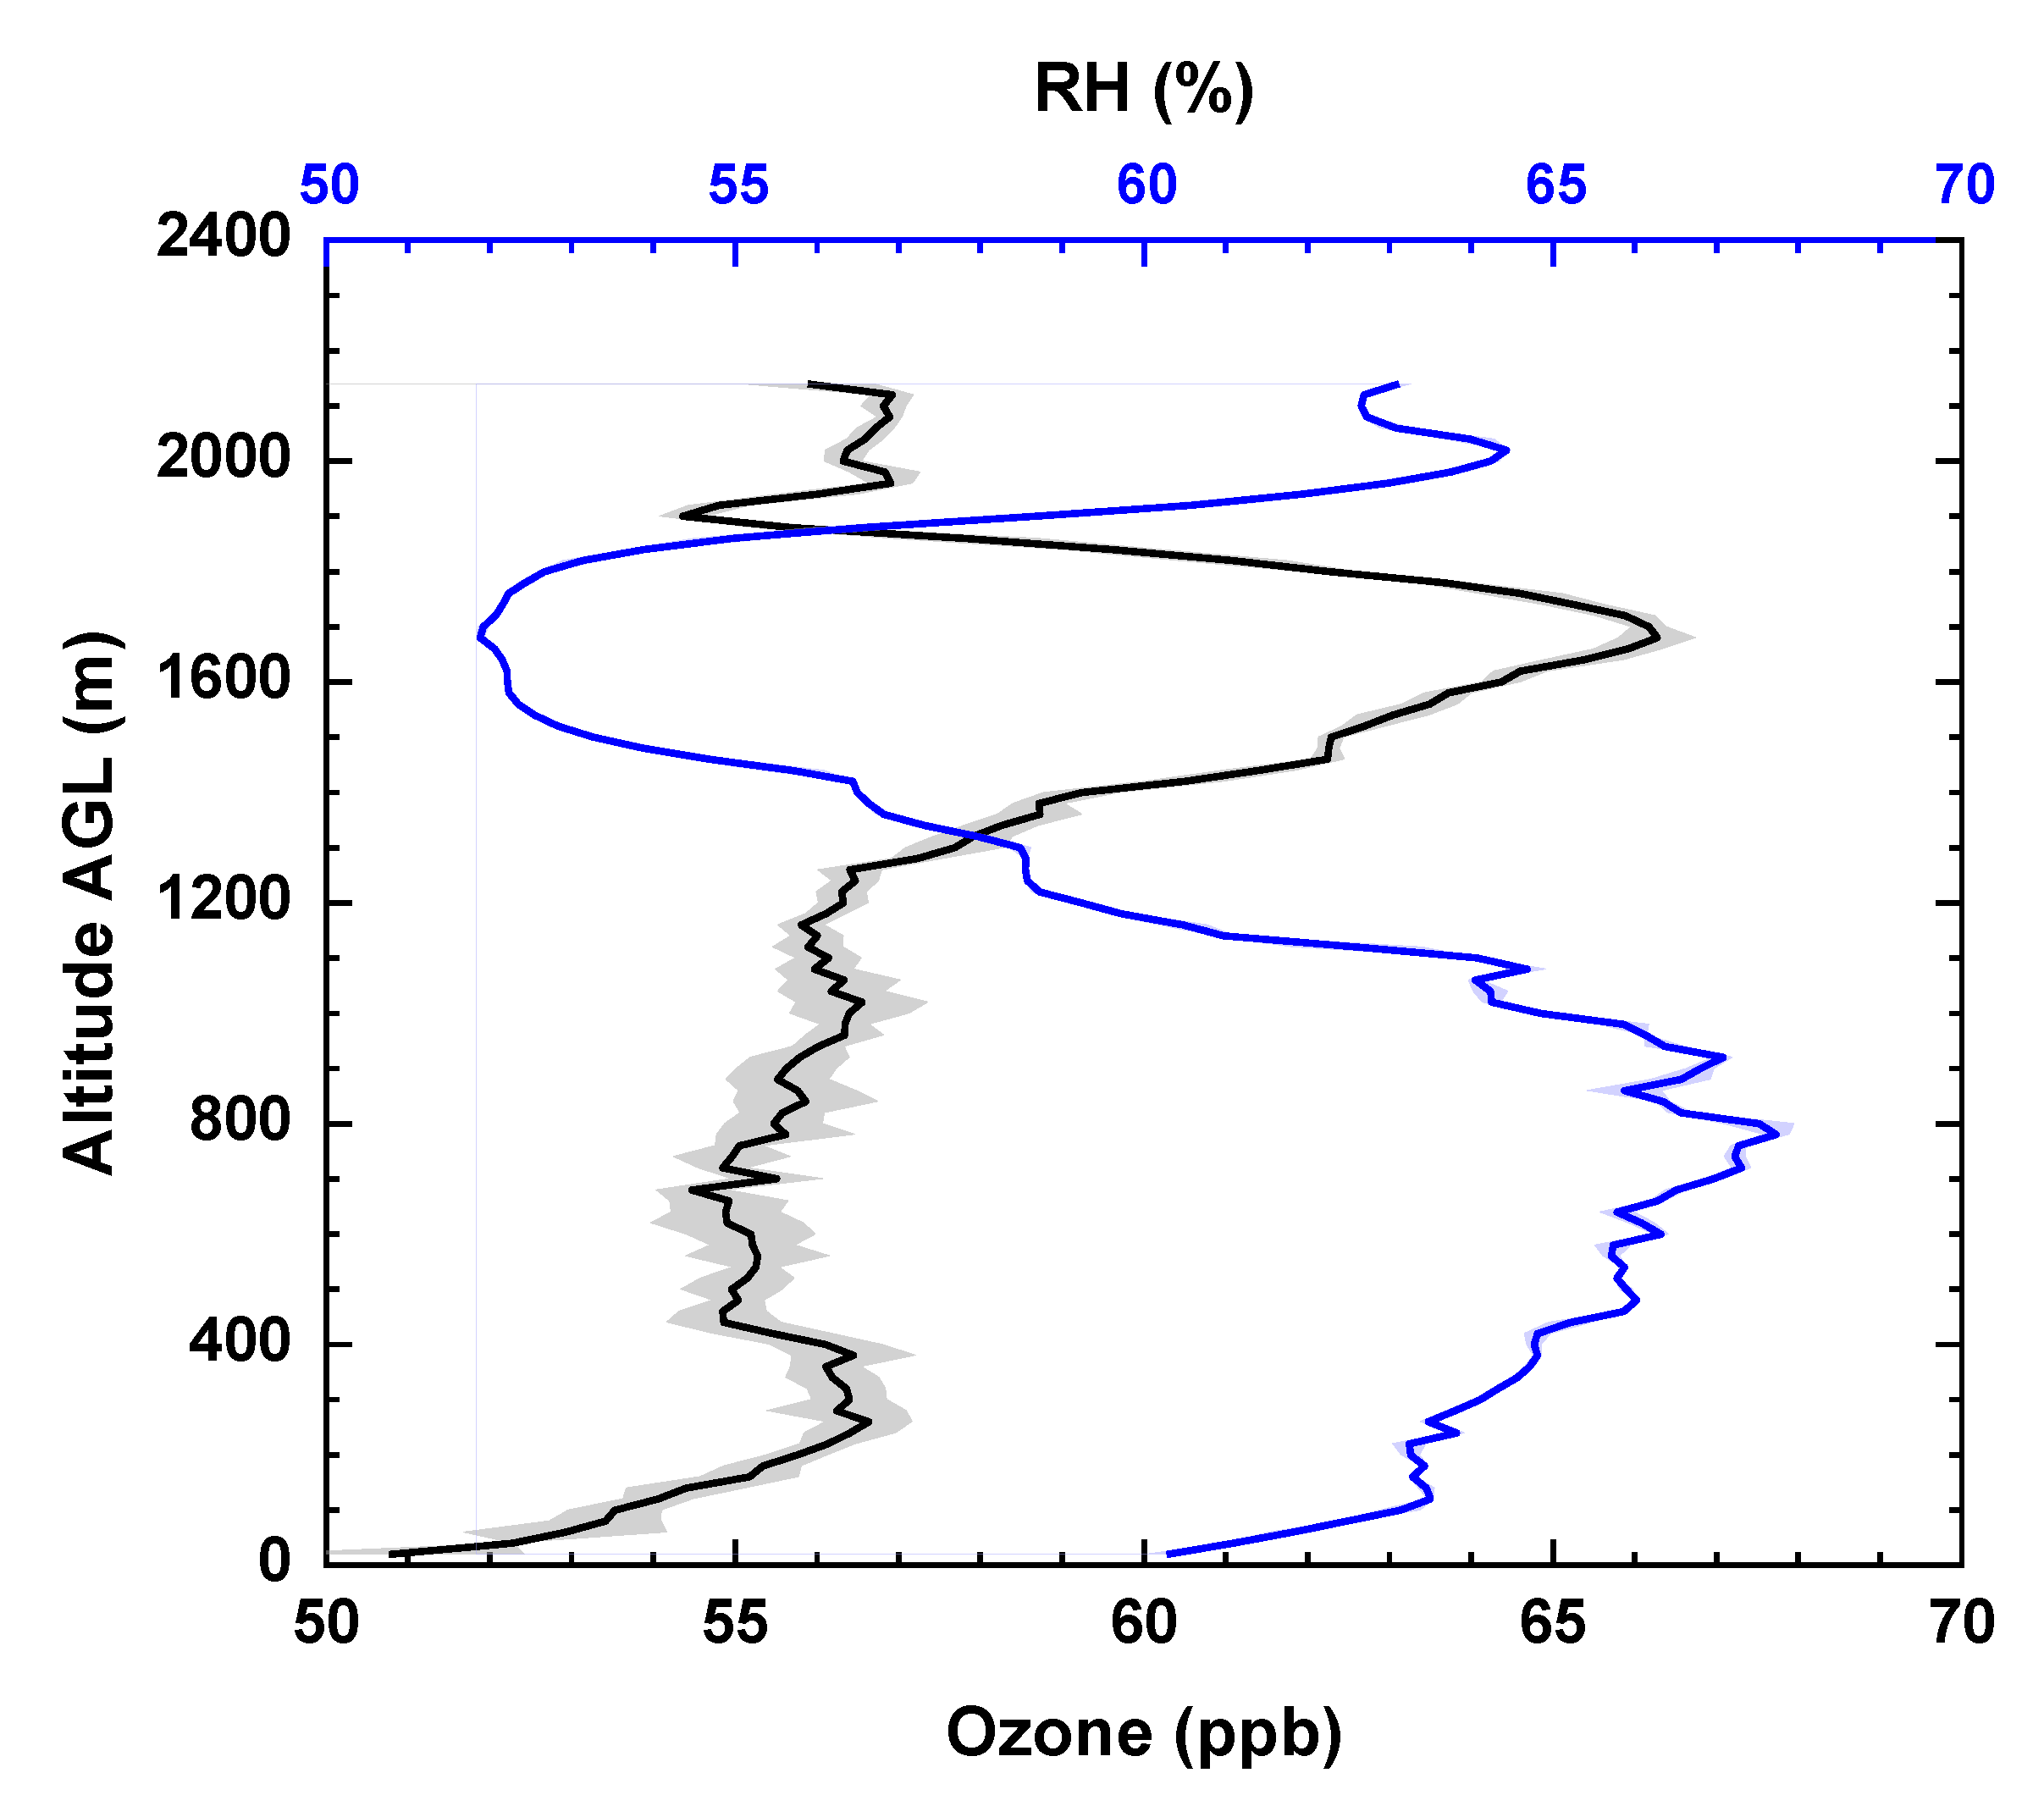
3.7. Ozone Profiling over Cyprus
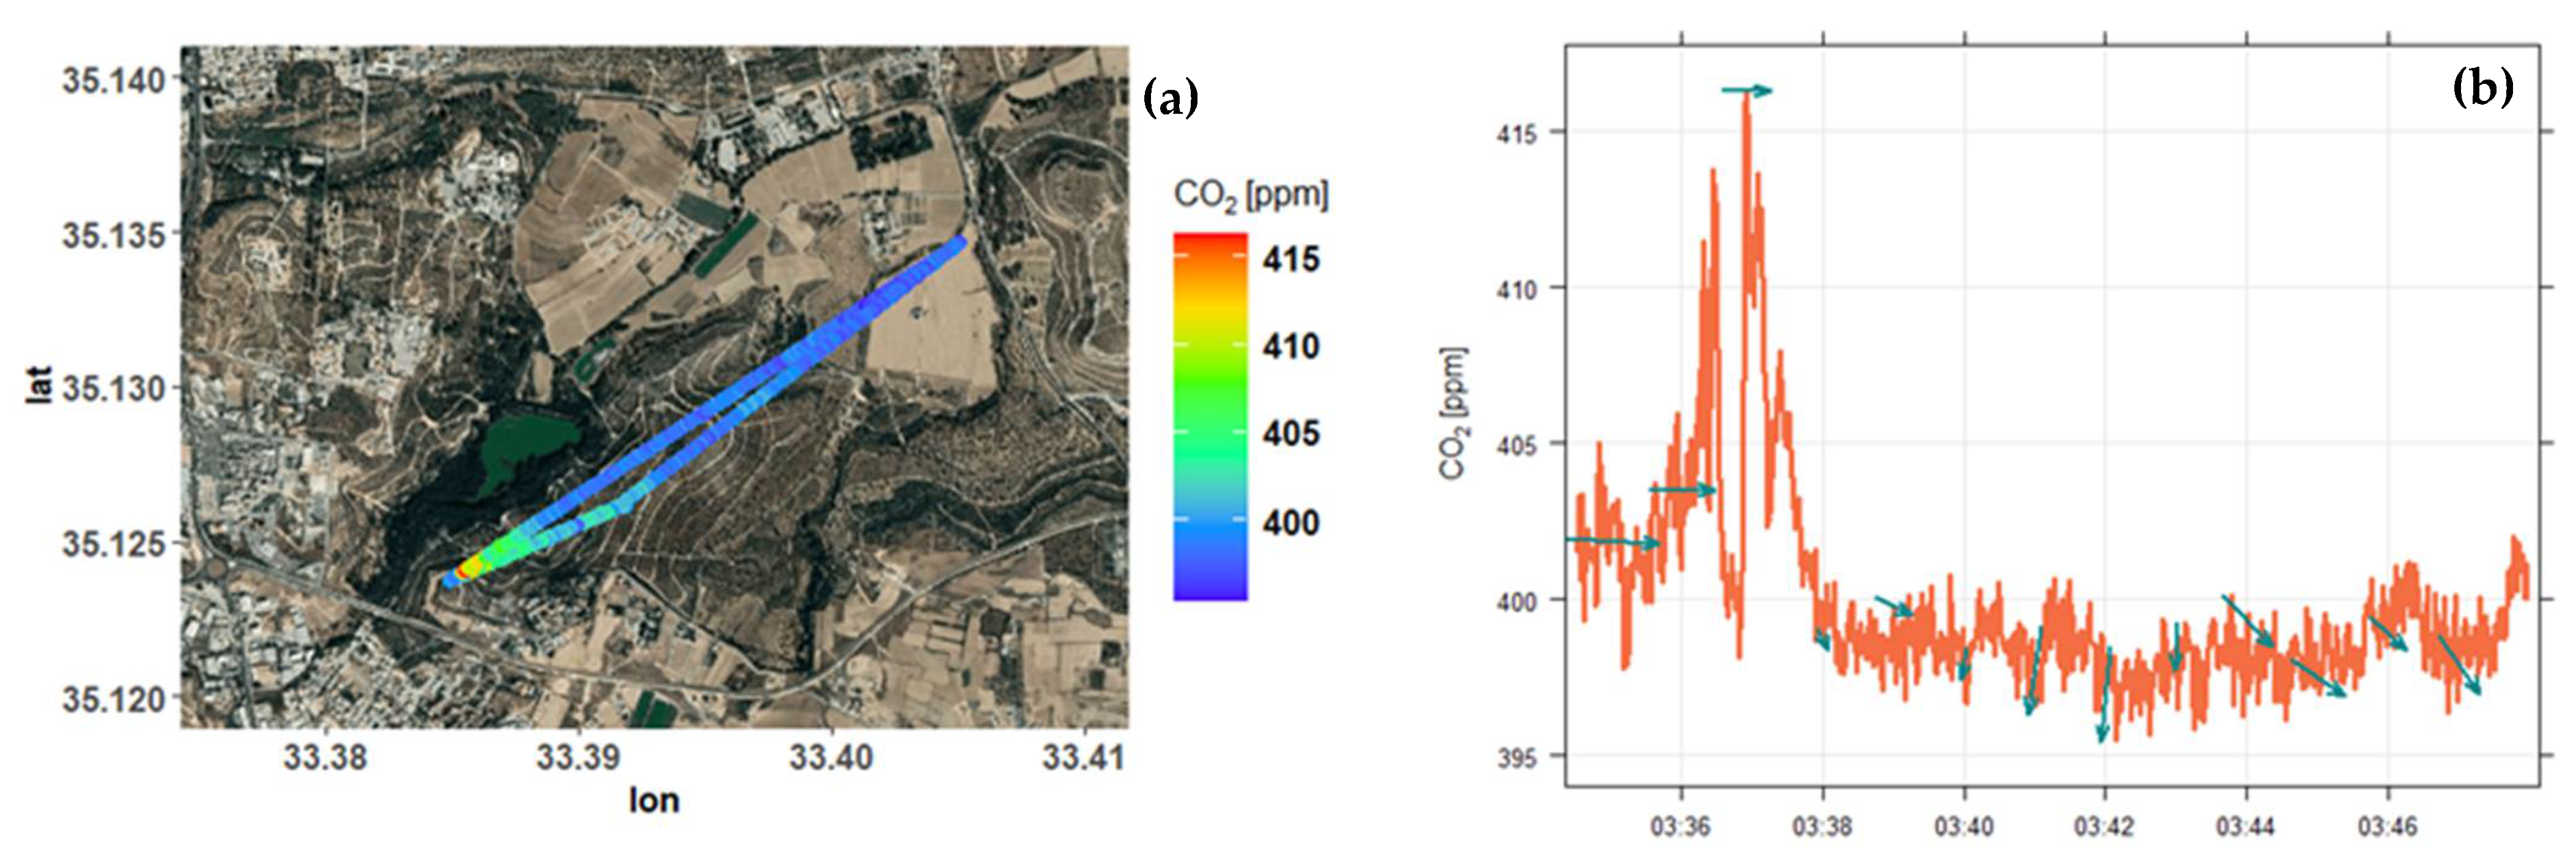
3.8. Mapping Close-to-the-Ground CO2 Concentrations
4. Conclusions
- (i)
- private airfield and permanent airspace located at a rural background site of Cyprus, enabling direct comparison of UAV atmospheric measurements with nearby ground-based high-quality observations part of large (inter)national atmospheric networks;
- (ii)
- state-of-the-art workshops for the construction of specific UAV components and customized integration of atmospheric sensors;
- (iii)
- in-house fixed and mobile Ground Control Station (software) to remotely pilot and operate UAVs from various locations;
- (iv)
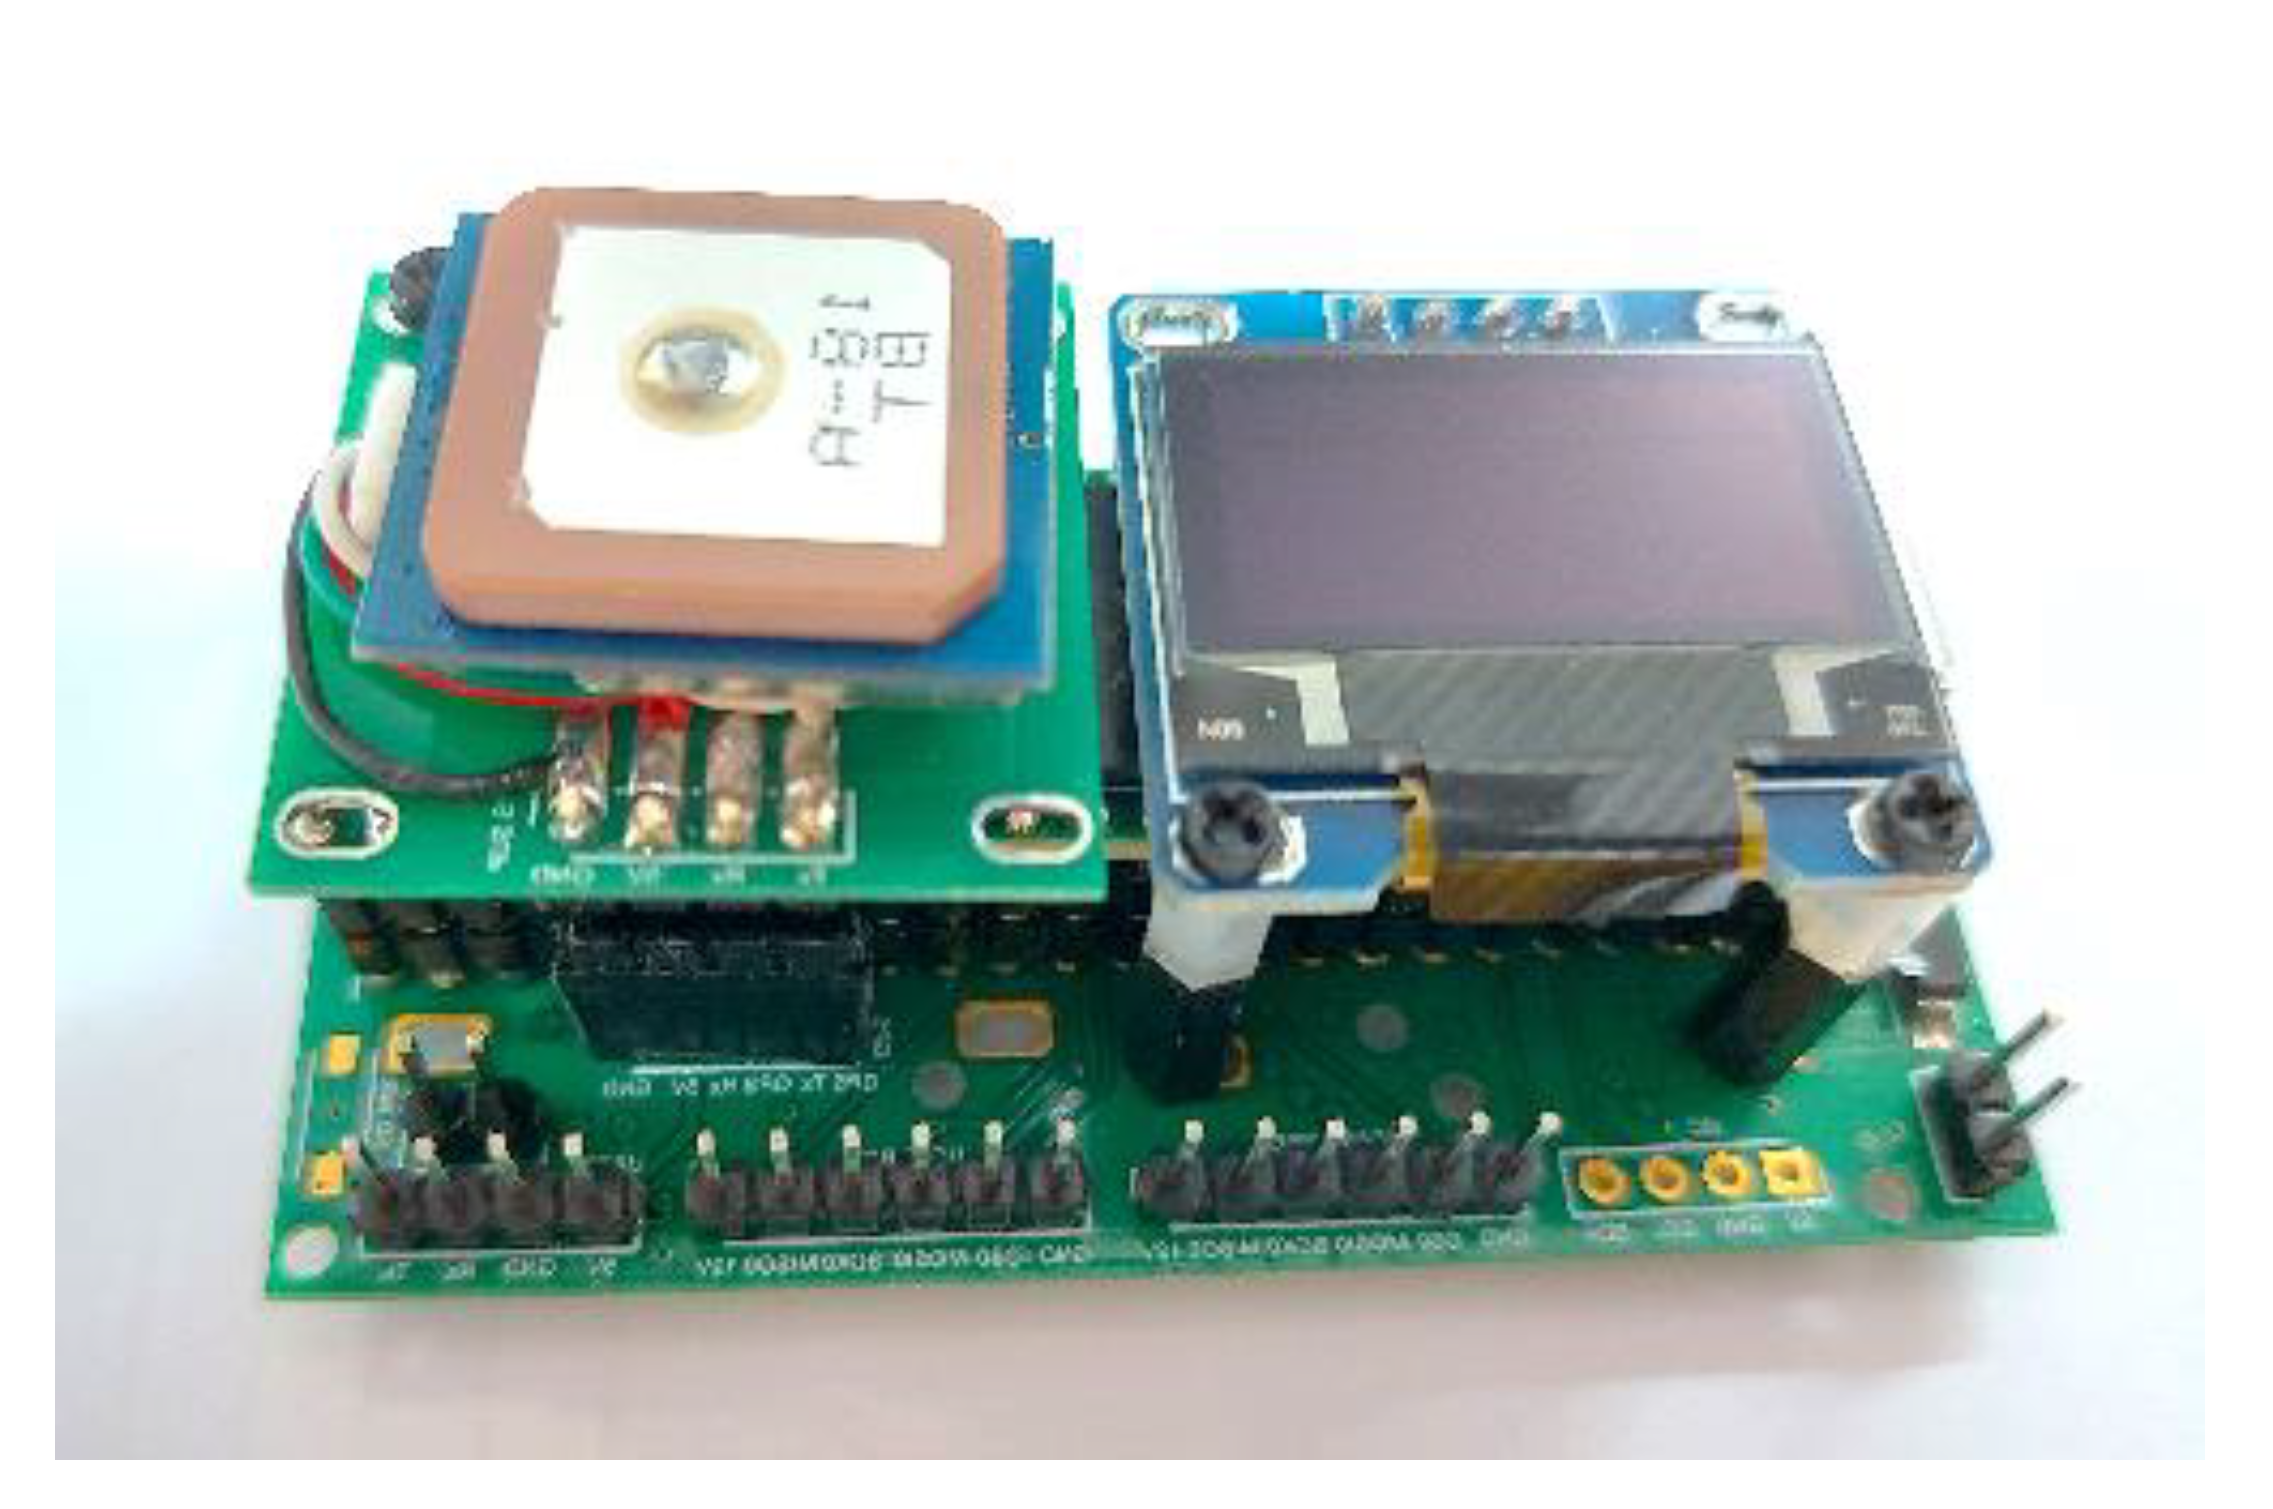
- in-house Auto-Pilots and Data Acquisition systems allowing for pre-programmed complex flight paths as well as control of a large variety of scientific instruments with real-time data visualization features;
- (v)
- complementary facilities allowing for simulating the on-flight performance of atmospheric sensors (at different pressure and air temperature) and performing quality-checked chemical analyses of off-line air samples collected on-board UAVs.
- (i)
- document in a more realistic way (compared to in-situ ground-based observations) INP concentrations and aerosol/droplet properties in cloud regions;
- (ii)
- test and validate remote sensing (lidar, ceilometer) retrievals of aerosol properties (mass concentrations) and INP;
- (iii)
- characterize the vertical dispersion of ground-based (e.g., city traffic) emissions and atmospheric oxidants (e.g., O3) within a fast-changing PBL;
- (iv)
- bridge the scaling gap between in-situ and remote-sensing observations in the first hundred meters of the atmosphere;
- (v)
- depict with a high vertical resolution superimposed thin atmospheric dust layers below/above the PBL;
- (vi)
- map with high-time response highly localized close-to-the-ground pollution and greenhouse gases hotspots.
5. Perspectives
Supplementary Materials
Author Contributions
Funding
Institutional Review Board Statement
Informed Consent Statement
Data Availability Statement
Acknowledgments
Conflicts of Interest
References
- Schepanski, K.; Tegen, I.; Laurent, B.; Heinold, B.; Macke, A. A new Saharan dust source activation frequency map derived from MSG-SEVIRI IR-channels. Geophys. Res. Lett. 2007, 34. [Google Scholar] [CrossRef] [Green Version]
- Banks, J.R.; Hünerbein, A.; Heinold, B.; Brindley, H.E.; Deneke, H.; Schepanski, K. The sensitivity of the colour of dust in MSG-SEVIRI Desert Dust infrared composite imagery to surface and atmospheric conditions. Atmos. Chem. Phys. 2019, 19, 6893–6911. [Google Scholar] [CrossRef] [Green Version]
- Mortier, A.; Gliß, J.; Schulz, M.; Aas, W.; Andrews, E.; Bian, H.; Chin, M.; Ginoux, P.; Hand, J.; Holben, B.; et al. Evaluation of climate model aerosol trends with ground-based observations over the last 2 decades—An AeroCom and CMIP6 analysis. Atmos. Chem. Phys. 2020, 20, 13355–13378. [Google Scholar] [CrossRef]
- Boucher, O.; Randall, D.; Artaxo, P.; Bretherton, C.; Feingold, G.; Forster, P.; Kerminen, V.-M.; Kondo, Y.; Liao, H.; Lohmann, P.; et al. Clouds and Aerosols, Rem. Sens. In Climate Change 2013 the Physical Science Basis: Working Group I Contribution to the Fifth Assessment Report of the Intergovernmental Panel on Climate Change; Cambridge University Press: Cambridge, UK, 2013; pp. 571–658. ISBN 9781107415324. [Google Scholar] [CrossRef]
- Reddy, B.S.K.; Kumar, K.R.; Balakrishnaiah, G.; Gopal, K.R.; Reddy, R.R.; Sivakumar, V.; Arafath, S.M.; Lingaswawy, A.P.; Pavankumari, S.; Umadevi, S.; et al. Ground-based in situ measurements of near-surface aerosol mass concentration over Anantapur: Heterogeneity in source impacts. Adv. Atmos. Sci. 2013, 30, 235–246. [Google Scholar] [CrossRef]
- Austin, R. Unmanned Aircraft Systems. Hum. Factors Aviat. 2010, 54, 505–531. [Google Scholar] [CrossRef]
- Illingworth, S.; Allen, G.; Percival, C.; Hollingsworth, P.; Gallagher, M.; Ricketts, H.; Hayes, H.; Ładosz, P.; Crawley, D.; Roberts, G. Measurement of boundary layer ozone concentrations on-board a Skywalker unmanned aerial vehicle. Atmos. Sci. Lett. 2014, 15, 252–258. [Google Scholar] [CrossRef] [Green Version]
- Babaan, J.B.; Ballori, J.P.; Tamondong, A.M.; Ramos, R.V.; Ostrea, P.M. Estimation of PM 2.5 vertical distribution using customized UAV and mobile sensors in Brgy. Int. Arch. Photogramm. Remote Sens. Spat. Inf. Sci. 2018, 42, 89–103. [Google Scholar] [CrossRef] [Green Version]
- Mamali, D.; Marinou, E.; Sciare, J.; Pikridas, M.; Kokkalis, P.; Kottas, M.; Binietoglou, I.; Tsekeri, A.; Keleshis, C.; Engelmann, R.; et al. Vertical profiles of aerosol mass concentration derived by unmanned airborne in situ and remote sensing instruments during dust events. Atmos. Meas. Tech. 2018, 11, 2897–2910. [Google Scholar] [CrossRef] [Green Version]
- Pikridas, M.; Bezantakos, S.; Močnik, G.; Keleshis, C.; Brechtel, F.; Stavroulas, I.; Demetriades, G.; Antoniou, P.; Vouterakos, P.; Argyrides, M.; et al. On-flight intercomparison of three miniature aerosol absorption sensors using unmanned aerial systems (UASs). Atmos. Meas. Tech. 2019, 12, 6425–6447. [Google Scholar] [CrossRef] [Green Version]
- Jimenez, J.R.; Zanca, N.; Lan, H.; Jussila, M.; Hartonen, K.; Riekkola, M.-L. Aerial drone as a carrier for miniaturized air sampling systems. J. Chromatogr. A 2019, 1597, 202–208. [Google Scholar] [CrossRef]
- Aboutalebi, M.; Torres-Rua, A.F.; McKee, M.; Kustas, W.P.; Nieto, H.; Alsina, M.M.; White, A.; Prueger, J.H.; McKee, L.; Alfieri, J.; et al. Incorporation of Unmanned Aerial Vehicle (UAV) point cloud products into remote sensing evapotranspiration models. Remote Sens. 2020, 12, 50. [Google Scholar] [CrossRef] [Green Version]
- Wimmer, D.; Mazon, S.B.; Manninen, H.E.; Kangasluoma, J.; Franchin, A.; Nieminen, T.; Backman, J.; Wang, J.; Kuang, C.; Krejci, R.; et al. Ground-based observation of clusters and nucleation-mode particles in the Amazon. Atmos. Chem. Phys. 2018, 18, 13245–13264. [Google Scholar] [CrossRef] [Green Version]
- Díaz-Delgado, R.; Ónodi, G.; Kröel-Dulay, G.; Kertész, M. Enhancement of Ecological Field Experimental Research by Means of UAV Multispectral Sensing. Drones 2019, 3, 7. [Google Scholar] [CrossRef] [Green Version]
- Rohi, G.; Ejofodomi, O.; Ofualagba, G. Autonomous monitoring, analysis, and countering of air pollution using environmental drones. Heliyon 2020, 6, e03252. [Google Scholar] [CrossRef] [Green Version]
- Altstädter, B.; Platis, A.; Wehner, B.; Scholtz, A.; Wildmann, N.; Hermann, M.; Käthner, R.; Baars, H.; Bange, J.; Lampert, A. ALADINA—An unmanned research aircraft for observing vertical and horizontal distributions of ultrafine particles within the atmospheric boundary layer. Atmos. Meas. Tech. 2015, 8, 1627–1639. [Google Scholar] [CrossRef] [Green Version]
- Corrigan, C.E.; Roberts, G.C.; Ramana, M.V.; Kim, D.; Ramanathan, V. Capturing vertical profiles of aerosols and black carbon over the Indian Ocean using autonomous unmanned aerial vehicles. Atmos. Chem. Phys. 2008, 8, 734–747. [Google Scholar] [CrossRef] [Green Version]
- Madokoro, H.; Kiguchi, O.; Nagayoshi, T.; Chiba, T.; Inoue, M.; Chiyonobu, S.; Nix, S.; Woo, H.; Sato, K. Development of Drone-Mounted Multiple Sensing System with Advanced Mobility for In Situ Atmospheric Measurement: A Case Study Focusing on PM2.5 Local Distribution. Sensors 2021, 21, 4881. [Google Scholar] [CrossRef] [PubMed]
- Singh, D.; Dahiya, M.; Kumar, R.; Nanda, C. Sensors and systems for air quality assessment monitoring and management: A review. J. Environ. Manag. 2021, 289, 112510. [Google Scholar] [CrossRef] [PubMed]
- Malaver, A.; Motta, N.; Corke, P.; Gonzalez, F. Development and integration of a solar powered unmanned aerial vehicle and a wireless sensor network to monitor greenhouse gases. Sensors 2015, 15, 4072–4096. [Google Scholar] [CrossRef] [PubMed]
- Chang, C.-C.; Wang, J.-L.; Lin, M.-R.; Ou-Yang, C.-F.; Pan, H.-H.; Chen, Y.-C. A study of atmospheric mixing of trace gases by aerial sampling with a multi-rotor drone. Atmos. Environ. 2018, 184, 254–261. [Google Scholar] [CrossRef]
- Berman, E.S.; Fladeland, M.; Liem, J.; Kolyer, R.; Gupta, M. Greenhouse gas analyzer for measurements of carbon dioxide, methane, and water vapor aboard an unmanned aerial vehicle. Sens. Actuator Chem. 2012, 169, 128–135. [Google Scholar] [CrossRef]
- Shah, A.; Pitt, J.; Kabbabe, K.; Allen, G. Suitability of a Non-Dispersive Infrared Methane Sensor Package for Flux Quantification Using an Unmanned Aerial Vehicle. Sensors 2019, 19, 4705. [Google Scholar] [CrossRef] [PubMed] [Green Version]
- Dalamagidis, K.; Valavanis, K.; Piegl, L.A. On Integrating Unmanned Aircraft Systems into the National Airspace; Springer Science & Business Media: New York, NY, USA, 2009. [Google Scholar]
- Limnaios, G. Current Usage of Unmanned Aircraft Systems (UAS) and Future Challenges: A Mission Oriented Simulator for UAS as a Tool for Design and Performance Evaluation. J. Comp. Model 2014, 4, 167–188. [Google Scholar]
- Villa, T.F.; Gonzalez, F.; Miljievic, B.; Ristovski, Z.D.; Morawska, L. An Overview of Small Unmanned Aerial Vehicles for Air Quality Measurements: Present Applications and Future Prospectives. Sensors 2016, 16, 1072. [Google Scholar] [CrossRef] [PubMed] [Green Version]
- Kleanthous, S.; Vrekoussis, M.; Mihalopoulos, N.; Kalabokas, P.; Lelieveld, J. On the temporal and spatial variation of ozone in Cyprus. Sci. Total Environ. 2014, 476, 677–687. [Google Scholar] [CrossRef]
- Bezantakos, S.; Schmidt-Ott, F.; Biskos, G. Performance evaluation of the cost-effective and lightweight Alphasense optical particle counter for use onboard unmanned aerial vehicles. Aerosol Sci. Technol. 2018, 52, 385–392. [Google Scholar] [CrossRef] [Green Version]
- Keleshis, C.; Ioannou, S.; Vrekoussis, M.; Levin, Z.; Lange, M.A. Data Acquisition (DAQ) System dedicated for Remote Sensing applications on Unmanned Aerial Vehicles (UAV). Sec. Intern. Conf. Rem. Sens. Geoinf. Environ. 2014, 9229, 92290H. [Google Scholar]
- Kezoudi, M.; Tesche, M.; Smith, H.; Tsekeri, A.; Baars, H.; Dollner, M.; Estellés, V.; Bühl, J.; Weinzierl, B.; Ulanowski, Z.; et al. Measurement report: Balloon-borne in-situ profiling of Saharan dust over Cyprus with the UCASS optical particle counter. Atmos. Chem. Phys. 2021, 21, 6781–6797. [Google Scholar] [CrossRef]
- Tomsche, L.; Pozzer, A.; Ojha, N.; Parchatka, U.; Lelieveld, J.; Fischer, H. Upper tropospheric CH4 and CO affected by the South Asian summer monsoon during the Oxidation Mechanism Observations mission. Atmos. Chem. Phys. 2019, 19, 1915–1939. [Google Scholar] [CrossRef] [Green Version]
- Kräuchi, A.; Philipona, R. Return glider radiosonde for in situ upper-air research measurements. Atmos. Meas. Tech. 2016, 9, 2535–2544. [Google Scholar] [CrossRef] [Green Version]
- Liu, H.; Wang, Q.; Sheng, W.; Wang, X.; Zhang, K.; Du, L.; Zhou, J. Humidity Sensors with Shielding Electrode Under Interdigitated Electrode. Sensors 2019, 19, 659. [Google Scholar] [CrossRef] [Green Version]
- Sousan, S.; Koehler, K.; Hallett, L.; Peters, T.M. Evaluation of the Alphasense optical particle counter (OPC-N2) and the Grimm portable aerosol spectrometer (PAS-1.108). Aerosol Sci. Technol. 2016, 50, 1352–1365. [Google Scholar] [CrossRef] [PubMed]
- Crilley, L.R.; Shaw, M.; Pound, R.; Kramer, L.J.; Price, R.; Young, S.; Lewis, A.C.; Pope, F.D. Evaluation of a low-cost optical particle counter (Alphasense OPC-N2) for ambient air monitoring. Atmos. Meas. Tech. 2018, 11, 709–720. [Google Scholar] [CrossRef] [Green Version]
- Smith, H.; Ulanowski, Z.; Kaye, P.H.; Hirst, E.; Stanley, W.; Kaye, R.; Wieser, A.; Stopford, C.; Kezoudi, M.; Girdwood, J.; et al. The Universal Cloud and Aerosol Sounding System (UCASS): A low-cost miniature optical particle counter for use in dropsonde or balloon-borne sounding systems. Atmos. Meas. Tech. 2019, 12, 6579–6599. [Google Scholar] [CrossRef] [Green Version]
- Girdwood, J.; Smith, H.; Stanley, W.; Ulanowski, Z.; Stopford, C.; Chemel, C.; Doulgeris, K.-M.; Brus, D.; Campbell, D.; Mackenzie, R. Design and Field Campaign Validation of a Multirotor UAV and Optical Particle Counter. Atmos. Meas. Tech. 2020. [Google Scholar] [CrossRef]
- Gao, R.S.; Telg, H.; McLaughlin, R.J.; Ciciora, S.J.; Watts, L.A.; Richardson, M.S.; Schwarz, J.P.; Perring, A.E.; Thornberry, T.D.; Rollins, A.W.; et al. A light-weight, high-sensitivity particle spectrometer for PM2.5 aerosol measurements. Aerosol Sci. Technol. 2016, 50, 88–99. [Google Scholar] [CrossRef]
- Mei, F.; McMeeking, G.; Pekour, M.; Gao, R.-S.; Kulkarni, G.; China, S.; Telg, H.; Dexheimer, D.; Tomlinson, J.; Schmid, B. Performance Assessment of Portable Optical Particle Spectrometer (POPS). Sensors 2020, 20, 6294. [Google Scholar] [CrossRef]
- Marinou, E.; Tesche, M.; Nenes, A.; Ansmann, A.; Schrod, J.; Mamali, D.; Tsekeri, A.; Pikridas, M.; Baars, H.; Engelmann, R.; et al. Retrieval of ice-nucleating particle concentrations from lidar observations and comparison with UAV in situ measurements. Atmos. Chem. Phys. 2019, 19, 11315–11342. [Google Scholar] [CrossRef] [Green Version]
- Ansmann, A.; Mamouri, R.-E.; Bühl, J.; Seifert, P.; Engelmann, R.; Hofer, J.; Nisantzi, A.; Atkinson, J.D.; Kanji, Z.A.; Sierau, B.; et al. Ice-nucleating particle versus ice crystal number concentration in altocumulus and cirrus layers embedded in Saharan dust:a closure study. Atmos. Chem. Phys. 2019, 19, 15087–15115. [Google Scholar] [CrossRef] [Green Version]
- Rosen, J.M.; Kjome, N.T. Backscattersonde: A new instrument for atmospheric aerosol research. Appl. Opt. 1991, 30, 1552–1561. [Google Scholar] [CrossRef]
- Brabec, M.; Wienhold, F.G.; Luo, B.P.; Vömel, H.; Immler, F.; Steiner, P.; Hausammann, E.; Weers, U.; Peter, T. Particle backscatter and relative humidity measured across cirrus clouds and comparison with microphysical cirrus modelling. Atmos. Chem. Phys. 2012, 12, 9135–9148. [Google Scholar] [CrossRef] [Green Version]
- Cirisan, A.; Luo, B.P.; Engel, I.; Wienhold, F.G.; Sprenger, M.; Krieger, U.K.; Weers, U.; Romanens, G.; Levrat, G.; Jeannet, P.; et al. Balloon-borne match measurements of midlatitude cirrus clouds. Atmos. Chem. Phys. 2014, 14, 7341–7365. [Google Scholar] [CrossRef] [Green Version]
- Schrod, J.; Weber, D.; Drücke, J.; Keleshis, C.; Pikridas, M.; Ebert, M.; Cvetković, B.; Nickovic, S.; Marinou, E.; Baars, H.; et al. Ice nucleating particles over the Eastern Mediterranean measured by unmanned aircraft systems. Atmos. Chem. Phys. 2017, 17, 4817–4835. [Google Scholar] [CrossRef] [Green Version]
- Lieke, K.; Kandler, K.; Scheuvens, D.; Emmel, C.; Von Glahn, C.; Petzold, A.; Weinzierl, B.; Veira, A.; Ebert, M.; Weinbruch, S.; et al. Particle chemical properties in the vertical column based on aircraft observations in the vicinity of Cape Verde Islands. Tellus B Chem. Phys. Meteorol. 2011, 63, 497–511. [Google Scholar] [CrossRef] [Green Version]
- Cheng, Y.-H.; Lin, M.-H. Real-Time Performance of the microAeth® AE51 and the Effects of Aerosol Loading on Its Measurement Results at a Traffic Site. Aerosol Air Qual. Res. 2013, 13, 1853–1863. [Google Scholar] [CrossRef] [Green Version]
- Cai, J.; Yan, B.; Ross, J.; Zhang, D.; Kinney, P.L.; Perzanowski, M.S.; Jung, K.; Miller, R.; Chillrud, S.N. Validation of MicroAeth® as a Black Carbon Monitor for Fixed-Site Measurement and Optimization for Personal Exposure Characterization. Aerosol Air Qual. Res. 2014, 14, 1–9. [Google Scholar] [CrossRef] [Green Version]
- Lee, J. Performance Test of MicroAeth® AE51 at Concentrations Lower than 2 μg/m3 in Indoor Laboratory. Appl. Sci. 2019, 9, 2766. [Google Scholar] [CrossRef] [Green Version]
- Cao, R.; Li, B.; Wang, H.-W.; Tao, S.; Peng, Z.-R.; He, H.-D. Vertical and Horizontal Profiles of Particulate Matter and Black Carbon Near Elevated Highways Based on Unmanned Aerial Vehicle Monitoring. Sustainability 2020, 12, 1204. [Google Scholar] [CrossRef] [Green Version]
- Liu, B.; Wu, C.; Ma, N.; Chen, Q.; Li, Y.; Ye, J.; Martin, S.T.; Li, Y. Vertical profiling of fine particulate matter and black carbon by using unmanned aerial vehicle in Macau, China. Sci. Total Environ. 2020, 709, 136109. [Google Scholar] [CrossRef]
- Sandradewi, J.; Prévôt, A.S.H.; Szidat, S.; Perron, N.; Alfarra, M.R.; Lanz, V.A.; Weingartner, E.; Baltensperger, U. Using Aerosol Light Absorption Measurements for the Quantitative Determination of Wood Burning and Traffic Emission Contributions to Particulate Matter. Environ. Sci. Technol. 2008, 42, 3316–3323. [Google Scholar] [CrossRef]
- Bates, T.S.; Quinn, P.; Johnson, J.E.; Corless, A.; Brechtel, F.J.; Stalin, S.E.; Meinig, C.; Burkhart, J. Measurements of atmospheric aerosol vertical distributions above Svalbard, Norway, using unmanned aerial systems (UAS). Atmos. Meas. Tech. 2013, 6, 2115–2120. [Google Scholar] [CrossRef] [Green Version]
- Bond, T.; Anderson, T.L.; Campbell, D. Calibration and intercomparison of filter-based measurements of visible light absorption by aerosols. Aerosol Sci. Technol. 1999, 30, 582–600. [Google Scholar] [CrossRef]
- Deshler, T.; Stübi, R.; Schmidlin, F.J.; Mercer, J.L.; Smit, H.G.J.; Johnson, B.J.; Kivi, R.; Nardi, B. Methods to homogenize electrochemical concentration cell (ECC) ozonesonde measurements across changes in sensing solution concentration or ozonesonde manufacturer. Atmos. Meas. Tech. 2017, 10, 2021–2043. [Google Scholar] [CrossRef] [Green Version]
- Kunz, M.; Lavric, J.V.; Gerbig, C.; Tans, P.; Neff, D.; Hummelgård, C.; Martin, H.; Rödjegård, H.; Wrenger, B.; Heimann, M. COCAP: A carbon dioxide analyser for small unmanned aircraft systems. Atmos. Meas. Tech. 2018, 11, 1833–1849. [Google Scholar] [CrossRef] [Green Version]
- Arzoumanian, E.; Vogel, F.R.; Bastos, A.; Gaynullin, B.; Laurent, O.; Ramonet, M.; Ciais, P. Characterization of a commercial lower-cost medium-precision non-dispersive infrared sensor for atmospheric CO2 monitoring in urban areas. Atmos. Meas. Tech. 2019, 12, 2665–2677. [Google Scholar] [CrossRef] [Green Version]
- Tsekeri, A.; Lopatin, A.; Amiridis, V.; Marinou, E.; Igloffstein, J.; Siomos, N.; Solomos, S.; Kokkalis, P.; Engelmann, R.; Baars, H.; et al. GARRLiC and LIRIC: Strengths and limitations for the characterization of dust and marine particles along with their mixtures. Atmos. Meas. Tech. 2017, 10, 4995–5016. [Google Scholar] [CrossRef] [Green Version]
- Seinfeld, J.H.; Bretherton, C.; Carslaw, K.; Coe, H.; DeMott, P.; Dunlea, E.J.; Feingold, G.; Ghan, S.; Guenther, A.B.; Kahn, R.; et al. Improving our fundamental understanding of the role of aerosol−cloud interactions in the climate system. Proc. Natl. Acad. Sci. USA 2016, 113, 5781–5790. [Google Scholar] [CrossRef] [PubMed] [Green Version]
- Reymann, C.; RenzAGLia, A.; Lamraoui, F.; Bronz, M.; Lacroix, S. Adaptive sampling of cumulus clouds with UAVs. Auton. Robot. 2018, 42, 491–512. [Google Scholar] [CrossRef] [Green Version]
- Li, J.; Kahn, R.A.; Wei, J.; Carlson, B.E.; Lacis, A.A.; Li, Z.; Li, X.; Dubovik, O.; Nakajima, T. Synergy of satellite- and ground-based aerosol optical depth measurements using an ensemble Kalman filter approach. J. Geophys. Res. Atmos. 2020, 125. [Google Scholar] [CrossRef]
- Ferrero, L.; Mocnik, G.; Ferrini, B.; Perrone, M.; Sangiorgi, G.; Bolzacchini, E. Vertical profiles of aerosol absorption coefficient from micro-Aethalometer data and Mie calculation over Milan. Sci. Total Environ. 2011, 409, 2824–2837. [Google Scholar] [CrossRef]
- Lelieveld, J.; Hadjinicolaou, P.; Kostopoulou, E.; Giannakopoulos, C.; Pozzer, A.; Tanarhte, M.; Tyrlis, E. Model projected heat extremes and air pollution in the eastern Mediterranean and Middle East in the twenty-first century. Reg. Environ. Chang. 2013, 14, 1937–1949. [Google Scholar] [CrossRef] [Green Version]
- Pfannerstill, E.Y.; Wang, N.; Edtbauer, A.; Bourtsoukidis, E.; Crowley, J.N.; Dienhart, D.; Eger, P.G.; Ernle, L.; Fischer, H.; Hottmann, B.; et al. Shipborne measurements of total OH reactivity around the Arabian Peninsula and its role in ozone chemistry. Atmos. Chem. Phys. 2019, 19, 11501–11523. [Google Scholar] [CrossRef] [Green Version]
- Eger, P.G.; Friedrich, N.; Schuladen, J.; Shenolikar, J.; Fischer, H.; Tadic, I.; Harder, H.; Martinez, M.; Rohloff, R.; Tauer, S.; et al. Shipborne measurements of ClNO2 in the Mediterranean Sea and around the Arabian Peninsula during summer. Atmos. Chem. Phys. 2019, 19, 12121–12140. [Google Scholar] [CrossRef] [Green Version]
- Celik, S.; Drewnick, F.; Fachinger, F.; Brooks, J.; Darbyshire, E.; Coe, H.; Paris, J.-D.; Eger, P.G.; Schuladen, J.; Tadic, I.; et al. Influence of vessel characteristics and atmospheric processes on the gas and particle phase of ship emission plumes: In situ measurements in the Mediterranean Sea and around the Arabian Peninsula. Atmos. Chem. Phys. 2020, 20, 4713–4734. [Google Scholar] [CrossRef] [Green Version]
- Tadic, I.; Crowley, J.N.; Dienhart, D.; Eger, P.; Harder, H.; Hottmann, B.; Martinez, M.; Parchatka, U.; Paris, J.-D.; Pozzer, A.; et al. Net ozone production and its relationship to nitrogen oxides and volatile organic compounds in the marine boundary layer around the Arabian Peninsula. Atmos. Chem. Phys. 2020, 20, 6769–6787. [Google Scholar] [CrossRef]
- Bourtsoukidis, E.; Pozzer, A.; Sattler, T.; Matthaios, V.N.; Ernle, L.; Edtbauer, A.; Fischer, H.; Könemann, T.; Osipov, S.; Paris, J.-D.; et al. The Red Sea Deep Water is a potent source of atmospheric ethane and propane. Nat. Commun. 2020, 11, 447. [Google Scholar] [CrossRef]
- Hattenberger, G.; Bronz, M.; Gorraz, M. Using the Paparazzi UAV System for Scientific Research. In Proceedings of the 2014 International Micro Air Vehicle Conference and Competition, Delft, The Netherlands, 12–15 August 2014. [Google Scholar]
- Paris, J.-D.; Riandet, A.; Bourtsoukidis, E.; Delmotte, M.; Berchet, A.; Williams, J.; Ernle, L.; Tadic, I.; Harder, H.; Lelieveld, J. Shipborne measurements of methane and carbon dioxide in the Middle East and Mediterranean areas and contribution from oil and gas emissions. Atmos. Chem. Phys. Discuss. 2021. in review. [Google Scholar] [CrossRef]
- Lagrosas, N.; Kuze, H.; Takeuchi, N.; Fukagawa, S.; Bagtasa, G.; Yoshii, Y.; Naito, S.; Yabuki, M. Correlation study between suspended particulate matter and portable automated lidar data. J. Aerosol Sci. 2005, 36, 439–454. [Google Scholar] [CrossRef]
- Lewandowski, P.A.; Eichinger, W.E.; Holder, H.; Prueger, J.; Wang, J.; Kleinman, L.I. Vertical distribution of aerosols in the vicinity of Mexico City during MILAGRO-2006 Campaign. Atmos. Chem. Phys. 2010, 10, 1017–1030. [Google Scholar] [CrossRef] [Green Version]
- Popovici, I.E.; Goloub, P.; Podvin, T.; Blarel, L.; Loisil, R.; Unga, F.; Mortier, A.; DeRoo, C.; Victori, S.; Ducos, F.; et al. Description and applications of a mobile system performing on-road aerosol remote sensing and in situ measurements. Atmos. Meas. Tech. 2018, 11, 4671–4691. [Google Scholar] [CrossRef] [Green Version]
- Mortier, A. Tendances et Variabilites de L’aerosol Atmospherique a L’aide du Couplage Lidar/Photometre sur les Sites de Lille et Dakar. PhD Thesis, Université de Lille, Lille, France, 2013. [Google Scholar]
- Holben, B.; Eck, T.; Slutsker, I.; Tanré, D.; Buis, J.; Setzer, A.; Vermote, E.; Reagan, J.; Kaufman, Y.; Nakajima, T.; et al. AERONET—A federated instrument network and data archive for aerosol characterization. Remote Sens. Environ. 1998, 66, 1–16. [Google Scholar] [CrossRef]
- Holben, B.N.; Kim, J.; Sano, I.; Mukai, S.; Eck, T.F.; Giles, D.; Schafer, J.S.; Sinyuk, A.; Slutsker, I.; Smirnov, A.; et al. An overview of mesoscale aerosol processes, comparisons, and validation studies from DRAGON networks. Atmos. Chem. Phys. 2018, 18, 655–671. [Google Scholar] [CrossRef] [Green Version]
- Yin, Z.; Ansmann, A.; Baars, H.; Seifert, P.; Engelmann, R.; Radenz, M.; Jimenez, C.; Herzog, A.; Ohneiser, K.; Hanbuch, K.; et al. Aerosol measurements with shipborne sun-sky-lunar photometer and collocated multiwavelength Raman polarization lidar over the Atlantic Ocean. Atmos. Meas. Tech. 2019, 12, 5685–5698. [Google Scholar] [CrossRef] [Green Version]
- Achilleos, S.; Evans, J.S.; Yiallouros, P.K.; Kleanthous, S.; Schwartz, J.; Koutrakis, P. PM10 concentration levels at an urban and background site in Cyprus: The impact of urban sources and dust storms. J. Air Waste Manag. Assoc. 2014, 64, 1352–1360. [Google Scholar] [CrossRef] [Green Version]
- Mamouri, R.E.; Ansmann, A.; Nisantzi, A.; Kokkalis, P.; Schwarz, A.; Hadjimitsis, D. Low Arabian dust extinction-to-backscatter ratio. Geophys. Res. Lett. 2013, 40, 4762–4766. [Google Scholar] [CrossRef]
- Mamouri, R.-E.; Ansmann, A. Potential of polarization lidar to provide profiles of CCN- and INP-relevant aerosol parameters. Atmos. Chem. Phys. 2016, 16, 5905–5931. [Google Scholar] [CrossRef] [Green Version]
- Nisantzi, A.; Mamouri, R.E.; Ansmann, A.; Schuster, G.; Hadjimitsis, D. Middle East versus Saharan dust extinction-to-backscatter ratios. Atmos. Chem. Phys. 2015, 15, 7071–7084. [Google Scholar] [CrossRef] [Green Version]
- Chouza, F.; Leblanc, T.; Brewer, M.; Wang, P.; Piazzolla, S.; Pfister, G.; Kumar, R.; Drews, C.; Tilmes, S.; Emmons, L.; et al. The impact of Los Angeles Basin pollution and stratospheric intrusions on the surrounding San Gabriel Mountains as seen by surface measurements, lidar, and numerical models. Atmos. Chem. Phys. 2021, 21, 6129–6153. [Google Scholar] [CrossRef]
- Gronoff, G.; Robinson, J.; Berkoff, T.; Swap, R.; Farris, B.; Schroeder, J.; Halliday, H.S.; Knepp, T.; Spinei, E.; Carrion, W.; et al. A Method for Quantifying Near Range Point Source Induced O3 Titration Events using Co-located Lidar and Pandora Measurements. Atmos. Environ. 2019, 204, 43–52. [Google Scholar] [CrossRef]
- Kwok, C.Y.; Laurent, O.; Guemri, A.; Philippon, C.; Wastine, B.; Rella, C.W.; Vuillemin, C.; Truong, F.; Delmotte, M.; Kazan, V.; et al. Comprehensive laboratory and field testing of cavity ring-down spectroscopy analyzers measuring H2O, CO2, CH4 and CO. Atmos. Meas. Tech. 2015, 8, 3867–3892. [Google Scholar] [CrossRef] [Green Version]
- Hazan, L.; Tarniewicz, J.; Ramonet, M.; Laurent, O.; Abbaris, A. Automatic processing of atmospheric CO2 and CH4 mole fractions at the ICOS Atmosphere Thematic Centre. Atmos. Meas. Tech. 2016, 9, 4719–4736. [Google Scholar] [CrossRef] [Green Version]


| Location | Date | Max. Height AGL (in m) | Platform Used | Scientific Interest | Reference |
|---|---|---|---|---|---|
| California, USA | 2014–2016 (4 days) | 450 | AggieAir UAV | Multi-spectral UAV imagery for evapotranspiration models | Aboutalebi et al., 2019 |
| Ontario, USA | April 2017 | 100 | Environmental drones | Large-scale air pollution | Rohi et al., 2020 |
| Hyytiälä and Siikaneva, Finland | October 2018 | 50 | Geodrone X4L drone | VOCs sampling | Ruiz-Jimenez et al., 2019 |
| Quezon City, Philippines | 22 March 2015 | 500 | Quezon City, Metro Manila, Philippines | PM2.5 profiles | Babaan et al., 2018 |
| Cape Fuguei, Taiwan | 27 October to 6 November 2015 | 300 | Multi-rotor drone carrying | VOCs, CO, CH4, and CO2 | Chang et al., 2018 |
| Indian Ocean | March 2006 | 3000 | Advanced Ceramics Research (ACR) Manta UAV | Black Carbon | Corrigan et al., 2018 |
| Melpitz, Germany | October 2013 | 1000 | Application of Light-weight Aircraft for Detecting IN situ Aerosol (ALADINA) UAV | Distribution of ultrafine particles in the Atmospheric Boundary Layer (ABL) | Altstädter et al., 2015 |
| Christmas Creek, QLD, Australia | 23 July 2013 | 50 | Solar-powered UAV | Air pollution monitoring, CH4 and CO2 concentrations | Malaver et al., 2015 |
| Hough End Fields site, Manchester, UK | 28 June 2012 | 120 | Skywalker UAV | Ozone profiles (with ECC ozonesonde by Science Pump Ltd.) | Illingworth et al., 2014 |
| Svalbard, Norway | 9 June and 11 July 2009 | 10 | Sensor Integrated Environmental Remote Research Aircraft (SIERRA) UAV | GHG observations—CH4 and CO2 concentrations, and water vapor | Berman et al., 2012 |
| UAS Type | Name | Wingspan Diameter (m) | MTOW/Payload | Ceiling (km) | Endurance (min) | Use | Material | Propulsion Energy | Reference |
|---|---|---|---|---|---|---|---|---|---|
| Small-size fixed-wing |  Skywalker 2015 | 1.83 | 4.2 kg/1.5 kg | 3 | 90 | Vertical Profiling, Plume Mapping | Foam plywood | Li-Ion or LiPo Battery | Airframe: commercially available, http://skywalkermodel.com/ (accessed on 24 May 2021) |
 Skywalker X8 | 2.12 | 5.2 kg/2 kg | 3 | 100 | Vertical Profiling, Plume Mapping | Foam plywood | Li-Ion or LiPo Battery | Airframe: commercially available http://skywalkermodel.com/ (accessed on 24 May 2021) | |
 I-Soar | 2.5 | 6.5 kg/2 kg | 3 | 110 | Vertical Profiling, Plume Mapping | Foam plywood | Li-Ion or LiPo Battery | Airframe: was commercially available—discontinued | |
 Cobi | 2.03 | 5.5 kg/2.5 kg | 4 | 120 | Vertical Profiling, Plume Mapping | Composite (Carbon Fiber) | Li-Ion or LiPo Battery | USRL-made, not commercially available | |
| Small-size multirotor |  Stack Emissions Quad Rotor | 0.35 | 1.5 kg/0.8 kg | 0.5 | 10 | Dense Profiling, Stack Emissions | Composite (Carbon Fiber) | LiPo Battery | USRL-made, not commercially available |
 Tarot 650 | 0.65 | 3.5 kg/1.5 kg | 2 | 30 | Dense Profiling, Stack Emissions, Plume Mapping | Composite (Carbon Fiber) | Li-Ion or LiPo Battery | Airframe: commercially available http://www.tarotrc.com/ (accessed on 10 March 2021) | |
 MK8-3500 | 1.16 | 7.8 kg/3.5 kg | 5 | 35 | Stack Emissions, Plume Mapping | Composite (Carbon Fiber) | LiPo Battery | Airframe: commercially available https://www.mikrokopter.de/ (accessed on 12 March 2021) | |
| Medium- size fixed- wing |  Cruiser | 3.8 | 45 kg/12 kg | 4 | 480 | Vertical Profiling | Composite (Fiber-Glass) | Gasoline | Airframe Commercially available https://magline.es/product.html (accessed on 10 March 2021) |
| Parameter | Instrument | Specifications | References | |
|---|---|---|---|---|
| T, RH |  | HC2-ROPCB (commercial) | Temperature range: −50–100 °C ± 0.1 °C; RH range: 0–100% ± 0.8%; 0.002 kg | https://www.rotronic.com/en/hc2-ropcb.html (accessed on 18 March 2021) |
| Aerosol Size distribution/Number concentration |  | OPC-N2 (commercial) | Size range: 0.38–17 µm in 16 channels; time resolution: 10s; dynamic range 0–10,000#/cm3; flow: 1.2 L/min; 0.100 kg without battery | http://www.alphasense.com/WEB1213/wp-content/uploads/2017/02/OPC-N2.pdf (accessed on 18 March 2021); Bezantakos et al. (2017); Bezantakos et al. (2020) |
| Aerosol Size distribution/Number concentration |  | POPS (commercial) | Size range: 0.14–3.3 µm in 16 channels; time resolution 1 s; flow: 0.18 L/min; consumption 7 W; 0.800 kg without battery | http://www.handixscientific.com/pops (accessed on 18 March 2021); Gao et al. (2016) |
| Aerosol Size distribution/Number concentration |  | UCASS (prototype) | Size range: 0.4–40.0 µm in 16 channels; time resolution 1 s; open-path geometry; typical air flow range: 2–15 m/s; 1.9 W; 0.230 kg | Smith et al. (2019); Girdwood et al. (2020); Kezoudi et al. (2020) |
| Aerosol Size distribution/Number concentration |  | MetOne model 212-2 (commercial) | Size range: 0.5–10.0 µm in 8 channels; time resolution 1 s; flow: 1 L/min | http://mail.metone.com/documents/AERO-212operation_manual.pdf (accessed on 17 March 2021); Sousan et al. (2016) |
| Aerosol Filter Sampling |  | 7-channel Filter Sampler (commercial) | 25-mm diameter filter sampling (Quartz, Teflon), flow: 2 L/min, 0.800 kg | https://www.brechtel.com/products-item/filter-sampler/ (accessed on 18 March 2021) |
| Aerosol Filter Sampling |  | Multi-sample PEAC (prototype) | Electrostatic precipitation; up to seven substrates; flow: 5 L/min; 2.500 kg | Schrod et al. (2017) |
| Aerosol Filter Sampling |  | Single-sample PEAC | USRL custom-built, lightweight version of multi-sampling PEAC; 0.600 kg | Schrod et al. 2017 |
| Aerosol Filter Sampling |  | GPAC | Size range: particles larger than 0.4 μm, A minimum of 1500 particles to be analyzed for each sample; 0.055 kg | Lieke et al. (2011) |
| Aerosol Filter Sampling |  | Filter Sampler | 47-mm filter sampling for chemical analyses; flow: 1 L/min; 0.500 kg | This study |
| Aerosol Backscatter ratio |  | COBALD | Back-scatter light from molecules/aerosols at angles 173°; high-power LEDs at 455 nm and 940 nm; resolution 1 s; Dimensions: 17 × 14 × 12 cm3; 0.310 kg | Rosen and Kjome (1991); Wienhold et al. (2012); Cirisan et al. (2014) |
| Black Carbon |  | STAP | Light absorption at 450, 525 and 624 nm. Sample flow up to 1.7 LPM; noise level (1 δ) 0.1 Mm−1; c.a. 1.500 kg | http://www.brechtel.com/brechtel_wp/wp-content/uploads/2014/10/ Brechtel_Model_9400_ACCESS_Brochure.pdf (accessed on 16 March 2021); Pikridas et al. (2019) |
| Black Carbon |  | MicroAeth® AE51 | Range 0–1 mg BC/m3; Resolution 0.001 μg BC/m3; Measurement Precision ± 0.1 μg BC/m3, 1 min avg., flow: 0.150 L/min; Dimensions 117 × 66 × 38 mm3; 0.280 kg | https://aethlabs.com/microaeth/ae51/tech-specs (accessed on 16 March 2021); Mamali et al. (2018); Pikridas et al. (2019) |
| Black Carbon |  | DWP | Modification of the AE51, by placing an additional light source emitting at 370 nm; flow rate: 2 L/min | Sandradewi et al. (2008); Pikridas et al. (2019) |
| Ozone |  | ECC Ozonesonde | 0.215 kg | https://www.en-sci.com/wp-content/uploads/2020/02/Ozonesonde-Flight-Preparation-Manual.pdf (accessed on 10 March 2021) |
| CO2 |  | SenseAir HPP v3.2 | Non-dispersive infrared absorption spectroscopy, 12 W, resolution 1 s, range 0–1000 ppm; precision <2 ppm, prototype being improved; 1.058 kg (without battery) | http://www.senseair.com/ (accessed on 10 May 2021); Liu et al. (in preparation) |
| Prog. Acronym | (Scientific Objectives) | Time Period | Location | UAV Sensors | UAV Type | Reference |
|---|---|---|---|---|---|---|
| BACCHUS | Ice Nuclei profiling; Comparison with lidar | April 2016 | Cyprus | MetOne OPC PEAC | Cruiser Skywalker X8 | Schröd et al. (2017) Mamali et al. (2018) Marinou et al. (2019 |
| ACTRIS2 | Aerosol light absorption profiling | January 2016 | Athens, Greece | MicroAeth® AE51, DWP, STAP | Cruiser Skywalker X8 | Tskeri et al. (2017) Pikridas et al. (2019) |
| Cloud droplets profiling | September 2017 | Northern Finland | Alphasense OPC | Skywalker 2015 | This study | |
| AQABA | Dust profiling | Summer 2017 | Mediterranean Sea, Red Sea, Gulf | Alphasense OPC | Skywalker 2015 | Unga et al. (in preparation) This study |
| AQ-SERVE | Dust profiling | November 2019 | USRL runway, Cyprus | 2 × POPS | Skywalker 2015, I-Soar | This study |
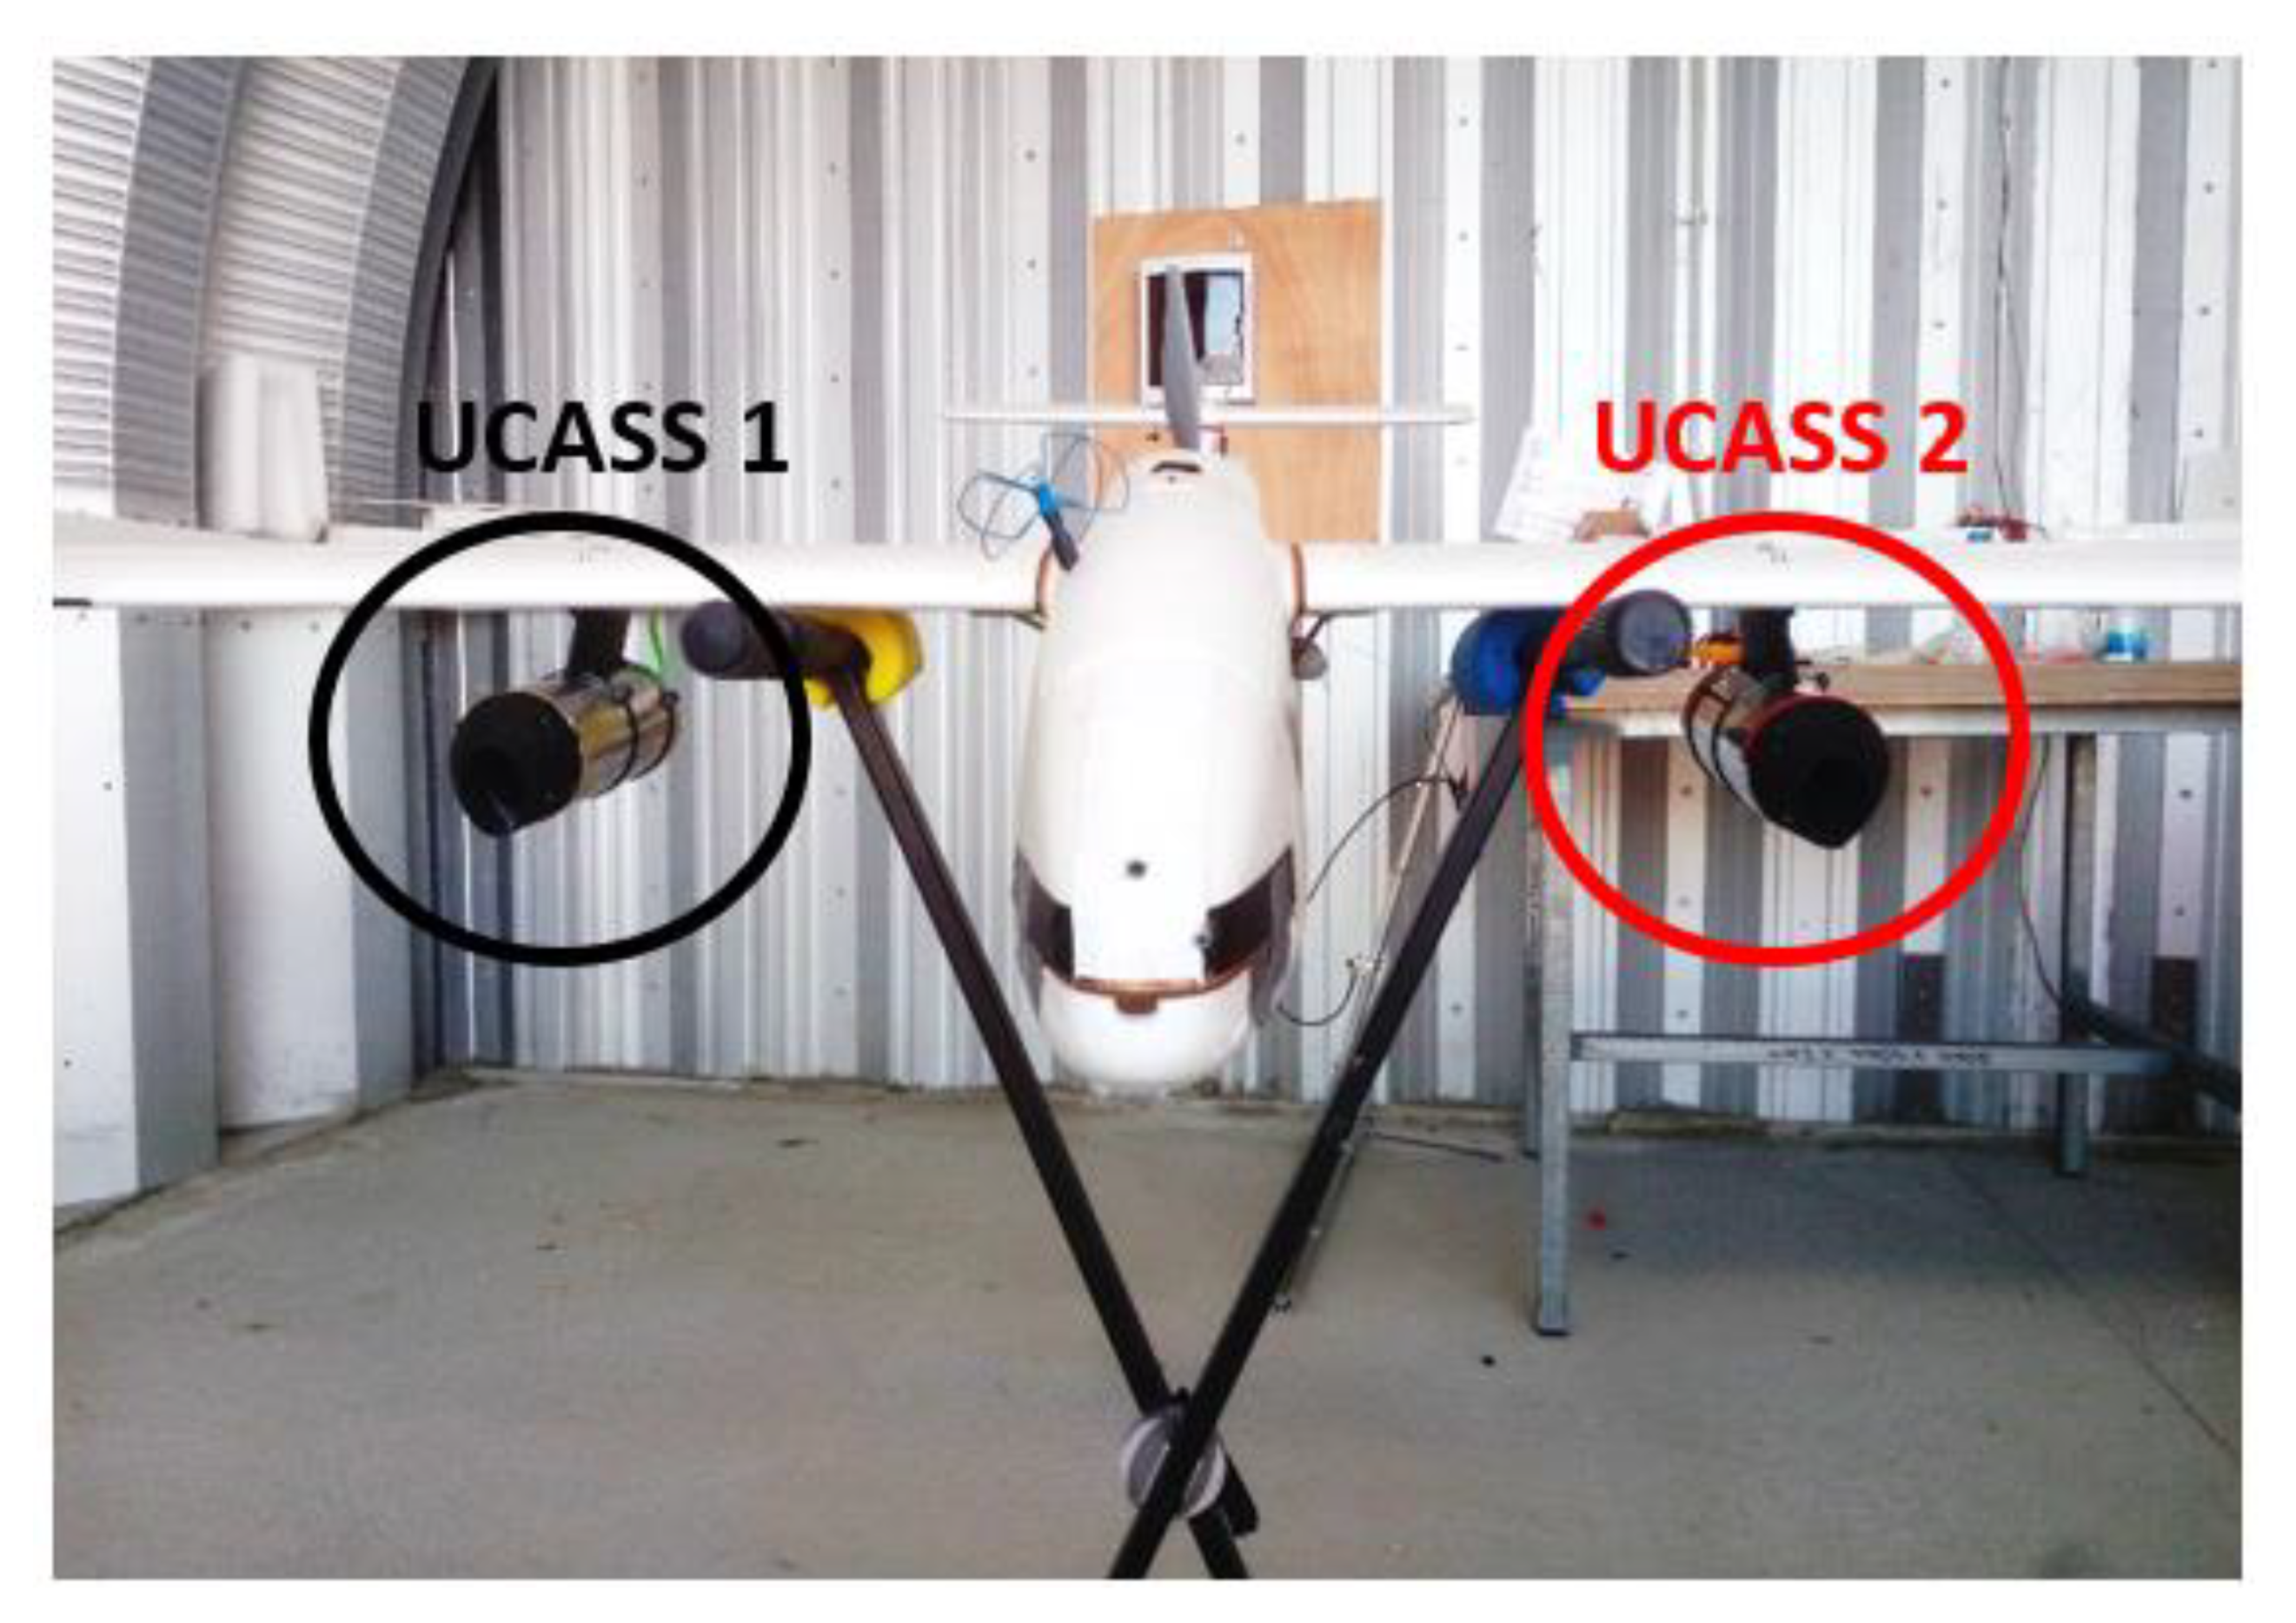
| March 2020 | USRL runway, Cyprus | 2 × UCASS | Skywalker 2015 | This study | ||
| Ozone profiling | May 2020 | USRL runway, Cyprus | ECC Ozonesonde | Skywalker 2015 | This study | |
| PM profiling | February 2020 | Nicosia, Cyprus | Alphasense OPC | Tarot 650 quadrotor | This study | |
| ACCEPT | CO2 profiling | May 2021 | Cyprus | SenseAir HPP | Liu et al. (in preparation) This study |
Publisher’s Note: MDPI stays neutral with regard to jurisdictional claims in published maps and institutional affiliations. |
© 2021 by the authors. Licensee MDPI, Basel, Switzerland. This article is an open access article distributed under the terms and conditions of the Creative Commons Attribution (CC BY) license (https://creativecommons.org/licenses/by/4.0/).
Share and Cite
Kezoudi, M.; Keleshis, C.; Antoniou, P.; Biskos, G.; Bronz, M.; Constantinides, C.; Desservettaz, M.; Gao, R.-S.; Girdwood, J.; Harnetiaux, J.; et al. The Unmanned Systems Research Laboratory (USRL): A New Facility for UAV-Based Atmospheric Observations. Atmosphere 2021, 12, 1042. https://doi.org/10.3390/atmos12081042
Kezoudi M, Keleshis C, Antoniou P, Biskos G, Bronz M, Constantinides C, Desservettaz M, Gao R-S, Girdwood J, Harnetiaux J, et al. The Unmanned Systems Research Laboratory (USRL): A New Facility for UAV-Based Atmospheric Observations. Atmosphere. 2021; 12(8):1042. https://doi.org/10.3390/atmos12081042
Chicago/Turabian StyleKezoudi, Maria, Christos Keleshis, Panayiota Antoniou, George Biskos, Murat Bronz, Christos Constantinides, Maximillien Desservettaz, Ru-Shan Gao, Joe Girdwood, Jonathan Harnetiaux, and et al. 2021. "The Unmanned Systems Research Laboratory (USRL): A New Facility for UAV-Based Atmospheric Observations" Atmosphere 12, no. 8: 1042. https://doi.org/10.3390/atmos12081042