
Characterization of the Interannual Variability of Precipitation and Streamflow in Tensift and Ksob Basins (Morocco) and Links with the NAO


Abstract
:
1. Introduction
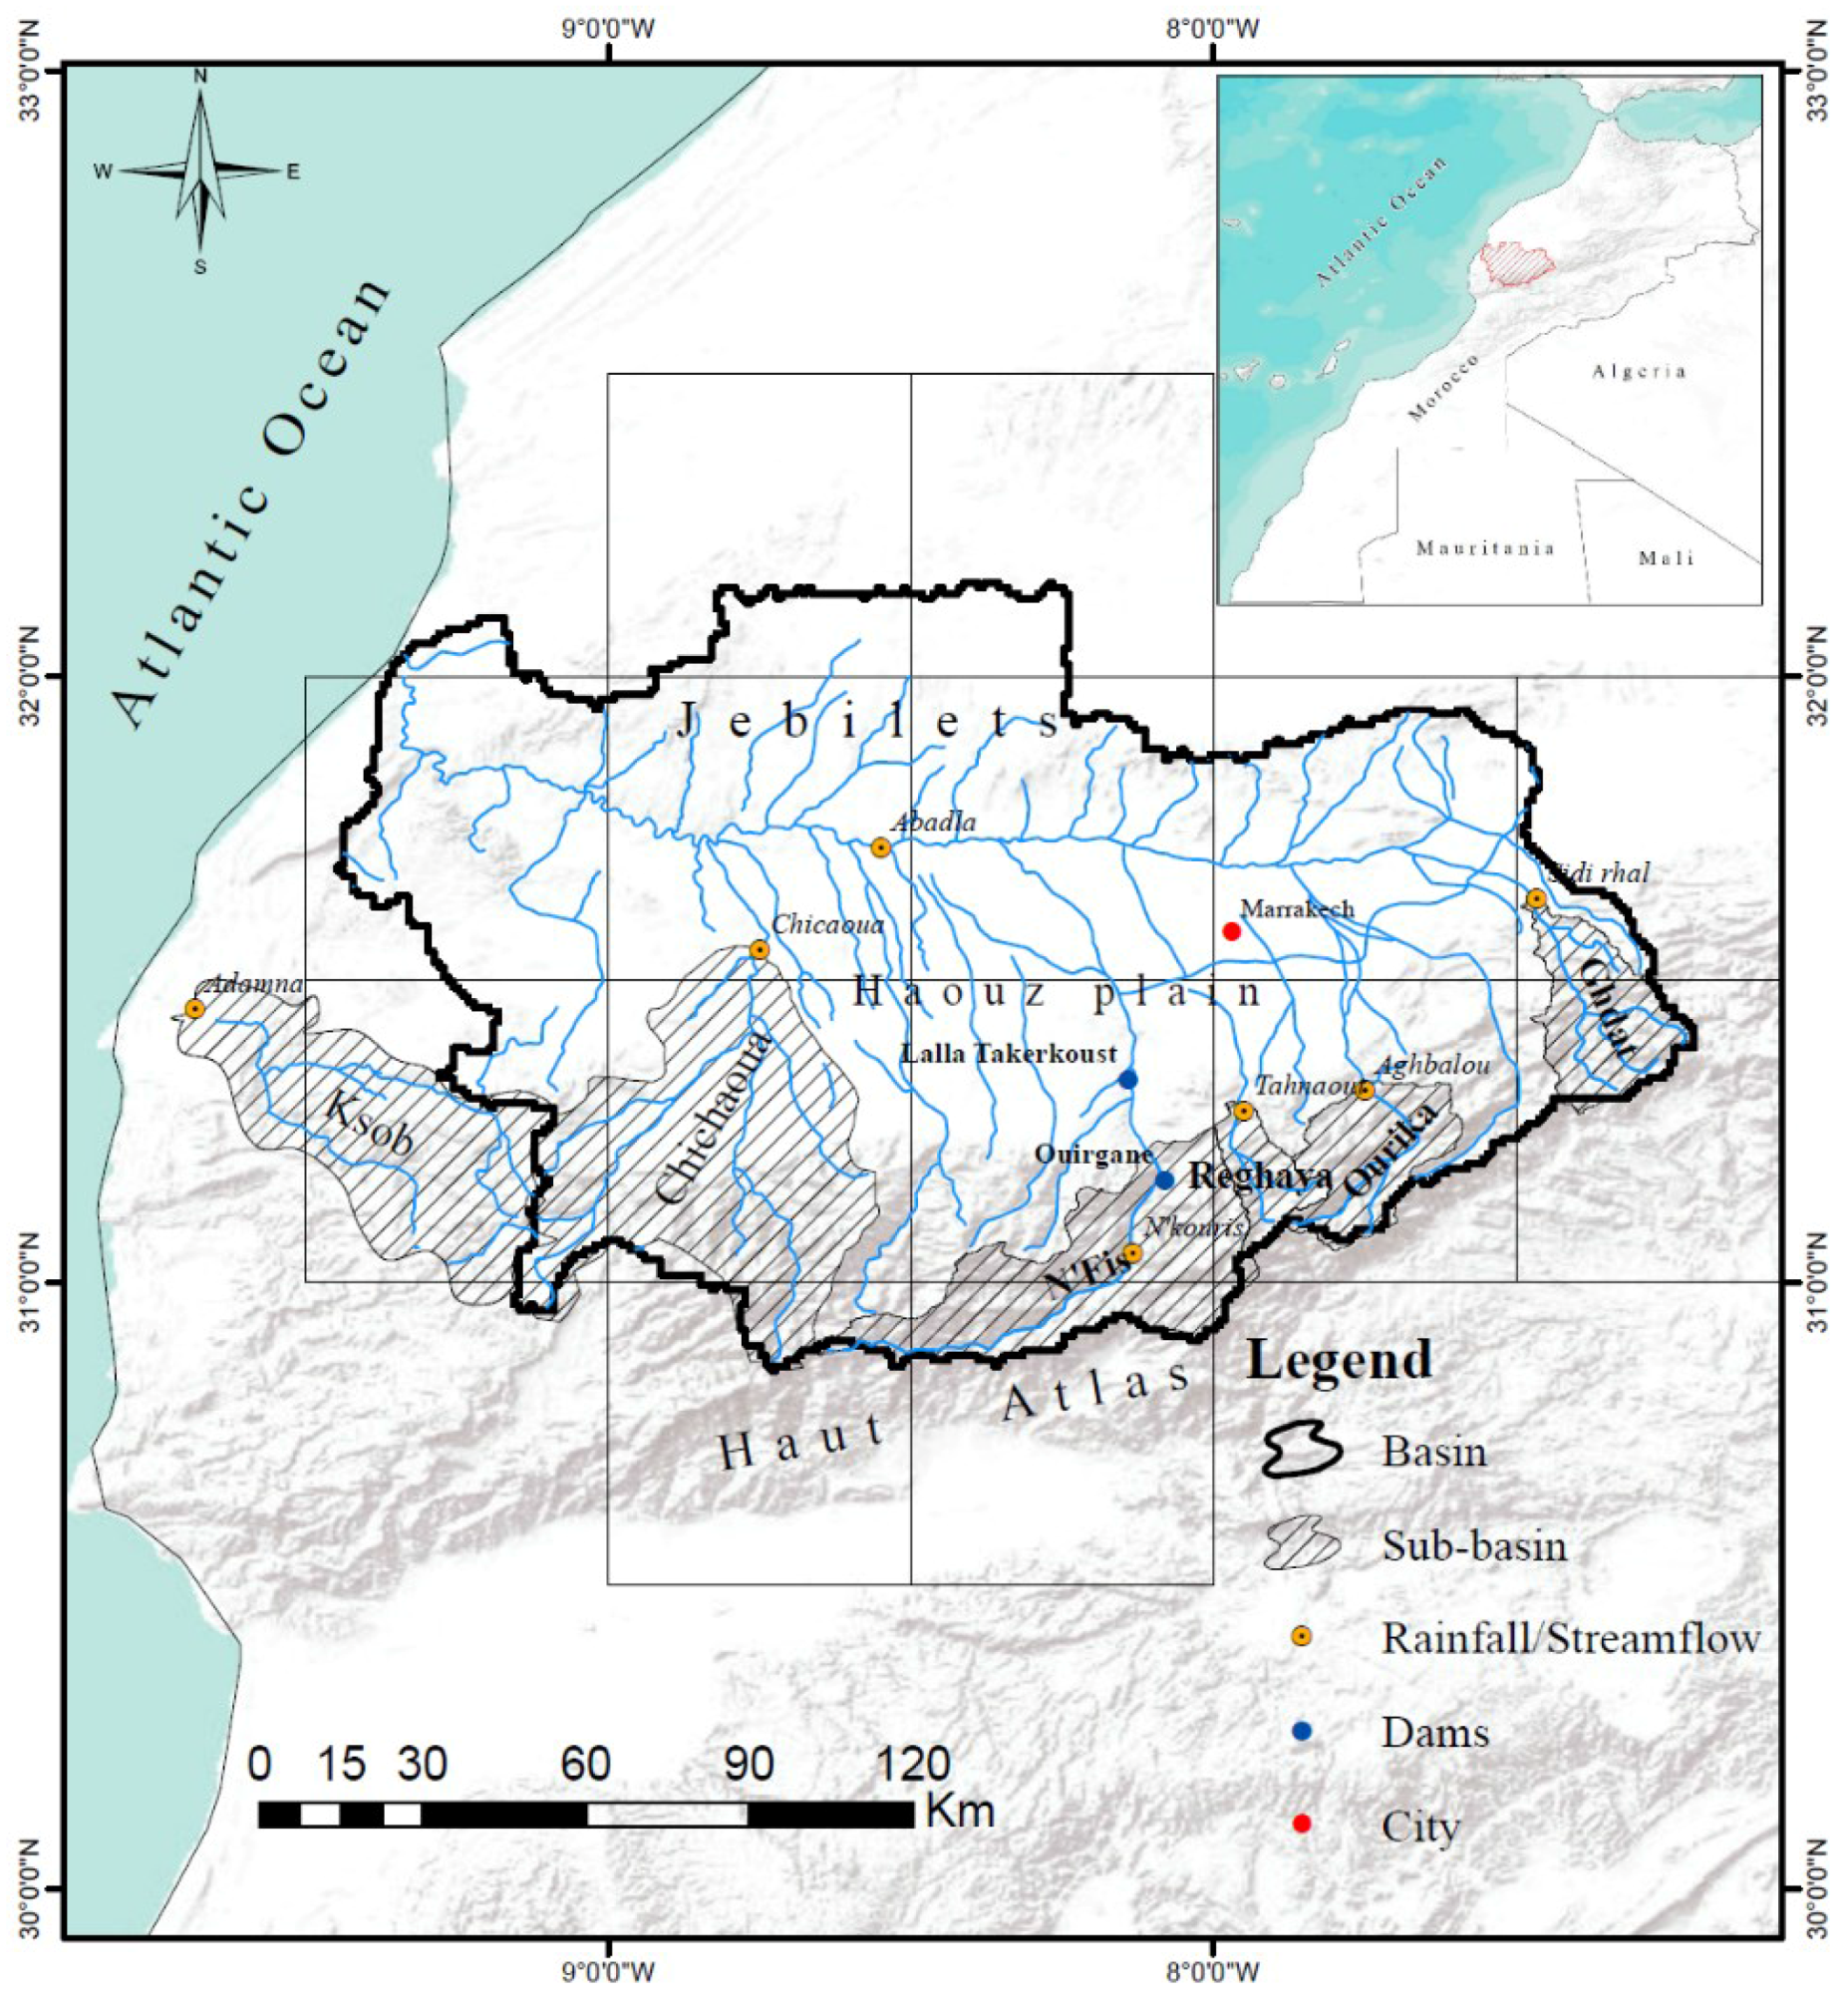
2. Study Area
3. Data and Methods
3.1. Data
3.2. Methods
- : Rainfall/streamflow for a given year;
- : Average rainfall/streamflow for interannual period; and
- S: Standard deviation of rainfall/streamflow for interannual period.
4. Results: Determination of the Hydrological Variability of the Tensift
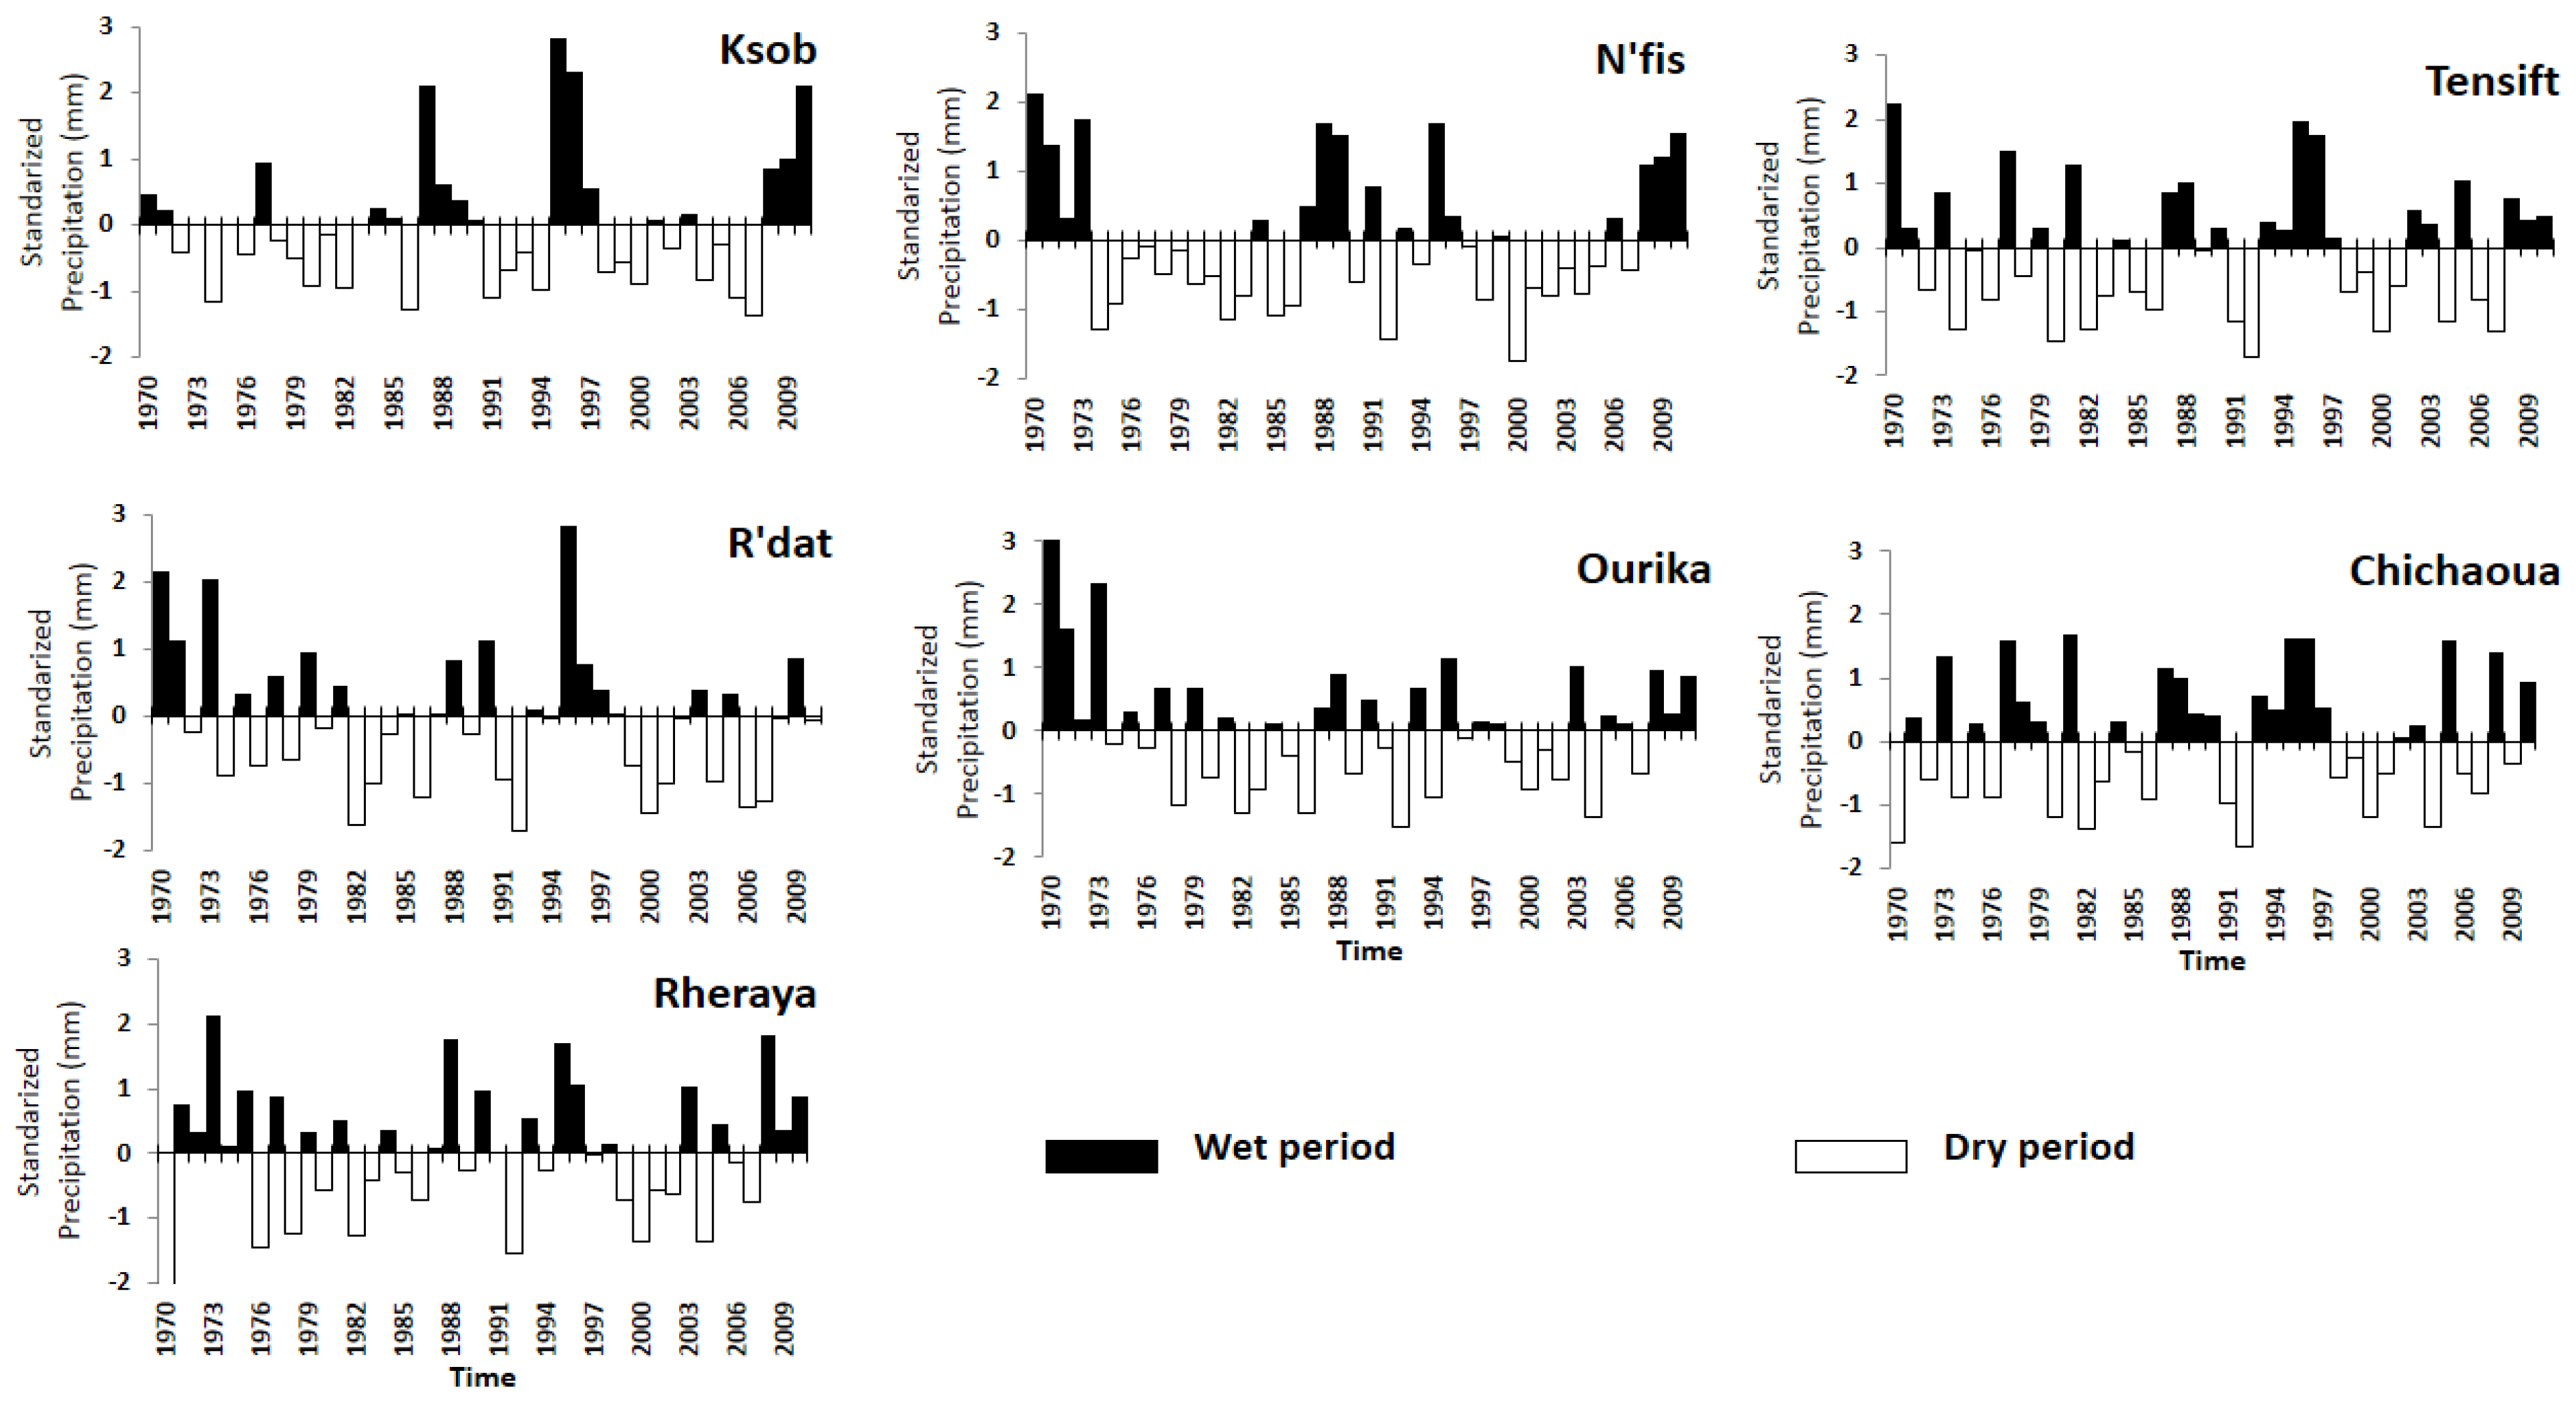
4.1. Hydrological Variability from the Standardized Variables
4.1.1. Rainfall
4.1.2. Streamflow
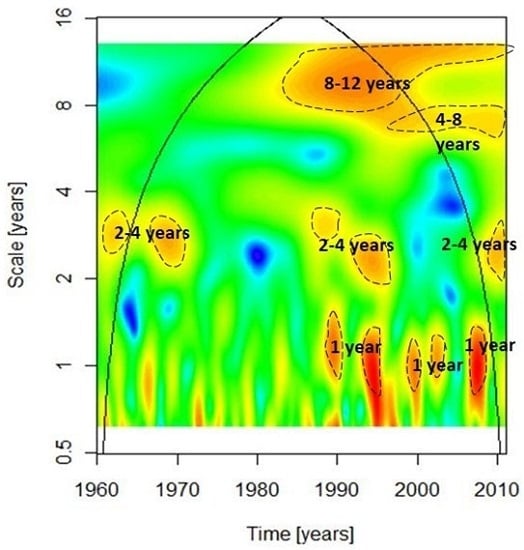
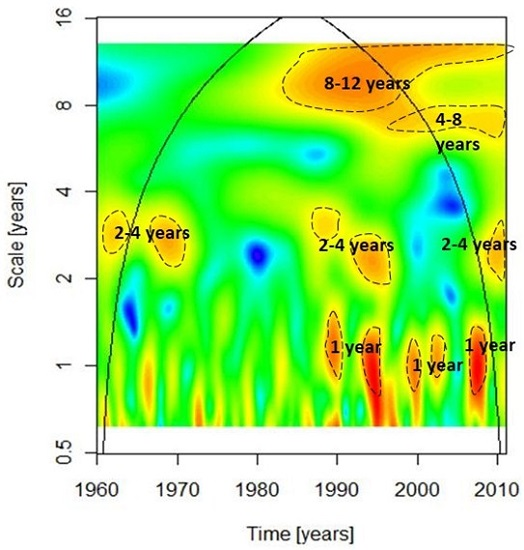
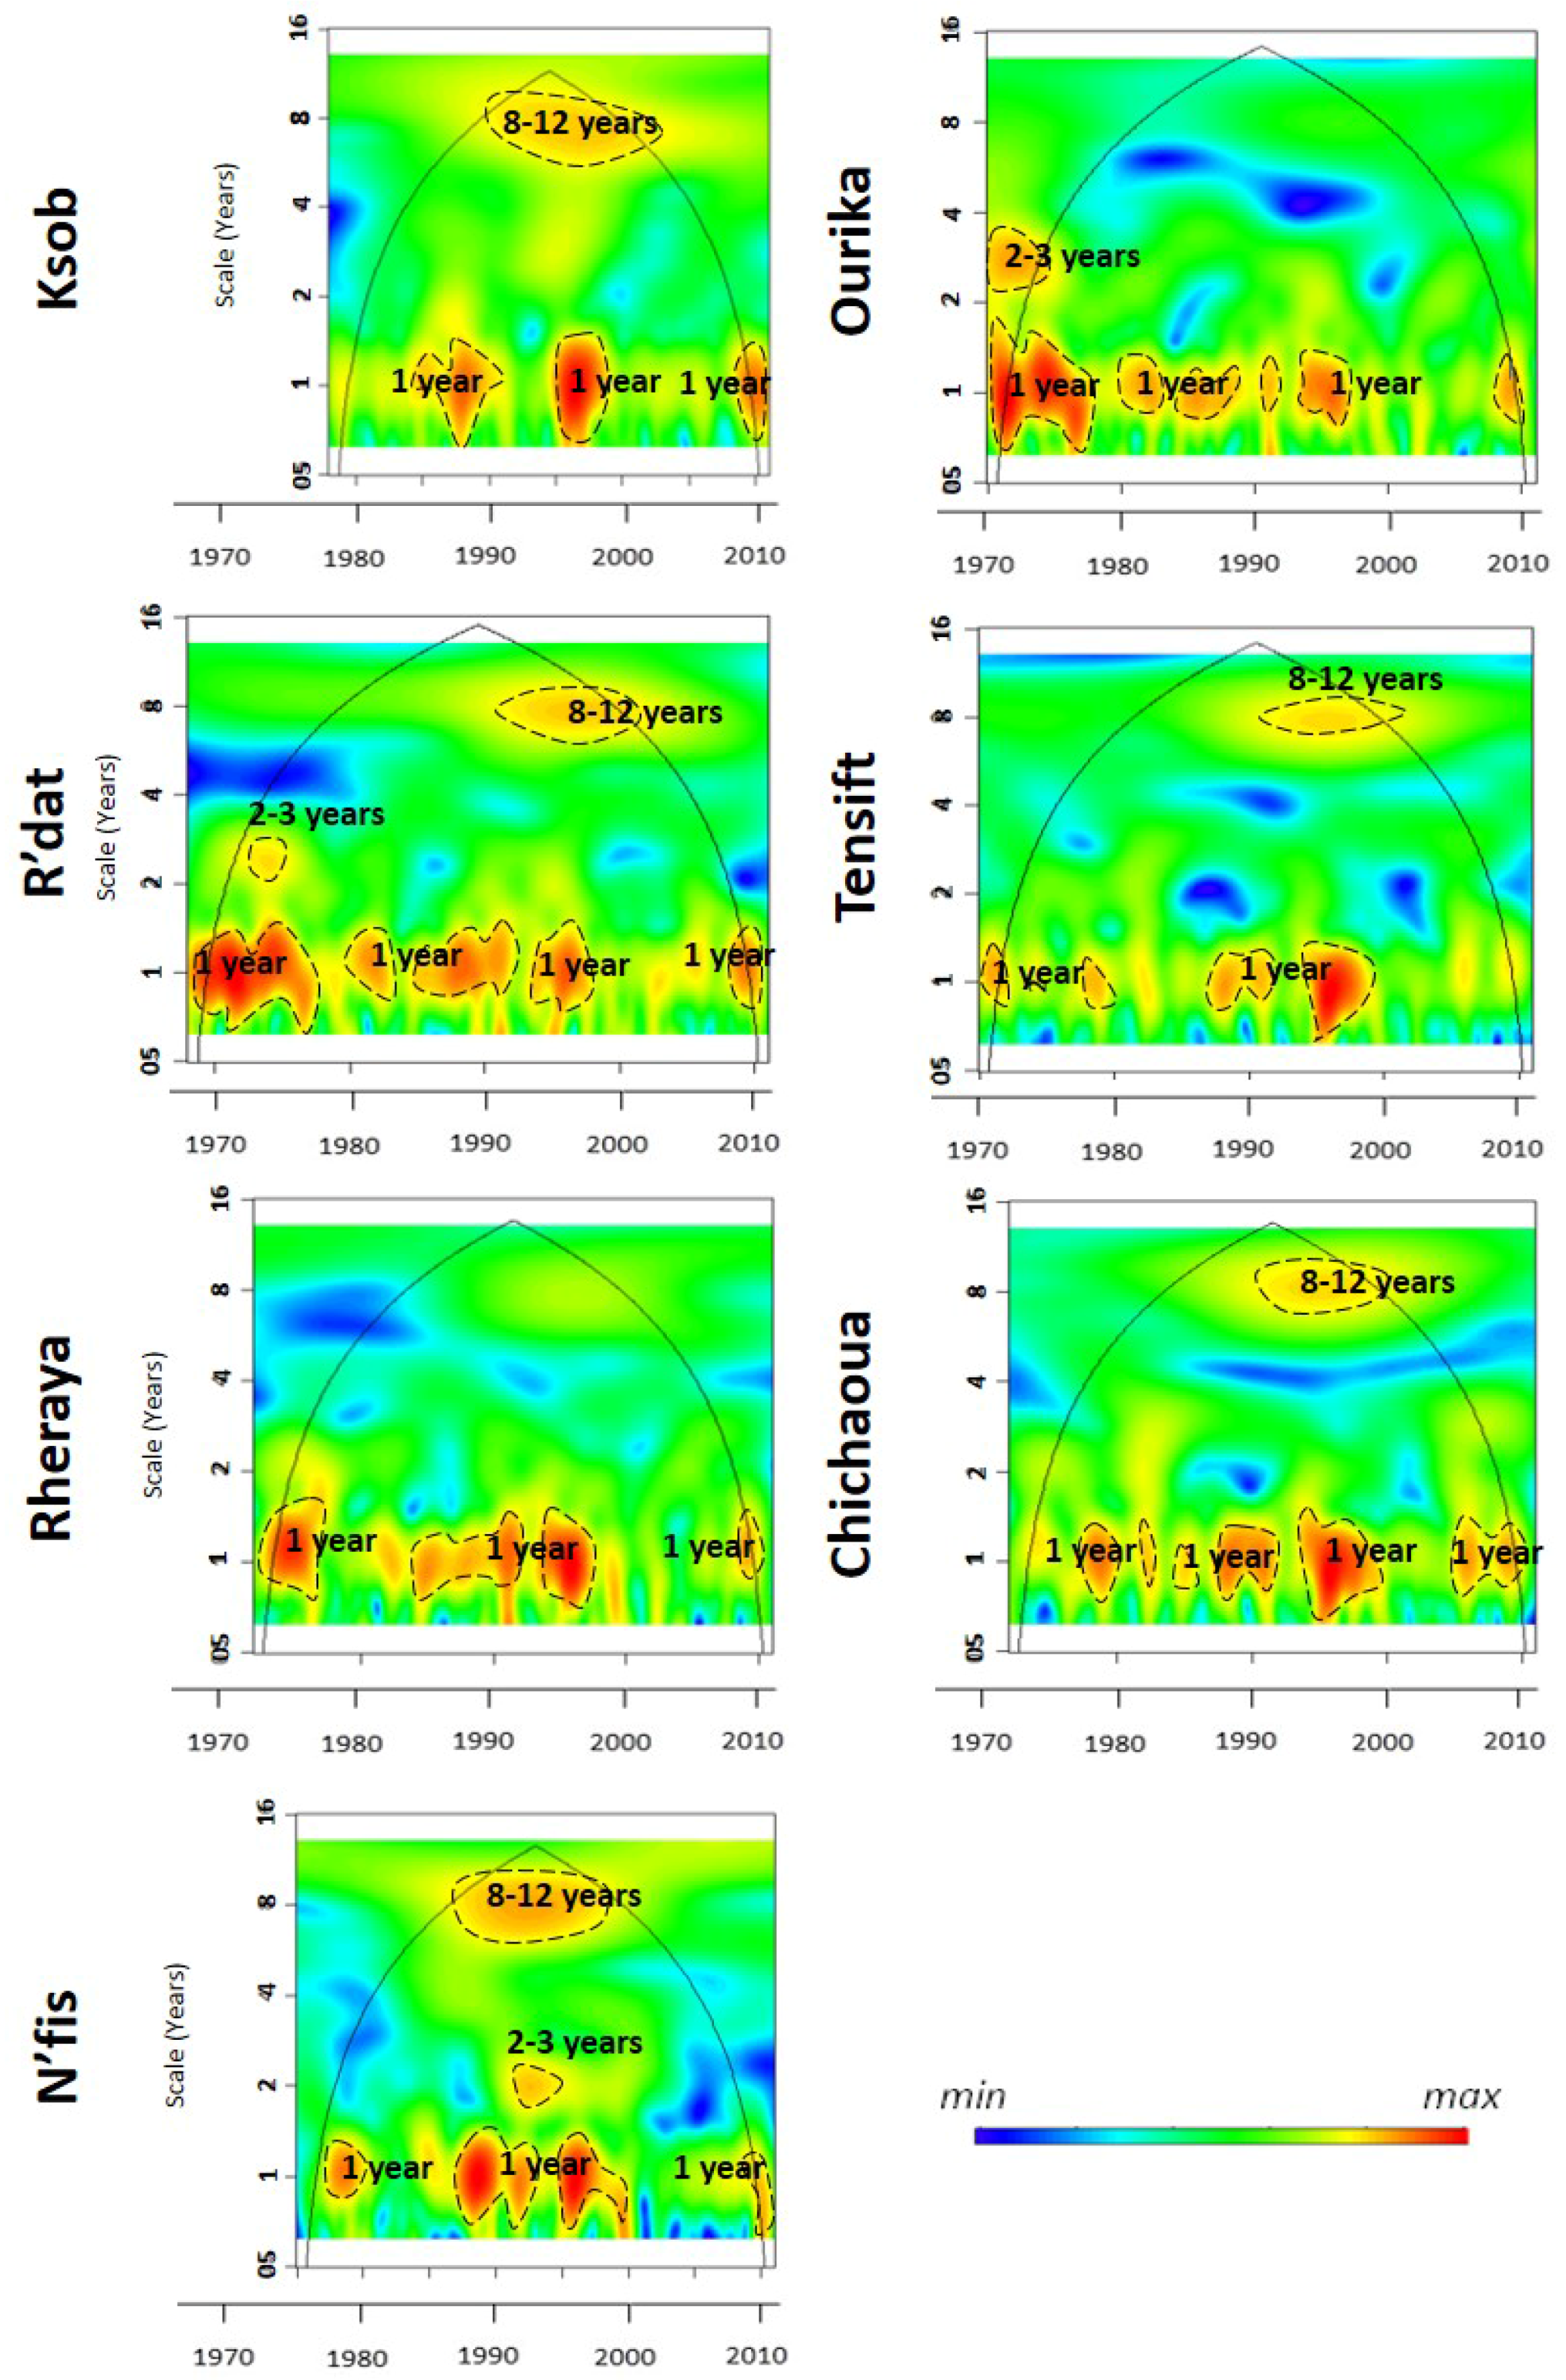
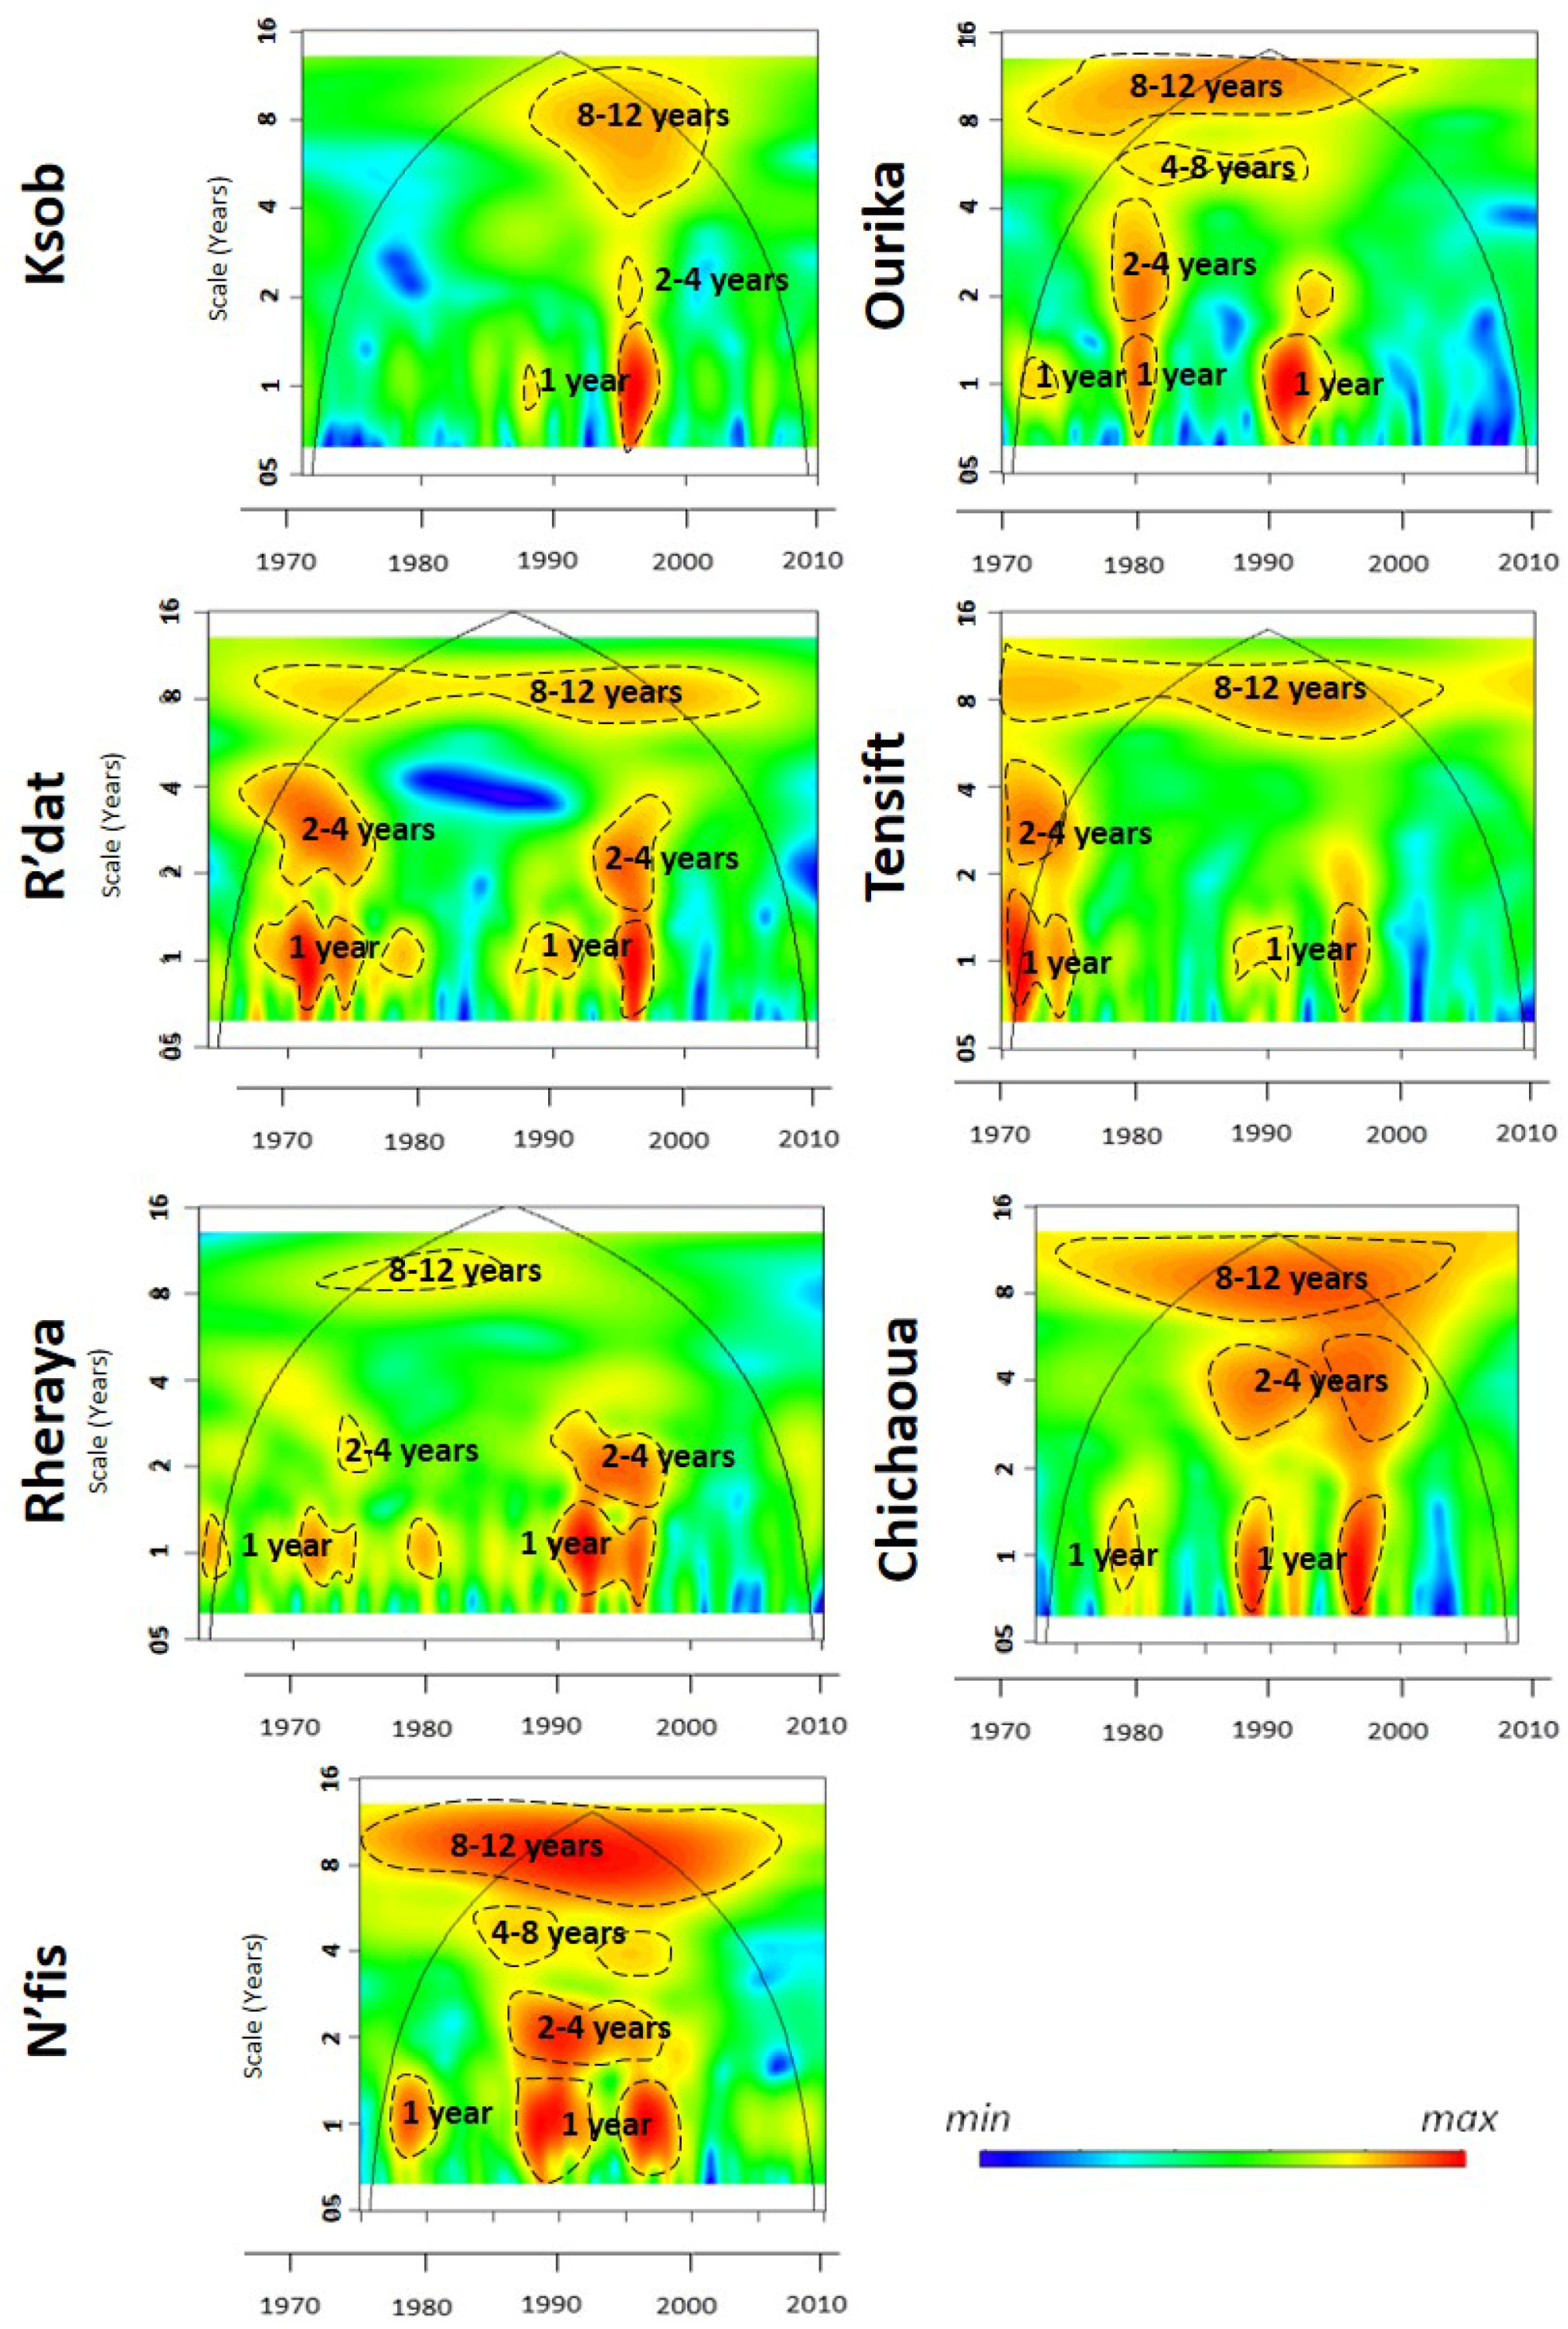
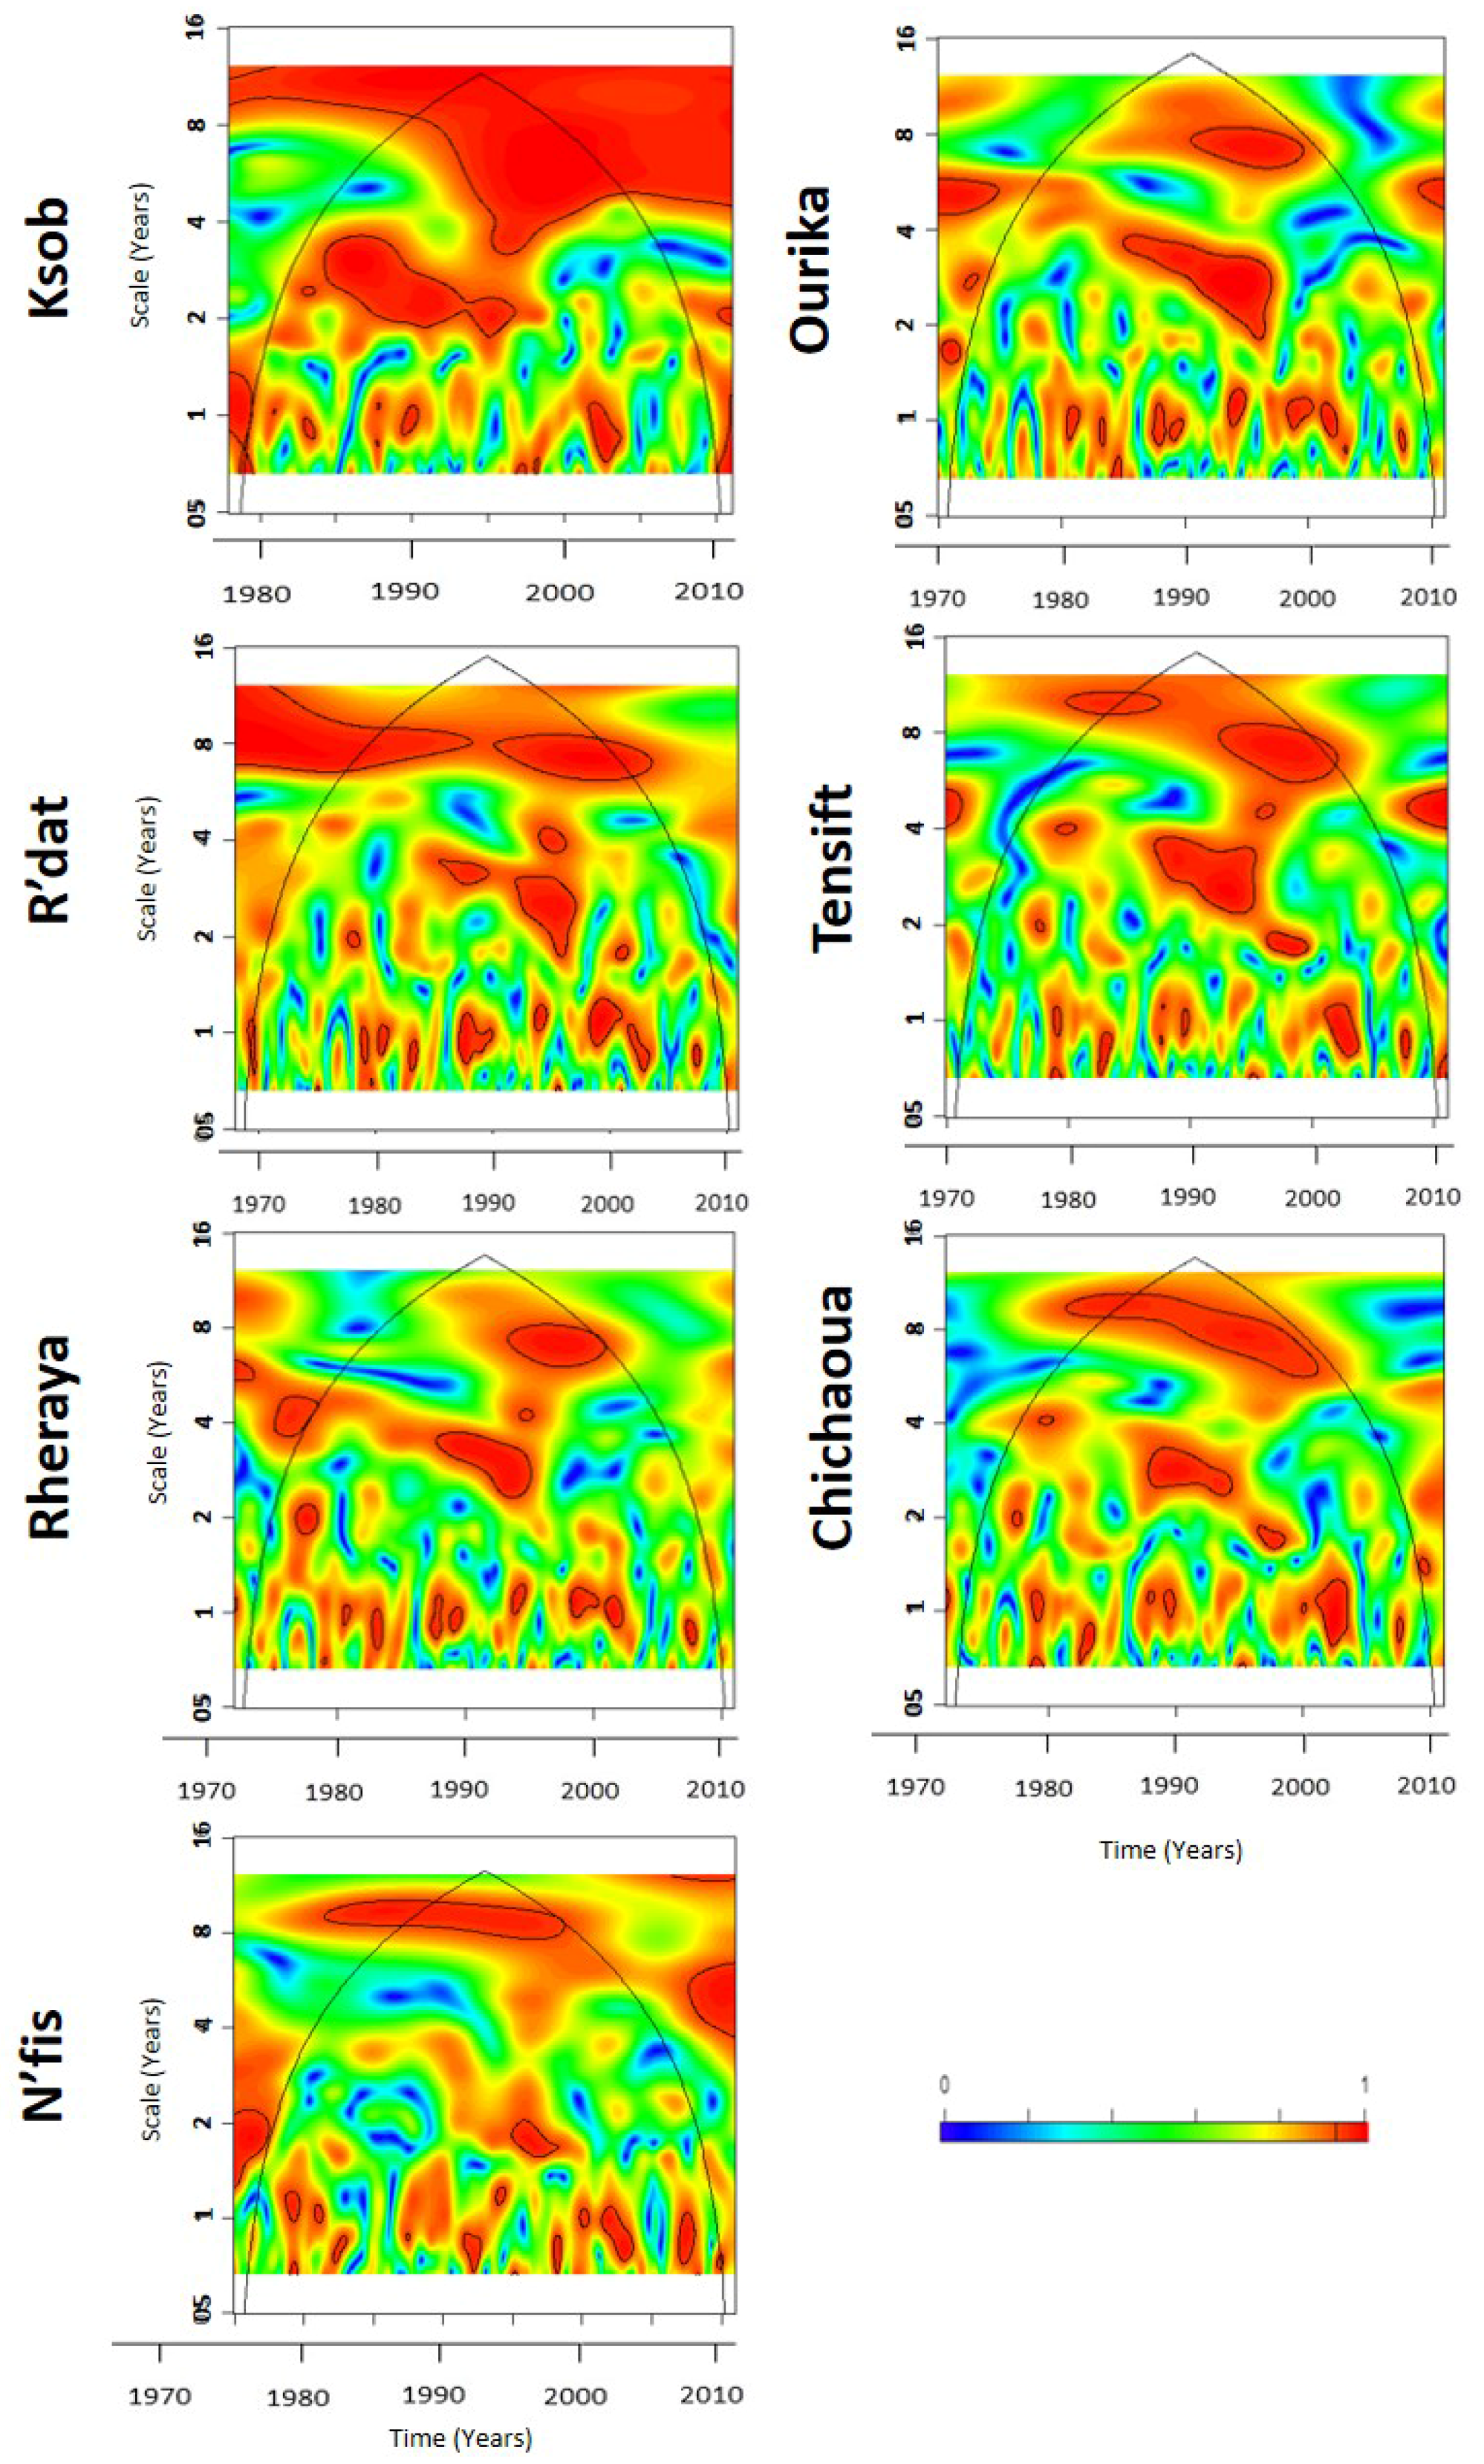
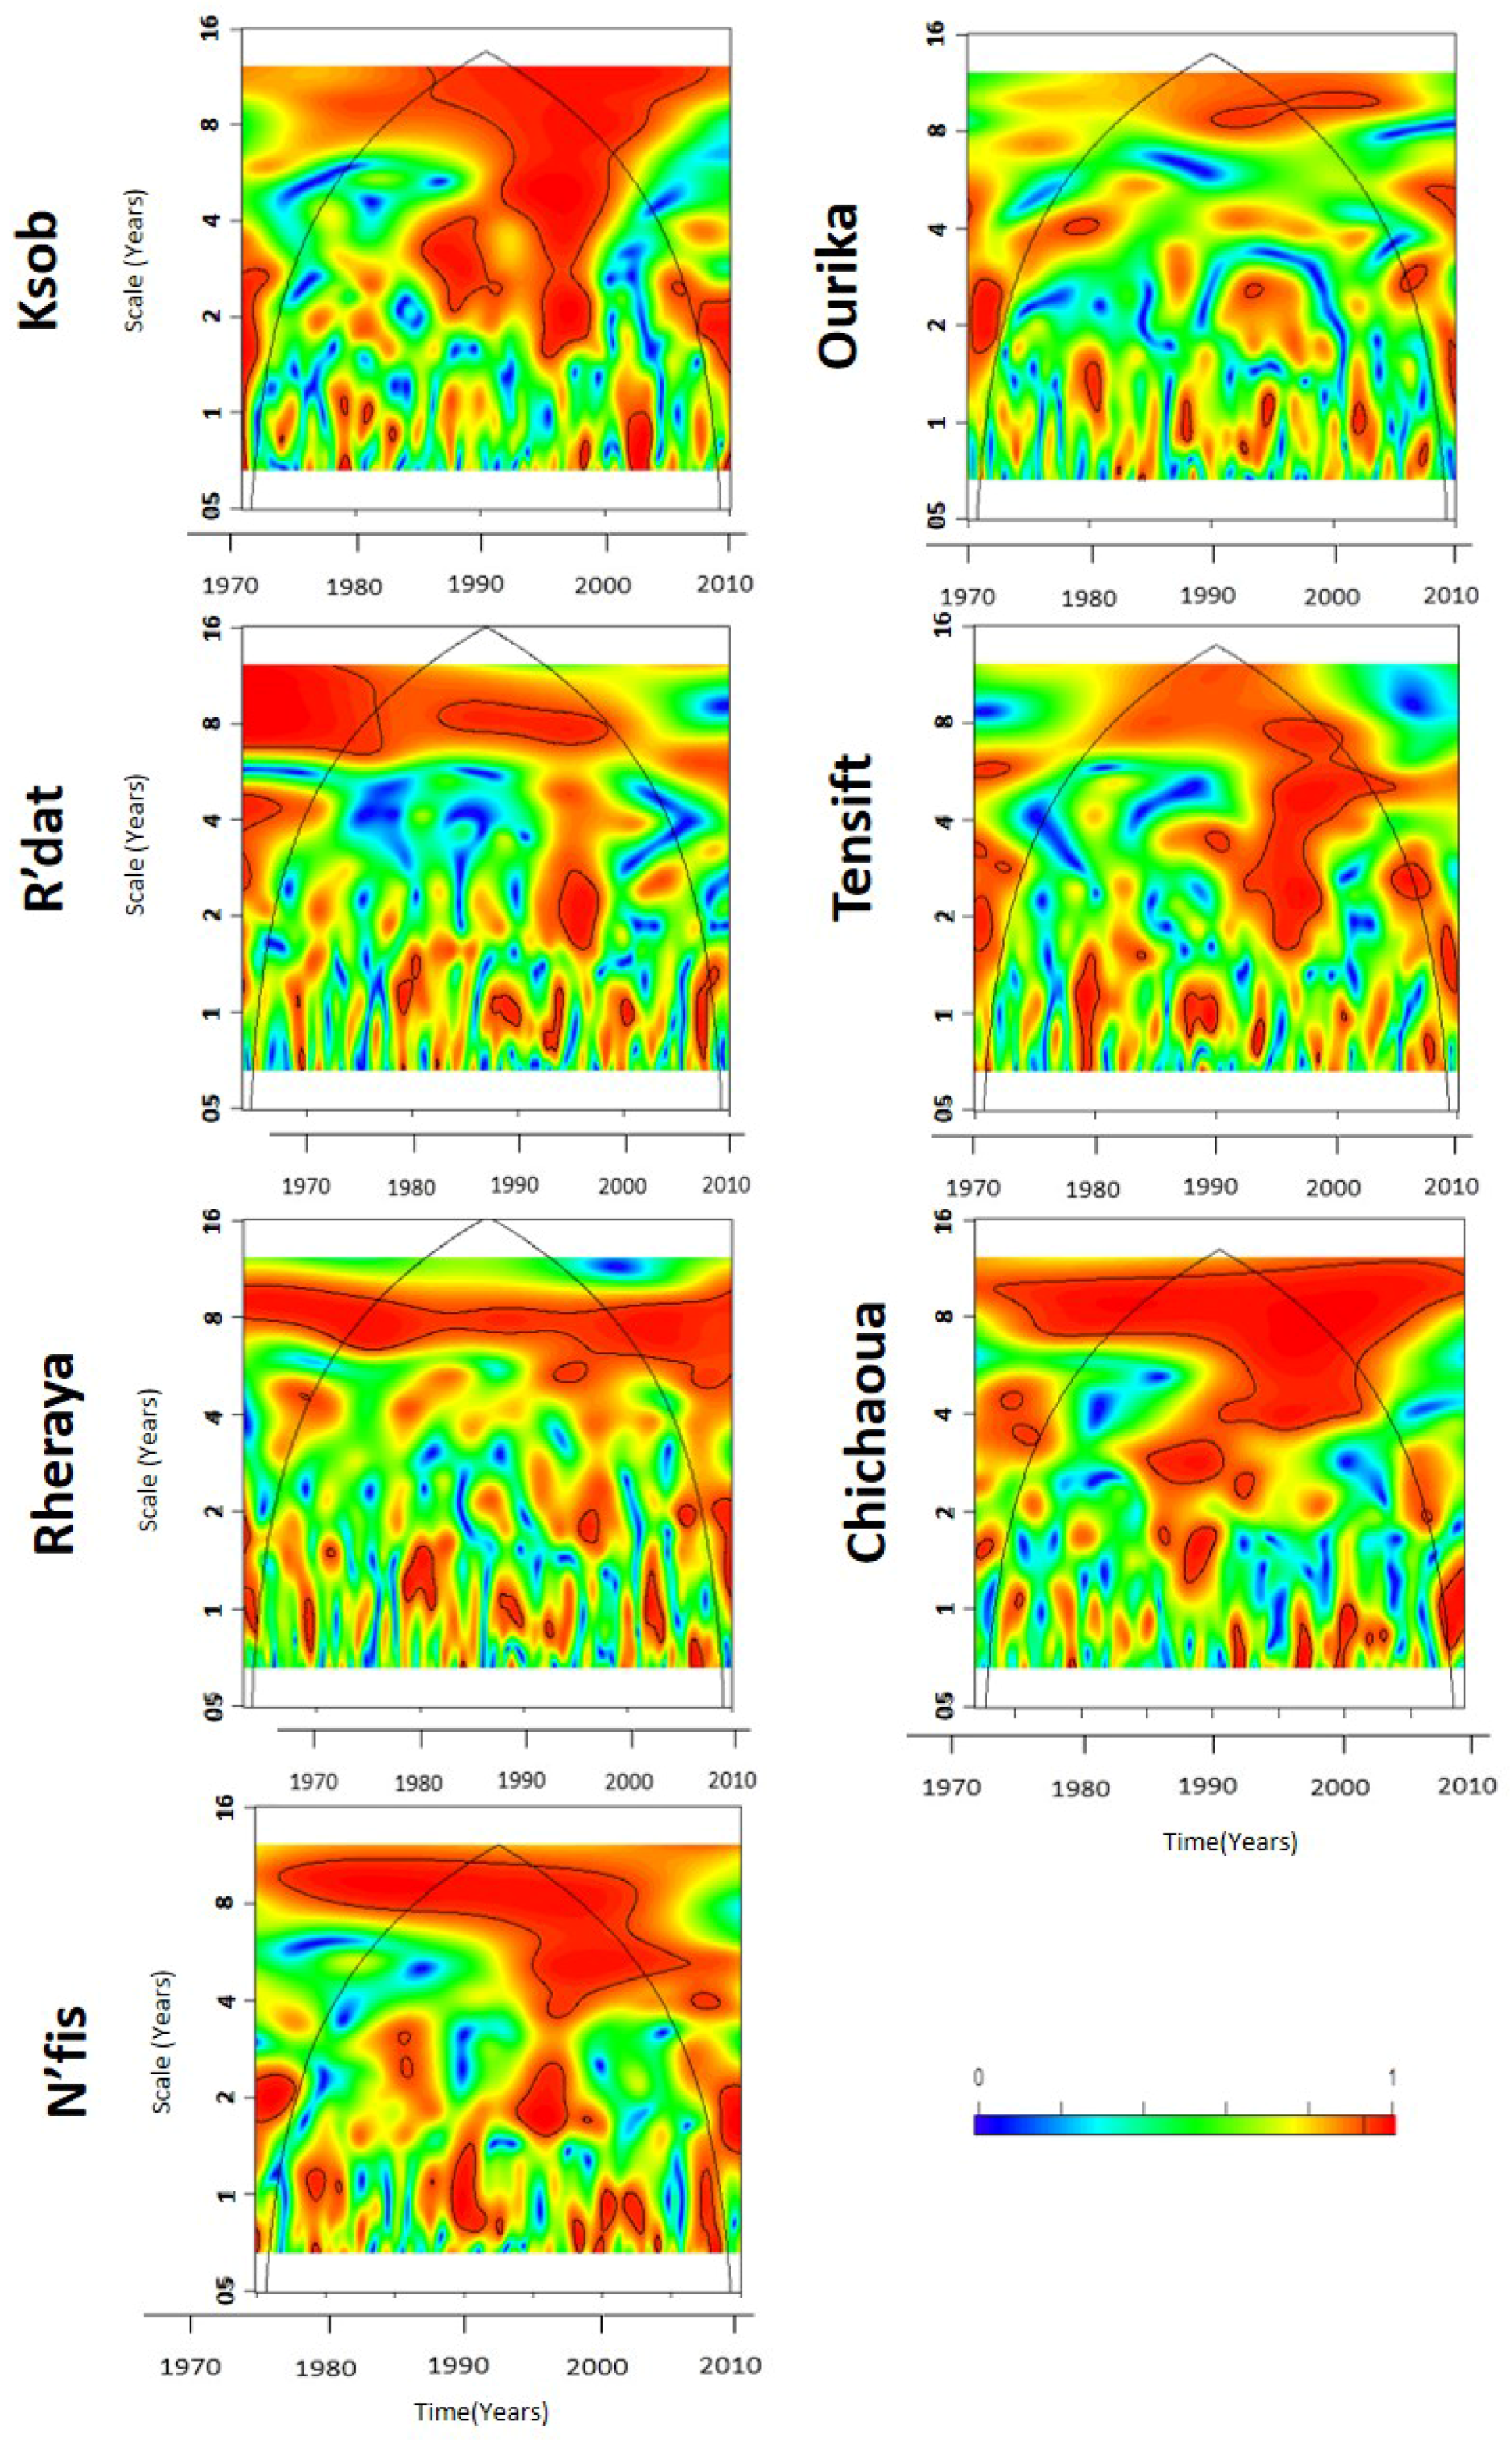
4.2. Hydrological Variability from the Wavelet Analysis
Rainfall
5. Discussion: Influence of the Climatic Fluctuations of the North Atlantic Oscillation (NAO) on the Hydrological Variability of the Tensift and Ksob Basins
5.1. Comparison between Rainfall and Streamflow
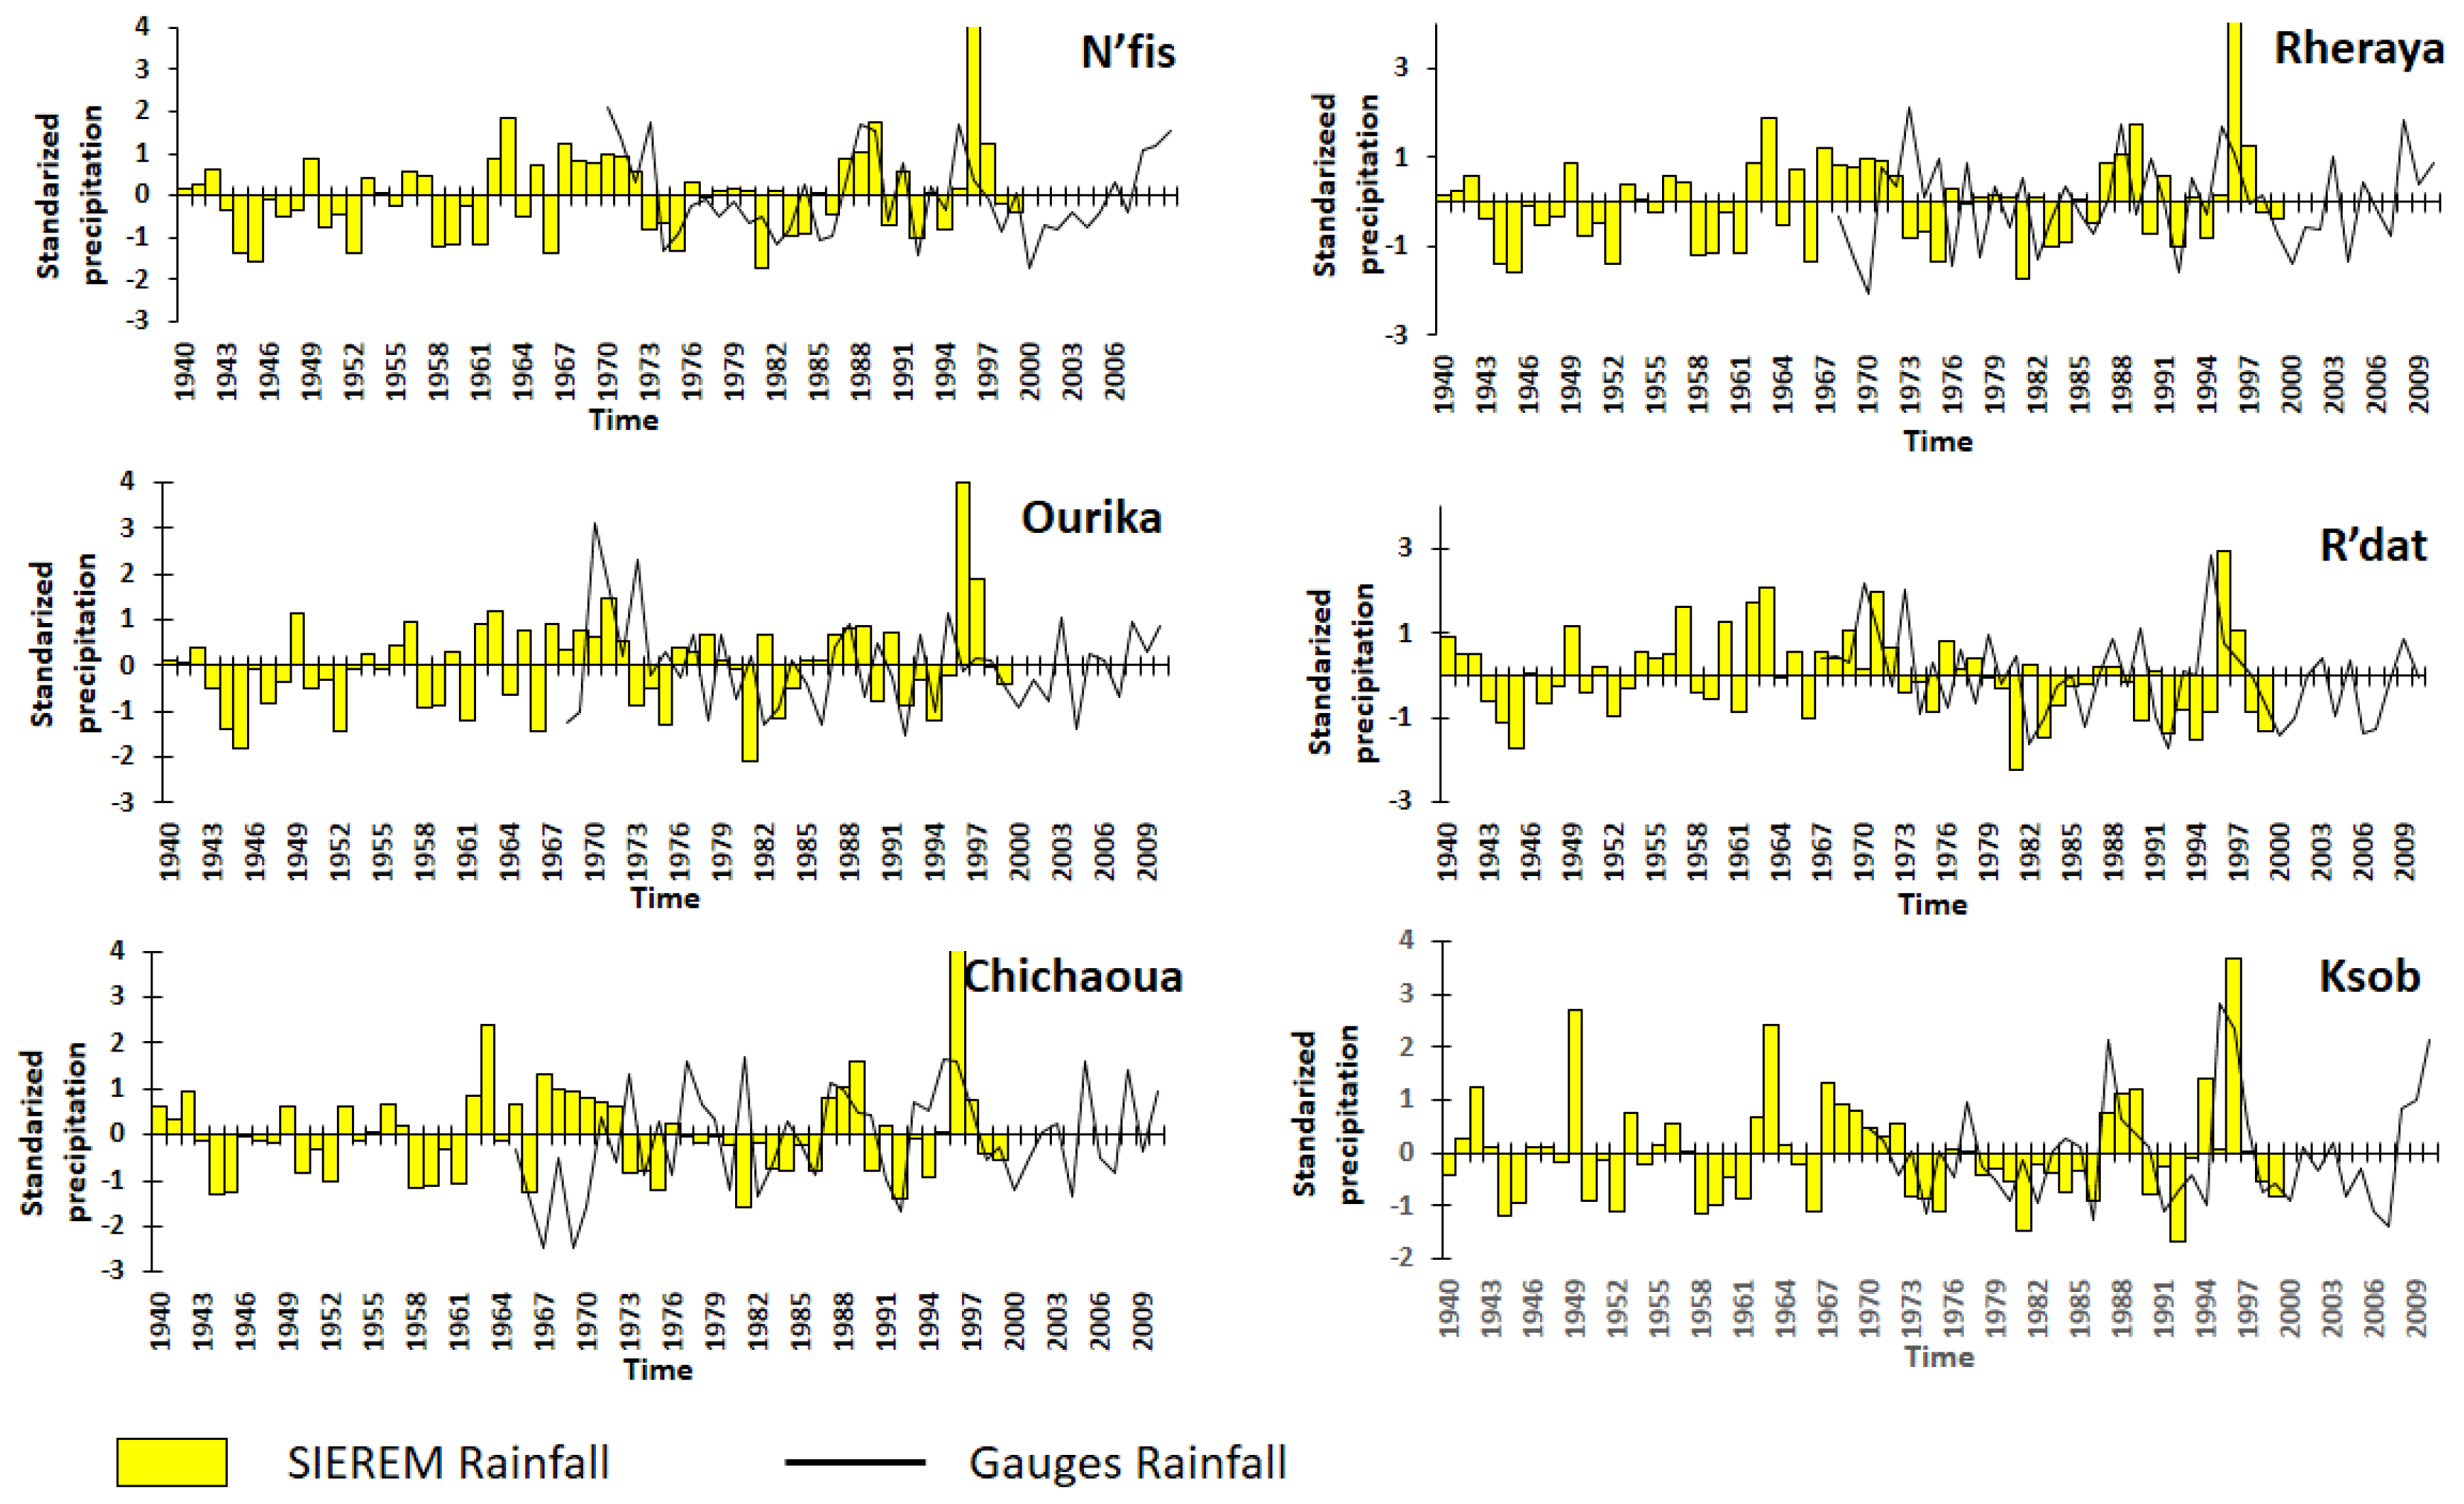
5.2. Comparison between Rainfall and Gridded Rainfall Data
5.3. Influence of the NAO on the Hydrological Variability
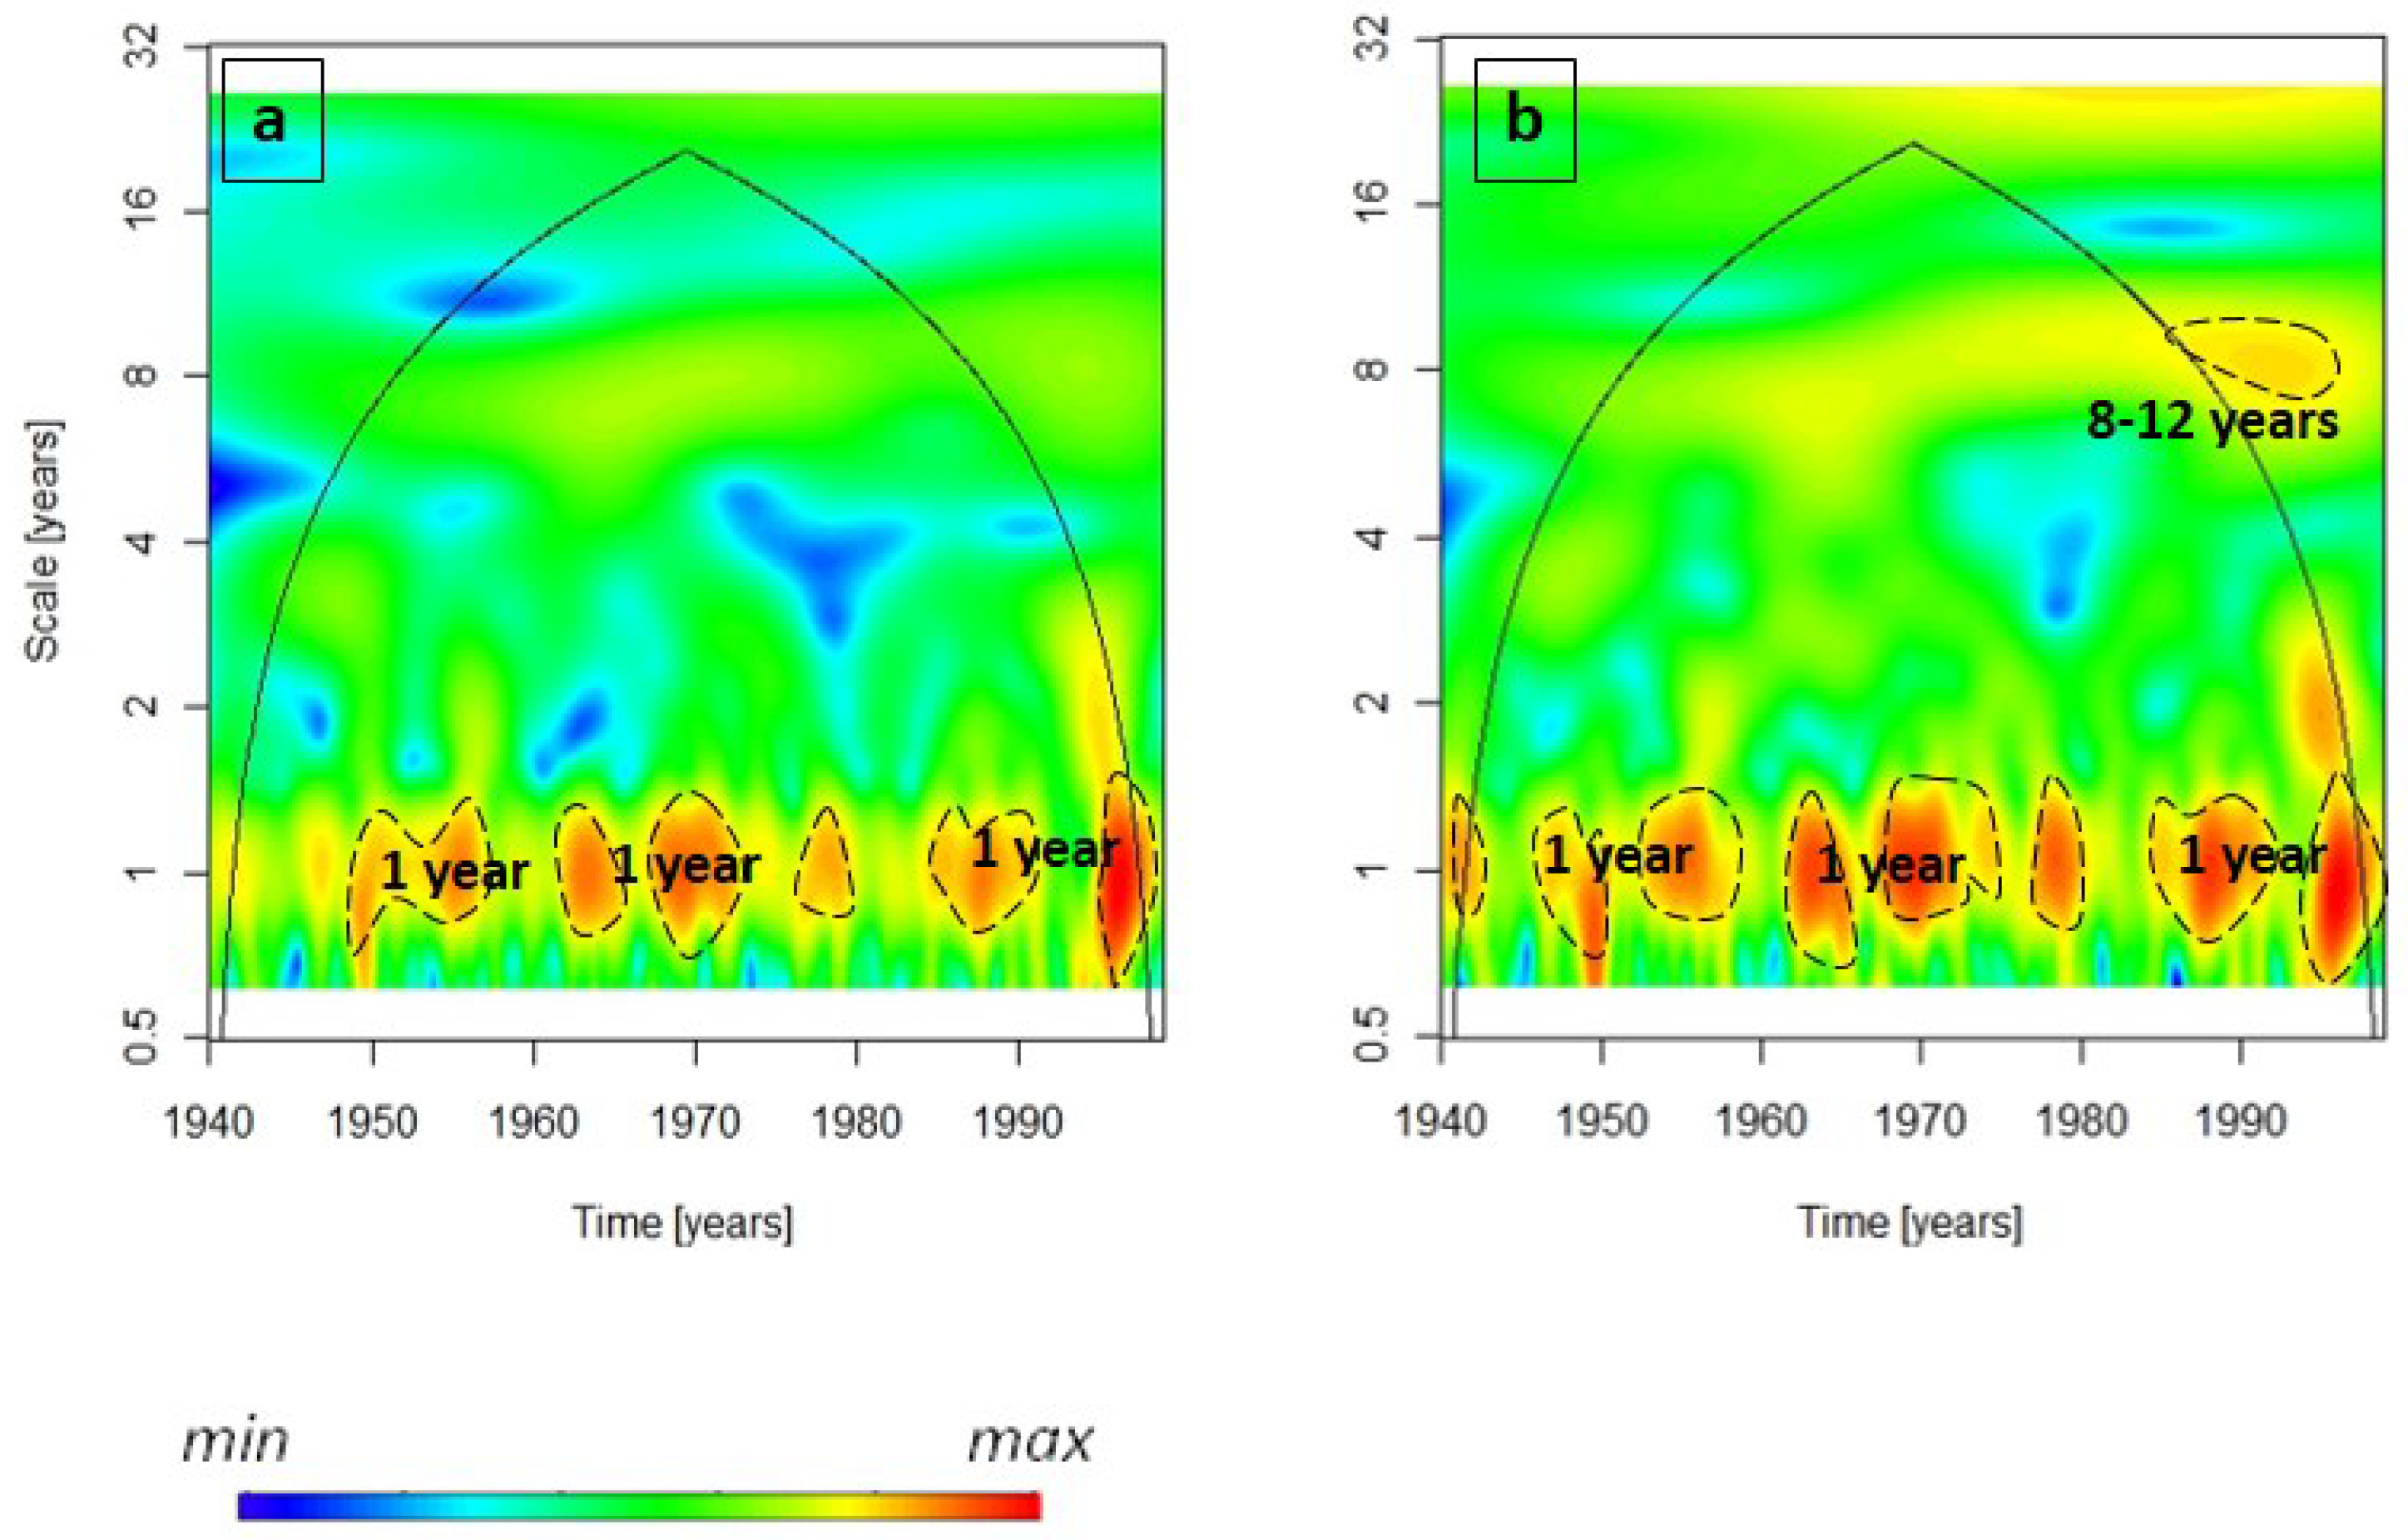
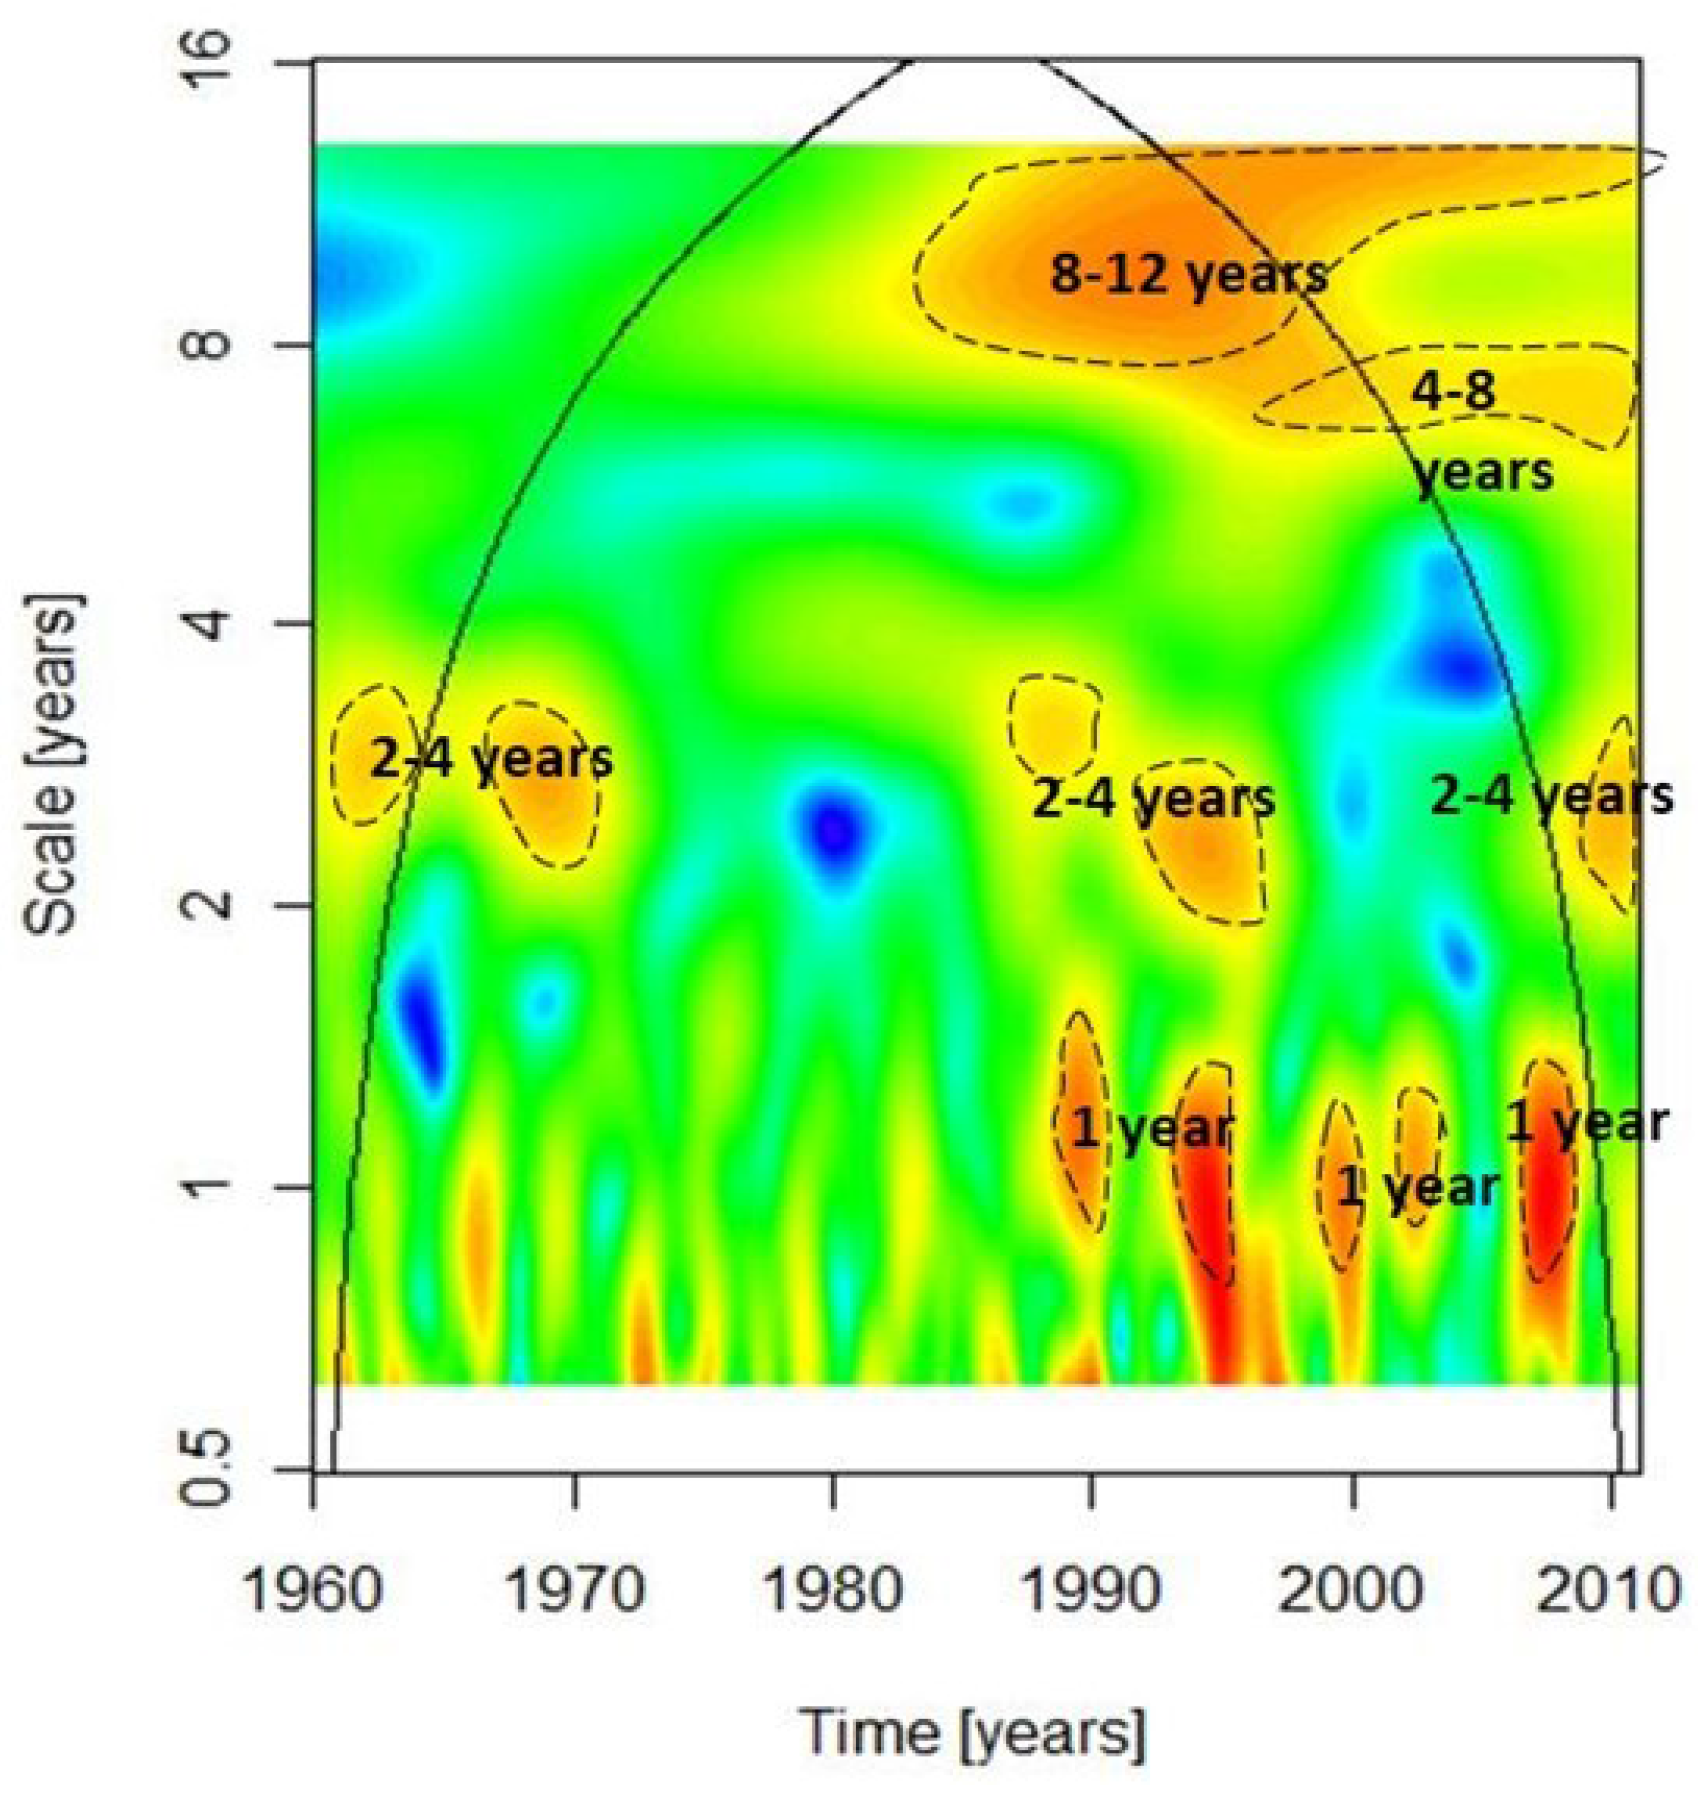
5.4. NAO Wavelet Analysis
6. Conclusions
Acknowledgments
Author Contributions
Conflicts of Interest
References
- Pachauri, R.K.; Andy, R. Climate Change 2007 Synthesis Report: Summary for Policymakers; IPCC Secretariat: Geneva, Switzerland, 2007. [Google Scholar]
- Seguin, B. Coup de chaud sur l’agriculture. Meteorologie 2010, 71, 55. [Google Scholar]
- Hurrell, J.W. Decadal trends in the North Atlantic Oscillation: Regional temperatures and precipitation. Science 1995, 269, 676–679. [Google Scholar] [CrossRef] [PubMed]
- Khomsi, K.; Mahe, G.; Sinan, M.; Snoussi, M. Hydro-climatic variability in two Moroccan watersheds: A comparative analysis of temperature, rain and flow regimes. In Climate and Land Surface Changes in Hydrology; Boegh, E., Blyth, E., Hannah, D.M., Hisdal, H., Kunstmann, H., Su, B., Yilmaz, K.K., Eds.; IAHS Publication: Wallingford, UK, 2013; Volume 359, pp. 183–190. [Google Scholar]
- Berri, G.J.; Ghietto, M.A.; Garcia, N.O. The influence of ENSO in the flows of the upper Parana river of South America over the past 100 years. J. Hydrometeorol. 2002, 3, 57–65. [Google Scholar] [CrossRef]
- Labat, D.; Espinoza, J.C.; Ronchail, J.; Cochonneau, G.; de Oliveira, E.; Doudou, J.C.; Guyot, J.L. Fluctuations in the monthly discharge of Guyana Shield rivers, related to Pacific and Atlantic climate variability. Hydrol. Sci. J. 2012, 57, 1081–1091. [Google Scholar] [CrossRef]
- Biondi, F.; Gershunov, A.; Cayan, D.R. North Pacific decadal climate variability since 1661. J. Clim. 2001, 14, 5–10. [Google Scholar] [CrossRef]
- Chang, P.; Ji, L.; Li, H. A decadal climate variation in the tropical Atlantic Ocean from thermodynamic air-sea interaction. Nature 1997, 85, 516–518. [Google Scholar] [CrossRef]
- Hurrell, J.W.; Van Loon, H. Decadal variations in climate associated with the North Atlantic Oscillation. In Climatic Change at High Elevation Sites; Diaz, H.F., Beniston, M., Bradley, R.S., Eds.; Springer: Berlin, Germany, 1997; pp. 69–94. [Google Scholar]
- Barnston, A.G.; Livezey, R.E. Classification, seasonality and persistence of low frequency atmospheric circulation patterns. Mon. Weather Rev. 1987, 115, 1083–1126. [Google Scholar] [CrossRef]
- Di Mauro, G.; Bonaccorso, B.; Cancelliere, A.; Rossi, G. Use of NAO index to improve drought forecasting in the Mediterranean area: Application to Sicily region. In Drought Management: Scientific and Technological Innovations; López-Francos, A., Ed.; CIHEAM: Zaragoza, Spain, 2008; pp. 311–319. [Google Scholar]
- Rossi, A.; Massei, N.; Laignel, B.; Sebag, D.; Copard, Y. The response of the Mississippi River to climate fluctuations and reservoir construction as indicated by wavelet analysis of streamflow and suspended-sediment load, 1950–1975. J. Hydrol. 2009, 377, 237–244. [Google Scholar] [CrossRef]
- Massei, N.; Durand, A.; Deloffre, J.; Dupont, J.P.; Valdes, D.; Laignel, B. Investigating possible links between the North Atlantic Oscillation and rainfall variability in northwestern France over the past 35 years. J. Geophys. Res. Atmos. 2007, 112. [Google Scholar] [CrossRef]
- Massei, N.; Laignel, B.; Deloffre, J.; Mesquita, J.; Motelay, A.; Lafite, R.; Durand, A. Long-term hydrological changes of the Seine River flow (France) and their relation to the North Atlantic Oscillation over the period 1950–2008. Int. J. Climatol. 2009, 30, 2146–2154. [Google Scholar] [CrossRef]
- Laignel, B.; Massei, N.; Rossi, A.; Mesquita, J.; Slimani, S. Water Resources Variability in the Context of Climatic Fluctuations on Both Sides of the Atlantic Ocean; IAHS-AISH Publication: Wallingford, UK, 2010; pp. 612–619. [Google Scholar]
- Massei, N.; Laignel, B.; Rosero, E.; Motelay-Massei, A.; Deloffre, J.; Yang, Z.L.; Rossi, A. A wavelet approach to the short-term to pluridecennal variability of streamflow in the Mississippi river basin from 1934 to 1998. Int. J. Climatol. 2011, 31, 31–43. [Google Scholar] [CrossRef]
- Lotsch, A.; Friedl, M.A.; Anderson, B.T.; Tucker, C.J. Response of terrestrial ecosystems to recent Northern Hemispheric drought. Geophys. Res. Lett. 2005, 32. [Google Scholar] [CrossRef]
- Facilité euro-méditerranéenne d’investissement et de partenariat. A Review of the Economic and Social Impact of Microfinance with Analysis of Options for the Mediterranean Region; European Investment Bank: Boulevard Konrad Adenauer, Luxembourg, 2008. [Google Scholar]
- Knippertz, P.; Fink, A.H.; Reiner, A.; Speth, P. Three late summer/early autumn cases of tropical-extratropical interactions causing precipitation in Northwest Africa. Mon. Weather Rev. 2003, 131, 116–135. [Google Scholar] [CrossRef]
- Winstanley, D. Rainfall patterns and general atmospheric circulation. Nature 1973, 245, 190–194. [Google Scholar] [CrossRef]
- Bunting, A.H.; Dennet, M.D.; Elston, J.; Milford, J.R. Rainfall trends in the West African Sahel. Q. J. R. Meteorol. Soc. 1976, 102, 59–64. [Google Scholar] [CrossRef]
- Lamb, P. Large-scale tropical Atlantic surface circulation patterns associated with sub-Saharan weather anomalies. Tellus 1978, 30, 240–251. [Google Scholar] [CrossRef]
- Lamb, P. Persistance of sub-Saharan drought. Nature 1982, 299, 46–47. [Google Scholar] [CrossRef]
- Nicholson, S.E. Revised rainfall series for the West Africa subtropics. Mon. Weather Rev. 1979, 107, 620–623. [Google Scholar] [CrossRef]
- Olivry, J.C. Le point en 1982 sur l’évolution de la sécheresse en Sénégambie et aux Iles du Cap Vert. Examen de quelques séries de longue durée (débits et précipitations). Cah. ORSTOM, Série Hydrol. 1983, 20, 47–69. [Google Scholar]
- Olivry, J.C. Les conséquences durables de la sécheresse actuelle sur l’écoulement du fleuve Sénégal et l’hypersalinisation de la basse Casamance. In Influence of Climate Change Variability on Influence of Climate Change Variability on the Hydrologie Regime and Water Resources; IAHS Publication: Wallingford, UK, 1987; pp. 501–512. [Google Scholar]
- Farmer, G. The Rainfall Climatology of the Sahel from Senegal to Somalia. A Report for the International Union for the International Union for the Conversation of Nature and Nature Resources; IUCN: Gland, Switzerland, 1988. [Google Scholar]
- Lamb, P.; Peppier, R.A. Further case studies of tropical Atlantic surface atmospheric and oceanic patterns associated with subsaharan drought. J. Clim. 1992, 5, 476–488. [Google Scholar] [CrossRef]
- Hulme, M. The sensitivity of Sahel rainfall to global warming: implications for scenario analysis of future climate change impact. In Water Resources Variability in Africa during the XXth Century; Servat, E., Hughes, D., Fritsch, J.-M., Hulme, M., Eds.; IAHS Publication: Wallingford, UK, 1998; pp. 429–436. [Google Scholar]
- Mahé, G.; Paturel, J.E. 1896–2006 Sahelian rainfall variability and runoff increase of Sahelian rivers. Comptes Rendus Geosci. 2009, 341, 538–546. [Google Scholar] [CrossRef]
- Sircoulon, J. Les données hydropluviométriques de la sécheresse récente en Afrique intertropicale; comparaison avec les sécheresses “1913” et “1940”. Cah. ORSTOM Série Hydrol. 1976, 13, 75–174. [Google Scholar]
- Motha, R.P.; Leduc, S.K.; Steyaert, L.T.; Sakamoto, C.M.; Strommen, N.D. Precipitation patterns in west Africa. Mon. Weather Rev. 1980, 108, 1567–1578. [Google Scholar] [CrossRef]
- Sircoulon, J. La sécheresse en Afrique de l’Ouest. Comparaison des années 1982–1984 avec les années 1972–1973. Cah. ORSTOM Série Hydrol. 1985, 21, 75–86. [Google Scholar]
- Nicholson, S.E. The nature of rainfall fluctuations in subtropical West Africa. Mon. Weather Rev. 1980, 108, 473–487. [Google Scholar] [CrossRef]
- Nicholson, S.E. Sub-Saharan rainfall in the years 1976–1980: Evidence of continued drought. Mon. Weather Rev. 1983, 111, 1646–1654. [Google Scholar] [CrossRef]
- Camberlin, P. La Variabilité Interannuelle des Champs Pluviométriques Ouest Africains; Cahier du Centre de Recherches de Climatologie: Dijon, France, 1990; pp. 7–32. [Google Scholar]
- Hulme, M. Rainfall changes in Africa: 1931–1960 to 1961–1990. Int. J. Climatol. 1992, 12, 685–699. [Google Scholar] [CrossRef]
- Mahé, G.; Olivry, J.C. Variations des précipitations et des écoulements en Afrique de l’Ouest et Centrale de 1951 à 1989. Sécheresse 1995, 1, 109–117. [Google Scholar]
- Taibi, S.; Meddi, M.; Souag, D.; Mahé, G. Climate and Land Surface Changes in Hydrology. In Proceedings of the H01, IAHS-IAPSO-IASPEI Assembly, Gothenburg, Sweden, 22–26 July 2013; IAHS Publication: Wallingford, UK, 2013; pp. 191–197. [Google Scholar]
- Driouech, F.; Deque, M.; Sanchez-Gomez, E. Weather regimes—Moroccan precipitation link in a regional climate change simulation. Glob. Planet. Chang. 2010, 72, 1–10. [Google Scholar] [CrossRef]
- Beven, K.; Lamb, R.; Quinn, P.; Romanowicz, R.; Freer, J.; Singh, V.P. Topmodel. In Computer Models of Watershed Hydrology; Singh, V.P., Ed.; Water Resources Publications: Littleton, CO, USA, 1995; pp. 627–668. [Google Scholar]
- Stour, L.; Agoumi, A. Sécheresse climatique au Maroc durant les dernières décennies. Hydroécologie Appliquée 2008, 16, 215–232. [Google Scholar] [CrossRef]
- Turki, I.; Laignel, B.; Laftouhi, N.; Nouaceur, Z.; Zamrane, Z. Investigating possible links between the North Atlantic Oscillation and rainfall variability in Marrakech (Morocco). Arabian J. Geosci. 2016, 9, 1–14. [Google Scholar] [CrossRef]
- El Mimouni, A.; Daoudi, L.; Saidi, M.E.; Baiddah, A. Comportement hydrologique et dynamique d’un bassin versant en milieu semi-aride: Exemple du bassin versant du Ksob (haut atlas occidental, Maroc). Span. J. Quat. Geomorphol. 2010, 24, 99–112. [Google Scholar]
- Riad, S.; Mania, J.; Bouchaou, L. Variabilité hydroclimatique dans les bassins versants du Haut Atlas de Marrakech (Maroc). Sci. Chang. Planétaires Sécheresse. 2006, 17, 443–446. [Google Scholar]
- Allam, M.; Houmimyd, A. Etude de Protection Contre l’ensablement de la Liaison Routière Entre Moulay Bouzarktoun et Essaouira; Rapport du Service Forestier d’Essaouira: Essaouira, Morocco, 1990; p. 65. [Google Scholar]
- Weisrock, A. Géomorphologie et Paléoenvironnements de l’Atlas Atlantique, Maroc. Ph.D. Thesis, Université de Paris I, Paris, France, 1980; p. 837. [Google Scholar]
- Hander. Contribution à l’étude de la Bioclimatologie humaine au Maroc l’exemple d’Essaouira. Ph.D. Thesis, Université de Paris IV, Paris, France, 1993; p. 230. [Google Scholar]
- Graf, W. Dam nation: A geographic census of American dams and their large-scale hydrologic impacts. Water Resour. Res. 1999, 35, 1305–1311. [Google Scholar] [CrossRef]
- Boyer, J.F.; Dieulin, C.; Rouché, N.; Crès, A.; Servat, E.; Paturel, J.E.; Mahé, G. SIEREM: An environmental information system for water resources. In Water Resource Variability: Hydrological Impacts, Proceedings of the 5th FRIEND World Conference, La Havana, Cuba, 27 November–1 December 2006; IAHS Publication: Wallingford, UK, 2006; Volume 308, pp. 19–25. [Google Scholar]
- Rouché, N.; Mahé, G.; Ardoin-Bardin, S.; Brissaud, B.; Boyer, J.F.; Crès, A.; Dieulin, C.; Bardin, G.; Commelard, G.; Paturel, J.E.; et al. Constitution d’une grille de pluies mensuelles pour l’Afrique, période 1900–2000. Sécheresse 2010, 21, 336–338. [Google Scholar]
- Dieulin, C.; Mahe, G.; Ejjiyar, S.; El Mansouri, B.; Paturel, J.E.; Boyer, J.F. A new gridded rainfall dataset for Africa over the period 1940–1999. In Proceedings of the Large River Basins Conference, Manaus, Brazil, 21–25 July 2014; p. 53.
- Lubès, H.; Masson, J.M.; Servat, E.; Paturel, J.E.; Kouame, B.; Boyer, J.F. Caractérisation de Fluctuations dans une Série Chronologique par Applications de Tests Statistiques-Etude Bibliographique; Orstom éditions: Montpellier, France, 1994. [Google Scholar]
- Gaucherel, C. Use of wavelet transform for temporal characterisation of remote watersheds. J. Hydrol. 2002, 269, 101–121. [Google Scholar] [CrossRef]
- McCabe, G.J.; Wolock, D.M. A step increase in streamflow in the conterminous United States. Geophys. Res. Lett. 2002, 29. [Google Scholar] [CrossRef]
- Labat, D. Oscillations in land surface hydrological cycle. Earth Planet. Sci. Lett. 2006, 242, 143–154. [Google Scholar] [CrossRef]
- Daubechies, I. The wavelet transform time-frequency localization and signal analysis. IEEE Trans. Inf. Theory 1990, 36, 961–1005. [Google Scholar] [CrossRef]
- Labat, D. Recent advances in wavelet analyses: Part 1. A review of concepts. J. Hydrol. 2005, 314, 275–288. [Google Scholar] [CrossRef]
- Ghil, M.; Allen, M.R.; Dettinger, M.D.; Ide, K.; Kondrashov, D.; Mann, M.E.; Robertson, A.W.; Saunders, A.; Tian, Y.; Varadi, F.; et al. Advanced spectral methods for climatic time series. Rev. Geophys. 2002, 40. [Google Scholar] [CrossRef]
- Labat, D.; Ababou, R.; Mangin, A. Rainfall-runoff relations for karstic springs—Part II: Continuous wavelet and discrete orthogonal multiresolution analyses. J. Hydrol. 2000, 238, 149–178. [Google Scholar] [CrossRef]
- Lafrenieres, M.; Sharp, M. Wavelet analysis of inter-annual variability in the runoff regimes of glacial and nival stream catchments, Bow Lake, Alberta. Hydrol. Process. 2003, 17, 1093–1118. [Google Scholar] [CrossRef]
- Labat, D. Cross wavelet analyses of annual continental freshwater discharge and selected climate indices. J. Hydrol. 2010, 385, 269–278. [Google Scholar] [CrossRef]
- Maraun, D.; Kurths, J. Cross wavelet analysis: Significance testing and pitfalls. Non Linear Process. Geophys. 2004, 11, 505–514. [Google Scholar] [CrossRef] [Green Version]
- Torrence, C.; Compo, G.P. A practical guide to wavelet analysis. Bull. Am. Meteorol. Soc. 1998, 79, 61–78. [Google Scholar] [CrossRef]
- Mahe, G.; Singla, S.; Driouech, F.; Khomsi, F. Analyse de la persistance de ruptures dans des séries pluviométriques au Maroc en fonction de l’échelle spatiale et de la reconstitution des données. In Proceedings of the Conférence CIREDD4, Blida, Algeria, 22–23 February 2011.
- Anctil, F.; Coulibaly, P. Wavelet analysis of the interannual variability in southern Québec streamflow. J. Clim. 2004, 17, 163–173. [Google Scholar] [CrossRef]
- Kucuk, M.; Kahya, E.; Cengiz, T.M.; Karaca, M. North Atlantic Oscillation influences on Turkish lake levels. Hydrol. Process. 2009, 23, 893–906. [Google Scholar] [CrossRef]
- Coulibaly, P.; Burn, D.H. Wavelet analysis of variability in annual Canadian streamflow. Water Resour. Res. 2004, 40. [Google Scholar] [CrossRef]
- Mesquita, J. Facteurs de Contrôle Climatique et Géomorphologique de la Variabilité Hydrologique de Bassins Versants en Substrat Carbonaté. Comparaison Haute Normandie (FR) et Région d’Austin, Texas (USA). Ph.D. Thesis, Université de Rouen, Mont Saint Aignan, France, 2009. [Google Scholar]
- Climate Data: Hurrell North Atlantic Oscillation (NAO) Index (Station-Based). Available online: https://climatedataguide.ucar.edu/climate-data/hurrell-north-atlantic-oscillation-nao-index-station-based (accessed on 20 April 2016).
- Glueck, M.F.; Stockton, C.W. Reconstruction of the North Atlantic oscillation, 1429–1983. Int. J. Climatol. 2001, 21, 1453–1465. [Google Scholar] [CrossRef]
- Humbert, J.; Najjar, J.; Ambroise, B.; Amiet, Y. Caractéristiques Morphométriques et Hydrographiques des Bassins de la Petite Fecht et du Ringel Barch; Recherche Géographique Strasbourg: Strasbourg, France, 1982; pp. 19–21. [Google Scholar]
- Saidi, M.E. Contribution à l’hydrologie profonde et superficielle du bassin du Souss (Maroc). Ph.D. Thesis, Université de Paris IV, Paris, France, 1995. [Google Scholar]
- Saidi, M.E.M; Daoudi, L.; Aresmouk, M.; Blali, A. Rôle du milieu physique dans l’amplification des crues en milieu montagnard: Exemple de la crue du 17 août 1995 dans la vallée de l’Ourika (Haut Atlas, Maroc). Sci. Chang. Planét. Séch. 2003, 14, 107–114. [Google Scholar]


| Station Name | River | Coordinate | Area km2 | Perimeter km | Length km | Width km | Slope | |
|---|---|---|---|---|---|---|---|---|
| Lon | Lat | |||||||
| Abadla | Tensift | 8°33′ | 31°42′ | - | - | - | - | - |
| Adamna | Ksob | 9°40′ | 31°32′ | 1453 | 208 | 87 | 39.2 | 1.5 |
| Aghbalou | Ourika | 7°45′ | 31°18′ | 503 | 104 | 48.1 | 10.4 | 19.9 |
| Chichaoua | Chichaoua | 8°45′ | 31°33′ | 1317 | - | - | - | - |
| N’kouris | N’fis | 8°7′ | 31°3′ | 1282 | 214 | 92.9 | 14.3 | 3.5 |
| S_Rhal | R’dat | 7°27′ | 31°37′ | 452 | 130 | 50.1 | 11 | 13.8 |
| Tahnaout | Rheraya | 7°57’ | 31°16′ | 225 | 78 | 34 | 6.6 | 19.1 |
| K’sob | N’fis | Tensift | R’dat | Ourika | Chichaoua | Rheraya | |
|---|---|---|---|---|---|---|---|
| 1 year | Mid 1980s–1990 | 1975–1980 | 1 year | Mid 1980s–1990 | 1975–1980 | 1 year | Mid 1980s–1990 |
| 2–3 years | 1990–1995 | 1973–1975 | Beguinin–1975 | ||||
| 8 years | 1990–Mid 2000s | 1985–2000 | 1990–2000 | 1990–2000 | 1990–2000 |
| K’sob | N’fis | Tensift | R’dat | Ourika | Chichaoua | Rheraya | |
|---|---|---|---|---|---|---|---|
| 1 year | Mid 1990s–2000 | 1977–1980 1987–1990 1995–1998 | Beguinin-mid 1970s 1987–1992 Mid 1990s–1998 | 1965–1975 1990–1995 | Beguinin–1973 1979–1982 1990–1993 | 1977–1980 1997–1990 1995–1998 | 1970–1975 1979–1982 1990–1995 |
| 2–4 years | 1995–1997 | 1987–1995 | Beguinin–mid 1970s | 1965–1975 1995–1998 | 1979–1983 Around 1990 | 1985–2000 | Around 1975 1990–1995 |
| 4–8 years | 1985–1990 1995–2000 | ||||||
| 8–12 yeras | 1990–2000 | 1980–2005 | Beguinin–2000 | 1970–2000 | Beguinin–2000 | 1975–end | 1978–1985 |
| Tensift | Ksob | Ourika | Chichaoua | N’fis | R’dat | Rheraya | |
|---|---|---|---|---|---|---|---|
| 1 year | 64% | 69% | 66% | 66% | 67% | 66% | 66% |
| 2–3 years | 66% | 72% | 67% | 65% | 64% | 70% | 54% |
| 2–4 years | 65% | 78% | 68% | 62% | 66% | 76% | 69% |
| 8 years | 78% | 95% | 66% | 69% | 82% | 84% | 65% |
| Total | 68% | 78% | 67% | 65% | 70% | 74% | 63% |
| Tensift | Ksob | Ourika | Chichaoua | N’fis | R’dat | Ourika | |
|---|---|---|---|---|---|---|---|
| 1 year | 67% | 63% | 62% | 59% | 70% | 65% | 69% |
| 2–4 years | 69% | 73% | 63% | 71% | 67% | 59% | 63% |
| 4–8 years | 71% | 69% | 64% | 76% | 73% | 67% | 79% |
| 8–12 years | 67% | 90% | 79% | 94% | 91% | 84% | 84% |
| Total | 68% | 74% | 67% | 75% | 75% | 69% | 74% |
© 2016 by the authors; licensee MDPI, Basel, Switzerland. This article is an open access article distributed under the terms and conditions of the Creative Commons Attribution (CC-BY) license (http://creativecommons.org/licenses/by/4.0/).
Share and Cite
Zamrane, Z.; Turki, I.; Laignel, B.; Mahé, G.; Laftouhi, N.-E. Characterization of the Interannual Variability of Precipitation and Streamflow in Tensift and Ksob Basins (Morocco) and Links with the NAO. Atmosphere 2016, 7, 84. https://doi.org/10.3390/atmos7060084
Zamrane Z, Turki I, Laignel B, Mahé G, Laftouhi N-E. Characterization of the Interannual Variability of Precipitation and Streamflow in Tensift and Ksob Basins (Morocco) and Links with the NAO. Atmosphere. 2016; 7(6):84. https://doi.org/10.3390/atmos7060084
Chicago/Turabian StyleZamrane, Zineb, Imen Turki, Benoit Laignel, Gil Mahé, and Nour-Eddine Laftouhi. 2016. "Characterization of the Interannual Variability of Precipitation and Streamflow in Tensift and Ksob Basins (Morocco) and Links with the NAO" Atmosphere 7, no. 6: 84. https://doi.org/10.3390/atmos7060084