A Decade with VAMDC: Results and Ambitions

 , , , ,
  ,
,  , , , , , , , , , ,
  , ,
, ,  ,
, 
 , , , , , , , , , , , , , , , , , , ,
  , , , , add
Show full author list
, , , , add
Show full author list
Abstract
:1. Introduction
2. Current Status of VAMDC Connected Databases
2.1. Evolution of VAMDC Nodes/Connected Databases Since 2016
2.1.1. NIFS Databases
2.1.2. VALD
2.1.3. NIST ASD
2.1.4. Spectr-W
2.1.5. CHIANTI
2.1.6. TIPbase–TOPbase
2.1.7. Stark-B
2.1.8. CDMS and JPL Spectral Line Catalog
2.1.9. HITRAN
2.1.10. S&MPO
2.1.11. MeCaSDa, ECaSDa, TFMeCaSDa, SHeCaSDa, GeCaSDa, RuCaSDa, TFSiCaSDa, UHeCaSDa
2.1.12. CDSD-296, CDSD-1000, CDSD-4000, ASD-1000, NOSD-1000 and NDSD-1000
2.1.13. SESAM
2.1.14. W@DIS
2.1.15. KIDA
2.1.16. UDfA
2.1.17. BASECOL
2.1.18. MOlD
2.1.19. BeamDB
2.1.20. IDEADB
2.2. VAMDC Data Nodes that Have Not Evolved Since 2016
2.2.1. LASp
2.2.2. PAH
2.3. Databases in the Process of Being Connected to VAMDC
2.3.1. ExoMolOP
2.3.2. SSHADE in VAMDC
2.3.3. AMBDAS
2.3.4. DREAM-DESIRE
2.3.5. IAMDB
2.3.6. PEARL
2.3.7. Clusters
- Method of cluster formation (supersonic expansion, seeded beam, gas aggregation, electrospray ionisation, helium nanodroplets, etc.)
- Method of ionisation (electrospray ionisation, matrix-assisted laser desorption/ionisation, electron impact, photo ionisation, etc.)
- Steps in between (tandem mass spectrometry, collision-induced dissociation, etc.)
- Analysis method (time-of-flight, quadrupole, ion cyclotron resonance, etc.)
- Environment (temperature, pressure, etc.)
- Others (evaluation of data, publication, magic numbers, solvation-effect, etc.)
3. Current Status of VAMDC e-Infrastructure
3.1. Overview of the VAMDC e-Infrastructure Components
3.1.1. Data Nodes, Query Language and Data Formats
3.1.2. Registry
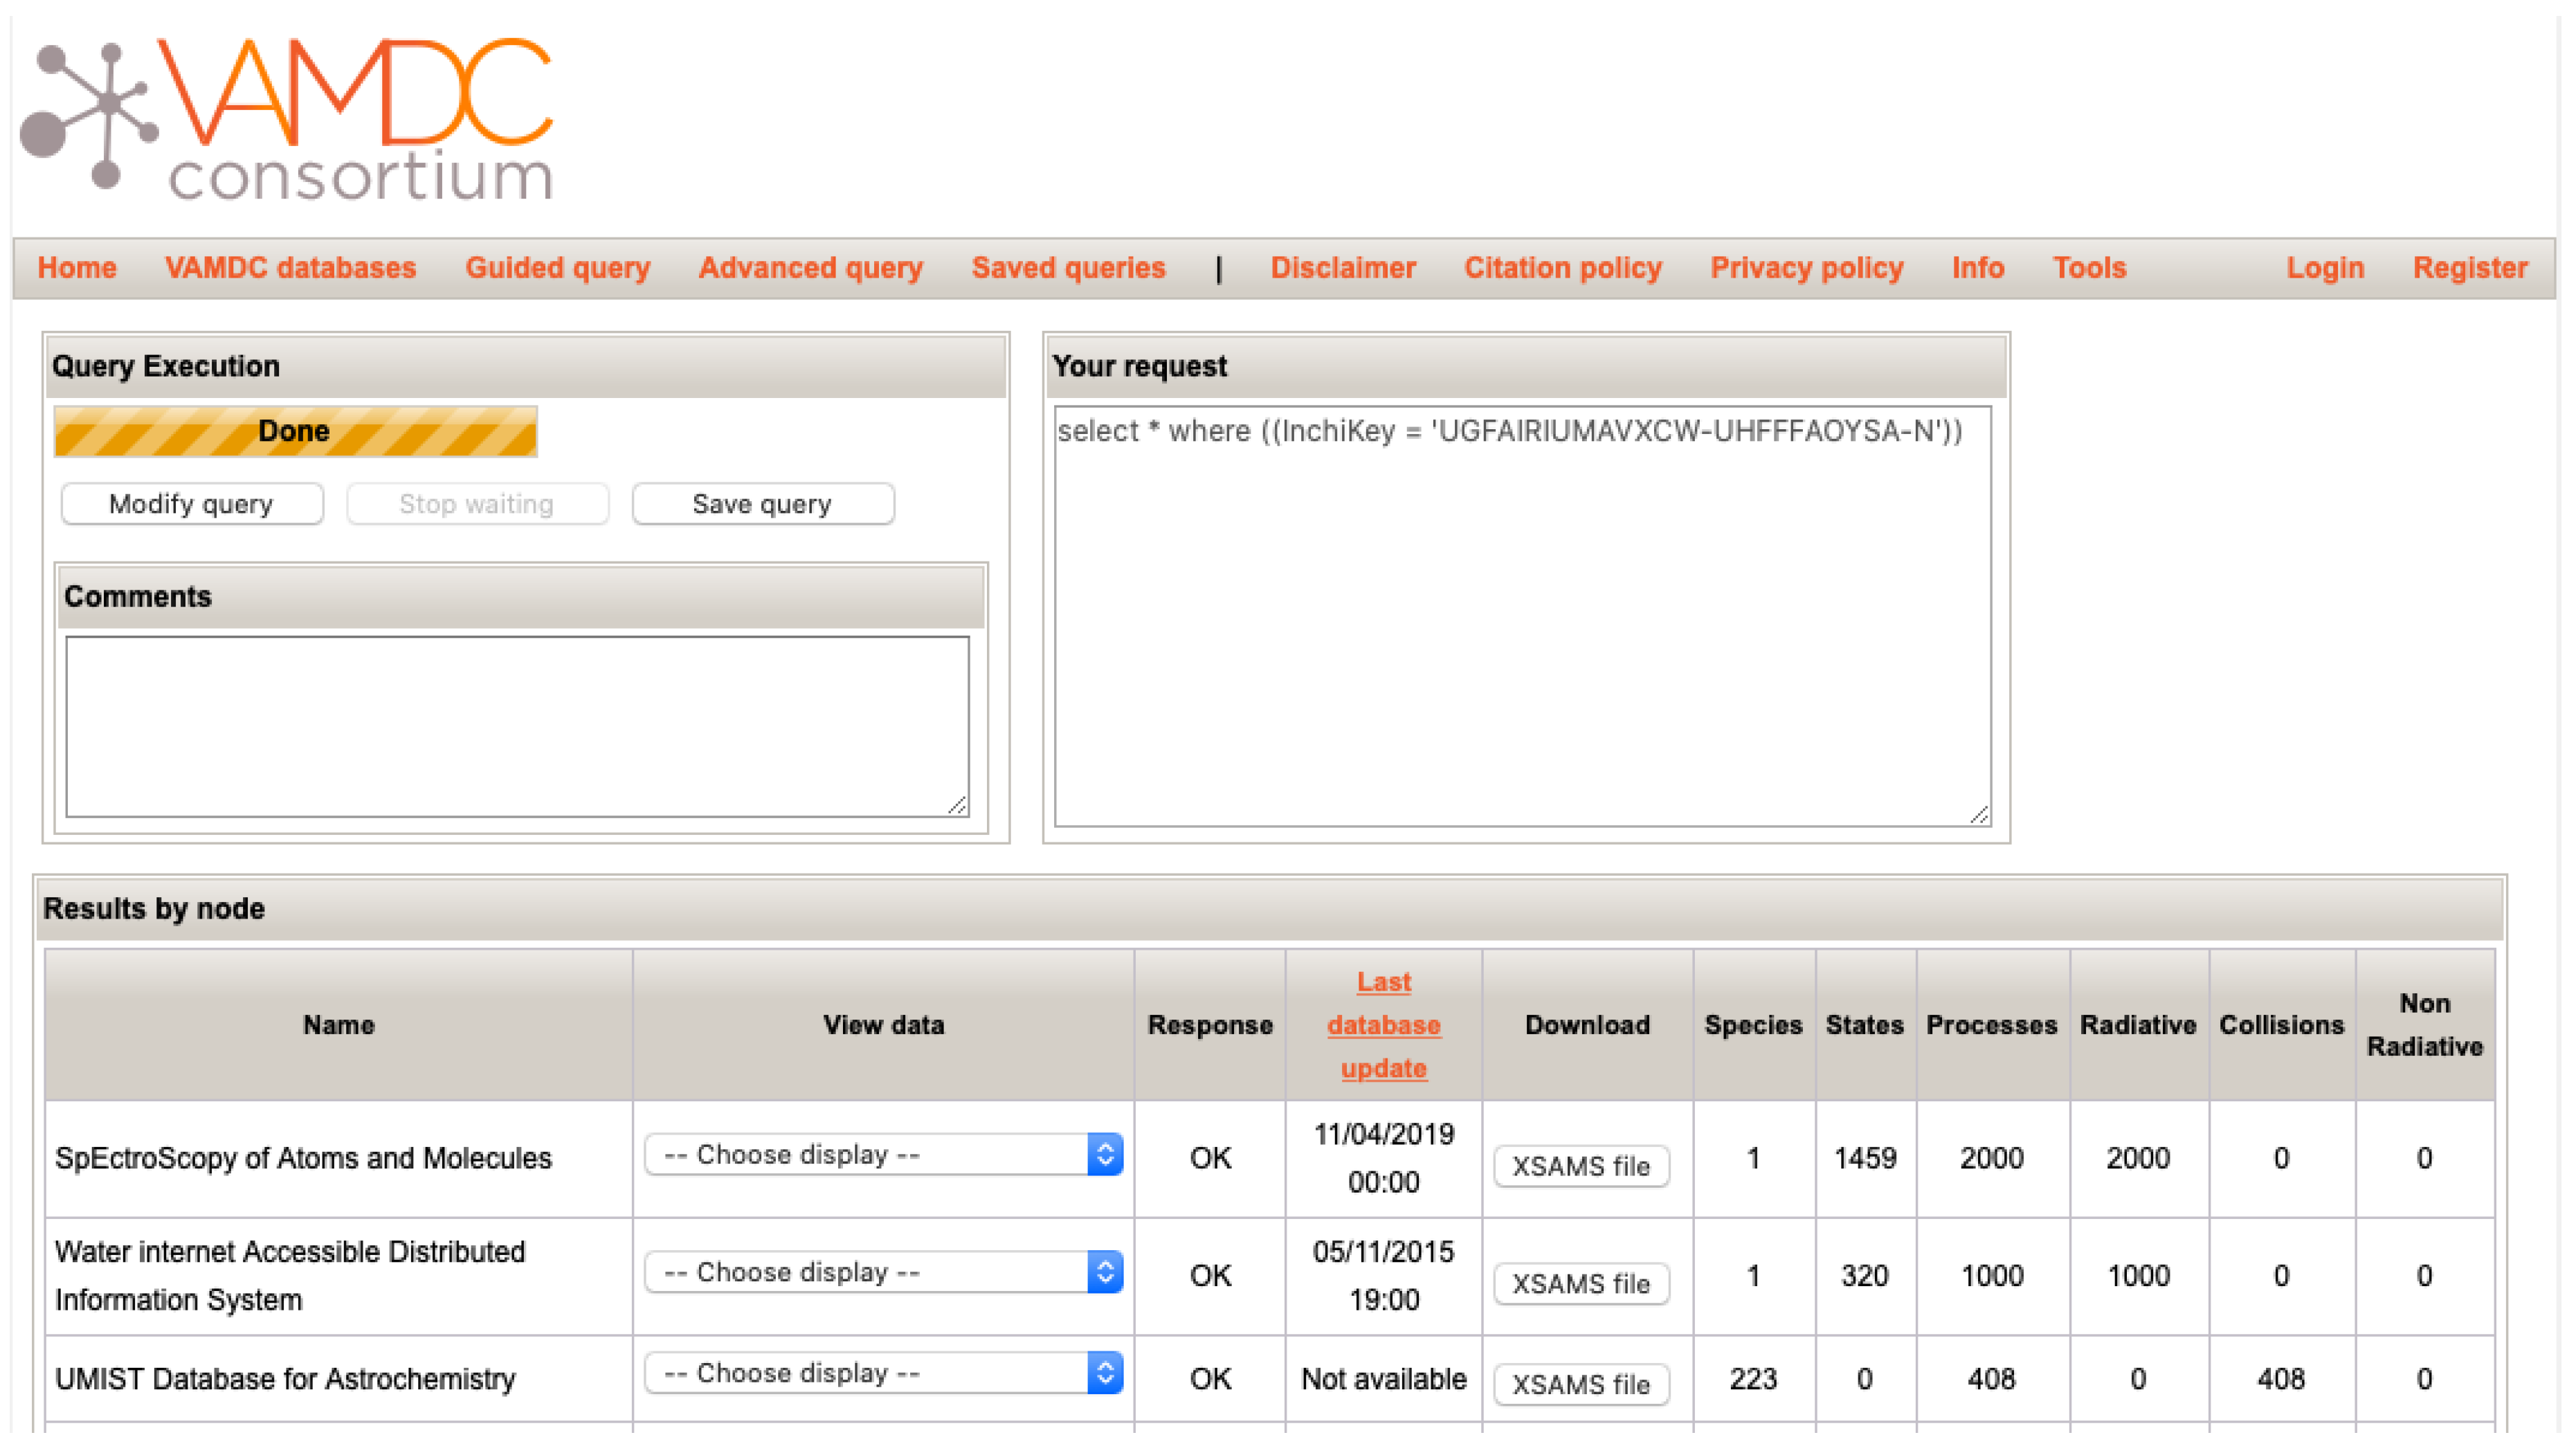
3.1.3. The Portal
3.2. Services Built over Existing VAMDC Infrastructure Since 2016
3.2.1. The Species Database
3.2.2. The Query Store
- The VAMDC infrastructure data are dynamic. A database displayed through the VAMDC infrastructure may evolve over time: the most recent and precise version of given data may replace old ones. We therefore needed mechanisms to allow for the citation of dynamic data.
- The data set provided by the VAMDC infrastructure always contains the references of the papers used for compiling the data sets. However, the citation process may become cumbersome when the extracted data sets come from many sources.
- each query served by the infrastructure is identified by a persistently unique resolvable identifier;
- the query-produced data may be assigned a DOI (DOI: digital object identifier, a formal name for a document or data set in a standard format intelligible by software.;
- data become directly citable by their DOI.
3.3. Pending Technical Issues
3.3.1. Treatment of Big Data
3.3.2. Selection and Comparison of Atomic States
3.3.3. Updating of Node Software
4. Applications and User Case Studies
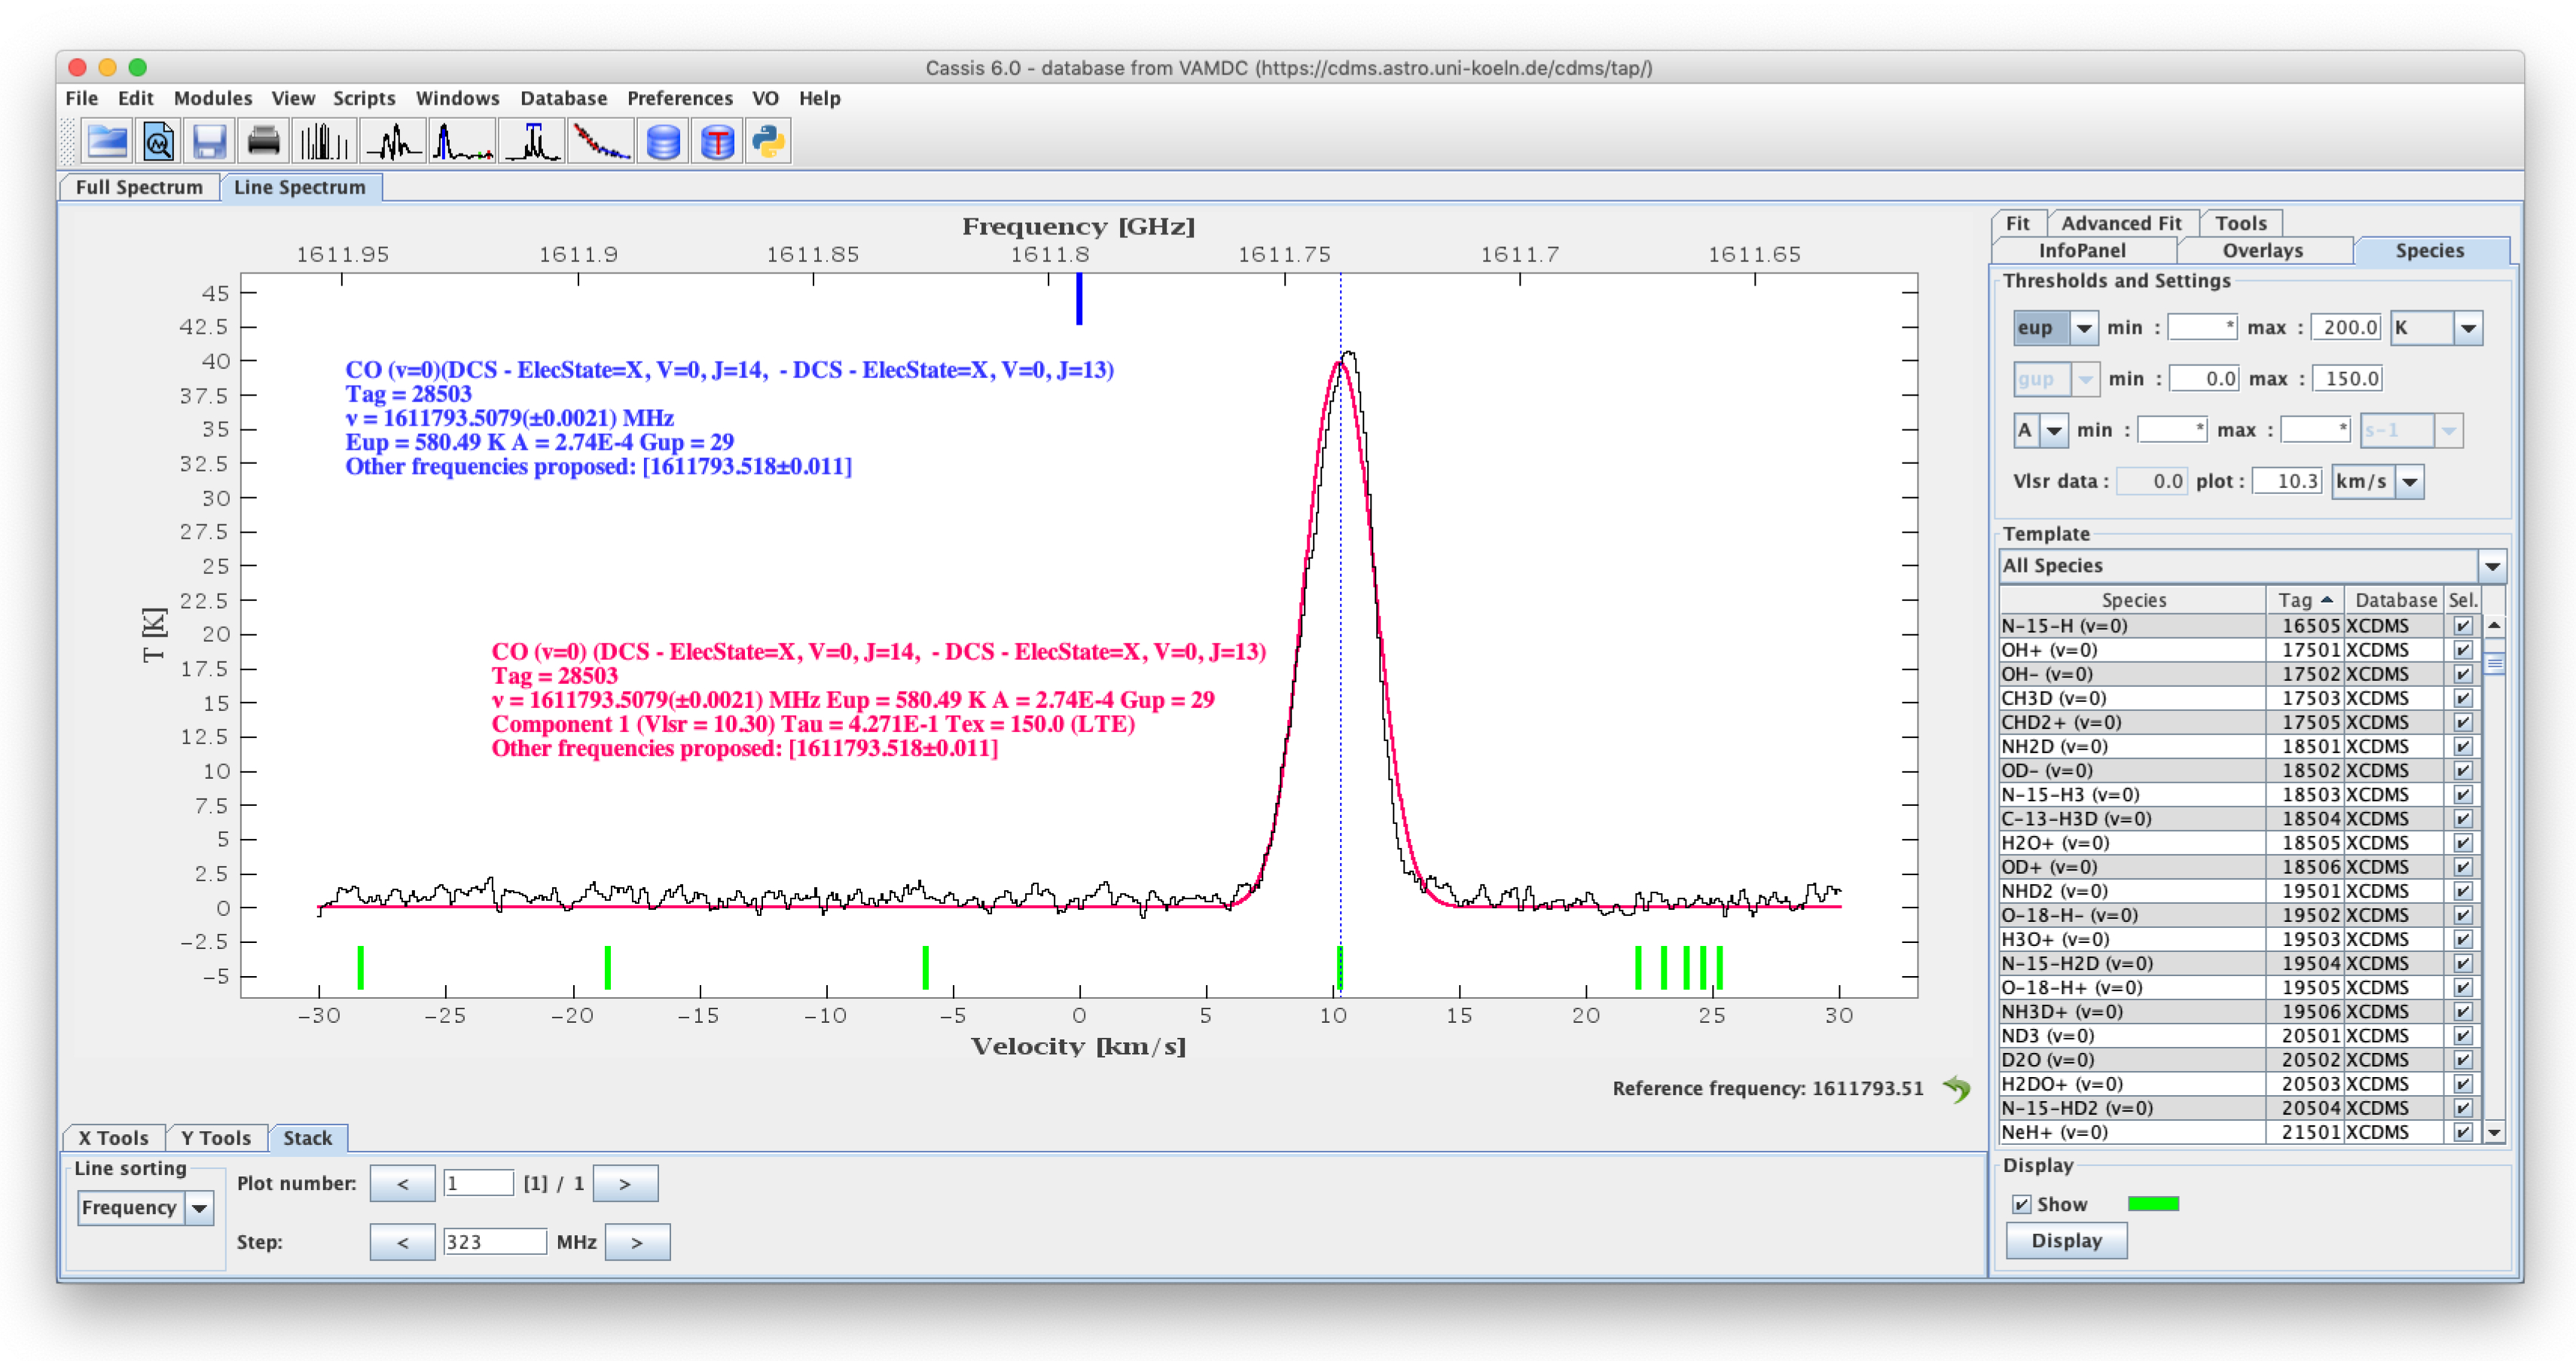
4.1. CASSIS Software
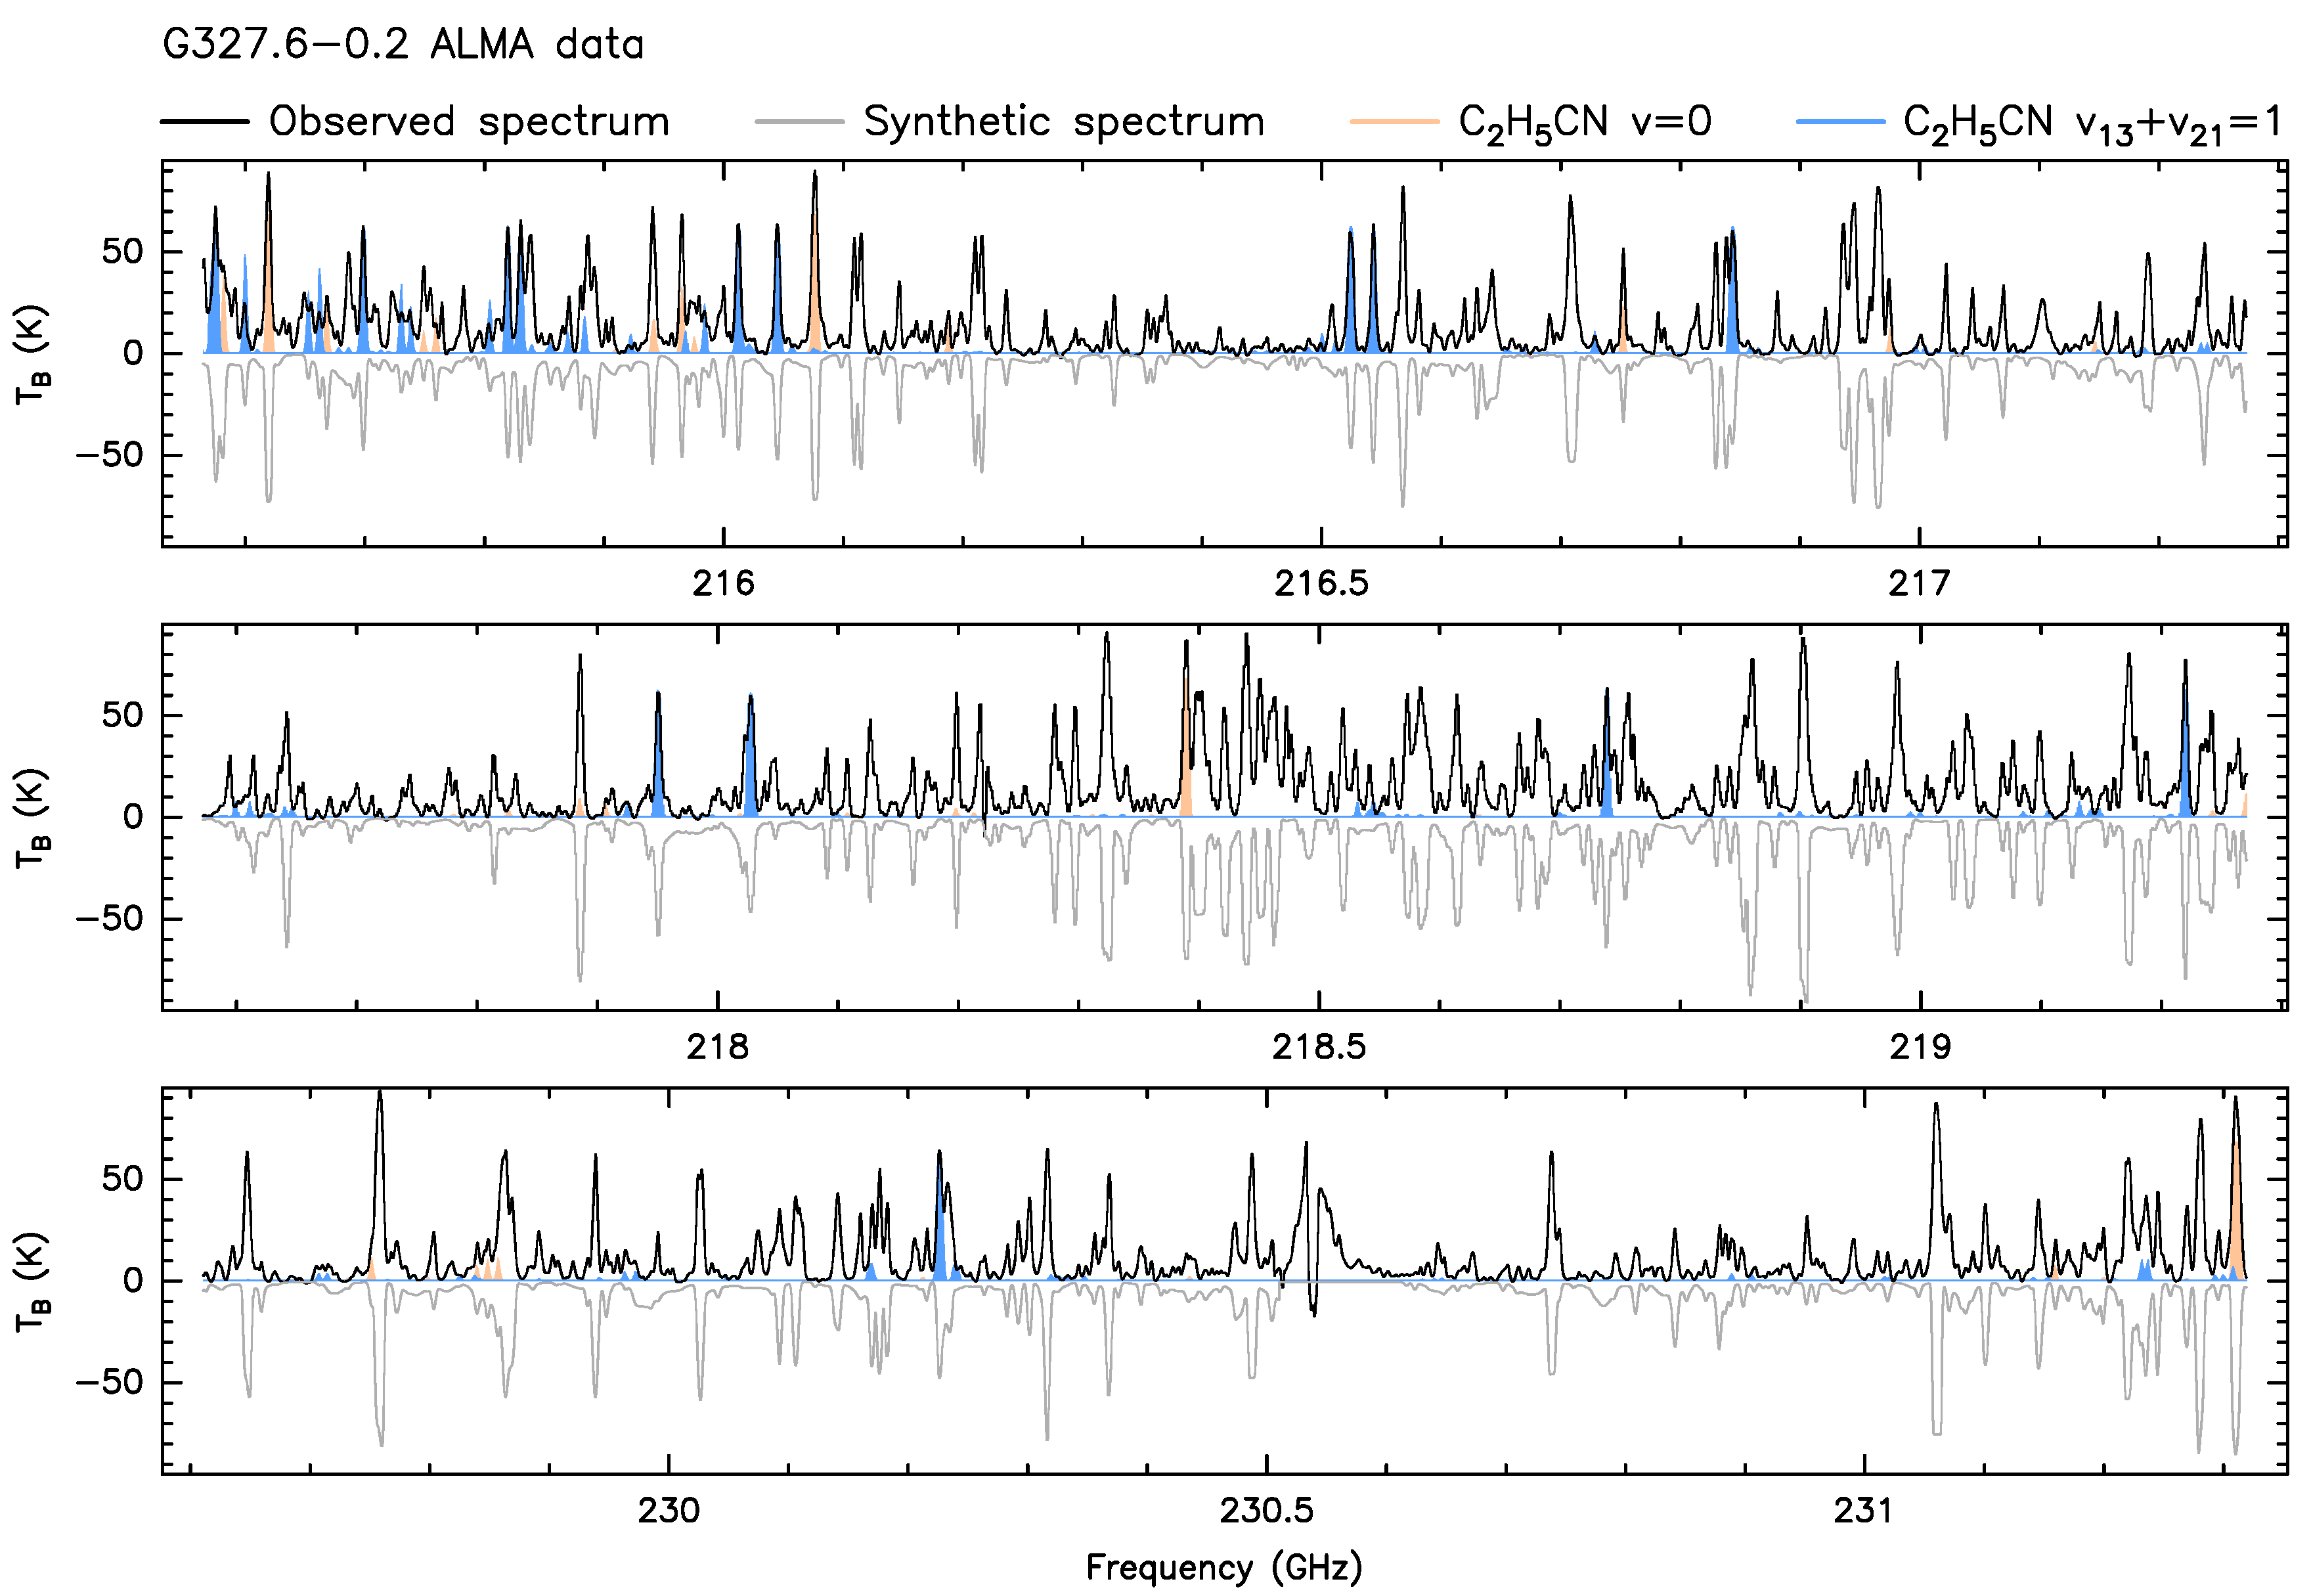
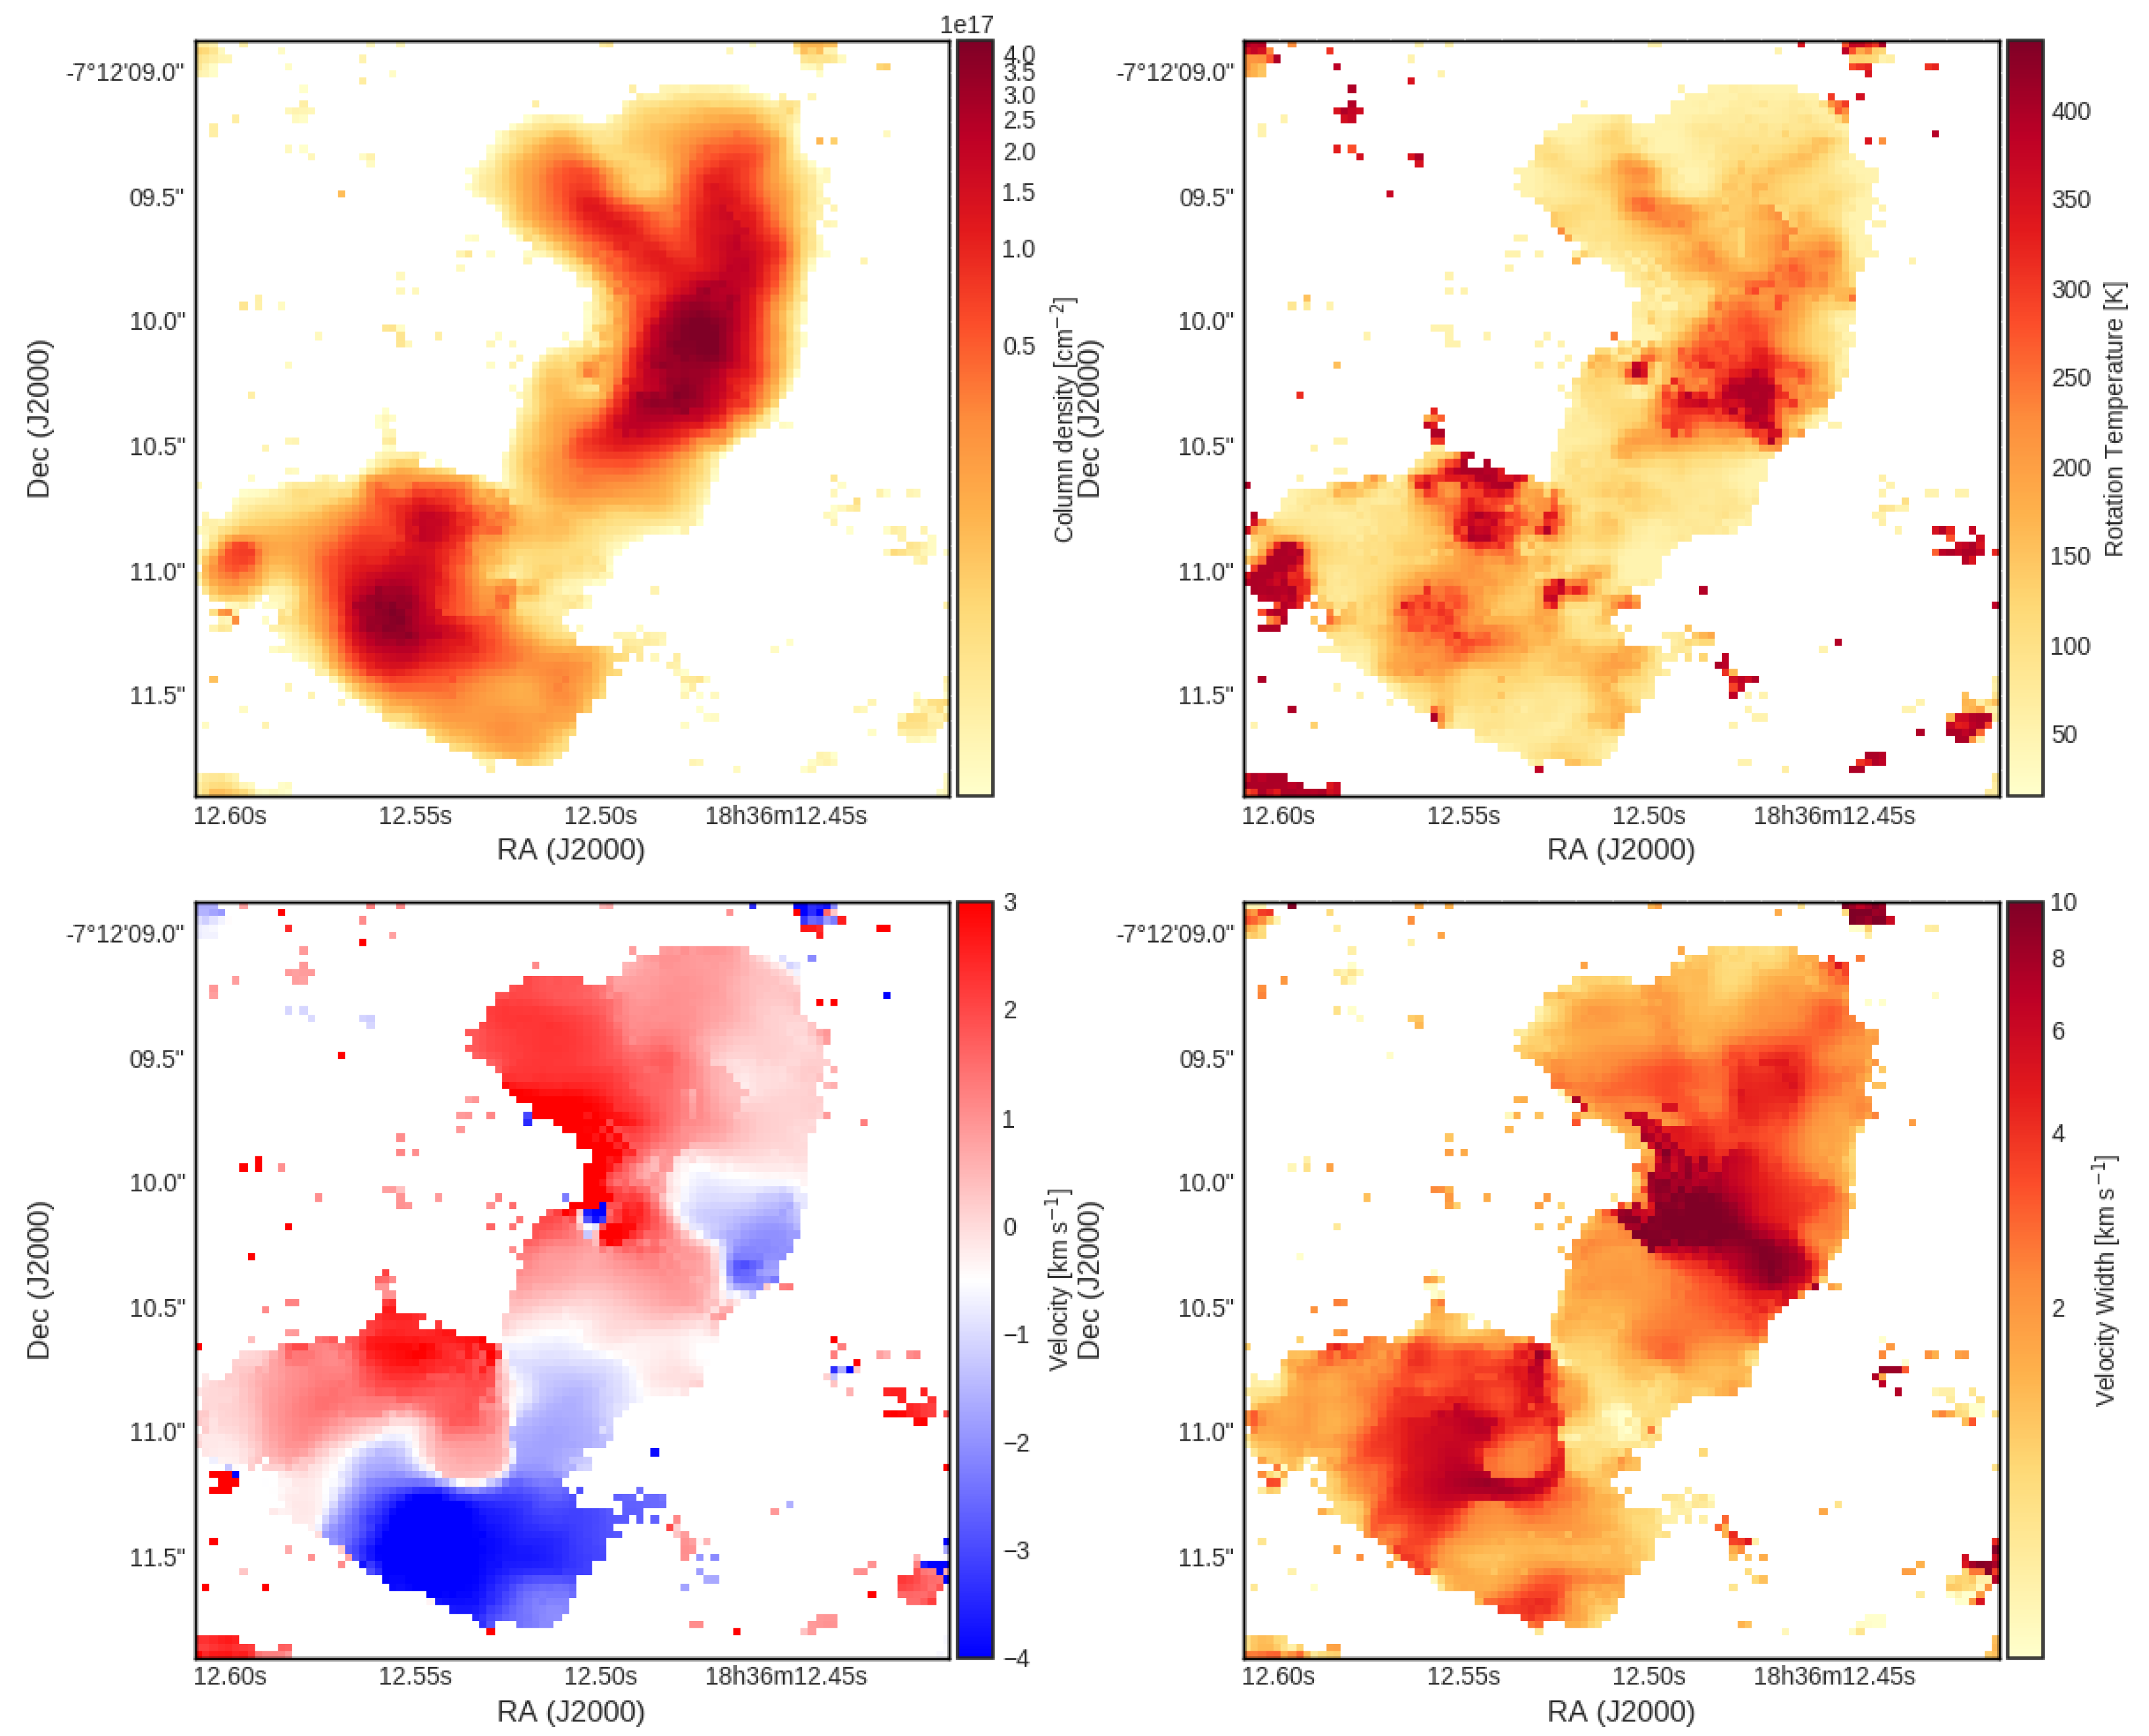
4.2. XCLASS—eXtended CASA Line Analysis Software Suite
4.3. Use of Stark-B Data
4.4. Examples of Concrete User Issues
5. Current Impact of VAMDC on the Community
5.1. Node Data Standardisation and Quality Control
5.2. VAMDC and the FAIR Principles
- Findable: data coming from the infrastructure are assigned persistently unique identifiers (Section 3.2.2), are described by rich metadata schemes and are indexed into public registries (Section 3.1.2).
- Accessible: the extraction query relies on open, documented standards (Section 3.1.1).
- Interoperable: the data extracted from VAMDC are formatted using the XSAMS standard (Section 3.1.1). Moreover VAMDC implements widely adopted international data interoperability standards (Section 3.1.3 and Section 3.2.2).
- Re-usable: the provenance and sources of all the data are documented in each data set extracted from VAMDC. Data tools are provided to convert VAMDC data into widely adopted community data formats (Section 3.1.3).
5.3. Development of New Software, Databases and Portal
5.3.1. GrafOnto Collection of Scientific Plots
5.3.2. New On-Line Databases and Community Portal
5.4. Sustainability Issues
5.5. Impact on Open Science Initiatives and International Data Alliances
- VAMDC has been active in the Research Data Alliance since 2014 (Section 3.2.2), when VAMDC became an early pilot for the data-citation recommendation. Starting from 2016, VAMDC took a leading role in the RDA-Federated Identity Management Interest Group: the RDA recommendations produced by this interest Group [180] incorporate ideas and needs coming from the authentication, authorisation and accounting strategy we developed for the VAMDC consortium [181].
- Since 2016, we have worked with the IVOA on converging VAMDC and the IVOA atomic and molecular standards (http://www.ivoa.net/documents/SLAP/, http://www.ivoa.net/documents/SLAP/).
6. Visions of the Future
6.1. User Interface
6.2. Complex Restrictions in VAMDC Request
6.3. Large Data Sets
6.4. XSAMS Manipulation
6.5. Prototype of a New Bibliographic Service
- VAMDC provides the main bibliographic information complemented by the list of the VAMDC nodes containing data related to that particular publication;
- when supported by the node, VAMDC provides direct link(s) for extracting the XSAMS data related to the publication from the VAMDC node.
6.6. Semantic Search of Qualitative Tabular and Graphic Resources in Quantitative Spectroscopy
6.7. Visualisation and Data Access from Python
6.8. Link Data to Evaluation Ratings
6.9. Open Science for the Future
6.10. Quality Status and Future
6.11. Sustainability
7. Conclusions
Author Contributions
Funding
Acknowledgments
Conflicts of Interest
Abbreviations
| A&M | Atomic and Molecular |
| AGB | Asymptotic Giant Branch |
| ALMA | Atacama Large Millimeter/submillimeter Array |
| AMBDAS | Atomic and Molecular Bibliographic Data System |
| AMDIS | Atomic and Molecular Data Interactive System |
| API | Application Programming Interface |
| ASCII | American Standard Code for Information Interchange |
| ASD | Atomic Spectra Database |
| ASD-1000 | Acetylene Spectroscopic Databank |
| AUTOSTRUCTURE | General program for calculation of atomic and ionic properties |
| BASECOL | Rovibrational Collisional Database |
| BeamDB | Belgrade Electron–Atom/Molecule DataBase |
| BRASS | Belgian Repository of Atomic data and Stellar Spectra |
| CAS | Chemical Abstracts Service |
| CASSIS | Centre d’Analyse Scientifique de Spectres Instrumentaux et Synthétiques |
| CDMS | Cologne Database for Molecular Spectroscopy |
| CDSD-x | Carbon Dioxide Spectroscopic Databank |
| CNRI | Corporation for National Research Initiative |
| CNRS | Centre National de la Recherche Scientifique |
| CRM | Collisional–Radiative Model |
| DAT@OSU | Datacenter for the Observatory of Besançon |
| DESIRE | Database on Sixth Row Elements |
| DOI | Digital Object Identifier |
| DR | Dielectronic Recombination |
| DREAM | Database of Rare Earths At Mons University |
| EII | Electron Impact Ionisation |
| EPN | European Planetary Network |
| EOSC | European Open Science Cloud |
| FAIR | Findable, Accessible, Interoperable, Reusable |
| FITS | Flexible Image Transport System |
| GEDE-RDA | Group of European Data Expert in the Research Data Alliance |
| GILDAS/CLASS | Software |
| HAPI | HITRAN Application Programming Interface |
| HITEMP | High-Temperature Molecular Database |
| HITRAN | High-Resolution Transmission Molecular Absorption Database |
| HTML | Hypertext Markup Language |
| IAMDB | Indian Atomic and Molecular DataBase |
| IDEADB | Innsbruck Dissociative Electron Attachment DataBase |
| IDP | Interplanetary Dust Particle |
| INAF | Istituto Nazionale di Astrofisica |
| InChI | International Chemical Identifier |
| ISM | Interstellar medium |
| IP | Iron Project |
| IPPJ | Institute of Plasma Physics, Nagoya University, Nagoya, Japan |
| IRAP | Institut de Recherche en Astrophysique et Planétologie |
| IVOA | International Virtual Observatory Alliance |
| JIHT RAS | Joint Institute for High Temperatures of the Russian Academy of Sciences |
| JPL | Jet Propulsion Laboratory |
| KAERI | Korea Atomic Energy Research Institute |
| KIDA | KInetic Database for Astrochemistry |
| LAMDA | Rovibrational Collisional Database |
| LASp | Laboratorio di Astrofisica Sperimentale |
| LIBS | Laser-Induced Breakdown Spectroscopy |
| MolLIST | Molecular Line Lists, Intensities and Spectra |
| NDSD-1000 | Nitrogen Dioxide Spectroscopic Databank |
| NIFS | National Institute for Fusion Science |
| NIST | National Institute of Standards and Technology |
| NOEMA | Northern Extended Millimeter Array |
| NOSD-1000 | Nitrous Oxide Spectroscopic Databank |
| OAC | Osservatorio Astrofisico di Catania |
| OP | Opacity Project |
| OVGSO | Observatoire Virtuel du Grand Sud-Ouest |
| PAH | Polycyclic Aromatic Hydrocarbon |
| PEARL | Photonic Electronic Atomic Reaction Laboratory |
| RADEX | Statistical Equilibrium Radiative Transfer Code |
| RADMC-3D | Multi-Purpose Radiative Transfer Tool |
| RDA | Research Data Alliance |
| RATRAN | Radiative Transfer and Excitation of Molecular Lines Code |
| RDA | Research Data Alliance |
| REST | Representational State Transfer |
| RFNC | Russian Federal Nuclear Centre |
| SAMP | Simple Application Messaging Protocol |
| SESAM | Spectroscopy Database Dedicated to Electronic Spectra of Diatomic Molecules |
| SSHADE | Solid Spectroscopy Hosting Architecture of Databases and Expertise |
| S&MPO | Spectroscopy and Molecular Properties of Ozone |
| SSAP | Simple Spectral Access Protocol, an IVOA standard |
| SQL | Structured Query Language |
| SQLite | C-language library that implements a small SQL database engine |
| TAP | Table Access Protocol, an IVOA standard |
| UDfA | UMIST Database for Astrochemistry |
| UMIST | University of Manchester Institute of Science and Technology |
| URL | Uniform Resource Locator |
| VALD | Vienna Atomic Line Database |
| VAMDC | Virtual Atomic and Molecular Data Centre |
| VNIITF | All-Russian Institute of Technical Physics |
| VO | Virtual Observatory |
| VSS2 | VAMDC SQL Sub-set 2 |
| XSAMS | XML Schema for Atoms, Molecules and Solids |
References
- Dubernet, M.L.; Boudon, V.; Culhane, J.L.; Dimitrijevic, M.S.; Fazliev, A.Z.; Joblin, C.; Kupka, F.; Leto, G.; Le Sidaner, P.; Loboda, P.A.; et al. Virtual atomic and molecular data centre. J. Quant. Spectrosc. Radiat. Transf. 2010, 111, 2151–2159. [Google Scholar] [CrossRef] [Green Version]
- Zwolf, C.; Dubernet, M.L.; Ba, Y.A.; Moreau, N. Experience and feedbacks from the sustainability for the virtual atomic and molecular data centre E-infrastructure. In Proceedings of the IST-Africa Conference, Pointe aux Piments, Mauritius, 7–9 May 2014; pp. 1–9. [Google Scholar] [CrossRef]
- Dubernet, M.L.; Antony, B.; Ba, Y.A.; Babikov, Y.; Bartschat, K.; Boudon, V.; Braams, B.; Chung, H.K.; Daniel, F.; Delahaye, F.; et al. The Virtual Atomic and Molecular Data Centre (VAMDC) Consortium. J. Phys. B At. Mol. Opt. Phys. 2016, 49, 074003. [Google Scholar] [CrossRef]
- Emoto, M.; Murakami, I.; Kato, D.; Yoshida, M.; Kato, M.; Imazu, S. Improvement of the NIFS Atom and Molecular Database. Atoms 2019, 7, 91. [Google Scholar] [CrossRef] [Green Version]
- Murakami, I.; Kato, D.; Kato, M.; Sakaue, H.A. Atomic and molecular database and data evaluation activities at the National Institute for Fusion Science. Fusion Sci. Technol. 2013, 63, 400–405. [Google Scholar] [CrossRef]
- Ryabchikova, T.; Piskunov, N.; Kurucz, R.L.; Stempels, H.C.; Heiter, U.; Pakhomov, Y.; Barklem, P.S. A major upgrade of the VALD database. Phys. Scr. 2015, 90, 054005. [Google Scholar] [CrossRef]
- Kramida, A.; Ralchenko, Y.; Reader, J.; NIST ASD Team. NIST Atomic Spectra Database (Version 5.7.1); National Institute of Standards and Technology: Gaithersburg, MD, USA, 2019. Available online: https://physics.nist.gov/asd (accessed on 9 July 2020).
- Skobelev, I.Y.; Loboda, P.A.; Gagarin, S.V.; Ivliev, S.V.; Kozlov, A.I.; Morozov, S.V.; Pikuz, S.A., Jr.; Pikuz, T.A.; Popova, V.V.; Faenov, A.Y. The Spectr-W3 Database on the Spectroscopic Properties of Atoms and Ions. Opt. Spectrosc. 2016, 120, 507–514. [Google Scholar] [CrossRef]
- Del Zanna, G.; Young, P.R. Atomic data for plasma spectroscopy: The CHIANTI database, improvements and challenges. Atoms 2020, 8, 46. [Google Scholar] [CrossRef]
- Hummer, D.G.; Berrington, K.A.; Eissner, W.; Pradhan, A.K.; Saraph, H.E.; Tully, J.A. Atomic data from the IRON project. I. Goals and methods. Astron. Astrophys. 1993, 279, 298–309. [Google Scholar]
- Cunto, W.; Mendoza, C.; Ochsenbein, F.; Zeippen, C.J. TOPbase at the CDS. Astron. Astrophys. 1993, 275, L5–L8. [Google Scholar]
- Sahal-Bréchot, S.; Dimitrijević, M.S.; Moreau, N. Virtual Laboratory Astrophysics and the Stark-B database VAMDC node: A resource for electron and ion impact widths and shifts of isolated lines. J. Phys. Conf. Ser. 2020, 1412, 132052. [Google Scholar]
- Roueff, E.; Sahal-Bréchot, S.; Dimitrijević, M.S.; Moreau, N.; Abgrall, H. The spectroscopic atomic and molecular databases at Paris Observatory. Atoms 2020, 8, 36. [Google Scholar] [CrossRef]
- Endres, C.P.; Schlemmer, S.; Schilke, P.; Stutzki, J.; Mueller, H.S.P. The Cologne Database for Molecular Spectroscopy, CDMS, in the Virtual Atomic and Molecular Data Centre, VAMDC. J. Mol. Spect. 2016, 327, 95–104. [Google Scholar] [CrossRef] [Green Version]
- Pickett, H.M.; Poynter, R.L.; Cohen, E.A.; Delitsky, M.L.; Pearson, J.C.; Müller, H.S.P. Submillimeter, millimeter and microwave spectral line catalog. J. Quant. Spectrosc. Radiat. Transf. 1998, 60, 883–890. [Google Scholar] [CrossRef]
- Gordon, I.E.; Rothman, L.S.; Hill, C.; Kochanov, R.V.; Tan, Y.; Bernath, P.F.; Birk, M.; Boudon, V.; Campargue, A.; Chance, K.V.; et al. The HITRAN 2016 Mol. Spectrosc. Database. J. Quant. Spectrosc. Radiat. Transf. 2017, 203, 3–69. [Google Scholar] [CrossRef]
- Babikov, Y.; Mikhailenko, S.; Barbe, A.; Tyuterev, V. S&MPO—An information system for ozone spectroscopy on the WEB. J. Quant. Spectrosc. Radiat. Transf. 2014, 145, 169–196. [Google Scholar] [CrossRef]
- Richard, C.; Boudon, V.; Rotger, M. Calculated spectroscopic databases for the VAMDC portal: New molecules and improvements. J. Quant. Spectrosc. Radiat. Transf. 2020, 251, 107096. [Google Scholar] [CrossRef]
- Boudon, V.; Manceron, L.; Richard, C. High-resolution spectroscopy and analysis of the ν3, ν4 and 2ν4 bands of SiF4 in natural isotopic abundance. J. Quant. Spectrosc. Radiat. Transf. 2020, 253, 107114–1–107114–20. [Google Scholar] [CrossRef]
- Tashkun, S.A.; Perevalov, V.I.; Gamache, R.R.; Lamouroux, J. CDSD-296, high-resolution carbon dioxide spectroscopic databank: An update. J. Quant. Spectrosc. Radiat. Transf. 2019, 228, 124–131. [Google Scholar] [CrossRef]
- Tashkun, S.A.; Perevalov, V.I. CDSD-4000: High-resolution, high-temperature carbon dioxide spectroscopic databank. J. Quant. Spectrosc. Radiat. Transf. 2011, 112, 1403–1410. [Google Scholar] [CrossRef]
- Tashkun, S.A.; Perevalov, V.I.; Lavrentieva, N.N. NOSD-1000, the high-temperature nitrous oxide spectroscopic databank. J. Quant. Spectrosc. Radiat. Transf. 2016, 177, 43–48. [Google Scholar] [CrossRef]
- Lukashevskaya, A.A.; Lavrentieva, N.N.; Dudaryonok, A.C.; Perevalov, V.I. NDSD-1000: High-resolution, high-temperature Nitrogen Dioxide Spectroscopic Databank. J. Quant. Spectrosc. Radiat. Transf. 2016, 184, 205–217. [Google Scholar] [CrossRef]
- Lyulin, O.M.; Perevalov, V.I. ASD-1000: High-resolution, high-temperature acetylene spectroscopic databank. J. Quant. Spectrosc. Radiat. Transf. 2017, 201, 94–103. [Google Scholar] [CrossRef]
- Akhlyostin, A.; Apanovich, Z.; Fazliev, A.; Kozodoev, A.; Lavrentiev, N.; Privezentsev, A.; Rodimova, O.; Voronina, S.; Császár, A.; Tennyson, J. The current status of the W@DIS information system. Proc. SPIE 2018, 158, 10035. [Google Scholar]
- Wakelam, V.; Herbst, E.; Loison, J.C.; Smith, I.W.M.; Chandrasekaran, V.; Pavone, B.; Adams, N.G.; Bacchus-Montabonel, M.C.; Bergeat, A.; Béroff, K.; et al. A KInetic Database for Astrochemistry (KIDA). Astrophys. J. Suppl. 2012, 199, 21. [Google Scholar] [CrossRef]
- Wakelam, V.; Loison, J.C.; Herbst, E.; Pavone, B.; Bergeat, A.; Béroff, K.; Chabot, M.; Faure, A.; Galli, D.; Geppert, W.D.; et al. The 2014 KIDA Network for Interstellar Chemistry. Astrophys. J. Suppl. 2015, 217, 20. [Google Scholar] [CrossRef]
- McElroy, D.; Walsh, C.; Markwick, A.J.; Cordiner, M.A.; Smith, K.; Millar, T.J. The UMIST database for astrochemistry 2012. Astron. Astrophys. 2013, 550, A36. [Google Scholar] [CrossRef] [Green Version]
- Dubernet, M.L.; Alexander, M.H.; Ba, Y.A.; Balakrishnan, N.; Balança, C.; Ceccarelli, C.; Cernicharo, J.; Daniel, F.; Dayou, F.; Doronin, M.; et al. BASECOL2012: A collisional database repository and web service within the Virtual Atomic and Molecular Data Centre (VAMDC). Astron. Astrophys. 2013, 553, A50. [Google Scholar] [CrossRef] [Green Version]
- Ba, Y.; Dubernet, M.; Moreau, N.; Zwolf, C. BASECOL (basecol.vamdc.org) new technical design. Atoms 2020, 8, 69. [Google Scholar] [CrossRef]
- Vujčič, V.; Jevremović, D.; Mihajlov, A.; Ignjatović, L.M.; Srećković, V.; Dimitrijević, M.; Malović, M. MOL-D: A Collisional Database and Web Service within the Virtual Atomic and Molecular Data Center. J. Astrophys. Astron. 2015, 36. [Google Scholar] [CrossRef] [Green Version]
- Jevremović, D.; Srećković, V.A.; Marinković, B.P.; Vujčić, V. Databases for collisional and radiative processes in small molecules needed for spectroscopy use in astrophysics. Contrib. Astron. Obs. Skaln. Pleso 2020, 50, 44–54. [Google Scholar] [CrossRef] [Green Version]
- Marinković, B.P.; Vujčić, V.; Sushko, G.; Vudragović, D.; Marinković, D.B.; Đorđević, S.; Ivanović, S.; Nešić, M.; Jevremović, D.; Solov’yov, A.V.; et al. Development of collisional data base for elementary processes of electron scattering by atoms and molecules. Nucl. Instrum. Methods Phys. Res. Sect. B Beam Interact. Mater. Atoms. 2015, 354, 90–95. [Google Scholar] [CrossRef]
- Gorfinkiel, J.D.; Ptasinska, S. Electron scattering from molecules and molecular aggregates of biological relevance. J. Phys. B At. Mol. Opt. Phys. 2017, 50, 182001. [Google Scholar] [CrossRef] [Green Version]
- Schmitt, B.; Bollard, P.; Damien, A.; Garenne, A.; Bonal, L.; Gorbacheva, M.; The SSHADE Partner’s Consortium. SSHADE: Solid Spectroscopy Hosting Architecture of Databases and Expertise and Its Databases. In Database Infrastructure; OSUG Data Center: Grenoble, France, 2018; Available online: https://www.sshade.eu (accessed on 16 October 2020). [CrossRef]
- Malloci, G.; Joblin, C.; Mulas, G. On-line database of the spectral properties of polycyclic aromatic hydrocarbons. Chem. Phys. 2007, 332, 353–359. [Google Scholar] [CrossRef]
- Chubb, K.L.; Rocchetto, M.; Yurchenko, S.N.; Min, M.; Waldmann, I.; Barstow, J.K.; Molliere, P.; Al-Refaie, A.Z.F.; Phillips, M.; Tennyson, J. The ExoMolOP Database: Cross-sections and K-tables for Molecules of Interest in High-Temperature Exoplanet Atmospheres. arXiv 2020, arXiv:2009.00687. [Google Scholar] [CrossRef]
- Fivet, V.; Quinet, P.; Palmeri, P.; Biémont, E.; Xu, H. Transition probabilities and lifetimes for atoms and ions from the sixth row of the periodic table and the database DESIRE. J. Electr. Spectrosc. Rel. Phen. 2007, 250, 156–158. [Google Scholar] [CrossRef]
- Quinet, P.; Palmeri, P. Current status and developments of the Atomic Database on Rare-Earths at Mons University (DREAM). Atoms 2020, 8, 18. [Google Scholar] [CrossRef]
- Kwon, D.H.; Chai, K.-B.; and KAERI Atomic Data Center Team. Photonic Electronic Atomic Reaction Laboratory Database. Available online: http://pearl.kaeri.re.kr (accessed on 16 October 2020).
- Takayanagi, K.; Suzuki, H. Cross Sections for Atomic Processes Vol.1. Processes Involving Hydrogen Isotopes, Their Ions, Electrons and Photons; Technical Report IPPJ-DT-48; Institute of Plasma Physics, Nagoya University: Nagoya, Japan, 1975. [Google Scholar]
- Takayanagi, K.; Suzuki, H. Cross Sections for Atomic Processes Vol.2. Processes Involving Hydrogen and Helium Isotopes, Their Ions, Electrons and Photons; Technical Report IPPJ-DT-50; Institute of Plasma Physics, Nagoya University: Nagoya, Japan, 1976. [Google Scholar]
- Kato, T.; Itikawa, Y.; Kanada, Y.; Watanabe, R. Database and Retrieval-Display System of Atomic Data for Fusion. Phys. Scr. 1981, 23, 198–201. [Google Scholar] [CrossRef]
- Murakami, I.; Kato, M.; Emoto, M.; Kato, D.; Sakaue, H.A.; Kawate, T. NIFS Atomic and Molecular Database for collision processes. Atoms 2020, in press. [Google Scholar] [CrossRef]
- Biémont, E.; Palmeri, P.; Quinet, P. A New Database of Astrophysical Interest. Astrophys. Space Sci. 1999, 269, 635–637. [Google Scholar] [CrossRef]
- Pakhomov, Y.V.; Ryabchikova, T.A.; Piskunov, N.E. Hyperfine Splitting in the VALD Database of Spectral-line Parameters. Astron. Rep. 2019, 63, 1010–1021. [Google Scholar] [CrossRef] [Green Version]
- Ryabchikova, T.; Piskunov, N.; Sitnova, T. Evaluation of the Recent Atomic Data for Fe uc(i) Lines Based on Solar and Stellar Spectra. Sol. Phys. 2019, 294, 156. [Google Scholar] [CrossRef]
- Pakhomov, Y.V.; Ryabchikova, T.A. Evolution of spectral line parameters database VALD. INASAN Sci. Rep. 2019, 4, 79–84. [Google Scholar] [CrossRef]
- Ryabchikova, T.; Pakhomov, Y.; Piskunov, N. VALD: The Meeting Point of Data Producers and Data Users. Galaxies 2018, 5, 93. [Google Scholar] [CrossRef]
- Pakhomov, Y.V.; Ryabchikova, T.A. Virtual atomic and molecular data centre VAMDC. In Stars and Satellites, Proceedings of the Memorial Conference Devoted to A.G. Masevich 100th Anniversary; Shustov, B.M., Wiebe, D.S., Eds.; Yanus-K: Moscow, Russia, 2018; pp. 402–408. [Google Scholar] [CrossRef]
- Pakhomov, Y.V. Method of spectral wavelength calibration using the VALD database. In Stars and Satellites, Proceedings of the Memorial Conference Devoted to A.G. Masevich 100th Anniversary; Shustov, B.M., Wiebe, D.S., Eds.; Yanus-K: Moscow, Russia, 2018; pp. 374–379. [Google Scholar] [CrossRef]
- Pakhomov, Y.; Piskunov, N.; Ryabchikova, T. VALD3: Current Developments. In Stars: From Collapse to Collapse; Astronomical Society of the Pacific Conference Series; Balega, Y.Y., Kudryavtsev, D.O., Romanyuk, I.I., Yakunin, I.A., Eds.; Astronomical Society of the Pacific: San Francisco, CA, USA, 2017; Volume 510, p. 518. [Google Scholar]
- Kramida, A. NIST Atomic Spectroscopy Bibliographic Databases; National Institute of Standards and Technology: Gaithersburg, MD, USA, 2019. Available online: https://www.nist.gov/pml/nist-atomic-spectra-bibliographic-databases (accessed on 9 July 2020).
- Kramida, A.; Olsen, K.; Ralchenko, Y. NIST LIBS Database; National Institute of Standards and Technology: Gaithersburg, MD, USA, 2019. Available online: https://physics.nist.gov/PhysRefData/ASD/LIBS/libs-form.html (accessed on 9 July 2020).
- Dere, K.P.; Landi, E.; Mason, H.E.; Monsignori Fossi, B.C.; Young, P.R. CHIANTI—An atomic database for emission lines. Astrophys. J. Suppl. 1997, 125, 149. [Google Scholar] [CrossRef] [Green Version]
- Del Zanna, G.; Dere, K.P.; Young, P.R.; Landi, E.; Mason, H.E. CHIANTI—An atomic database for emission lines. Version 8. Astron. Astrophys. 2015, 582, A56. [Google Scholar] [CrossRef]
- Dere, K.P.; Del Zanna, G.; Young, P.R.; Landi, E.; Sutherland, R.S. CHIANTI—An Atomic Database for Emission Lines. XV. Version 9, Improvements for the X-ray Satellite Lines. Astrophys. J. Suppl. 2019, 241, 22. [Google Scholar] [CrossRef] [Green Version]
- Seaton, M.J. Atomic data for opacity calculations. I. General description. J. Phys. B Atom. Mol. Phys. 1987, 20, 6363–6378. [Google Scholar] [CrossRef]
- Cunto, W.; Mendoza, C. The Opacity Project—The Topbase Atomic Database. Rev. Mex. De Astron. Y AstrofíSica 1992, 23, 107. [Google Scholar]
- Berrington, K.A.; Eissner, W.B.; Norrington, P.H. RMATRX1: Belfast atomic R-matrix codes. Comput. Phys. Commun. 1995, 92, 290–420. [Google Scholar] [CrossRef]
- Ballance, C.P.; Griffin, D.G. Relativistic radiatively damped R-matrix calculation of the electron-impact excitation of W46+. J. Phys. B 2006, 39, 3617. [Google Scholar] [CrossRef]
- Badnell, N.R. A Breit-Pauli distorted wave implementation for AUTOSTRUCTURE. Comput. Phys. Commun. 2011, 182, 1528–1535. [Google Scholar] [CrossRef]
- Badnell, N.R.; Bautista, M.A.; Butler, K.; Delahaye, F.; Mendoza, C.; Palmeri, P.; Zeippen, C.J.; Seaton, M.J. Updated opacities from the Opacity Project. Mon. Not. R. Astron. Soc. 2005, 360, 458–464. [Google Scholar] [CrossRef]
- Delahaye, F.; Zwölf, C.M.; Zeippen, C.J.; Mendoza, C. IPOPv2 online service for the generation of opacity tables. J. Quant. Spectrosc. Radiat. Transf. 2016, 171, 66–72. [Google Scholar] [CrossRef] [Green Version]
- Sahal-Bréchot, S.; Dimitrijević, M.S.; Moreau, N.; Ben Nessib, N. The Stark-B Database as a Resource for ‘‘Stark’’ Widths and Shifts Data: State of Advancement and Program of Development. Adv. Space Res. 2014, 54, 1148–1151. [Google Scholar] [CrossRef] [Green Version]
- Sahal-Bréchot, S.; Dimitrijević, M.S.; Moreau, N.; Ben Nessib, N. The Stark-B Database VAMDC node: A Repository for Spectral Line Broadening and Shifts Due to Collisions with Charged Particles. Phys. Scr. 2015, 50, 054008. [Google Scholar] [CrossRef]
- Dimitrijević, M.S.; Sahal-Bréchot, S.; Moreau, N. The Stark-B Database, A Node of Virtual Atomic and Molecular Data Center (VAMDC). Publ. Astron. Obs. Belgrade 2018, 98, 285–288. [Google Scholar]
- Sahal-Brćhot, S.; Dimitrijević, M.S.; Ben Nessib, N. Widths and Shifts of Isolated Lines of Neutral and Ionized Atoms Perturbed by Collisions With Electrons and Ions: An Outline of the Semiclassical Perturbation (SCP) Method and of the Approximations Used for the Calculations. Atoms 2014, 2, 225–252. [Google Scholar]
- Dimitrijević, M.S.; Konjević, N. Stark broadening of doubly and triply ionized atoms. J. Quant. Spectrosc. Radiat. Transf. 1980, 24, 451–459. [Google Scholar] [CrossRef]
- Sahal-Bréchot, S.; Dimitrijević, M.S.; Ben Nessib, N. Comparisons and comments on electron and ion impact profiles of spectral lines. Balt. Astron. 2011, 20, 523–530. [Google Scholar] [CrossRef] [Green Version]
- Pearson, J.C.; Mueller, H.S.P.; Pickett, H.M.; Cohen, E.A.; Drouin, B.J. Introduction to submillimeter, millimeter and microwave spectral line catalog. J. Quant. Spectrosc. Radiat. Transf. 2010, 111, 1614–1616. [Google Scholar] [CrossRef]
- Endres, C.; Schlemmer, S.; Drouin, B.; Pearson, J.; Müller, H.S.P.; Schilke, P.; Stutzki, J. Improved Infrastucture for Cdms and JPL Molecular Spectroscopy Catalogues. In Proceedings of the 69th International Symposium on Molecular Spectroscopy, Champaign, IL, USA, 16–20 June 2014. [Google Scholar]
- Müller, H.S.P.; Thorwirth, S.; Roth, D.A.; Winnewisser, G. The Cologne Database for Molecular Spectroscopy, CDMS. Astron. Astrophys. 2001, 370, L49–L52. [Google Scholar] [CrossRef]
- Müller, H.S.P.; Schlöder, F.; Stutzki, J.; Winnewisser, G. The Cologne Database for Molecular Spectroscopy, CDMS: A useful tool for astronomers and spectroscopists. J. Mol. Struct. 2005, 742, 215–227. [Google Scholar] [CrossRef]
- McClatchey, R.; Benedict, W.; Clough, S.; Burch, D.; Calfee, R.; Fox, K.; Rothman, L.S.; Garing, J. AFCRL Atmospheric Absorption Line Parameters Compilation; Technical Report 434; Optical Physics Laboratory: Bedford, MA, USA, 1973. [Google Scholar]
- Rothman, L.S. Atmospheric absorption-line parameters: The HITRAN data base (A). J. Opt. Soc. Am. 1983, 73, 1959. [Google Scholar]
- Rothman, L.S.; Gamache, R.R.; Goldman, A.; Brown, L.R.; Toth, R.A.; Pickett, H.M.; Poynter, R.L.; Flaud, J.M.; Camy-Peyret, C.; Barbe, A.; et al. The HITRAN database: 1986 edition. Appl. Opt. 1987, 26, 4058. [Google Scholar] [CrossRef] [PubMed]
- Rothman, L.S.; Gamache, R.; Tipping, R.; Rinsland, C.; Smith, M.; Benner, D.; Devi, V.; Flaud, J.M.; Camy-Peyret, C.; Perrin, A.; et al. The HITRAN molecular database: Editions of 1991 and 1992. J. Quant. Spectrosc. Radiat. Transf. 1992, 48, 469–507. [Google Scholar] [CrossRef]
- Rothman, L.S.; Rinsland, C.; Goldman, A.; Massie, S.T.; Edwards, D.P.; Flaud, J.M.; Perrin, A.; Camy-Peyret, C.; Dana, V.; Mandin, J.; et al. The HITRAN Molecular Spectroscopic Database and HAWKS (HITRAN Atmospheric Workstation): 1996 Edition. J. Quant. Spectrosc. Radiat. Transf. 1998, 60, 665–710. [Google Scholar] [CrossRef]
- Rothman, L.S.; Barbe, A.; Chris Benner, D.; Brown, L.; Camy-Peyret, C.; Carleer, M.; Chance, K.; Clerbaux, C.; Dana, V.; Devi, V.; et al. The HITRAN molecular spectroscopic database: Edition of 2000 including updates through 2001. J. Quant. Spectrosc. Radiat. Transf. 2003, 82, 5–44. [Google Scholar] [CrossRef]
- Rothman, L.S.; Jacquemart, D.; Barbe, A.; Chris Benner, D.; Birk, M.; Brown, L.; Carleer, M.; Chackerian, C.; Chance, K.; Coudert, L.; et al. The HITRAN 2004 molecular spectroscopic database. J. Quant. Spectrosc. Radiat. Transf. 2005, 96, 139–204. [Google Scholar] [CrossRef] [Green Version]
- Rothman, L.S.; Gordon, I.E.; Barbe, A.; Benner, D.C.; Bernath, P.F.; Birk, M.; Boudon, V.; Brown, L.R.; Campargue, A.; Champion, J.P.; et al. The HITRAN 2008 molecular spectroscopic database. J. Quant. Spectrosc. Radiat. Transf. 2009, 110, 533–572. [Google Scholar] [CrossRef] [Green Version]
- Rothman, L.S.; Gordon, I.E.; Babikov, Y.; Barbe, A.; Chris Benner, D.; Bernath, P.F.; Birk, M.; Bizzocchi, L.; Boudon, V.; Brown, L.R.; et al. The HITRAN2012 molecular spectroscopic database. J. Quant. Spectrosc. Radiat. Transf. 2013, 130, 4–50. [Google Scholar] [CrossRef]
- Hill, C.; Gordon, I.E.; Kochanov, R.V.; Barrett, L.; Wilzewski, J.S.; Rothman, L.S. HITRANonline: An online interface and the flexible representation of spectroscopic data in the HITRAN database. J. Quant. Spectrosc. Radiat. Transf. 2016, 177, 4–14. [Google Scholar] [CrossRef] [Green Version]
- Skinner, F.M.; Gordon, I.E.; Hill, C.; Hargreaves, R.J.; Lockhart, K.E.; Rothman, L.S. Referencing Sources of Molecular Spectroscopic Data in the Era of Data Science: Application to the HITRAN and AMBDAS Databases. Atoms 2020, 8, 16. [Google Scholar] [CrossRef]
- Rothman, L.S.; Gordon, I.; Barber, R.; Dothe, H.; Gamache, R.; Goldman, A.; Perevalov, V.; Tashkun, S.; Tennyson, J. HITEMP, the high-temperature molecular spectroscopic database. J. Quant. Spectrosc. Radiat. Transf. 2010, 111, 2139–2150. [Google Scholar] [CrossRef]
- Li, G.; Gordon, I.E.; Rothman, L.S.; Tan, Y.; Hu, S.M.; Kassi, S.; Campargue, A.; Medvedev, E.S. Rovibrational Line Lists for Nine Isotopologues of the CO Molecule in the X 1Σ+ Ground Electronic State. Astrophys. J. Suppl. Ser. 2015, 216, 15. [Google Scholar] [CrossRef] [Green Version]
- Hargreaves, R.J.; Gordon, I.E.; Rothman, L.S.; Tashkun, S.A.; Perevalov, V.I.; Lukashevskaya, A.A.; Yurchenko, S.N.; Tennyson, J.; Müller, H.S. Spectroscopic line parameters of NO, NO2, and N2O for the HITEMP database. J. Quant. Spectrosc. Radiat. Transf. 2019, 232, 35–53. [Google Scholar] [CrossRef] [Green Version]
- Hargreaves, R.J.; Gordon, I.E.; Rey, M.; Nikitin, A.V.; Tyuterev, V.G.; Kochanov, R.V.; Rothman, L.S. An Accurate, Extensive, and Practical Line List of Methane for the HITEMP Database. Astrophys. J. Suppl. 2020, 247, 55. [Google Scholar] [CrossRef] [Green Version]
- Kochanov, R.; Gordon, I.; Rothman, L.S.; Shine, K.; Sharpe, S.; Johnson, T.; Wallington, T.; Harrison, J.; Bernath, P.; Birk, M.; et al. Infrared absorption cross-sections in HITRAN2016 and beyond: Expansion for climate, environment, and atmospheric applications. J. Quant. Spectrosc. Radiat. Transf. 2019, 230, 172–221. [Google Scholar] [CrossRef]
- Karman, T.; Gordon, I.E.; van der Avoird, A.; Baranov, Y.I.; Boulet, C.; Drouin, B.J.; Groenenboom, G.C.; Gustafsson, M.; Hartmann, J.M.; Kurucz, R.L.; et al. Update of the HITRAN collision-induced absorption section. Icarus 2019, 328, 160–175. [Google Scholar] [CrossRef]
- Kochanov, R.; Gordon, I.; Rothman, L.S.; Wcisło, P.; Hill, C.; Wilzewski, J. HITRAN Application Programming Interface (HAPI): A comprehensive approach to working with spectroscopic data. J. Quant. Spectrosc. Radiat. Transf. 2016, 177, 15–30. [Google Scholar] [CrossRef]
- Mikhailenko, S.; Barbe, A. High resolution infrared spectrum of 16O3: The 3600–4300 cm−1 range reinvestigated. J. Quant. Spectrosc. Radiat. Transf. 2020, 244, 106823. [Google Scholar] [CrossRef]
- Starikova, E.; Barbe, A.; Tyuterev, V. The ν3 bands of 17O17O18O and 17O18O17O ozone isotopomers. J. Quant. Spectrosc. Radiat. Transf. 2019, 232, 87–92. [Google Scholar] [CrossRef]
- Barbe, A.; Starikova, E.; De Backer, M.; Tyuterev, V. Analyses of infrared FT spectra of asymmetric ozone isotopologue 16O16O18O in the range 950–3850 cm−1. J. Quant. Spectrosc. Radiat. Transf. 2018, 218, 231–247. [Google Scholar] [CrossRef]
- Tyuterev, V.; Kochanov, R.; Tashkun, S. Accurate ab initio dipole moment surfaces of ozone: First principle intensity predictions for rotationally resolved spectra in a large range of overtone and combination bands. J. Chem. Phys. 2017, 146, 064304. [Google Scholar] [CrossRef] [PubMed]
- Tyuterev, V.; Barbe, A.; Jacquemart, D.; Janssen, C.; Mikhailenko, S.; Starikova, E. Ab initio predictions and laboratory validation for consistent ozone intensities in the MW, 10 and 5 μm ranges. J. Chem. Phys. 2019, 150, 184303. [Google Scholar] [CrossRef] [Green Version]
- Boudon, V.; Champion, J.P.; Gabard, T.; Loëte, M.; Rotger, M.; Wenger, C. Spherical Top Theory and Molecular Spectra. In Handbook of High-Resolution Spectroscopy; Quack, M., Merkt, F., Eds.; Wiley: Chichester, UK, 2011; Volume 3, pp. 1437–1460. [Google Scholar]
- Wenger, C.; Boudon, V.; Rotger, M.; Sanzharov, J.P.; Champion, J.P. XTDS and SPVIEW: Graphical tools for the analysis and simulation of high-resolution molecular spectra. J. Mol. Spectrosc. 2008, 251, 102–113. [Google Scholar] [CrossRef]
- Boudon, V.; Champion, J.P.; Gabard, T.; Loëte, M.; Michelot, F.; Pierre, G.; Rotger, M.; Wenger, C.; Rey, M. Symmetry-adapted tensorial formalism to model rovibrational and rovibronic spectra of molecules pertaining to various point groups. J. Mol. Spectrosc. 2004, 228, 620–634. [Google Scholar] [CrossRef]
- Ba, Y.A.; Wenger, C.; Surleau, R.; Boudon, V.; Rotger, M.; Daumont, L.; Bonhommeau, D.A.; Tyuterev, V.G.; Dubernet, M.L. MeCaSDa and ECaSDa: Methane and ethene calculated spectroscopic databases for the virtual atomic and molecular data centre. J. Quant. Spectrosc. Radiat. Transf. 2013, 130, 62–68. [Google Scholar] [CrossRef]
- Person, W.; Krohn, B. Coriolis intensity perturbations of the ν4 band of SF6. J. Mol. Spectrosc. 1983, 98, 229–257. [Google Scholar] [CrossRef]
- Aldridge, J.; Brock, E.; Filip, H.; Flicker, H.; Fox, K.; Galbraith, H.; Holland, R.; Kim, K.; Krohn, B.; Magnuson, D.; et al. Measurement and analysis of the infrared-active stretching fundamental (ν3) of UF6. J. Chem. Phys. 1985, 83, 34–48. [Google Scholar] [CrossRef]
- De Roure, D.; Jennings, N.R.; Shadbolt, N.R. The Semantic Grid: A Future e-Science Infrastructure. In Grid Computing: Making the Global Infrastructure a Reality; EPSRC/DTI Core e-Science Programme Wiley: Hoboken, NJ, USA, 2001; pp. 437–470. [Google Scholar] [CrossRef]
- Gruber, T. Toward principles for the design of ontologies used for knowledge sharing? Int. J. Hum. Comput. Stud. 1995, 43, 907–928. [Google Scholar] [CrossRef]
- Lavrentiev, N.; Privezentsev, A.; Fazliev, A. Tabular and Graphic Resources in Quantitative Spectroscopy. In Data Analytics and Management in Data Intensive Domains. DAMDID/RCDL 2018. Communications in Computer and Information Science; Springer: Berlin, Germany, 2019; Volume 1003, pp. 55–69. [Google Scholar] [CrossRef]
- Lavrentiev, N.; Privezentsev, A.; Fazliev, A. Applied Ontologies for Managing Graphic Resources in Quantitative Spectroscopy. In Data Analytics and Management in Data Intensive Domains DAMDID/RCDL 2019. Communications in Computer and Information Science; Springer: Berlin, Germany, 2020; Volume 1223, Chapter 6. [Google Scholar] [CrossRef]
- Millar, T.J.; Bennett, A.; Rawlings, J.M.C.; Brown, P.D.; Charnley, S.B. Gas phase reactions and rate coefficients for use in astrochemistry—The UMIST ratefile. Astron. Astrophys. Sup. 1991, 87, 585–619. [Google Scholar]
- Dubernet, M.L.; Nenadovic, L. SPECTCOL: Spectroscopic and Collisional Data Retrieval; Record ascl:1111.005; Astrophysics Source Code Library. 2011. Available online: http://ascl.net/1111.005 (accessed on 9 July 2020).
- Srećković, V.A.; Ignjatović, L.M.; Jevremović, D.; Vujčić, V.; Dimitrijević, M.S. Radiative and Collisional Molecular Data and Virtual Laboratory Astrophysics. Atoms 2017, 5, 31. [Google Scholar] [CrossRef] [Green Version]
- Ignjatovic, L.M.; Sreckovic, V.; Dimitrijevic, M. Photoionization of the alkali molecular ions in geo-cosmical plasmas. Contrib. Astron. Obs. Skaln. Pleso 2020, 50, 187–192. [Google Scholar] [CrossRef] [Green Version]
- Marinković, B.P.; Srećković, V.A.; Vujčić, V.; Ivanović, S.; Uskoković, N.; Nešić, M.; Ignjatović, L.M.; Jevremović, D.; Dimitrijević, M.S.; Mason, N.J. BEAMDB and MOLD—Databases at the Serbian Virtual Observatory for Collisional and Radiative Processes. Atoms 2019, 7, 11. [Google Scholar] [CrossRef] [Green Version]
- Marinković, B.P.; Jevremović, D.; Srećković, V.A.; Vujčić, V.; Ignjatović, L.M.; Dimitrijević, M.S.; Mason, N.J. BEAMDB and MolD—Databases for atomic and molecular collisional and radiative processes: Belgrade nodes of VAMDC. Eur. Phys. J. D 2017, 71. [Google Scholar] [CrossRef]
- Predojević, B.; Šević, D.; Marinković, B.P.; McEachran, R.P.; Blanco, F.; García, G.; Brunger, M.J. Joint theoretical and experimental study on elastic electron scattering from bismuth. Phys. Rev. A 2020, 101, 032704. [Google Scholar] [CrossRef]
- McEachran, R.P.; Marinković, B.P.; García, G.; White, R.D.; Stokes, P.W.; Jones, D.B.; Brunger, M.J. Integral Cross Sections for Electron–Zinc Scattering over a Broad Energy Range (0.01–5000 eV). J. Phys. Chem. Ref. Data 2020, 49, 013102. [Google Scholar] [CrossRef]
- Marinković, B.; Bredehöft, J.; Vujčić, V.; Jevremović, D.; Mason, N. Rosetta Mission: Electron Scattering Cross Sections—Data Needs and Coverage in BEAMDB Database. Atoms 2017, 5, 46. [Google Scholar] [CrossRef] [Green Version]
- Marinković, B.P.; Pejčev, V.; Filipović, D.M.; Šević, D.; Milosavljević, A.R.; Milisavljević, S.; Rabasović, M.S.; Pavlović, D.; Maljković, J.B. Cross section data for electron collisions in plasma physics. J. Phys. Conf. Ser. 2007, 86, 012006. [Google Scholar] [CrossRef]
- Denifl, S.; Garcia, G.; Huber, B.A.; Marinković, B.P.; Mason, N.; Postler, J.; Rabus, H.; Rixon, G.; Solovyov, A.V.; Suraud, E.; et al. Radiation damage of biomolecules (RADAM) database development: Current status. J. Phys. Conf. Ser. 2013, 438, 012016. [Google Scholar] [CrossRef] [Green Version]
- Bartschat, K.; Zatsarinny, O. Benchmark calculations of atomic data for plasma and lighting applications. Plasma Sources Sci. Technol. 2011, 20, 024012. [Google Scholar] [CrossRef]
- Nina, A.; Radovanovic, M.; Srećković, V. Integrations of Satellite and Ground-Based Observations and Multi-Disciplinarity in Research and Prediction of Different Types of Hazards in Solar System, Book of Abstracts; Geographical Institute “Jovan Cvijić” of Serbian Academy of Sciences and Arts: Belgrade, Serbia, 2019. [Google Scholar]
- Baratta, G.A.; Domingo, M.; Ferini, G.; Leto, G.; Palumbo, M.E.; Satorre, M.A.; Strazzulla, G. Ion irradiation of CH4-containing icy mixtures. Nucl. Instrum. Methods Phys. Sect. B 2003, 209, 283. [Google Scholar] [CrossRef]
- Leto, G.; Baratta, G.A. Ly-alpha photon induced amorphization of Ic water ice at 16 Kelvin. Effects and quantitative comparison with ion irradiation. Astron. Astrophys. 2003, 397, 7–13. [Google Scholar] [CrossRef] [Green Version]
- Tennyson, J.; Yurchenko, S.N. ExoMol: Molecular line lists for exoplanet and other atmospheres. Mon. Not. R. Astron. Soc. 2012, 425, 21–33. [Google Scholar] [CrossRef] [Green Version]
- Tennyson, J.; Hill, C.; Yurchenko, S.N. Data structures for ExoMol: Molecular line lists for exoplanet and oth er atmospheres. In 6th International Conference on Atomic and Molecular Data and Their Applications ICAMDATA-2012; AIP: New York, NY, USA, 2013; Volume 1545, pp. 186–195. [Google Scholar] [CrossRef] [Green Version]
- Tennyson, J.; Yurchenko, S.N.; Al-Refaie, A.Z.F.; Barton, E.J.; Chubb, K.L.; Coles, P.A.; Diamantopoulou, S.; Gorman, M.N.; Hill, C.; Lam, A.Z.; et al. The ExoMol database: Molecular line lists for exoplanet and other hot atmospheres. J. Mol. Spectrosc. 2016, 327, 73–94. [Google Scholar] [CrossRef] [Green Version]
- Tennyson, J.; Yurchenko, S.N.; abd, V.H.J.; Clark, K.L.; Chubb, A.F.A.R.; Conway, E.K.; Dewan, A.; Gorman, M.N.; Hill, C.; Lynas-Gray, A.E.; et al. The 2020 release of the ExoMol database: Molecular line lists for exoplanet and other hot atmospheres. J. Quant. Spectrosc. Radiat. Transf. 2020, 255, 107228. [Google Scholar] [CrossRef]
- Lacis, A.A.; Oinas, V. A description of the correlated k distributed method for modeling nongray gaseous absorption, thermal emission, and multiple scattering in vertically inhomogeneous atmospheres. J. Geophys. Res. 1991, 96, 9027. [Google Scholar] [CrossRef] [Green Version]
- Bernath, P.F. MoLLIST: Molecular Line Lists, Intensities and Spectra. J. Quant. Spectrosc. Radiat. Transf. 2020, 240, 106687. [Google Scholar] [CrossRef]
- Hill, C.; Dubernet, M.L.; Endres, C.; Karwasz, G.; Marinković, B.; Marquart, T.; Heinola, K.; Zwolf, C.M.; Moreau, N. Classification of Processes in Plasma Physics; Technical Report INDC(NDS)-0812; IAEA: Vienna, Austria, 2020. [Google Scholar]
- Quinet, P.; Palmeri, P.; Biémont, E.; McCurdy, M.; Rieger, G.; Pinnington, E.; Wickliffe, M.; Lawler, J. Experimental and theoretical lifetimes, branching fractions and oscillator strengths in Lu II. Mon. Not. R. Astron. Soc. 1999, 307, 934. [Google Scholar] [CrossRef] [Green Version]
- Quinet, P.; Palmeri, P.; Biémont, E.; Li, Z.; Zhang, Z.; Svanberg, S. Radiative lifetime measurements and transition probability calculations in lanthanide ions. J. Alloy Compd. 2002, 344, 255–259. [Google Scholar] [CrossRef]
- Rahman, M.A.; Krishnakumar, E. Absolute partial and total electron ionization cross sections of uracil. Int. J. Mass Spetrom 2015, 392, 145–153. [Google Scholar] [CrossRef]
- Rahman, M.A.; Krishnakumar, E. Electron ionization of DNA bases. J. Chem. Phys. 2016, 144, 161102. [Google Scholar] [CrossRef] [PubMed] [Green Version]
- Tadsare, V. Dissociative Electron Attachment to Organic Molecules. Ph.D. Thesis, Tata Institute of Fundamental Research, TIFR, Mumbai, India, 2018. [Google Scholar]
- Sinha, N.; Gupta, D.; Antony, B. Electron impact ionisation cross sections for complex molecules. J. Phys. B At. Mol. Opt. Phys. 2019, 52, 145202. [Google Scholar] [CrossRef]
- Modak, P.; Antony, B. Electron scattering from FO. J. Phys. B At. Mol. Opt. Phys. 2019, 52, 095202. [Google Scholar] [CrossRef]
- Nahar, S.; Antony, B. Review: Positron scattering from atoms and molecules. Atoms 2020, 8, 29. [Google Scholar] [CrossRef]
- Sinha, N.; Sahoo, A.; Antony, B. Positron scattering from pyridine and pyrimidine. J. Phys. Chem. A 2020, 124, 5147–5156. [Google Scholar] [CrossRef]
- Modak, P.; Antony, B. Photoionization of CO using R-matrix theory. Astrophys. J. 2019, 887, 262. [Google Scholar] [CrossRef]
- Modak, P.; Antony, B. Probing photon interaction with H2O and D2O. J. Phys. B At. Mol. Opt. Phys. 2020, 53, 045202. [Google Scholar] [CrossRef]
- Kwon, D.H.; Savin, D.W. Electron-impact ionization of P-like ions forming Si-like ions. Astrophys. J. 2014, 784, 13. [Google Scholar] [CrossRef]
- Kwon, D.H.; Savin, D.W. Effects of configuration interaction for dielectronic recombination of Na-like ions forming Mg-like ions. Astrophys. J. 2011, 734, 2. [Google Scholar] [CrossRef] [Green Version]
- Kim, D.S.; Kwon, D.H. Theoretical photoionization spectra for Mg-isoelectronic Cl5+ and Ar6+ ions. J. Phys. B At. Mol. Opt. Phys. 2015, 48, 105004. [Google Scholar] [CrossRef]
- Zhang, D.H.; Kwon, D.H. Theoretical electron-impact ionization of W17+ forming W18+. J. Phys. B At. Mol. Opt. Phys. 2014, 47, 075202. [Google Scholar] [CrossRef]
- Kwon, D.H. Dielectronic recombination of lowly charged tungsten ions Wq+ (q=5−10). J. Quant. Spectrosc. Radiat. Transf. 2018, 208, 64–70. [Google Scholar] [CrossRef]
- Chai, K.B.; Kwon, D.H. Optical emission spectroscopy and collisional-radiative modeling for low temperature Ar plasmas. J. Quant. Spectrosc. Radiat. Transf. 2019, 227, 136–144. [Google Scholar] [CrossRef]
- Ralser, S.; Postler, J.; Harnisch, M.; Ellis, A.M.; Scheier, P. Extracting cluster distributions from mass spectra: IsotopeFit. Int. J. Mass Spectrom. 2015, 379, 194–199. [Google Scholar] [CrossRef] [Green Version]
- Scheier, P.; Märk, T. Doubly charged argon clusters and their critical size. J. Chem. Phys. 1987, 86, 3056–3057. [Google Scholar] [CrossRef]
- Schöbel, H.; Bartl, P.; Leidlmair, C.; Denifl, S.; Echt, O.; Märk, T.; Scheier, P. High-resolution mass spectrometric study of pure helium droplets, and droplets doped with krypton. Eur. Phys. J. D 2011, 63, 209–214. [Google Scholar] [CrossRef]
- Regandell, S.; Marquart, T.; Piskunov, N. Inside a VAMDC data node—Putting standards into practical software. Phys. Scr. 2018, 93, 035001. [Google Scholar] [CrossRef] [Green Version]
- Zwölf, C.M.; Moreau, N.; Dubernet, M.L. New model for datasets citation and extraction reproducibility in VAMDC. J. Mol. Spectrosc. 2016, 327, 122–137. [Google Scholar] [CrossRef] [Green Version]
- Walton, N.; Astrogrid Consortium. Meeting the User Science Challenge for a Virtual Universe. In Toward an International Virtual Observatory; Quinn, P.J., Górski, K.M., Eds.; Springer: Berlin/Heidelberg, Germany, 2004; p. 187. [Google Scholar] [CrossRef]
- Moreau, N.; Zwolf, C.M.; Ba, Y.A.; Richard, C.; Boudon, V.; Dubernet, M.L. The VAMDC Portal as a Major Enabler of Atomic and Molecular Data Citation. Galaxies 2018, 6, 105. [Google Scholar] [CrossRef] [Green Version]
- Taylor, M.B.; Boch, T.; Taylor, J. SAMP, the Simple Application Messaging Protocol: Letting applications talk to each other. Astron. Comput. 2015, 11, 81–90. [Google Scholar] [CrossRef] [Green Version]
- Heller, S.; McNaught, A.; Pletnev, I.; Stein, S.; Tchekhovskoi, D. InChI, the IUPAC International Chemical Identifier. J. Cheminform. 2015, 7, 23. [Google Scholar] [CrossRef] [Green Version]
- Zwölf, C.; Moreau, N.; Yaya-Awa, B.; Dubernet, M.L. Implementing in the VAMDC the New Paradigms for Data Citation from the Research Data Alliance. Data Sci. J. 2018, 1, 4. [Google Scholar] [CrossRef] [Green Version]
- Rey, M.; Nikitin, A.V.; Babikov, Y.L.; Tyuterev, V.G. TheoReTS—An information system for theoretical spectra based on variational predictions from molecular potential energy and dipole moment surfaces. J. Mol. Spectrosc. 2016, 327, 138–158. [Google Scholar] [CrossRef]
- Huang, X.; Schwenke, D.W.; Lee, T.J. Quantitative validation of Ames IR intensity and new line lists for 32/33/34S16O2, 32S18O2 and 16O32S18O. J. Quant. Spectrosc. Radiat. Transf. 2019, 225, 327–336. [Google Scholar] [CrossRef]
- Owens, A.; Yachmenev, A.; Tennyson, J.; Thiel, W.; Yurchenko, S.N. ExoMol Molecular line lists XXIX: The rotation-vibration spectrum of methyl chloride up to 1200 K. Mon. Not. R. Astron. Soc. 2018, 479, 3002–3010. [Google Scholar] [CrossRef] [Green Version]
- Rey, M.; Chizhmakova, I.; Nikitin, A.; Tyuterev, V. Understanding global infrared opacity and hot bands of greenhouse molecules with low vibrational modes from first-principles calculations: The case of CF4. Phys. Chem. Chem. Phys. 2018, 20, 21008–21033. [Google Scholar] [CrossRef]
- Egorov, O.; Nikitin, A.; Rey, M.; Rodina, A.; Tashkun, S.; Tyuterev, V. Global modeling of NF3 line positions and intensities from far to mid-infrared up to 2200 cm−1. J. Quant. Spectrosc. Radiat. Transf. 2019, 239, 106668. [Google Scholar] [CrossRef]
- Rey, M.; Nikitin, A.V.; Tyuterev, V.G. Accurate Theoretical Methane Line Lists in the Infrared up to 3000 K and Quasi-continuum Absorption/Emission Modeling for Astrophysical Applications. Astrophys. J. 2017, 847, 105. [Google Scholar] [CrossRef]
- Yurchenko, S.N.; Amundsen, D.S.; Tennyson, J.; Waldmann, I.P. A hybrid line list for CH4 and hot methane continuum. Astron. Astrophys. 2017, 605, A95. [Google Scholar] [CrossRef] [Green Version]
- Wong, A.; Bernath, P.; Rey, M.; Nikitin, A.; Tyuterev, V. Atlas of Experimental and Theoretical High-temperature Methane Cross Sections from T = 295 to 1000 K in the Near-infrared. Astrophys. J. Suppl. 2019, 240, 4. [Google Scholar] [CrossRef] [Green Version]
- Erard, S.; Cecconi, B.; Le Sidaner, P.; Berthier, J.; Henry, F.; Molinaro, M.; Giardino, M.; Bourrel, N.; André, N.; Gangloff, M.; et al. The EPN-TAP protocol for the Planetary Science Virtual Observatory. Astron. Comput. 2014, 7–8, 52–61. [Google Scholar] [CrossRef] [Green Version]
- van der Tak, F.F.S.; Lique, F.; Faure, A.; Black, J.H.; van Dishoeck, E.F. The Leiden Atomic and Molecular Database (LAMDA): Current Status, Recent Updates, and Future Plans. Atoms 2020, 8, 15. [Google Scholar] [CrossRef]
- Möller, T.; Endres, C.; Schilke, P. eXtended CASA Line Analysis Software Suite (XCLASS). Astron. Astrophys. 2017, 598, A7. [Google Scholar] [CrossRef] [Green Version]
- Möller, T.; Bernst, I.; Panoglou, D.; Muders, D.; Ossenkopf, V.; Röllig, M.; Schilke, P. Modeling and Analysis Generic Interface for eXternal numerical codes (MAGIX). Astron. Astrophys. 2013, 549, A21. [Google Scholar] [CrossRef]
- Endres, C.P.; Martin-Drumel, M.A.; Zingsheim, O.; Bonah, L.; Pirali, O.; Zhang, T.; Sánchez-Monge, Á.; Möller, T.; Wehres, N.; Schilke, P.; et al. SOLEIL and ALMA views on prototypical organic nitriles: C2H5CN. J. Mol. Spectrosc. 2020. submitted. [Google Scholar]
- Moscadelli, L.; Rivilla, V.M.; Cesaroni, R.; Beltrán, M.T.; Sánchez-Monge, Á.; Schilke, P.; Mottram, J.C.; Ahmadi, A.; Allen, V.; Beuther, H.; et al. The feedback of an HC HII region on its parental molecular core. The case of core A1 in the star-forming region G24.78+0.08. Astron. Astrophys. 2018, 616, A66. [Google Scholar] [CrossRef] [Green Version]
- Dimitrijević, M.S.; Sahal-Bréchot, S. On the Application of Stark Broadening Data Determined with a Semiclassical Perturbation Approach. Atoms 2014, 2, 357–377. [Google Scholar] [CrossRef] [Green Version]
- Dreizler, S. HST Spectroscopy of PG 1159 Stars: The Boundary of the GW VIR Instability Strip. Balt. Astron. 1998, 7, 71–82. [Google Scholar] [CrossRef]
- Dojčinović, I.P.; Trklja, N.; Tapalaga, I.; Purić, J. Investigation of Stark line broadening within spectral series of potassium and copper isoelectronic sequences. Mon. Not. R. Astron. Soc. 2019, 489, 2997–3002. [Google Scholar] [CrossRef]
- Lavrentyev, N.; Makogon, M.; Fazliev, A. Comparison of the HITRAN and GEISA Spectral Databases Taking into Account the Restriction on Publication of Spectral Data. Atmos. Ocean. Opt. 2011, 24, 436–451. [Google Scholar] [CrossRef]
- Wilkinson, M.D.; Dumontier, M.; Aalbersberg, I.J.; Appleton, G.; Axton, M.; Baak, A.; Blomberg, N.; Boiten, J.W.; da Silva Santos, L.B.; Bourne, P.E.; et al. The FAIR Guiding Principles for scientific data management and stewardship. Sci. Data 2016, 3, 160018. [Google Scholar] [CrossRef] [PubMed] [Green Version]
- Lavrentiev, N.; Rodimova, O.; Fazliev, A. Systematization of published scientific graphics characterizing the water vapor continuum absorption: I. Publications of 1898–1980. In Proceedings of the 24-th International Symposium on Atmospheric and Oceanic Optics: Atmopheric Physics, Tomsk, Russia, 2–5 July 2018. [Google Scholar] [CrossRef]
- Lavrentiev, N.; Rodimova, O.; Fazliev, A. Systematization of graphically plotted published spectral functions of weakly bound water complexes. In Proceedings of the 22-nd International Symposium on Atmosperic and Oceanic Optics: Atmopheric Physics, Tomsk, Russia, 30 June–3 July 2016. [Google Scholar] [CrossRef]
- Laverick, M.; Lobel, A.; Merle, T.; Royer, P.; Martayan, C.; David, M.; Hensberge, H.; Thienpont, E. The Belgian repository of fundamental atomic data and stellar spectra (BRASS). I. Cross-matching atomic databases of astrophysical interest. Astron. Astrophys. 2018, 612, A60. [Google Scholar] [CrossRef] [Green Version]
- Available online: http://dataosu.obs-besancon.fr (accessed on 16 October 2020).
- Atherton, C.J.; Barton, T.; Basney, J.; Broeder, D.; Costa, A.; van Daalen, M.; Dyke, S.; Elbers, W.; Enell, C.F.; Fasanelli, E.M.V.; et al. Federated Identity Management for Research Collaborations. In Standard, Research Data Alliance; Zenodo: Geneva, Swissland, 2019. [Google Scholar] [CrossRef]
- Zwölf, C.M.; Rixon, G. Authentication, Authorisation and Accounting Strategy; Technical Delivrable; VAMDC Consortium; Zenodo: Geneva, Swissland, 2015. [Google Scholar] [CrossRef]
- Wittenburg, P.; Hellström, M.; Zwölf, C.M.; Abroshan, H.; Asmi, A.; Di Bernardo, G.; Couvreur, D.; Gaizer, T.; Holub, P.; Hooft, R.; et al. Persistent identifiers: Consolidated assertions. In Standard, Research Data Alliance; Zenodo: Geneva, Swissland, 2017. [Google Scholar] [CrossRef]
- Collins, S.; Genova, F.; Harrower, N.; Hodson, S.; Jones, S.; Laaksonen, L.; Mietchen, D.; Petrauskaité, R.; Wittenburg, P. Turning FAIR into Reality—Final Report and Action Plan from the European Commission Expert Group on FAIR Data; Report; Publications Office of the European Union: Brussel, Belgium, 2018. [Google Scholar] [CrossRef]
- Berners-Lee, T.; Hendler, J.; Lassila, O. Toward principles for the design of ontologies used for knowledge sharing. Semant. Web 2001, 43, 907–928. [Google Scholar]
- Group, W.O.W. OWL 2 Web Ontology Language Document Overview, W3C Recommendation 27 October 2009, 1st ed. The World Wide Web Consortium (W3C): 2009. Available online: https://www.w3.org/ (accessed on 16 October 2020).
- Privezentsev, A.; Tsarkov, D.; Fazliev, A.; Tennyson, J. Computed Knowledge Base for Description of Information Resources of Water Spectroscopy. In Proceedings of the 7th International Workshop on OWL: Experiences and Directions (OWLED 2010), San Francisco, CA, USA, 21–22 June 2010. [Google Scholar]
- Fazliev, A.; Privezentsev, A.; Tsarkov, D.; Tennyson, J. Ontology-Based Content Trust Support of Expert Information Resources in Quantitative Spectroscopy. In Knowledge Engineering and the Semantic Web, Communications in Computer and Information Science; Springer: Berlin, Germany, 2013; Volume 394, pp. 15–28. [Google Scholar] [CrossRef]
- Voronina, V.; Privezentsev, A.; Tsarkov, D.; Fazliev, A. An Ontological Description of States and Transitions in Quantitative Spectroscopy. In Proceedings of the XX-th International Symposium on Atmospheric and Ocean Optics: Atmospheric Physics, Novosibirsk, Russia, 23–27 June 2014. [Google Scholar] [CrossRef]
- Akhlestin, A.; Lavrentiev, N.; Rodimova, O.; Fazliev, A. The continuum absorption: Trust assessment of published graphical information. In Proceedings of the 25-th International Symposium on Atmospheric and Ocean Optics: Atmospheric Physics, Novosibirsk, Russia, 30 June–5 July 2019. [Google Scholar] [CrossRef]


| Database | Data Classification | Applications |
|---|---|---|
| NIFS Database | atomic, molecular processes [4,5] | STEL, SOL, plasma, fusion |
| VALD | atomic, molecular linelists [6] | STEL, SOL |
| VALD-Moscow | atomic, molecular linelists [6] | STEL, SOL (subset) Section 2.1.2 |
| NIST ASD | atomic lineslists [7] | STEL, ISM |
| Spectr-W | atomic lineslists and collisions [8] | STEL, SOL, plasma, fusion |
| CHIANTI | atomic lineslists and collisions [9] | SOL |
| TIPbase | atomic linelists and collisions [10] | STEL, SOL, plasma |
| TOPbase | atomic linelists and collisions [11] | STEL, SOL, plasma |
| Stark-B | atomic line shifts, broadening [12,13] | STEL, plasma |
| CDMS | molecular linelists [14] | ISM, E, C |
| JPL | molecular linelists [15] | ISM, E, C |
| HITRAN | molecular linelists, broadening coefficients [16] | E, PL, EXO |
| S&MPO | O linelists [17] | E, EXO |
| MeCaSDa | CH linelists [18] | E, EXO, PL, DBW |
| ECaSDa | Ethene calculated linelists [18] | E, PL |
| TFMeCaSDa | Tetrafluoro-Methane calculated linelists [18] | E |
| SHeCaSDa | Sulfur Hexafluoride calculated linelists [18] | E |
| GeCaSDa | GeH linelists [18] | PL |
| RuCaSDa | RuO linelists [18] | Nuclear industry |
| TFSiCaSDa | SiF linelists [18,19] | E |
| UHeCaSDa | UF line lists () | Nuclear industry |
| CDSD-296 | CO linelists [3,20] | E, PL, EXO, BDW |
| CDSD-1000 | CO linelists [3] | E, PL, EXO, BDW |
| CDSD-4000 | CO linelists [21] | E, PL, EXO, BDW |
| NOSD-1000 | NO linelists [22] | E, PL, EXO |
| NDSD-1000 | NO linelists [23] | E, PL, EXO |
| ASD-1000 | CH linelists [24] | E, PL, EXO |
| SESAM | VUV small molecules linelists [13] | ISM, STELL |
| W@DIS | atmospheric molecule data sources [25] | E, PL |
| KIDA | chemical kinetics [26,27] | ISM, PL |
| UDfA | chemical kinetics [28] | ISM, PL |
| BASECOL | molecular collisions [29,30] | ISM, C |
| MOLD | photo-dissociation cross sections [31,32] | STEL |
| BeamDB | molecule/atom-electron cross-sections [33] | Plasma, radiation damage |
| IDEADB | dissociative electron collisions [34] | PL, EXO, ISM, radiation damage |
| GhoSSt | solid spectroscopy data [35] | ISM, PL |
| LASp | solid spectroscopy data [3] | ISM, PL |
| PAH | PAH theoretical Data [3,36] | ISM, PL, E |
| ExoMolOP e | molecular opacities [37] | EXO, DBW, STEL, E |
| SSHADE e | solid spectroscopy data [35] | E, C, EXO, ISM, PL |
| AMBDAS | collisions in plasmas (bibliography) () | Nuclear Fusion |
| DESIRE | radiative data for sixth row elements [3,38] | STEL, SOL, plasmas |
| DREAM | radiative data for rare earths [39] | STEL, SOL, plasmas, lighting industry |
| IAMDB | A+M spectroscopy, atomic collision () | Astrophysics, other |
| PEARL | atomic processes [40] | STEL, SOL, plasma, fusion |
| Clusters | cluster size distributions, condensation () | ISM, P, biology |
| VALD | Topbase | Tipbase |
|---|---|---|
| SHeCaSDa | MeCaSDa | GeCaSDa |
| TFMeCaSDa | RuCaSDa | TFSiCaSDa |
| UHeCaSDa | ECaSDa | Stark-B |
| CDMS | JPL | BeamDB |
| Mold | SeSAM | Basecol |
Publisher’s Note: MDPI stays neutral with regard to jurisdictional claims in published maps and institutional affiliations. |
© 2020 by the authors. Licensee MDPI, Basel, Switzerland. This article is an open access article distributed under the terms and conditions of the Creative Commons Attribution (CC BY) license (http://creativecommons.org/licenses/by/4.0/).
Share and Cite
Albert, D.; Antony, B.; Ba, Y.A.; Babikov, Y.L.; Bollard, P.; Boudon, V.; Delahaye, F.; Del Zanna, G.; Dimitrijević, M.S.; Drouin, B.J.; et al. A Decade with VAMDC: Results and Ambitions. Atoms 2020, 8, 76. https://doi.org/10.3390/atoms8040076
Albert D, Antony B, Ba YA, Babikov YL, Bollard P, Boudon V, Delahaye F, Del Zanna G, Dimitrijević MS, Drouin BJ, et al. A Decade with VAMDC: Results and Ambitions. Atoms. 2020; 8(4):76. https://doi.org/10.3390/atoms8040076
Chicago/Turabian StyleAlbert, Damien, Bobby K. Antony, Yaye Awa Ba, Yuri L. Babikov, Philippe Bollard, Vincent Boudon, Franck Delahaye, Giulio Del Zanna, Milan S. Dimitrijević, Brian J. Drouin, and et al. 2020. "A Decade with VAMDC: Results and Ambitions" Atoms 8, no. 4: 76. https://doi.org/10.3390/atoms8040076