Biogenic Amines Determination in “Plant Milks”


Department of Management, Sapienza University of Rome, 00161 Rome, Italy
*
Author to whom correspondence should be addressed.
Beverages 2019, 5(2), 40; https://doi.org/10.3390/beverages5020040
Submission received: 1 March 2019
/
Revised: 13 March 2019
/
Accepted: 11 April 2019
/
Published: 4 June 2019
(This article belongs to the Special Issue Composition Determination and Beverage Safety)
Abstract
:“Plant milks” are water-based beverages, such as, extracts from cereals, pseudo-cereals, oil seeds, legumes or fruits. Plant milk consumption is rising in European and North American markets due to problems related to cow milk allergies, intolerances, but also because of vegan diets and sensitivity to environmental issues. There is no specific regulation for these beverages, therefore their composition can vary considerably, even in the same category. The aim of this study is to characterize the main categories of cereal and pseudo-cereal milks on the market by studying the profile of 8 biogenic amines (histamine, serotonin, spermine, spermidine, putrescine, β-phenylethylamine, cadaverine, tyramine) through a RP-HPLC/FD method with a pre-column derivatization. Biogenic amines are ubiquitous compounds, produced by the decarboxylation of the respective amino acids and they have been proposed as quality and safety markers of different foods and beverages. In the analyzed samples, the total biogenic amines content ranged from a minimum of 1.92 mg/L, to a maximum of 9.27 mg/L. The main biogenic amine found in the samples was histamine. The results show a low content of biogenic amines in all types of analyzed products. This ensures the quality and safety of cereal and pseudo-cereal milk samples.
1. Introduction
In Europe, milk is defined as “the normal mammary secretion obtained from one or more milkings without either addition thereto or extraction therefrom” by the Council Regulation (EU) No 1308/2013 [1]. People benefit from milk consumption, especially during the first years of life. Milk provides proteins of high biological value, lipids, vitamins and minerals (such as calcium) [2]. Nevertheless, milk consumption is gradually decreasing in western countries [3].
Nowadays the spread of alternative milk is growing (i.e., vegetables milk) commonly called “plant milk” or “non-dairy milk”. Consumption of “plant milk” is constantly increasing in North America as well as in Europe [4].
The consumer choice of vegetable milk is related to health problems, such as lactose intolerance, milk protein allergy, phenylketonuria [5,6]. An ever-larger portion of consumers, however, choose these beverages for other reasons such as religious motivations, the choice of diets that exclude animal foods or for taste. In addition, increasing urbanization has improved the demand of functional and healthy beverages [7].
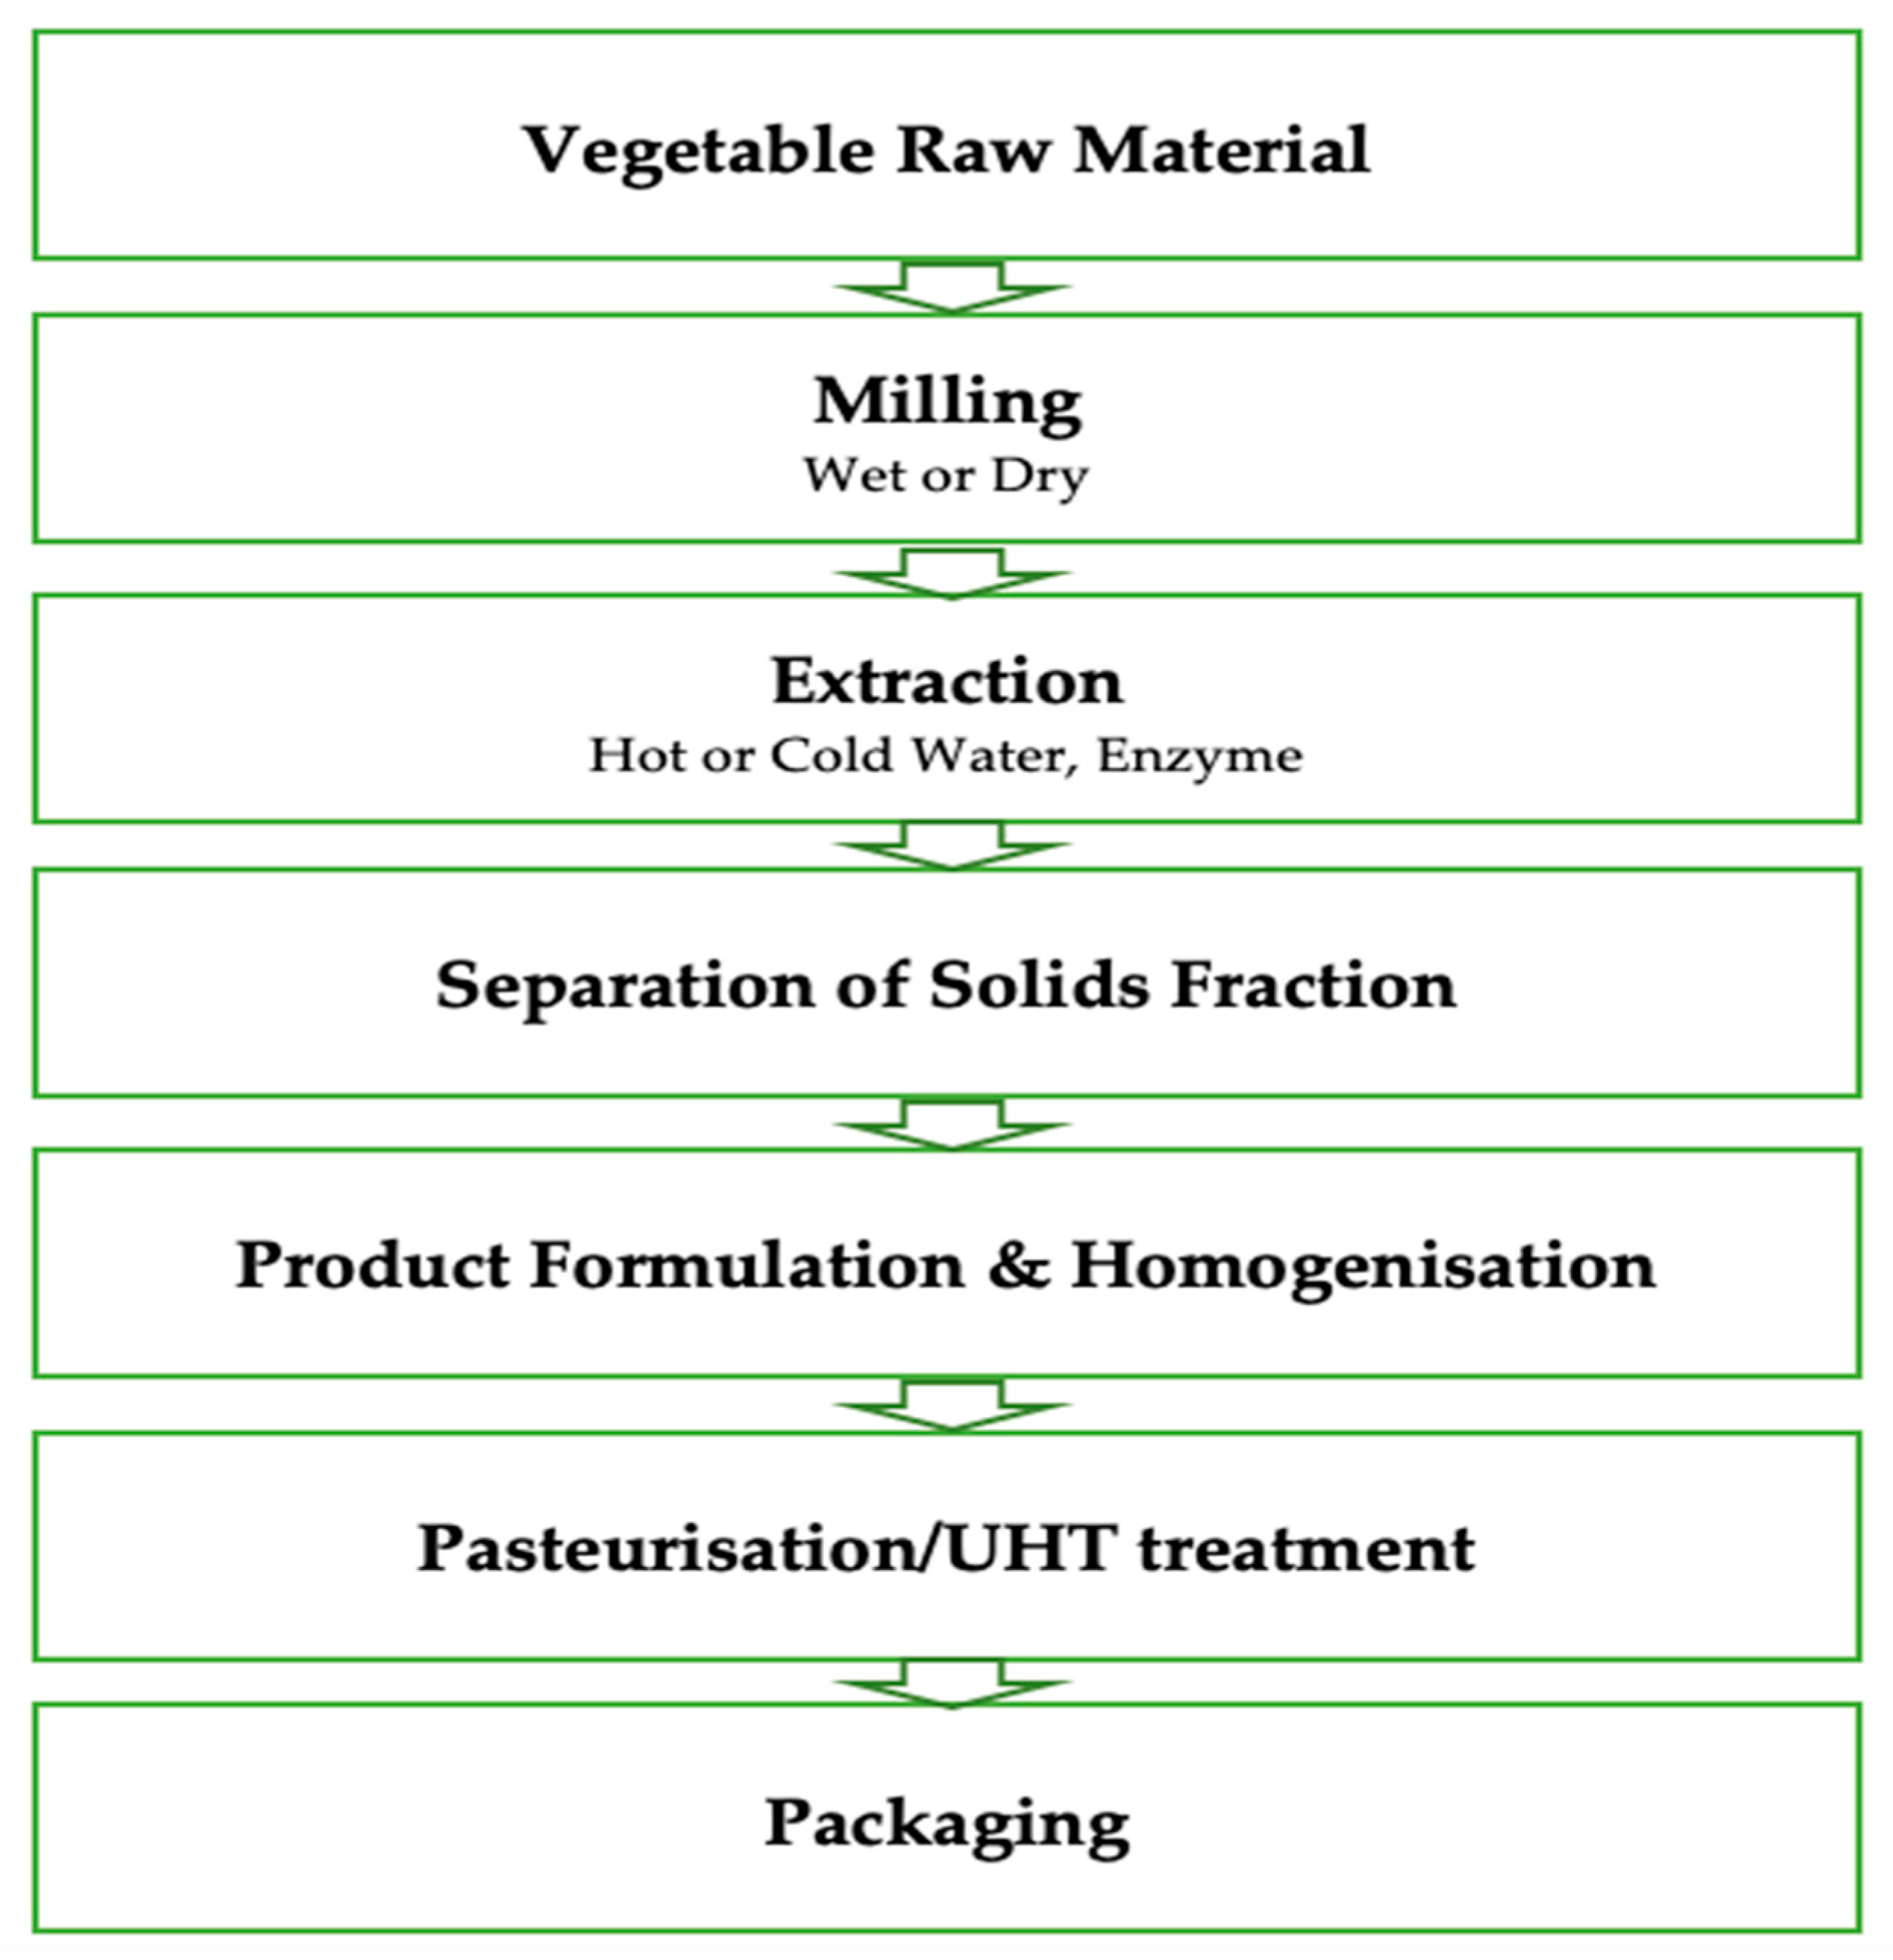
All plant milks are obtained by the same procedure. Figure 1 shows the production flow-chart. First the raw material is crushed, then the obtained flour is mixed with water. After being filtered, the vegetable milk is ready. Industrial productions can also be continued with other ingredient additions or heat treatments [8]. Oil, flavorings, sugar, and stabilizer are the most common ingredients added. Homogenization and ultra-high temperature (UHT) treatments (rarely pasteurization) are performed to improve suspension quality and microbial stability [9].
Soybean milk is the most ancient and widespread non-dairy milk. However, preparation originating from other plants belongs to many world cultures (atole from Mexico, horchata from Spain, bushera from Uganda, etc.) [9]. According to a recent study [8], there is no shared definition and classification of these plant milks.
A general classification in categories has been proposed:
- Cereal based: Oat milk, rice milk, corn milk, spelt milk, millet milk;
- Legume based: Soy milk, peanut milk, lupin milk, cowpea milk;
- Nut based: Almond milk, coconut milk, hazelnut milk, pistachio milk, walnut milk;
- Seed based: Sesame milk, flax milk, hemp milk, sunflower milk;
- Pseudo-cereal based: Quinoa milk, teff milk, amaranth milk, buckwheat milk.
Plant milks have a lower nutritional value than milk, they lack important proteins, vitamins and minerals. Plant milks, however, are beverages that have beneficial health characteristics [10]. For example, in vegetable milks, there are phytosterols despite cholesterol being widely present in milk. They contribute to fiber intake and are often reinforced with vitamins and minerals. Plant milks are recommended for milk allergy sufferers (no lactose, no milk protein) and some of these are also gluten-free and nut-free [11].
An important characteristic is the presence of phytochemicals, substances known to have positive effects on health. Oat milk, for example, contains b-Glucan, with a hypocholesterolemic effect by reducing total and low-density lipoprotein (LDL) cholesterol. Sesame milk instead contains lignans which have antioxidant, anticarcinogenic and anti-tumor activity [8].
There is no specific regulation of plant milks, so in the same category they can have a great difference in composition values. Therefore, to ensure quality and safety of these products, the detection of suitable molecular markers is required.
Biogenic amines are ubiquitous compounds and derive from amino acids decarboxylation. This reaction is caused by endogenous enzymes or microorganisms, therefore biogenic amines can be endogenous or exogenous. Endogenous biogenic amines are part of many cellular functions, with very different effects. Great attention is given to the study of biogenic amines content in food [12]. They are present in all food, especially in the protein ones or in fermented products, like fish, meat, wine and dairy products [13,14,15,16]. Low levels of biogenic amines are a natural characteristic of some fermented food (cheese, sausage, etc.) and contribute to define their aroma [17]. Excessive presence of biogenic amines can cause headaches, tachycardia and nausea but also, in extreme cases, cerebral hemorrhage, anaphylactic shock and death. In addition, some biogenic amines show a vasoconstrictive or vasodilator effect. The most dangerous biogenic amines for human health are histamine and tyramine. Phenylethilamine, serotonin, putrescine and cadaverine can have toxic effects enhancers by hindering the body’s enzymatic detoxification mechanisms. Starting from recent studies, also alcohol intake seems to increase the amines absorption rate [18]. Histamine and tyramine are responsible respectively for sgombroid syndrome and the cheese crisis [19]. A scientific opinion from the European Food Safety Authority has established the biogenic amines safe intake dose (per meal) is 50 mg of histamine and 600 mg of tyramine [20].
Several authors have proposed biogenic amines as food quality and safety indicators, also in beverages. Poveda investigated the difference in the amino acid profile and the biogenic amines content in craft beers from the Spanish market. The results showed a relationship with raw materials and brewery [21]. A recent study evaluated the profile of biogenic amines in fruit juices and fruit nectars, and then classified them according to the fruit of origin [22]. However, many studies have focused on wine, in which biogenic amines can represent a great problem for consumers. Higher biogenic amines content have been found in red wines than the white ones, especially wines obtained by malolactic fermentation [23,24]. Moreover, biogenic amines were also investigated in cow’s milk and soy drinks [25,26].
Nowadays, the high-performance liquid chromatography (HPLC)-based method is considered the “golden standard” method for biogenic amines determination [27]. This method has high sensitivity and allows the simultaneous quantitation of several biogenic amines in food. The European Union has defined a HPLC method, coupled to a pre-column derivatization, for histamine routine control in fish [28].
The aim of this study was to characterize the main cereal and pseudo-cereal based milks found on the market by evaluating the profile of 8 biogenic amines (histamine, serotonin, spermine, spermidine, putrescine, β-phenylethylamine, cadaverine, tyramine) by a reverse phase liquid chromatography method coupled with a spectrofluorimetric detector (RP-HPLC-FD) and pre-column derivatization. Starting from the results, it was possible to evaluate the identification of biogenic amines to use as safety and quality markers in plant milk. Starting from literature research, few works describing the presence of biogenic amines in alternative milks, especially in soy milk [26,29], were found and not one in cereal milks. So, to the best of our knowledge, this seems to be the first study that investigates the content of biogenic amines in cereal and pseudo-cereal milk.
2. Materials and Methods
2.1. Materials
Acetonitrile (HPLC grade), Perchloric acid (HClO4), sodium hydroxide (NaOH), sodium carbonate (Na2CO3) and ammonium hydroxide (NH4OH) were purchased from Sigma Aldrich Chemical Co., (Milan, Italy). The eight biogenic amines studied were histamine (HIS), serotonin (SER), spermine (SPM), spermidine (SPD), putrescine (PUT), β-phenylethylamine (β-PEA), cadaverine (CAD), and tyramine (TYM) all of which were supplied by Supelco (Bellefonte, PA, USA) as well as the derivatizing agent dansyl chloride (5-(dimethylamino) naphthalene-1-sulfonyl chloride).
2.2. Sampling
Twenty-three different “plant milk” products, were purchased from Italian local stores. Three batches for each beverage were studied and the biogenic amines content was determined twice of each sample. These products were manufactured in Europe and fit EU quality standards. The most popular and representative brand of each product were chosen. All samples were UHT treated, so they were stored at room temperature until their analyses. Table 1 shows the cereal (or pseudo-cereal) percentage content of plant milk samples.
2.3. Biogenic Amines Extraction and Derivatization
Biogenic amines from non-dairy milk samples were extracted according to a literature method [26] with some modification. An aliquot of 5 mL of sample was extracted twice with 8 mL of HClO4 0.6 M, homogenized in a magnetic stirring plate for 10 min, and centrifuged at 2700 g for 10 min. Supernatants was filtered through a 0.20 µm membrane Millipore filter (Millipore Bedford Corp., Bedford, MA, USA) and combined. The final volume was adjusted to 25 mL with HClO4 0.6 M. Derivatization has been performed according to a previously optimized method [30]. An aliquot of 1 mL of the final extract was added of 200 µL of NaOH 2 M, 300 µL of saturated NaHCO3 solution, and 2 mL of dansyl chloride solution (10 mg/mL in acetone). After shaking, samples were left in the dark at 45 °C for 60 min. After incubation, 0.100 mL of 25% ammonium hydroxide was added to remove any residual of dansyl chloride. Finally, the volume was adjusted to 5 mL by adding acetonitrile and filtered (0.22 µm, Polypro Acrodisc, Pall Gelman Laboratory, Port Washington, NY, USA). After filtration, a volume of 20 μL was injected into the chromatograph.
2.4. HPLC Analysis
HPLC chromatographic separation of biogenic amines was performed in a system consisting of a LC-10 ATVP binary HPLC pump with RF-10AXL fluorescence detector (Shimadzu, Kyoto, Japan). The injector was fitted with a 20 μL loop. The analytical method applied was carried out as described in a previous work. Fluorescence detection was set at 320 nm for excitation and 523 nm for emission. The separation of the analytes was carried out using a Supelcosil LC-18 column (Supelco, 5 µm particle size, 150 mm × 2.1 mm I.D.) equipped with a Supelguard LC-18 guard column (Supelco Inc., Bellefonte, PA, USA). Biogenic amines were separated using a linear gradient obtained from ultrapure water (A) and acetonitrile (B). The elution gradient was as follows: The initial mobile phase contained 50% B and these conditions were maintained for 3 min; this percentage was linearly increased up to 70% in 5 min 30 s and kept for 1 min 30 s; after that, the content of B increased from 70% to 100% in 8 min, maintaining these conditions for 3 min. After this period, initial conditions were restored. The flow rate of the mobile phase was 0.6 mL/min and the column temperature was set at 43 °C. Identification of the Biogenic Amines (BAs) was based on their retention times. The calibration curves, i.e., the peak area versus concentration, were linear (R2 > 0.995) in the range of concentration between 0.1–16 mg/L. The lines of regression calculated have been used to compute the amount of the analytes in samples by interpolation, using the external standard method. The chromatographic data were collected and processed using Class-VP software (Ver. 6.12 SP2 Shimadzu, Deutschland Gmbh, Duisburg, Germany).
2.5. Results Expression
BAs determinations were carried out in triplicate; means and standard deviation were calculated. Analysis of variance (ANOVA) and Principal Component Analysis were performed using JMP (ver. 13.0 SAS Institute, Cary, NC, USA). The Biogenic Amines Index (BAI) was applied to determinate the loss in quality of beverages and was calculated as follows:
expressed in mg/L [31].
3. Results and Discussion
The presence of BAs has been widely explored in food and beverages, such as cheese, meat, wine and beer. Starting from the existing literature, this is the first qualitative and quantitative study on biogenic amines in cereals and pseudo-cereals alternative milks. As shown in many studies, different analytical techniques have been proposed for BAs determination in various food matrices [32]. In this study, the most used technique was chosen: HPLC-Fluorescence Detection (HPLC-FD) with precolumn derivatization. The samples were heterogeneous in composition and cereal concentration, also in the same cereal class. Therefore, the biogenic amines content for each sample has been determined, total BAs content and BAI were also calculated. After that, a statistical data analysis was performed to highlight correlations between the samples.
3.1. Biogenic Amines Determination
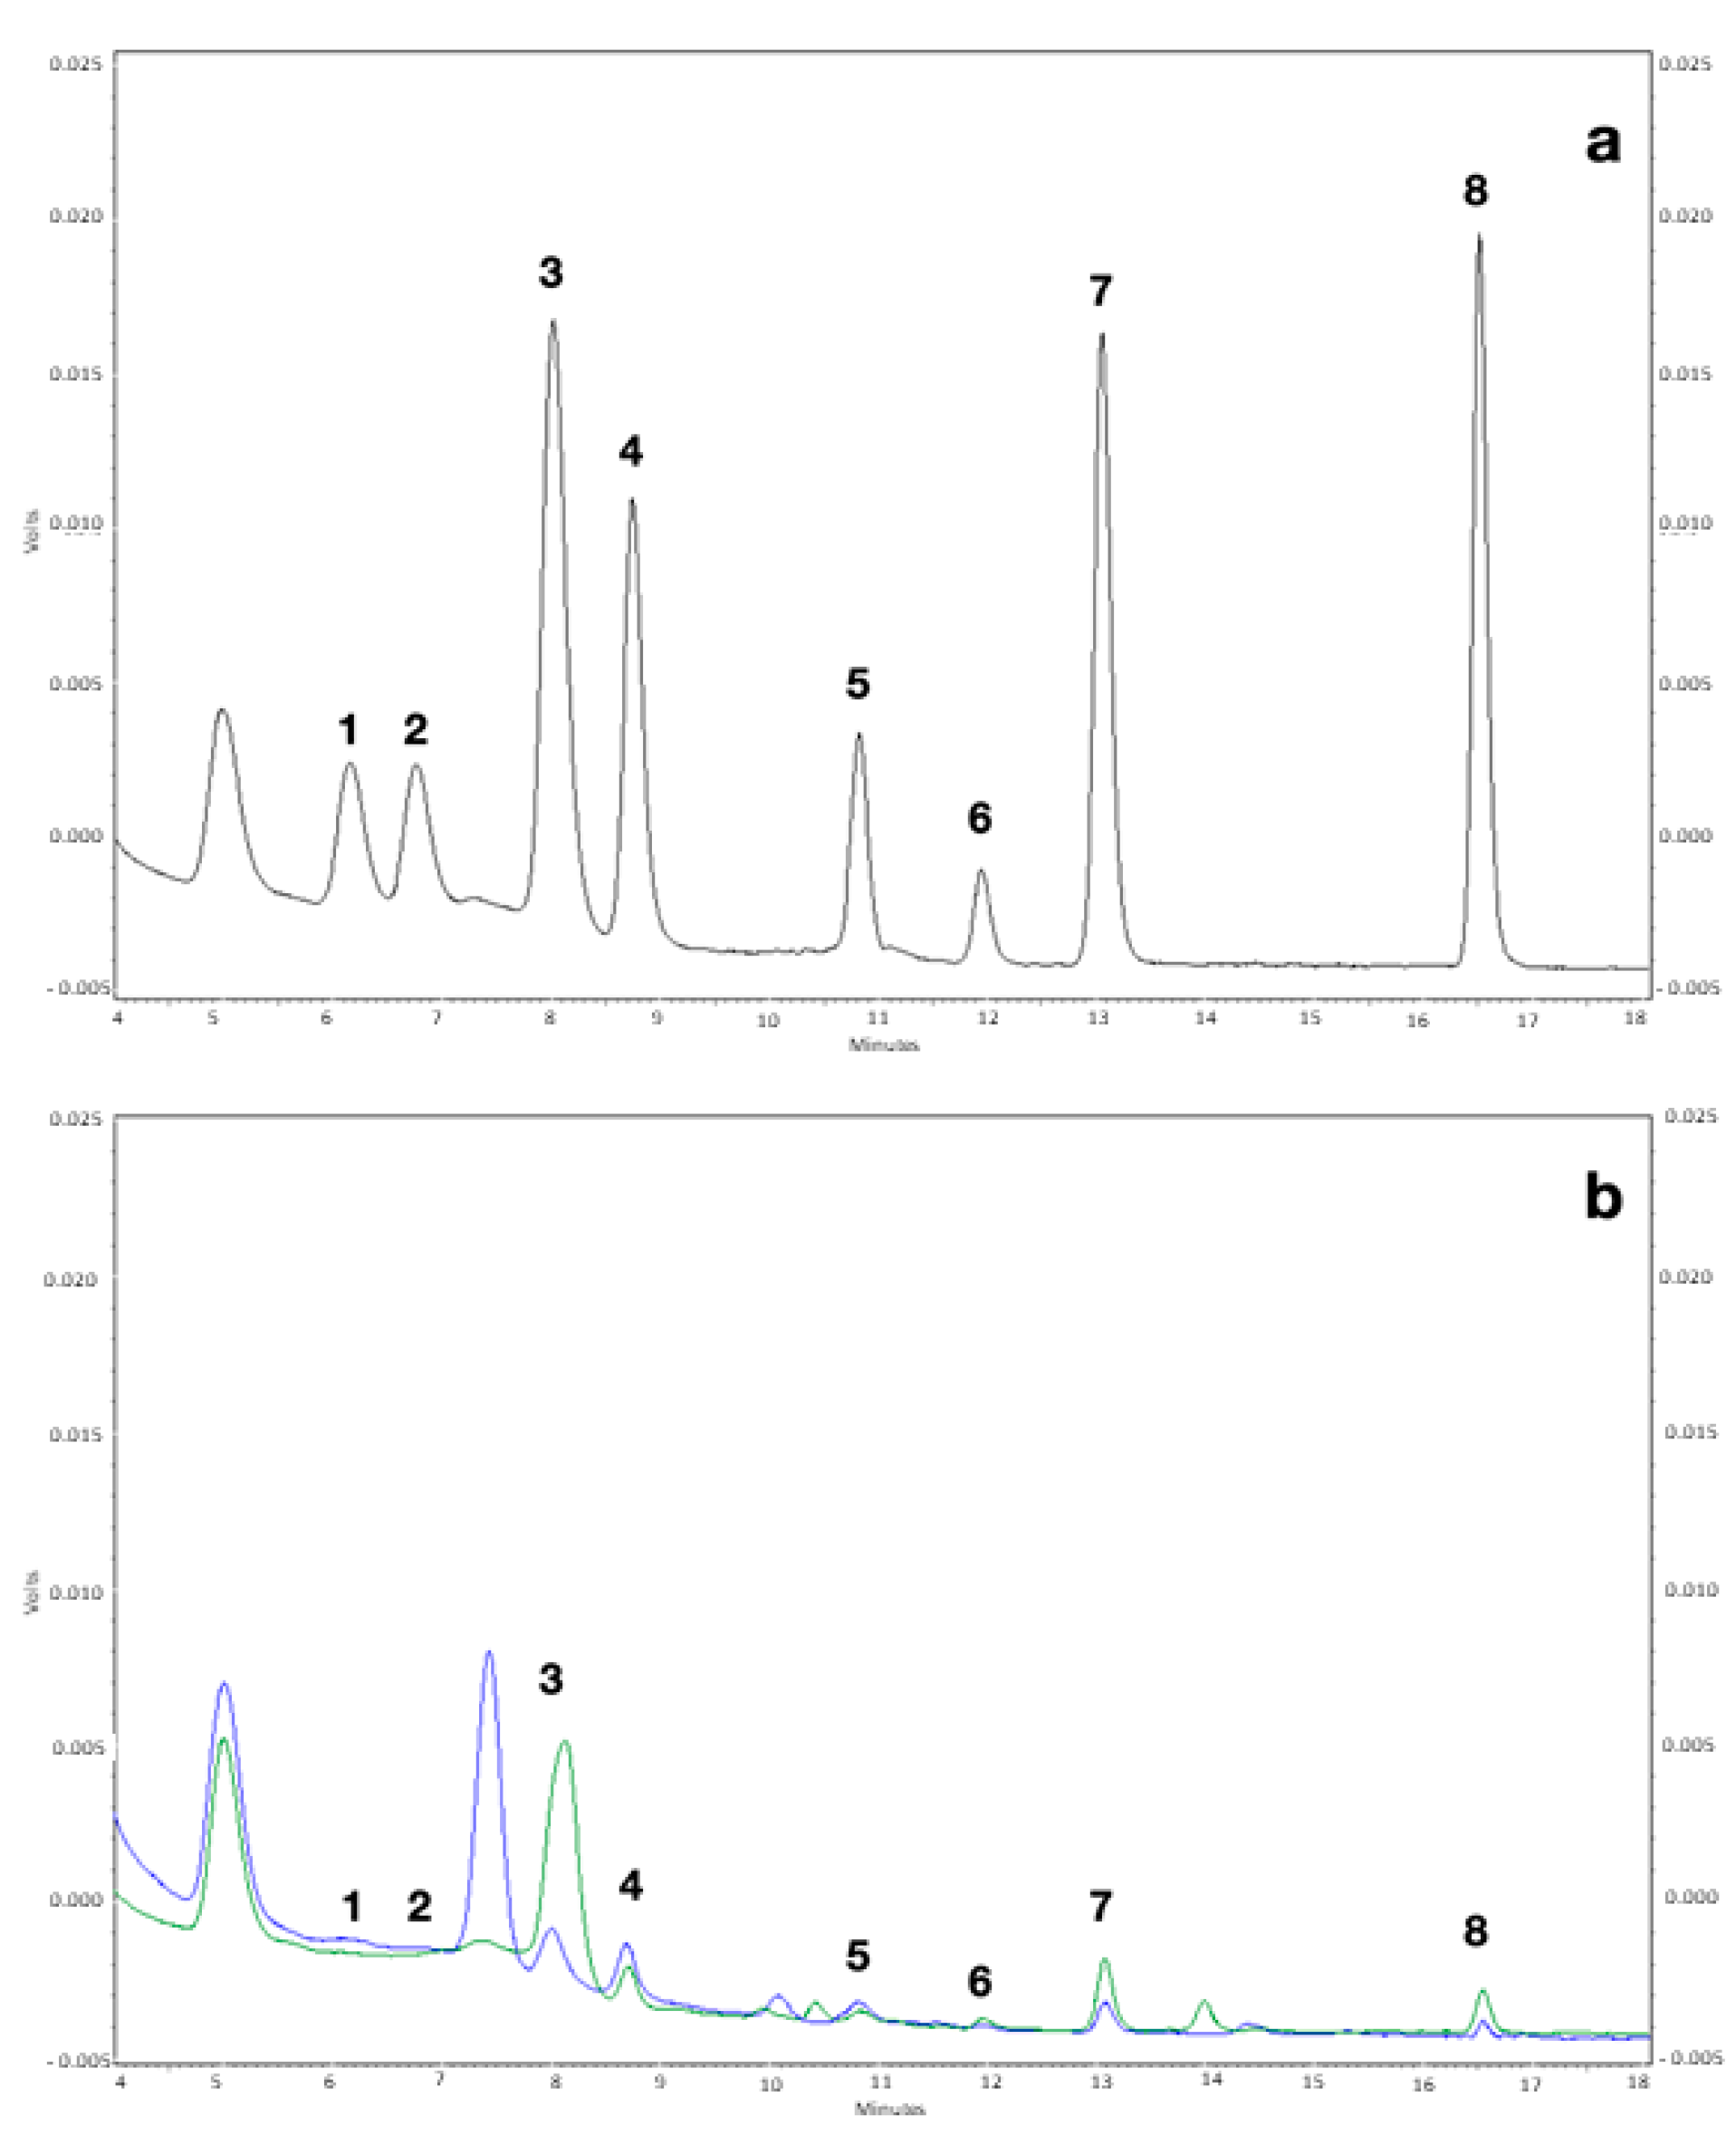
Chromatograms of BAs standards solution and the overlap of two real samples are shown in Figure 2. The comparison of the retention times allowed the identification, in the 23 samples, only 5 of the 8 analyzed biogenic amines.
BAs had different profiles in all samples. Cadaverine, histamine and tyramine were found (at different levels) in the all six classes considered. Spermine and spermidine were respectively determined (oat, barley, quinoa and rice) and 2 (oat and barley) classes, while β-phenylethylamine, putrescine and serotonin were not found in any of the samples.
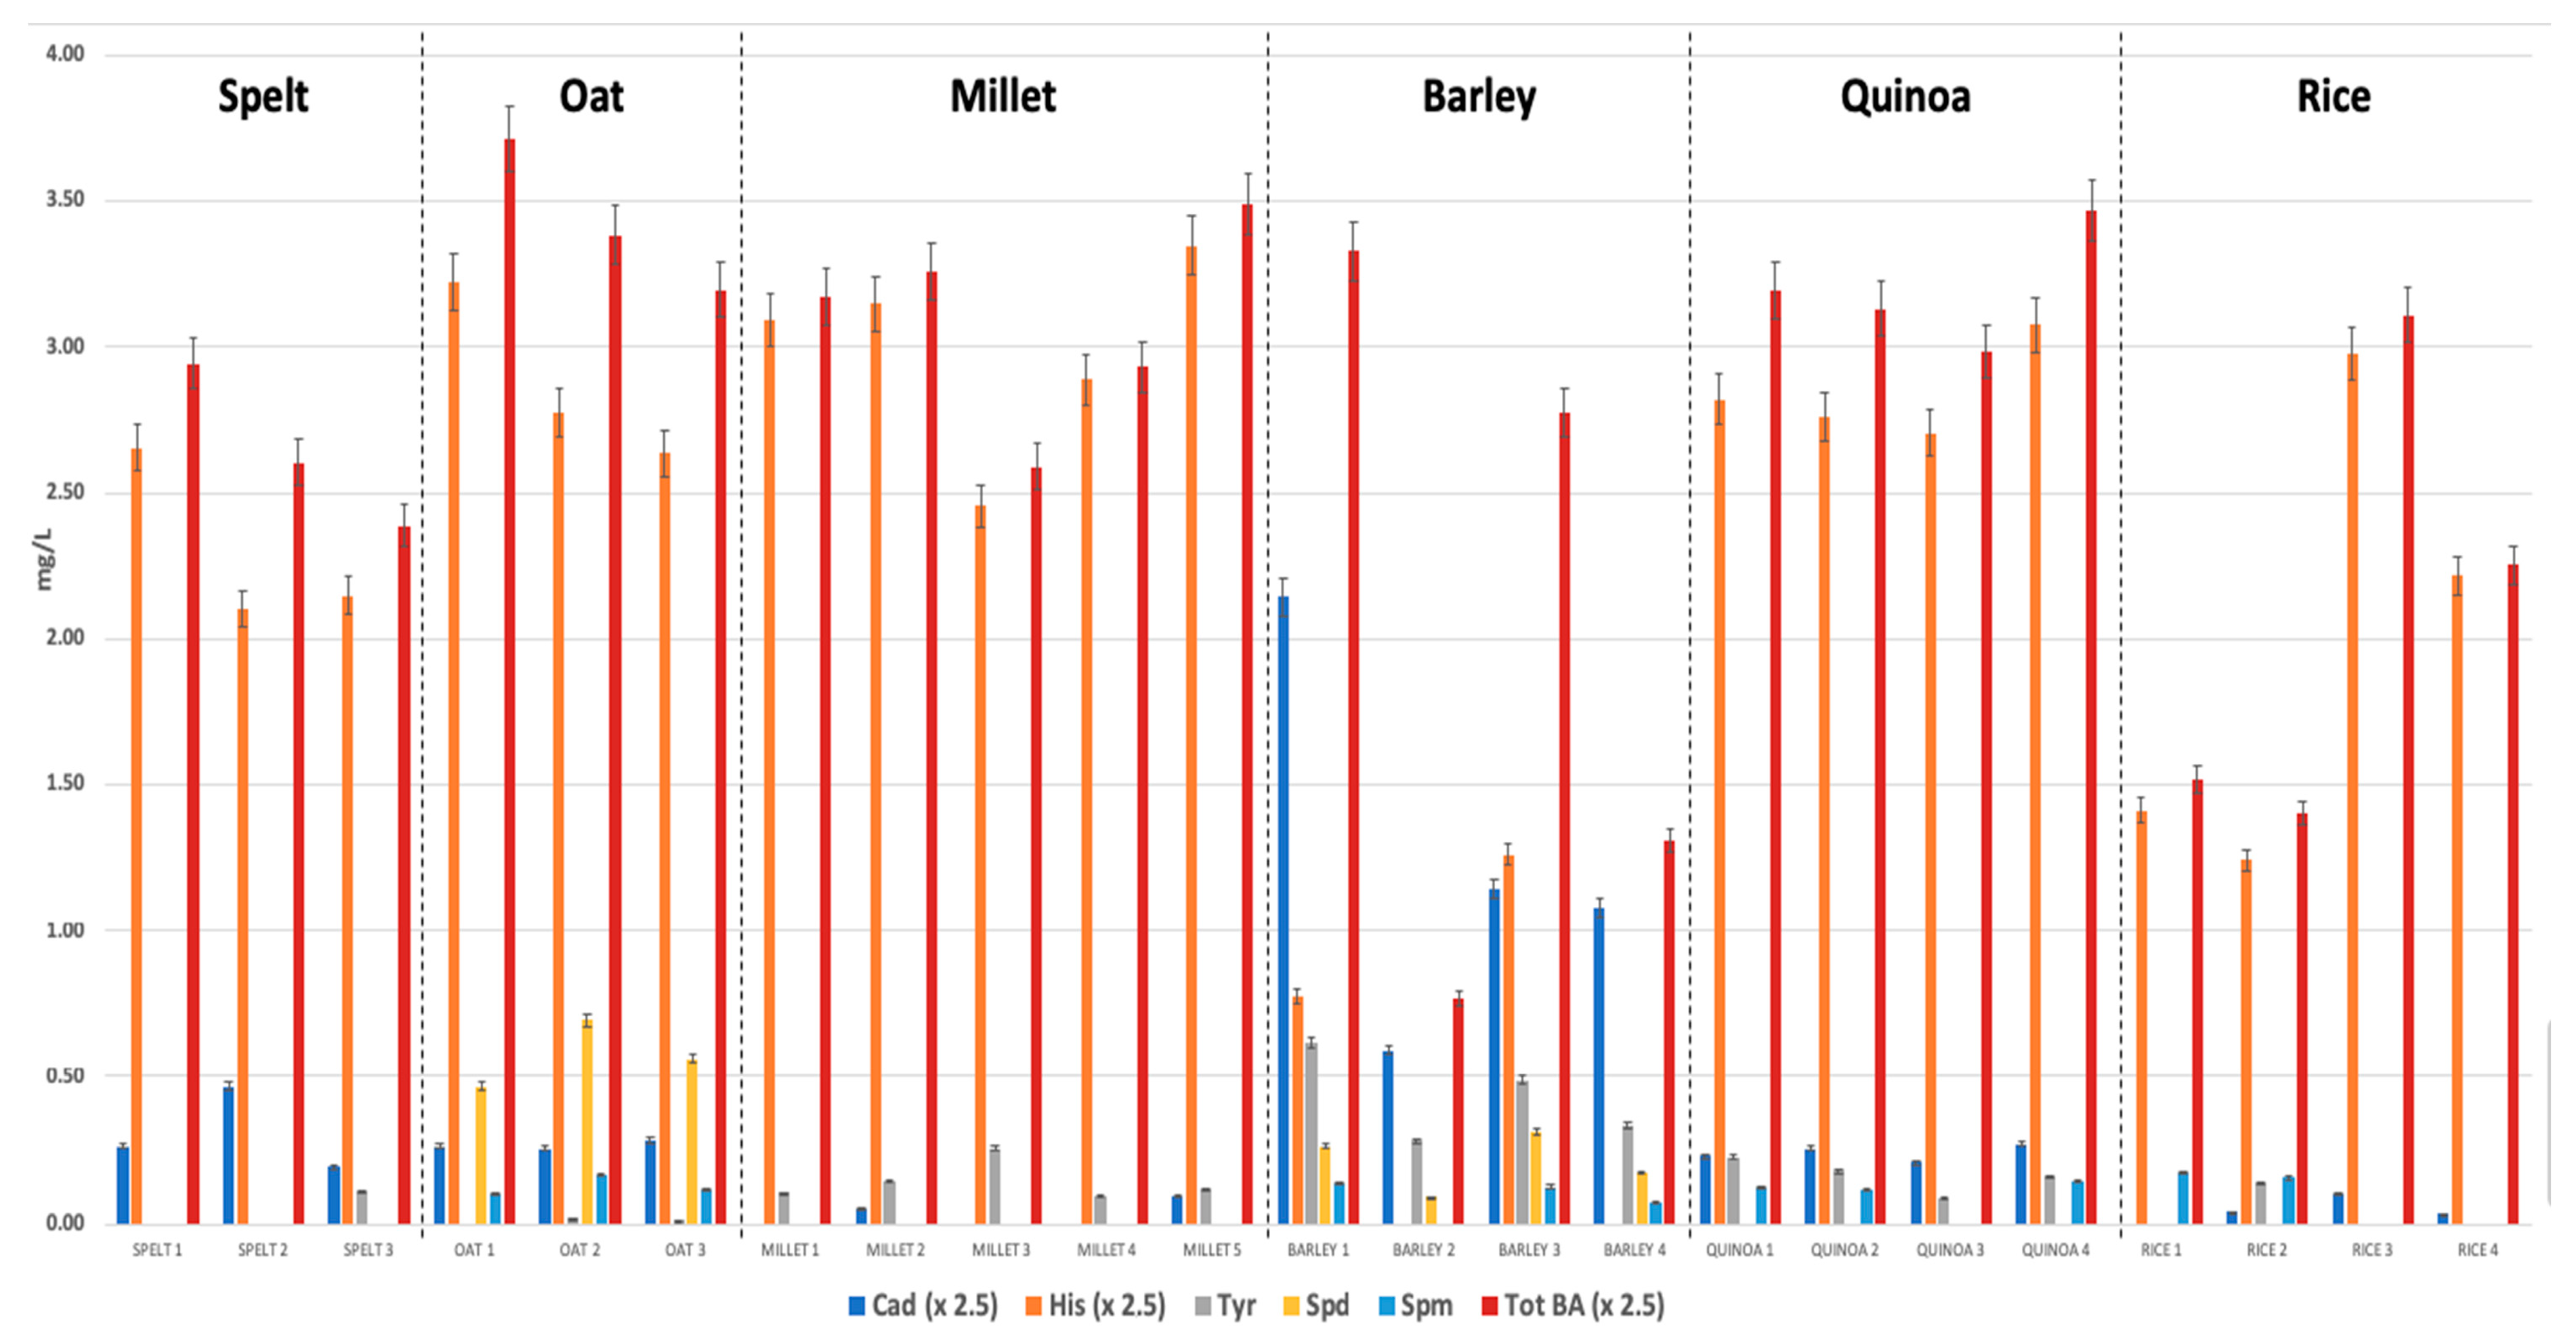
Figure 3 displays the concentration of BAs (error bars express standard deviation) for each sample. The chart shows also the total biogenic amines content. The graph highlights that the contents of histamine and cadaverine were higher than the other amines. For a better visualization, His and Cad columns have been reduced 2.5× times. The BAs profile is not the same for samples belonging to the same class, but it is possible to highlight the same trends.
The total content of amines (Tot. BA) was calculated as the sum of the 5 amines present in the samples. It has an average value of 6.84 mg/L, with large inter and intra-class variability. The Tot. BA values range from a minimum of 1.92 mg/L (a barley milk sample), to a maximum of 9.27 mg/L (an oat milk sample). The Tot. BA values are comparable to that reported in the literature for other non-fermented beverages [33,34].
Histamine was the biogenic amine found in almost all the samples. It was also the biogenic amine present in the largest quantities (histamine was 82% of the sum of all the amines found). Histamine has been detected in large quantity in almost all classes of samples: Just the barley samples are the exception. However, the barley samples show the lowest content of this amine. Considering the entire sample set, histamine was found in concentrations ranging from 1.94–8.37 mg/L, with a mean content of 6.16 mg/L. Histamine is derived from decarboxylation of the amino acid histidine and is the only biogenic amine regulated for its negative health effects. Histamine is attributed to a negative effect on the organism physiology, especially on the nervous system and mediation of allergies. The Commission Regulation 2073/2005 establishes a maximum limit of 200 mg/kg for high histidine content fish [28], while in wines it is reported an average content ranging from 2–15 mg/L [35,36]. Therefore, the content of this amine in the samples is under the limit: In a portion of 200 mL of cereal milk, the histamine content can be from 0.4–1.6 mg. However, this histamine amount could be important for subjects with Diamine Oxidase (DAO) enzyme deficiency [37].
The second most present amine was cadaverine. It has been found in concentrations up to 1 mg/L in all barley milk samples and in one sample of spelt milk. The lowest cadaverine amounts were found in millet and rice milk samples, with concentrations close to the L.O.Q. Cadaverine is a diamine that characterizes putrefaction processes of animal tissues. Nevertheless, this amine has been found in vegetables [38,39] and soybean milk [26]. Tyramine, spermidine and spermine were determined at concentrations under 1 mg/L. Tyramine was found ubiquitously in the cereal milk classes, although in different concentrations (range 0.10–0.62 mg/L). Spermine was detected in the milk samples of oat, barley, quinoa and rice, with an average concentration of 0.14 mg/L. Instead, spermidine characterizes only oat and barley milk samples.
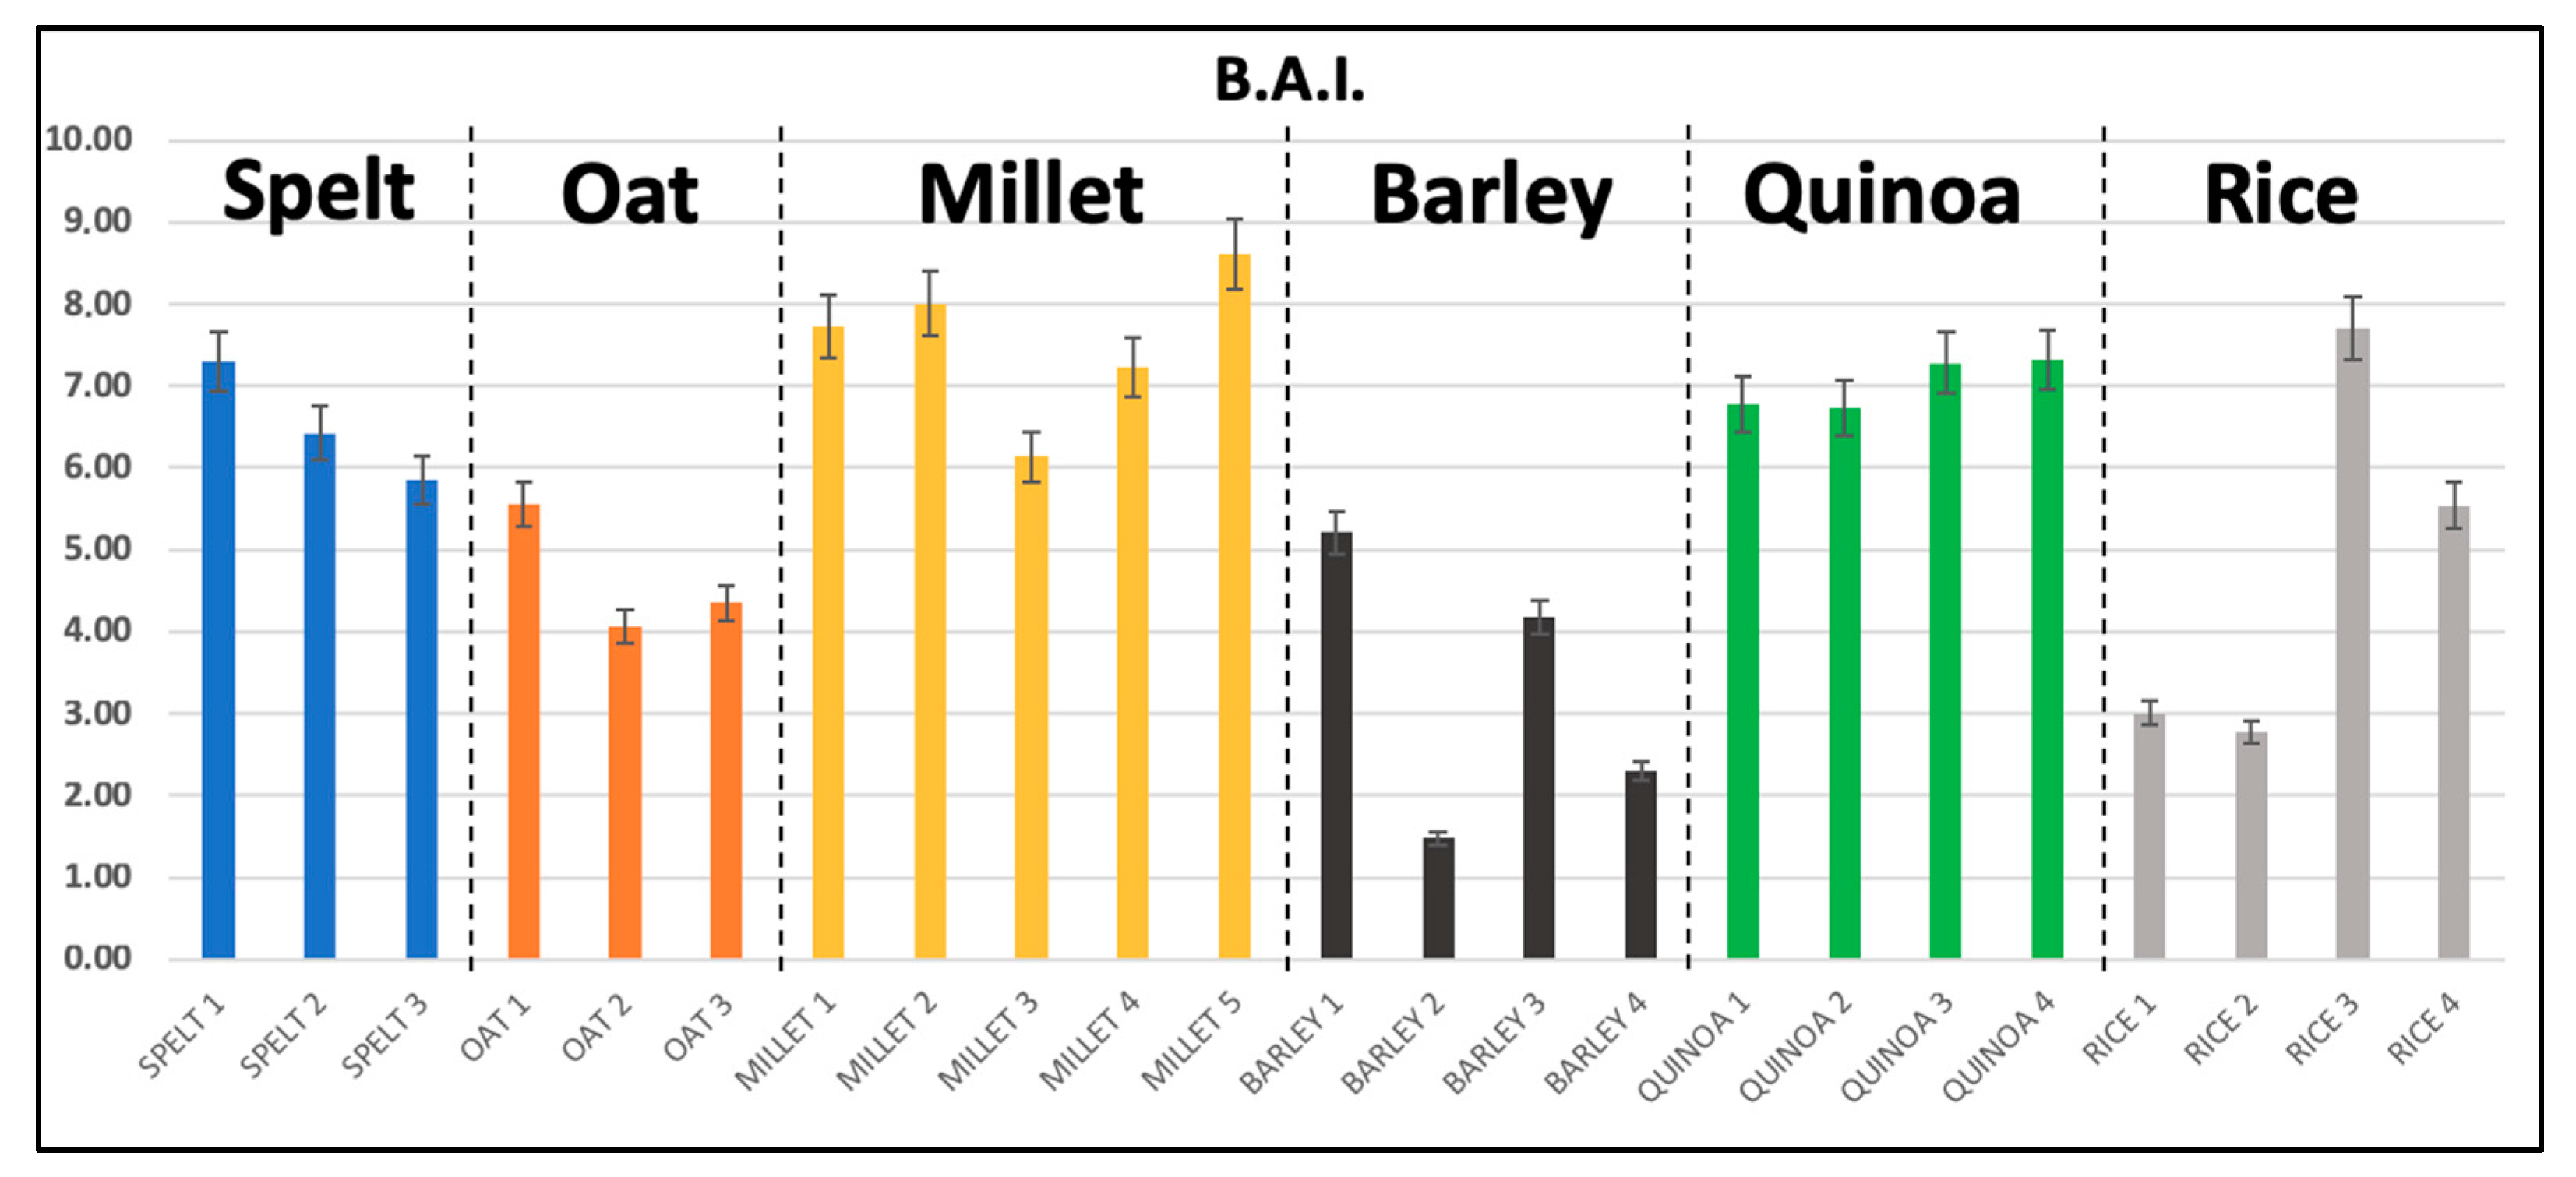
The Biogenic Amine Index was proposed for the first time in 1977 as a quality parameter for tuna and other fish [40]. Since then it has been used to evaluate quality and freshness of various foods [41]. In this study all the samples obtained a BAI less than 10 (Figure 4); according to literature, BAI values <10 denote no loss in quality [31].
3.2. Statistical Analysis
To evidence significant differences and to explore possible groupings among samples, a statistical analysis was performed. Table 2 illustrates a large intra-class variability in biogenic amines content for different samples of cereal milk. This result may be due to differences in quantity, quality and geographic origin of the cereals, but also to different technologies used in beverages production.
The one-way analysis of variance of cereal milk classes is presented in Table 3, pairs with no significant differences are not shown. The comparison of BAs means concentrations were performed by two-tailed t-test. Pairs with p-values lower than 0.05 are considered statistically different. The results show that barley samples are significantly different from all other classes of milks for the contents of CAD, HIS and TYR. Rice milk (the best-selling cereal milk [9]) shows significant differences of His content with samples of millet, quinoa and spelt milk.
The SPM content, low in all samples, does not show significant differences between milk classes. Instead, the SPD content found in barley and oat samples is statistically different. It is noteworthy that the BAI is statistically different in almost all the classes, as shown in the Table 3 (except for the rice-quinoa couple). A meaningful result is that the classes millet-quinoa, millet-spelt, oat-barley and spelt-quinoa have no differences in biogenic amines contents.
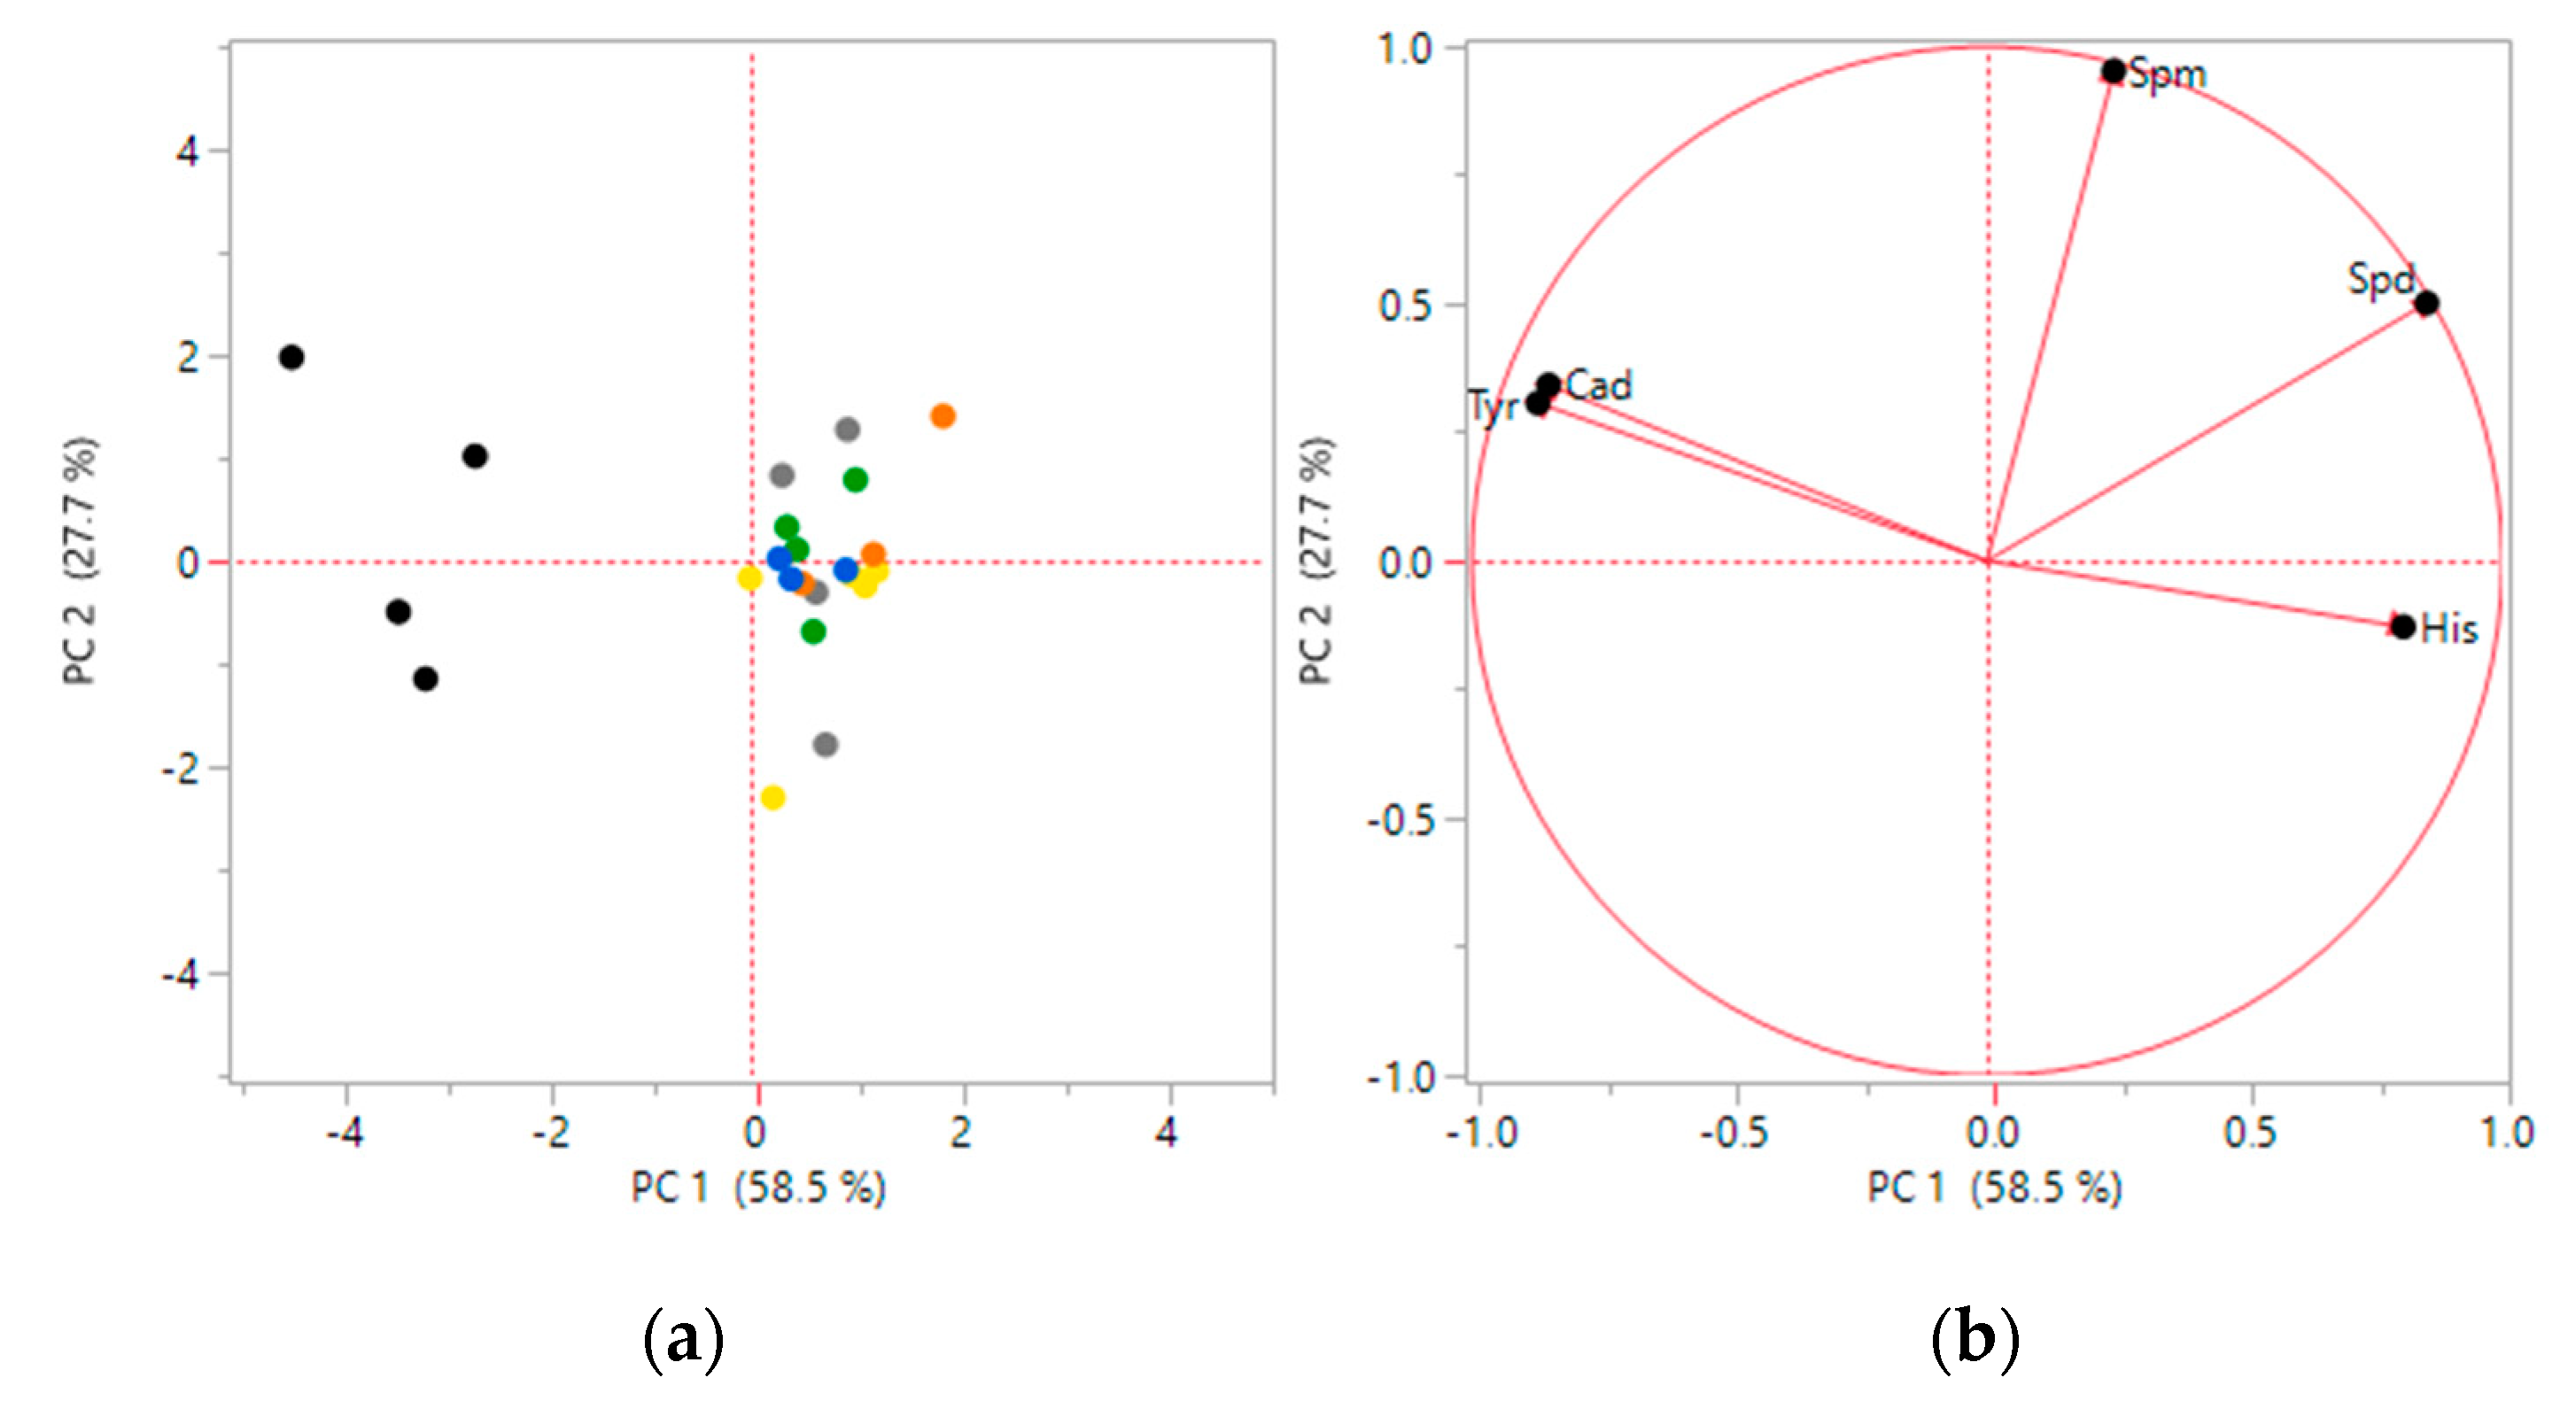
Hence, the different biogenic amines profiles of cereal milks were investigated using a multivariate statistical technique: The Principal Component Analysis (PCA). PCA is a data set exploratory technique, which highlights groupings of samples and/or variables correlations [42]. In this study, the PCA was performed on the experimental data matrix and autoscaling was chosen as data pretreatment. Figure 5 shows scores and loadings plots of PCA: The first two principal components (PC) explain 86.2% of the variability between the data.
In the scores plot (Figure 5a) the barley milk samples are grouped on the left of the graph, characterized by high Tyr and Cad concentration and low His concentration (loadings plot, Figure 5b). This result is according to ANOVA results: The barley milk class showed significant differences with the other classes in the content of these three BAs. The other samples are grouped in the central part of scores plot, showing no significant grouping between classes.
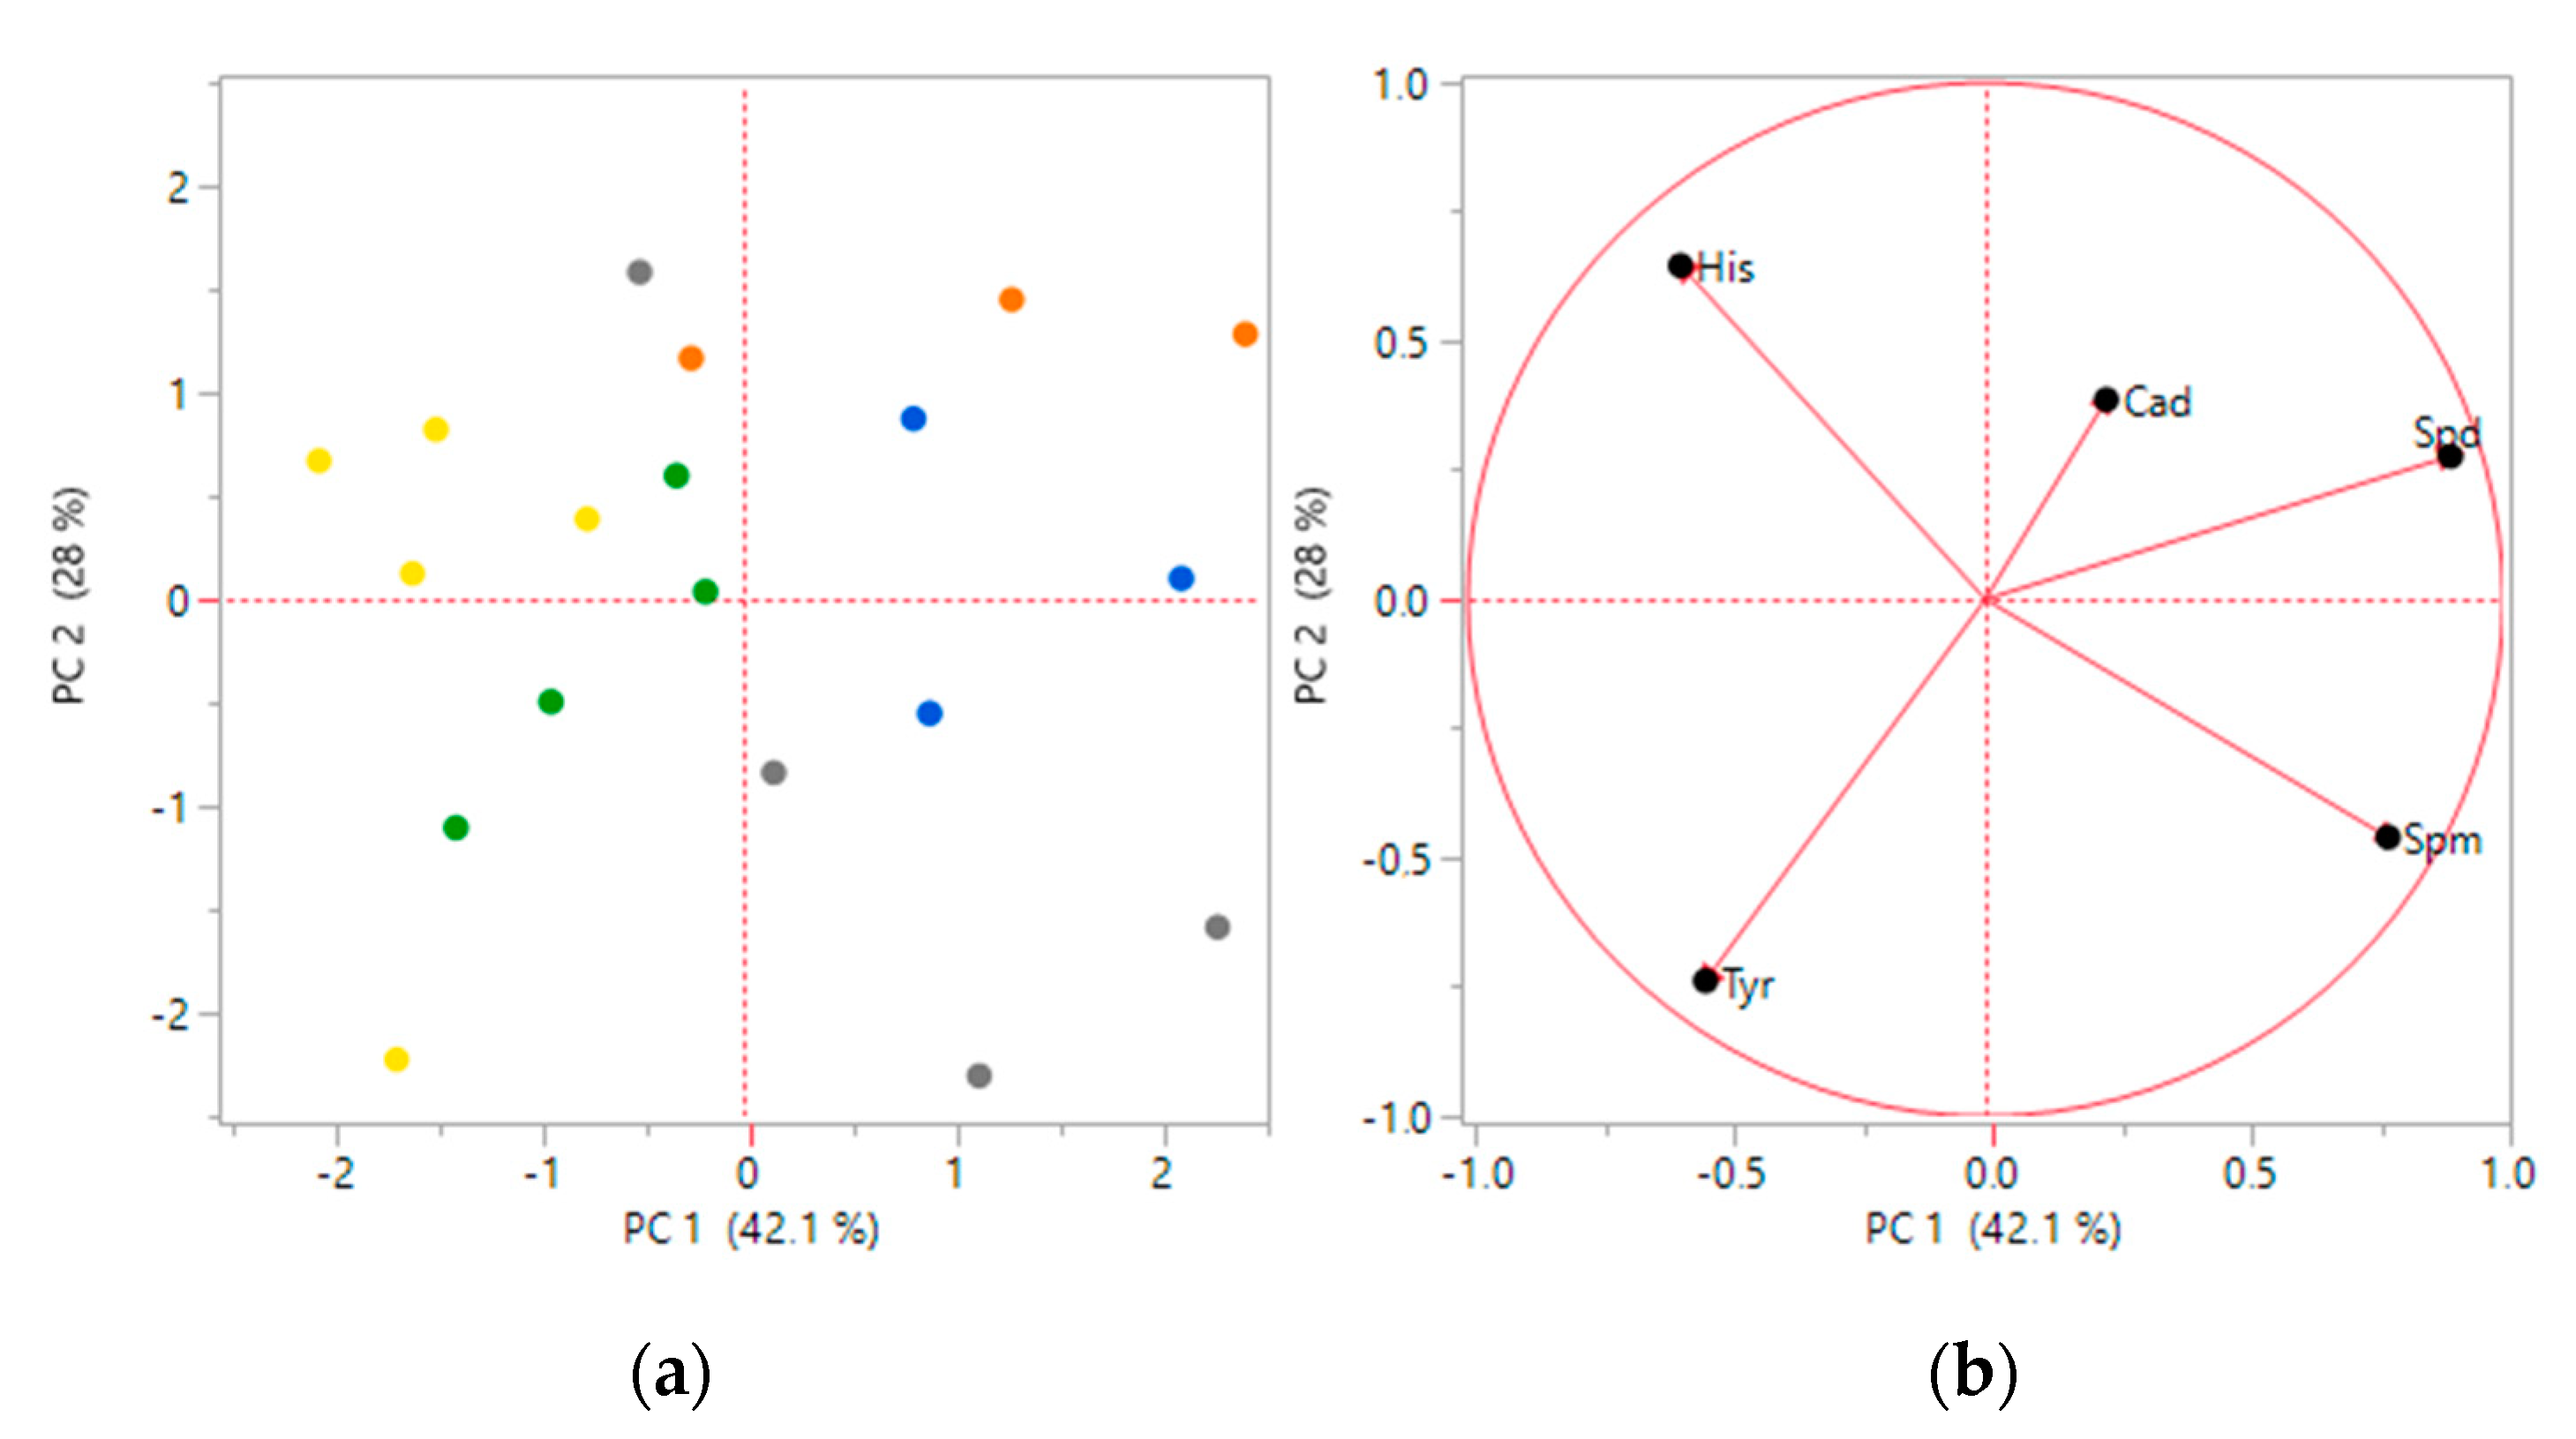
Since the first PCA seems to explain just the difference between the barley milk samples and the other ones, a second analysis was performed (Figure 6), excluding the barley milk samples, in order to maximize the information explained by PCA.
In the second PCA the first two components explain 70.1% of the variance, but there are no distinct groupings. As pointed out from the scores plot (Figure 6a), millet and quinoa milk samples are characterized by negative values of first PC. On the opposite side, there are spelt milk samples, characterized by positive values of first PC. Furthermore, the oat milk samples are characterized by positive values of second PC. As shown by loadings plot (Figure 6b) these samples have a higher concentration of CAD and SPD than others. However, there are no well-defined clusters, this may be due to the heterogeneity of cereal milks composition.
4. Conclusions
This study evaluates the biogenic amines content of six different classes of cereal and pseudo-cereal milks, chosen as the bestselling dairy alternative (excluding soy milk). This is the first investigation on the presence of eight biogenic amines in cereal and pseudo cereal milks.
The results show that the beverages are not biogenic amines free, as expected, due to the water extraction step in the production process [9,43].
Histamine, cadaverine, tyramine, spermidine and spermine were found in the samples.
The total biogenic amines content ranged from a minimum of 1.92 mg/L, to a maximum of 9.27 mg/L and the BAI was under 10 for all products analyzed. The main biogenic amine in the samples was histamine. Biogenic amines are usually considered as quality and safety markers. Cereal and pseudo-cereal milk samples shown low content in biogenic amines, therefore they can be considered safe and quality products.
Moreover, statistical analysis has shown that barley milk has a different BAs profile compared to the other classes.
Further studies need to be conducted by expanding data-set in other classes and variables. Future experiments can be conducted to monitor the evolution of the BAs profile during shelf life, as well as to evaluate the biogenic amines in products derived from these milks (dairy free yogurt, dairy free cheese, etc.).
Author Contributions
Conceptualization, L.G., S.C, M.R. and R.R.; methodology, L.G., S.C, M.R. and R.R.; L.G., S.C, M.R. and R.R.; validation, L.G., S.C, M.R. and R.R.; formal analysis, L.G., S.C, M.R. and R.R.; investigation, L.G., S.C, M.R. and R.R.; resources, L.G., S.C, M.R. and R.R.; data curation, L.G., S.C, M.R. and R.R.; writing—original draft preparation, L.G., S.C, M.R. and R.R.; writing—review and editing, L.G., S.C, M.R. and R.R.; visualization, L.G., S.C, M.R. and R.R.; supervision, L.G., S.C, M.R. and R.R.; project administration, L.G., S.C, M.R. and R.R.; funding acquisition, L.G., S.C, M.R. and R.R.
Funding
This research received no external funding.
Conflicts of Interest
The authors declare no conflict of interest.
References
- Regulation (EU) No. 1308/2013 of the European Parliament and of the Council of 17 December 2013 establishing a common organisation of the markets in agricultural products and repealing Council Regulations (EEC) No 922/72, (EEC) No 234/79, (EC) No 1037/2001 and (EC) No 1234/2007. Off. J. Eur. Union 2013, L347, 671–854.
- Lucarini, M. Bioactive Peptides in Milk: From Encrypted Sequences to Nutraceutical Aspects. Beverages 2017, 3, 41. [Google Scholar] [CrossRef]
- FAOSTAT. Milk Consumption—Europe 2007–2017; FAO: Roma, Italy, 2018. [Google Scholar]
- Mäkinen, O.E.; Wanhalinna, V.; Zannini, E.; Arendt, E.K. Foods for Special Dietary Needs: Non-dairy Plant-based Milk Substitutes and Fermented Dairy-type Products. Crit. Rev. Food Sci. Nutr. 2016, 56, 339–349. [Google Scholar] [CrossRef] [PubMed]
- Margaret, J.; James, E. Comparison of the Nutrient Content of Cow’ s Milk and Nondairy Milk Alternatives: What’ s the Difference? Nutr. Today 2018, 53, 153–159. [Google Scholar]
- Ripari, V. Techno-Functional Role of Exopolysaccharides in Cereal-Based, Yogurt-Like Beverages. Beverages 2019, 5, 16. [Google Scholar] [CrossRef]
- Marsh, A.J.; Hill, C.; Ross, R.P.; Cotter, P.D. Fermented beverages with health-promoting potential: Past and future perspectives. Trends Food Sci. Technol. 2014, 38, 113–124. [Google Scholar] [CrossRef] [Green Version]
- Sethi, S.; Tyagi, S.K.; Anurag, R.K. Plant-based milk alternatives an emerging segment of functional beverages: A review. J. Food Sci. Technol. 2016, 53, 3408–3423. [Google Scholar] [CrossRef] [PubMed]
- Jeske, S.; Zannini, E.; Arendt, E.K. Past, present and future: The strength of plant-based dairy substitutes based on gluten-free raw materials. Food Res. Int. 2018, 110, 42–51. [Google Scholar] [CrossRef]
- Chalupa-Krebzdak, S.; Long, C.J.; Bohrer, B.M. Nutrient density and nutritional value of milk and plant-based milk alternatives. Int. Dairy J. 2018, 87, 84–92. [Google Scholar] [CrossRef]
- Kundu, P.; Dhankhar, J.; Sharma, A. Development of Non Dairy Milk Alternative Using Soymilk and Almond Milk. Curr. Res. Nutr. Food Sci. J. 2018, 6, 203–210. [Google Scholar] [CrossRef]
- Doeun, D.; Davaatseren, M.; Chung, M.S. Biogenic amines in foods. Food Sci. Biotechnol. 2017, 26, 1463–1474. [Google Scholar] [CrossRef]
- Cinquina, A.L.; Calì, A.; Longo, F.; De Santis, L.; Severoni, A.; Abballe, F. Determination of biogenic amines in fish tissues by ion-exchange chromatography with conductivity detection. J. Chromatogr. A 2004, 1032, 73–77. [Google Scholar] [CrossRef]
- Vinci, G.; Antonelli, M.L. Biogenic amines: Quality index of freshness in red and white meat. Food Control 2002, 13, 519–524. [Google Scholar] [CrossRef]
- Stratton, J.E.; Hutkins, R.W.; Taylor, S.L. Biogenic Amines in Cheese and other Fermented Foods: A Review. J. Food Prot. 2016, 54, 460–470. [Google Scholar] [CrossRef]
- Guo, Y.Y.; Yang, Y.P.; Peng, Q.; Han, Y. Biogenic amines in wine: A review. J. Food Sci. Technol. 2015, 50, 1523–1532. [Google Scholar] [CrossRef]
- Spano, G.; Russo, P.; Lonvaud-Funel, A.; Lucas, P.; Alexandre, H.; Grandvalet, C.; Coton, E.; Coton, M.; Barnavon, L.; Bach, B.; et al. Biogenic amines in fermented foods. Eur. J. Clin. Nutr. 2010, 64, 94–100. [Google Scholar] [CrossRef]
- Tofalo, R.; Perpetuini, G.; Schirone, M.; Suzzi, G. Biogenic Amines: Toxicology and Health Effect. Encycl. Food Health 2015. [Google Scholar] [CrossRef]
- Kalač, P. Health effects and occurrence of dietary polyamines: A review for the period 2005–mid 2013. Food Chem. 2014, 161, 27–39. [Google Scholar] [CrossRef]
- EFSA. Scientific Opinion on risk based control of biogenic amine formation in fermented foods. EFSA J. 2011, 9, 2393. [Google Scholar] [CrossRef]
- Poveda, J.M. Biogenic amines and free amino acids in craft beers from the Spanish market: A statistical approach. Food Control 2019, 96, 227–233. [Google Scholar] [CrossRef]
- Preti, R.; Bernacchia, R.; Vinci, G. Chemometric evaluation of biogenic amines in commercial fruit juices. Eur. Food Res. Technol. 2016, 242, 2031–2039. [Google Scholar] [CrossRef]
- Ordóñez, J.L.; Callejón, R.M.; Troncoso, A.M.; García-Parrilla, M.C. Evaluation of biogenic amines profile in opened wine bottles: Effect of storage conditions. J. Food Compos. Anal. 2017, 63, 139–147. [Google Scholar] [CrossRef]
- La Torre, G.L.; Rando, R.; Saitta, M.; Alfa, M.; Maisano, R.; Dugo, G. Determination of biogenic amine and heavy metal contents in sicilian wine samples. Ital. J. Food Sci. 2010, 22, 28–40. [Google Scholar]
- Linares, D.M.; Del Rio, B.; Ladero, V.; Martínez, N.; Fernández, M.; Martín, M.C.; Alvarez, M.A. Factors influencing biogenic amines accumulation in dairy products. Front. Microbiol. 2012, 3, 180. [Google Scholar] [CrossRef]
- Toro-Funes, N.; Bosch-Fuste, J.; Latorre-Moratalla, M.L.; Veciana-Nogués, M.T.; Vidal-Carou, M.C. Biologically active amines in fermented and non-fermented commercial soybean products from the Spanish market. Food Chem. 2015, 173, 1119–1124. [Google Scholar] [CrossRef]
- Duflos, G.; Inglebert, G.; Himber, C.; Degremont, S.; Lombard, B.; Brisabois, A. Validation of standard method EN ISO 19343 for the detection and quantification of histamine in fish and fishery products using high-performance liquid chromatography. Int. J. Food Microbiol. 2018, 288, 97–101. [Google Scholar] [CrossRef]
- Commission Regulation (EC) No. 2073/2005 of 15 November 2005 on microbiological criteria for foodstuffs. Off. J. Eur. Union 2005, L338, 1–26.
- Nishimura, K.; Shiina, R.; Kashiwagi, K.; Igarashi, K. Decrease in polyamines with aging and their ingestion from food and drink. J. Biochem. 2006, 139, 81–90. [Google Scholar] [CrossRef]
- Chiacchierini, E.; Restuccia, D.; Vinci, G. Evaluation of two different extraction methods for chromatographic determination of bioactive amines in tomato products. Talanta 2006, 69, 548–555. [Google Scholar] [CrossRef]
- Al Bulushi, I.; Poole, S.; Deeth, H.C.; Dykes, G.A. Biogenic amines in fish: Roles in intoxication, spoilage, and nitrosamine formation-A review. Crit. Rev. Food Sci. Nutr. 2009, 49, 369–377. [Google Scholar] [CrossRef]
- Papageorgiou, M.; Lambropoulou, D.; Morrison, C.; Kłodzińska, E.; Namieśnik, J.; Płotka-Wasylka, J. Literature update of analytical methods for biogenic amines determination in food and beverages. Trends Anal. Chem. 2018, 98, 128–142. [Google Scholar] [CrossRef] [Green Version]
- Preti, R.; Letizia, M.; Bernacchia, R.; Vinci, G. Fast determination of biogenic amines in beverages by a core—Shell particle column. Food Chem. 2015, 187, 555–562. [Google Scholar] [CrossRef]
- Basheer, C.; Wong, W.; Makahleth, A.; Tameem, A.A.; Salhin, A.; Saad, B.; Lee, H.K. Hydrazone-based ligands for micro-solid phase extraction-high performance liquid chromatographic determination of biogenic amines in orange juice. J. Chromatogr. A 2011, 28, 4332–4339. [Google Scholar] [CrossRef]
- Landete, J.M.; Ferrer, S.; Polo, L.; Pardo, I. Biogenic amines in wines from three Spanish regions. J. Agric. Food Chem. 2005, 53, 1119–1124. [Google Scholar] [CrossRef]
- Li, Z.; Wu, Y.; Zhang, G.; Zhao, Y.; Xue, C. A survey of biogenic amines in chinese red wines. Food Chem. 2007, 105, 1530–1535. [Google Scholar]
- Maintz, L.; Novak, N. Histamine and histamine intolerance. Am. J. Clin. Nutr. 2007, 85, 1185–1196. [Google Scholar] [CrossRef]
- Guo, X.-L.; Li, E.H.; Wang, L.F.; Liu, Q.; Li, X.Y.; Yu, J.; Zhong, W.; Song, Y.D.; Pan, S.Y. Analysis of Biogenic Amines in Pickled Vegetable by a New Pre-column Derivatization of RP-HPLC. Mod. Food Sci. Technol. 2017, 877, 507–512. [Google Scholar]
- Kalač, P.; Švecová, S.; Pelikánová, T. Levels of biogenic amines in typical vegetable products. Food Chem. 2002, 77, 349–351. [Google Scholar] [CrossRef]
- Mietz, J.L.; Karmas, E. Chemical quality index of canned tuna as determined by high-pressure liquid chromatography. J. Food Sci. 1977, 42, 155–158. [Google Scholar] [CrossRef]
- Custódio, F.B.; Theodoro, K.H.; Gloria, M.B.A. Bioactive amines in fresh beef liver and influence of refrigerated storage and pan-roasting. Food Control 2016, 60, 151–157. [Google Scholar] [CrossRef] [Green Version]
- Guebel, D.V.; Torres, N.V. Principal Component Analysis (PCA). Encycl. Syst. Biol. 2013. [Google Scholar] [CrossRef]
- Naila, A.; Flint, S.; Fletcher, G.; Bremer, P.; Meerdink, G. Control of biogenic amines in food—Existing and emerging approaches. J. Food Sci. 2010, 75, 139–150. [Google Scholar] [CrossRef]
Figure 1.
General flow chart for vegetable milks production.

Figure 2.
HPLC-FD chromatograms. (a) Standard solution. (b) Green trace: Barley milk sample, Blue trace: Rice milk sample. 1 β-PEA 2 PUT, 3 CAD, 4 HIS, 5 SER, 6 TYR, 7 SPD, 8 SPM.
Figure 2.
HPLC-FD chromatograms. (a) Standard solution. (b) Green trace: Barley milk sample, Blue trace: Rice milk sample. 1 β-PEA 2 PUT, 3 CAD, 4 HIS, 5 SER, 6 TYR, 7 SPD, 8 SPM.

Figure 3.
Biogenic amine concentration (mg/L) and total biogenic amine content.

Figure 4.
Biogenic Amine Index.

Figure 5.
Scores plot (a) and loadings plot (b) of complete data set. Spelt: Blue, Oat: Orange, Millet: Yellow, Barley: Black, Quinoa: Green, Rice: Grey.
Figure 5.
Scores plot (a) and loadings plot (b) of complete data set. Spelt: Blue, Oat: Orange, Millet: Yellow, Barley: Black, Quinoa: Green, Rice: Grey.

Figure 6.
Scores plot (a) and loadings plot (b) of all samples except barley. Spelt: Blue, Oat: Orange, Millet: Yellow, Quinoa: Green, Rice: Grey.
Figure 6.
Scores plot (a) and loadings plot (b) of all samples except barley. Spelt: Blue, Oat: Orange, Millet: Yellow, Quinoa: Green, Rice: Grey.


Table 1.
Declared cereal concentration (%) of milk samples.
| Milk Sample | % Cereal | Milk Sample | % Cereal |
|---|---|---|---|
| SPELT 1 | 16.0 | BARLEY 1 | 17.0 |
| SPELT 2 | 15.0 | BARLEY 2 | 15.0 |
| SPELT 3 | 15.0 | BARLEY 3 | 17.0 |
| OATS 1 | 14.0 | BARLEY 4 | 15.0 |
| OATS 2 | 11.0 | QUINOA 1 | 8.0 |
| OATS 3 | 10.0 | QUINOA 2 | 8.0 |
| MILLET 1 | 16.0 | QUINOA 3 | 4.0 |
| MILLET 2 | 16.0 | QUINOA 4 | 8.0 |
| MILLET 3 | 15.0 | RICE 1 | 12.5 |
| MILLET 4 | 15.0 | RICE 2 | 12.0 |
| MILLET 5 | 17.0 | RICE 3 | 17.0 |
| RICE 4 | 14.0 |
Table 2.
Mean concentrations (mg/L ± Standard Deviation) and range of biogenic amines by cereal class.
Table 2.
Mean concentrations (mg/L ± Standard Deviation) and range of biogenic amines by cereal class.
| CAD | HIS | TYR | SPD | SPM | TOT BA | BAI | |
|---|---|---|---|---|---|---|---|
| Spelt | 0.77 ± 0.35 | 5.76 ± 0.77 | 0.11 * | n.d. | n.d. | 6.61 ± 0.70 | 6.53 ± 0.73 |
| range | 0.49 − 1.17 | 5.26 − 6.64 | − | − | − | 5.97 − 7.36 | 5.86 − 7.3 |
| Oat | 0.67 ± 0.03 | 7.20 ± 0.77 | n.d. | 0.57 ± 0.11 | 0.13 ± 0.03 | 8.58 ± 0.66 | 4.66 ± 0.79 |
| range | 0.64 − 0.71 | 6.59 − 8.06 | - | 0.46 − 0.69 | 0.1 − 0.17 | 7.99 − 9.29 | 4.07 − 5.56 |
| Millet | 0.17 ± 0.05 | 7.47 ± 0.85 | 0.17 ± 0.05 | n.d. | n.d. | 7.72 ± 0.86 | 7.58 ± 0.90 |
| range | n.d. − 0.23 | 6.14 − 8.37 | n.d. − 0.25 | − | − | 6.47 − 8.72 | 6.22 − 8.60 |
| Barley | 3.10 ± 1.63 | 2.55 ± 0.86 | 0.43 ± 0.15 | 0.21 ± 0.10 | 0.12 ± 0.02 | 5.11 ± 3.01 | 3.20 ± 1.81 |
| range | 1.47 − 5.36 | n.d. − 3.15 | 0.28 − 0.62 | n.d. − 0.31 | n.d. − 0.14 | 1.92 − 8.32 | 1.27 − 5.21 |
| Quinoa | 0.60 ± 0.07 | 7.10 ± 0.41 | 0.16 ± 0.05 | n.d. | 0.12 ± 0.02 | 7.98 ± 0.50 | 6.88 ± 0.30 |
| range | 0.52 − 0.68 | 6.77 − 7.69 | 0.10 − 0.22 | − | n.d. − 0.14 | 7.46 − 8.67 | 6.68 − 7.32 |
| Rice | 0.15 ± 0.09 | 4.90 ± 2.00 | 0.14 * | n.d. | 0.15 ± 0.02 | 5.18 ± 1.97 | 4.68 ± 2.19 |
| range | n.d. − 0.25 | 3.10 − 7.44 | − | − | n.d. − 0.17 | 3.51 − 7.77 | 2.78 − 7.33 |
(n.d. = not detected, * found in one sample).
Table 3.
One-way ANOVA: p-values 1.
| Milk Sample | CAD | HIS | TYR | SPD | SPM | TOT BA | BAI |
|---|---|---|---|---|---|---|---|
| Barley-Millet | <0.0001 | <0.0001 | 0.0001 | - | 0.1398 | 0.0192 | <0.0001 |
| Barley-Rice | <0.0001 | 0.0005 | <0.0001 | - | 0.4689 | 0.3356 | 0.0089 |
| Barley-Quinoa | 0.0001 | <0.0001 | 0.0004 | - | 0.6063 | 0.0170 | 0.0002 |
| Barley-Oat | 0.0003 | <0.0001 | <0.0001 | 0.0060 | 0.4164 | 0.0108 | <0.0001 |
| Barley-Spelt | 0.0004 | 0.0002 | <0.0001 | - | - | 0.1513 | 0.0001 |
| Rice-Millet | 0.9982 | 0.0152 | 0.3533 | - | 0.0674 | 0.0613 | 0.0038 |
| Rice-Oat | 0.3115 | 0.0489 | 0.3970 | - | 0.9310 | 0.0312 | 0.0468 |
| Rice-Quinoa | 0.3355 | 0.0424 | 0.2401 | - | 0.8000 | 0.0517 | 0.0783 |
| Rice-Spelt | 0.2337 | 0.4413 | 0.9916 | - | - | 0.3356 | 0.0486 |
| Oat-Spelt | 0.8598 | 0.2295 | 0.4021 | - | - | 0.2211 | 0.0009 |
| Oat-Quinoa | 0.9017 | 0.9299 | 0.0642 | - | 0.7298 | 0.6858 | 0.0012 |
1 The means of couples with p-values < 0.05 are statistically different (bolded), pairs with no significant differences are not shown.
© 2019 by the authors. Licensee MDPI, Basel, Switzerland. This article is an open access article distributed under the terms and conditions of the Creative Commons Attribution (CC BY) license (http://creativecommons.org/licenses/by/4.0/).
Share and Cite
MDPI and ACS Style
Gobbi, L.; Ciano, S.; Rapa, M.; Ruggieri, R. Biogenic Amines Determination in “Plant Milks”. Beverages 2019, 5, 40. https://doi.org/10.3390/beverages5020040
AMA Style
Gobbi L, Ciano S, Rapa M, Ruggieri R. Biogenic Amines Determination in “Plant Milks”. Beverages. 2019; 5(2):40. https://doi.org/10.3390/beverages5020040
Chicago/Turabian StyleGobbi, Laura, Salvatore Ciano, Mattia Rapa, and Roberto Ruggieri. 2019. "Biogenic Amines Determination in “Plant Milks”" Beverages 5, no. 2: 40. https://doi.org/10.3390/beverages5020040
Note that from the first issue of 2016, this journal uses article numbers instead of page numbers. See further details here.