
Seismic Vulnerability Assessment of Portuguese Adobe Buildings


1
RISCO, Research Centre for Risks and Sustainability in Construction, Civil Engineering Department, Campus Universitário de Santiago, University of Aveiro, 3810-193 Aveiro, Portugal
2
Universidade Fernando Pessoa, Praça de 9 de Abril 349, 4249-004 Porto, Portugal
3
Department of Civil Engineering, Campus de Azurém, University of Minho, ISISE, 4800-058 Guimarães, Portugal
*
Author to whom correspondence should be addressed.
Buildings 2021, 11(5), 200; https://doi.org/10.3390/buildings11050200
Submission received: 6 April 2021
/
Revised: 3 May 2021
/
Accepted: 7 May 2021
/
Published: 10 May 2021
(This article belongs to the Special Issue Seismic Performance Assessment of Buildings)
Abstract
:Adobe construction represents 5.3% of the total Portuguese building stock according to the latest National Housing Census. The distribution of these adobe buildings is scattered across the country, with higher density in the central region and in Algarve in the south, where the seismic hazard is highest. A large proportion of these buildings are still in use for residential and commercial purposes and are of historical significance, contributing to the cultural heritage of the country. Adobe buildings are known to exhibit low seismic resistance due to their brittle behavior, thus making them vulnerable to ground shaking and more prone to structural damage that can potentially cause human fatalities. Three buildings with one-story, two-stories, and two-stories plus an attic were numerically modeled using solid and contact elements. Calibration and validation of material properties were carried out following experimental results. A set of 30 ground motion records with bi-directional components were selected, and non-linear time-history analyses were performed until complete collapse occurred. Two novel engineering demand parameters (EDPs) were used, and damage thresholds were proposed. Finally, fragility and fatality vulnerability functions were derived. These functions can be used directly in seismic risk assessment studies.
1. Introduction
In this study, the seismic vulnerability assessment of three Portuguese adobe buildings was conducted to derive fragility and fatality vulnerability functions, which can be used to estimate losses due to earthquakes. Over the past centuries, Portugal has experienced numerous earthquakes; a lesser-known event from the 18th century, the 1722 Algarve earthquake, occurred 33 years before the well-known great 1755 Lisbon earthquake and tsunami, and caused widespread damage in Algarve. More recent events in Portugal such as the 1909 Mw 6.0 Benavente earthquake, the 1969 Mw 8.0 Algarve earthquake, and the 1980 Mw 6.8 Azores earthquake are examples of events where significant damage was observed. The 1909 Benavente earthquake, despite its recorded moderate magnitude (Mw 6.0), is known to be the largest crustal earthquake in the Iberian Peninsula [1]. It occurred around a period during which the Art Nouveau movement was gaining popularity in the central region, and adobe constructions were in vogue. According to a post-earthquake survey report of the 1909 Benavente earthquake [2], 879 buildings were damaged: 20% reported light damage, 40% reported moderate damage, and the remaining 40% were completely damaged. Furthermore, there were severe casualties that resulted in 46 deaths, out of which 30 were from the village of Benavente. The direct and indirect consequences of this event played an important role in influencing the local seismic building culture.
The majority of the past studies regarding the seismic vulnerability of adobe buildings were focused on the South American building stock. Tarque et al. [3] developed analytical fragility functions following the displacement-based earthquake loss assessment (DBELA) methodology [4] for commonly found one story buildings from Peru. Ahmad et al. [5] broadly proposed fragility functions for a range of commonly found buildings, including adobe structures in Pakistan. A study focused broadly on the South American building stock [6] developed fragility functions for unreinforced masonry with adobe blocks, using single-degree-of-freedom (SDoF) oscillators to model the response of the buildings. Recently, Martins and Silva [7] developed analytical fragility and vulnerability functions using censored cloud regression analysis, for one, two, and three-story adobe buildings. Finally, Sumerente et al. [8] developed fragility functions, combining in-plane and out-of-plane loading conditions, for typical one- and two-story adobe buildings in Peru.
According to Abeling and Ingham [9], the building volume loss is considered a better damage descriptor for estimating risk to occupants as compared to traditional damage states because it can be directly correlated with earthquake fatalities. Such data is essential to better estimate earthquake-related risk and losses, thus minimizing economic losses and mitigating fatalities. The fragility and vulnerability functions of the Portuguese adobe buildings with one-story, two-stories, and two-stories plus an attic were derived following the steps listed below.
- Building surveys that contained well-documented evidence such as building schematics and descriptions of the buildings were examined. However, due to the scarcity of a large dataset specific to adobe buildings, three buildings with one archetype per building class of one-story, two-stories, and two-stories plus an attic were selected for the case study presented herein.
- These selected buildings were numerically modeled using the advanced finite element method-based software LS-DYNA [10]. These models were tested by following experimental validation and a series of sensitivity analyses to check the influence of various parameters.
- A set of 30 bi-directional ground motion records were selected based on the peak ground acceleration (PGA) as the intensity measure (IM), and used to perform several non-linear time-history analyses until the complete collapse of the buildings.
- To derive the fragility functions, two novel engineering demand parameters (EDPs)—namely the crack propagation ratio (CPR) and volume loss ratio (VLR)—were selected, and damage thresholds were proposed such that they can be correlated with the damage classifications of the European Macroseismic Scale (EMS-98) [11].
- The fragility functions were derived using the well-established cloud analysis [12] to quantify physical structural damage due to a given IM.
- Furthermore, a fatality vulnerability function was derived to estimate indoor fatalities.
2. Characterization of Adobe Buildings in Portugal
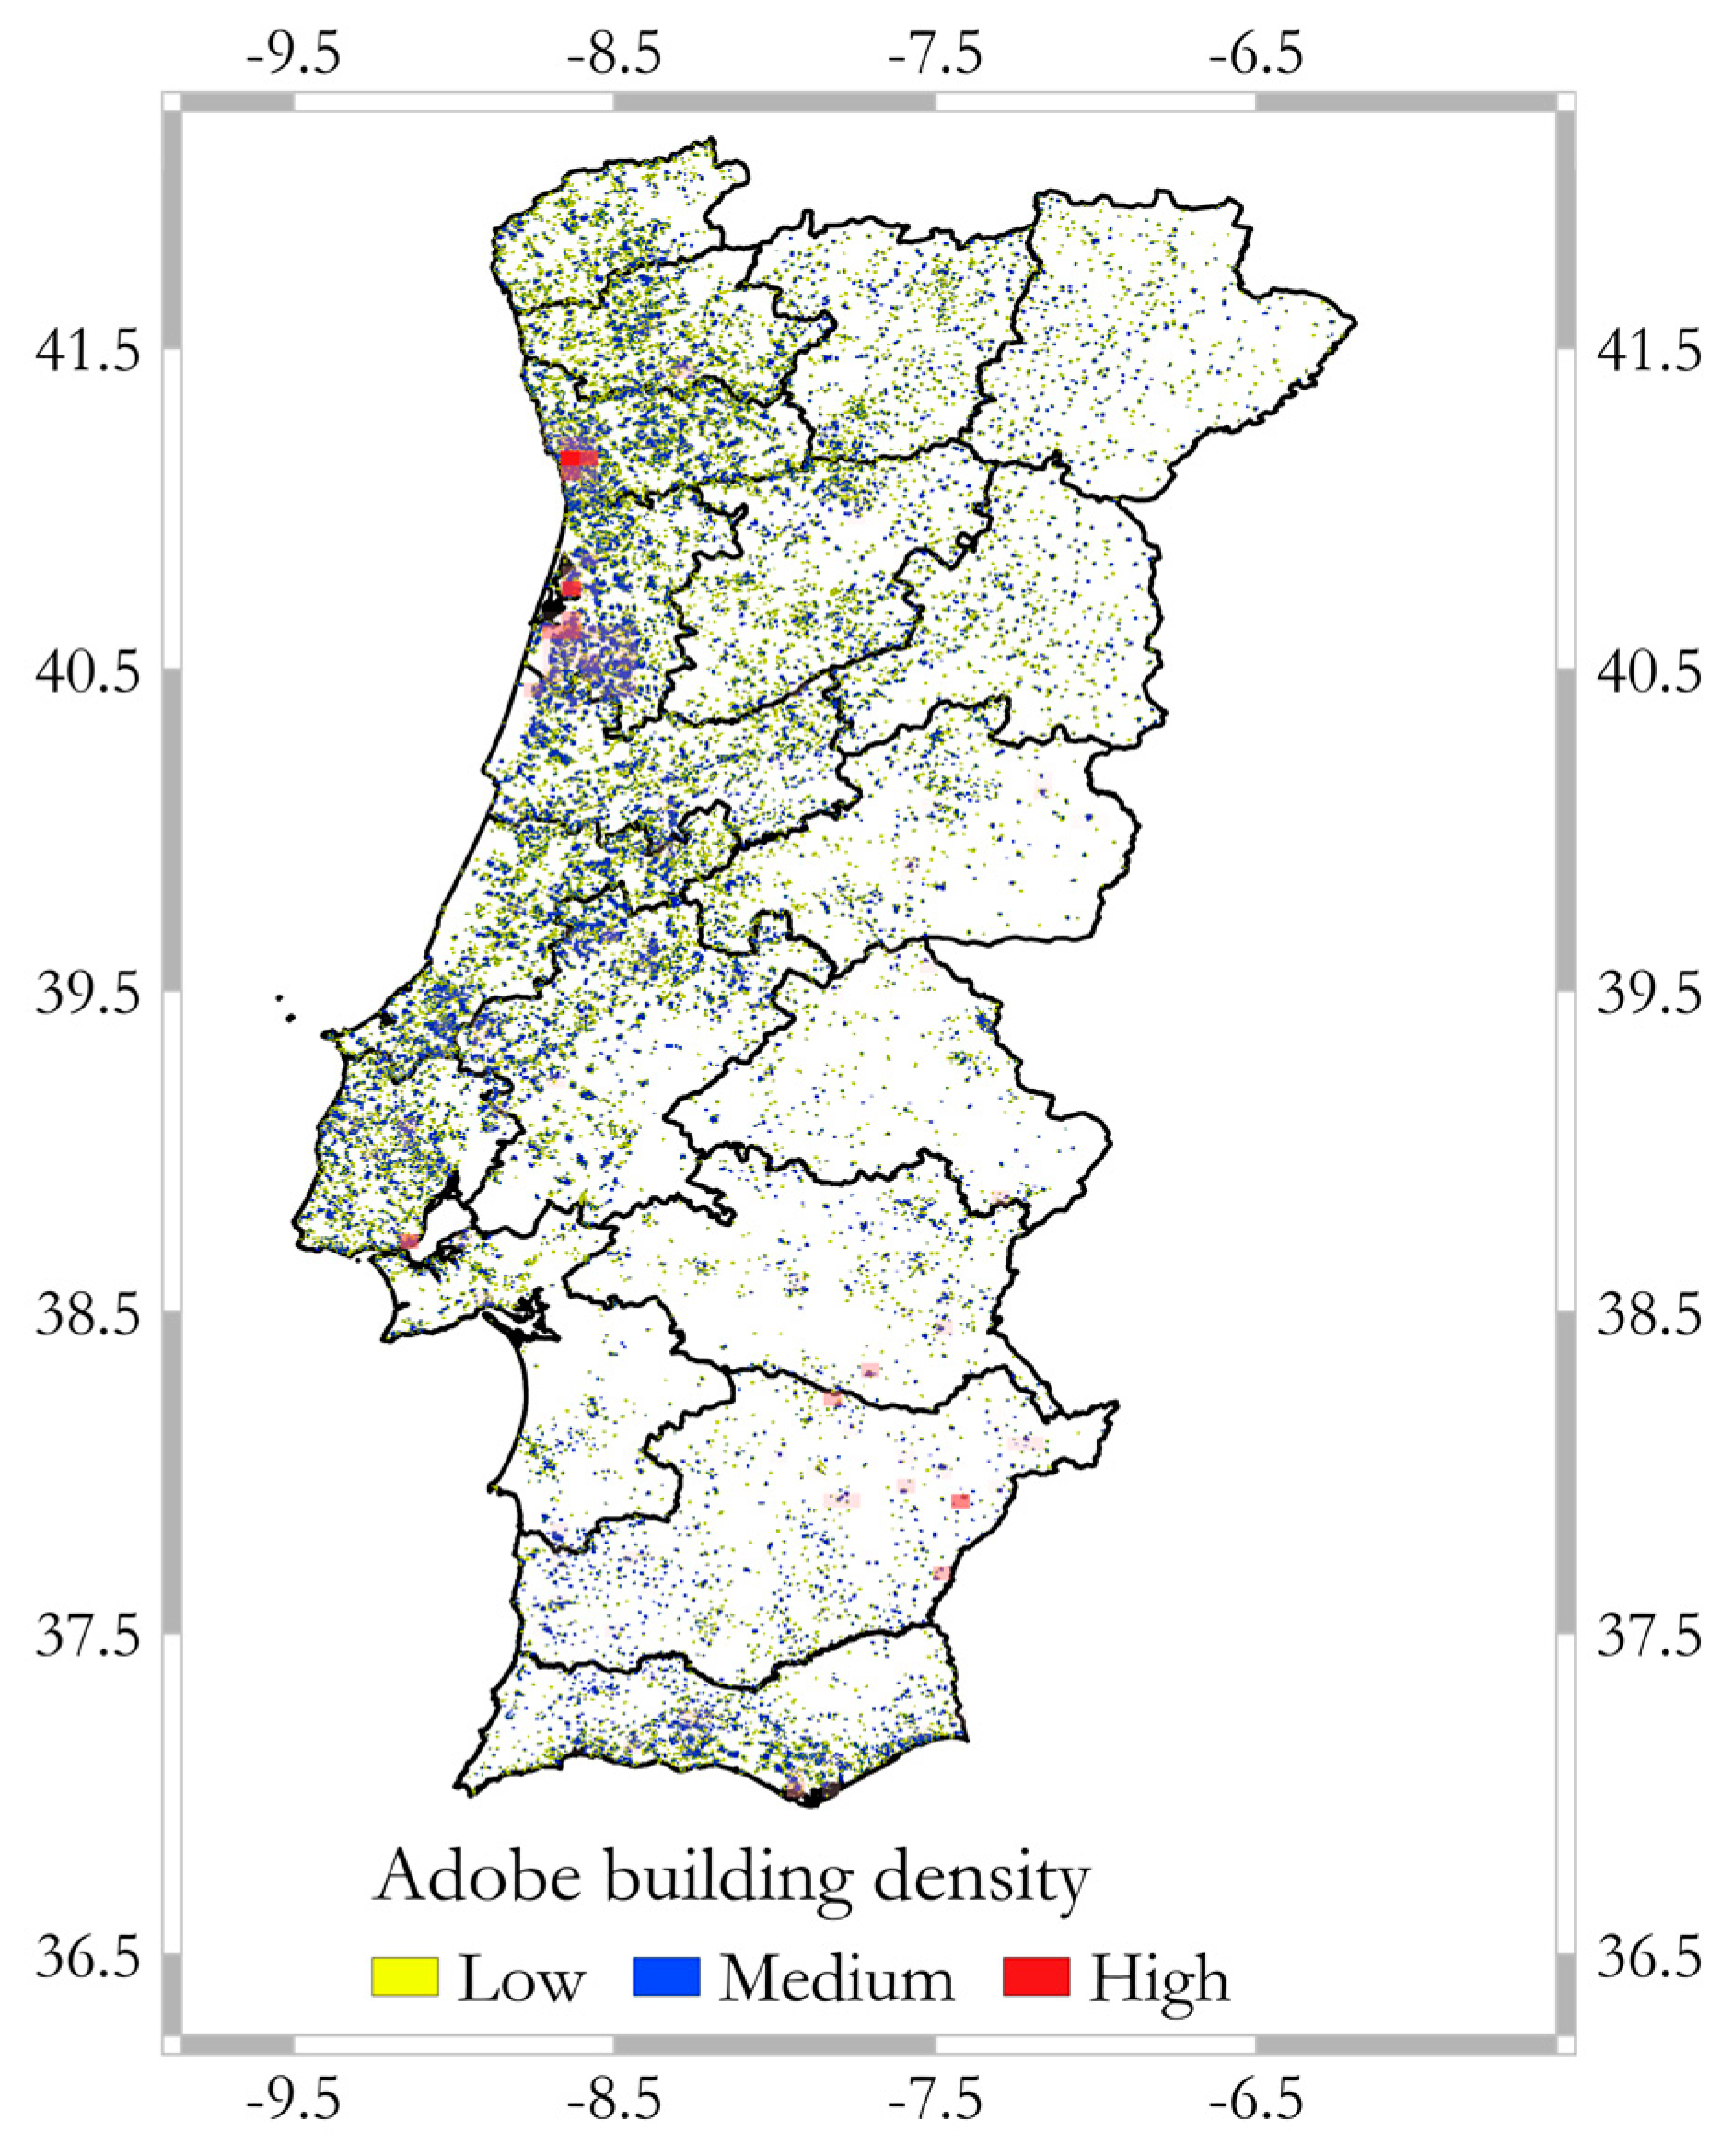
According to the 2011 Population and Housing Census of Portugal (INE) [13], the total building stock of Portugal comprises 3,353,610 buildings, out of which the adobe building stock amounts to 178,422 buildings, i.e., about 5.32% of the whole Portuguese building stock (Figure 1).
In Portugal, earthen materials have been used to construct loadbearing walls in the form of adobe or rammed earth for the construction of buildings, especially in the central and southern regions of the country. Locally, earth-based building materials are divided into three different types of building techniques: rammed earth, known as “taipa”; wattle-and-daub, “tabique”; and adobe [14]. Currently, there is a lack of reliable vulnerability models for adobe buildings in Portugal. In this study, the advances in computational modeling capabilities were utilized for the development of sophisticated numerical models that can simulate the complete collapse of a full-scale building subjected to bi-directional loading and are capable of predicting crack propagation and volume loss. As previously mentioned, there are many adobe buildings in the central and southern part of the country, due to the existence of sandy soils and the presence of lime, which has been reported to be used as a stabilizing agent. It can be observed that the central region of Portugal has the highest density of adobe buildings, since it was the prevailing construction system adopted for the first half of the 20th century [15] and the legacy from the patrimony built in that period is still significant. As part of the endeavor towards the preservation of the inheritance and cultural heritage of the country, from the historical past to the present, adobe buildings irrespective of the grandeur or simplicity are extremely important. In fact, many patrimonial buildings of high historical, cultural, and architectural value [16] are still in a reasonable conservation state [17]. The factor that led to the upsurge in adobe as a construction material of choice, especially in the central region, is credited to the Art Nouveau movement that spread across Europe in various forms. This movement had a significant influence in some Portuguese cities [18], particularly in Aveiro, where it is estimated that 30–40% of the buildings are still adobe buildings [19]. The Southern region of Algarve, where the seismic hazard is relatively high [20], has a high density of adobe buildings, as shown in Figure 1.
Database of Adobe Buildings Information
An appropriate selection of the buildings to be modeled depends largely on the availability of building survey data containing documented evidence with building schematics, dimensions, and detailing with photographs that can be consulted to infer information about the exterior walls, interior walls, openings, lintel beams, roofing systems, attic, and features such as gable end walls.
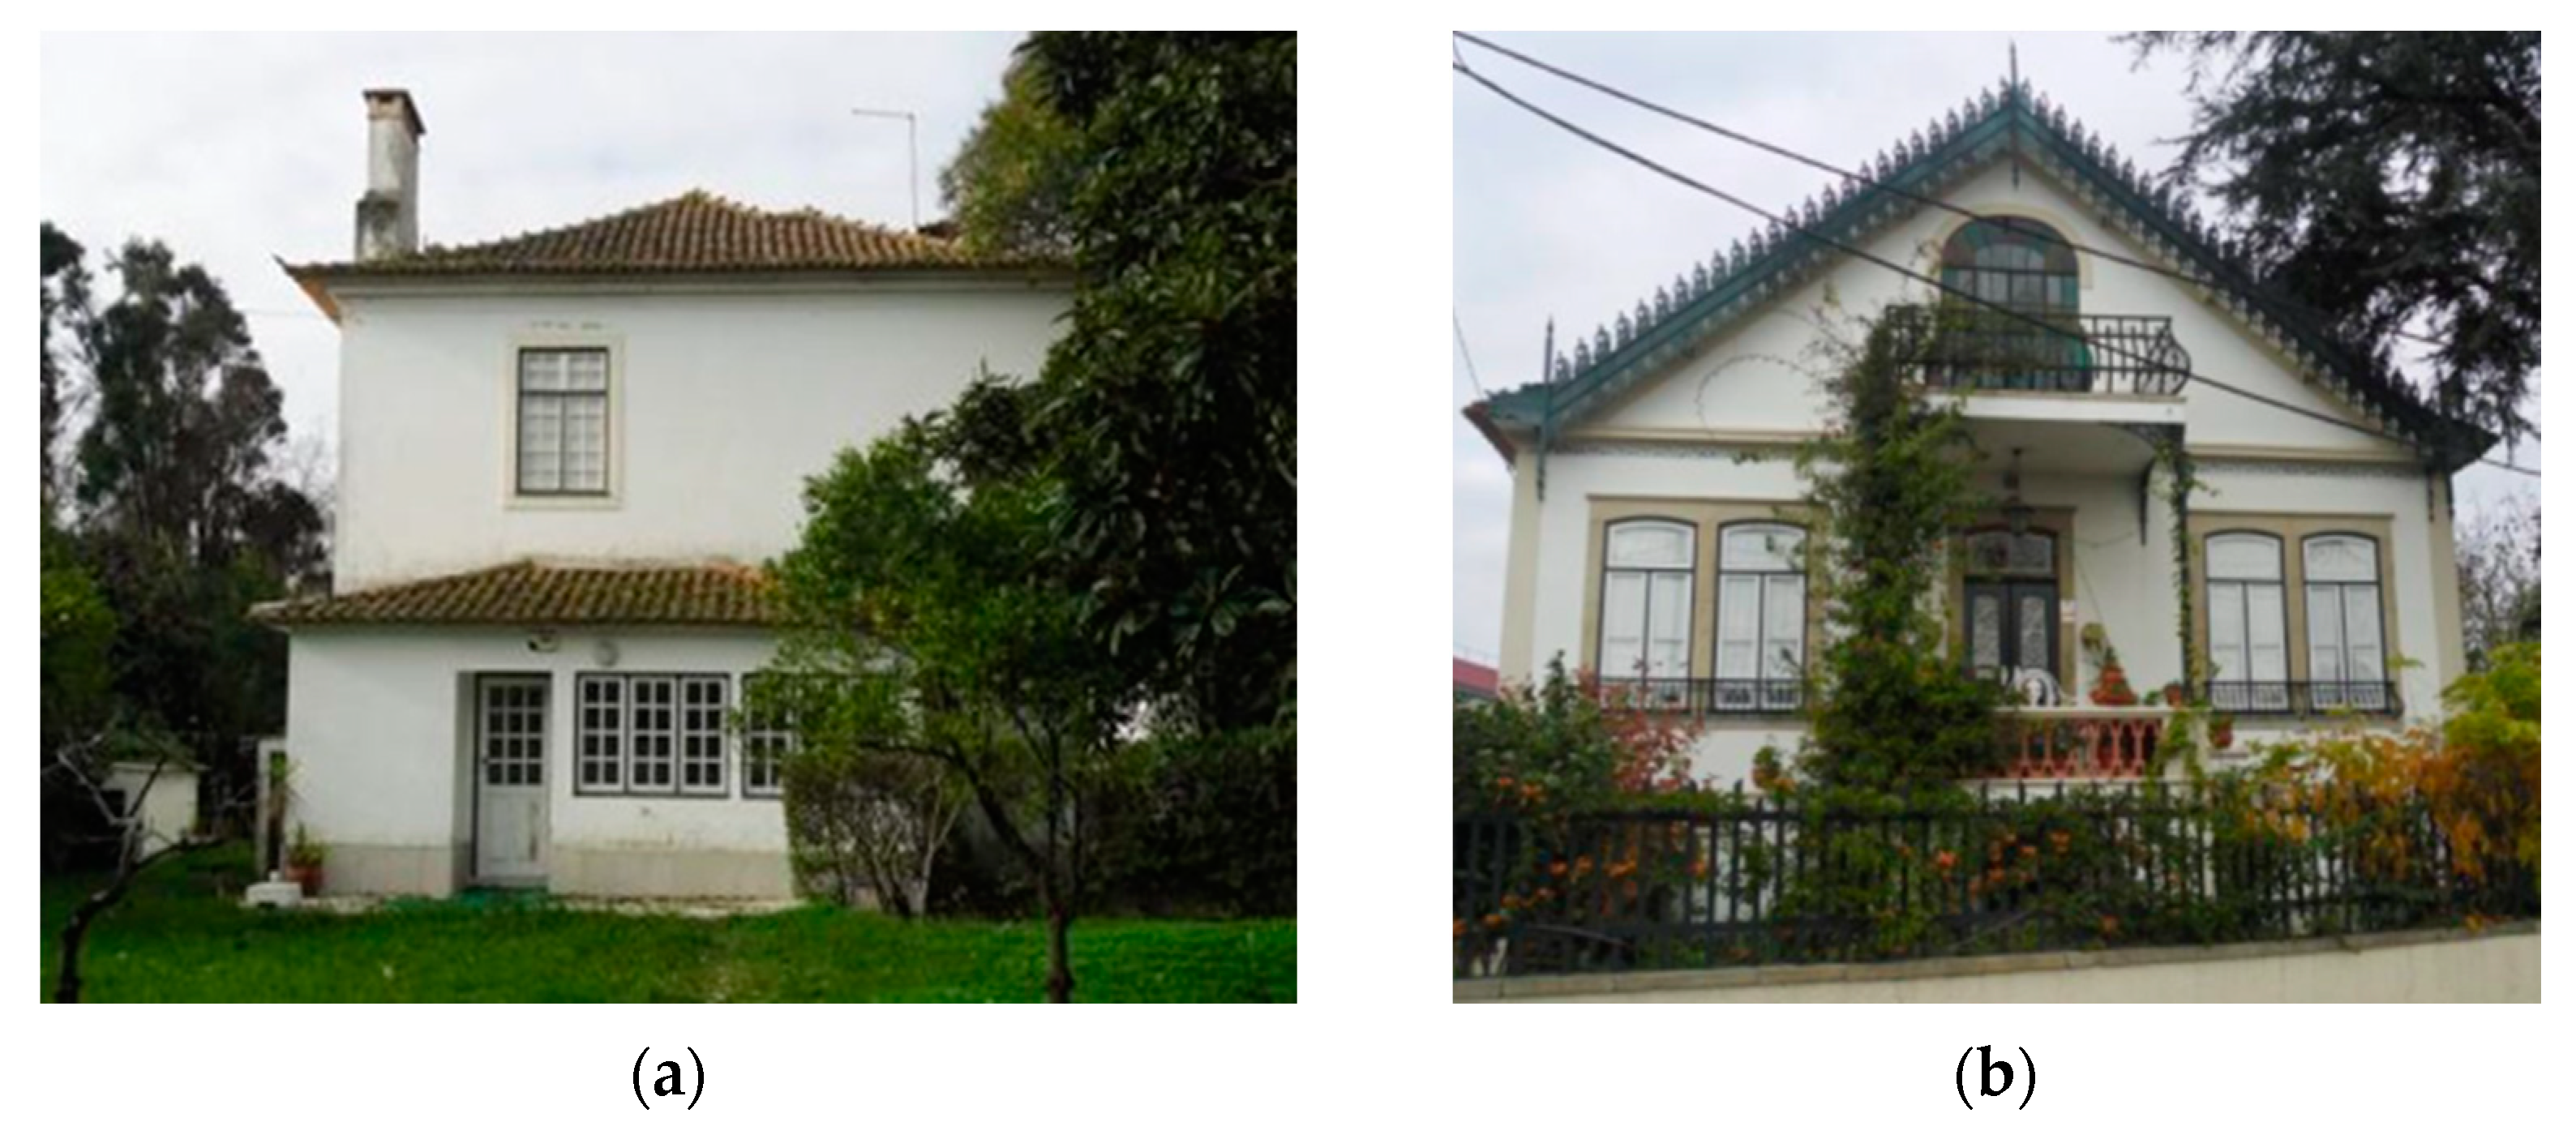
Three building surveys pertaining to earth-based buildings in continental Portugal were examined in this study, namely, the Algarve survey report [21], the Alentejo survey report [22], and the survey of façade walls in Aveiro [19]. From these surveys, it was concluded that it was essential to segregate these earthen buildings according to the primary, secondary, and tertiary construction material that was used to build the external walls and then the internal walls, respectively. The surveys reported a vast amount of buildings constructed using taipa as both their primary and secondary construction material, along with some buildings that used adobe and tabique as the secondary and tertiary construction materials for internal walls. From these surveys, we selected a one-story building with gable end walls in which both the primary and secondary construction material used was adobe. The selection of buildings with two and more stories was carried out following studies [23] that were archived at the University of Aveiro’s database, which documented detailed building drawings constructed with adobe as the primary construction material. It is noteworthy to mention that these buildings, located in the municipality of Ílhavo, are currently in use, as shown in Figure 2a,b.
3. Case Study Buildings—Geometrical and Material Properties
The information obtained from the documented evidence discussed in Section 2 was studied in detail and incorporated in the LS-DYNA software environment to build the numerical models and perform the vulnerability assessment of the three selected case study buildings, namely Buildings 1–3.
3.1. Geometrical Properties
The selected buildings are unique buildings due to their geometrical properties such as exterior wall thickness, story or inter-story heights, total area, percentage of openings, and building features such as lintel beams and gable-end walls. Each case study building is described below.
3.1.1. Building 1
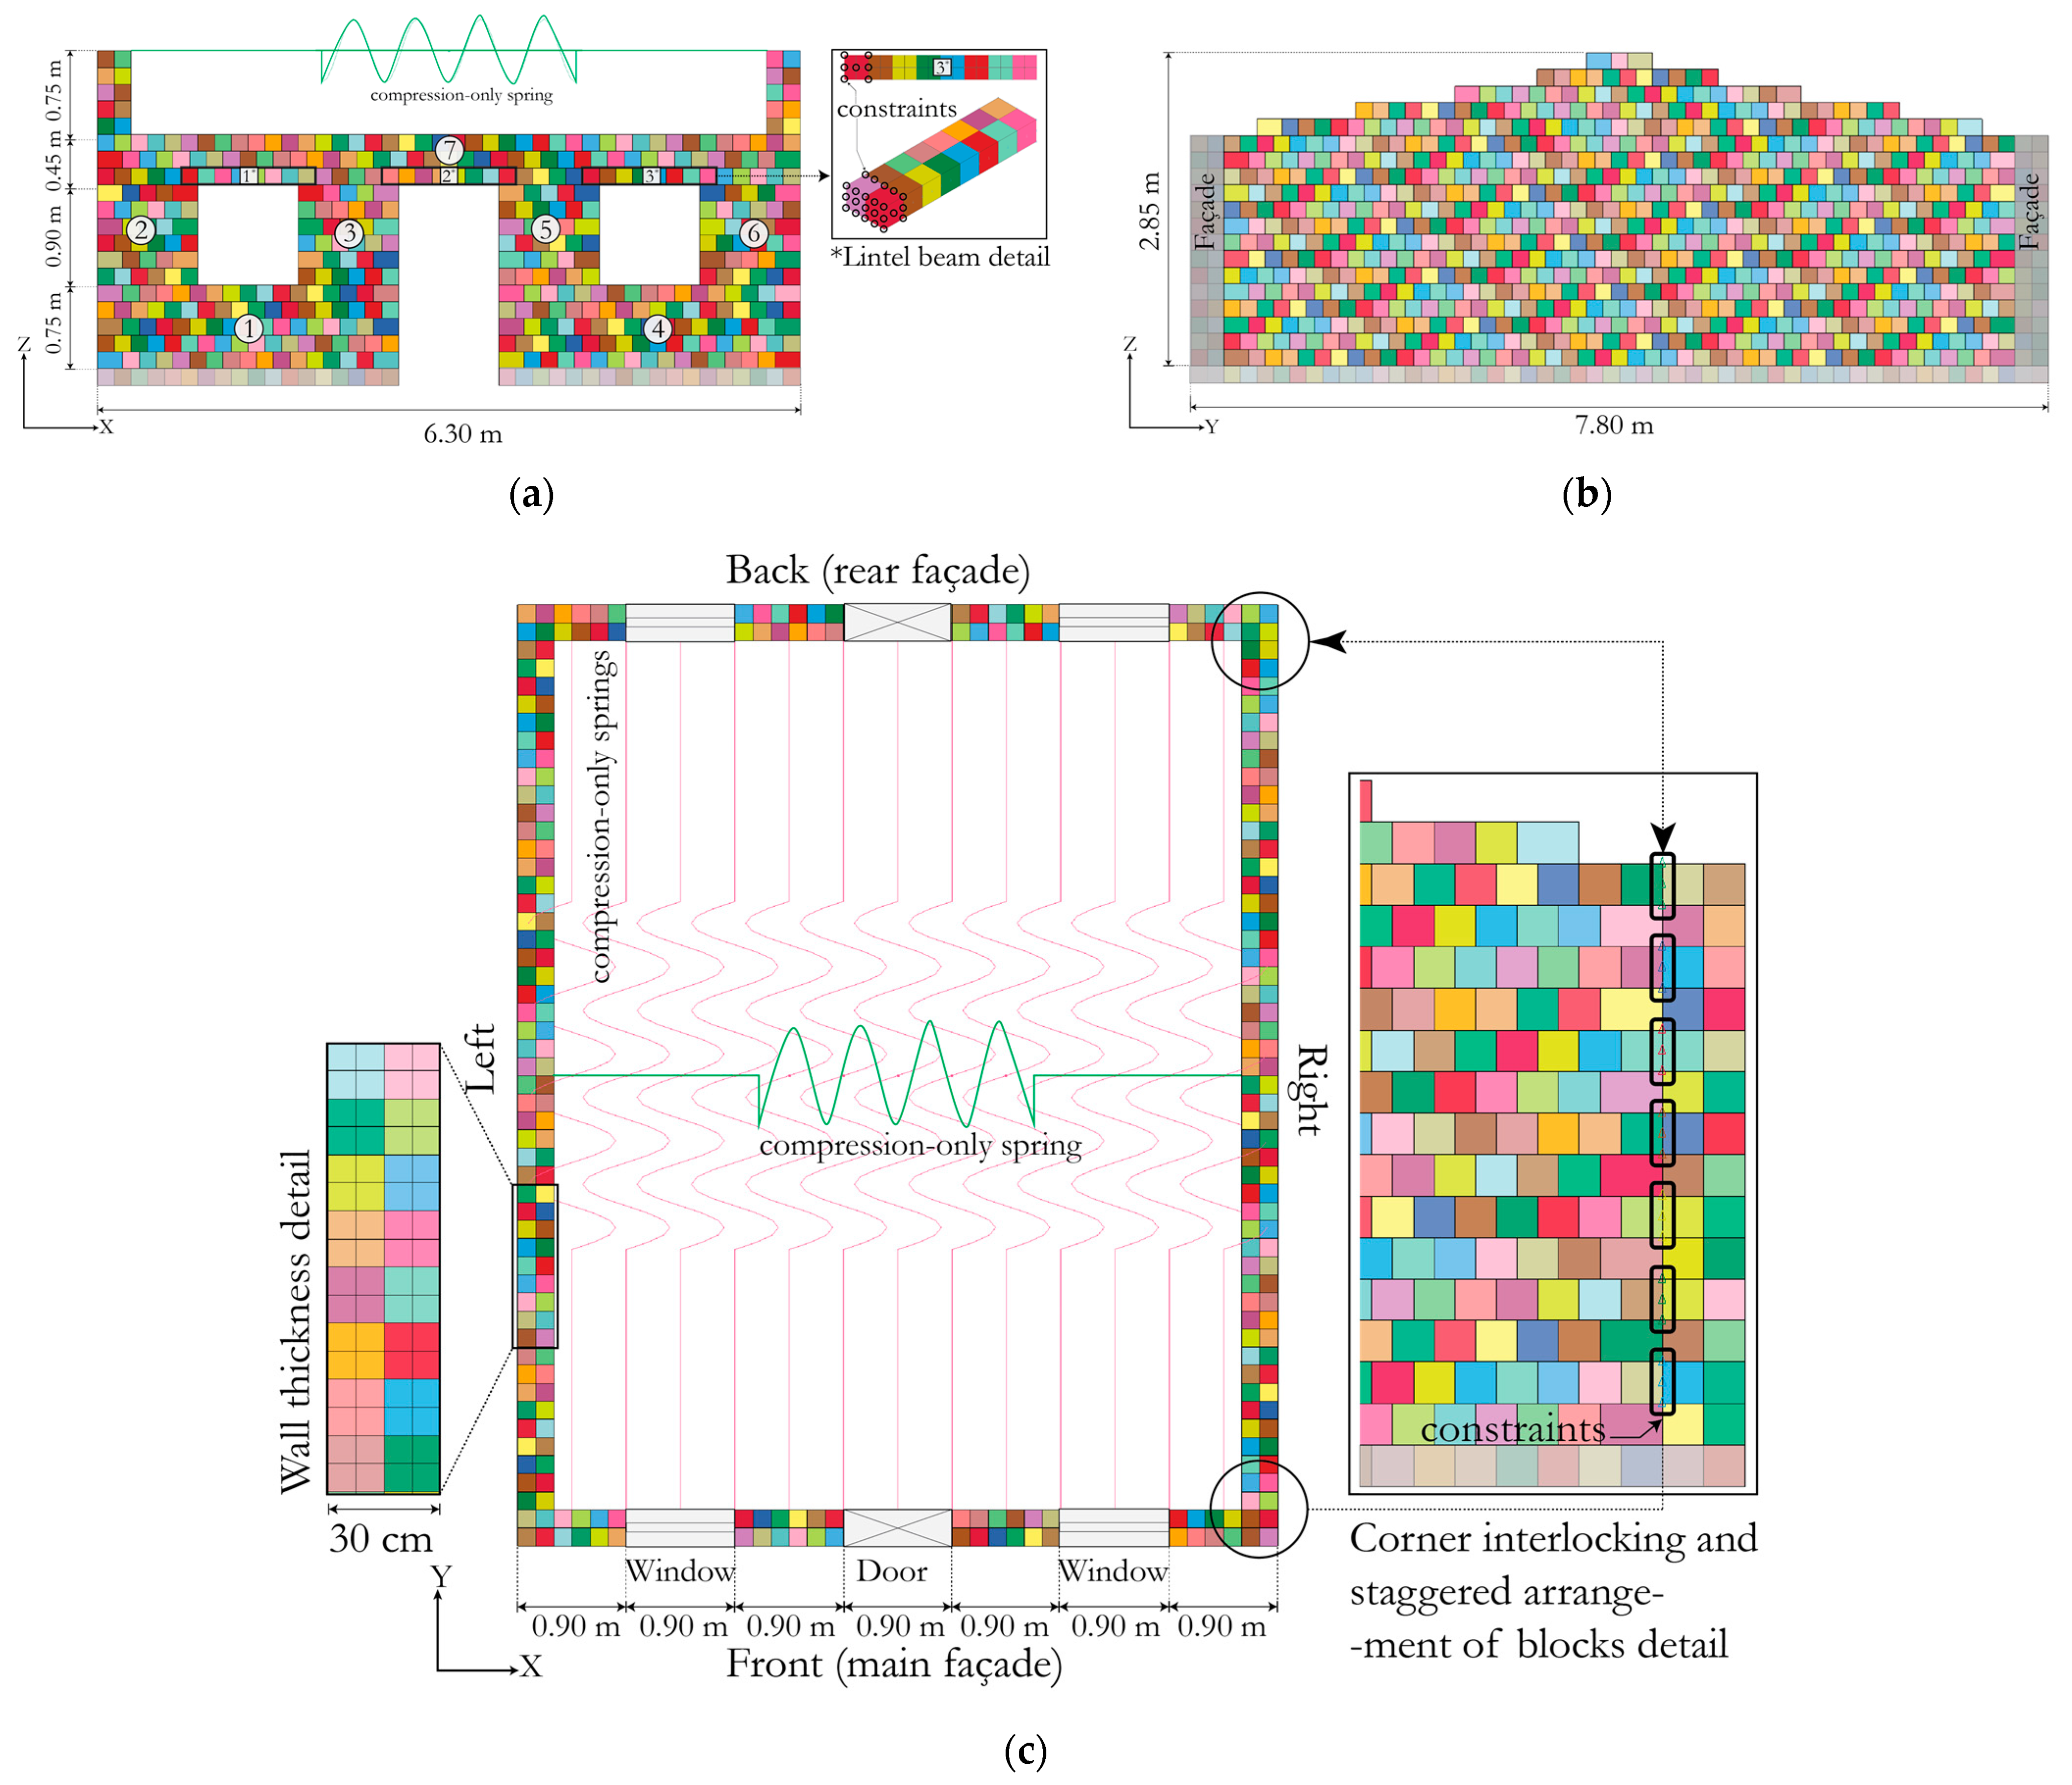
This one story building with gable-end walls, was located in the county Castro Marim in Algarve was utilized for residential purposes, but was abandoned at the time of the survey. Its floorplan is rectangular, and it is divided into four compartments. The primary and secondary construction material is adobe, and the external walls are 30 cm thick, remaining constant along the height of the building. The thickness of the walls was modeled by adopting a “two-parts” scheme in order to avoid computational instabilities, as shown in Figure 3c. The internal walls are 15 cm thick and divide the various compartments of the building. However, for simplifying the numerical models and reducing the computational cost, these internal walls were not modeled in this study. The main façade has a door and two windows on either side. Each visible multicoloured block is termed as a ‘part’, and these different parts constitute the prisms that are numbered from 1–7, as depicted in Figure 3a. The interlocking of blocks was modeled by arranging them in a staggered pattern, and the addition of constraints at the intersections simulate the interlocking of two orthogonal walls, as shown in Figure 3c. Since buildings are built using lintel beams, these elements were included above the openings in the numerical models. These are elastic members constituted by a set of blocks whose nodes are constrained at the edges in the x, y, and z directions, as shown in Figure 3a. These are structural components that are important to model, as they play an important role in preventing the onset of premature collapse mechanisms due to seismic loading. The gable-end walls compose both the left and right façades of the building and do not have any openings, as shown in Figure 3b. The roof is composed of simple wood beams and trusses, which support the ceramic roofing tiles. The beams of the roofing system were modeled using a discrete element with compression-only springs added in the two orthogonal directions with equal spacing, as shown in Figure 3a,c. The mechanical properties of the wooden beams of the roofing system were defined according to prescriptions from Eurocode 5 [24]. The dimensions of the building are summarized in Table 1, and the geometrical details and features that have been modeled in the LS-DYNA environment are shown in Figure 3a–c. Further details pertaining to numerical modeling are discussed in Section 4.
3.1.2. Building 2
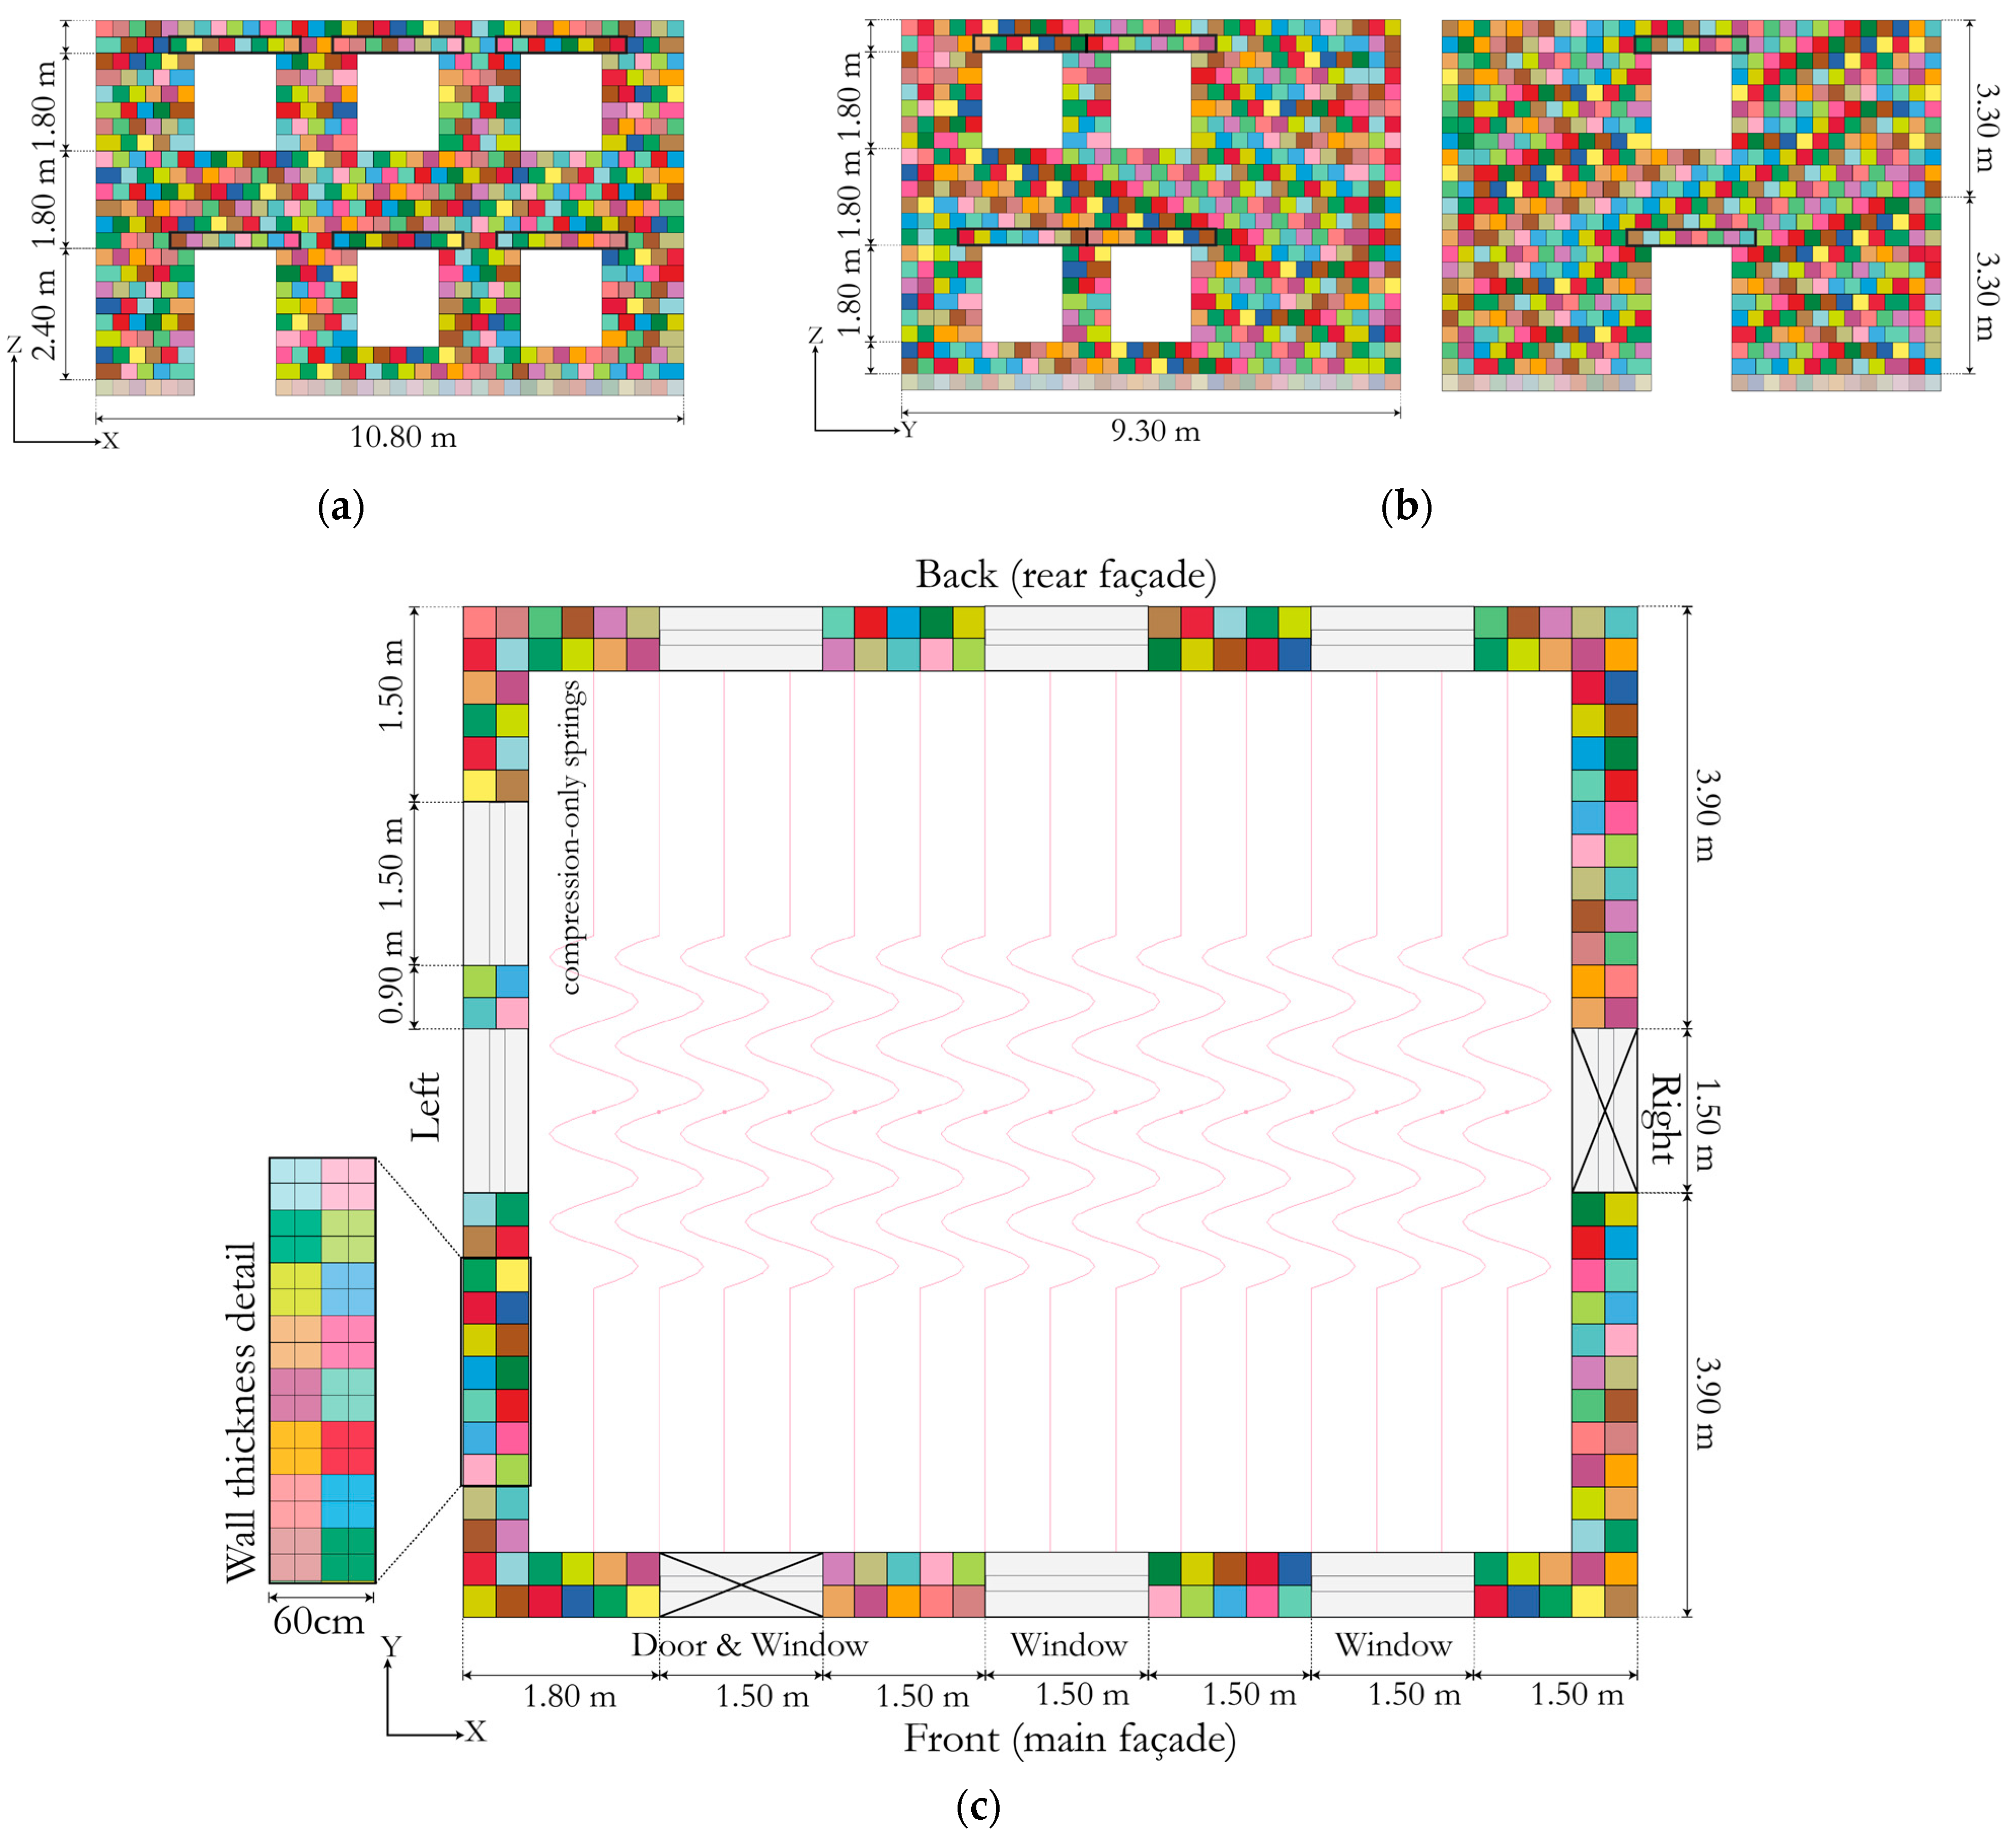
The two-story residential building is located in the municipality of Ílhavo and is currently in use (see Figure 2a). Its floorplan is rectangular and composed of a ground and first floor with equal inter-story heights. The primary construction material is adobe, while the external walls are 60 cm thick as a constant throughout the entire height of the building. The interior walls are 15 cm thick and were built using a secondary construction material (tabique). These thin tabique internal walls have a much lower structural capacity when compared to the thick adobe external walls. For this reason, as well as to reduce the computational demand of the numerical models, these elements were not modeled in this study. Nonetheless, a recent study by Battaglia et al. (2020) [25] indicates that tabique walls can lead to a slight reduction in the structural capacity. Each of the façades has multiple openings, as presented in Figure 4a,b. The lintel beams were modeled above each of the openings, as previously described. The roof is composed of simple wood beams and trusses, which support the ceramic roofing tiles. The beams of the roofing system were modeled using a discrete element with compression-only springs in one direction, as shown in Figure 4c. The mechanical properties of the wooden beams of the roofing system were defined according to prescriptions from Eurocode 5 [24]. The dimensions of the building are summarized in Table 1, and the geometrical details are shown in Figure 4a–c. Further details pertaining to numerical modeling are discussed in Section 4.
3.1.3. Building 3
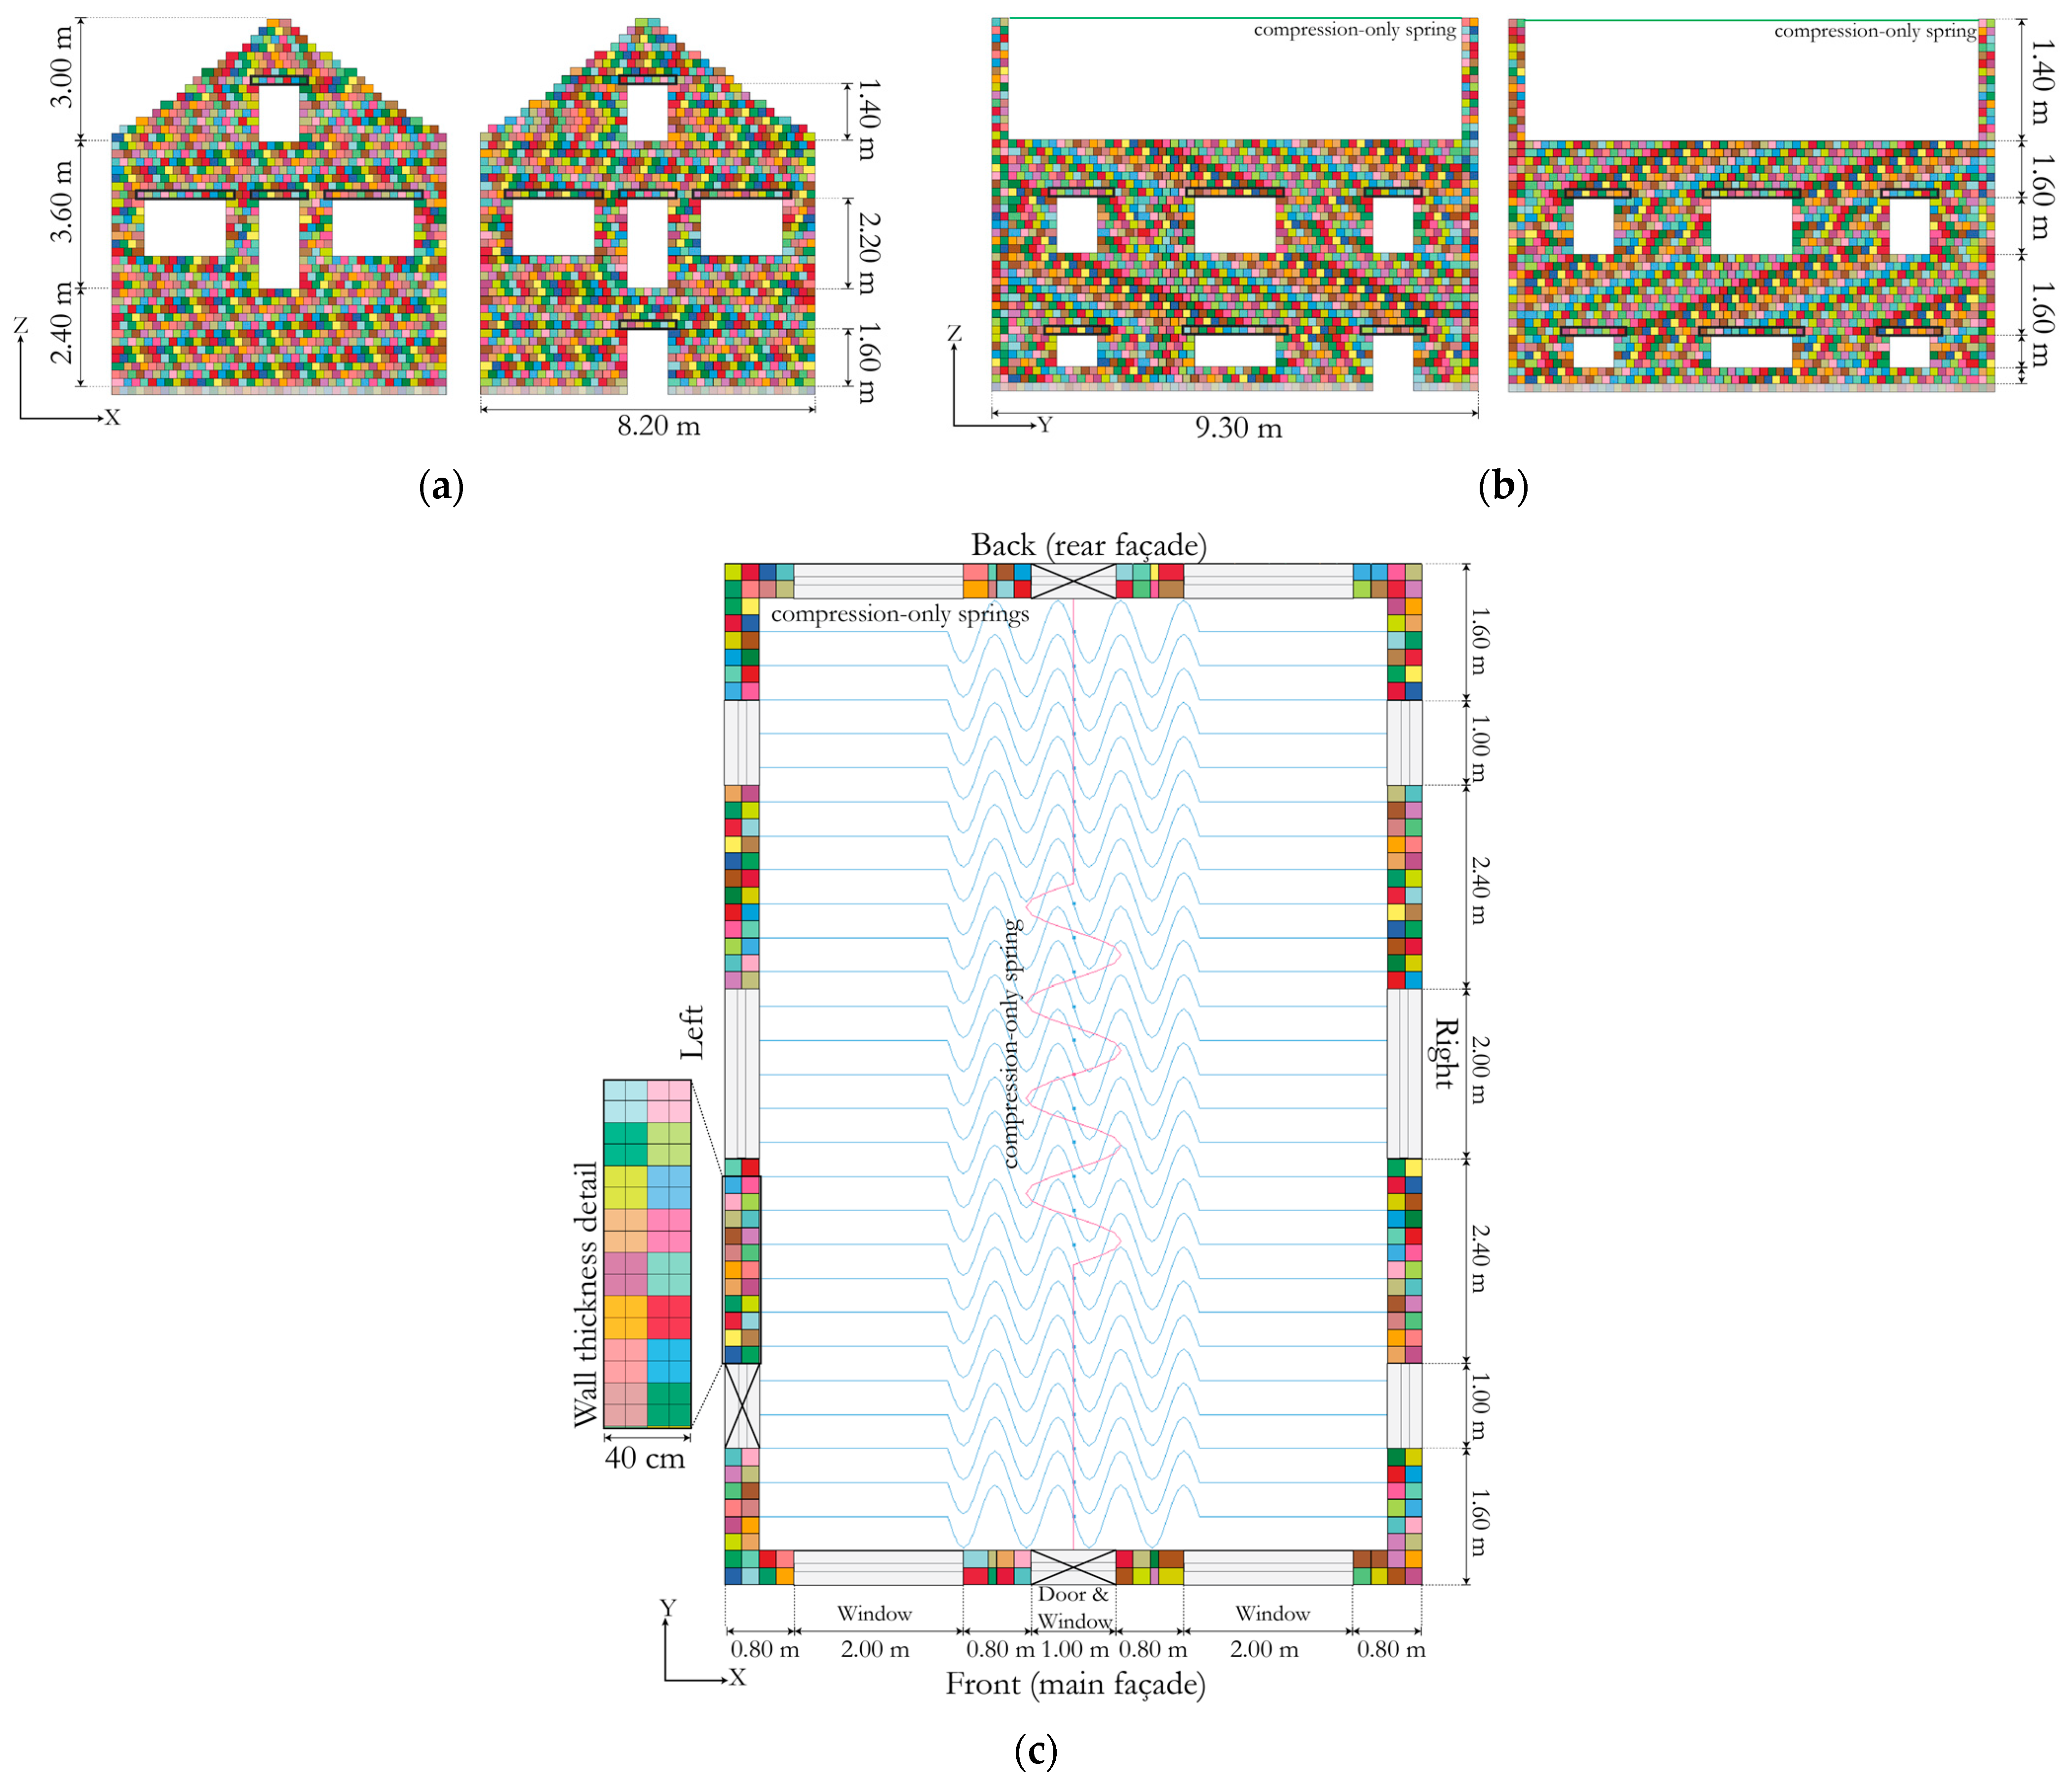
The two-story plus attic with gable-end walls is a residential building also located in the municipality of Ílhavo. Similar to Building 2, this one is also currently in use (see Figure 2b). Its floorplan is rectangular and is composed of a basement which serves as a storage and a wine-cellar with a lower height than the other two stories, a habitable first floor with multiple compartments, and an attic at the top. The primary construction material is adobe. The external walls are 40 cm thick, which is constant throughout the entire height of the building. The interior walls are 15 cm thick and were built using a secondary construction material (tabique); these walls were not numerically modeled for the reasons described for Building 2. Each of the façades has multiple openings, as shown in Figure 5a,b. The lintel beams were modeled above each of the openings, as mentioned previously. In the basement level, there are windows that are fixed and unopenable, serving only for lighting, whereas the above story and attic have openable windows that are used for lighting and ventilation. The flooring system consists of wooden beams that are equally spaced at 40 cm and the roof that consists of wooden trusses. The beams of the roofing system were modeled using a discrete element with compression-only springs added in the two orthogonal directions with equal spacing as shown in Figure 5a,c. The mechanical properties of the wooden beams of the roofing system were defined according to prescriptions from Eurocode 5 [24]. The dimensions of the building are summarized in Table 1, and the geometrical details are shown in Figure 5a–c. Further details pertaining to numerical modeling are discussed in Section 4.
3.2. Material Properties
The study of adobe mechanical properties is of paramount importance to improve the reliability of numerical models, which can then be used to derive fragility and vulnerability functions. Several studies and experimental campaigns have been conducted at the Civil Engineering Department of the University of Aveiro since 2005, providing crucial insights and information to sustain more robust numerical models. Adobe has also been extensively studied in Portugal, but mainly on the characterization of its mechanical properties [26,27]. The experimental campaigns on in-plane cyclic tests on full-scale double-T shaped adobe walls carried out by Silveira et al. [28] provided the value of Young’s modulus (E) adopted herein. The material properties reported by Silveira et al. [28] were incorporated in a case study by Sarchi et al. [29] to create two finite element models, that were then used to develop fragility functions.
3.2.1. Testing the Modeling Platform
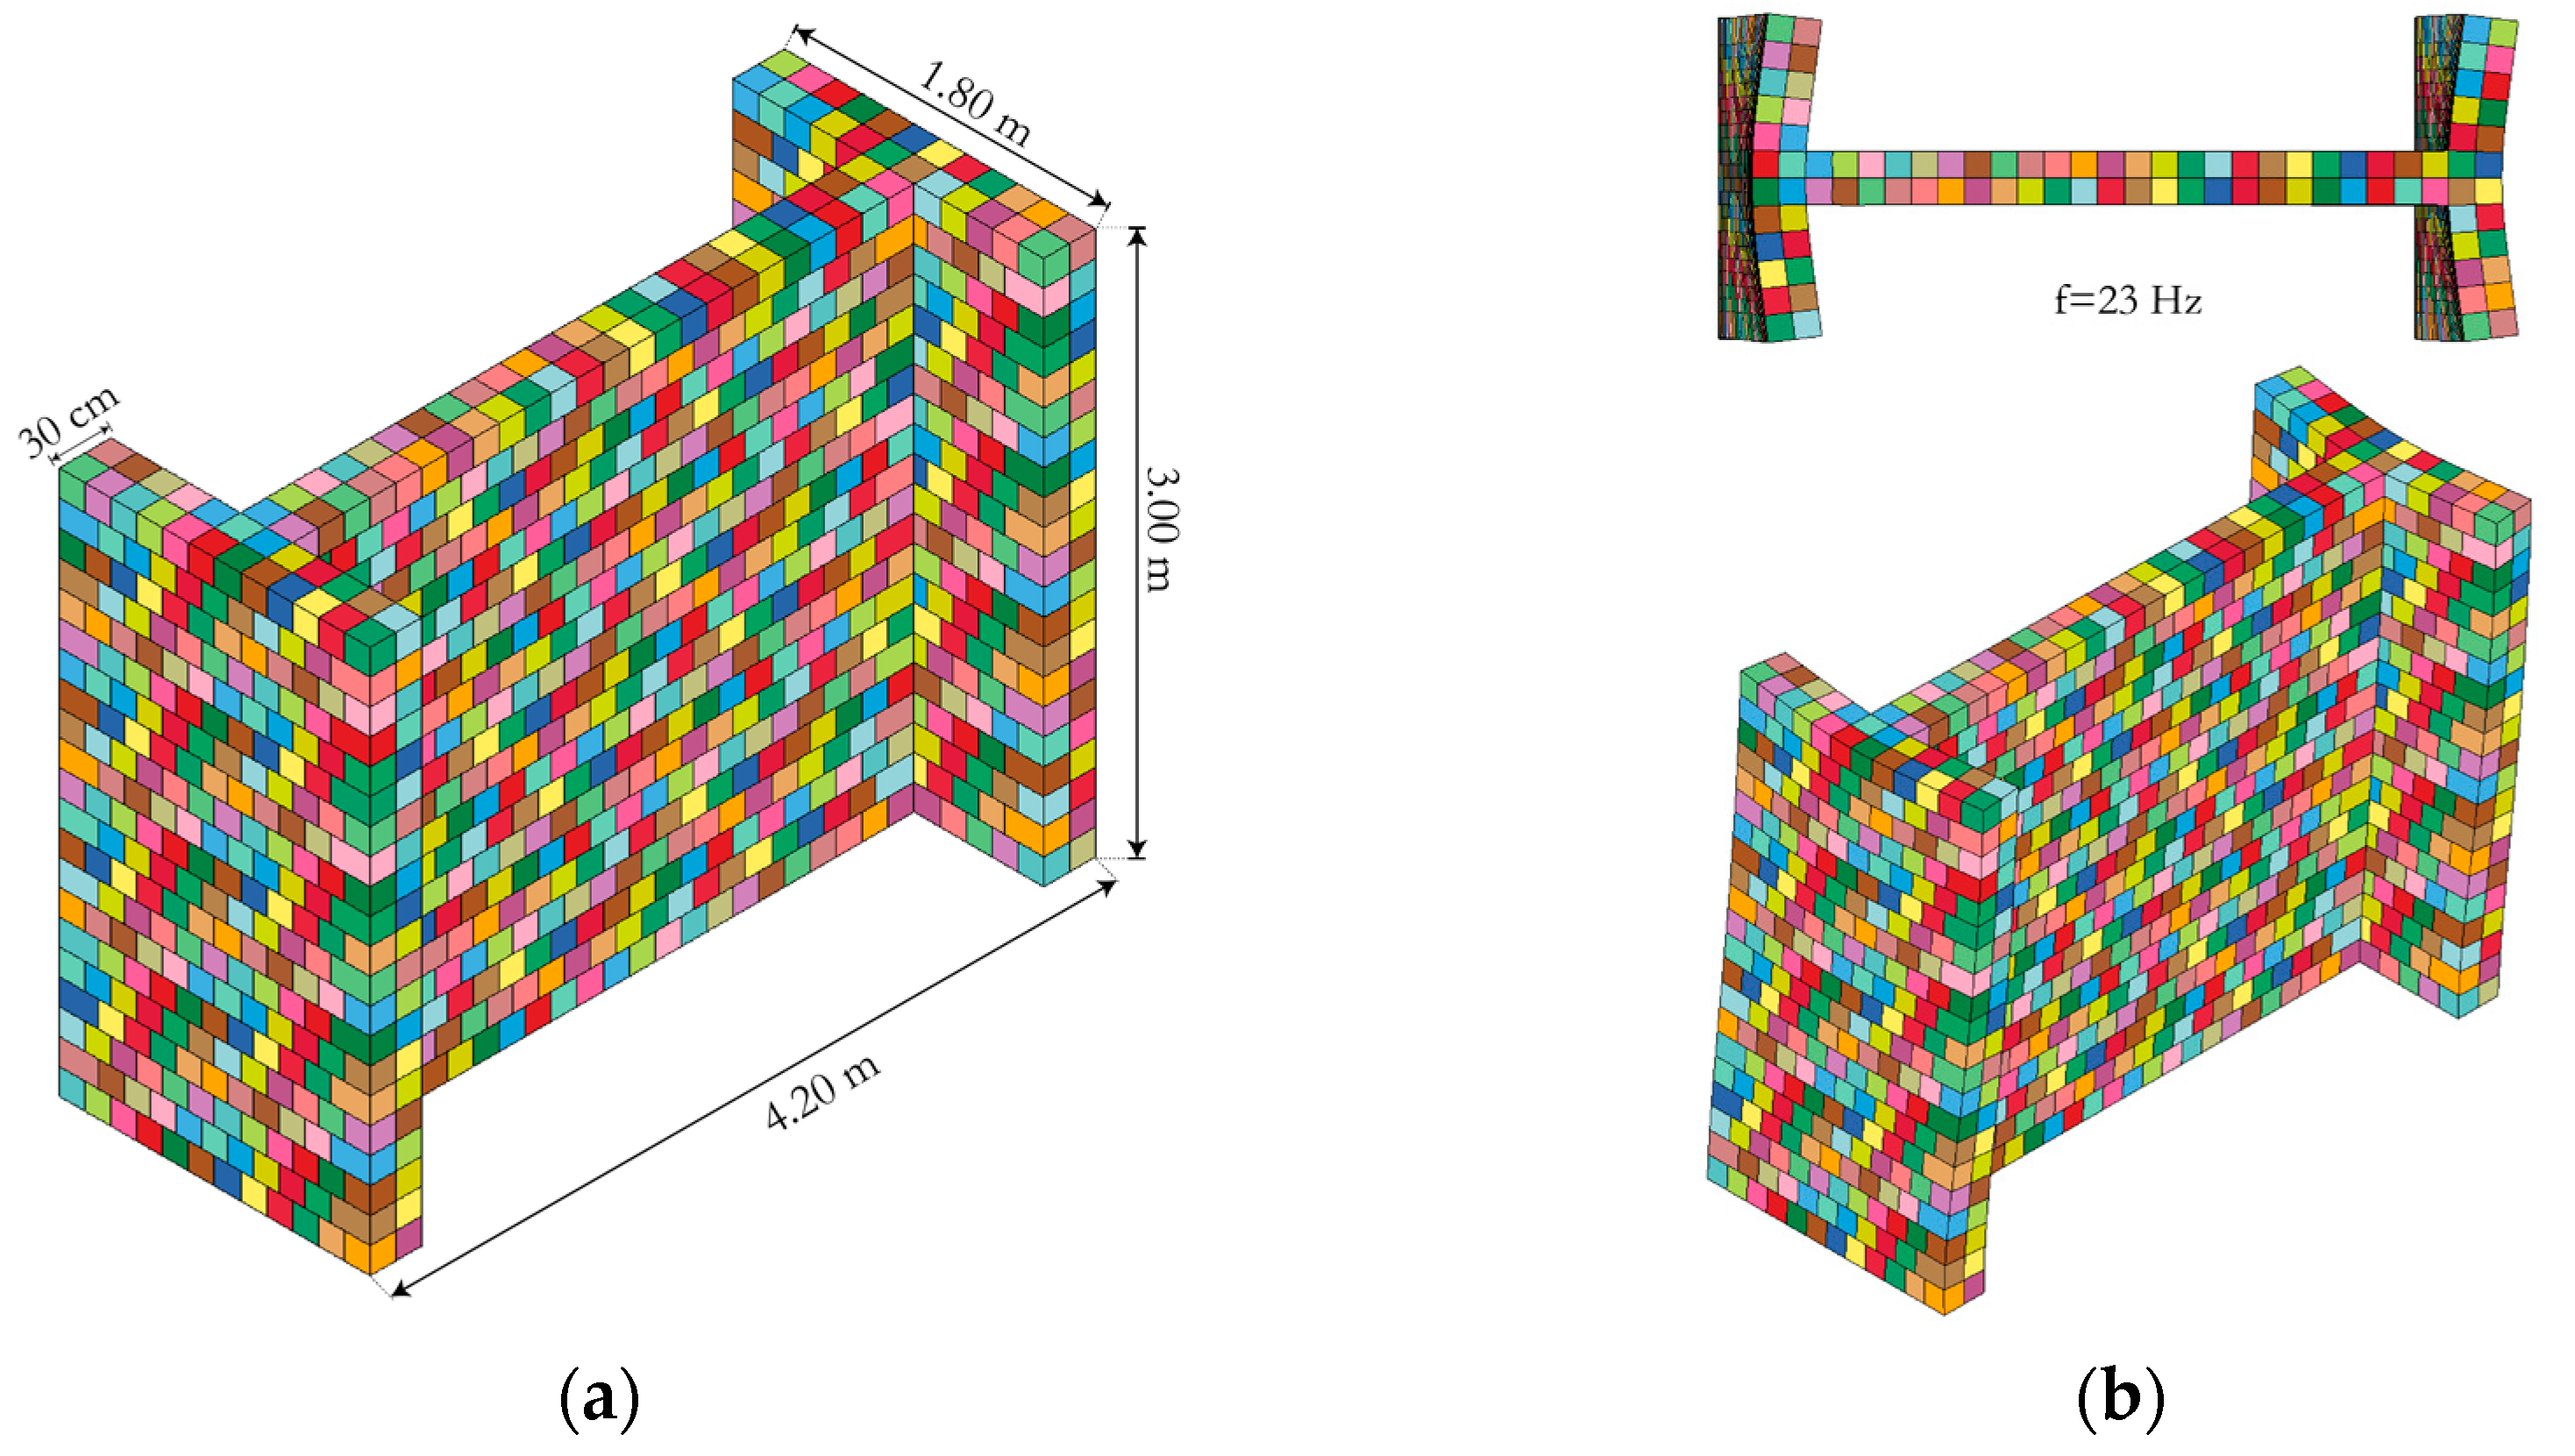
In the context of this study, it was pertinent to first test the modeling platform, herein LS-DYNA, then check if the results of the experimental tests were reproducible and thus applicable. A numerical model of the adobe double-T wall experiment reported in Silveira et al. [28] was recreated in the LS-DYNA environment as shown in Figure 6a, and a trial range of values of Young’s modulus was applied and tested in the linear range. Each of the eigenmodes and their corresponding eigenfrequencies were checked, and it was found that at a Young modulus of 738 MPa, the corresponding frequency was 23 Hz, as shown in Figure 6b, henceforth providing a match to the experimental results. This value was corroborated by another study [30] that suggested that the Young modulus should be lower than 1 GPa for this kind of material.
3.2.2. Sensitivity Analysis
A sensitivity analysis was performed in which the various parameters involved in the numerical modeling such as tensile strength, normal energy, and shear energy release rates, and coefficients of friction were tested by using different proposals from the literature. It is a well-known fact from the scientific literature that adobe masonry exhibits a brittle behavior, owing to its low compressive, tensile, and shear strength [31,32,33,34,35]. For this reason, when subjected to cyclic action, adobe masonry usually presents a low resistance capacity. The tensile strength was assumed to be 0.05 MPa [31], and the recommendations from Lourenço and Pereira [36] were followed to define the initial range of parameters such as the normal energy release rate and shear energy release rate. According to AlShawa et al. [37], it is acceptable to assume equal shear and tensile parameters for masonry. The parameters that influenced the structural response the most were the normal and shear energy release rates. Thus, the final values of normal energy and shear energy release rate adopted in this study for buildings 1, 2, and 3 are 10 N/m, 30 N/m, and 20 N/m, respectively. From the literature, there was no clear recommendation for the coefficient of friction. Thus, a static coefficient of 0.4 and a dynamic coefficient of 0.3 was assumed. A summary of all the mechanical properties and input parameters adopted for the numerical models of the adobe buildings are given in Table 2.
4. Framework for Vulnerability Assessment
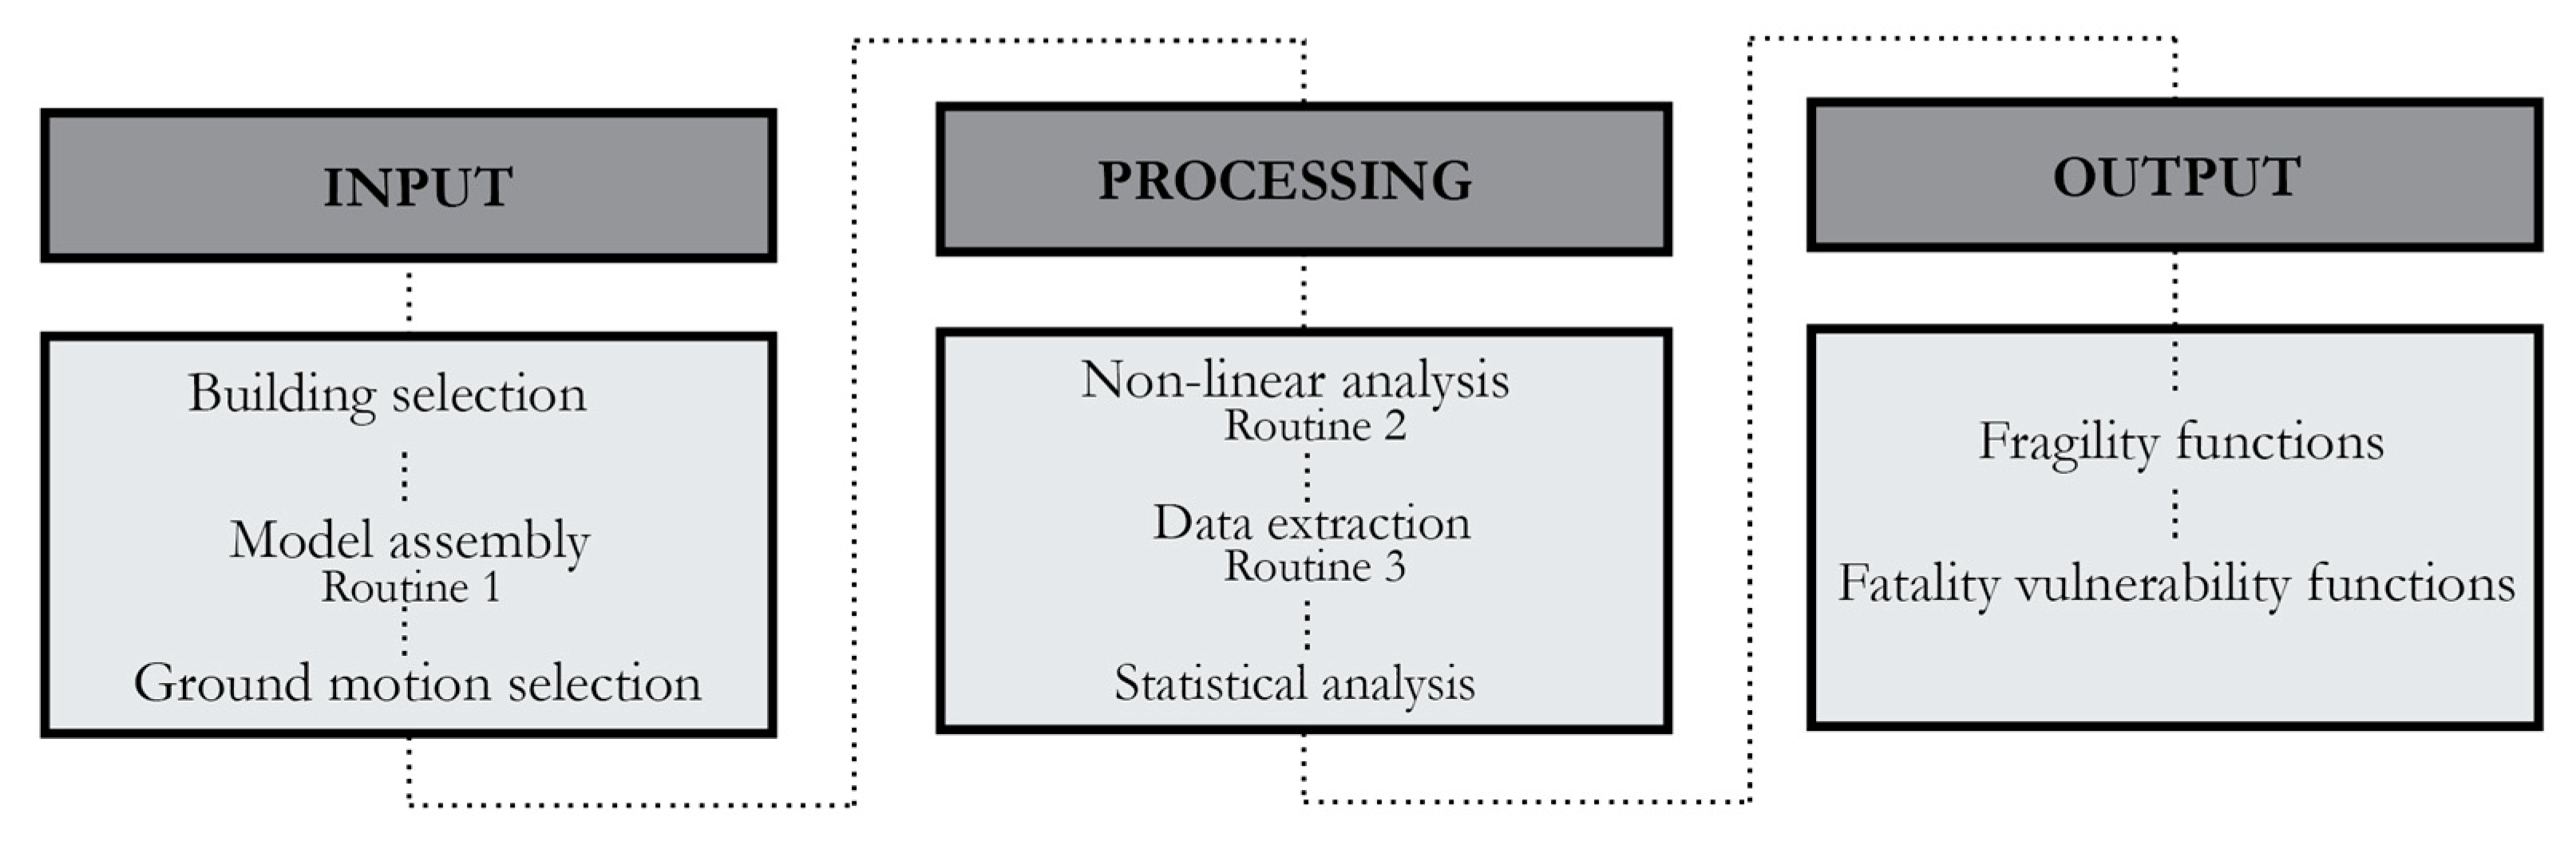
The framework for vulnerability assessment of the adobe buildings is shown in Figure 7, and each of these steps is discussed in detail in the following subsections.
4.1. Numerical Modeling
LS-DYNA, a general-purpose finite element software capable of simulating complex real-world problems, was used in this study. A shared memory parallel (SMP) double precision solver was utilized to improve the convergence of the non-linear analyses, and a combined finite-discrete element [38] strategy was adopted to simulate various stages of damage, such as cracking of walls and volume loss. The development of the numerical models in this study followed the recommendations from Karanikoloudis and Lourenço [31], and Lourenço and Pereira [36].
The pre-processing, processing, and post-processing of the numerical models can be broadly categorised into three steps, as shown in Figure 8. Firstly, the detailed building drawings are used to define the geometry in the software environment (LS-PrePost [39]) Secondly, the assembled models have to be processed and the data stored. Finally, the relevant data is extracted and further post-processed to obtain results such as the maximum displacements or fraction of cracked walls. To improve the computational performance and accuracy of these steps, automatic processes have been implemented in the MATLAB [40] routines (1–3). For each of the three steps mentioned above, a schematic of these routines is shown in Figure 8. Routine 1 was used for assembling the required geometry of the building based on a simplified input protocol. It efficiently generates the nodes and the solid elements and connects the segments to produce the complete building model. Routine 2 was used to execute the second step of this process, that is, running the static and dynamic analyses, which are performed in a stepwise manner. It generates a set of instructions that can be run from the system console that controls the LS-DYNA solver and can run multiple analyses simultaneously while efficiently segregating and storing the data generated. Routine 3 was used to execute the third step of this process: the extraction of the relevant data from the analyses, which, in the present study, mainly relates to crack propagation and volume loss.
4.1.1. Solids Elements for Walls
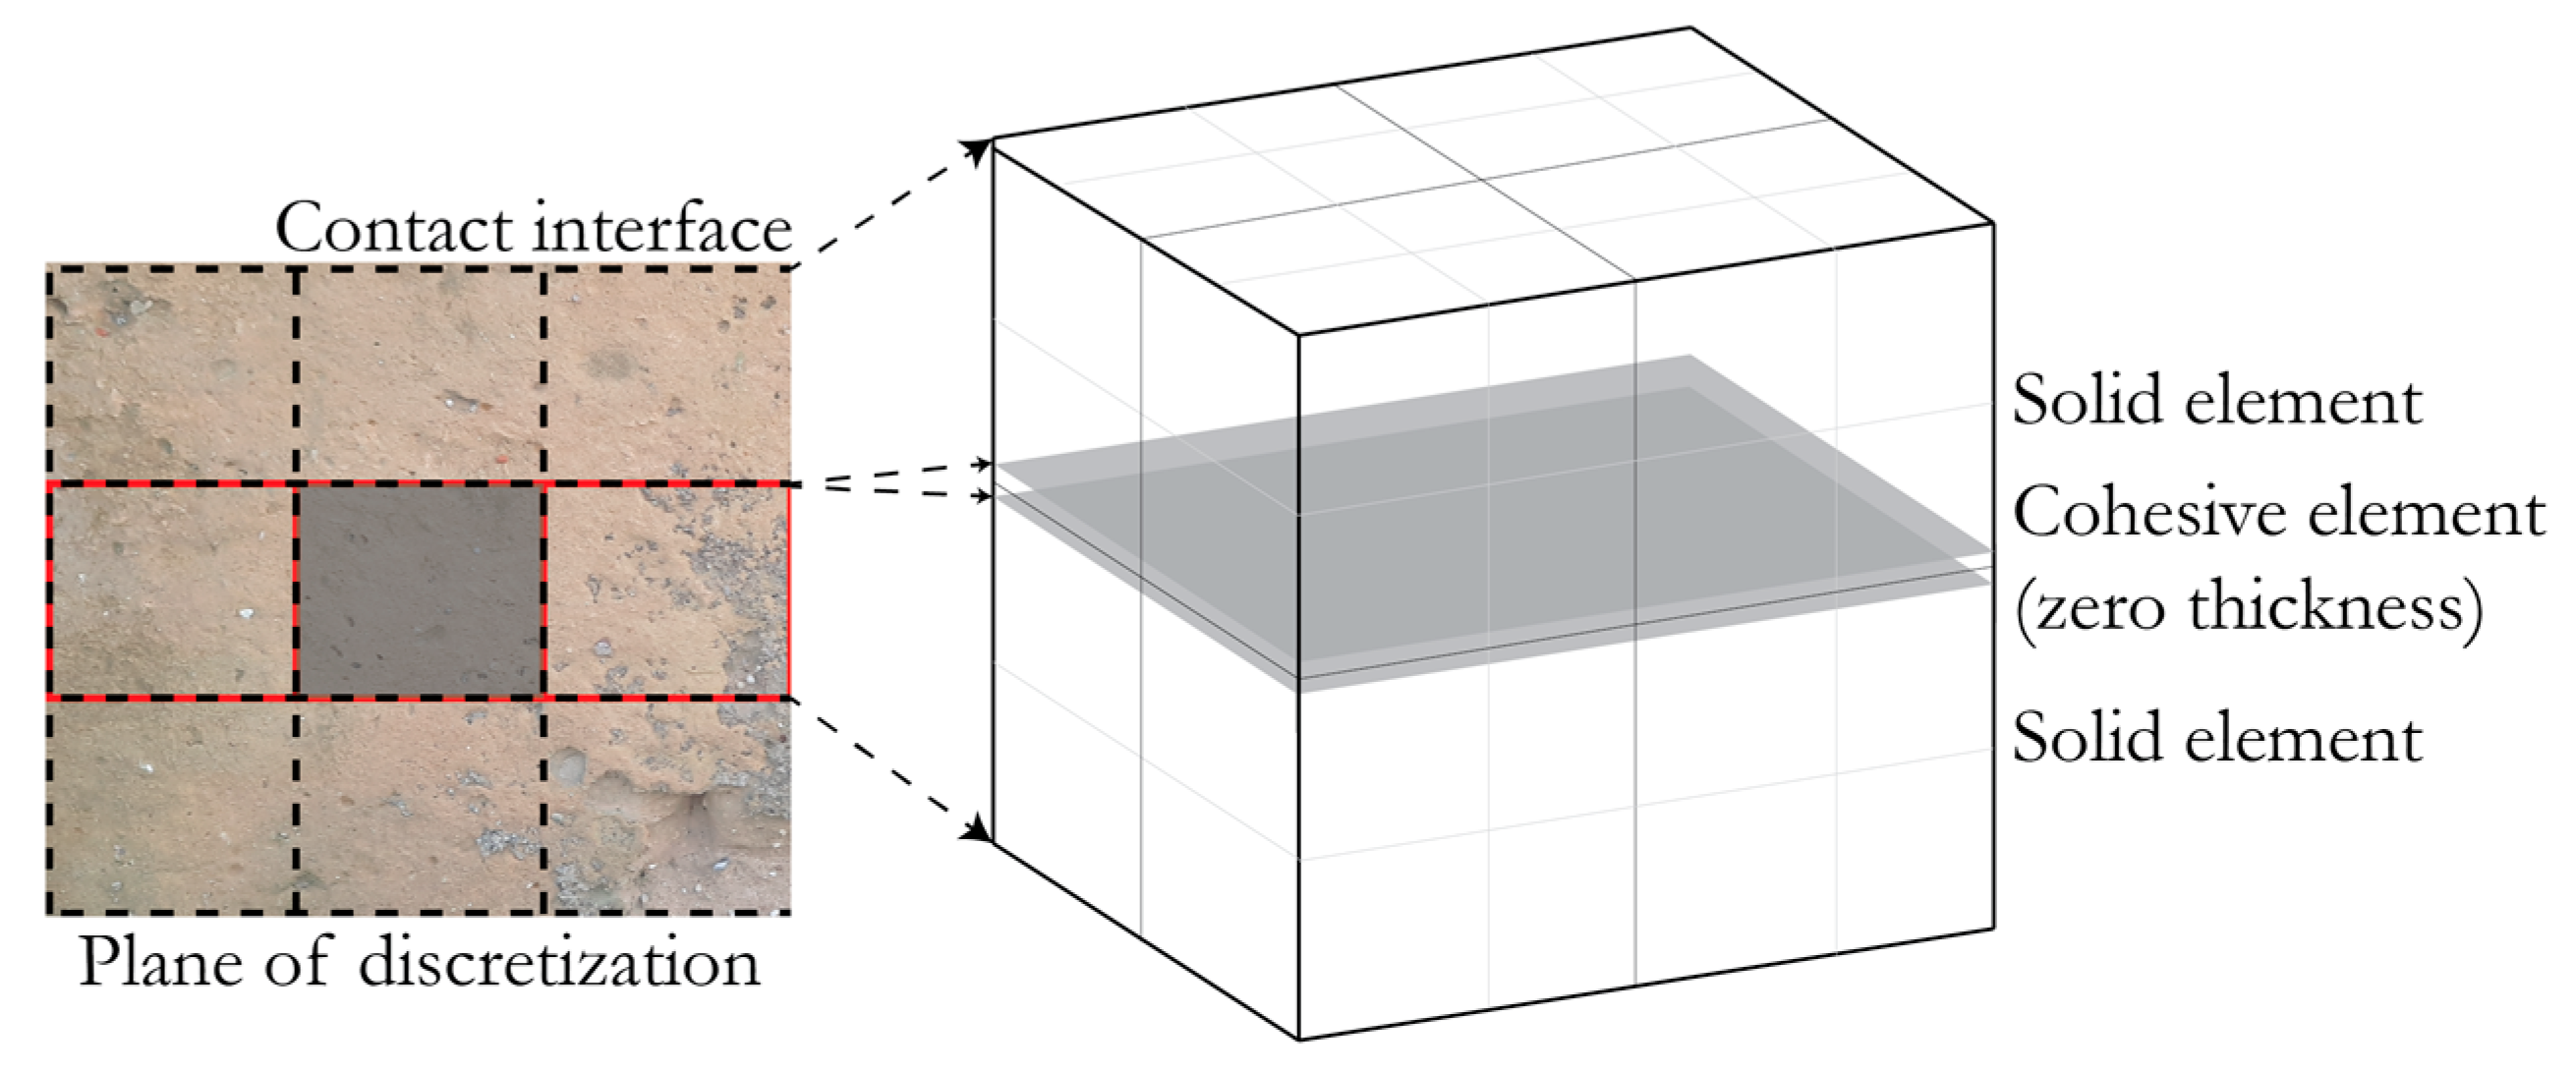
To suit this study’s objectives, it is pertinent to model the collapse mechanism of the buildings. This process allows quantifying the crack propagation and the volume loss of material. According to a classification given by D’Altri et al. [41], this modeling strategy can be considered a block-based approach, and a similar novel computational modeling strategy was proposed by Pulatsu et al. [42]. To this end, the building was discretized uniformly into blocks, as shown in Figure 9. In this study, the buildings were modeled utilizing three different mesh size discretization to reproduce the required wall thickness. The thickness of the walls is modeled adopting a “two-parts” scheme, in order to avoid computational instabilities. Thus, to reproduce a wall of 30 cm thickness, we used two blocks of 15 cm each. Furthermore, each block is constituted of two elements with a mesh size of 7.5 cm each, as shown in Figure 3c. The same approach has been applied to the other two buildings as shown in Figure 4C and Figure 5C. Finally, the computational cost plays an important role, and larger mesh sizes help in reducing the cost significantly. A summary of the components of the models is given in Table 3.
The elements used in our models were LS-DYNA’s standard three-dimensional solid elements formed by eight nodes (hexahedron) ELFORM_TYPE_1, based on linear shape functions using one-point integration with constant stress [10]. The material properties attributed to these blocks is *MAT_001, an isotropic elastic material model [10]. This combination of solid elements and associated material properties proved to be efficient, enabling multiple non-linear time history analyses. However, while working with solid elements, it is possible to develop Hourglassing (HG). This is a pathology that can potentially cause numerical inconsistencies due to the development of nonphysical, zero energy modes of deformation that produce zero strain and no stress in the solids. To control this numerical error, an HG control (IHQ4) that follows a stiffness form of type 2 Flanagan-Belytschko has been utilized, with a Hourglass coefficient (QH) of 0.05 [37].
4.1.2. Segment Contact Interface Elements and Cohesive Mixed-Mode Material Model
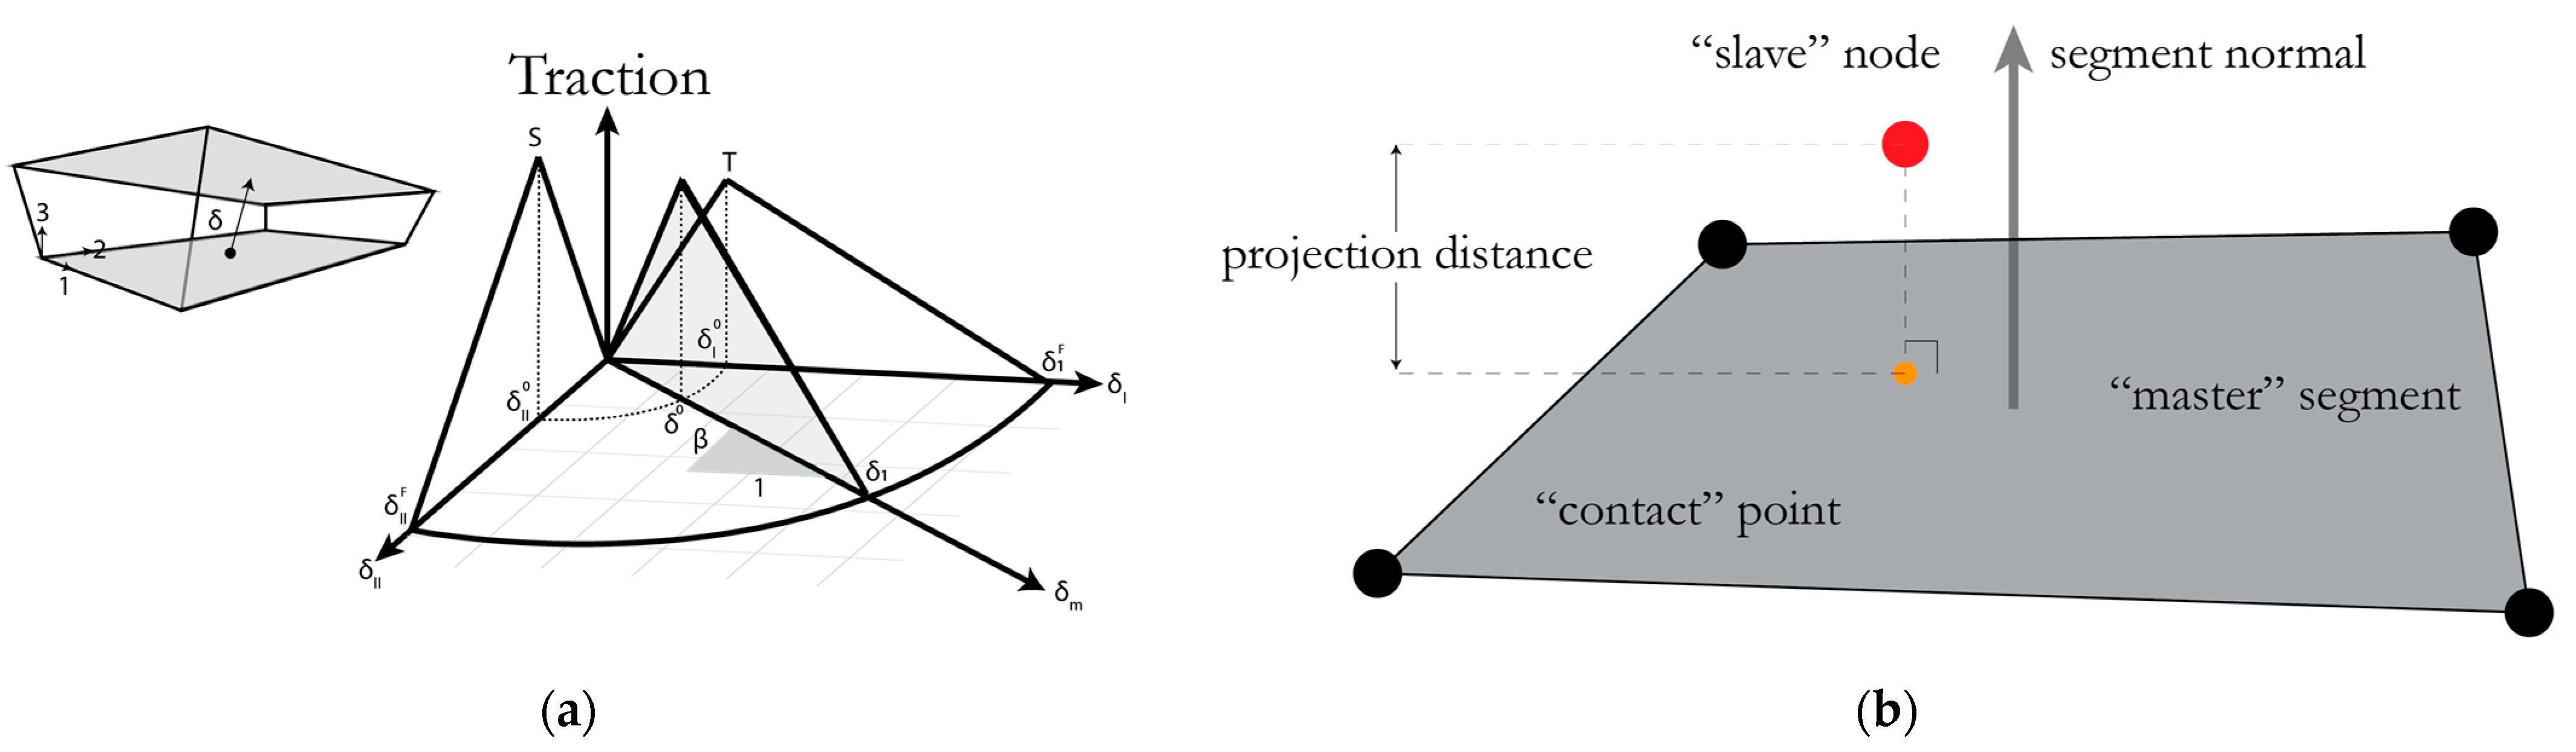
The solid elements were connected using zero thickness master and slave interfaces. A penalty stiffness approach was used to model the separation, impact, and sliding with friction between blocks. A *CONTACT_AUTOMATIC_SURFACE_TO_SURFACE_TIEBREAK was used as these automatic contacts are non-oriented, and can detect penetration coming from either side of the master and slave segments. The selected contact algorithm is based on the *MAT_138 [10], which has a Discrete Crack Model, and it was assumed that the tensile behavior is governed by a bilinear traction separation law with linear softening, as shown in Figure 10a. This material model has a pre-defined failure criterion, and the cohesive elements were removed after meeting the criteria. No damage was assumed in the initial state of the buildings. The schematic of a master and slave node is shown in Figure 10b, and a summary of the mechanical properties and input parameters adopted for the numerical models are given in Table 2.
4.1.3. Optimization
Due to the large deformations of the solid elements from their original position, an element may become so distorted that its volume becomes negative. This behavior increases processing time and eventually causes premature termination of the analysis. A function to remove such elements was incorporated using the *DEFINE_ELEMENT_DEATH_SOLID_SET [10] option. This functionality tracks solid blocks that fall below the base of the building and removes them from the calculation. This optimization significantly improved the computational performance and required storage, while maintaining a steady iterative timestep.
4.2. Eigenvalue Analysis
Eigenvalue analysis is fundamental towards understanding the fundamental period of vibration of the buildings. The modes of vibration corresponding to the X and Y direction of the building models with significant mass participations are shown in Figure 11a–f. The local modes with corresponding low values of mass participation are not shown for the sake of brevity.
4.3. Hazard Demand
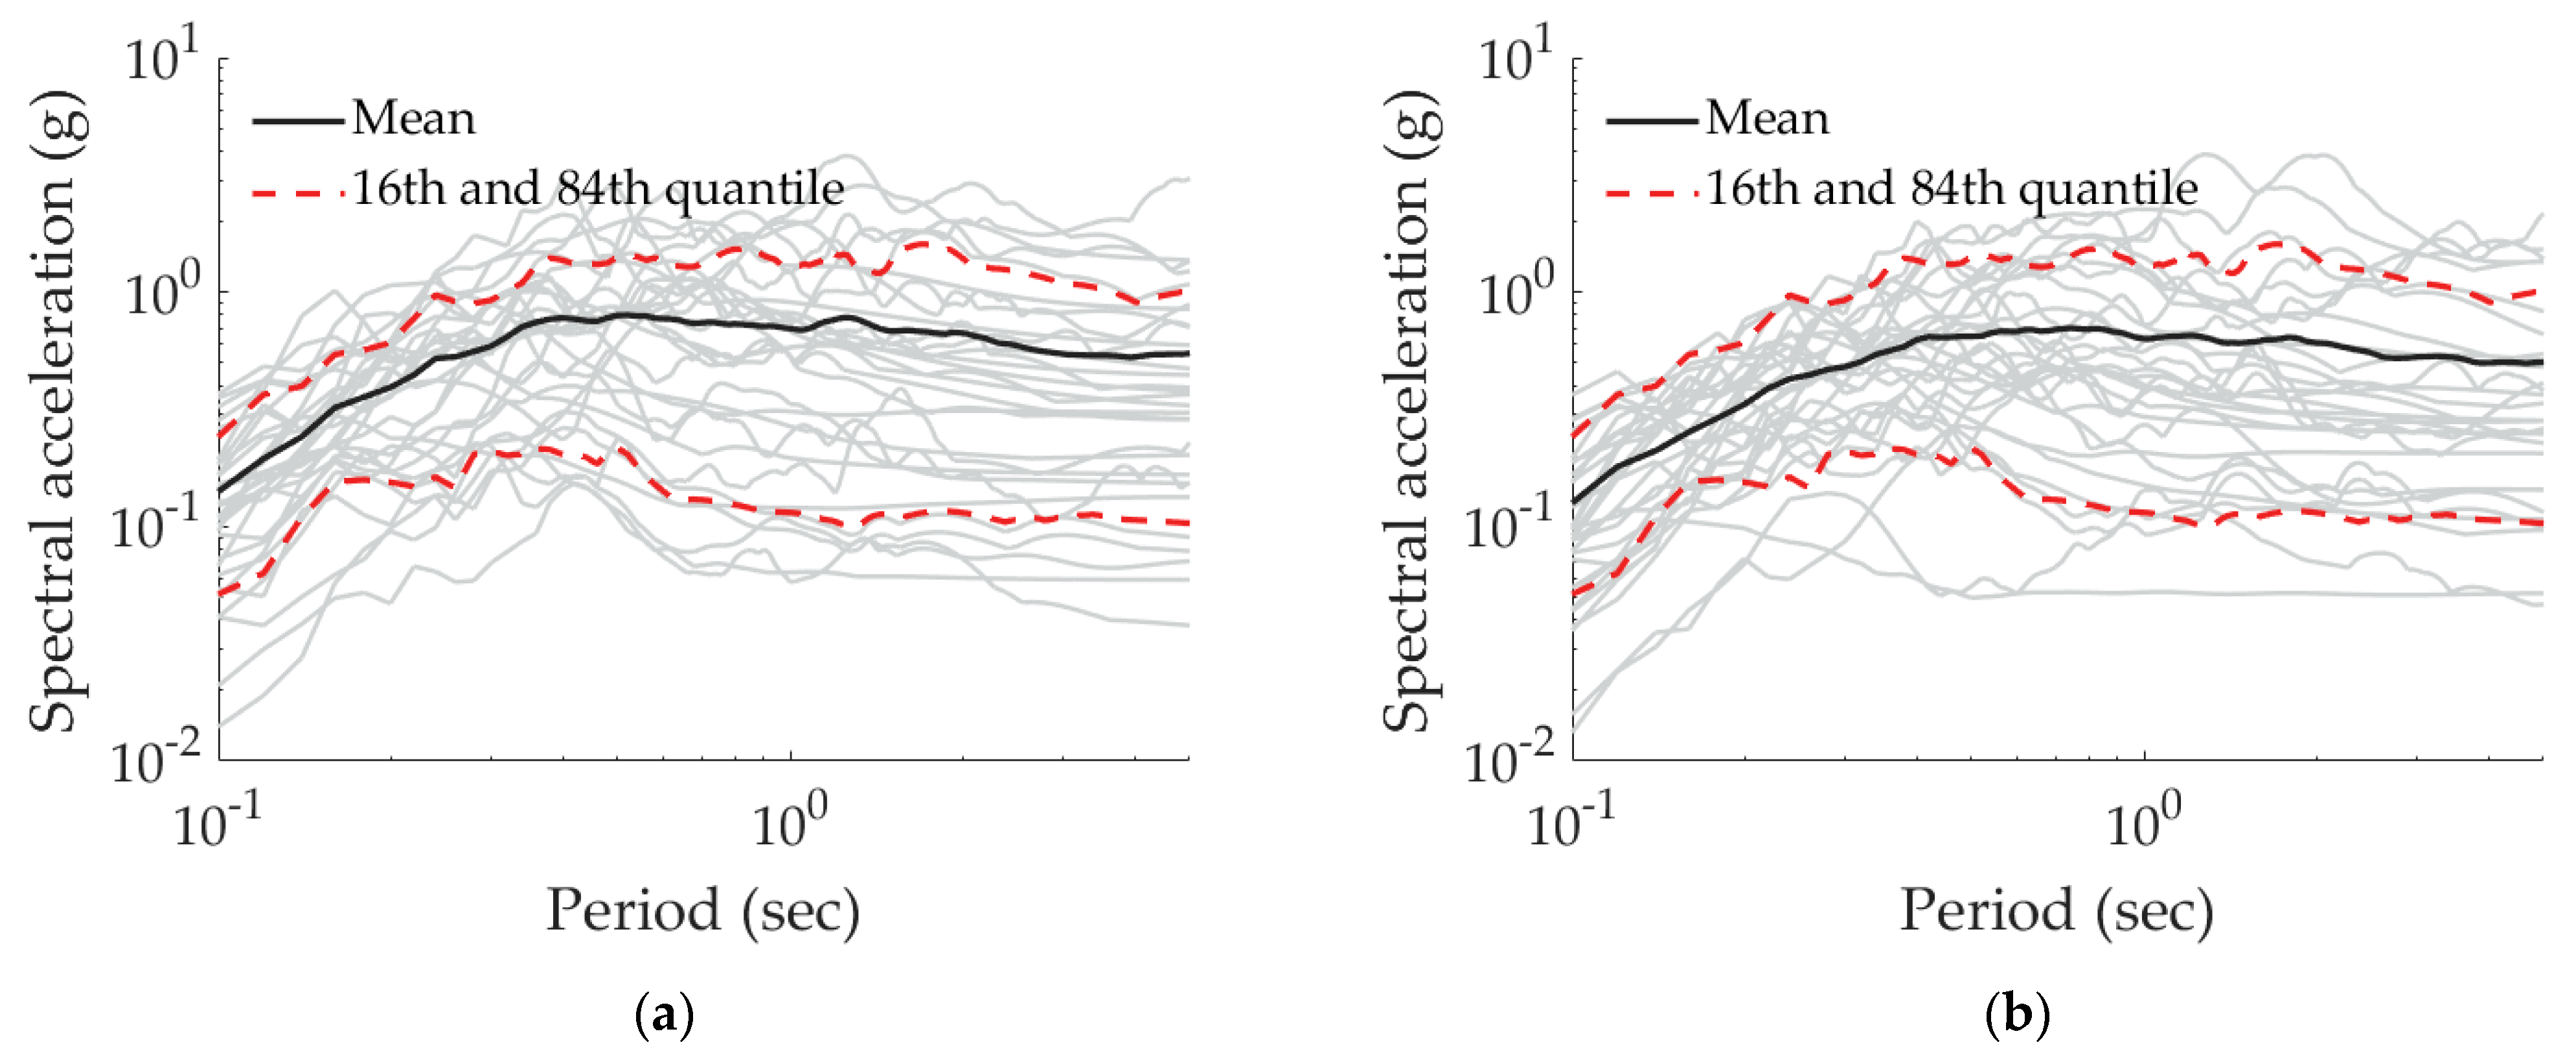
A set of 30 bi-directional ground motions records were selected based on the local tectonic regime in Portugal and a seismic hazard disaggregation study for the most populated regions [44]. The IM considered was PGA, and the records were segregated into five bins between 0.05 g and 1.05 g. Some of these records were scaled to cover the range of PGA required to induce collapse. A limit was set for the duration of the records, since it was not computationally feasible to use ground motion records that exceeded 60 s in duration. Figure 12 illustrates the acceleration spectra for the selected ground motion records along with the median spectrum and the 16th and 84th percentile spectra.
4.4. Non-Linear Time History Analysis
Non-linear time history analyses were performed on all three building models using the set of selected ground motion records in the two orthogonal directions. A gravity analysis prior to a non-linear time history analysis ensures that the model is preloaded prior to applying dynamic loads. In this manner, it is possible to clearly distinguish the preloading phase from the transient phase [45]. The pre-loading was performed using a high damping in order to get a soft response (pseudo-static) to avoid any dynamic effects, whereas for the non-linear time histories, a damping of 3% was assumed [31].
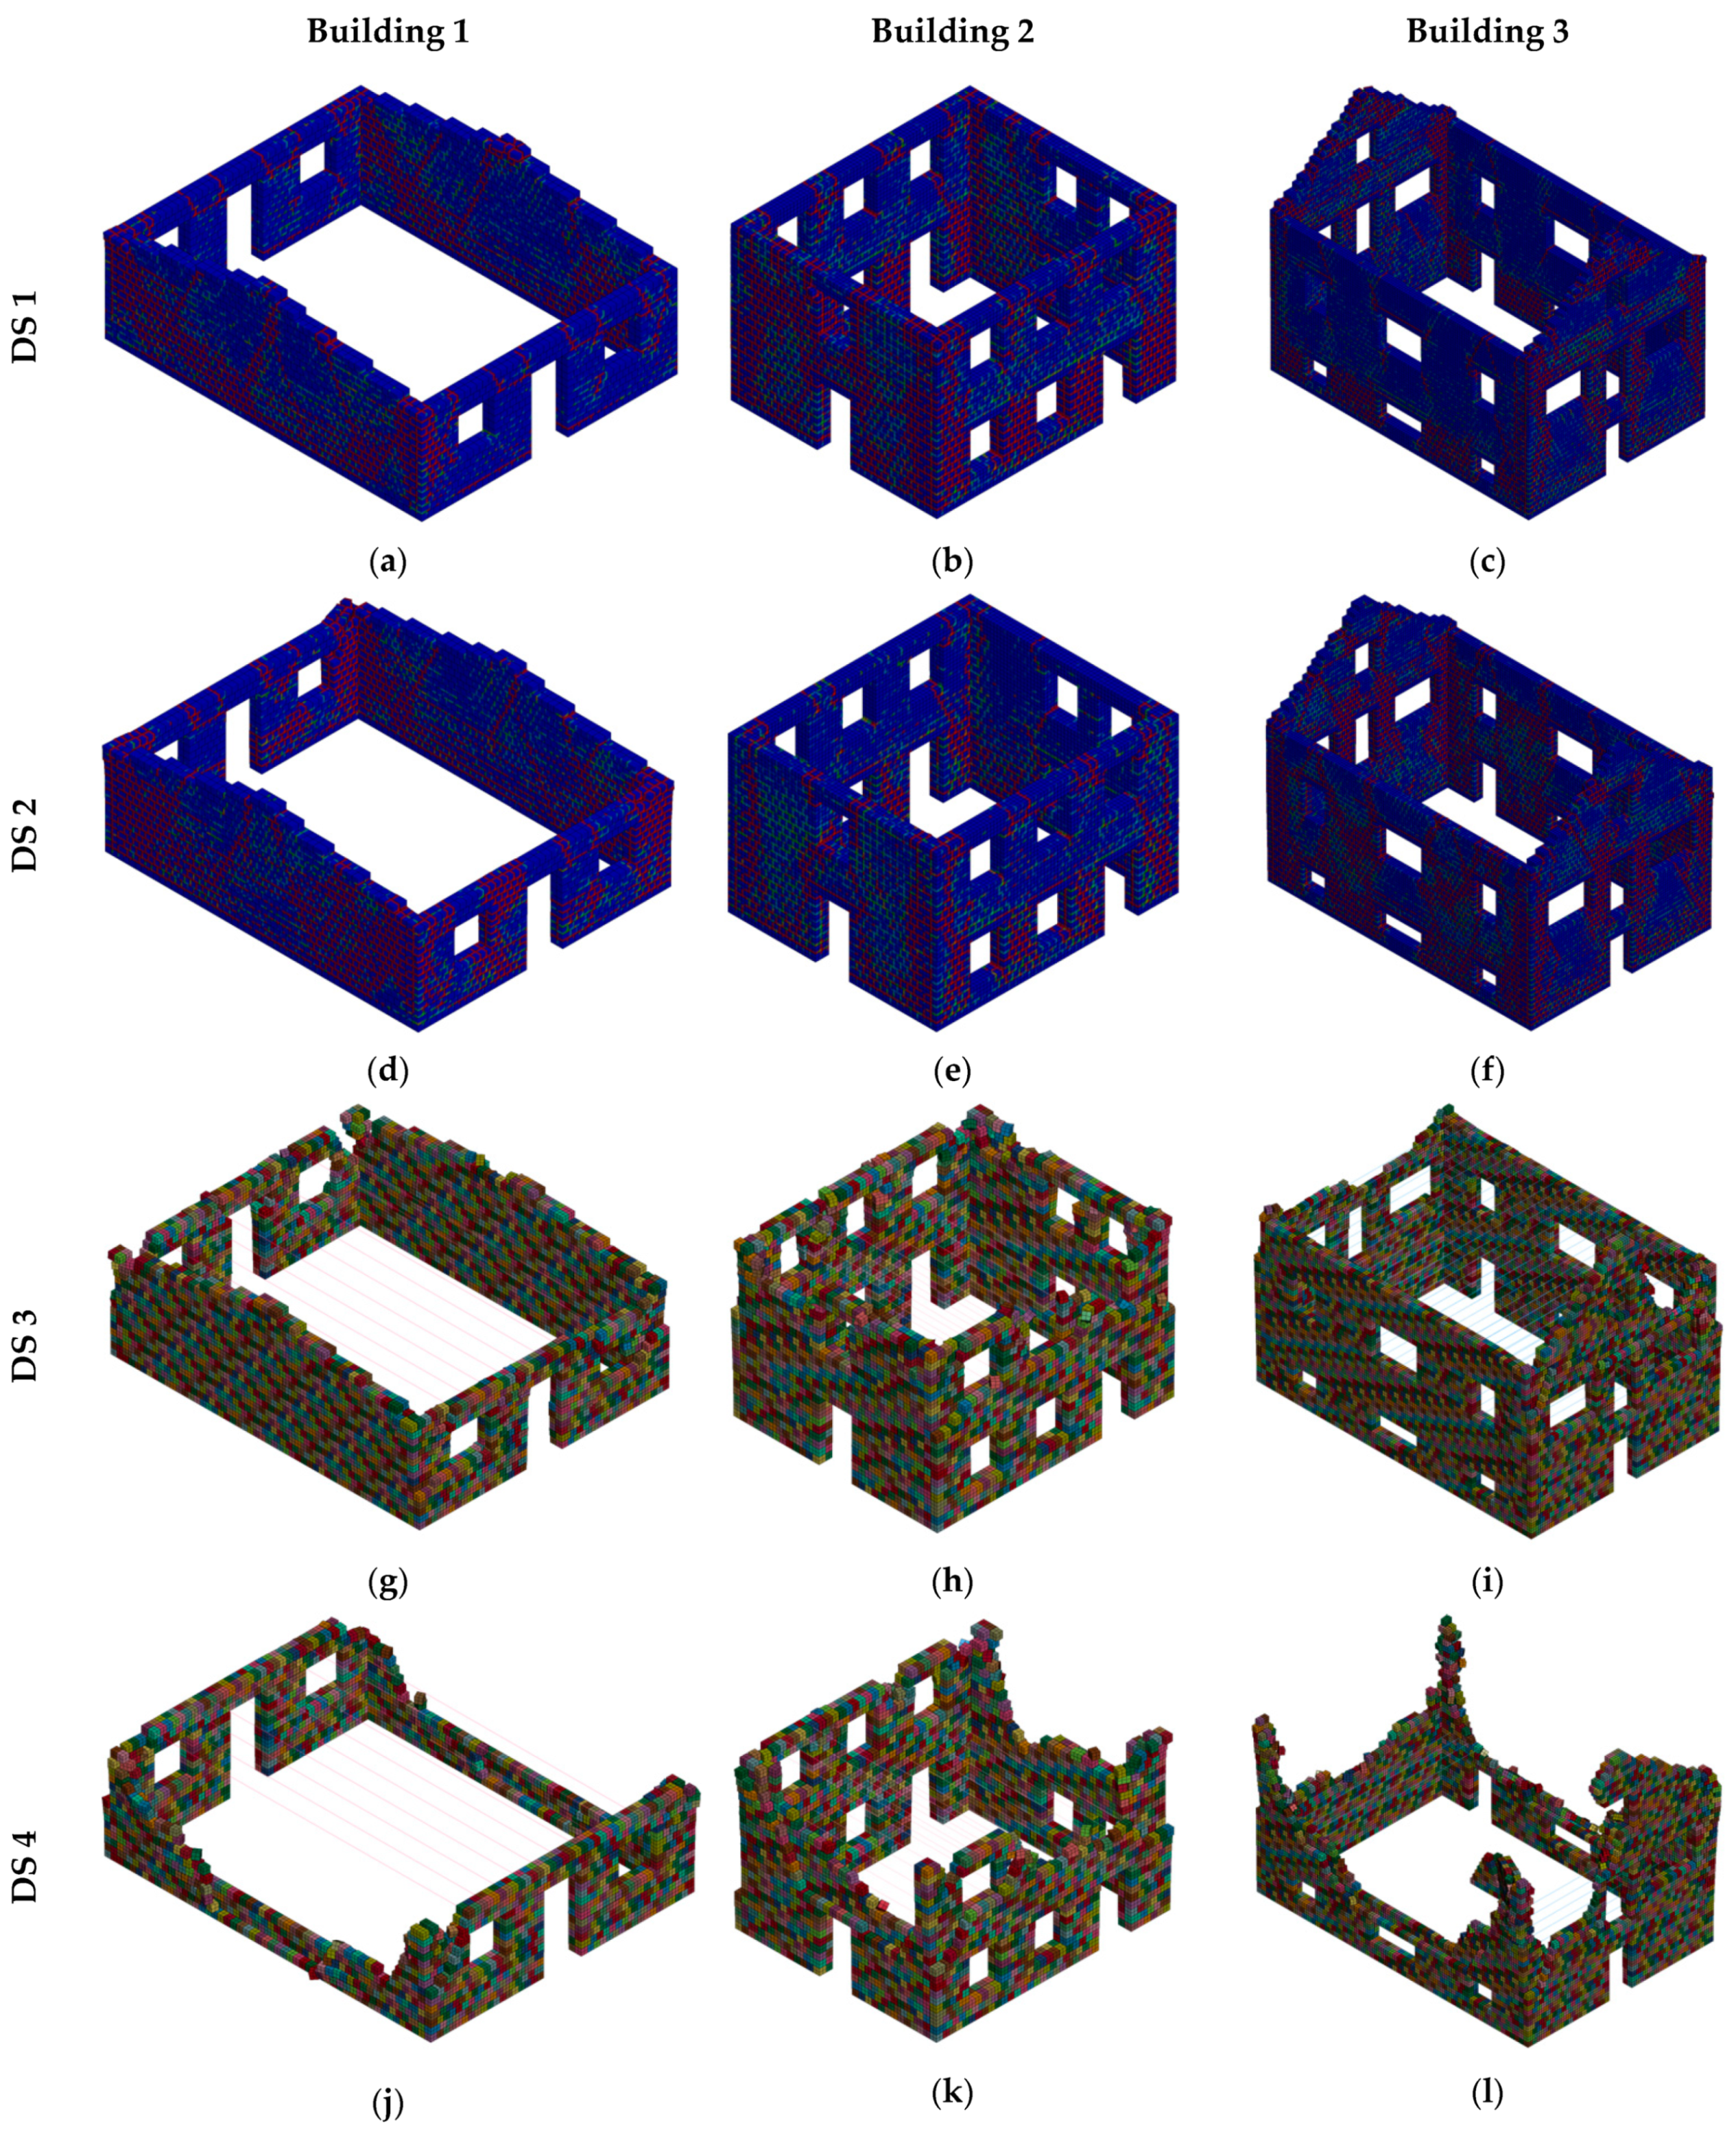
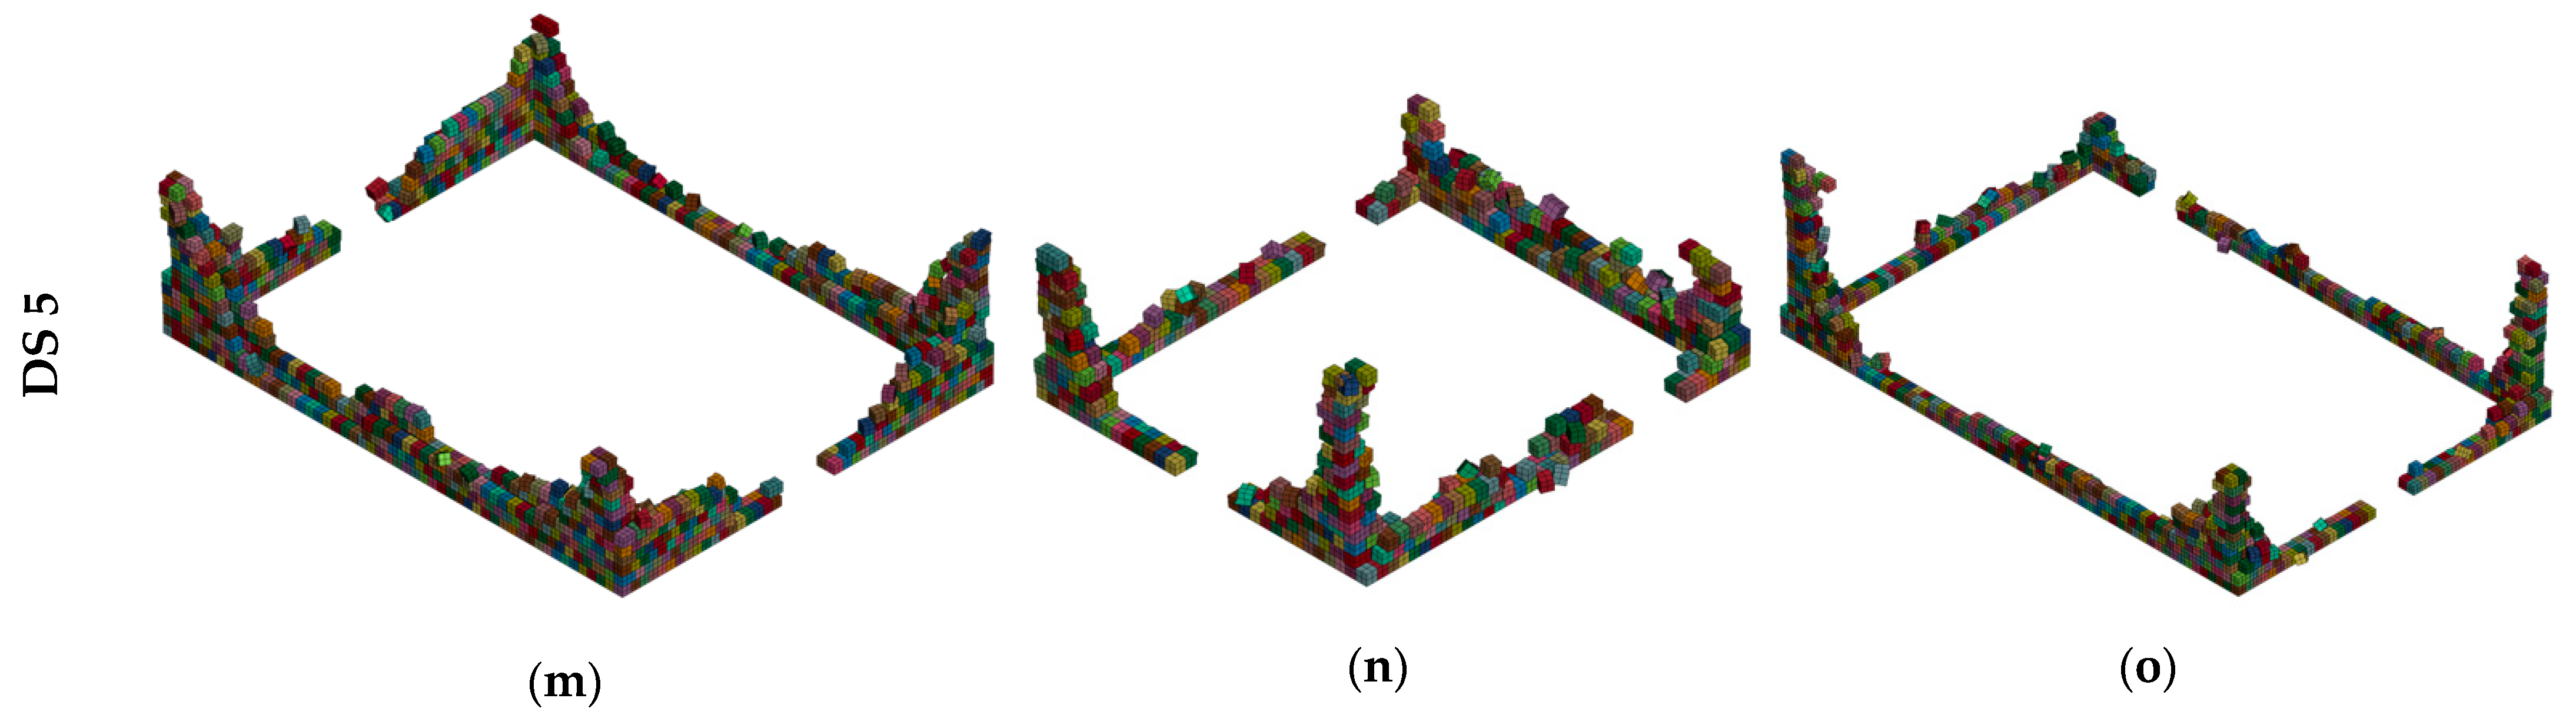
In these analyses, it was expected that depending on the intensity of the ground motion records, the contact interfaces develop cracks due to the energy input. This effect causes the solid elements of the walls get displaced from their original position, and trigger a combined collapse mechanism. The failure modes of these buildings under seismic loading depend on the mechanical properties and on the overall geometric configuration of the building [17,46]. Examples of the end stage of the non-linear time history analyses according to the different assumed damage states are shown in Figure 13a–o.
4.5. EDPs and DSs
To compute the probability of exceeding a set of damage states, it is necessary to establish clear criteria relating each damage state with an engineering threshold (i.e., engineering demand parameter). We adopted the damage states from the European Macrosceismic Scale (EMS 98) [11], and defined a damage criteria based on two EDPs: (1) the crack propagation ratio, which refers to the cracks that develop on the walls prior to the onset of detachment of the blocks, and (2) the volume loss ratio, which refers to the post-failure movements of the blocks that have the potential to cause fatalities. The two novel EDPs are sub-categorized into the five damage states (DS1 to DS5) in Table 4. The thresholds for the novel EDPs were defined following the post-earthquake damage observations from So and Pomonis (2012) [47], in which typical volume loss for collapse of European masonry buildings were indicated. The data generated from the non-linear time history analyses pertaining to crack propagation and volume loss were extracted using the automated MATLAB routines and segregated for further analysis.
4.6. Cloud Analysis
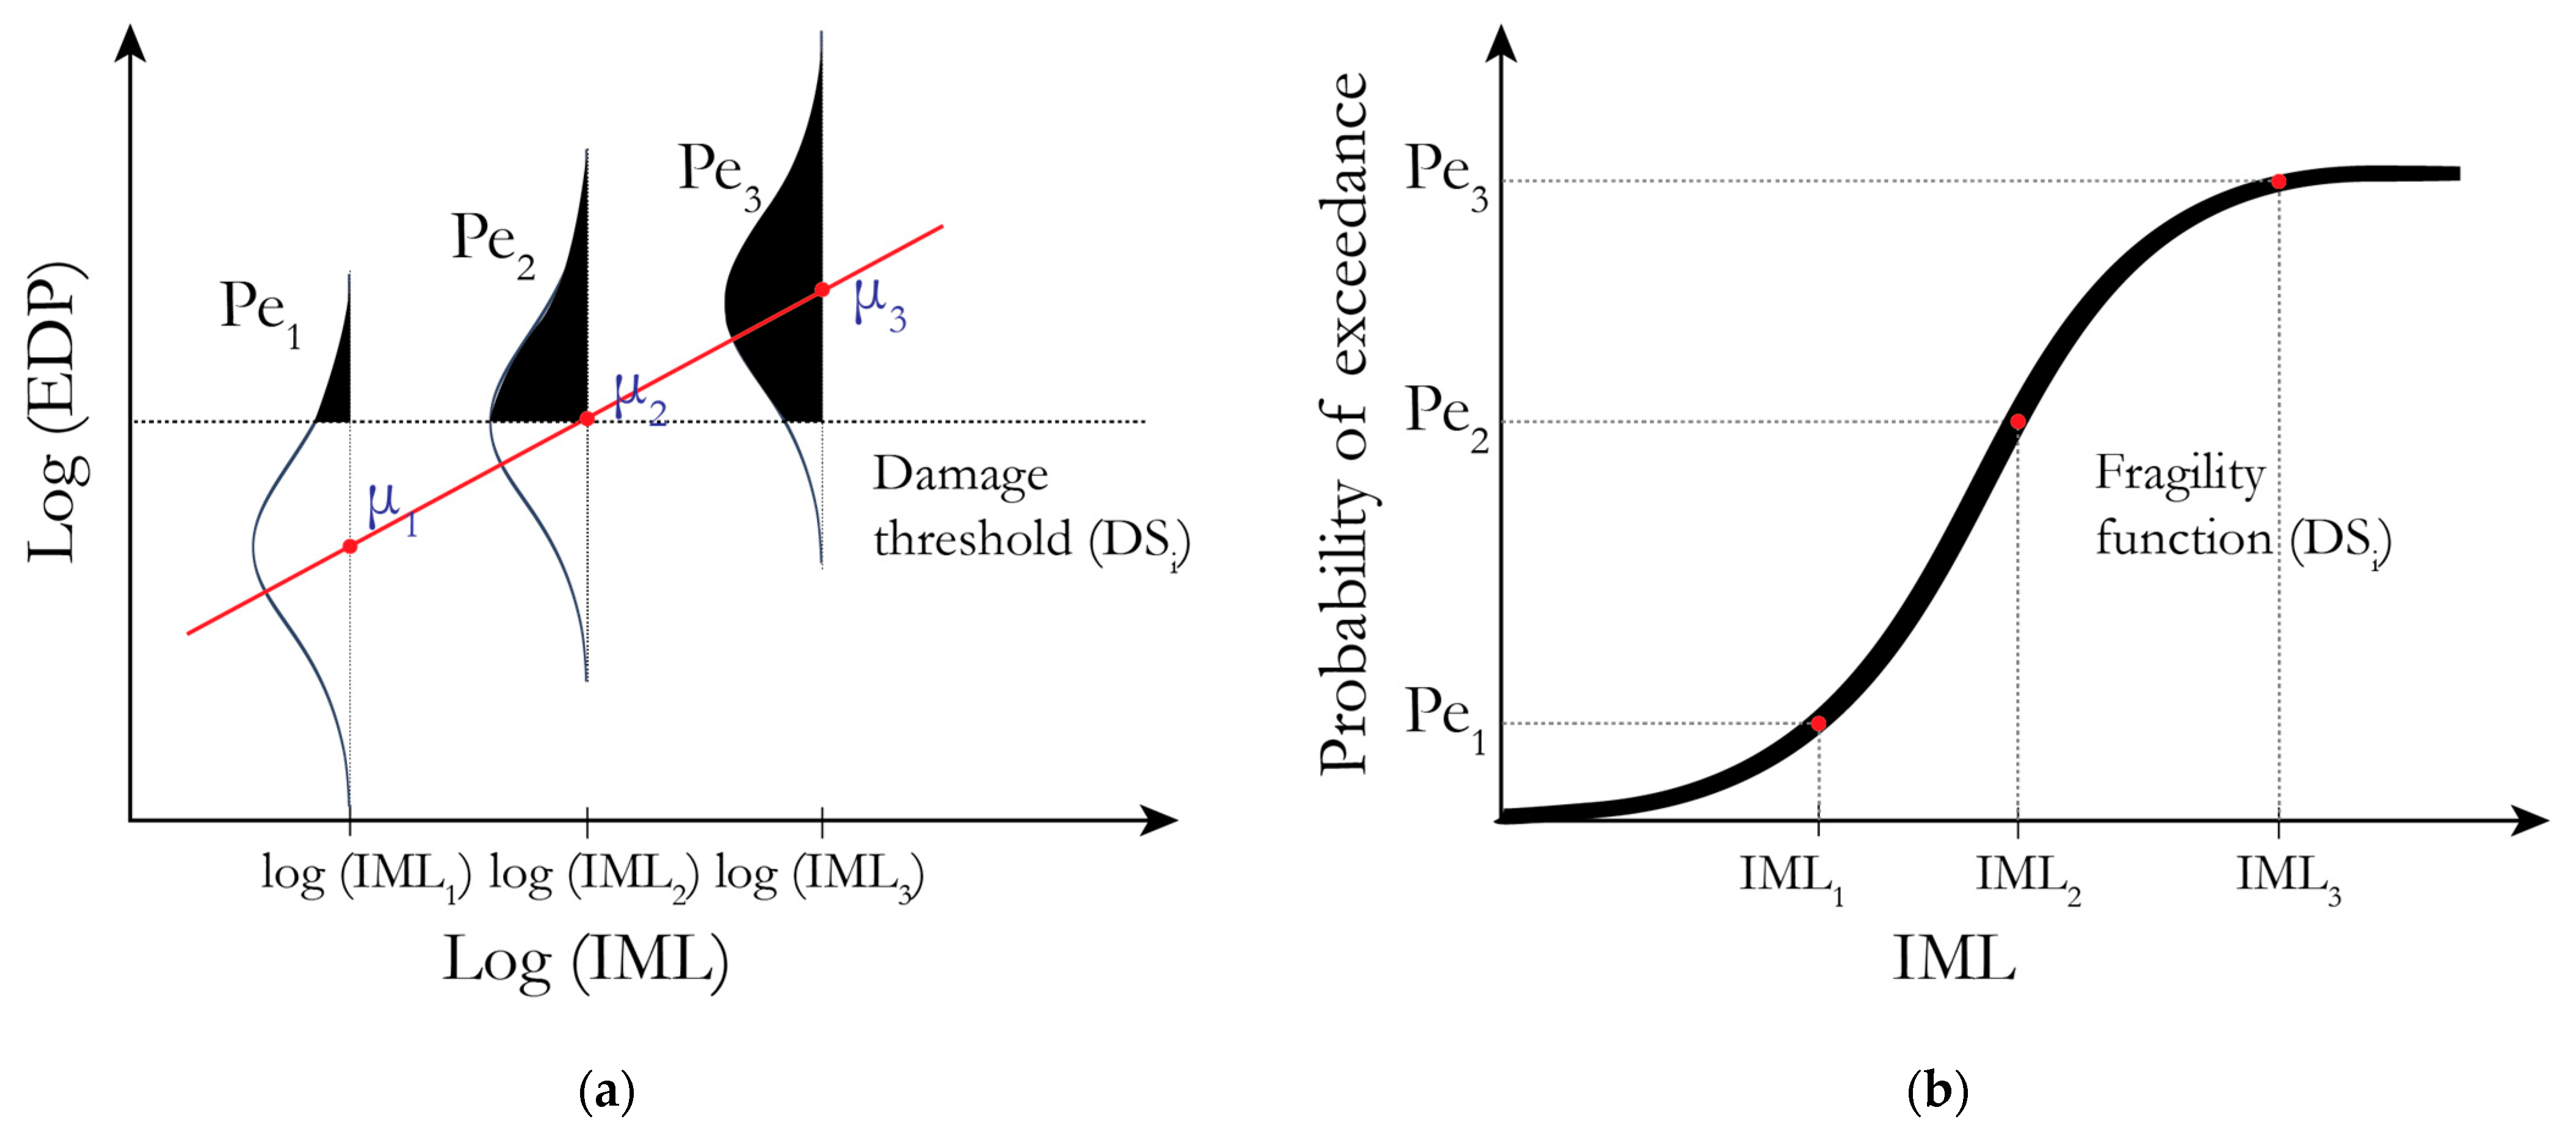
Fragility assessment is an important step in seismic risk assessment [12]. Fragility functions define the conditional probability of exceeding a damage state for a given IM. Incremental Dynamic Analysis (IDA) [48] and Multiple Stripe Analysis (MSA) [49] are commonly used in fragility studies. However, these methods usually require a large computational effort due to the need to scale the ground motion records, and perform a large number of dynamic analysis. The issue of computational effort is particularly important in the current study, as the detailed numerical models are computationally-demanding. Thus, for the sake of simplicity, the Cloud analysis procedure was adopted [12]. This procedure has been used in recent structural fragility studies and it is capable of considering the record-to-record variability and other sources of uncertainty related to structural modeling. The steps followed for the fragility assessment are described below, and illustrated in Figure 14.
- The results extracted from the non-linear time history analysis were plotted (IM vs. EDP) in a logarithmic scale, and a linear regression was performed to generate a trendline that best fits the data.
- The following equation was used to calculate the expected value of the dependent variable (EDP) given an IM. A homogeneity of variance was assumed for the IM-EDP random variables; hence the model can be described as shown in Equation (1).where stands for the expected logarithm of EDP given an IM, b and log(a) are the regression parameters, is the record-to-record variability, n is the no. of records, and corresponds to the i-EDP value obtained from the non-linear analysis for the corresponding .
- The structural fragility functions obtained from the probabilistic model can be expressed using Equation (2).where is the cumulative normal standard distribution and the is the damage threshold (e.g., 15%) corresponding to a given damage state (e.g., DS1).
4.7. Fatality Vulnerability Functions
The method to estimate fatality rates in this study follows the methodology proposed by Abeling and Ingham [9], which uses a relationship between the volume loss of the building and an expected fatality ratio. The buildings volume loss is a damage descriptor that measures the ratio between the volume of debris (Vd) and the space capacity (Vc) measured up-to a height of 2 m from the floor level, as shown in Figure 15. The volume loss can be calculated using Equation (3).
A cloud of fatality ratio (FR)—IM data was produced by multiplying the volume loss obtained from each of the structural analysis by the corresponding FR proposed by Abeling and Ingham [9]. This cloud of points was then fitted to a lognormal cumulative density function, as defined in Equation (4)
where 0.52 is the maximum fatality ratio corresponding to 100% volume loss as per [9], Φ is the cumulative normal standard distribution, θ is the logarithmic mean, and β is the logarithmic standard deviation, as presented in Table 5.
5. Results
The results of this study for the three adobe buildings are presented in terms of the derived fragility and fatality vulnerability functions, as shown in Figure 16a–f with comparisons to the recent study by Martins and Silva (2020) [7]. The corresponding fragility parameters (i.e., µ—logarithmic mean and σ—logarithmic standard deviation) are presented in Table 6 and the fatality vulnerability parameters are presented in Table 5. It can be inferred from the values of dispersion (i.e., σ) in Table 6, that there are two different values for the dispersion, one value corresponding to DS1-DS2 and another for DS3-DS5. The difference arises due to the two EDPs selected to predict the different phenomenon. It is intuitive to understand that a building can develop cracks after which volume loss occurs. The 1-story building is less vulnerable in the first damage states, due to the absence of a story above and the low height. It becomes vulnerable in the last damage states, since post-cracking, the walls lose their load bearing capacity, and these blocks are immediately displaced from their original position. Also, the elastic period of the buildings has an influence on DS1 and DS2, while DS3-DS5 are in the non-linear range. According to Ginell and Tolles [32] the post-elastic behavior of adobe is different from ductile building materials, since it is a brittle material characterized by low compressive, tensile, and shear strength. It is worth noting that all the buildings are unreinforced, and their load bearing capacities rests solely on the integrity of the walls.
6. Conclusions
This study presented the development of fragility and vulnerability functions for typical adobe buildings in Portugal, one of the most vulnerable types of construction in the country. The selection of the buildings to numerically model was carried out based on survey data comprising building drawings, photographs, and information regarding the construction practice and material properties. The sensitivity of mechanical properties and modeling options was assessed, and calibration and validation of material properties were carried out following the results from a full-scale experimental in-plane cyclic tests on adobe walls. A set of 30 ground motion records with bi-directional components were selected, and non-linear time-history analyses were performed until collapse was reached. Two novel EDPs were adopted and damage thresholds were proposed such that they can be correlated with damage classifications in agreement with the European Macroseismic Scale (EMS-98) [11]. Fragility functions were then derived following the cloud analysis methodology [12] and compared to a recent study [7].
The fragility functions proposed herein can be used directly in the assessment of damage due to earthquake scenarios, or in probabilistic risk analysis to identify regions in the country where the probability of collapse of these structures is particularly high. Similarly, the vulnerability functions in terms of fatality rates can be employed to assess human losses, which is particularly important for the development of risk management measures.
Author Contributions
Conceptualization, V.S., R.V. and T.M.F.; methodology, S.M., H.L., V.S., R.V. and T.M.F.; software, H.L., S.M.; validation, S.M., H.L., V.S., T.M.F. and R.V.; investigation, S.M., H.L.; resources, R.V.; data curation, H.L., S.M.; writing—original draft preparation, S.M.; writing—review and editing, T.M.F., R.V., H.L., and V.S.; visualization, S.M., H.L.; supervision, V.S., R.V. and T.M.F.; project administration, R.V.; funding acquisition, R.V., V.S. and T.M.F. All authors have read and agreed to the published version of the manuscript.
Funding
This work was funded by the Foundation for Science and Technology (FCT)—Aveiro Research Centre for Risks and Sustainability in Construction (RISCO), Universidade de Aveiro, Portugal in the framework of research project PTDC/ECI-EST/31865/2017 MitRisk—Framework for seismic risk reduction resorting to cost-effective retrofitting solutions.
Institutional Review Board Statement
Not applicable.
Informed Consent Statement
Not applicable.
Data Availability Statement
The data presented in this study are available on request from the corresponding author.
Conflicts of Interest
The authors declare no conflict of interest. The funders had no role in the design of the study; in the collection, analyses, or interpretation of data; in the writing of the manuscript, or in the decision to publish the results.
References
- Sousa, G.; Gallaecia, E.S. Historical Seismicity in Portugal. In Seismic Retrofitting: Learning from Vernacular Architecture; Taylor & Francis: Abingdon, UK, 2015. [Google Scholar]
- Choffat, P. Le tremblement de terre du 23 Avril 1909 dans le Ribatejo. In Revista de Obras Pu´blicas e Minas, Tomo XLIII; Imprensa Nacional: Lisboa, Spain, 1912. (In French) [Google Scholar]
- Tarque, N.; Crowley, H.; Pinho, R.; Varum, H. Displacement-Based Fragility Curves for Seismic Assessment of Adobe Buildings in Cusco, Peru. Earthq. Spectra 2012, 28, 759–794. [Google Scholar] [CrossRef] [Green Version]
- Crowley, H.; Pinho, R.; Bommer, J.J. A Probabilistic Displacement-based Vulnerability Assessment Procedure for Earthquake Loss Estimation. Bull. Earthq. Eng. 2004, 2, 173–219. [Google Scholar] [CrossRef]
- Ahmad, N.; Ali, Q.; Crowley, H.; Pinho, R. Earthquake loss estimation of residential buildings in Pakistan. Nat. Hazards 2014, 73, 1889–1955. [Google Scholar] [CrossRef]
- Villar-Vega, M.; Silva, V.; Crowley, H.; Yepes, C.; Tarque, N.; Acevedo, A.B.; Hube, M.A.; Gustavo, C.D.; María, H.S. Development of a Fragility Model for the Residential Building Stock in South America. Earthq. Spectra 2017, 33, 581–604. [Google Scholar] [CrossRef]
- Martins, L.; Silva, V. Development of a fragility and vulnerability model for global seismic risk analyses. Bull. Earthq. Eng. 2020, 2020, 1–27. [Google Scholar] [CrossRef]
- Sumerente, G.; Lovon, H.; Tarque, N.; Chácara, C. Assessment of Combined In-Plane and Out-of-Plane Fragility Functions for Adobe Masonry Buildings in the Peruvian Andes. Front. Built Environ. 2020, 6, 52. [Google Scholar] [CrossRef]
- Abeling, S.; Ingham, J.M. Volume loss fatality model for as-built and retrofitted clay brick unreinforced masonry buildings damaged in the 2010/11 Canterbury earthquakes. Structures 2020, 24, 940–954. [Google Scholar] [CrossRef]
- Hallquist, J.O. Livermore Software Technology Corporation (Lstc), Ls-Dyna Keyword User’s Manual Volume I; 2018; Volume II. Available online: https://ftp.lstc.com/anonymous/outgoing/jday/manuals/LS-DYNA_Manual_Volume_I_R11.pdf (accessed on 15 March 2021).
- Comisión Sismológica Europea. Escala Macro Sísmica Europea EMS-98; 1998; Volume 15. Available online: http://media.gfz-potsdam.de/gfz/sec26/resources/documents/PDF/EMS-98_Original_englisch.pdf (accessed on 15 March 2021).
- Jalayer, F.; De Risi, R.; Manfredi, G. Bayesian Cloud Analysis: Efficient structural fragility assessment using linear regression. Bull. Earthq. Eng. 2015, 13, 1183–1203. [Google Scholar] [CrossRef]
- De Estatística, I.N. Census Data 2011. Lisbon. 2011. Available online: http://censos.ine.pt/ (accessed on 15 March 2021).
- Costa, C.; Arduin, D.; Rocha, F.; Velosa, A. Adobe Blocks in the Center of Portugal: Main Characteristics. Int. J. Arch. Herit. 2019, 15, 467–478. [Google Scholar] [CrossRef]
- Correia, M.; Carlos, G.; Merten, J.; Viana, D.; Rocha, S. Vernacular Heritage and Earthen Architecture; Taylor & Francis Group: London, UK, 2013; pp. 111–116. [Google Scholar] [CrossRef]
- Varum, H.; Figueiredo, A.; Silveira, D.; Martins, T.; Costa, A. Investigaciones realizadas en la Universidad de Aveiro sobre caracterización mecánica de las construcciones existentes en adobe en Portugal y propuestas de rehabilitación y refuerzo. Resultados alcanzados. Inf. Constr. 2011, 63, 127–142. [Google Scholar] [CrossRef] [Green Version]
- Varum, H.; Costa, A.; Fonseca, J.; Furtado, A. Behaviour Characterization and Rehabilitation of Adobe Construction. Procedia Eng. 2015, 114, 714–721. [Google Scholar] [CrossRef] [Green Version]
- Varum, H.; Costa, A.; Velosa, A.; Martins, T.; Pereira, H.; Almeida, J. Caracterização mecânica e patológica das construções em Adobe no distrito de Aveiro como suporte em intervenções de reabilitação. In Houses and Cities Built with Earth: Conservation, Significance and Urban Quality; CULTURA 2000—Education and Culture, European Union Program; ARGUMEMTUM: Monsaraz, Portugal, 2006; pp. 41–45. [Google Scholar]
- Silveira, D.; Varum, H.; Costa, A.; Neto, C. Survey of the Facade Walls of Existing Adobe Buildings. Int. J. Arch. Herit. 2016, 10, 867–886. [Google Scholar] [CrossRef] [Green Version]
- IPQ. NP EN 1998-1. Eurocódigo 8: Projecto de Estruturas Para Resistência Aos Sismos. In Parte 1: Regras Gerais, Acções Sísmicas e Regras Para Edifícios; Instituto Português da Qualidade: Caparica, Portugal, 2010; p. 230. (In Portuguese) [Google Scholar]
- Braga, A.M.; Estêvão, J.M.C. Os Sismos E a Construção Em Taipa No Algarve. In Sísmica 2010–8° Congr. Sismol. e Eng. Sísmica; University of Aveiro: Aveiro, Portugal, 2010; pp. 1–13. [Google Scholar]
- Correia, M.R. Rammed Earth in Alentejo; Argumentum: Lisbon, Portugal, 2007. [Google Scholar]
- Cancela, D.C.P. Comportamento Higrotérmico e Monitorização de Construções em Adobe. Master’s Thesis, Civil Engineering, Univeristy of Aveiro, Aveiro, Portugal, 2013. [Google Scholar]
- EN 1995-1-2:2004. Part 1–2: General—Structural fire design. In Eurocode 5: Design of Timber Structures; CEN: Brussels, Belgium, 2004. [Google Scholar]
- Battaglia, L.; Ferreira, T.M.; Lourenço, P.B. Seismic fragility assessment of masonry building aggregates: A case study in the old city Centre of Seixal, Portugal. Earthq. Eng. Struct. Dyn. 2021, 50, 1358–1377. [Google Scholar] [CrossRef]
- Silveira, D.; Varum, H.; Costa, A.; Martins, T.; Pereira, H.; Almeida, J. Mechanical properties of adobe bricks in ancient constructions. Constr. Build. Mater. 2012, 28, 36–44. [Google Scholar] [CrossRef] [Green Version]
- Silveira, D.; Varum, H.; Costa, A. Influence of the testing procedures in the mechanical characterization of adobe bricks. Constr. Build. Mater. 2013, 40, 719–728. [Google Scholar] [CrossRef]
- Silveira, D.; Varum, H.; Costa, A.; Pereira, H.; Sarchi, L.; Monteiro, R. Seismic behavior of two Portuguese adobe buildings: Part I—in-plane cyclic testing of a full-scale adobe wall. Int. J. Arch. Herit. 2018, 12, 922–935. [Google Scholar] [CrossRef]
- Sarchi, L.; Varum, H.; Monteiro, R.; Silveira, D. Seismic behavior of two Portuguese adobe buildings: Part II—numerical modeling and fragility assessment. Int. J. Arch. Herit. 2018, 12, 936–950. [Google Scholar] [CrossRef]
- NIKER. New Integrated Knowledge Based Approaches to the Protection of Cultural Heritage from Earthquake-Induced Risk; Research Report; University of Padova: Padova, Italy, 2010. [Google Scholar]
- Karanikoloudis, G.; Lourenço, P.B. Structural assessment and seismic vulnerability of earthen historic structures. Application of sophisticated numerical and simple analytical models. Eng. Struct. 2018, 160, 488–509. [Google Scholar] [CrossRef] [Green Version]
- Ginell, W.S.; Tolles, E.L. Seismic Stabilization of Historic Adobe Structures. J. Am. Inst. Conserv. 2000, 39, 147–163. [Google Scholar] [CrossRef]
- Vargas, J.; Bariola, J.; Blondet, M.; Mehta, P.K. Seismic strength of adobe masonry. Mater. Struct. 1986, 19, 253–258. [Google Scholar] [CrossRef]
- Blondet, M.; Ginocchio, F.; Marsh, C.; Ottazzi, G.; Villa-Garcia, G.; Yep, J. Shaking Table Test of Improved Adobe Masonry Houses. In Proceedings of the 9th World Conference on Earthquake Engineering, Kyoto, Tokyo, Japan, 2–6 August 1988. [Google Scholar]
- Illampas, R.; Ioannou, I.; Charmpis, D.C. Adobe bricks under compression: Experimental investigation and derivation of stress–strain equation. Constr. Build. Mater. 2014, 53, 83–90. [Google Scholar] [CrossRef]
- Lourenço, P.B.; Pereira, J.M. Seismic Retrofitting Project Recommendations for Advanced Modeling of Historic Earthen Sites; Getty Conservation Institute: Los Angeles, CA, USA; TecMinho–University of Minho: Guimarães, Portugal, 2018. [Google Scholar]
- Alshawa, O.; Sorrentino, L.; Liberatore, D. Simulation Of Shake Table Tests on Out-of-Plane Masonry Buildings. Part (II): Combined Finite-Discrete Elements. Int. J. Arch. Herit. 2016, 11, 1–15. [Google Scholar] [CrossRef]
- Hazay, M.; Munjiza, A. Introduction to the Combined Finite-Discrete Element Method. In Computational Modeling of Masonry Structures Using the Discrete Element Method; IGI Global: Hershey, PA, USA, 2016; pp. 123–145. ISBN 1522502319. [Google Scholar]
- Dis, C. LS-DYNA/LS-PrePost Ex. 0. Introduction 2011, 31 (Suppl. S1), 1–74. [Google Scholar]
- T.M. Inc. MATLAB; T.M. Inc.: Natick, MA, USA, 2018. [Google Scholar]
- D’Altri, A.M.; Sarhosis, V.; Milani, G.; Rots, J.; Cattari, S.; Lagomarsino, S.; Sacco, E.; Tralli, A.; Castellazzi, G.; De Miranda, S. Modeling Strategies for the Computational Analysis of Unreinforced Masonry Structures: Review and Classification. Arch. Comput. Methods Eng. 2020, 27, 1153–1185. [Google Scholar] [CrossRef]
- Pulatsu, B.; Erdogmus, E.; Lourenço, P.B.; Lemos, J.V.; Tuncay, K. Simulation of the in-plane structural behavior of unreinforced masonry walls and buildings using DEM. Structure 2020, 27, 2274–2287. [Google Scholar] [CrossRef]
- Bala, S. Tie-Break Contacts in LS-DYNA; Livemore Software: Livermore, CA, USA, 2007. [Google Scholar]
- Sousa, L.; Marques, M.; Silva, V.; Varum, H. Hazard Disaggregation and Record Selection for Fragility Analysis and Earthquake Loss Estimation. Earthq. Spectra 2017, 33, 529–549. [Google Scholar] [CrossRef]
- Hallquist, J.O. LS Dyna Theory Manual; Livemore Software: Livermore, CA, USA, 2006. [Google Scholar]
- Costa, A.; Humberto, V.; João, M.G. Structural Rehabilitation of Old Buildings; Springer: Berlin/Heidelberg, Germany, 2014. [Google Scholar]
- Pomonis, A. Derivation of Globally Applicable Casualty Rates for use in Earthquake Loss Estimation Models. In Proceedings of the 15th World Conference Earthquake Engineering, Lisbon, Portugal, 24–28 September 2012. [Google Scholar]
- Vamvatsikos, D.; Cornell, C.A. Incremental dynamic analysis. Earthq. Eng. Struct. Dyn. 2002, 31, 491–514. [Google Scholar] [CrossRef]
- Vamvatsikos, D.; Cornell, C.A. Direct Estimation of Seismic Demand and Capacity of Multidegree-of-Freedom Systems through Incremental Dynamic Analysis of Single Degree of Freedom Approximation. J. Struct. Eng. 2005, 131, 589–599. [Google Scholar] [CrossRef] [Green Version]
- Okada, S. Description for indoor space damage degree of building in earthquake. In Proceedings of the Eleventh World Conference on Earthquake Engineering, Acapulco, Mexico, 23–28 June 1996. [Google Scholar]
Figure 1.
Geographical distribution of adobe buildings in Portugal, as reported in the INE 2011 [13].
Figure 1.
Geographical distribution of adobe buildings in Portugal, as reported in the INE 2011 [13].

Figure 2.
Photographs of the main façades: (a) two-story (Building 2); (b) 2-story plus an attic (Building 3).
Figure 2.
Photographs of the main façades: (a) two-story (Building 2); (b) 2-story plus an attic (Building 3).

Figure 3.
Dimensions of Building 1 and details of the modeling in the LS-DYNA environment: (a) elevation view showing the front (main façade), (inset right) close-up of a lintel beam; (b) elevation view showing the symmetric left and right gable end walls; (c) plan view of the building and position of compression-only springs: (left inset) wall thickness detail (right inset) close-up view of a corner intersection, constraints, and interlocking.

Figure 4.
Dimensions of Building 2 and details of the modeling in the LS-DYNA environment: (a) elevation view showing the front (main façade); (b) elevation view showing the left and right walls; (c) plan view of the building and position of compression-only springs (left inset) wall thickness detail.

Figure 5.
Dimensions of Building 3 and details of the modeling in the LS-DYNA environment: (a) elevation view showing the front (main façade) and back (rear façade) showing the gable end walls; (b) elevation view showing the left and right walls; (c) plan view of the building and position of compression-only springs (left inset) wall thickness detail.

Figure 6.
Recreated single adobe double-T wall in the LS-DYNA environment (a) dimensions and detailing; (b) Top and isometric view of the in-plane mode of vibration with its corresponding matched frequency f = 23 Hz.
Figure 6.
Recreated single adobe double-T wall in the LS-DYNA environment (a) dimensions and detailing; (b) Top and isometric view of the in-plane mode of vibration with its corresponding matched frequency f = 23 Hz.

Figure 7.
Framework for vulnerability assessment of adobe buildings.

Figure 8.
Procedure utilizing the automated algorithms in LS-DYNA for pre-processing, processing, and post-processing of the building models.
Figure 8.
Procedure utilizing the automated algorithms in LS-DYNA for pre-processing, processing, and post-processing of the building models.

Figure 9.
Procedure utilizing the automated algorithms in LS-DYNA for pre-processing, processing, and post-processing of the building models.
Figure 9.
Procedure utilizing the automated algorithms in LS-DYNA for pre-processing, processing, and post-processing of the building models.

Figure 10.
Material models in LS-DYNA: (a) Mixed-mode traction-separation law adapted from [10]; (b) assessment of projection distance for a free slave node adapted from [43].

Figure 11.
Fundamental periods of vibration and the corresponding modes for translation in X-direction and Y-direction: (a,b) building 1; (c,d) building 2; (e,f) building 3.
Figure 11.
Fundamental periods of vibration and the corresponding modes for translation in X-direction and Y-direction: (a,b) building 1; (c,d) building 2; (e,f) building 3.

Figure 12.
Response spectra of the bi-directional components of the selected ground motion records: (a) horizontal component in X-direction; (b) horizontal component in Y-direction.
Figure 12.
Response spectra of the bi-directional components of the selected ground motion records: (a) horizontal component in X-direction; (b) horizontal component in Y-direction.

Figure 13.
Crack formation and volume loss shown at the end stage of the non-linear time history analyses sustained by buildings 1–3 for the 5 damage states: (a,d,g,j,m) building 1; (b,e,h,k,n) building 2; (c,f,i,l,o) building 3.
Figure 13.
Crack formation and volume loss shown at the end stage of the non-linear time history analyses sustained by buildings 1–3 for the 5 damage states: (a,d,g,j,m) building 1; (b,e,h,k,n) building 2; (c,f,i,l,o) building 3.


Figure 14.
A schematic of the fragility assessment procedure: (a) probability of exceedance for three IMLs given a damage threshold; (b) Fragility function for a given damage state.
Figure 14.
A schematic of the fragility assessment procedure: (a) probability of exceedance for three IMLs given a damage threshold; (b) Fragility function for a given damage state.

Figure 15.
Illustration of volume loss using Building 2 (adapted from Okada [50]).
Figure 15.
Illustration of volume loss using Building 2 (adapted from Okada [50]).

Figure 16.
Fragility and fatality vulnerability function for each of the building classes, respectively (a,b) 1-story; (c,d) 2-story; (e,f) 2-story plus an attic.
Figure 16.
Fragility and fatality vulnerability function for each of the building classes, respectively (a,b) 1-story; (c,d) 2-story; (e,f) 2-story plus an attic.


Table 1.
Building characteristics and dimensions.
| Building Characteristics | Building 1 | Building 2 | Building 3 | |
|---|---|---|---|---|
| Total no. of stories | 1 | 2 | 2 + Attic | |
| Length (m) | X-direction | 6.30 | 10.80 | 8.20 |
| Y-direction | 7.80 | 9.30 | 12.00 | |
| Area (m2) | 49.14 | 100.44 | 98.40 | |
| Height (m) | 1st Story | 2.85 | 3.30 | 2.40 |
| 2nd Story | - | 3.30 | 3.60 | |
| Attic | - | - | 3.00 | |
| Total height (m) | 2.85 | 6.60 | 9.00 | |
| Total no. of external walls | 4 | 4 | 4 | |
| External wall thickness (cm) | 30 | 60 | 40 | |
| Gable-end walls | Yes | No | Yes | |
| Lintel beams | Yes | Yes | Yes | |
| Total no. of window openings | 4 | 15 | 16 | |
| Total no. of door openings | 2 | 3 | 4 | |
| Total percentage of openings (%) | 10 | 20 | 15 | |
Table 2.
Mechanical properties and input parameters of the numerical models.
| Element | Mechanical Properties | Value | Units |
|---|---|---|---|
| SOLID elements | Young’s modulus | 0.74 | GPa |
| Poison’s ratio | 0.30 | - | |
| Density | 1500 | kg/m3 | |
| Cohesive elements | Static coeff. of friction | 0.4 | - |
| Dynamic coeff. of friction | 0.3 | - | |
| Scale factor for segment penalty stiffness | 1.0 | - | |
| Normal and shear failure stress | 0.05 | MPa | |
| Normal and shear energy release rate | 10, 30, 20 | N/m | |
| Normal (CN) and tangential stiffness | 0.74 | GPa | |
| Springs | Timber elasticity modulus | 7.00 | GPa |
| Timber elasticity modulus (5%) | 4.70 | GPa | |
| Design compressive strength | 16.00 | MPa | |
| Design bending strength | 14.00 | MPa |
Table 3.
Numerical modeling characteristics.
| Building 1 | Building 2 | Building 3 | |
|---|---|---|---|
| Mesh size (cm) | 7.5 | 15 | 10 |
| Block size (cm) | 15 | 30 | 20 |
| No. of nodes | 141,408 | 123,156 | 300,654 |
| No. of solid elements | 42,223 | 37,040 | 89,962 |
| No. of parts | 5162 | 4433 | 10,932 |
| Total volume of blocks composing the walls (m3) | 17.80 | 124.90 | 89.90 |
| Roof | Spring-based | Spring-based | Spring-based |
Table 4.
EDPs and DSs and the corresponding damage thresholds.
| EDPs | DSs | Damage Description | Threshold |
|---|---|---|---|
| Crack propagation ratio | DS 1 | Negligible to slight | 15% |
| DS 2 | Moderate | 25% | |
| Volume loss ratio | DS 3 | Substantial to heavy | 10% |
| DS 4 | Very heavy | 25% | |
| DS 5 | Destruction | 40% |
Table 5.
Fatality vulnerability parameters for adobe buildings.
| Building Class | θ * | β ** |
|---|---|---|
| 1-story | 1.06 | 0.88 |
| 2-story | 0.45 | 0.75 |
| 2-story plus attic | 0.45 | 0.77 |
* θ—logarithmic mean, ** β—logarithmic standard deviation.
Table 6.
Fragility parameters for adobe buildings.
| Building Class | IM | DS 1 | DS 2 | DS 3 | DS 4 | DS 5 | |||||
|---|---|---|---|---|---|---|---|---|---|---|---|
| µ * | σ ** | µ | σ | µ | σ | µ | σ | µ | σ | ||
| 1-story | PGA | −0.89 | 0.39 | −0.67 | 0.39 | −0.43 | 0.37 | −0.20 | 0.37 | −0.08 | 0.37 |
| 2-story | PGA | −1.38 | 0.43 | −1.00 | 0.43 | −0.38 | 0.50 | −0.05 | 0.50 | 0.12 | 0.50 |
| 2-story plus attic | PGA | −1.39 | 0.42 | −0.96 | 0.42 | −0.46 | 0.49 | −0.17 | 0.49 | −0.02 | 0.49 |
* µ—logarithmic mean, ** σ—logarithmic standard deviation.
Publisher’s Note: MDPI stays neutral with regard to jurisdictional claims in published maps and institutional affiliations. |
© 2021 by the authors. Licensee MDPI, Basel, Switzerland. This article is an open access article distributed under the terms and conditions of the Creative Commons Attribution (CC BY) license (https://creativecommons.org/licenses/by/4.0/).
Share and Cite
MDPI and ACS Style
Momin, S.; Lovon, H.; Silva, V.; Ferreira, T.M.; Vicente, R. Seismic Vulnerability Assessment of Portuguese Adobe Buildings. Buildings 2021, 11, 200. https://doi.org/10.3390/buildings11050200
AMA Style
Momin S, Lovon H, Silva V, Ferreira TM, Vicente R. Seismic Vulnerability Assessment of Portuguese Adobe Buildings. Buildings. 2021; 11(5):200. https://doi.org/10.3390/buildings11050200
Chicago/Turabian StyleMomin, Samar, Holger Lovon, Vitor Silva, Tiago Miguel Ferreira, and Romeu Vicente. 2021. "Seismic Vulnerability Assessment of Portuguese Adobe Buildings" Buildings 11, no. 5: 200. https://doi.org/10.3390/buildings11050200
Note that from the first issue of 2016, this journal uses article numbers instead of page numbers. See further details here.