
An Evaluation of Useful Daylight Illuminance in an Office Room with a Light Shelf and Translucent Ceiling at 51° N


Faculty of Architecture, Wroclaw University of Science and Technology, Prusa 53/55, 50-317 Wroclaw, Poland
Buildings 2021, 11(11), 494; https://doi.org/10.3390/buildings11110494
Submission received: 29 September 2021
/
Revised: 16 October 2021
/
Accepted: 17 October 2021
/
Published: 20 October 2021
(This article belongs to the Special Issue Architecture, City, People, and Structure)
Abstract
:The present study investigates the issue of computer-aided daylight evaluation in an office room with a light shelf and dropped translucent ceiling. In this type of room, daylight is admitted from two sources: (i) a standard window in the wall and (ii) via a light shelf and clerestory window, which illuminate the plenum located above the working space. The light from the plenum is transmitted through the translucent ceiling into the office room. The present study is based on data obtained through a computer-aided daylight simulation by DeLuminæ (DL-Light, ver. 11.0.9, and DL-Instant, ver. 6.1.4) software using the Radiance engine and real weather data for Wroclaw, Poland, at 51st lat. N. An office room of 12 × 6 m with different shading and daylight distribution scenarios was simulated (Variants 1–5). Next, the useful daylight illuminance (UDI (%)) for the range of 300–3000 lx and daylight glare probability (DGP) were calculated. To further optimize the daylighting scenarios, an adaptive shading system was simulated, which was activated when the illuminance value dropped below 300 lx. In the final variant, Variant 6, mean UDI300–3000 values were recorded to be above 80% for 95% of the area of the work plane. This allows the conclusion that a light shelf and translucent ceiling guide daylight deep into the room, improving uniformity and reducing glare when the standard window is covered by an adaptive shading system.
1. Introduction
Nowadays, the issues of adequate access to daylight are attracting a lot of attention. The reason for this is not only the drive to meet regulations and standards but also the desire to provide visual comfort to users. Direct sunlight is responsible for the synthesis of vitamin D in the human body, so access to daylight is also a matter of health and well-being. Issues of access to daylight are particularly often addressed in the context of living spaces, and strict national regulations exist in this area (e.g., the Right to Light [1]). However, people spend a significant portion of their day in workplaces that are subject to different regulations. Workers’ visual comfort is also consistently gaining in importance and is the subject of lively scientific discussion and research.
Much attention is being paid to office spaces. In the current architectural paradigm of all-glass facades, office spaces are usually overlit, rooms are illuminated only from one side and the depths are increasing. Despite these adverse circumstances, designers need to provide adequate lighting, as certain ranges of illuminance are required to perform tasks at the working plane.
The use of daylight is a special challenge in office spaces, as this type of illumination is subject to high variability over time. Additionally, office rooms are usually illuminated by a window, which is installed in the façade. This causes uneven distribution of daylight in a room, with very high levels of illuminance near the window and the depth of the room underlit. Hellinga writes that the impact of a window on workers’ visual comfort is positive “as long as they do not cause glare, thermal discomfort, or a loss of privacy” [2]. Glare is defined as a “condition of vision in which there is discomfort or a reduction in the ability to see details or objects, caused by an unsuitable distribution or range of luminance” (CIBSE Lighting Guide LG7, 2015) [3].
One of the possible ways of bringing daylight deep into the workspace is illumination from above, which is used commonly in industrial buildings. In office towers, due to the obvious multi-floor building structure, the systems of direct zenithal lighting—skylights and dormers—are excluded. A light shelf (LS) is a well-established and exhaustively researched system (see Section 2), which—in its basic form—guides the light from the façade deep into the room using different types of flat solar reflectors and the ceiling (an anidolic system uses curved reflectors). The advantage of a light shelf is that (i) the systems are natural lighting systems, (ii) they offer better daylight distribution over the working plane, (iii) they reduce energy consumption for artificial lighting, and (iv) they offer improved color reproduction. Technologies designed to reduce energy demand are particularly important because of their influence on achieving the 17 sustainable development goals defined by the United Nations [4], with particular attention to goal 11 (sustainable cities and communities) and goal 13 (climate action), by cutting down CO2 emissions.
In the presented paper, a special type of light shelf (LS) in conjunction with a translucent ceiling (TC) is evaluated. In this type of solution, the light shelf illuminates the plenum located over the entire office room. Daylight is redirected in the plenum by multiplied reflections and then transmitted through the translucent dropped ceiling into the office room. The idea of using a translucent ceiling to scatter daylight is not new. Previous studies by the author show that “since ancient times, light-permeable fabric has been used to scatter light coming from above in rooms and open spaces” [5]. A velarium—an awning stretching over an ancient theatre—was used to avoid glare and limit direct sunlight illumination reaching spectators [6]. Papers report the use of a velarium in the Colosseum [7], Amphitheatre in Pula [8], Teatro Grande in Pompeii and Teatro Romano in Benevento [9]. At the end of the XIX century, with the increasing number of exhibition spaces, translucent dropped ceilings were used in museums, e.g., Museum Boijmans Van Beuningen in Rotterdam [10], Pinacoteca di Brera in Milan [11], Sant’Agostino Museum in Genova and Castelvecchio Museum in Verona. The most recent applications feature the Beyeler Foundation in Basel and the High Museum Expansion in Atlanta.
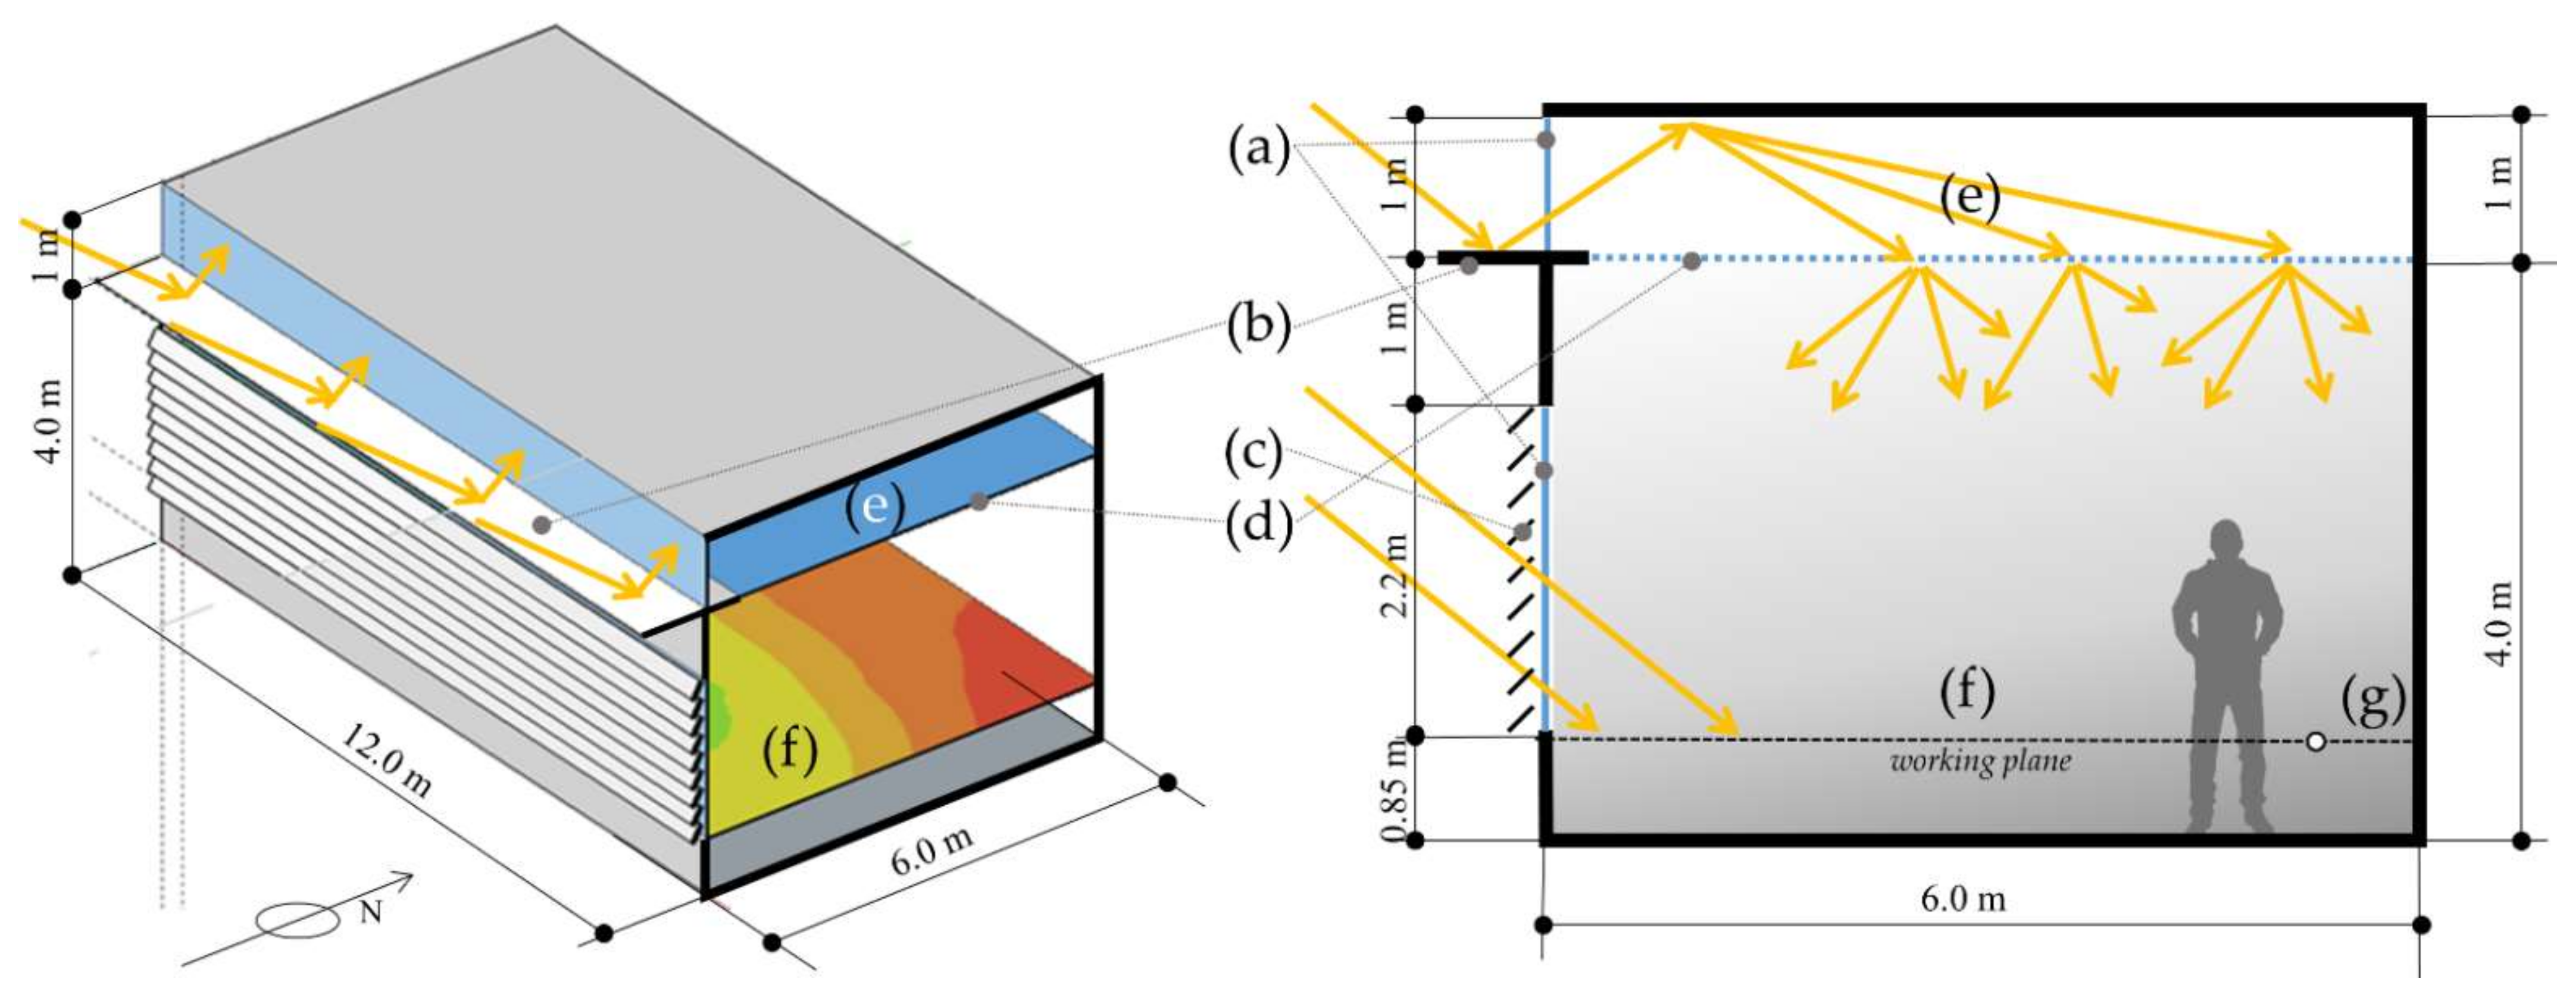
However, to date—as chapter 2 shows—limited attention has been paid to daylight evaluation of an office room indirectly illuminated from above with the use of LS and TC. The present paper offers a solution, in which there are two sources of daylight in an office room: (i) a regular south-facing window in a façade (a, see Figure 1) and (ii) a light shelf (b) and a translucent ceiling system (d). The regular window is equipped with horizontal louvres (c) to regulate daylight. In the LS/TC system, daylight is guided by an external light shelf (b), admitted through a clerestory (window placed in the wall, above the regular window), distributed in the plenum (e) and transmitted through the translucent dropped ceiling (d) into the room (see Figure 1). The values of illuminance are simulated for the working plane (f), located 0.85 m above the floor level in the test room. Sensor A (g) is placed deep in the room to record the values of illuminance specific for the area more distant from the window. In the presented solution, the effect of direct solar illumination from LS is excluded, as a translucent ceiling is used. The analyzed solution shows some affinity to anidolic non-imaging optic systems (an meaning “without” and eidolon meaning the “image” in Greek) and other light redirecting systems.
Objective of the Study
This paper suggests a procedure (computer simulation) to evaluate the illuminance and luminance values coming from reflected and scattered daylight in a modeled office test room. For this purpose, different illuminating scenarios (Variants 1–6) are implemented using horizontal louvres to regulate the influx of daylight through a regular window and the LS-TC system. The main aim of the present paper is to verify the maximal level of UDI that is possible to be achieved using mixed settings of both systems of daylight distribution (regular window and LS-TC system).
Specifically, the objectives of this study are to determine (i) the level of useful daylight illuminance (UDI), (ii) the level of luminance and daylight glare probability (DGP) and (iii) the optimal daylighting scenario to maximize UDI, using an adopted test room and real weather data. To facilitate this research, a test room was chosen, and two types of analysis were carried out: illuminance and luminance. A two-step methodology was applied.
2. State of the Research
2.1. Method and Eligibility Criteria
The data for the literature review were acquired from international scientific databases (WoS and Scopus—last search 13 September 2021). The author examined the words in the titles and abstracts of similar studies to specify candidate search terms (“keywords”). The search strategy for all databases included papers with the keywords “light shelf” and “daylight”. The daylight distribution solution analyzed in this paper includes the part that might be considered as related to the “light duct”; therefore, the search was expanded to include the keyword “anidolic”. The scientific method applied in this paper includes the simulation of shading elements; therefore, references regarding this were also included.
Study selection was a multi-stage process, according to the standard defined by the PRISMA protocol [12]. This multi-stage process is composed of three phases: (i) identification, (ii) screening and (iii) inclusion. First, potential studies were identified from the initial review of titles and abstracts. It became evident that “light shelf” was the subject of many studies in the span of the last 20 years in the discipline of building engineering. Second, a single researcher (MB) screened the titles and abstracts of 239 records (published in the years 2017–2021), and—after the previous step was completed—the same researcher double screened the abstracts from the years 1996–2021. In consequence—after the removal of duplicates—156 records were screened, from which 34 full-text documents were retrieved and reviewed in detail, and finally, 26 (each cited) papers were included in the literature review. The PRISMA protocol flow diagram is available as Supplementary Material.
For the sake of clarity, the results of the literature review are presented in tabular form (see Table 1). In the table, the column “Research Focus” includes a summary of the approach of different research teams, while in the column “Research Gap”, potential room for improvement or innovation is shortly outlined. The main scientific method for the literature study used was a desk study (PC with an internet connection); no automation tools were used.
2.2. Light Shelf
Daylight distribution is one of the most important aspects of a comfortable working environment. It is currently the subject of many research projects, procedures and design works. In the view of climate change and raising environmental awareness of the issues of daylight, distribution has become a discipline balancing the issues of viewer’s comfort and sustainability.
Many reports have been prepared from the perspective of the daylight distribution system, approaching the issue from the point of view of visual comfort and energy. Early in 1996, Soler and Oteiza performed an experiment featuring a light shelf using two (1:10) scale models for the location Madrid. The authors concluded that a “light shelf may be recommended (…) as a daylighting device in view of the large proportion of clear days” [13]. Later in 2002, Claros in a team with Soler studied the influence of light shelf and model reflectance on light shelf performance [14]; they concluded that a “light shelf (…) is recommended because of the shading effect” for the study conducted in Madrid. It seems that again, light shelves—as a main area of research—come back in the second decade of the XX century. In 2013, Safa et al. presented a study of the optimization of the light shelf system in hot and arid zones [15]. Later, Kurtay and Esen presented an evaluation of light shelf performance detected in an overcast sky, and subsequently, in 2017, the same team presented a refined version of the previous paper—a new method for light shelf design according to latitudes [16]. In 2015, Berardi and Anaraki analyzed the impact of light shelves on the useful daylight illuminance [17]. The previous paper is followed in 2018 by a paper analyzing the benefits of light shelves over the daylight illuminance in office buildings in Toronto [18]. In 2016, Meresi evaluates the daylight performance of light shelves combined with external blinds in south-facing classrooms in Athens, Greece [19]. Due to the similarity with the presented research, the papers by Berardi and Anaraki and Meresi are the main sources of reference, especially because the same metrics (UDI) and software are used (Radiance). In 2017, the team of Warrier and Raphael experimentally and objectively evaluated the potential of light shelves to improve daylighting and visual comfort. They concluded that “in 30% of the simulated cases, horizontal light shelves are found to increase the illuminance near the window, thereby increasing the possibility of glare” [20].
In 2017, the first publication of the team of Lee et al. was published, studying the effectiveness of a perforated light shelf for an energy-saving scenario [21]. In the following years till the current time, the team of Prof. Heangwoo Lee published 11 papers considering different aspects of a light shelf and its performance. Those papers feature a light shelf using diffused reflection [22]; a movable light shelf system [23]; an awning system with a built-in light shelf [24]; the use of a diffusion sheet [25]; an evaluation of a light shelf based on energy consumption [26]; a light shelf with a solar module [27]; a light shelf based on reflector curvature [28] application of a prism sheet [29]; a movable light shelf with a rolling reflector [30]; and finally, in 2021, light shelves with photovoltaic modules [31].
Starting from 2020, other research teams contributed to the issue of a light shelf. In 2020, the team of Avila-Zamora and Murillo-Quirós presented an experimental study of light distribution in a scale model using different types of light shelves and evaluated the illuminance in the cross-section of a room [32]. Moreover, in 2020, the team of Sadaf et al. presented a comparative study on daylight performance assessment of light shelves based on inclination [33]. The latest publication included in the review is a paper by the team of Ruggiero et al. published in 2021 with the energy analysis of the application of a light shelf, concluding that “the best solution is given by the application of an internal horizontal light shelf placed at 50 cm from the top of the window with a depth of 90 or 60 cm” [34].
2.3. Anidolic Daylighting System
Anidolic daylighting systems are systems that use mirrors, lenses and light guides to collect the light outside and direct it into the depth of the room. The light is usually scattered to avoid glare. The light distribution system that is used in this paper features a plenum space for light distribution that shows some affinity with a “light duct”, which is frequently used in anidolic daylighting systems. As early as 1998, Courret et al. analyzed an anidolic duct in a room with overcast outdoor conditions in a non-residential building [35]. Following that, in 2002, Scartezzini in a team with Courret evaluated three different anidolic systems (anidolic ceiling, integrated anidolic system and anidolic solar blinds) [36]. In 2007, Wittkopf presented an analysis of an anidolic ceiling for diffuse daylight in Singapore, featuring a light duct that occupied the entire depth of the room [37]. In 2016, Binarti and Satwiko provided an evaluation of an affordable anidolic daylighting system with a light duct, channeling light from the façade deep into the house [38].
2.4. Shading Elements
The problem of shading elements has been investigated from many different perspectives. The general approach is toward the minimization of heat gain and the reduction in illuminance. Most authors use useful daylight illuminance (UDI) and daylight glare probability (DGP) in the evaluation of shading systems. Shading elements and their influence on building energy requirements were studied by Palmero-Marrero and Oliveira [39], Gratia and De Herde [40] and Manzan [41]. Usually, different forms of louvers and blinds are used in different positions and locations in relation to the window (e.g., by Atzeri et al. [42] and Zheng et al. [43]). For example, Alzoubi and Al-Zoubi evaluated the performance of vertical and horizontal shading devices for south-exposed façades in a dry climate. Despite this limitation (very different latitude), the results of Alzoubi and Al-Zoubi are very relevant to the present study. According to the above-mentioned study, horizontal louvers are “most effective in regulating illuminance level in the interior and for the illumination uniformity” [44]. Shading studies are not included in Table 1, as they are only connected with the simulation part of the present study.
2.5. Maximum Discomfort Daylight Levels
From the perspective of the present research, one of the important issues connected with visual comfort in an office room is overexposure and glare. These issues were previously analyzed by many researchers, but a summary of values should also be given here. In 2019, Suk presented a review of various studies providing different glare discomfort thresholds [45]. According to the above-mentioned data, different authors give a different threshold: Sutter et al. > 3200 lx [46], Linney > 2740 lx [47] and Wymelenberg and Inanici > 4000 lx [48]. Mardaljevic et al. [49] define the 3000 lx threshold as an indicator of discomfort glare. This means that when illuminance exceeds 3000 lux, the likelihood of glare as calculated by the daylight glare probability (DGP) increases. This maximum level is therefore used in the present paper, which is fully explained in Section 3.2.1.
2.6. The Current Empirical Research
The presented paper aims to develop a new procedure for the assessment of useful daylight illuminance (UDI) and daylight glare probability (DGP) based on Radiance-calculated values of illumination at the working plane. The innovativeness of the presented approach relies on previously unexplored factors, which include the following:
- A new typology of an office room that is illuminated by two sources of daylight: a standard window and through LS and TC. A few similar daylight distribution scenarios have been previously analyzed, as cited above, but none of them featured a plenum with a translucent ceiling at the entire surface of the test room. This type of daylight distribution is used in museums but not in offices; at least, no analytical simulation study of this type is known to the author. The fact that the main strategy adopted is to further the increase in visual comfort (an increase in UDI and reduction in DGP) also demonstrates the innovativeness of the presented approach. UDI was successfully used in a previous publication by the author to evaluate the level of daylight [50].
- A computer-aided procedure is applied, which is based on the calculation of illuminance over the entire year at the level of the working plane. This procedure uses a simulation performed by the Radiance engine. This innovative approach incorporates different scenarios for the operation of external louvers that adjust according to the illuminance level at the work plane in the office room.
- A computer-aided procedure is applied, which uses real weather data in an EPW (Energy Plus Weather) file that represent actual climate and daylighting conditions, recorded at the airport Strachowice in the city of Wroclaw (51°10′ lat. N, 17°03′ long. E), WMO station identifier 124240. The data set was “developed for use in energy calculations for buildings and dwellings including building certificates and building energy research” [51]. A set of 61 weather files was developed by the Polish Ministry of Infrastructure based on data from IMGW (Institute of Meteorology and Water Management, National Research Institute, Poland). The weather data were retrieved from the EnergyPlus weather web page (https://energyplus.net/weather (accessed on 14 October 2021).
3. Method
As mentioned in the Introduction, a two-step methodology was used in this paper: S1 is used to evaluate the values of illuminance, and S2 used is to evaluate the values of luminance. Every step was performed in three phases, first, for Variants 1 and 2; second, for Variants 3 and 4; and third, for Variants 5 and 6. The details of the method are given accordingly in the sub-chapters below.
3.1. Simulation Software
The useful daylight illuminance (UDI) in % was calculated based on the illuminance values simulated for every hour in the year in the “annual simulation campaign”. The calculations were performed using a 3D model of the test office room (see Figure 1) and Radiance-based software DeLuminæ (DL-Light, ver. 11.0.9) for SketchUp. DeLuminæ is a reliable, fast and intuitive daylight simulation for 3D architectural and urban models directly integrated within the SketchUp graphic modeller, which was developed by a French company owned by Ljubica Mudri and Jean-Dominique Lénard. Daylight glare probability (DGP—numerical values in the range of 0.0–1.0) was calculated based on the momentary levels of luminance in the office room with the use of the DL-Instant Extension plug-in (ver. 6.1.4). All of the DL-Light tools used in the background validated the Radiance software for physically based simulations.
In the presented simulation campaign, the 3D model used featured translucent surfaces and horizontal Venetian-style louvers. Although Radiance is software that was previously numerously validated by other researchers, it is worth mentioning that Reinhart and Walkenhorst proved that Radiance-based simulation methods “are able to efficiently and accurately model complicated daylighting elements such as (…) Venetian blind system” [52]. Additionally, Reinhart and Andersen have shown that translucent materials “can be modeled in Radiance with an even higher accuracy than was demonstrated in earlier (…)” [53].
3.2. Measures Adopted in the Current Study
The evaluation of daylight was based on various parameters. Some of them were related to the illuminance of the surface of the working plane and expressed in lx, while others were based on a luminance study and expressed in cd/m2. Some metrics were defined by the author. Below, the list of the metrics used in this study is presented:
- Useful daylight illuminance UDI300–3000 and mean ;
- The average number of hours in the simulated year for which the illumination exceeded 3000 lx at the working plane t > 3000;
- The average number of hours in the simulated year for which the illumination was lower than 300 lx at the working plane t < 300;
- Maximal illuminance value in the year Emax;
- Mean daylight uniformity Umean for values of illuminance at equinox 14:30;
- Daylight glare probability DGP for values of luminance at equinox 14:30;
- Luminance probe values in cd/m2;
- Standard deviation σ and uniformity U300–3000 for final UDI300–3000 distribution.
A brief description of the main metrics is given below, and a diagram of the procedure is given in Section 3.5.
3.2.1. UDI300–3000 and
Following the results of the analysis of four daylight metrics given by Boubekri and Lee [54], the metric that was used in the present paper is useful daylight illuminance (UDI). The UDI metric was originally suggested in 2005 in a paper by Nabil and Mardaljevic [55]. UDI determinates the percentage of the time that the interior daylight illuminance in a room falls within a user-defined range (here, between 300 and 3000 lux). A time frame could also be suggested (here, 8 working hours, 8:00–16:00, 5 days a week). In brief, UDI represents the annual occurrence of daylight illuminances falling within a given range. In 2012, Mardaljevic et al. reported illuminance in the “range 300 to around 3000 lux is often perceived either as desirable or at least tolerable” [49]; therefore, those values were used in the present paper. The UDI metric is denoted as UDI300–3000. Mardaljevic et al. also state that UDI300–3000 “gives the occurrence of daylight illuminances in the range 300 to 3000 lux where additional artificial lighting will most likely not be needed” [49]; therefore, it might be simplified as the greater the value of UDI300–3000, which is expressed as a percentage of the year, the more autonomous the lighting in the test room is (meaning artificial light is not required).
Moreover, as the standard EN 17037 (2018) states: “a space is considered to provide adequate daylight if a target illuminance level is achieved across a fraction of the reference plane within a space for at least half of the daylight hours” (EN 17037, 2018). This “fraction” of space for the target level (spatial scale) should be at least 50% of the floor area. In the present paper, those values were adopted, and the gradual optimization of the presented daylight solutions was directed toward meeting, or even exceeding, those standards.
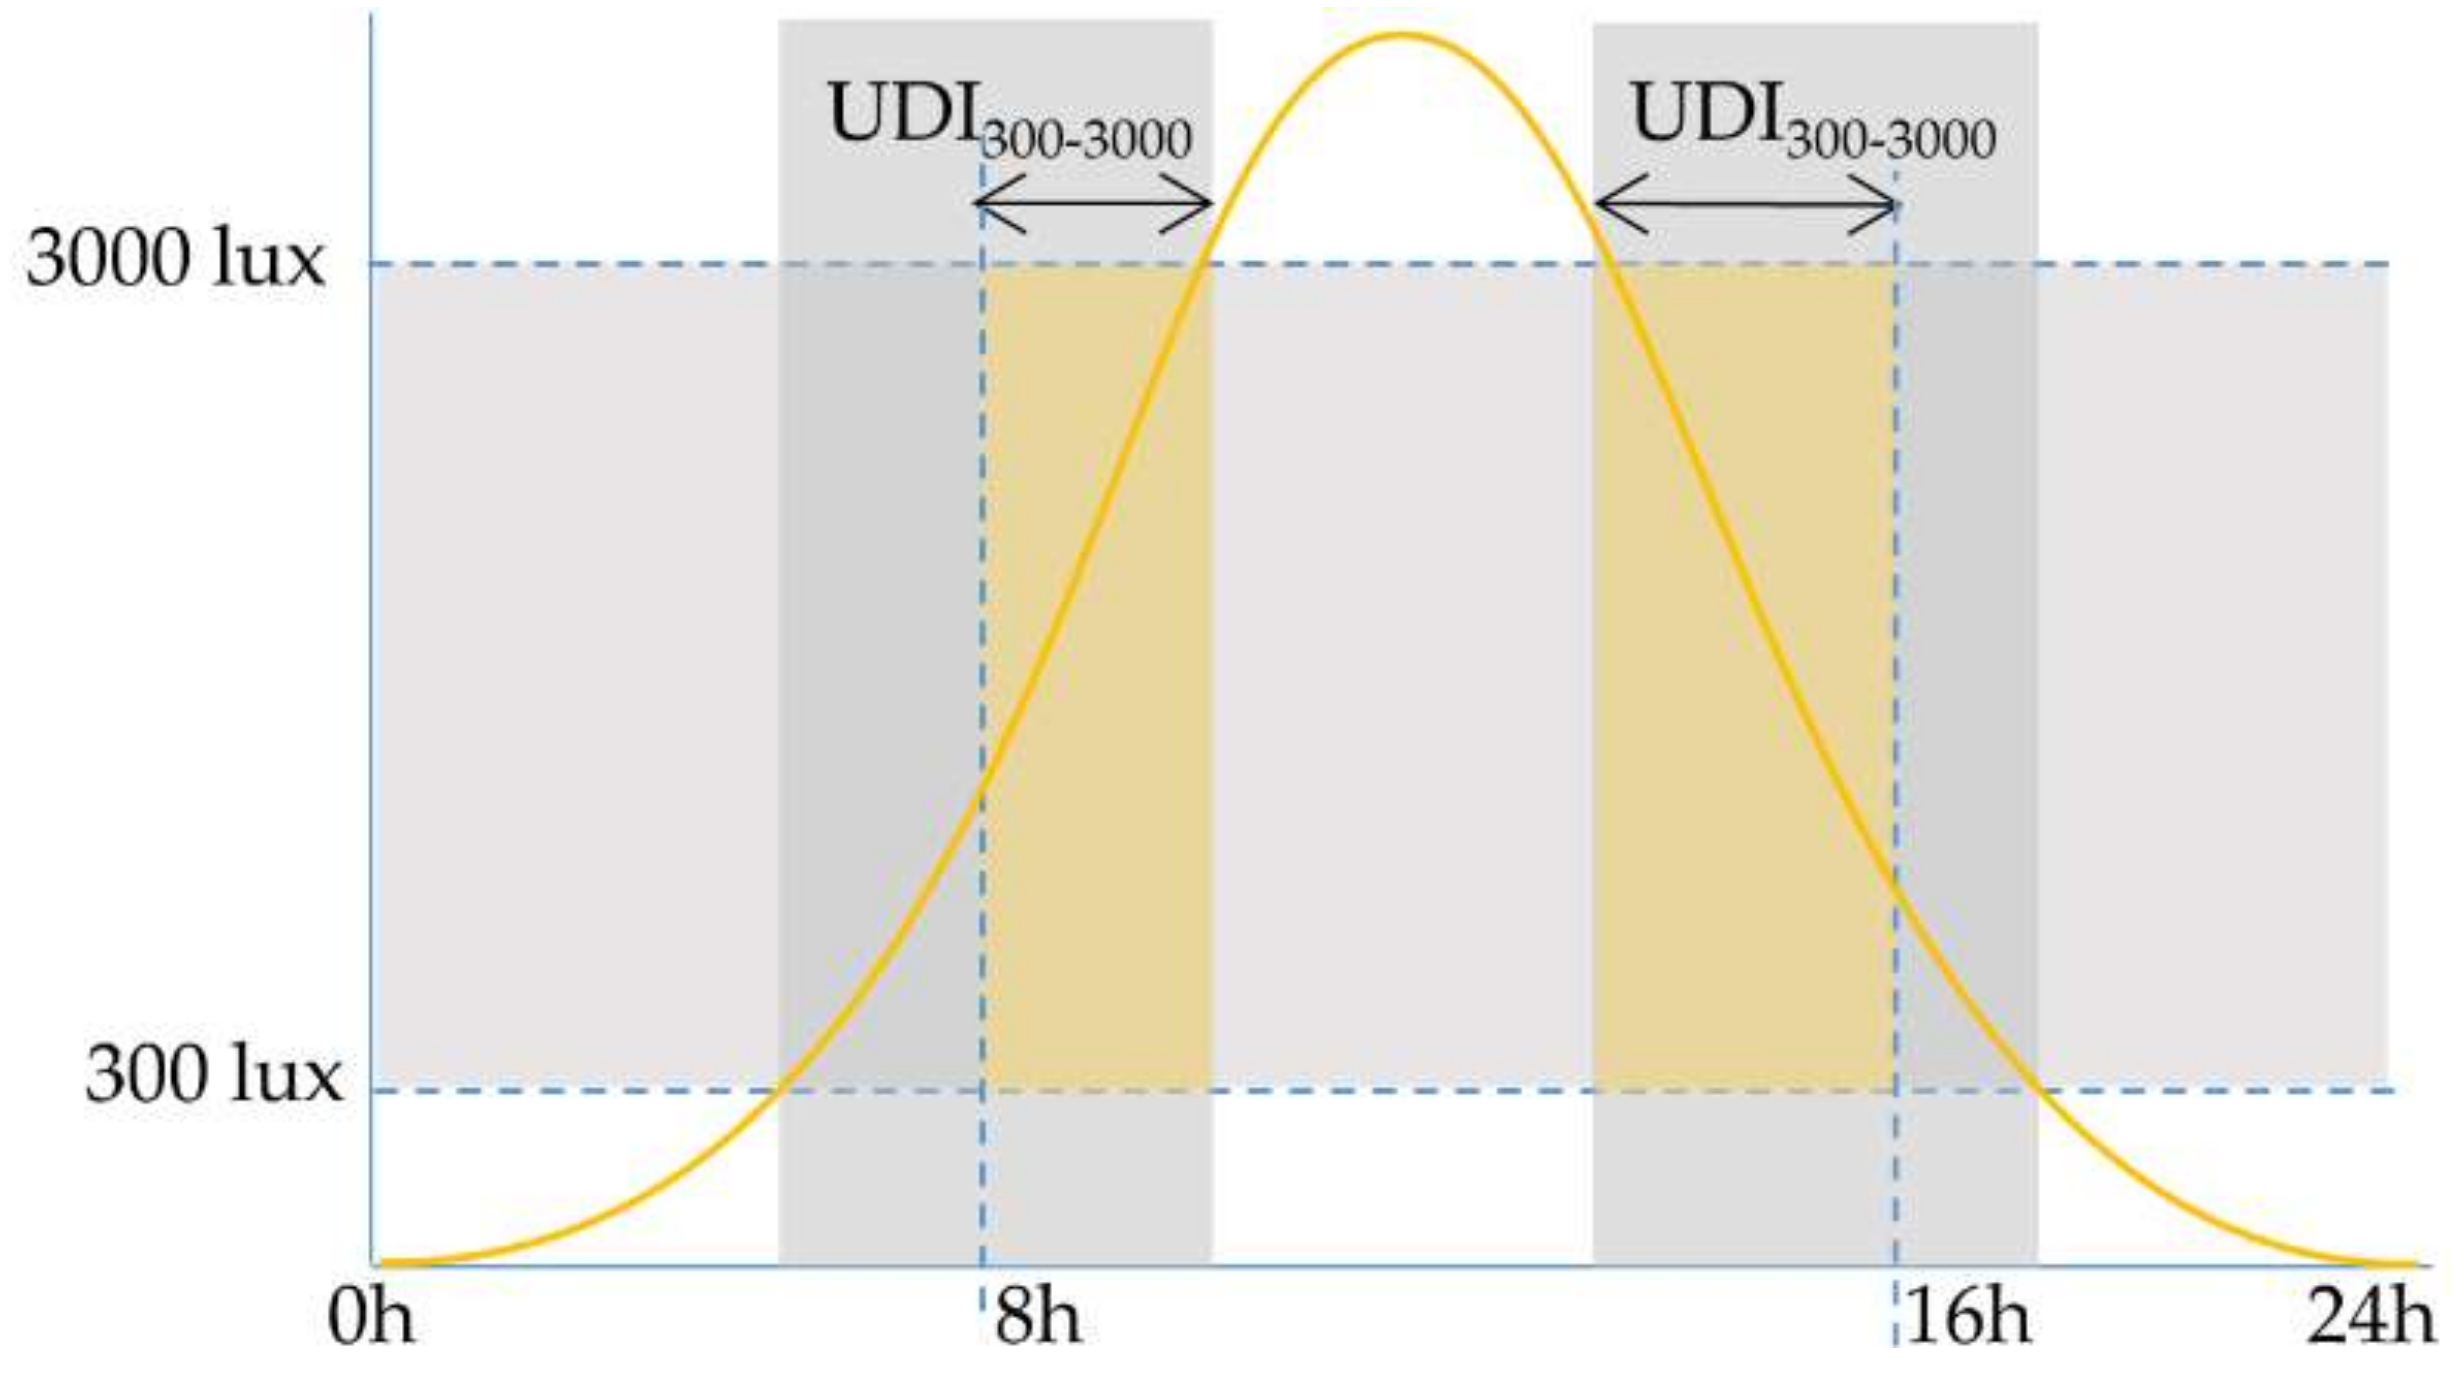
UDI300–3000 was calculated based on the values of illuminance Ev at the surface of the working plane, 0.85 m above the floor level. The value of Ev was simulated for each hour of the year. For the analyzed daylight scenario, it was necessary to calculate 4,099,680 illuminance values (78 sensor grid points per 8760 h for the six analyzed variants). For the final calculation of UDI300–3000, the values from 8:00 to 16:00 (8 h working day) from Monday to Friday were taken (in total for 2088 working hours over 261 working days in the year). Figure 2 explains the UDI300–3000 calculation in graphical form (see Figure 2).
UDI300–3000 was calculated for 78 sensors, and its spatial distribution at the level of the working plane is given in the diagrams is the Section 4. However, an additional metric is provided marked/denoted as , which is the average of the final UDI300–3000 values. Taking the average might be considered as an oversimplification and does not allow the presentation of all of the spatial distribution of the obtained results, but it was chosen for ease of presenting the results of subsequent variants with a single number.
Additionally, uniformity U300–3000 and standard deviation σ for the final values of UDI300–3000 were calculated. Uniformity U300–3000 was calculated according to the formula U300–3000 = UDImin/. Please bear in mind that U300–3000 and Us are different metrics.
3.2.2. Uniformity of Illuminance
The uniformity of illuminance Us is defined as “the ratio between the minimum illuminance (from daylight) on the working plane within a room and the average illuminance (from daylight) on the same working plane” [56]. Us was calculated based on Formula (1). It was calculated for momentarily values of illuminance Ev, and in the present paper, Us was calculated for equinox (20 March and 22 September, at 14:30—see the detailed explanation below).
where Emin is the minimal value of illuminance, and is an average value of illuminance at the surface of the working plane calculated for 78 sensors at a specified hour in the year. If uniformity equals 1, the working plane is evenly illuminated; the lower the value of Us (as the fraction of unity), the lower the uniformity of illumination at the surface of the working plane.
3.2.3. Daylight Glare Probability
Jan Wienold at the Fraunhofer Institute for Solar Energy Systems defined daylight glare probability (DGP) for the first time in the year 2006 in a paper published with Jens Christoffersen [57]. DGP is expressed in % or as a fraction of unity. DGP is higher when the illuminance increases, with some influence on the direction of the view. DGP was originally evaluated in many variants, and finally, this metric was calculated according to Formula (2), where Ev is the vertical eye illuminance (lux); Ls is the luminance of the source (cd/m2); ωs is the solid angle of the source; and P is the position index (see Reference [57]).
According to Wienold and Christoffersen, with DGP above 35% (<2000 lux), the glare is rated as “Perceptible”, and with DGP above 45% (>6000 lux/>4500 lux), the glare is “Intolerable”.
In the present paper, DGP was calculated automatically using the DL-Instant Extension plug-in (ver. 6.1.4). The calculation of DGP and Us and the estimation of glare were performed for equinox (20 March and 22 September, at 14:30) for a person of average height (1.8 m) standing inside the room looking west, toward the Sun. The reason for choosing this particular day, this time and this view was due to the geometry of the analyzed room and the Sun’s path. One of the most significant factors contributing to the glare sensation is the bright patches of light that form on the working plane. These unfavorable circumstances occur when the observer is looking toward the Sun and the working plane is illuminated by bright spots of light, reaching almost half of the width of the test room. It should be noted that an evaluation for the longest day of the year—21 June, at noon—was performed, but this particular day is characterized by the high position of the Sun in the sky, which results in a relatively small area of increased luminance at the working plane. It was assumed that the potential decrease in DGP for equinox (20 March and 22 September, at 14:30) would turn out beneficial for all other days of the year using the daylight management strategies used in the gradually evaluated variants.
3.2.4. Luminance Evaluation
Luminance evaluation was performed using the false-color diagrams generated by the Instant Extension plug-in (ver. 6.1.4) with the use of the same color scale for all variants; the scale is given accordingly in Figures 5–7. Additionally, two probes were placed in the room: one in the bright spot (in the bright patch of sunlight—probe A) and the other deep in the room in the shadow—probe B. The values of the probes are given in the false-color diagrams in Section 4.
3.3. Simulation Setup for UDI and DGP
The case study office room that was analyzed in the current study was a 12.0 × 6.0 m exhibition room with a height of 4.0 m (72 m2 and 288 m3). Two axes of symmetry were aligned with the directions of the compass (N–S and W–E). The office room was illuminated by two daylight sources: (i) a standard south-facing window of 2.2 m height glazed with transparent glass and (ii) a translucent dropped ceiling illuminated by the clerestory window placed over the standard window. All the materials used for the simulation featured the parameters given in Table 2 according to the geometry given in Figure 1. UDI was calculated for the surface of the working plane, 12.0 × 6.0 m, placed 0.85 m above the floor level.
3.4. Analysis Assumptions for Calculations of Daylight
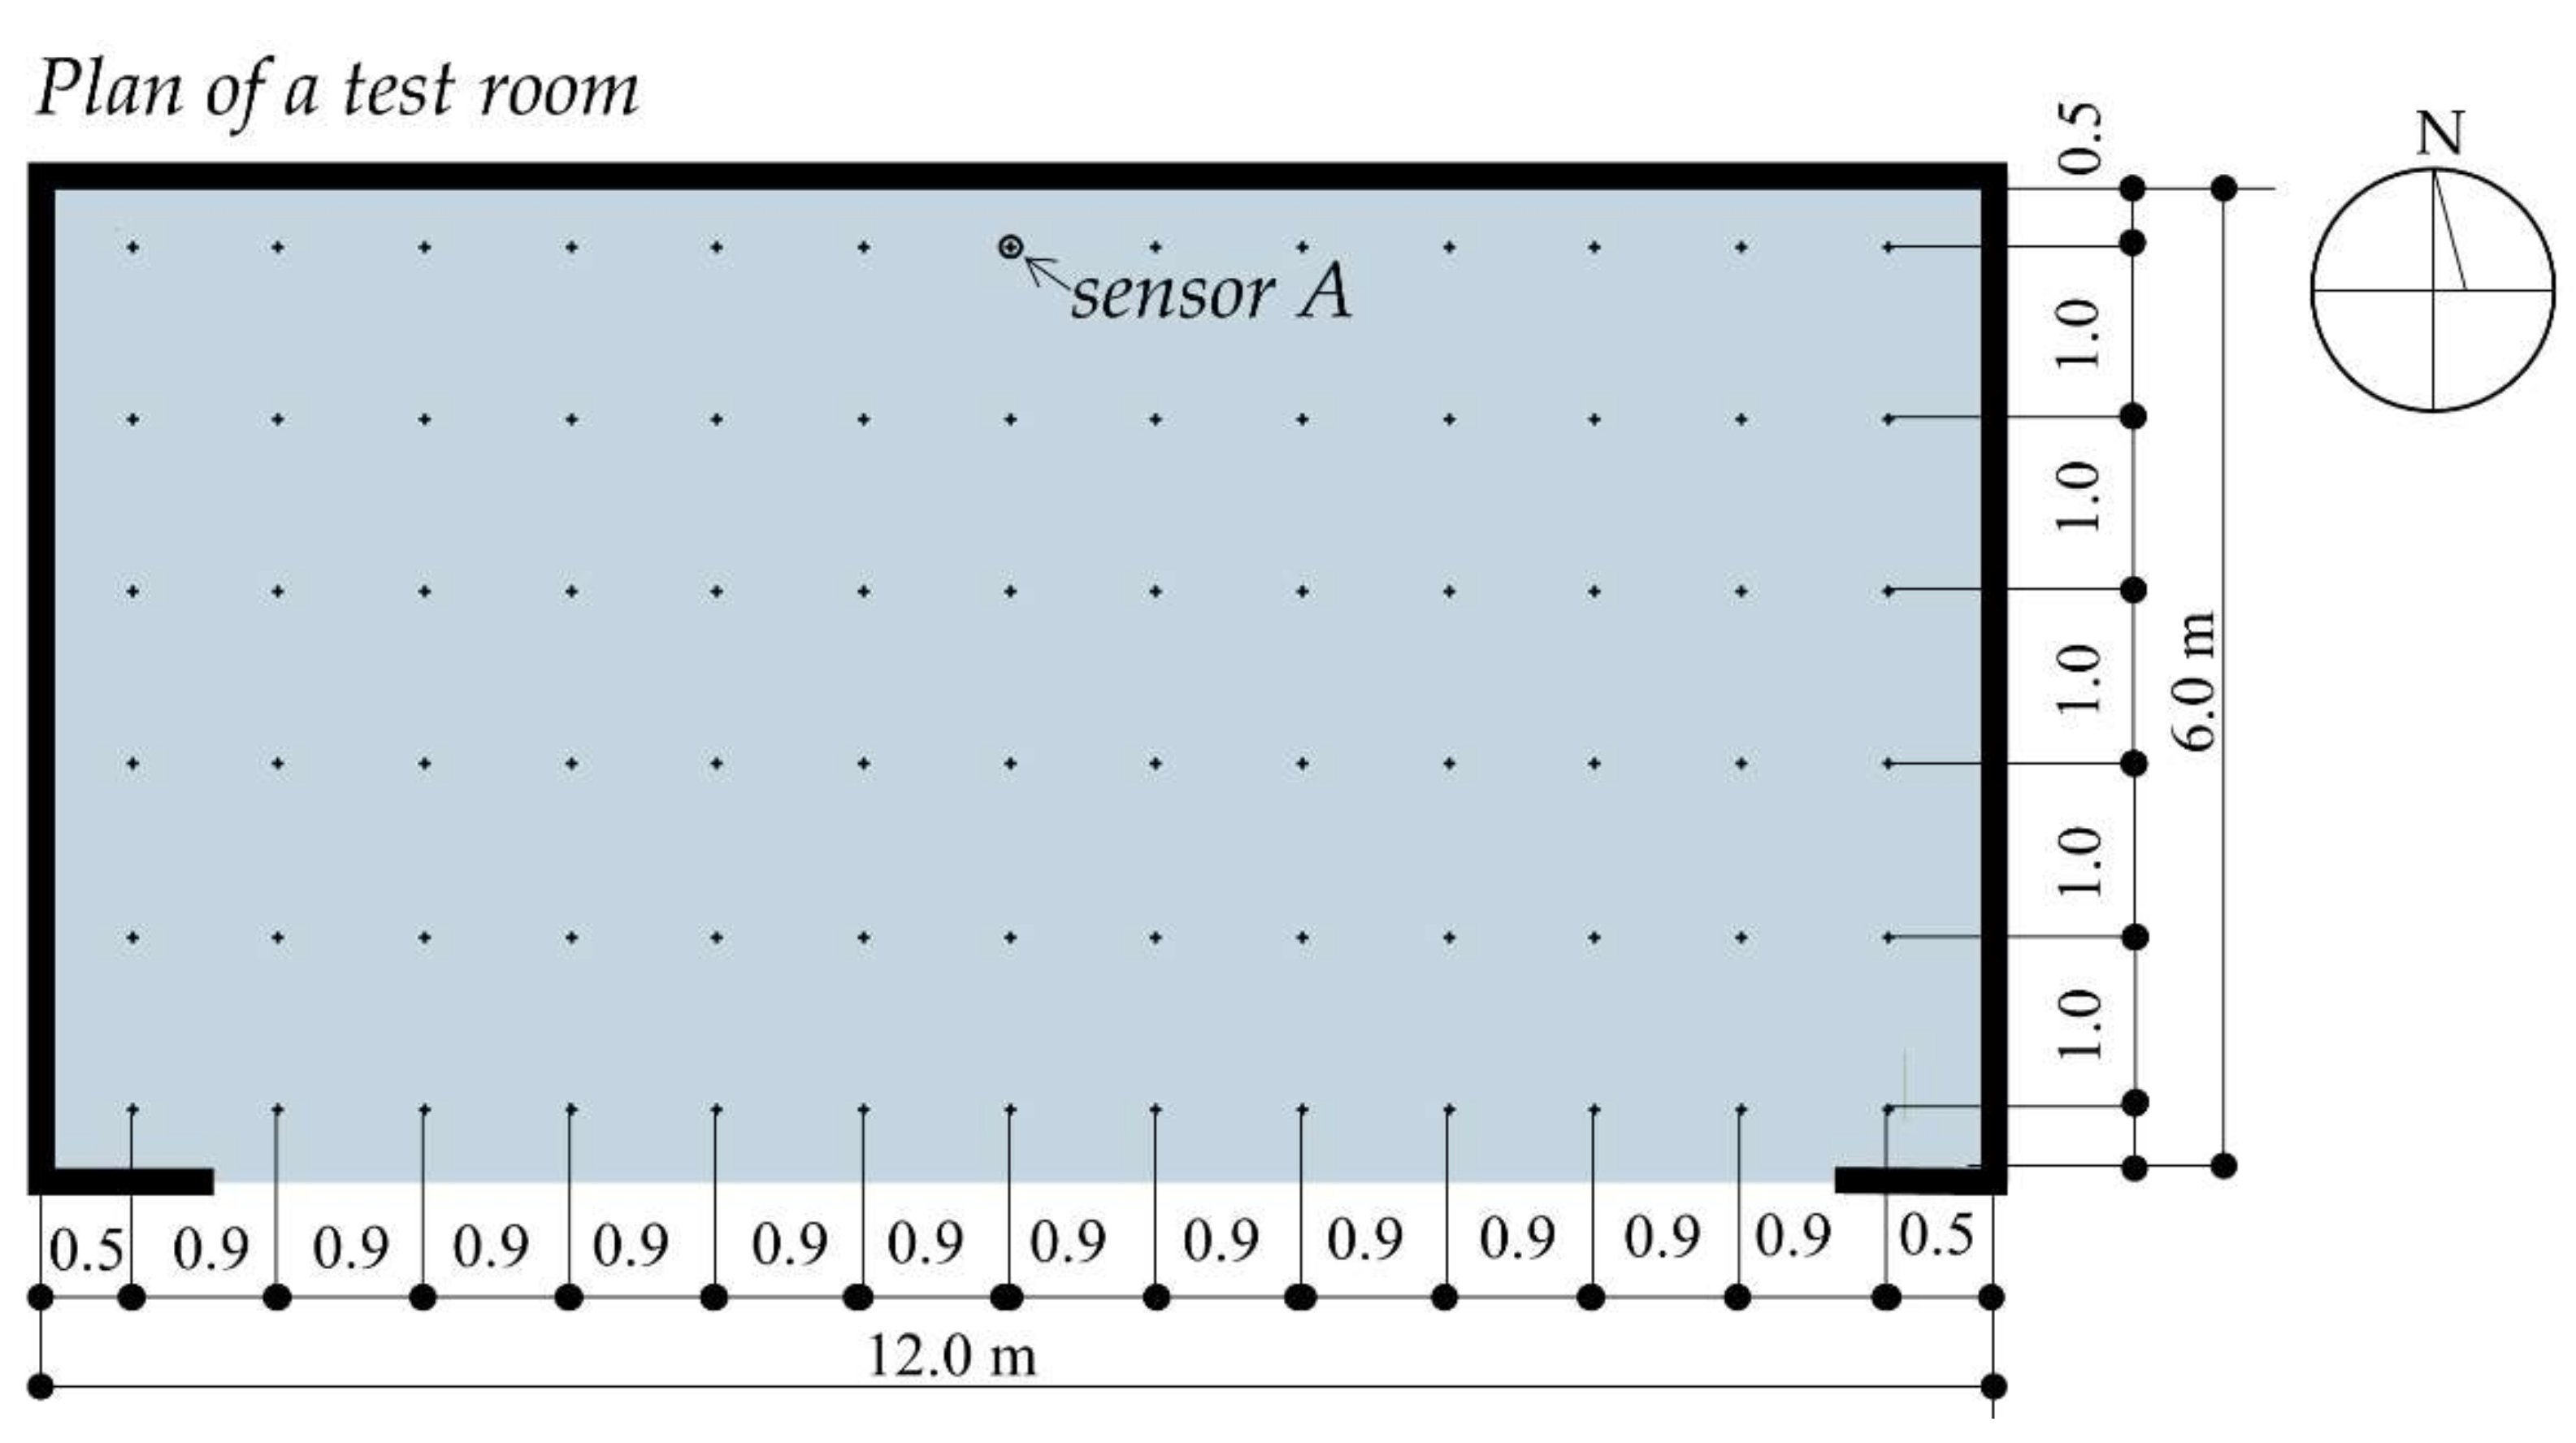
UDI300–3000, DGP and other metrics were calculated for Wroclaw, a city in south-west Poland (51°06′ lat. N, 17°01′ long. E) with the use of real weather data obtained from the Institute of Meteorology and Water Management, National Research Institute. The values of Ev were calculated in an office room on a rectangular grid of approximately 0.90 × 1.0 m at the level of the working plane by 78 virtual sensors (a grid of 6 × 13 measuring points, approximately 1 sensor per m2) (see Figure 3).
Simultaneously, a single virtual sensor, Sensor A, recording horizontal illuminance values (lx) was placed at the level of the working plane, at the back of the room, in the middle. Sensor A was located deep in the room and was used to trigger the automatic reaction of the louvres that were used in the daylighting scenario in Variant 6.
3.5. Sequential and Gradual Sequence of Simulation
The simulation process comprised three consecutive phases. First, office rooms without a light shelf and translucent ceiling were simulated in two variants (Variant 1 without the louvres and Variant 2 with static louvres at 45°). Second, a light shelf and translucent ceiling were introduced and similarly simulated in the next two variants (Variant 3 without the louvers and Variant 4 with static louvers at 45°), providing evident improvement of both UDI and DGP values. Third, to further increase UDI300–3000 and reduce DGP, the same system of louvers was virtually mechanized (as an adaptive system), with the assumption that the louvers were opened to the 90° position when the sensor located deep in the room detected illuminance values below 300 lx. (Variants 5 and 6). The intention was to virtually create a system that allows more daylight when the levels deep in the room drop below the threshold value of 300 lx. A schematic diagram of the method is given in Figure 4.
4. Results
The results of the three consecutive phases of the simulation are presented in the following sections, in Figure 5, Figure 6 and Figure 7 and Table 3.
4.1. First Phase of the Simulation
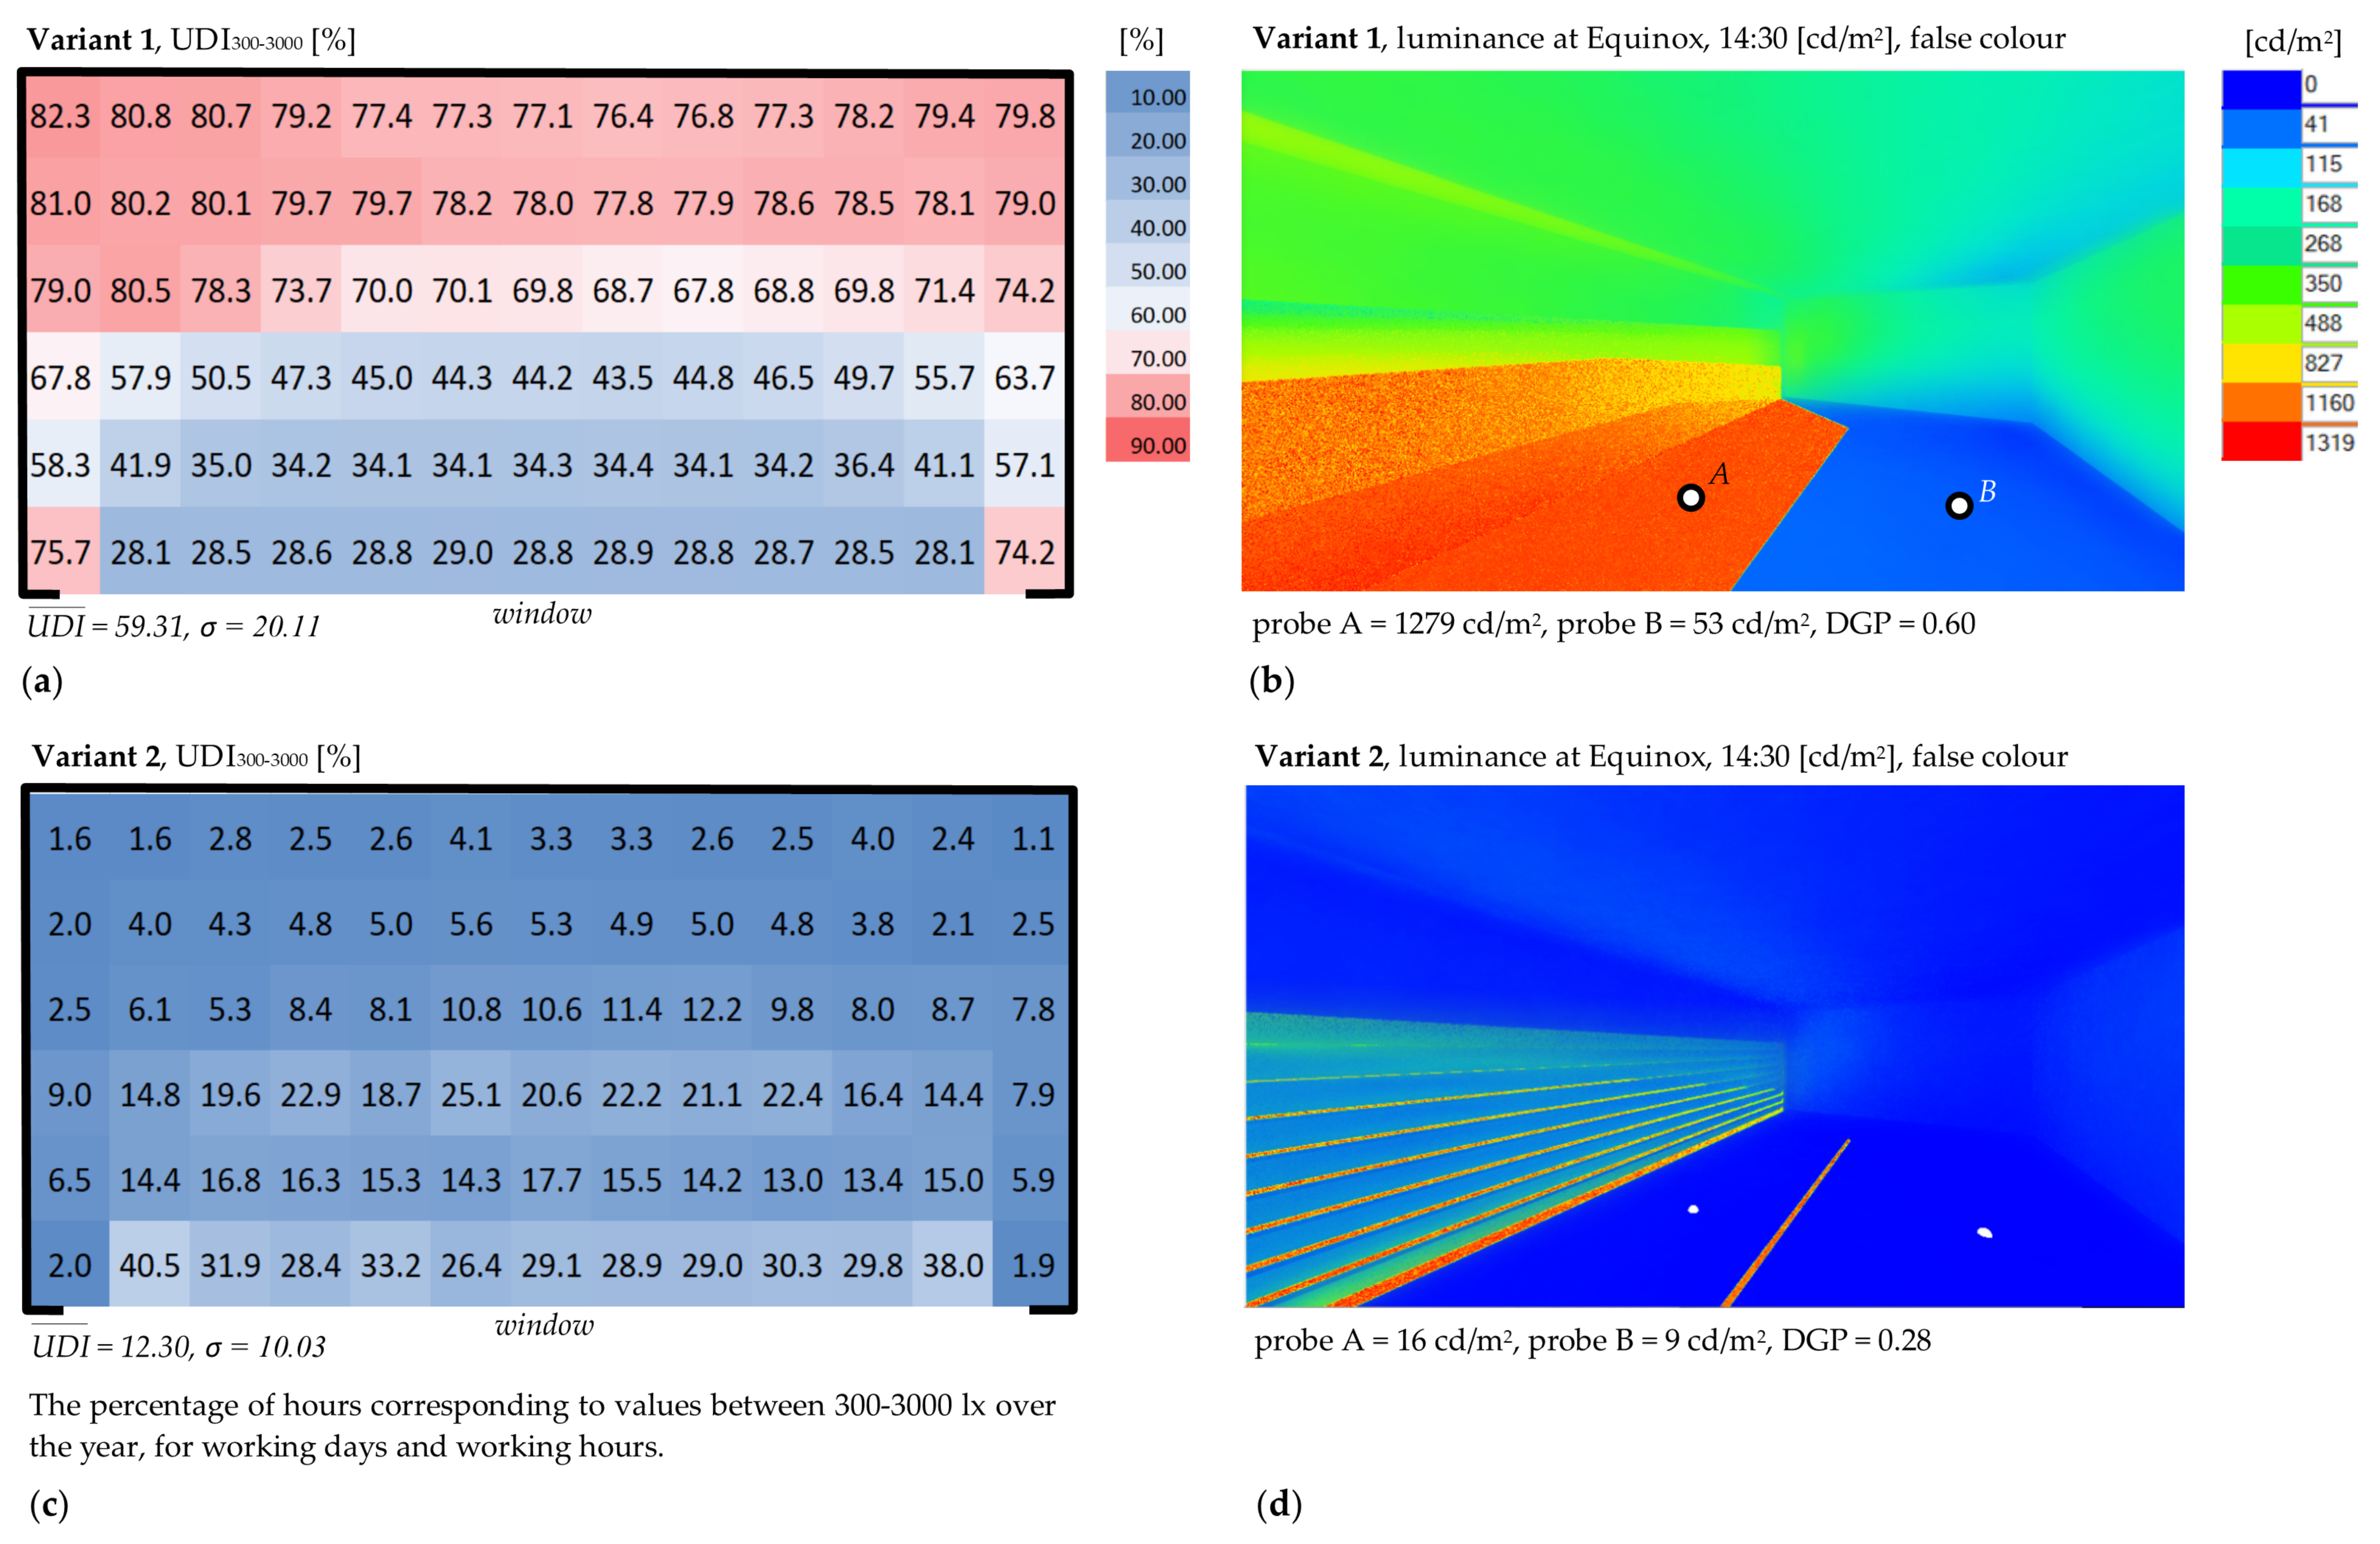
The results of the first phase of the simulation are given in Figure 5 and Table 3. It became evident from the beginning that as Variant 1 lacks any type of daylight management system and glare protection, it would result in medium UDI300–3000 values (average = 59.31%, and a very high probability of glare, DGP = 0.602). Uniformity is also very low Us = 0.51, and the standard deviation is very high, σ = 20.11. This variant could be generally described as overlit. The value of DGP by far exceeds the values of visual comfort in an office room and is simply assessed as an “Intolerable” glare. Furthermore, the illuminance values show high variability over time. The highest instantaneous value of Emax is 35,592 lx and is recorded for one of the longest days of the year (mid-June). This could be explained by the higher angle of the incidence of the rays of the Sun striking the horizontal surface of the working plane.
Luminance distribution in the room in Variant 1 is very uneven. The value for probe A is very high (1279 cd/m2), while the value for probe 2 is very low (53 cd/m2). The contrast is very high, and the ratio equals 25.
In Variant 2, horizontal static louvers were designed to reduce the illumination. This variant with static louvres at 45° could be generally described as highly underlit. Louvers block the daylight over the course of the entire year. is very low (12.3%), which proves a substantial lack of illumination in the room, and this conclusion is supported by the value of t>3000, which equals 0. This means that there are no hours over the year with illumination over 3000 lx at any point of the working plane, while as many as 1828 h are underlit with values below 300 lx. However, the Us is high, but the absolute values of illuminance are very low, ranging from 63 to 270 lx on the day of equinox at 14:30 h. Based on this, it could be concluded that a static louvre is not a solution, as it blocks the light below the accepted level of illuminance for an office space.
Luminance distribution in the room in Variant 2 is much more even than in the case of Variant 1, but the values are very low: probe A = 16 cd/m2, while probe B = 9 cd/m2.
Therefore, in the next phase, steps were undertaken to verify whether the introduction of a light shelf and translucent ceiling would help to achieve more uniform values.
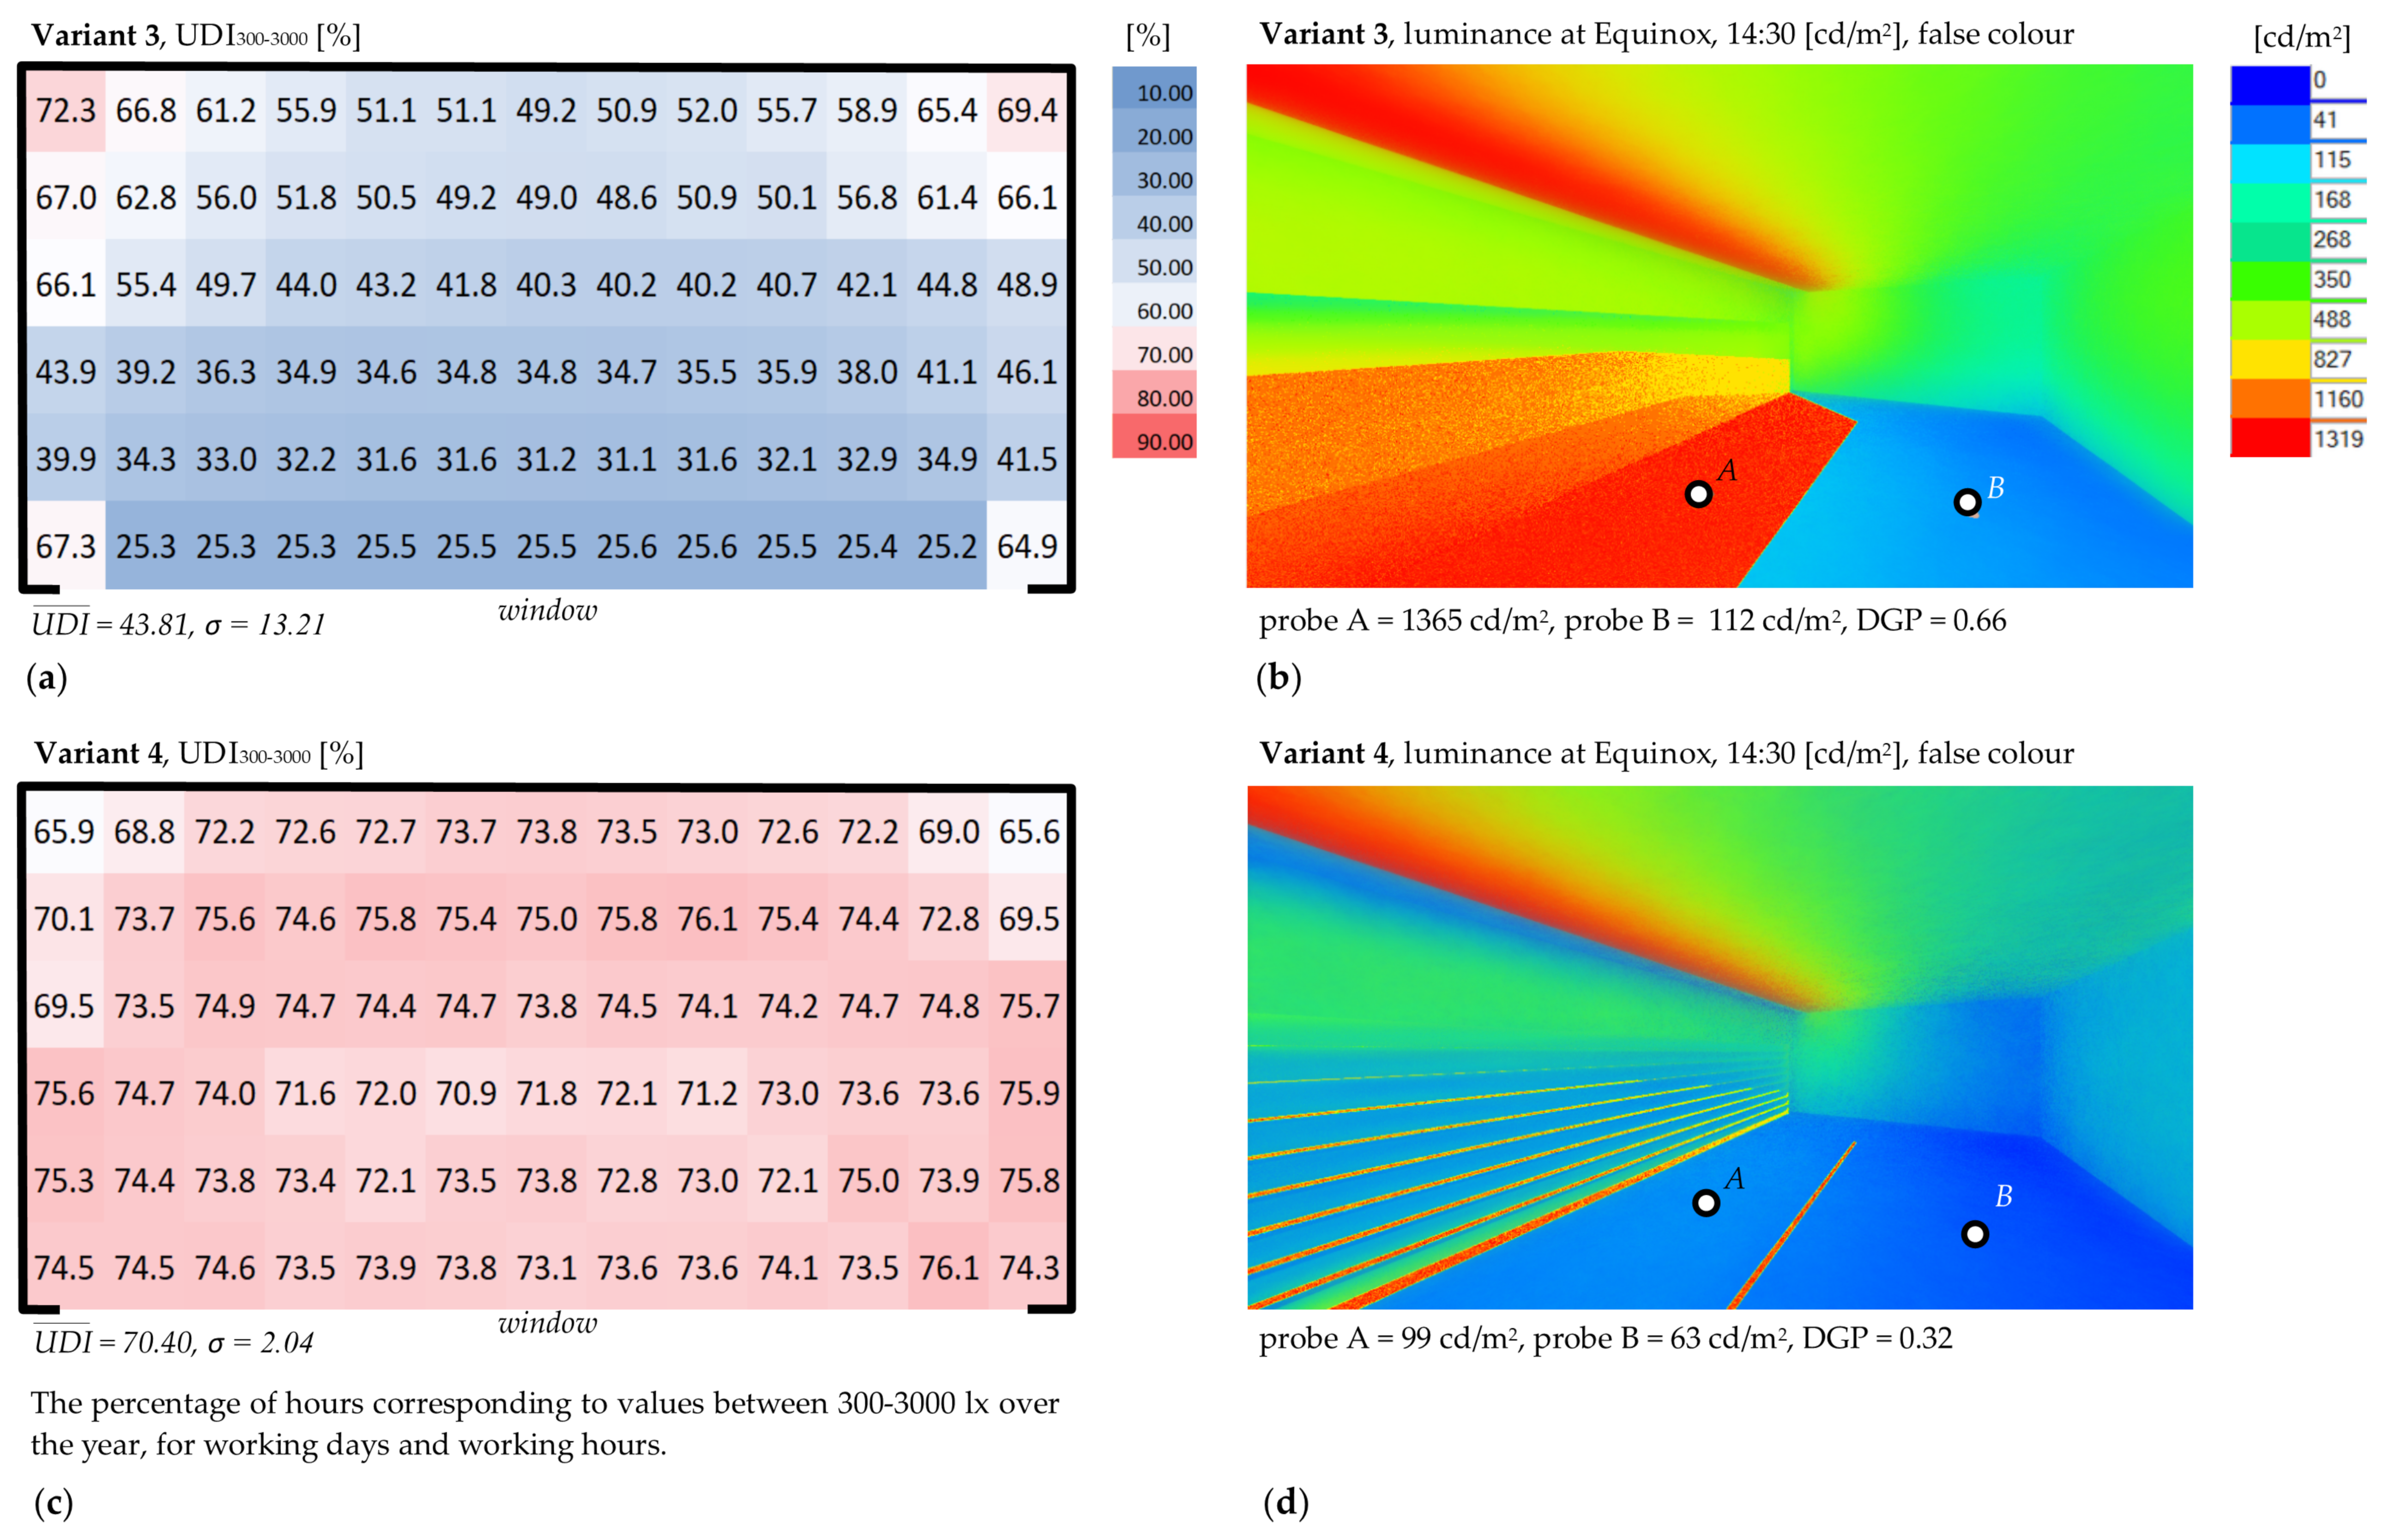
4.2. Second Phase of the Simulation
In the first phase of the simulation, only the variants with no daylight redistribution system were analyzed (Variant 2 used louvres, but this cannot be considered as a light distribution system). The second phase of the simulation involves the introduction of a daylight redistribution system in the form of a light shelf (LS) and a translucent ceiling (TC). The size and the orientation of the room remain unchanged. This allows one to make a comparison of how the daylight redistribution system performs in the same room with identical external daylight conditions (weather data derived from the *.epw file).
In the second phase of the simulations, a light shelf (LS) and translucent ceiling (TC) were introduced according to the geometry given in Figure 1. The results of the second phase of the simulation are provided in Figure 6 and Table 3.
In Variant 3, the introduction of LS and TC resulted in even higher values of illuminance at the level of the working plane. In Variant 3, the value of t>3000—the number of hours over 3000 lx—is even higher than that of Variant 1 (672 vs. 1058, respectively). Considering that in the adopted employment scenario the number of working hours in the year is 2088 (8 h per day/av. 261 working days in the year), Variant 3 is characterized by a very high number of hours with values over 3000 lx for more than half of the working hours in the year.
The values of luminance in probe A are also very high (the highest recorded in the simulation, 1365 cd/m2), although the difference is smaller than in the case of Variant 1 (probe B value is 112 cd/m2). Moreover, the values of DGP = 0.64 justify the conclusion that in Variant 3, the introduction of the second source of daylight (through the ceiling) led to an increase in the amount of daylight, resulting in unacceptably high values. In general terms, it could be stated that Variant 3 is highly overlit, with the Emax value as high as 39,586 lx.
However, it is worth noting that the introduction of the light shelf improved the uniformity of daylight, from the value of 0.51 in Variant 1 to the value of 0.75 in Variant 3. This proves that an LS and TC system is efficient in daylight distribution.
Variant 4 is identical to Variant 2 but with the introduction of LS and TC. The louvres are static at the angle of 45°. The values of Emax, and DGP (6621 lx, 70.4% and 0.32, respectively) allow us to state that this variant is uniform. Wienold [57] and Bodard and Cauwerts [58] state that DGP lower than 0.35 is an “Imperceptible” glare, which proves that in Variant 4, the glare is simply absent. This is confirmed by the analysis of the luminance values, which are similar (probe A = 99 cd/m2 and probe B—63 cd/m2). In Variant 4, only 110 h are overlit and only 442 h are underlit, with the remaining 1536 h within the range of 300–3000 lx. This is substantial progress in comparison to the previous variants. The high value of , the low standard deviation σ = 2.04 and very good uniformity Us (0.83) show that LC and TC systems effectively channel the daylight deep in the room, and, simultaneously, louvers protect the interior from very high values of illuminance (see Figure 5b).
The drawback of Variant 4 was the static location of the louvres impeding the views of outside and eye contact with the surroundings; this issue is also briefly discussed in Section 6.1. In Variants 5 and 6, other orientations of louvres and adaptive scenarios are suggested.
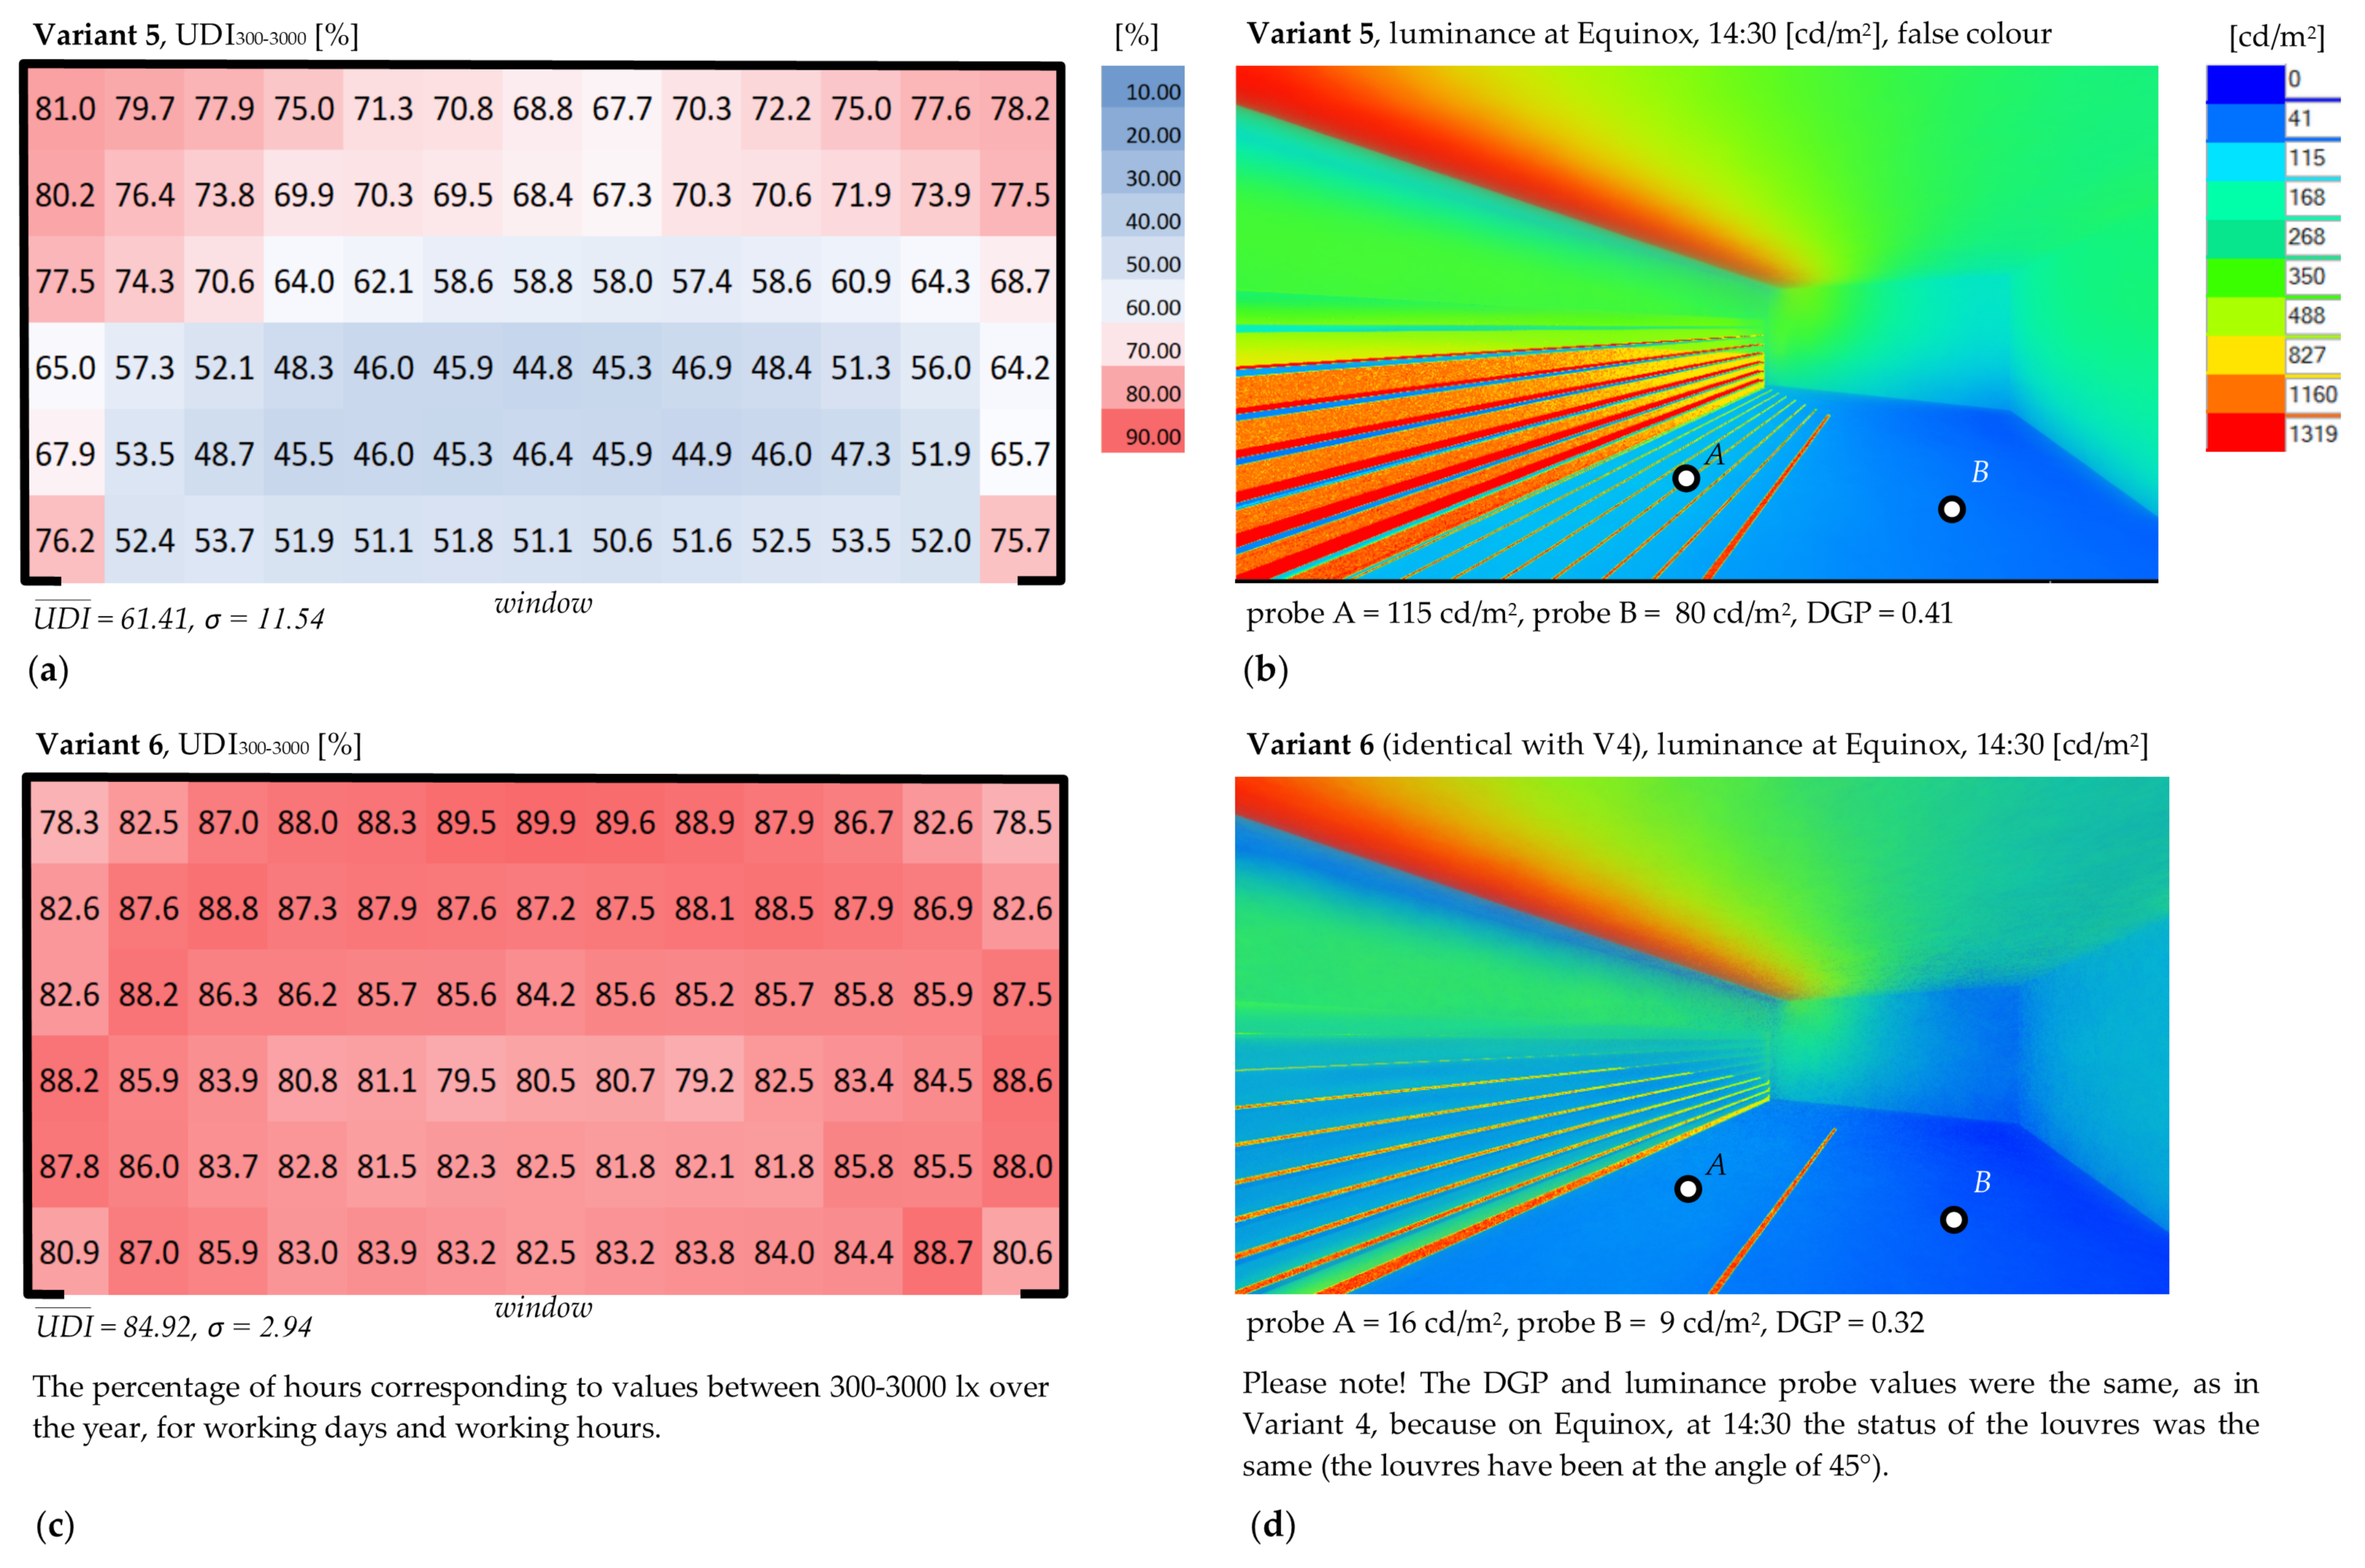
4.3. Third Phase of the Simulation
In the third phase of the simulation, two scenarios were tested: Variant 5, identical to Variant 4 but with the open louvres at the angle of 90° in relation to the surface of the window, and Variant 6 with automatic louvres. The results are given in Figure 7 and Table 3. Variant 5 performed worse than Variant 4; however, it was visibly better than Variants 1, 2 and 3. in Variant 5 (61.41%) was 13% worse than that in Variant 4 (70.40%), and also, the standard deviation was higher σ = 11.54, with Emax = 21,749 lx. The number of hours over 3000 lux was higher, 606 vs. 110, respectively. Different orientations of louvres (at 90°) caused the formation of bright stripes of sunlight on the surface of the working plane. Because of this, the glare sensation was higher, with DGP = 0.41 and also with a higher difference between the probes. For probe A, located in the bright stripe (1344 cd/m2), and probe B, located deep in the room (80 cd/m2), the difference was 16.8 times. However, it needs to be mentioned that probe A located in a “dark” spot, between the bright stripes, showed only 115 cd/m2.
Based on these data, a decision was made to test an adaptive scenario in Variant 6. The geometry of the louvers was the same as in Variant 4, but the louvers were rotated at the angle of 45° to the outside, opening for an outside view and the penetration of daylight. Louvers automatically opened when the level of illumination Ev detected by sensor A located deep in the room dropped below 300 lx. The rationale behind this triggering value comes from the analysis of the value of t<300 for Variant 4. In Variant 4, 442 h were underlit; therefore, a room for potential improvement was sought and more light was required at certain hours rather than less.
The values for Variant 6 were the best, which were achieved in the entire simulation campaign. in Variant 6 was 84.92%, with the standard deviation σ = 2.94 (only slightly smaller than in Variant 4). The values of Emax = 6621 lx, t<300 and t>3000 were also optimal. The DGP and luminance probe values were the same, as in Variant 4, because on equinox, at 14:30, the status of the louvres was the same (the louvres were at the angle of 45°).
5. Discussion
Data based on weather-based simulation allow for the formulation of some insight regarding the results of the calculations. Insights are summarized in the following points regarding the variants of the simulations:
5.1. Variants without Louvres
Variants 1 and 3 (featuring no louvres) are characterized by moderate values of , 59.31% and 43.81%, respectively. Moreover, both Variants 1 and 3 are characterized by low and moderate uniformity Us (0.51 and 0.75). Very high values of t>3000 justify the statement that both Variants are either overlit or highly overlit. The test room is simply too bright for a substantial fraction of the year (672 h for Variant 1 and striking 1058 h for Variant 3, respectively, which is 50.6% of the entire year).
5.2. Variants with Louvres
The application of louvres and LS/TC in Variants 4, 5 and 6 translates into greater visual comfort. The values of in Variants 4 and 5 are 70.40% and 61.41%, respectively. In Variant 6, where an adaptive scenario is applied, reaches 84.92%. It should be emphasized that this value is extraordinarily high, providing the correct values of illumination in the office room for almost 85% of working hours—this is 1770 h per year out of 2088 h in total. It is therefore justified to state that Variant 6 offers high visual comfort and comfortable daylight working conditions. Other simulation results support the above-mentioned observation, showing that Variant 6 performed better than Variant 4 and also better than Variant 5. In Variant 6, was 20.5% better than that of Variant 4 (84.92% vs. 70.40%, respectively). Again, Variant 6 represented an improvement of 43% in comparison with Variant 1 and a striking improvement of 93% in comparison with Variant 2.
5.3. Visual Comfort
One of the most important issues regarding visual comfort is the value of DGP and standard deviation σ. In the context of the luminance level, Variant 6 (and Variant 4) outperformed the other Variants. In these cases, the DGP equaled 0.32, denoting “Imperceptible” glare. To complete visual comfort analysis, standard deviation σ was calculated for the final results of UDI300–3000 (see Figure 5, Figure 6 and Figure 7). This analysis also brings some interesting insights. In Variant 1, the deviation is very high (20.11), while for Variants 2, 3 and 5, the values of σ are similar (10.03, 13.21 and 11.54). Variants 4 and 6 are characterized by a low standard deviation σ (2.04 and 2.94, respectively). This proves that the use of an LS and TC system can mitigate large differences in illumination at the level of the working plane and also in the context of results throughout the entire year, not only at the momentous values. The quality of visual comfort is also estimated by the uniformity of daylight. The analysis of the uniformity U300–3000 for the final results of UDI300–3000 provides interesting points for discussion. Variant 2 has a very low value of U300–3000 = 0.09, and Variants 1 and 3 have similar values of approximately 0.55. The application of LS and TC dramatically increases U300–3000 up to the value of 0.89–0.92 in Variants 4 and 6, which is considered very high. This translates to a very even distribution of daylight at the level of the working plane.
In general, the results of the simulation allow us to state that a translucent ceiling (TC) and light shelf (LS) undoubtedly affect the quality of light indoors: (i) uniformity is greater and (ii) the luminance values are higher deep in the room in comparison with the variants where no daylight guiding/distribution system is used, e.g., the very high values of probe A in Variants 1 and 3 (respectively, 1279 and 1365 cd/m2). Therefore, it is justified to state that the translucent dropped ceiling, as an illumination tool, performs very well, assuring an even distribution of daylight in an office space.
6. Conclusions
The present study demonstrated the importance of analyzing new methods of illumination of deep office space from above, especially in the context of the improvement of visual comfort. This study proposes a novel typology of a daylight distribution system using both a light shelf (LS) and a translucent ceiling (TC), which proved to be very effective in the improvement of visual comfort. Moreover, a new evaluation procedure was suggested, which uses real weather-based data (representing climate conditions) to evaluate the illuminance at the level of the working plane.
A simulation was carried out with the use of Radiance software, previously validated by other studies. This method offered detailed information about changes in illuminance at the level of the working plane throughout the entire year.
The use of the weather data ensures that the most accurate results are obtained, and the procedure is capable of using the most recent data from weather files as soon as they become available. Similar results are also expected when certain conditions apply. This study was performed for the city of Wroclaw, Poland; however, the results might also be appropriate as a starting point of analysis for other cities at 51° lat. N., with similar cloud coverage (e.g., for London in the UK and Regina in Canada). The paper also proves the feasibility of a procedure of assessing daylight comfort in the adopted test room using real weather data.
The findings of this study support the assumption that translucent dropped ceilings and light shelves in conjunction with louvres can be effectively used to reduce the level of illuminance, enhance daylight uniformity and increase visual comfort by reducing daylight glare probability (DGP). The presented procedure of calculating UDI300–3000 might be used by architects and planners in the design of office spaces to initially evaluate whether the levels of illuminance and luminance stay within the desired limits.
6.1. Limitation of the Study
However, the present study has some limitations, which should be explicitly noted. First, due to the high computing power required, a limited number of variants were analyzed. Obviously, it is more likely to specify the optimal variant when more alternatives are checked. Moreover, it cannot be forgotten that the results are based on a simulation. Real-time measurements might differ, and also, the weather data from the EPW file might not reflect ongoing climate change (e.g., the increased number of sunny days). Moreover, in the analyzed variants, for the majority of the time, louvres were positioned at the angle of 45° in relation to the surface of the window; it was only in Variant 6 that the louvres were momentarily opened allowing a view of the outside. Therefore, it is likely that the European Standard EN17037 criteria for the horizontal view angle (required minimum angle of between 14° and 28°) were not met (for the view), despite other visual comfort metrics meeting or even exceeding the requirements (daylight, sunlight and glare). The readers should also be aware that external light shelves are at risk of being destroyed by high wind pressure.
6.2. Future Research
Future studies should aim to analyze more variants with possible different geometries of daylight distribution systems, and some converging mirrors should also be taken into account as a part of the light shelf or the daylight distribution system in the room (anidolic systems). It will also be important that future research investigates the issues of fully retractable louvres, allowing more daylight and a greater view of the outside on very dull days, even further limiting the number of days with an average value of illuminance below 300 lx. Future studies should investigate the association between louvre geometry and closure schedule vs. the provision of the view of outside, according to European Standard EN17037. A potential improvement in the credibility of the results is associated with experimental research that might deliver data based on measurements, as previously discussed by Bodart and Cauwerts, in a room with a different geometry [58].
Supplementary Materials
The simulation data and PRISMA flow diagram presented in this study are available at https://drive.google.com/drive/folders/1K2hLzjQWIW7LplQsDsLmqxoLCPIitywg?usp=sharing.
Funding
This research received no external funding. The APC was funded by the Wroclaw University of Science and Technology.
Institutional Review Board Statement
Not applicable.
Informed Consent Statement
Not applicable.
Data Availability Statement
The simulation data presented in this study are openly available at https://drive.google.com/drive/folders/1K2hLzjQWIW7LplQsDsLmqxoLCPIitywg?usp=sharing (accessed on 14 October 2021). The figures presented in this study are available on request from the corresponding author.
Conflicts of Interest
The author declares no conflict of interest.
Nomenclature
| LS | light shelf |
| TC | translucent ceiling |
| UDI | useful daylight illuminance |
| UDI300–3000 | useful daylight illuminance with the range of 300–3000 lx |
| mean UDI | |
| DGP | daylight glare probability |
| t<300 | the average number of hours with illuminance under 300 lx |
| t>3000 | the average number of hours with illuminance over 3000 lx |
| Emax | maximal illuminance |
| Umean | mean daylight uniformity |
| U300–3000 | uniformity for the final UDI300–3000 distribution |
| σ | the standard deviation for the final UDI300–3000 distribution |
References
- House of Commons. Rights to Light Law Com. 356 HC 796 2014-15; House of Commons: London, UK, 2014; 243p, ISBN 9781474112581.
- Hellinga, H. Daylight and View. The Influence of Windows on the Visual Quality of Indoor Spaces. Ph.D. Thesis, Delft University of Technology, Delft, The Netherlands, 2013. [Google Scholar]
- CIBSE. Lighting Guide LG7/15; CIBSE: London, UK, 2015; p. 113. ISBN 9781906846589. [Google Scholar]
- Sustainable Development Goals, United Nations Department of Global Communications. May 2020. Available online: https://www.un.org/sustainabledevelopment/wp-content/uploads/2019/01/SDG_Guidelines_AUG_2019_Final.pdf (accessed on 13 September 2021).
- Brzezicki, M. An evaluation of annual luminous exposure from daylight in a museum room with a translucent ceiling. Buildings 2021, 11, 193. [Google Scholar] [CrossRef]
- Merriam-Webster. Citation. In Merriam-Webster.com Dictionary. Available online: https://www.merriam-webster.com/dictionary/velarium (accessed on 13 September 2021).
- Sdino, L.; Rosasco, P.; Novi, F.; Porcile, G.L. The evaluation of actions aimed at enhancing the cultural heritage: The case study of the Colosseum roofing. Valori Valutazioni 2018, 20, 93–107. [Google Scholar]
- Krizmanić, A. Amfiteatar u Puli. Velarij. Prostor Znanstveni Časopis za Arhitekturu i Urbanizam 2020, 28, 202–219. [Google Scholar] [CrossRef]
- d’Ambrosio Alfano, F.R.; Iannace, G.; Ianniello, C.; Ianniello, E. “Velaria” in ancient Roman theatres: Can they have an acoustic role? Energy Build. 2015, 95, 98–105. [Google Scholar] [CrossRef]
- Huygen, F. Het Museum Boymans van Hannema; Museum Boymans-van Beuningen: Rotterdam, The Netherlands, 1992. [Google Scholar]
- Lucchi, E. Environmental Risk Management for Museums in Historic Buildings through an Innovative Approach: A Case Study of the Pinacoteca di Brera in Milan (Italy). Sustainability 2020, 12, 5155. [Google Scholar] [CrossRef]
- Moher, D.; Liberati, A.; Tetzlaff, J.; Altman, D.G.; PRISMA Group. Preferred reporting items for systematic reviews and meta-analyses: The PRISMA statement. PLoS Med. 2009, 6, e1000097. [Google Scholar] [CrossRef] [PubMed] [Green Version]
- Soler, A.; Oteiza, P. Dependence on solar elevation of the performance of a light shelf as a potential daylighting device. Renew. Energy 1996, 8, 198–201. [Google Scholar] [CrossRef]
- Claros, S.T.; Soler, A. Indoor daylight climate-influence of light shelf and model reflectance on light shelf performance in Madrid for hours with unit sunshine fraction. Build. Environ. 2002, 37, 587–598. [Google Scholar] [CrossRef]
- Safa, D.; Noureddine, Z. A Study of Optimization of the Light Shelf System in Hot and Arid Zones. 2013. Available online: http://proceedings.ases.org/wp-content/uploads/2014/02/SOLAR2013_0065_final-paper.pdf (accessed on 14 October 2021).
- Kurtay, C.; Esen, O. A new method for light shelf design according to latitudes: Cun-okay light shelf curves. J. Build. Eng. 2017, 10, 140–148. [Google Scholar] [CrossRef]
- Berardi, U.; Anaraki, H.K. Analysis of the impacts of light shelves on the useful daylight illuminance in office buildings in Toronto. Energy Procedia 2015, 78, 1793–1798. [Google Scholar] [CrossRef] [Green Version]
- Berardi, U.; Anaraki, H.K. The benefits of light shelves over the daylight illuminance in office buildings in Toronto. Indoor Built Environ. 2018, 27, 244–262. [Google Scholar] [CrossRef]
- Meresi, A. Evaluating daylight performance of light shelves combined with external blinds in south-facing classrooms in Athens, Greece. Energy Build. 2016, 116, 190–205. [Google Scholar] [CrossRef]
- Warrier, G.A.; Raphael, B. Performance evaluation of light shelves. Energy Build. 2017, 140, 19–27. [Google Scholar] [CrossRef]
- Lee, H.; Kim, K.; Seo, J.; Kim, Y. Effectiveness of a perforated light shelf for energy saving. Energy Build. 2017, 144, 144–151. [Google Scholar] [CrossRef]
- Lee, H.; Jeon, G.; Seo, J.; Kim, Y. Daylighting performance improvement of a light-shelf using diffused reflection. Indoor Built Environ. 2017, 26, 717–726. [Google Scholar] [CrossRef]
- Lee, H.; Gim, S.-H.; Kim, Y.; Seo, J. Study on movable light-shelf system with location-awareness technology for lighting energy saving. Indoor Built Environ. 2017, 26, 796–812. [Google Scholar] [CrossRef]
- Lee, H.; Jang, H.-I.; Seo, J. A preliminary study on the performance of an awning system with a built-in light shelf. Build. Environ. 2018, 131, 255–263. [Google Scholar] [CrossRef]
- Lee, H.; Seo, J.; Kim, S. Improvement of light-shelf performance through the use of a diffusion sheet. Build. Environ. 2018, 144, 248–258. [Google Scholar] [CrossRef]
- Lee, H.; Kim, S.; Seo, J. Evaluation of a light shelf based on energy consumption for lighting and air conditioning. Indoor Built Environ. 2018, 27, 1405–1414. [Google Scholar] [CrossRef]
- Lee, H. Performance evaluation of a light shelf with a solar module based on the solar module attachment area. Build. Environ. 2019, 159, 106161. [Google Scholar] [CrossRef]
- Lee, H.; Seo, J.; Choi, C. Preliminary study on the performance evaluation of a light shelf based on reflector curvature. Energies 2019, 12, 4295. [Google Scholar] [CrossRef] [Green Version]
- Lee, H.; Seo, J. Performance evaluation of external light shelves by applying a prism sheet. Energies 2020, 13, 4618. [Google Scholar] [CrossRef]
- Lee, H. A basic study on the performance evaluation of a movable light shelf with a rolling reflector that can change reflectivity to improve the visual environment. Int. J. Environ. Res. Public Health 2020, 17, 8338. [Google Scholar] [CrossRef] [PubMed]
- Lee, H.; Zhao, X.; Seo, J. A study of optimal specifications for light shelves with photovoltaic modules to improve indoor comfort and save building energy. Int. J. Environ. Res. Public Health 2021, 18, 2574. [Google Scholar] [CrossRef] [PubMed]
- Ávila-Zamora, A.; Murillo-Quirós, N. Effect of Light Distribution in a Scale Model Due to Different Light Shelves. Tecnología en Marcha 2020, 8, 17–25. [Google Scholar] [CrossRef]
- Sadaf, N.; Humaira, K.; Abrar, A. A comparative study on daylight performance assessment of light shelves based on inclination. Mehran Univ. Res. J. Eng. Technol. 2020, 39, 800–805. [Google Scholar] [CrossRef]
- Ruggiero, S.; Assimakopoulos, M.-N.; De Masi, R.F.; de Rossi, F.; Fotopoulou, A.; Papadaki, D.; Vanoli, G.P.; Ferrante, A. Multi-disciplinary analysis of light shelves application within a student dormitory refurbishment. Sustainability 2021, 13, 8251. [Google Scholar] [CrossRef]
- Courret, G.; Scartezzini, J.-L.; Francioli, D.; Meyer, J.-J. Design and assessment of an anidolic light-duct. Energy Build. 1998, 28, 79–99. [Google Scholar] [CrossRef]
- Scartezzini, J.-L.; Courret, G. Anidolic daylighting systems. Sol. Energy 2002, 73, 123–135. [Google Scholar] [CrossRef]
- Wittkopf, S.K. Daylight performance of anidolic ceiling under different sky conditions. Sol. Energy 2007, 81, 151–161. [Google Scholar] [CrossRef]
- Binarti, F.; Satwiko, P. An east-facing anidolic daylighting system on a tropical urban house. Indoor Built Environ. 2016, 25, 691–702. [Google Scholar] [CrossRef] [Green Version]
- Palmero-Marrero, A.I.; Oliveira, A.C. Effects of louver shading devices on building energy requirements. Appl. Energy 2010, 87, 2040–2049. [Google Scholar] [CrossRef]
- Gratia, E.; De Herde, A. The most efficient position of shading devices in a double-skin façade. Energy Build. 2006, 39, 364–373. [Google Scholar] [CrossRef]
- Manzan, M. Genetic optimization of external fixed shading devices. Energy Build. 2014, 72, 431–440. [Google Scholar] [CrossRef]
- Atzeri, A.M.; Gasparella, A.; Cappelletti, F.; Tzempelikos, A. Comfort and energy performance analysis of different glazing systems coupled with three shading control strategies. Sci. Technol. Built Environ. 2018, 24, 545–558. [Google Scholar] [CrossRef]
- Zheng, J.W.; Tao, Q.H.; Li, L. Wind Pressure Coefficient on a Multi-Storey Building with External Shading Louvers. Appl. Sci. 2020, 10, 1128. [Google Scholar] [CrossRef] [Green Version]
- Alzoubi, H.H.; Al-Zoubi, A.H. Assessment of building façade performance in terms of daylighting and the associated energy consumption in architectural spaces: Vertical and horizontal shading devices for southern exposure facades. Energy Convers. Manag. 2010, 51, 1592–1599. [Google Scholar] [CrossRef]
- Suk, J.Y. Luminance and vertical eye illuminance thresholds for occupants’ visual comfort in daylit office environments. Build. Environ. 2019, 148, 107–115. [Google Scholar] [CrossRef]
- Sutter, Y.; Dumortier, D.; Fontoynont, M. The use of shading systems in vdu task offices: A pilot study. Energy Build. 2006, 38, 780–789. [Google Scholar] [CrossRef]
- Linney, A. Maximum Luminances and Luminance Ratios and Their Impact on Users’ Discomfort Glare Perception and Productivity in Daylight Offices. Master’s Thesis, Victoria University of Wellington, Wellington, New Zealand, 2008. [Google Scholar]
- Wymelenberg, K.V.D.; Inanici, M. Evaluating a New Suite of Luminance-Based Design Metrics for Predicting Human Visual Comfort in Offices with Daylight. Leukos 2016, 12, 113–138. [Google Scholar] [CrossRef]
- Mardaljevic, J.; Andersen, M.; Roy, N.; Christoffersen, J. Daylighting metrics: Is there a relation between useful daylight illuminance and daylight glare probability? In Proceedings of the First Building Simulation and Optimization Conference, Loughborough, UK, 10–11 September 2012. [Google Scholar]
- Brzezicki, M.; Regucki, P. Optimization of useful daylight illuminance vs. drag force for vertical shading fins/panels. Sci. Technol. Built Environ. 2021, 27, 367–376. [Google Scholar] [CrossRef]
- Weather Data Sources. Available online: https://energyplus.net/weather/sources#IMGW (accessed on 14 October 2021).
- Reinhart, C.F.; Walkenhorst, O. Validation of dynamic radiance-based daylight simulations for a test office with external blinds. Energy Build. 2001, 33, 683–697. [Google Scholar] [CrossRef]
- Reinhart, C.F.; Andersen, M. Development and validation of a radiance model for a translucent panel. Energy Build. 2006, 38, 890–904. [Google Scholar] [CrossRef]
- Boubekri, M.; Lee, J. A comparison of four daylighting metrics in assessing the daylighting performance of three shading systems. J. Green Build. 2017, 12, 39–53. [Google Scholar] [CrossRef]
- Nabil, A.; Mardaljevic, J. Useful daylight illuminance: A new paradigm for assessing daylight in buildings. Lighting Res. Technol. 2005, 37, 41–59. [Google Scholar] [CrossRef]
- BREEAM UK New Construction. Non-Domestic Buildings (United Kingdom), Technical Manual, SD5078; BREEAM UK New Construction: Watford, UK, 2018; Available online: https://www.breeam.com/NC2018/content/resources/output/10_pdf/a4_pdf/print/nc_uk_a4_print_mono/nc_uk_a4_print_mono.pdf (accessed on 14 October 2021).
- Wienold, J.; Christoffersen, J. Evaluation methods and development of a new glare prediction model for daylight environments with the use of CCD cameras. Energy Build. 2006, 38, 743–757. [Google Scholar] [CrossRef]
- Bodart, M.; Cauwerts, C. Assessing daylight luminance values and daylight glare probability in scale models. Build. Environ. 2017, 113, 210–219. [Google Scholar] [CrossRef]
Figure 1.
The geometry of the test room: on the right, an axonometric section showing the plenum, and on the left, the schematic section showing the location of transparent (marked in pale blue) and translucent surfaces in the test room (marked in blue, dotted line). Description: (a) transparent glass: clerestory window and regular window in the façade; (b) light shelf; (c) horizontal louvres; (d) translucent ceiling; (e) daylight distribution plenum; (f) evaluated working plane (g) illuminance sensor A—used in Variant 6.

Figure 2.
UDI represents the annual occurrence of daylight illuminances falling within the given range (gray-marked area); UDI300–3000 used in this paper is limited to the range of 300–3000 lx with working hours 8–16.
Figure 2.
UDI represents the annual occurrence of daylight illuminances falling within the given range (gray-marked area); UDI300–3000 used in this paper is limited to the range of 300–3000 lx with working hours 8–16.

Figure 3.
Test room plan: the dimension of the working plane and the location of measuring sensors. The values of illuminance in sensor A are used in the adaptive scenario Variant 6.
Figure 3.
Test room plan: the dimension of the working plane and the location of measuring sensors. The values of illuminance in sensor A are used in the adaptive scenario Variant 6.

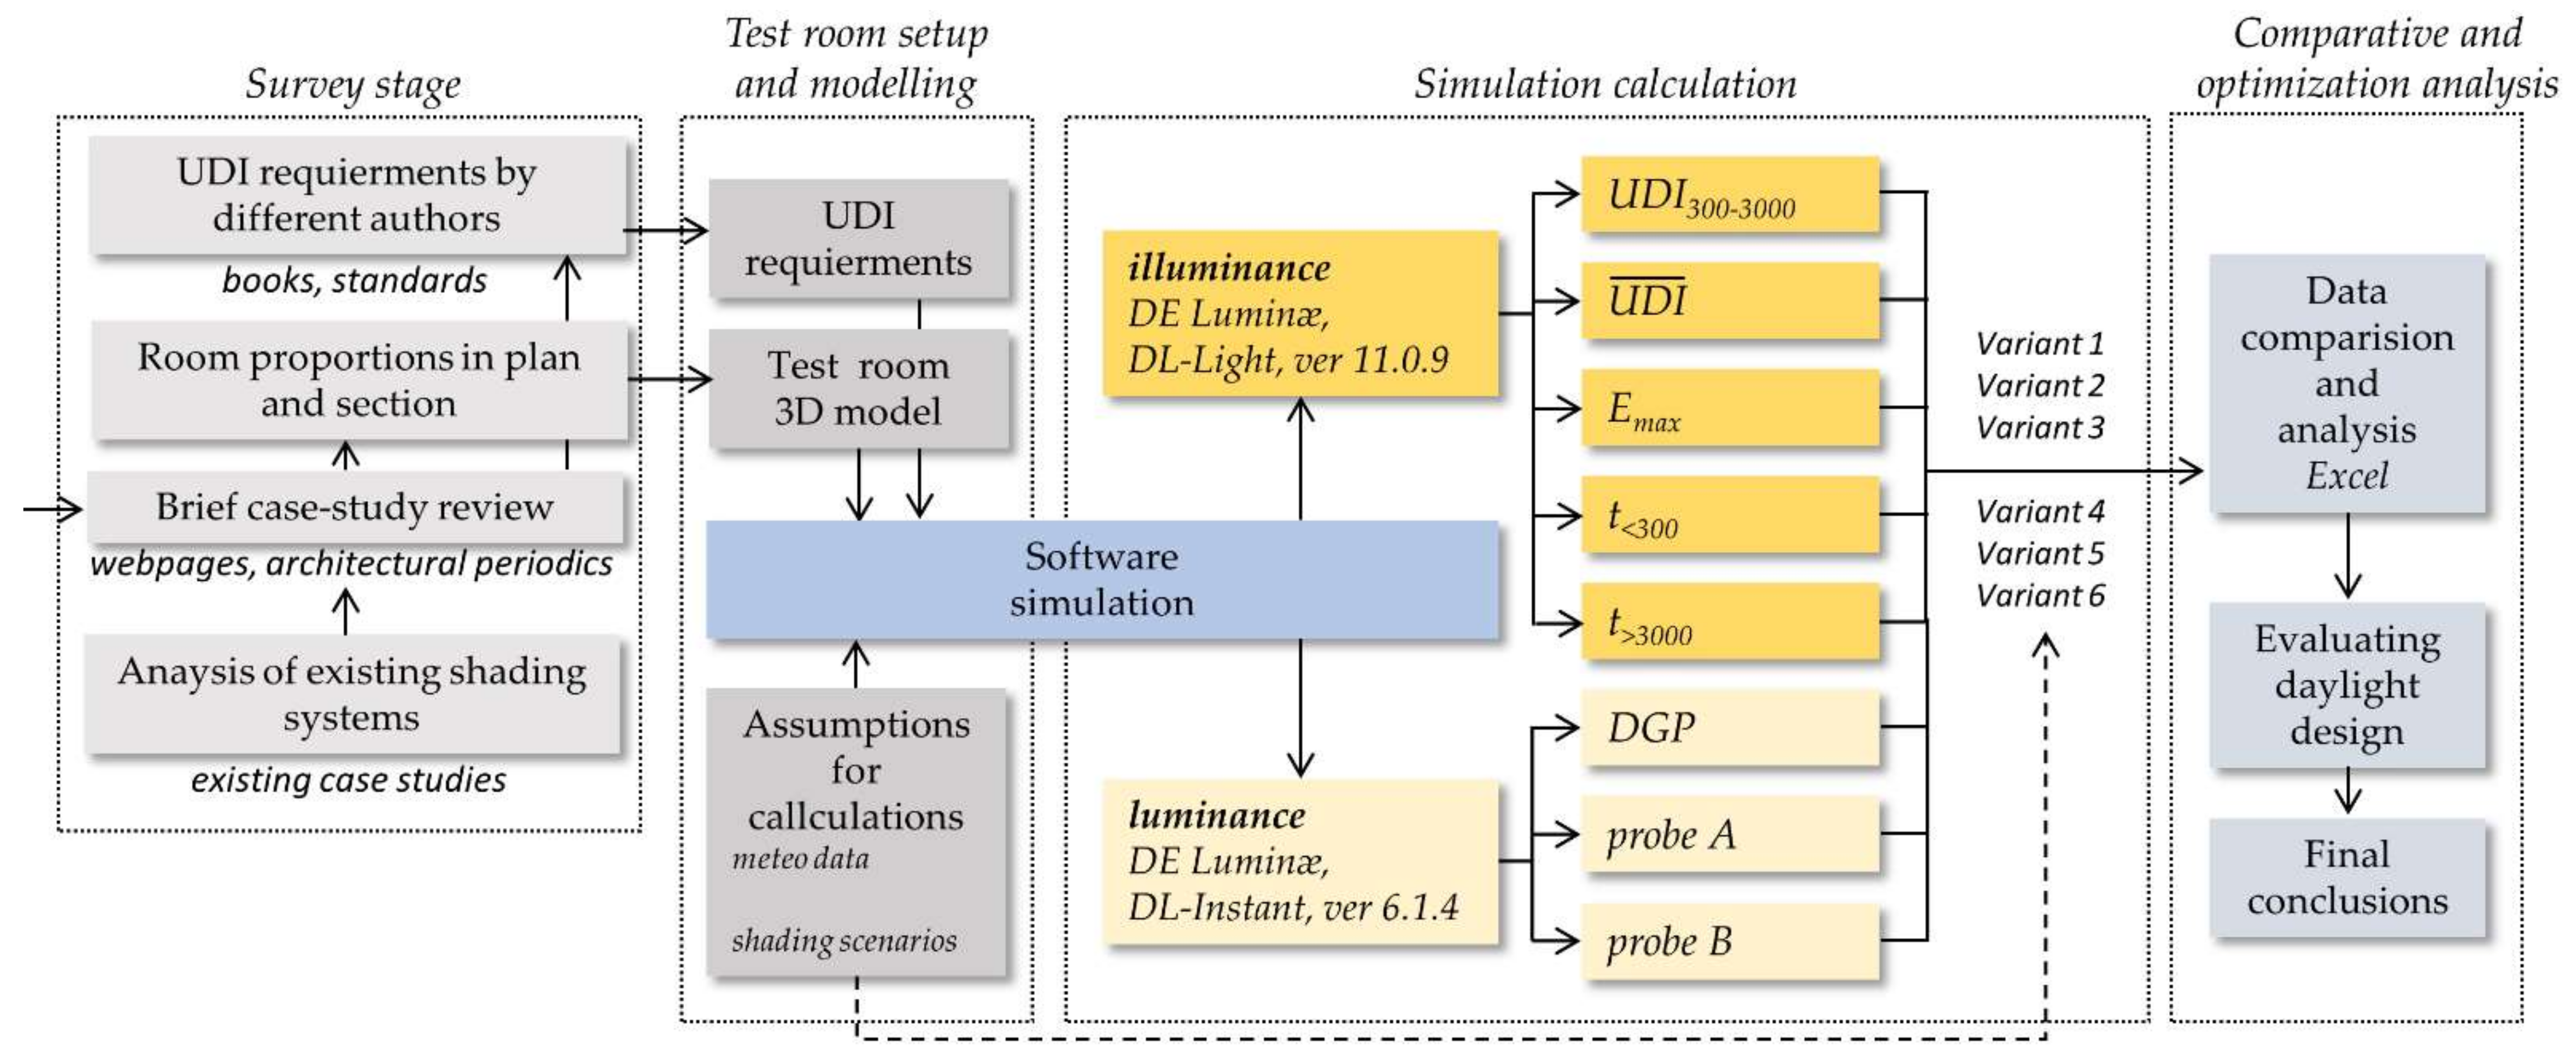
Figure 4.
The schematic diagram of the adopted methodology and sequence of simulation.

Figure 5.
Results of the first phase of the simulation: (a,c) test room plan and spatial distribution of UDI300–3000 over the test year (%); (b,d) luminance values for equinox, at 14:30 (cd/m2) for Variants 1 and 2. Scale is given respectively on the Figure. Exact values are given in the data file in Supplementary Materials.

Figure 6.
Results of the second phase of the simulation: (a,c) test room plan and spatial distribution of UDI300–3000 over the test year (%); (b,d) luminance values for equinox, at 14:30 (cd/m2) for Variants 3 and 4. Scale is given respectively on the Figure. Exact values are given in the data file in Supplementary Materials.

Figure 7.
Results of the third phase of the simulation: (a,c) test room plan and spatial distribution of UDI300–3000 over the test year (%); (b,d) luminance values for equinox, at 14:30 (cd/m2) for Variants 5 and 6. Scale is given respectively on the Figure. Exact values are given in the data file in Supplementary Materials.


Table 1.
The literature review.
| Ref. No. | Authors | Year | Methodology | Research Focus | Research Gap 1 |
|---|---|---|---|---|---|
| subject: light shelf | |||||
| [13] | Soler and Oteiza | 1996 | experiment | ● performance of a light shelf using two (1:10) scale models for Madrid | ● no translucent elements are used ● the early stage of research |
| [14] | Claros and Soler | 2002 | experiment | ● influence of light shelf and model reflectance on light shelf performance | ● illuminance at the measurement points used |
| [15] | Safa et al. | 2013 | simulation | ● optimization of the light shelf system in hot and arid zones | ● geographical limitation |
| [16] | Kurtay and Esen | 2017 | simulation | ● a new method for light shelf design according to latitudes | ● CUN-OKAY light shelf curves are tested |
| [17] | Berardi and Anaraki | 2015 | simulation | ● light shelves’ influence on UDI | ● the high-quality study, a direct reference to the present study |
| [18] | 2018 | simulation | ● benefits of light shelves over daylight illuminance in office buildings in Toronto | ● as above | |
| [19] | Meresi | 2016 | simulation | ● evaluation of daylight performance of light shelves combined with external blinds in south-facing classrooms | ● DF is used as the main metric |
| [20] | Warrier and Raphael | 2017 | simulation experiment | ● evaluate the potential of light shelves to improve daylighting and visual comfort | ● static horizontal light shelves should be employed only after careful design and performance evaluation |
| [21] | Lee et al. | 2017 | experiment | ● perforated light shelf for energy saving | ● high-quality experimental studies ● no translucent elements are used |
| [22] | 2017 | experiment | ● light shelf using diffused reflection | ||
| [23] | 2017 | experiment | ● study on a movable light shelf system | ||
| [24] | 2018 | experiment | ● an awning system with a built-in light shelf | ||
| [25] | 2018 | experiment full size testbed | ● use of a diffusion sheet | ||
| [26] | 2018 | ● evaluation of a light shelf based on energy consumption | |||
| [27] | 2019 | ● light shelf with a solar module | |||
| [28] | 2019 | ● light shelf based on reflector curvature | |||
| [29] | 2020 | ● application of a prism sheet | |||
| [30] | 2020 | ● movable light shelf with a rolling reflector | |||
| [31] | 2021 | ● light shelves with photovoltaic modules | |||
| [32] | Avila-Zamora and Murillo-Quirós | 2020 | experiment | ● light distribution in a scale model using different types of light shelves | ● classroom scale models are used |
| [33] | Sadaf et al. | ● daylight performance assessment of light shelves based on inclination | ● overcast sky model is used | ||
| [34] | Ruggiero et al. | 2021 | simulation | ● energy analysis of the application of light shelf | |
| subject: anidolic daylighting system | |||||
| [35] | Courret et al. | 1998 | simulation | ● analysis of anidolic duct in the room with overcast outdoor conditions in non-residential building | ● no translucent elements are used ● DF does not take into account weather conditions, only overcast sky |
| [36] | Scartezzini and Courret | 2002 | simulation, experiment | ● three different anidolic systems were evaluated (anidolic ceiling, integrated anidolic system, anidolic solar blinds) | ● no translucent elements are used |
| [37] | Wittkopf | 2007 | simulation | ● daylight performance of anidolic ceiling with a light duct for diffuse daylight in Singapore, Japan and the UK | ● no translucent elements are used ● the simple light duct is simulated in an office room. |
| [38] | Binarti and Satwiko | 2016 | simulation, experiment | ● daylight evaluation of an affordable anidolic daylighting system with a light duct ● practically installed parabolic collector. | ● no translucent elements are used ● the simple light duct is simulated and later measured on the east-facing façade. |
1 number.
Table 2.
Geometry characteristics per material.
| Vertical Surfaces of the Test Room | Work Plane | Dropped Ceiling/Clerestory Window | Standard Window | Louvers | |
|---|---|---|---|---|---|
| Material | White paint | Dark gray (RAL 7000) | Translucent glass | Transparent glass | Gray metal |
| Reflectance | 0.82 | 0.23 | 0.36 1 | 0.19 2 | 0.39 |
| Transmittance | 0 | 0 | 0.54 1 | 0.50 2 | 0 |
1 parameter of a double layer of 4 mm Pilkington Optifloat™ Opal. 2 parameter of a single layer of 6 mm Pilkington Suncool OW 50 − 25 + 4 mm Pilkington Optifloat™ Clear.
Table 3.
The results of the computer simulation of all analyzed variants.
| Analyzed Variant | Variant 1 | Variant 2 | Variant 3 | Variant 4 | Variant 5 | Variant 6 |
|---|---|---|---|---|---|---|
| short description | base variant 1 | base + SL45° | base + TC | base + SL45° +TC | base + SL90° + TC | base + AL + TC |
| schematic section |  |  |  |  |  |  |
| (%) | 59.31% | 12.30% | 43.81% | 70.40% | 61.41% | 84.92% |
| σ | 20.11 | 10.03 | 13.21 | 2.04 | 11.54 | 2.94 |
| Emax (lx) | 35,592 | 2953 | 39,586 | 6621 | 21,749 | 6621 |
| t<300 (h) | 177 | 1828 | 117 | 442 | 190 | 201 |
| t>3000 (h) | 672 | 0 | 1058 | 110 | 616 | 110 |
| Us for Equinox14:30 | 0.51 | 0.89 | 0.75 | 0.83 | 0.76 | 0.84 |
| DGP for Equinox14:30 | 0.602 | 0.285 | 0.663 | 0.32 | 0.411 | 0.32 3 |
| Probe A (cd/m2) | 1279 | 16 | 1365 | 99 | 115 (1344 2) | 99 3 |
| Probe B (cd/m2) | 53 | 9 | 112 | 63 | 80 | 63 3 |
| Ev triggering value (lx) | n.a. | n.a. | n.a. | n.a. | n.a. | 300 |
| short characteristic | overlit | underlit | highly overlit | uniform | still overlit | even more uniform |
1 explanation of the abbreviations used: SL45°—static louvres at 45° angle, TC—translucent ceiling, SL90°—static louvres at 90° angle (perpendicular to the surface of the glass), AL—adaptive louvres opened when Ev < 300 lx, 2 value of luminance given for the bright spot between the louvres, 3 value of luminance identical to Variant 4 because the louvre geometry/setting for equinox at 14:30 was the same.
Publisher’s Note: MDPI stays neutral with regard to jurisdictional claims in published maps and institutional affiliations. |
© 2021 by the author. Licensee MDPI, Basel, Switzerland. This article is an open access article distributed under the terms and conditions of the Creative Commons Attribution (CC BY) license (https://creativecommons.org/licenses/by/4.0/).
Share and Cite
MDPI and ACS Style
Brzezicki, M. An Evaluation of Useful Daylight Illuminance in an Office Room with a Light Shelf and Translucent Ceiling at 51° N. Buildings 2021, 11, 494. https://doi.org/10.3390/buildings11110494
AMA Style
Brzezicki M. An Evaluation of Useful Daylight Illuminance in an Office Room with a Light Shelf and Translucent Ceiling at 51° N. Buildings. 2021; 11(11):494. https://doi.org/10.3390/buildings11110494
Chicago/Turabian StyleBrzezicki, Marcin. 2021. "An Evaluation of Useful Daylight Illuminance in an Office Room with a Light Shelf and Translucent Ceiling at 51° N" Buildings 11, no. 11: 494. https://doi.org/10.3390/buildings11110494
Note that from the first issue of 2016, this journal uses article numbers instead of page numbers. See further details here.