Air Leakage of Joints Filled with Polyurethane Foam

1
Nearly Zero Energy Buildings Research Group, Department of Civil Engineering and Architecture, Tallinn University of Technology, Ehitajate tee 5, 19086 Tallinn, Estonia
2
School of Engineering, Department of Civil Engineering and Architecture, Tallinn University of Technology, Ehitajate tee 5, 19086 Tallinn, Estonia
*
Author to whom correspondence should be addressed.
Buildings 2019, 9(7), 172; https://doi.org/10.3390/buildings9070172
Submission received: 19 June 2019
/
Revised: 14 July 2019
/
Accepted: 16 July 2019
/
Published: 19 July 2019
(This article belongs to the Special Issue Airtightness and Controllable Natural Ventilation for Buildings: Challenges and Trends)
Abstract
:Air leakage through the building envelope joints is usually one of the main reasons why airtightness targets are not achieved. The objective of this study was to analyse the air leakage of joints filled with polyurethane foam and its influencing factors. Wooden test specimens (54 in total) with planed, sawn and plastic-coated cavities and two cavity thicknesses were filled with three different polyurethane foams and tested according to standard EN 12114. The surface type and thickness of the joint had a significant effect on the air leakage of joints filled with polyurethane foam. In laboratory conditions, a consistent and very low air leakage rate was obtained with planed timber surfaces. Joints with plastic-coated and sawn timber surfaces performed worse, on average, by a factor of two or more and contributed to very variable airtightness, with up to 28% and 50% of the test specimens failing the airtightness testing. On the basis of the high ‘failure rate’, polyurethane foam may classify as a not completely trustworthy solution in guaranteeing the airtightness of construction joints. A comparison of estimated and previously measured overall airtightness of an entire building envelope showed dependency on ‘failure rate’ rather than on average measured leakage rate.
1. Introduction
An airtight and well-insulated building envelope is a key factor for achieving the requirements set for nearly zero energy buildings (nZEB) becoming mandatory in the European Union (EU) from the year 2021. Increased insulation thickness in timber constructions creates a serious risk of moisture accumulation inside the construction and deterioration of the building structure, if air leakages are not minimised or avoided. This is especially important in the case of timber constructions where the materials are more sensitive to extensive moisture and deterioration. There are several different technical solutions for sealing the cracks, joints and penetrations through the building envelope. Special sealing tapes for different surface materials, airtight membranes, rubber collars, adhesive sealing glues and different montage foams are used with varying degrees of success. Although it has been shown that the overall airtightness of new buildings has improved significantly [1,2,3], the actual leakage rate and its variation is strongly related to overall quality assurance mechanisms and local building techniques [1,4], especially for window-related air leakages [5].
Polyurethane (PU) one-component foams (OCF) are self-adhesive and self-hardening sealing materials that are often used for door and window installation and filling other joints and gaps in the building envelope. Despite their widespread use, it is not known if the necessary airtightness can be consistently achieved without the use of additional sealing tapes. The volume of PU OCF expands after application, filling all hollow spaces and hardens on contact with the air humidity. The expansion of the foam cannot be fully controlled, and therefore successful results can be highly dependent on the surface properties along with the foam properties and the environmental conditions. Different joints in the building envelope can have different surface materials. Depending on the construction technology, a cap between different envelope elements can have a sawn wooden surface (wooden studs and beams at the end of walls, roof elements, etc.), a planed wooden surface (connection between wooden window frame, plywood and other similar wood-based products, planed wooden elements etc.) or a plastic surface (connection between wall and a window frame manufactured from polyvinyl chloride (PVC)). All three surface types were analysed in this study to quantify the differences due to surface treatment.
The objective of this study was to analyse the air leakage of joints filled with polyurethane foam and their influencing factors to see if consistent airtightness can be achieved under varying conditions. The first part of the study consisted in estimating experimentally the air leakage rates over test specimens prepared so to analyse the influence of different foams, joint widths and surface treatments. Inferential statistics was then used in the second part of the paper for the analysis and interpretation of the data. The following hypotheses were studied:
- A joint between sawn wooden surfaces is leakier than a joint between planed wooden surfaces because the sawn surface is rougher;
- A joint with a PVC surface has larger leakage than the other tested joints because the foam is not exposed to humidity, and water droplets on the plastic surface may cause leakage pathways;
- A wider joint has larger air leaks because the pressure exerted by the expanding foam is lessened;
- Different foams have different air leakage properties.
2. Methods
2.1. Studied Joints
In this study, 95 mm-deep joints with two different widths (10 mm and 30 mm) and three different surface treatments (sawn wooden laths (SW), planed wooden laths (PW), and plastic surface (PVC)) filled with three different polyurethane foam products (product L, product S, product K, all with high elastic recovery dimensional stability) from different producers were studied. Three identical test specimens were prepared for each combination to reduce measurement uncertainty, totalling 54 test specimens. Foam was applied to each joint twice, once on each side.
The studied joints may represent joints in different building envelope structures, where achieving airtightness is necessary, and montage foams are generally used for this purpose. Some examples are presented in Figure 1.
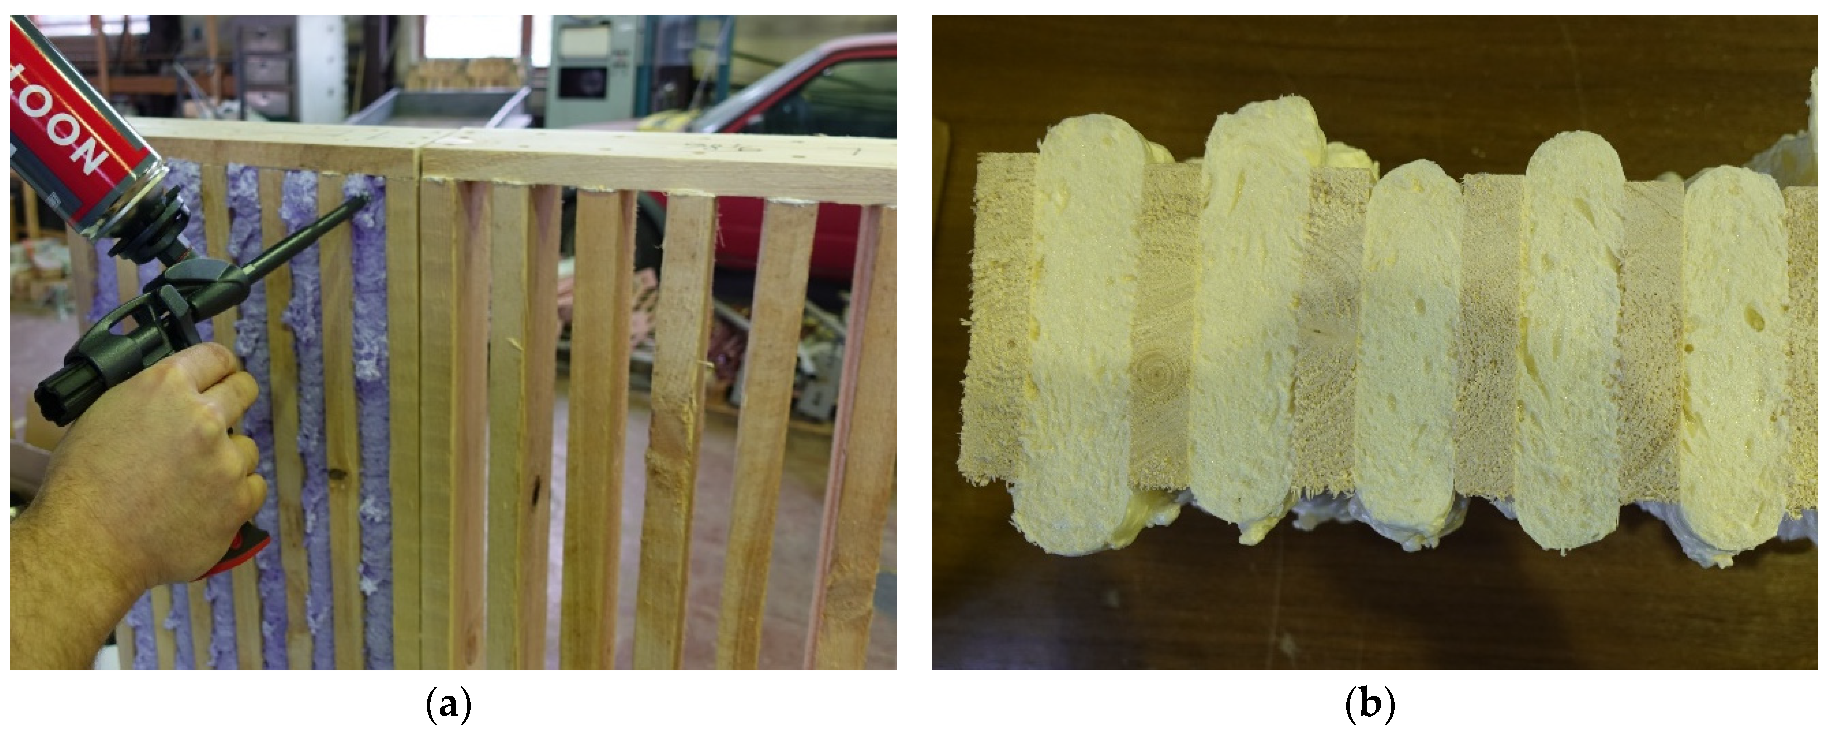
The joints were filled in laboratory conditions by professional workers (provided by the PU-foam producers) according to the filling instructions (Figure 2a). Joint filling was carried out so that the foam filled the joint in its width (Figure 2b). Excessive foam was removed after the first round of measurements to allow repeated measurements of the test specimens with a cut foam surface.
2.2. Measurements
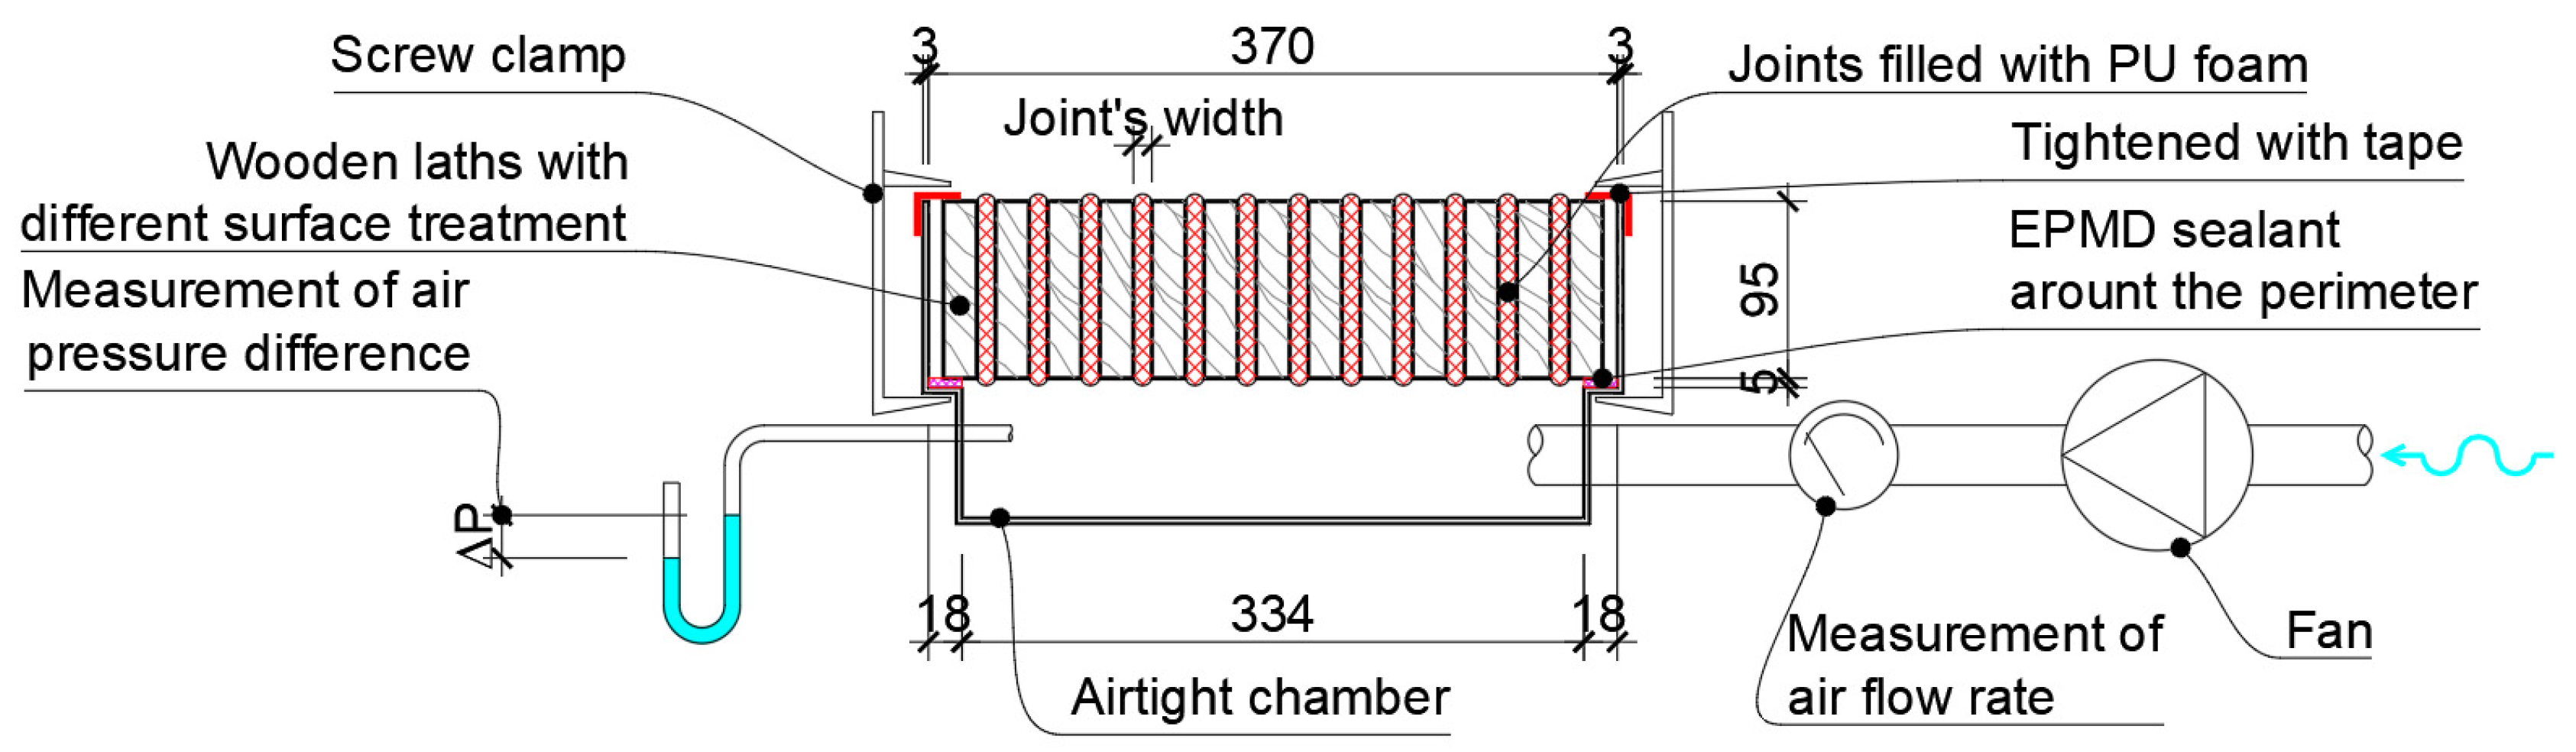
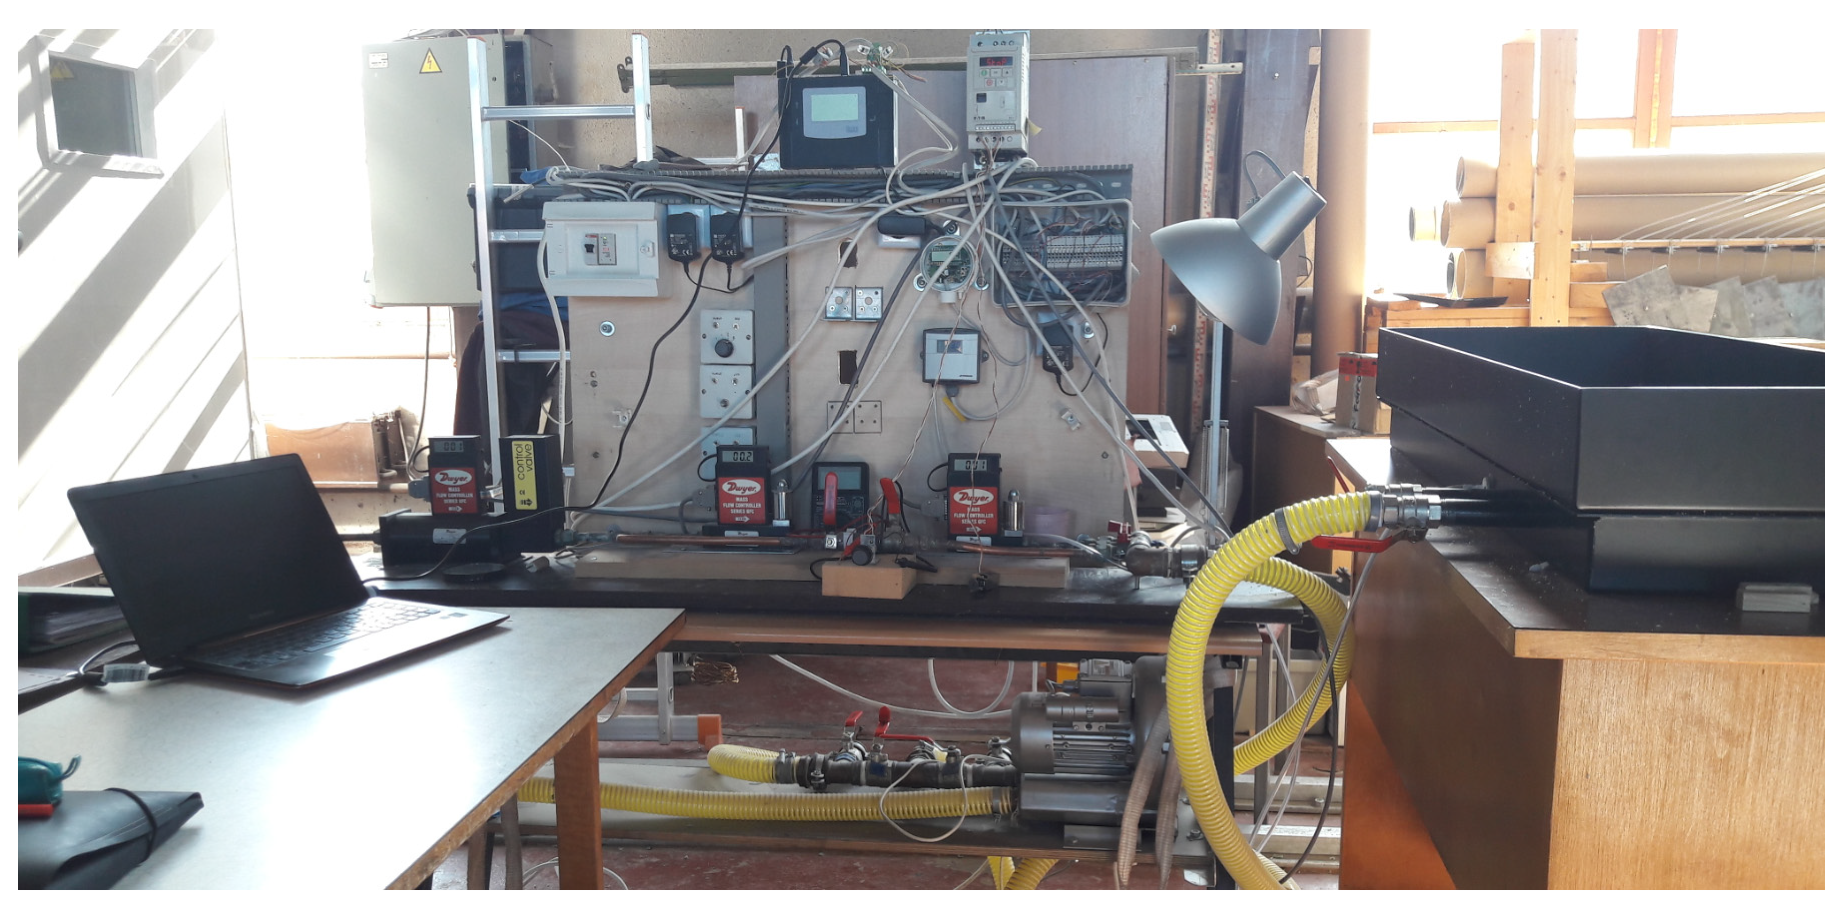
The measurements of air leakage from the building envelope joints were conducted under laboratory conditions, based on the EN 12114 standard [6]. The air leakage test equipment (Figure 3 and Figure 4) consisted of the following:
- A hermetic chamber (Tallinn University of Technology, Tallinn, Estonia) (3 mm steel plate with ethylene propylene diene monomer (EPDM) rubber sealant) with the test area having a width of 334 mm, a height of 1000 mm and a depth of 100 mm;
- A fan (Elmo Rietschle G-BH1, positive pressure difference ≤100 kPa, negative pressure difference ≤90 kPa, air flow 2450 m3/h, Gardner Denver, Inc, Milwaukee, USA) for creating an air flow;
- A frequency converter (EATON DC1-S24DNN-A20N, Eaton Industries GmbH, Bonn, Germany) to regulate the air flow;
- An air flow calibrator (Dwyer: GFC 1109 for 0–5 L/min, GFC 1131 for 0–30 L/min, GFC 1144 for 0–500 L/min, with an accuracy of ±1.5%, Dwyer Instruments International, Michigan, USA);
- A differential manometer (Produal PEL-DK for 0–1000 Pa and Dwyer Magnesense MS for 0–100 Pa, with an accuracy of ±1%) for pressure difference measurements;
- A temperature and relative humidity sensor (Rotronic HygroClip SC05, Rotronic AG, Bassersdorf, Switzerland);
- A data-logger (Grant Squirrel SQ2010, 8 channels, Grant Instruments, Cambridge, United Kingdom) for automatic and simultaneous data reading and saving.
Kalamees et al. (2010) [7] analysed the air pressure conditions in typical Finnish residences using data from field measurements and computer simulations and showed that for detached houses, the design value of the air pressure difference across the building envelope for moisture convection analysis should be at least ±10 Pa. To avoid the disruptive effect of normal air pressure variation, air leakage measurements have to be conducted at a higher air pressure difference. According to ISO 9972 [8], the air leakage measurement of the whole building envelope is performed between 10 Pa and typically up to 60 Pa and 100 Pa, while the reference pressure difference for the declared air leakage rate is usually equal to 50 Pa. European standard EN 12114 [6] about air permeability of building components and building elements aims for the maximum pressure difference up to 1000 Pa during measurements, while the reference pressure difference for classifying the air permeability of windows and doors is 100 Pa, according to EN 12207 [9]. The climatic conditions (e.g., wind speed) corresponding to different pressure differences significantly depend on the wind direction, building height and shape, etc. The typical reference pressure difference of 50 Pa corresponds roughly to a wind speed in the range of 9 to 10 m/s.
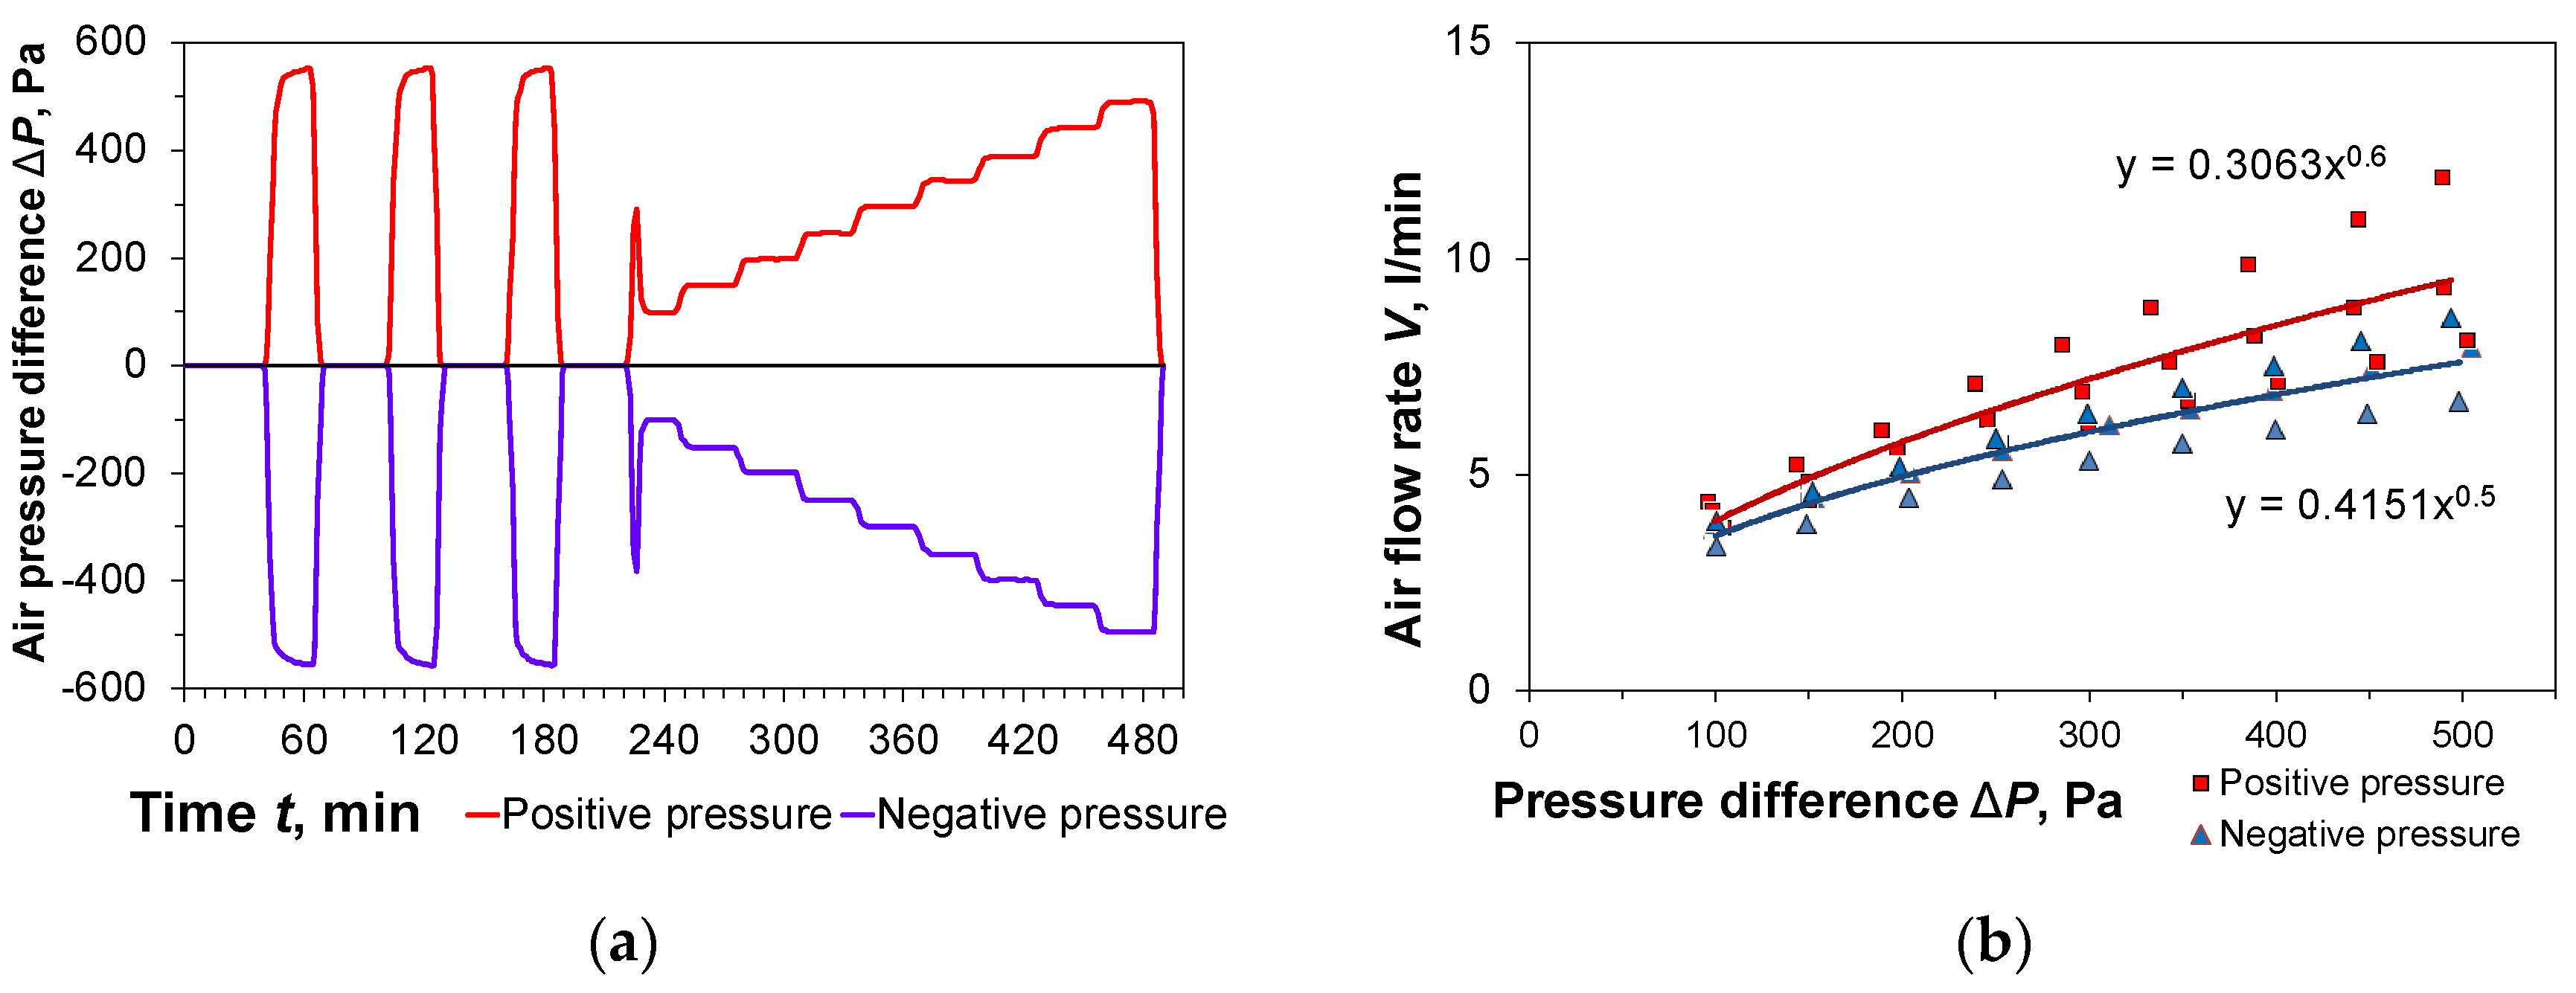
In this study, air leakage measurements were conducted at different air pressure differences, depending on the individual test, up to ±600 Pa, together with three pressure pulses (Figure 5a) according to EN 12114 standard. The air flow rate and static air pressure differences were measured and recorded at each step automatically. The relation between the pressure difference and the airflow through the building envelope (Figure 5b) allowed to present the results using the power law (Equation (1)):
where (m3/h) is the airflow, is the air pressure difference (Pa), and C (m3/(h·Pan)) and n (-) are constants obtained from curve fitting, with n ranging from 0.5 to 1.
The air leakage of each test specimen was measured at positive and negative pressure differences (different flow direction) with separate curve fitting. After removing the excessive foam, all measurements were repeated at positive and negative pressure differences to account for both situations in real-life conditions. During this repetitive testing phase, each test specimen was measured four times totalling 216 separate measurement sequences.
2.3. Statistical Analysis
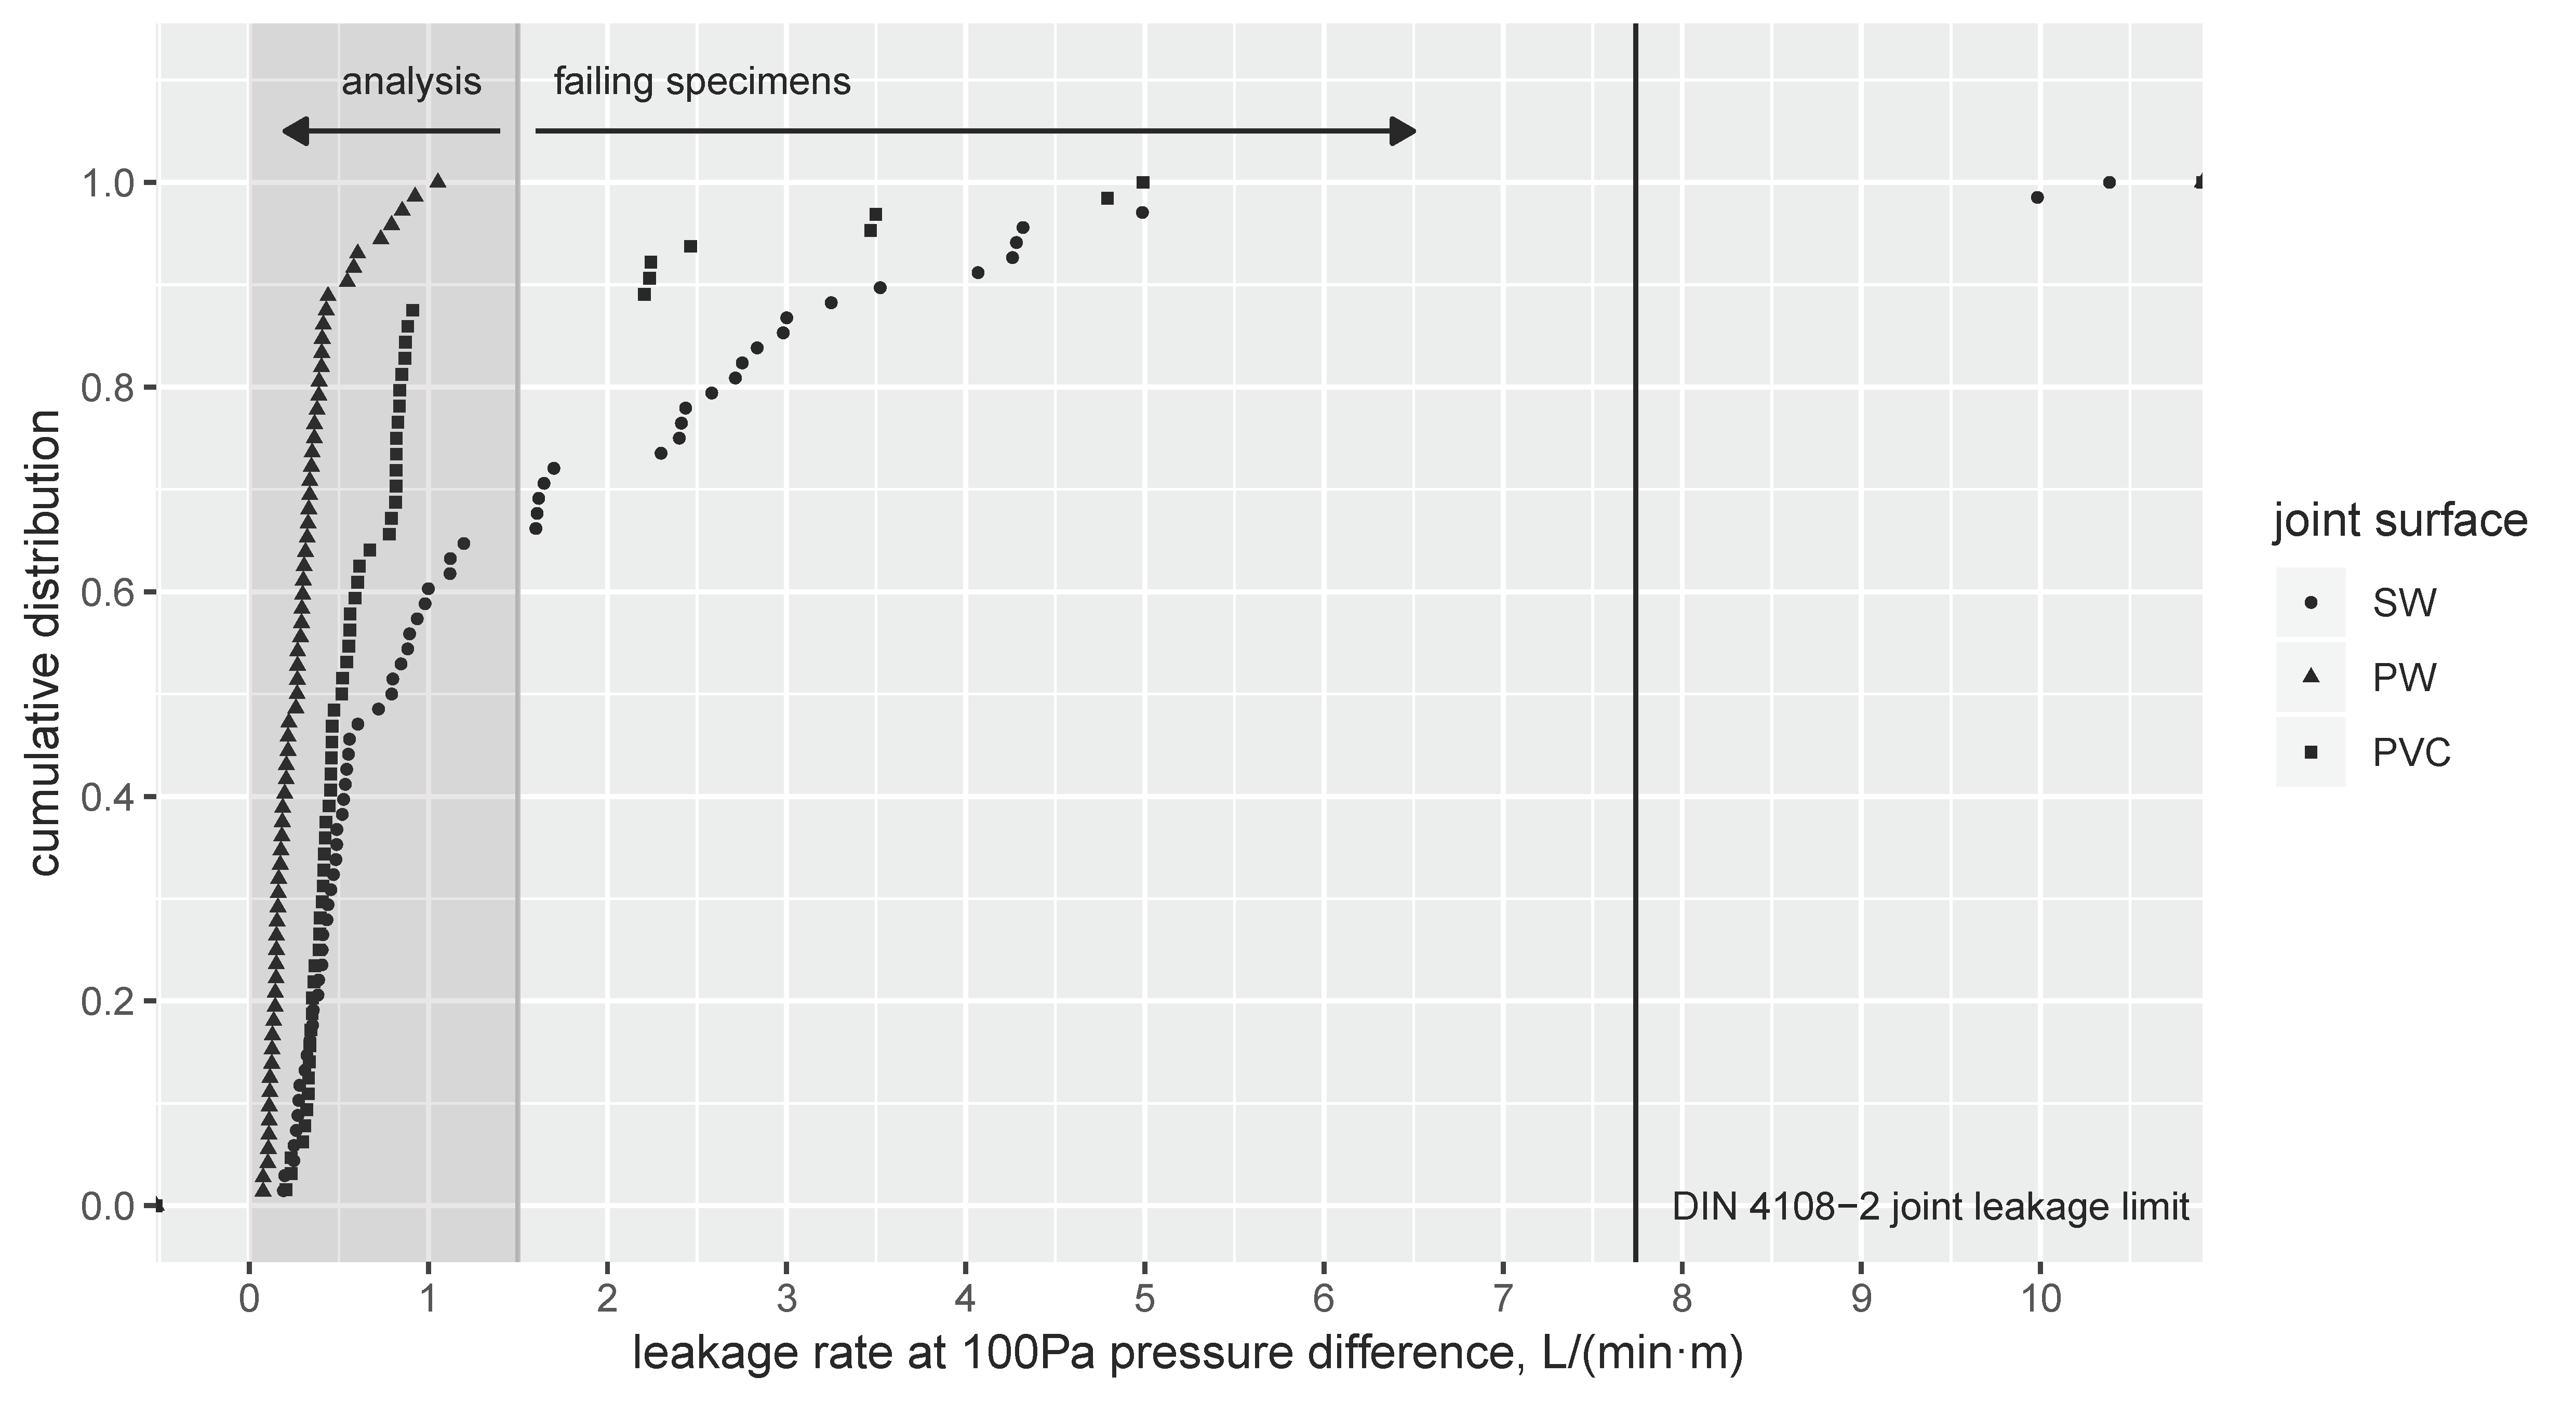
The measurement data were combined into a database and analysed to test the significance of different factors. To allow the comparison of test specimens with different lath and joint dimensions, the measured air flow rate was divided by the cumulative joint length of each test specimen to obtain the air leakage rates (V100 … V500, L/(min·m)). Preliminary analysis of the measured air leakages over a wide range of pressure differences showed that some test specimens with the same foam, joint width and surface treatment had significantly larger air leakage rates and therefore were marked as ‘failing specimens’ and omitted from more detailed statistical analysis. The failing criterion was defined as V100 > 1.5 L/(min·m). Nevertheless, all measurement results were still used to determine the ratio of failed specimens grouped by foam, lath surface treatment and joint width. The cumulative distribution of leakage rates at 100 Pa pressure difference for different joint surface types along with a graphical representation of the failing test specimens is shown in Figure 6. The general limiting value of air leakage for airtight joints (0.1 m3/(m⋅h⋅(daPa)2/3)) according to German standard DIN 4108-2 is also shown in the figure for the corresponding pressure difference [10].
Due to measurement sensitivity, the air leakage rate of some test specimens could not be measured for the full range of pressure differences. Some test specimens were too tight for stable measurements at lower pressure differences, while some test specimens with higher leakage did not sustain a stable pressure difference at 500 Pa and 600 Pa pressure difference. For this purpose, more detailed statistical analysis was done with air leakage rates at 400 Pa pressure difference. For the analysis, a power law between pressure difference and airflow through the envelope (Equation (1)) was linearized and statistically fitted to the measured leakage rates and pressure differences separately for each test specimen. The respective flow coefficients and exponents derived for each test specimen were used according to the estimated air leakage rates at exactly 400 Pa pressure difference (according to Equation (1)). The mean air leakage rate (V400) per metre length of joint along with the standard deviation (σV400) was calculated and tested for significant differences (One-Way ANOVA with 95% confidence interval) between the different grouping factors (joint width, lath surface treatment, foam product). Additionally, air leakage rates at 50 Pa pressure difference were estimated from the same power curves to allow comparisons with previous studies.
3. Results
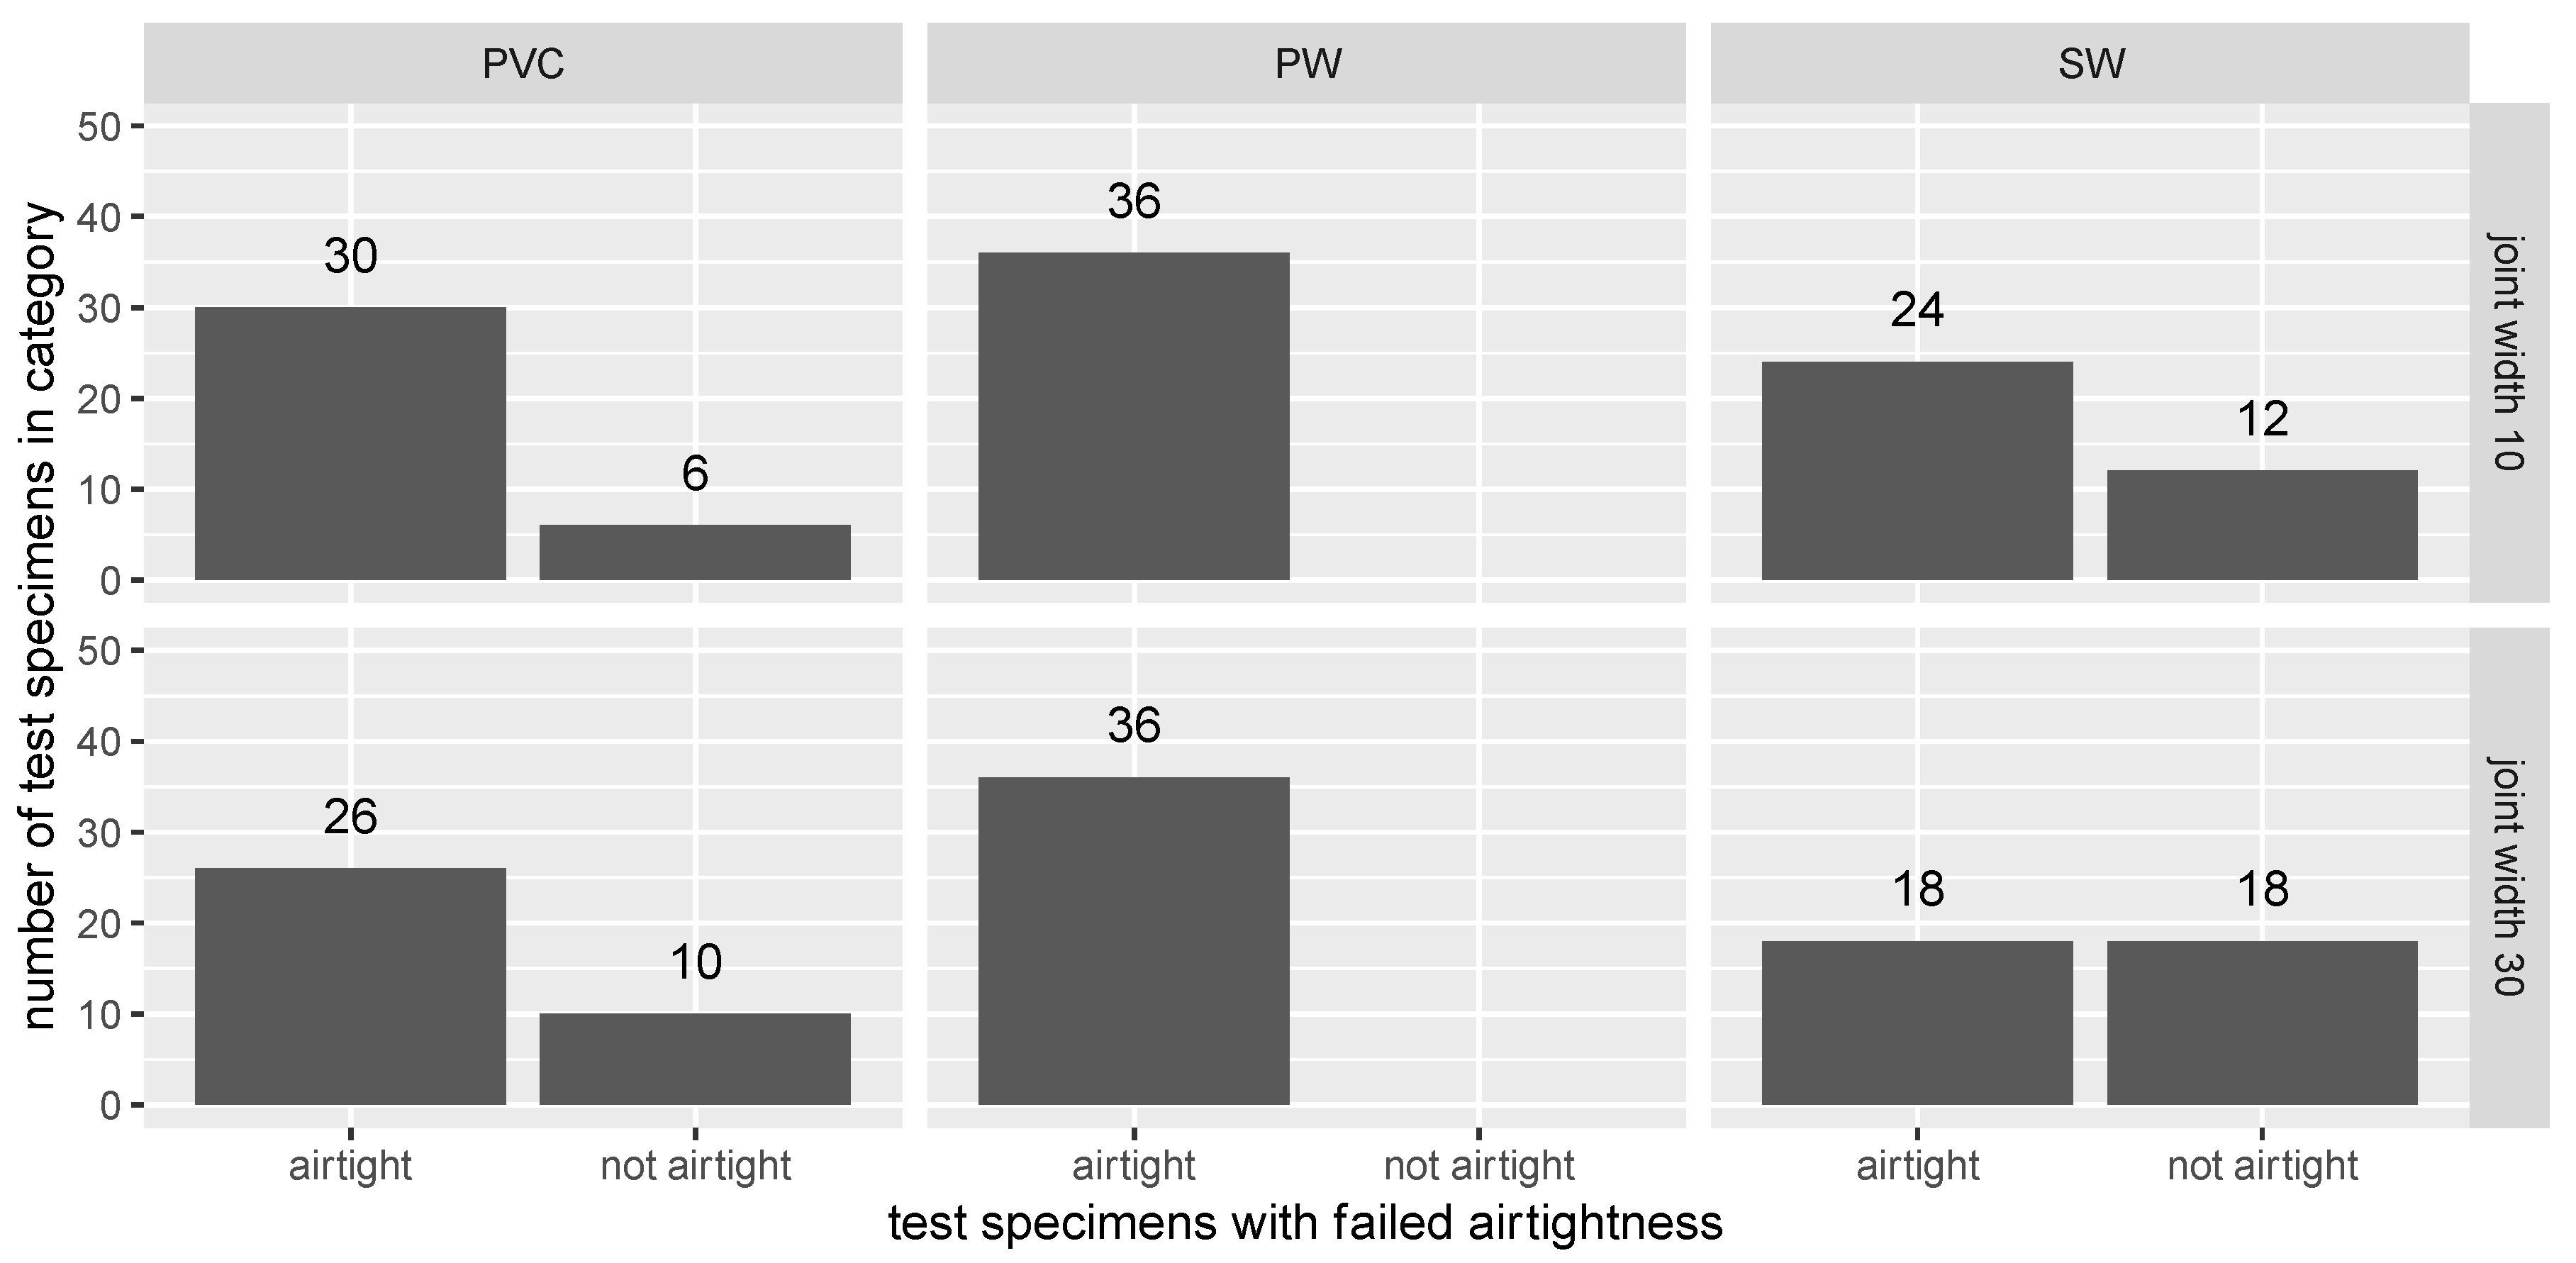
The proportion of the test specimens with failed airtightness (significantly larger air leakage compared to test specimens with exactly the same configuration or excessive air leakage of all test specimens with visible cracks) depended greatly on lath surface treatment. Figure 7 shows that in the case of planed timber, the airtightness did not fail. In the case of the PVC surface, the proportion of failed test specimens was 16% and 28%, respectively, for 10 mm and 30 mm joint widths. Joints with a sawed wooden surface performed significantly worse, with a failure rate of 33% and 50% for 10 mm and 30 mm joint widths, respectively.
A larger joint width also contributed to a higher failure rate of airtightness. Grouping by specific foam product did not have a significant effect on the failure rate of the test specimens.
The mean air leakage rates at 400 Pa and 50 Pa pressure differences grouped by foam product, joint width and lath surface treatment are given in Table 1 along with the variations (standard deviation) among the test specimens and in under- and overpressure conditions. For statistical testing, air leakage rates at 400 Pa pressure difference were used.
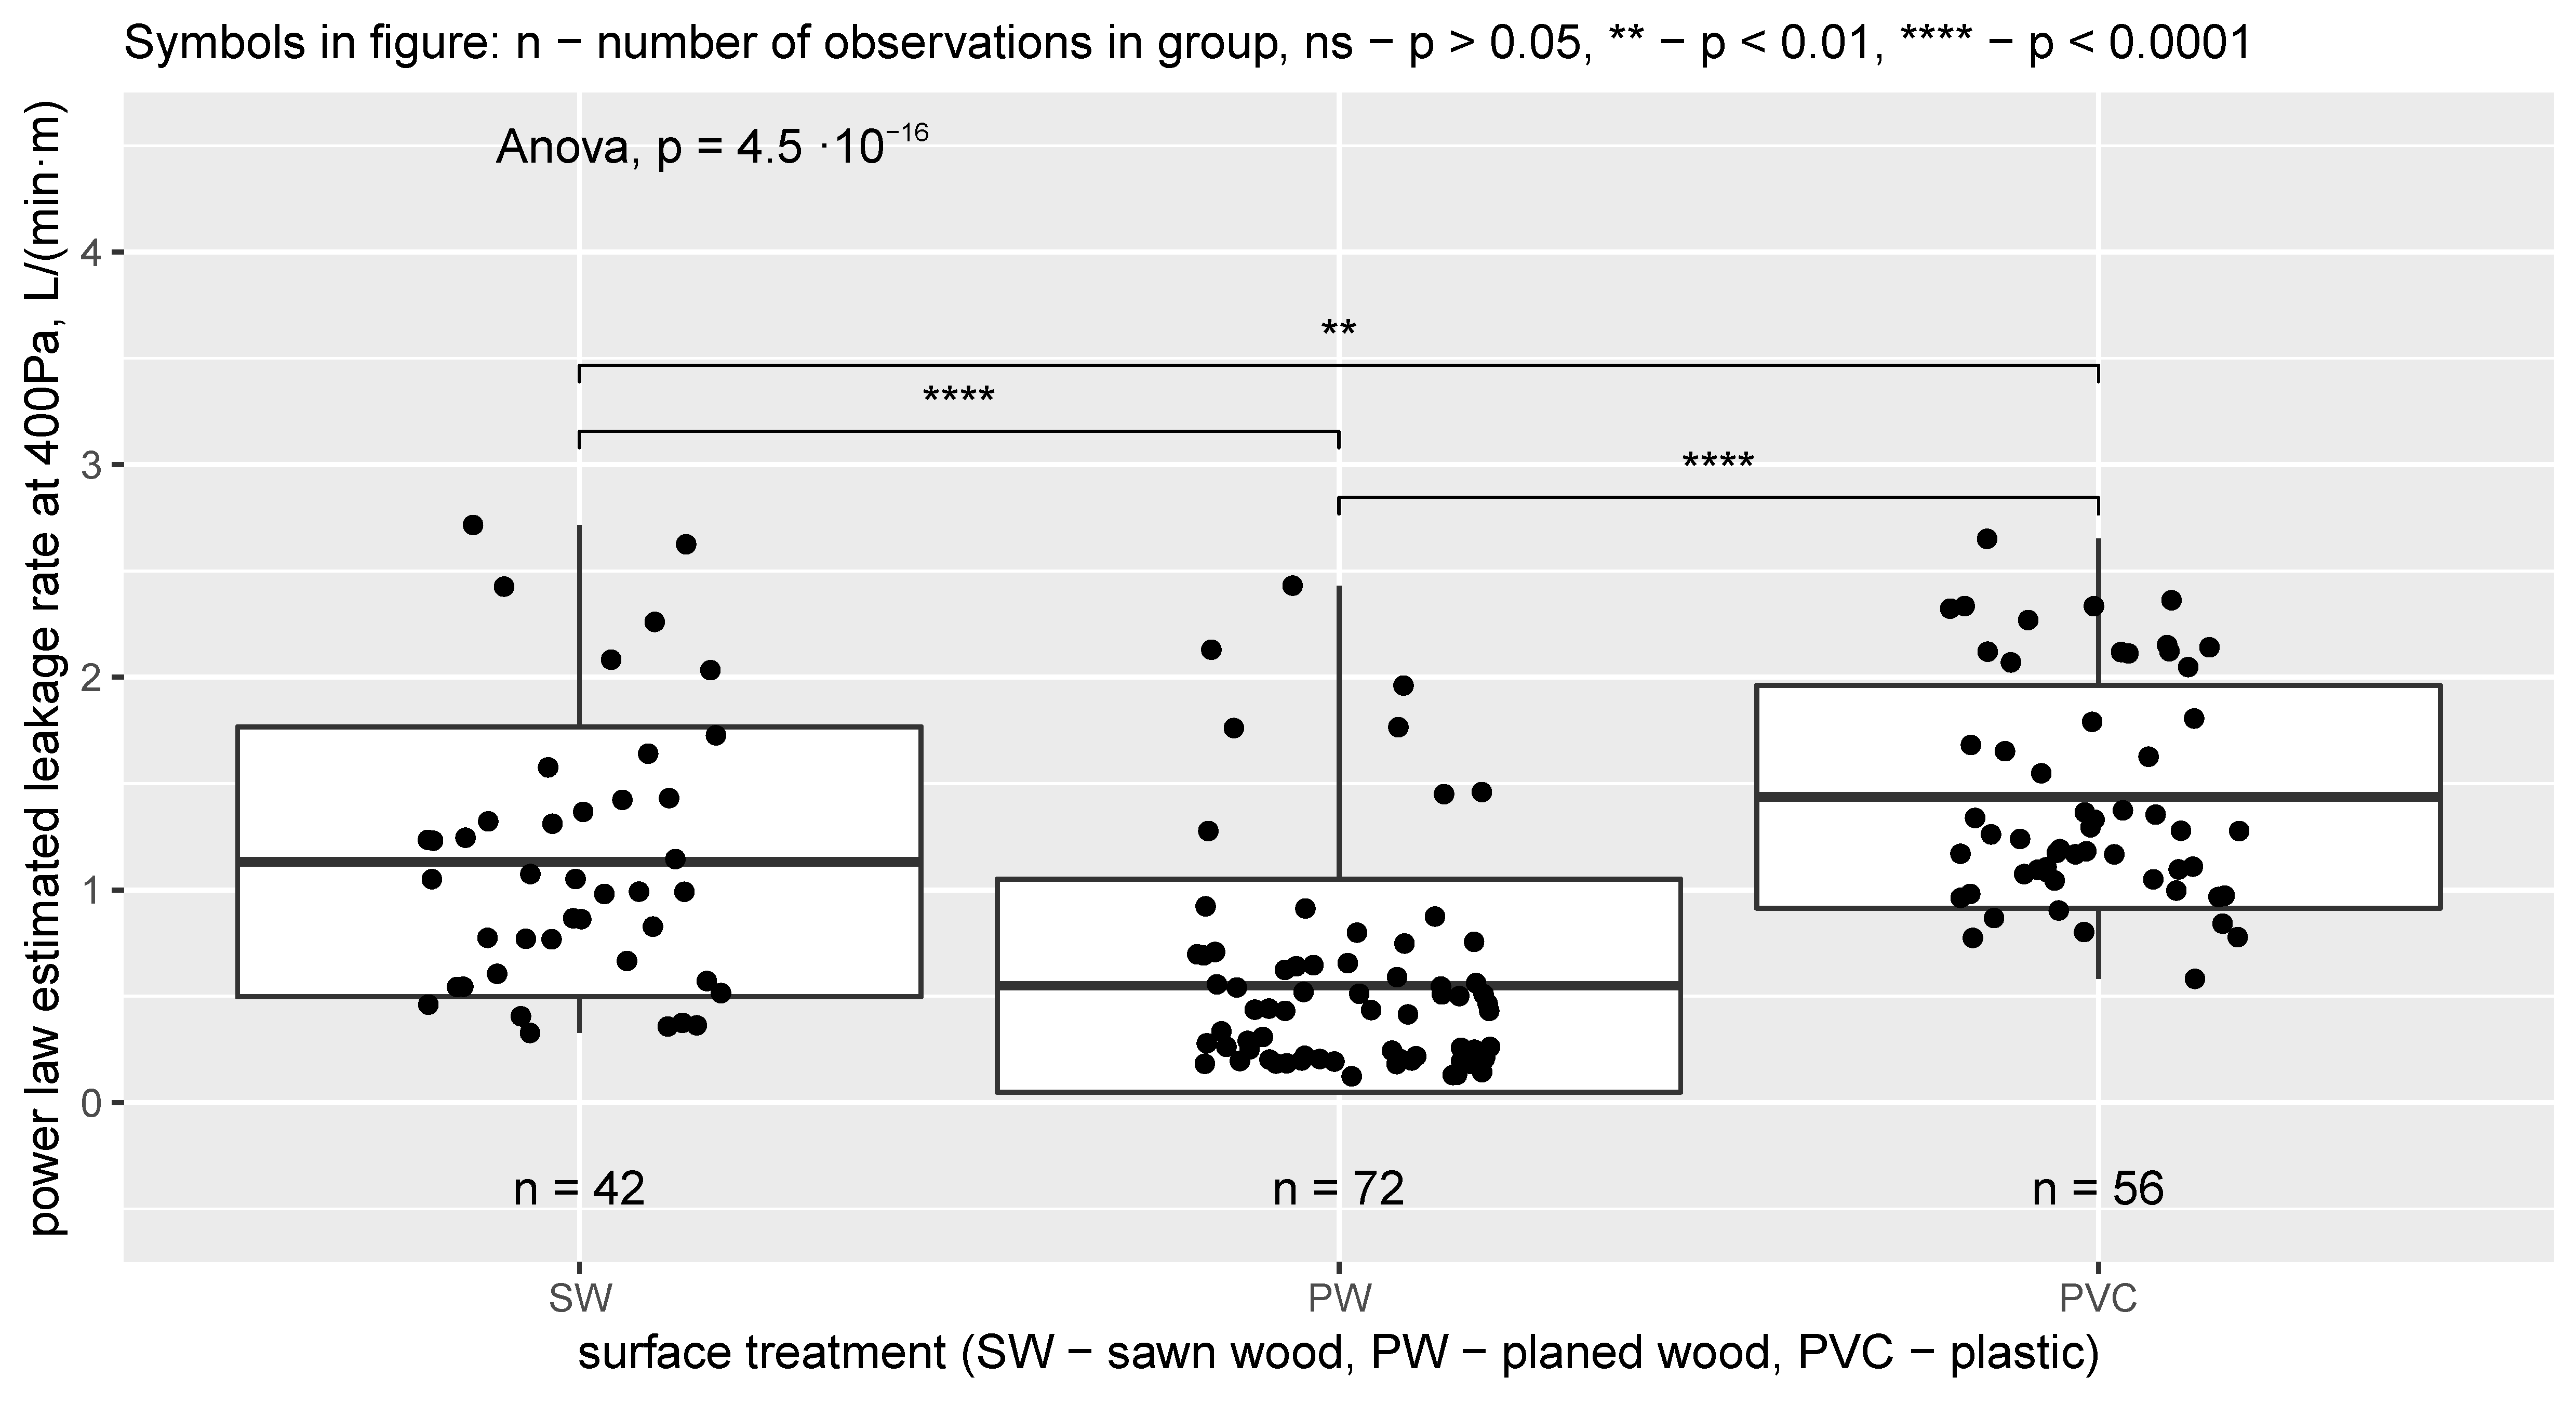
Figure 8 shows that the mean air leakage rate for joints with a planed wood surface (V400 = 0.549 L/(min·m)) was significantly (p < 0.0001) lower by a factor of two or more than that of joints with sawn wood surfaces (V400 = 1.132 L/(min·m)) and plastic surfaces (V400 = 1.438 L/(min·m)). Also, the deviation was lower for joints with a planed wooden surface (σV400 = 0.501 L/(min·m)) compared to those with sawn wooden surfaces (σV400 = 0.635 L/(min·m)) and plastic surfaces (σV400 = 0.524 L/(min·m)), meaning a better reliability in achieving the target result. It was expected that the smooth timber surface would enable better bonding between the timber surface and the PU foam, in contrast to the sawn timber surface, for which the foam would not fill all the small grooves etc.
For plastic-coated laths, the foam can expand similarly to planed laths, but the humidity transport from surface to foam is limited, and therefore the foam expansion is inhibited. This is usually compensated by moistening the plastic surface before applying the foam; however, exact guidelines regarding the quantities to be used are not provided by the foam producers. If the plastic surface is moistened before the foam is applied, water droplets on the plastic surface may cause random leakage pathways depending on the spraying technique and the amount of water used. The difference between PVC coating and sawed timber was small (but still significant, with p < 0.01) contributing to approximately a 27% increase of leakage, on average, in the case of plastic coating.
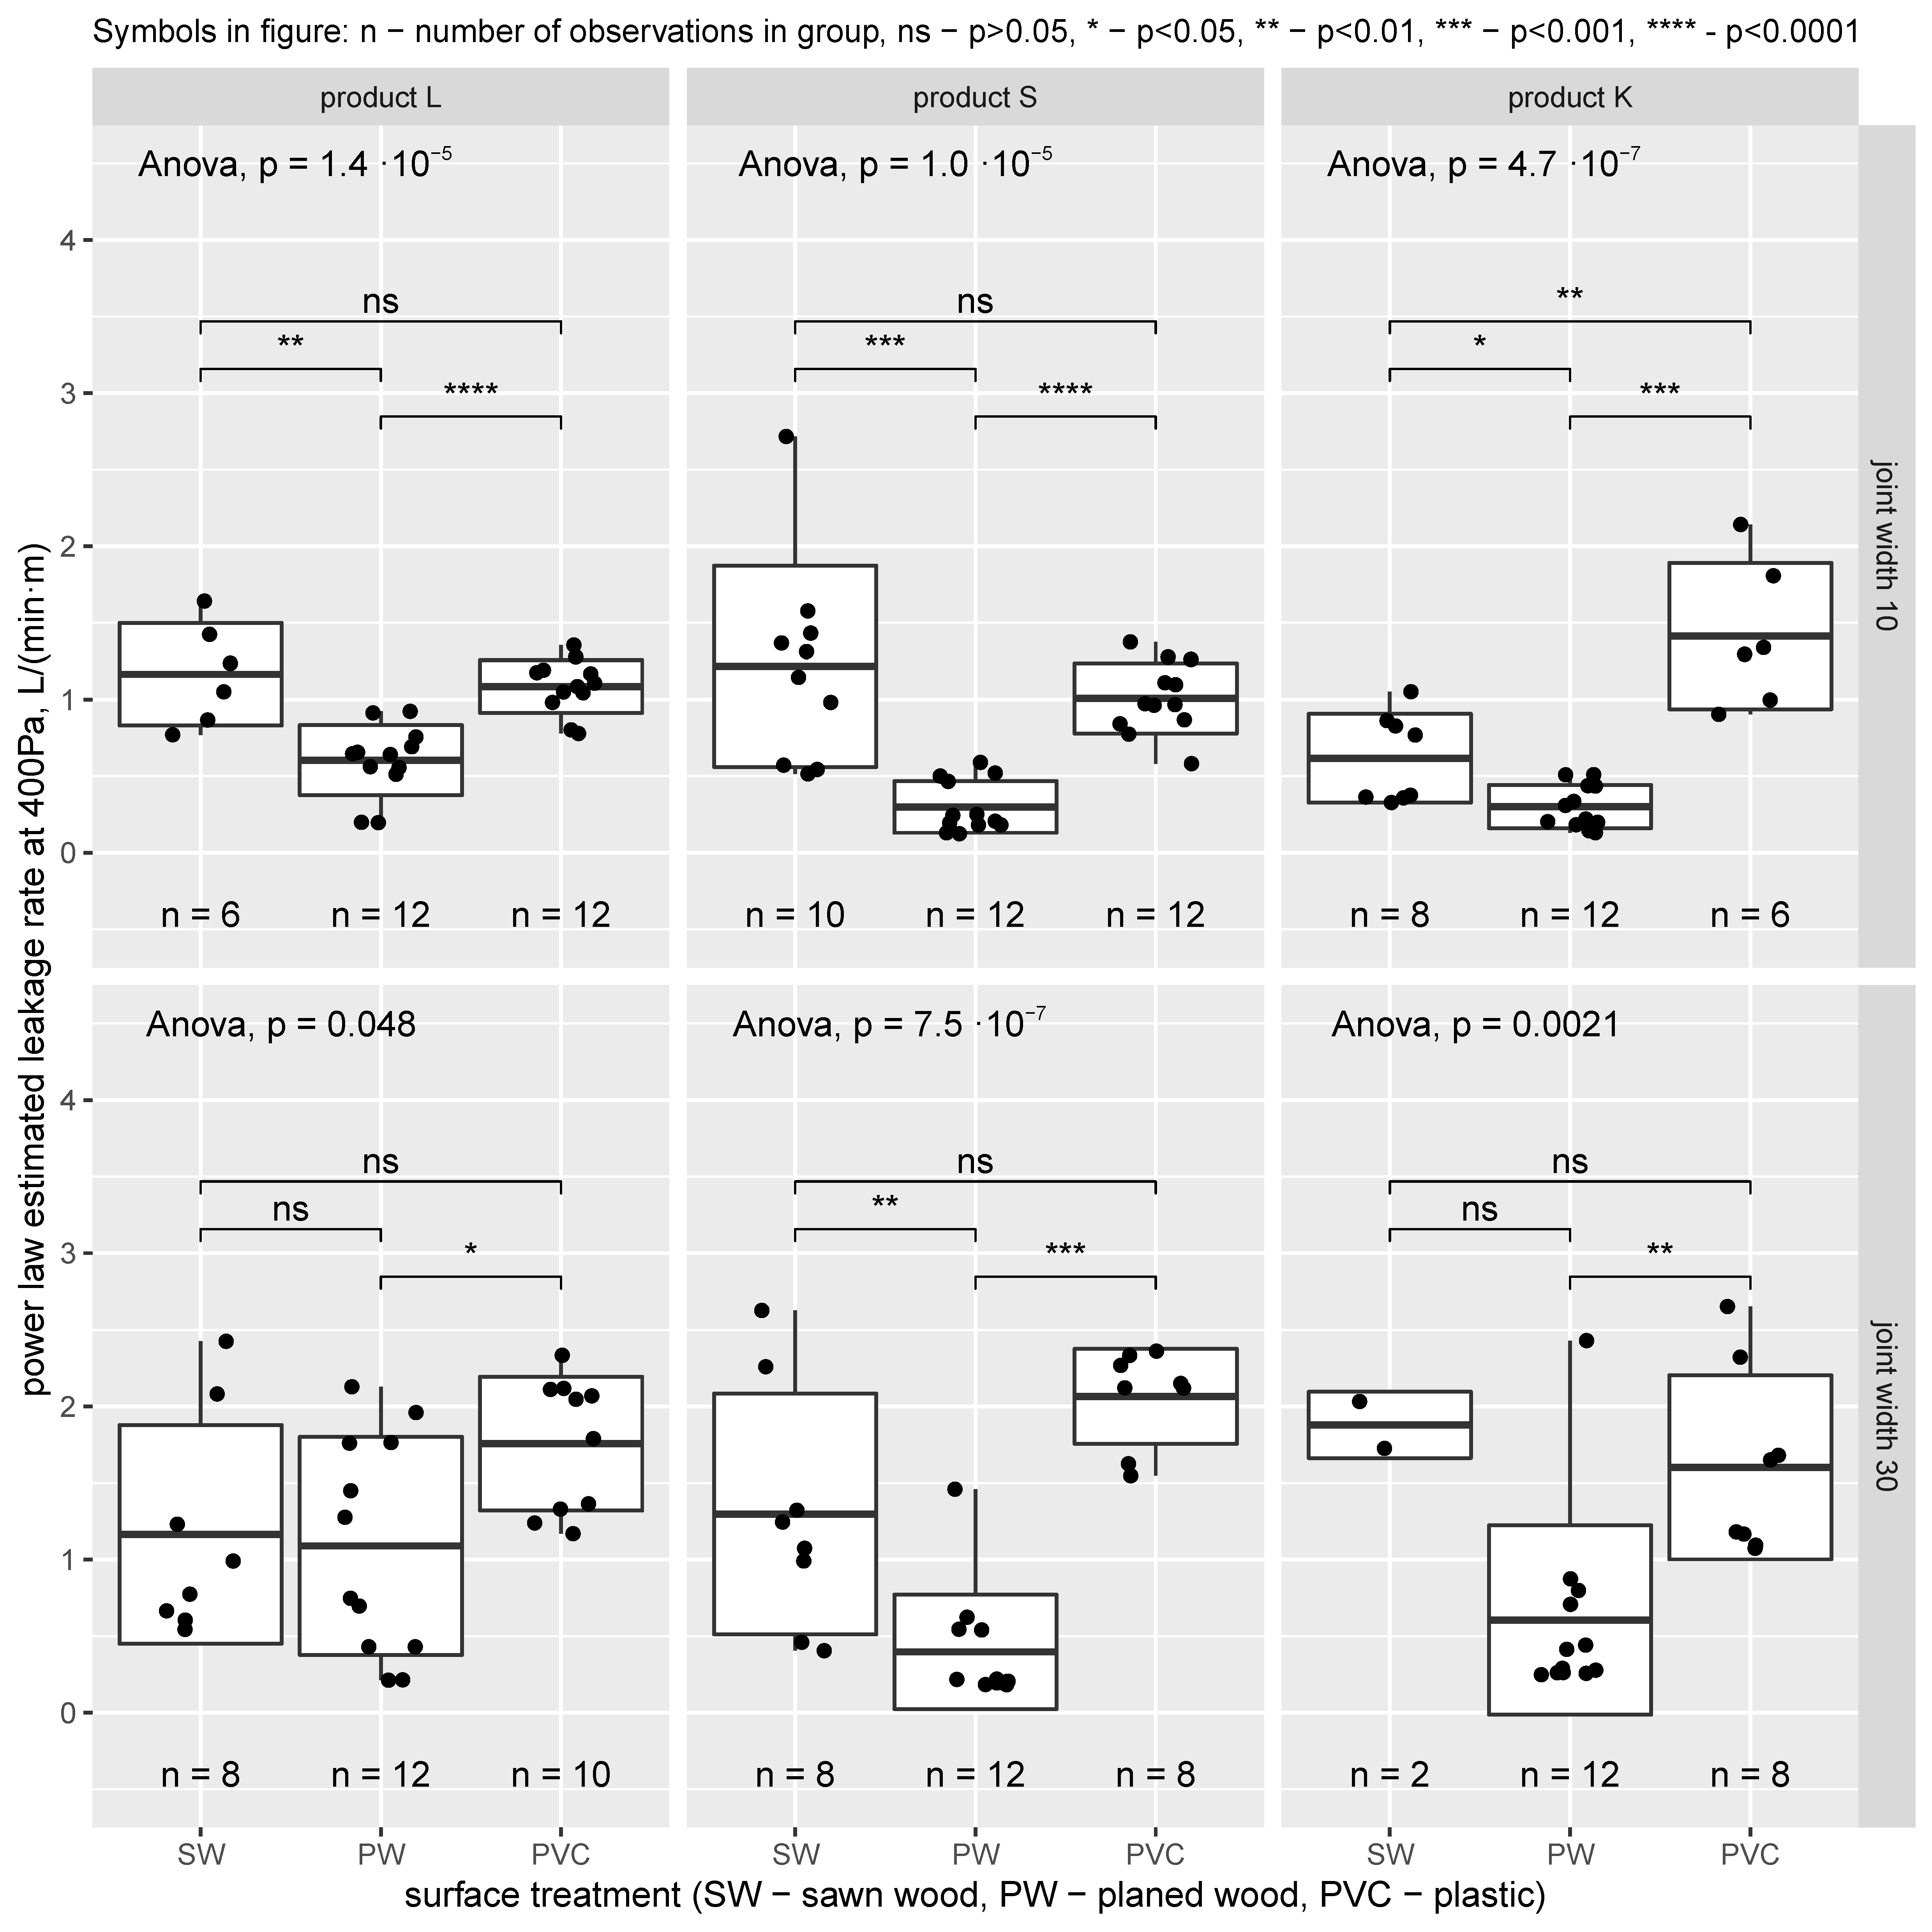
The comparison between different surface treatments within groups, for the same foam product and joint with is shown in Figure 9.
The air leakage rate in the case of the planed timber remained significantly lower than those measured for the two other surface treatment groups, even when considering the effect of joint width (10 mm versus 30 mm) and specific foam products, except for the test specimens with 30 mm-wide joints treated with the foam product “L”, for which all measurements had large variations, and the average air flow difference between all foam products were small. The difference between the sawn wooden surface and the plastic surface was not significant in most cases.
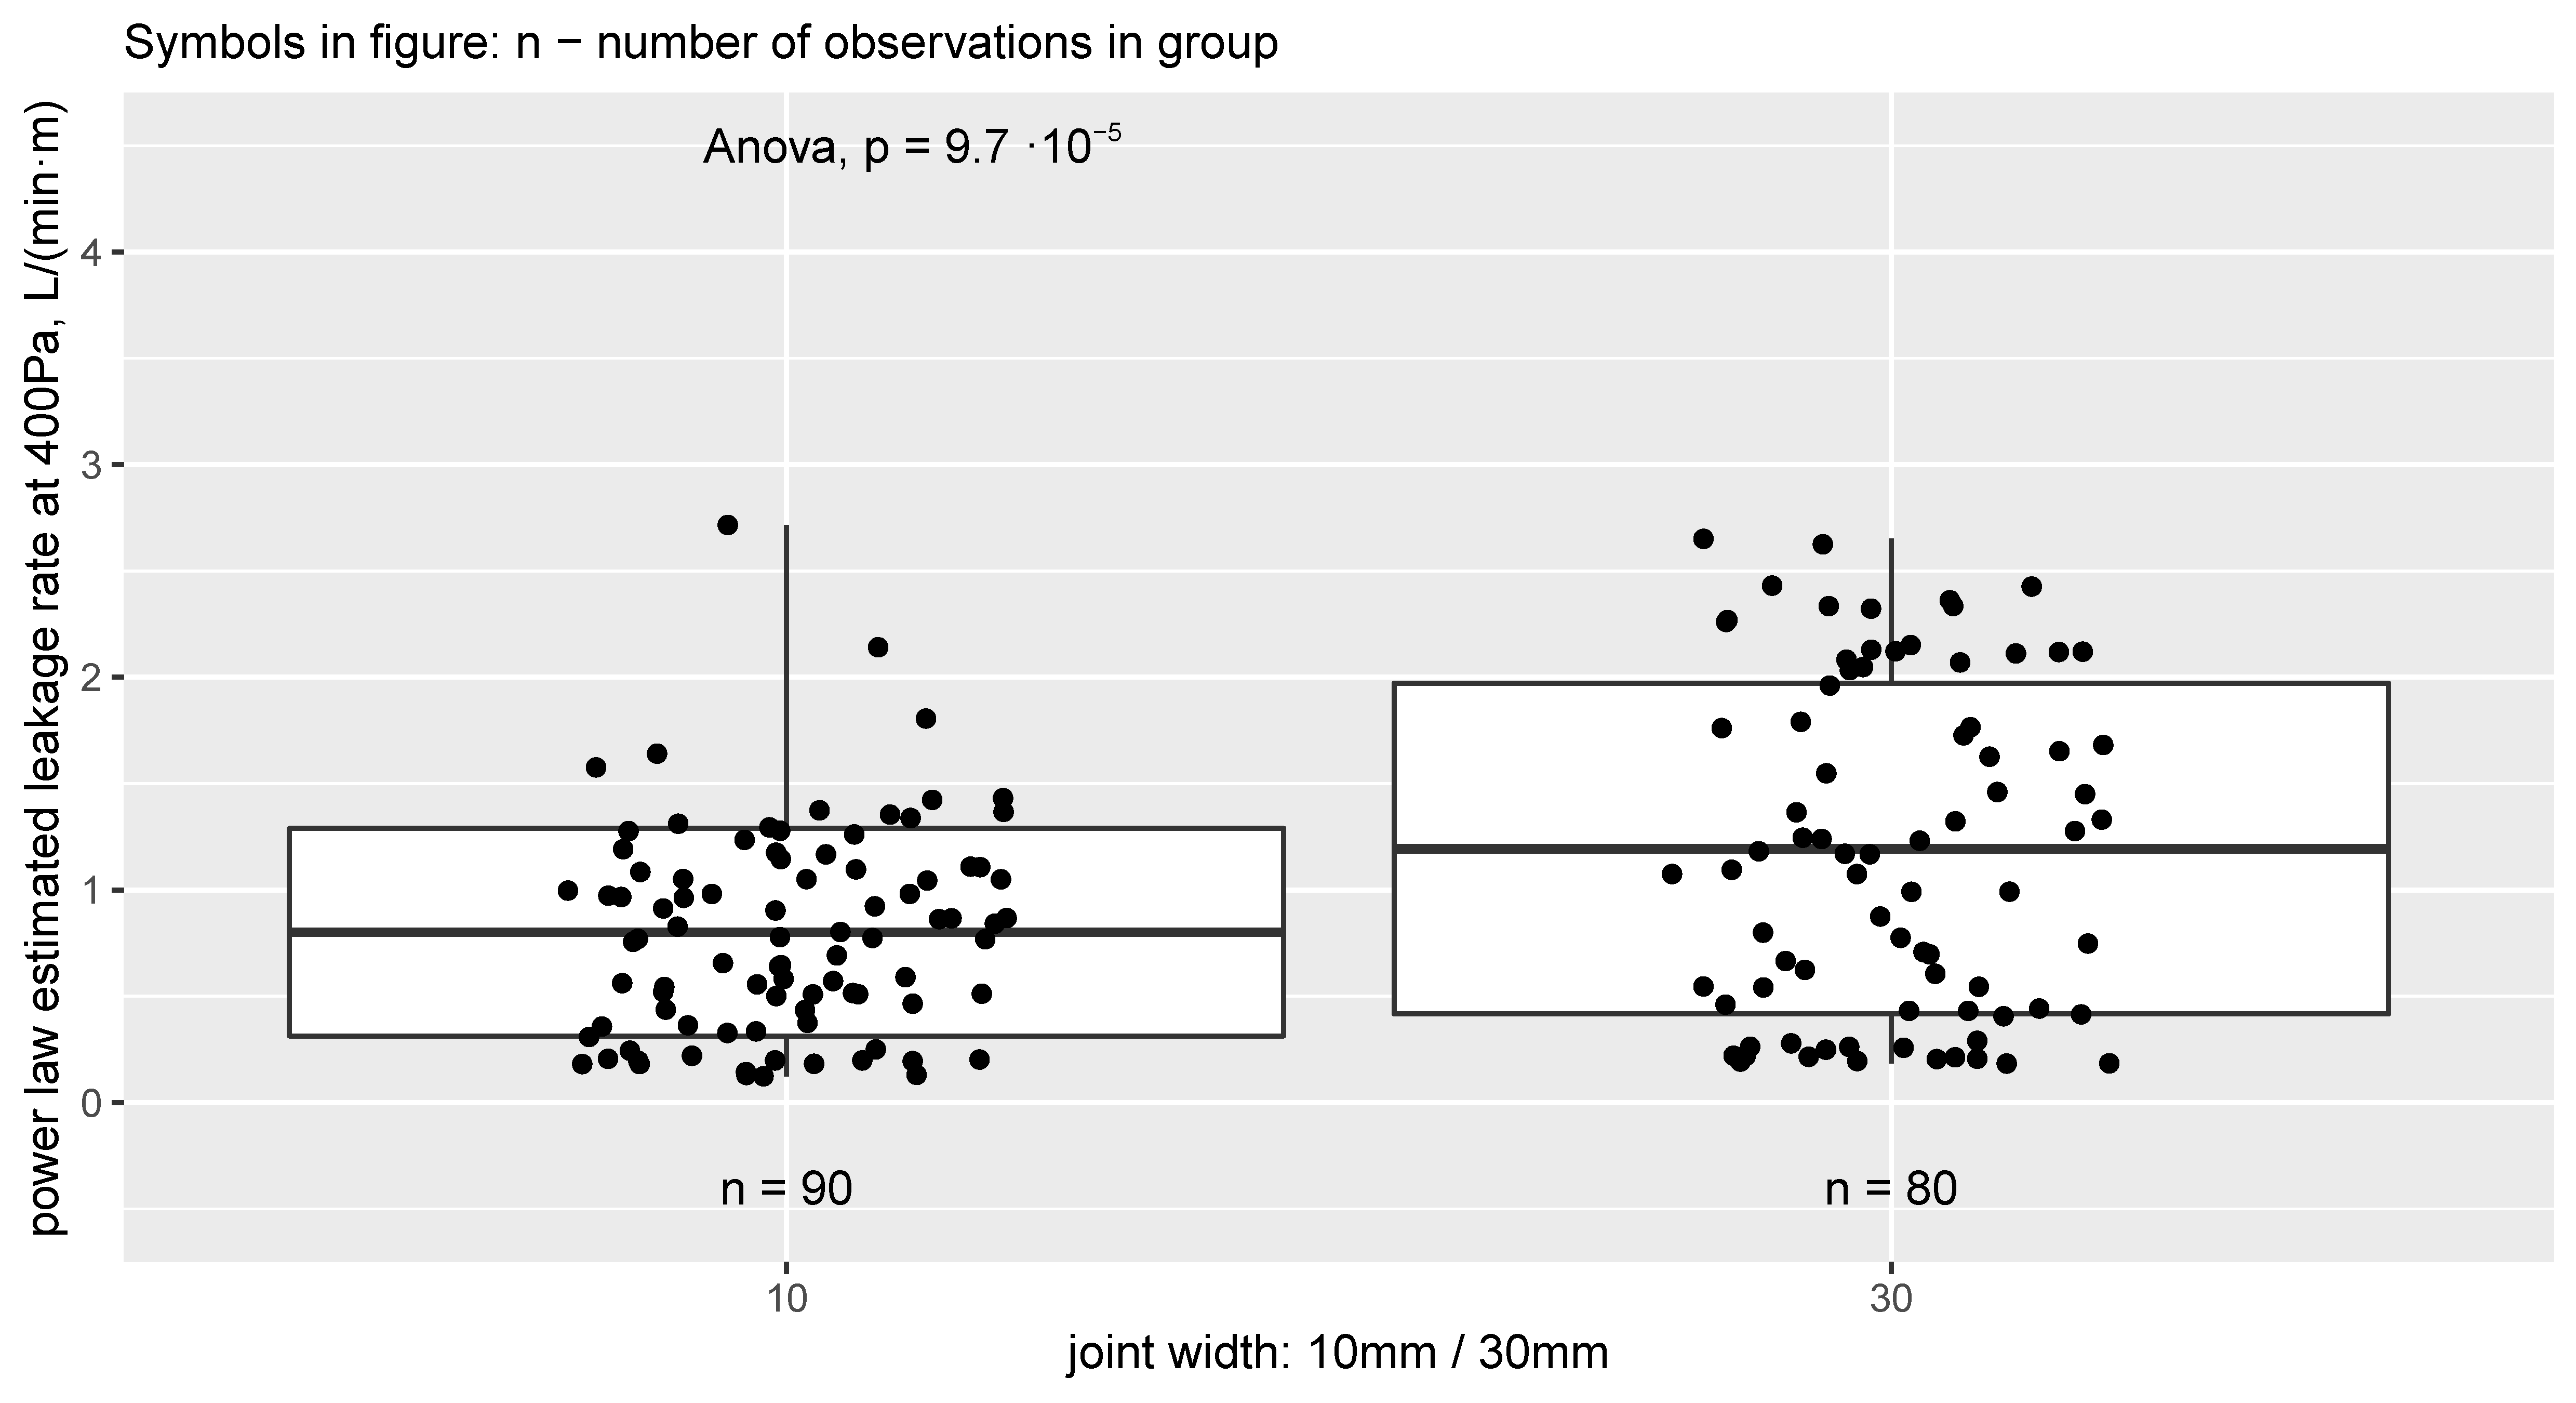
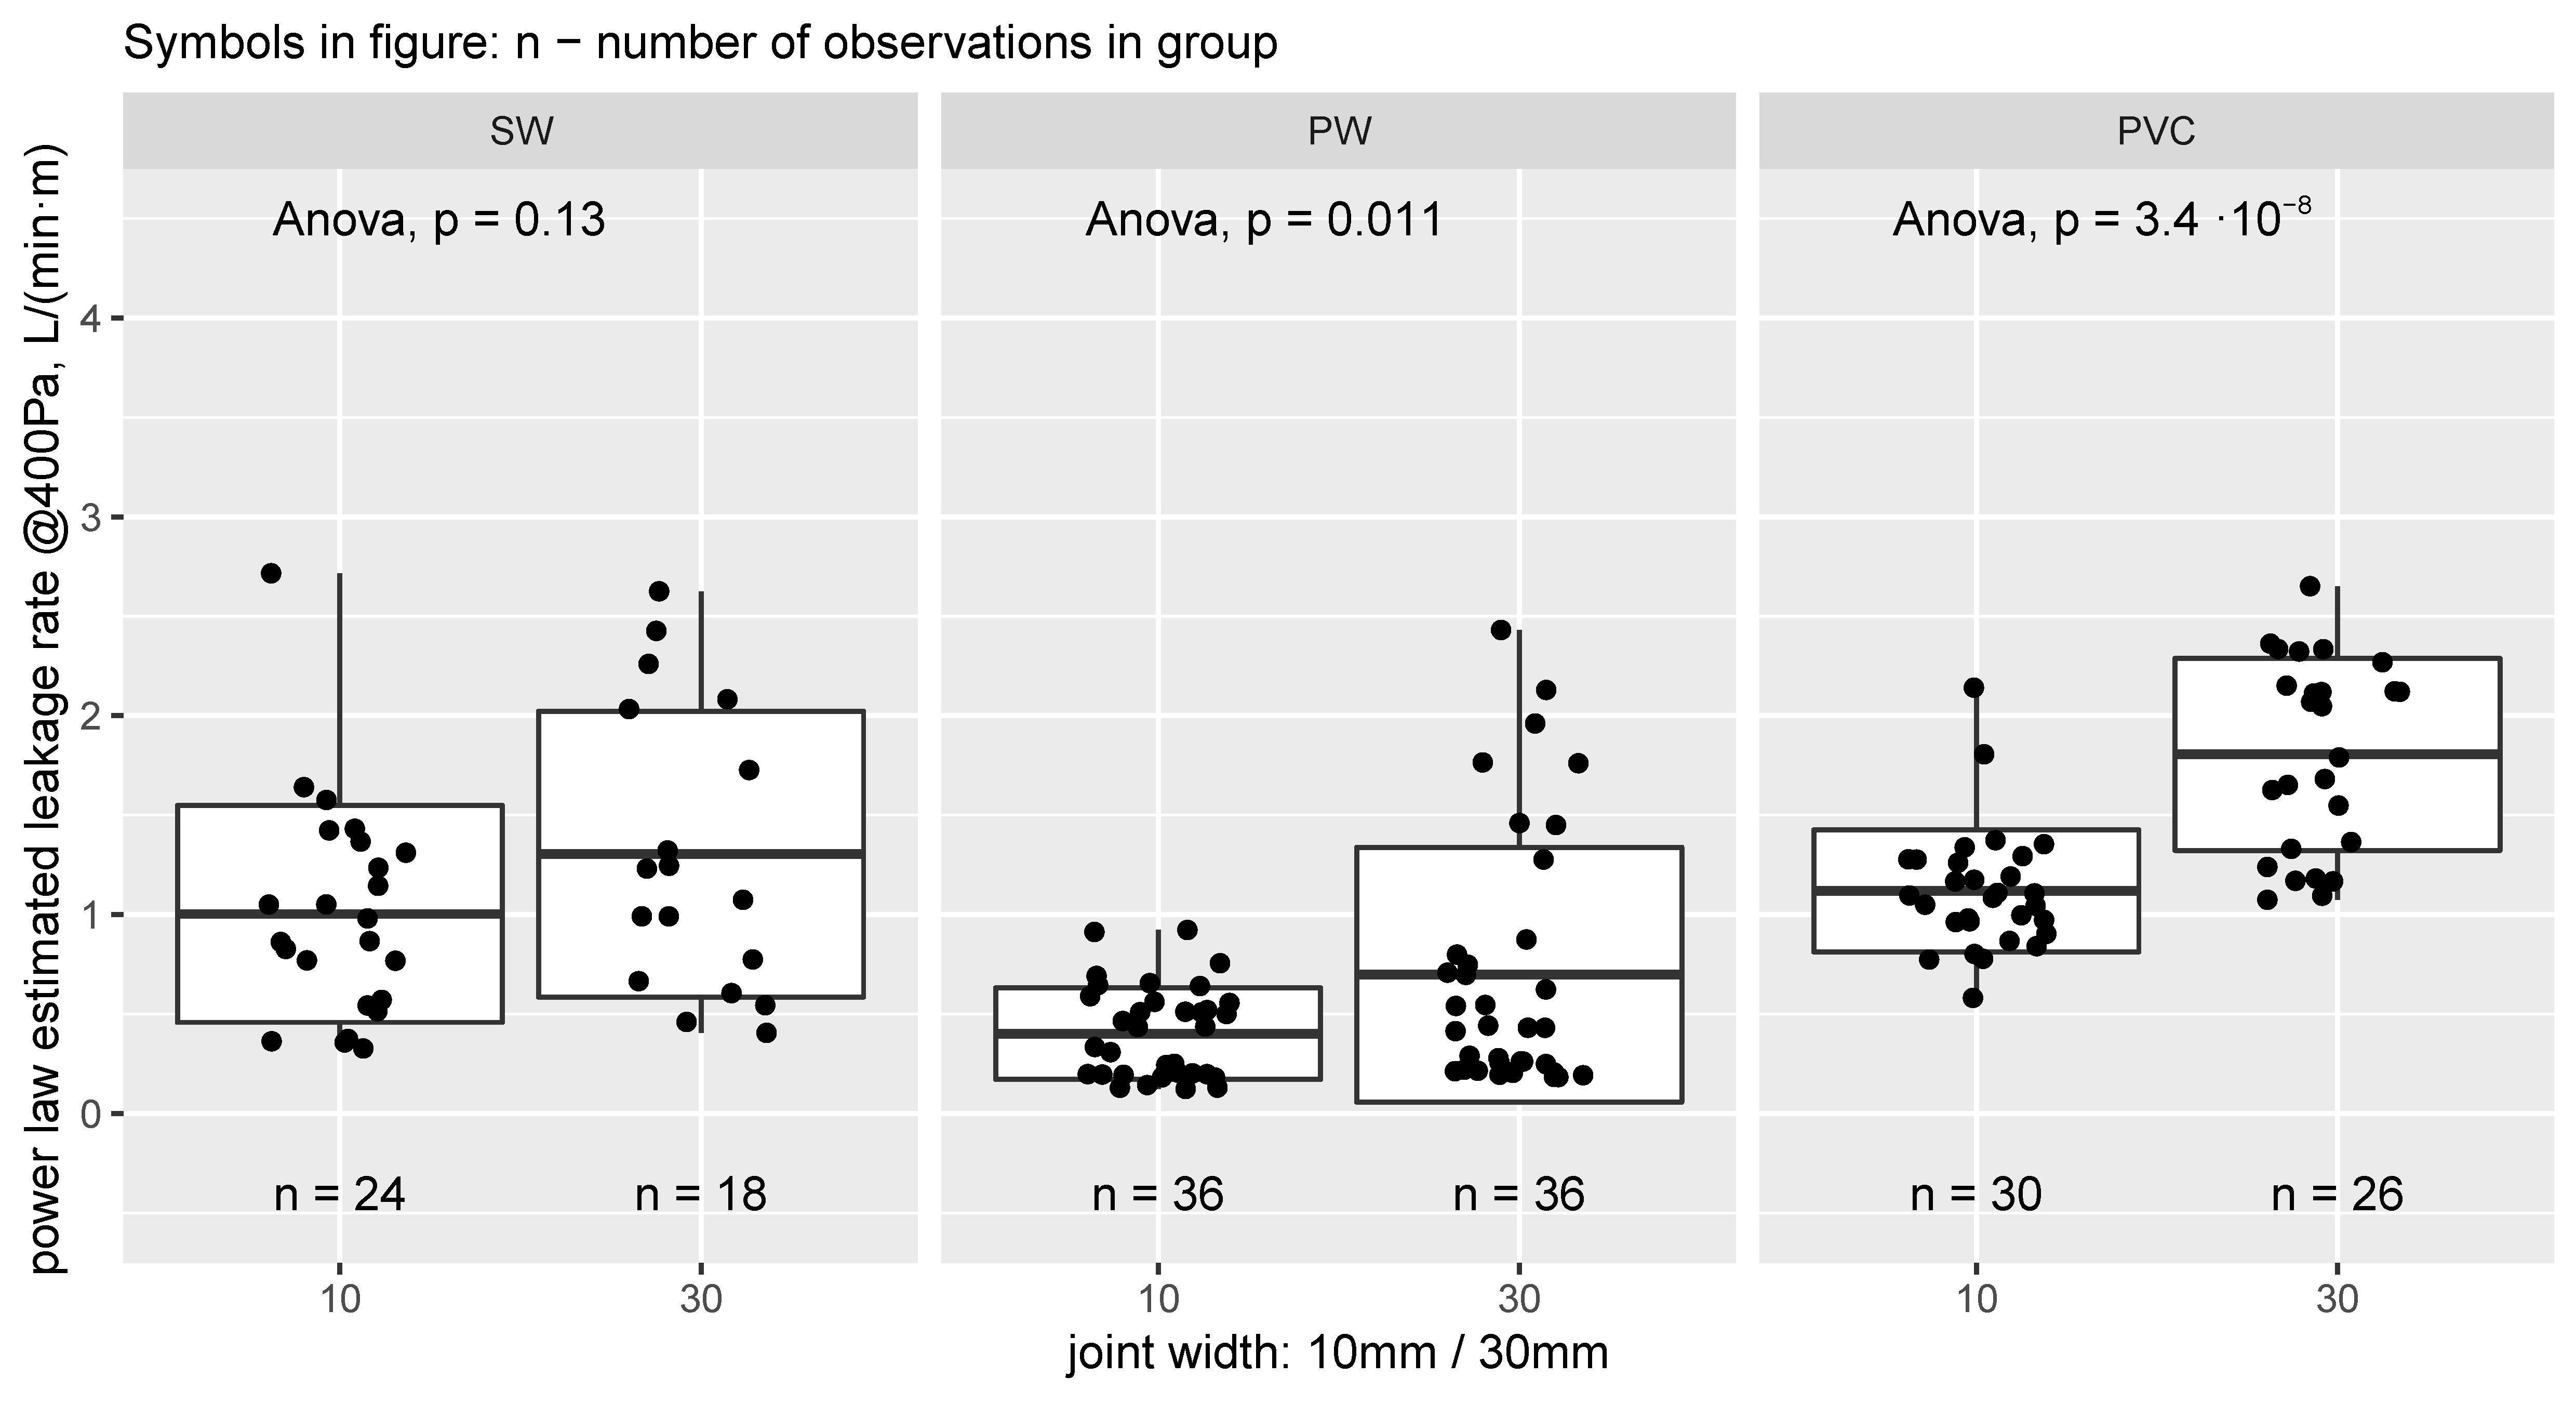
The mean air leakage rate and its variation increased with the increase in joint width (Figure 10). The mean air leakage through a 10 mm joint with all surfaces filled with all foams (V400 = 0.801 L/(min·m)) was significantly lower (p < 0.0001) than mean air leakage through a 30 mm joint (V400 = 1.194 L/(min·m)). The same phenomena were observed in the case of different lath surface treatments, although for sawn wooden surfaces, the difference was not statistically significant (Figure 11).
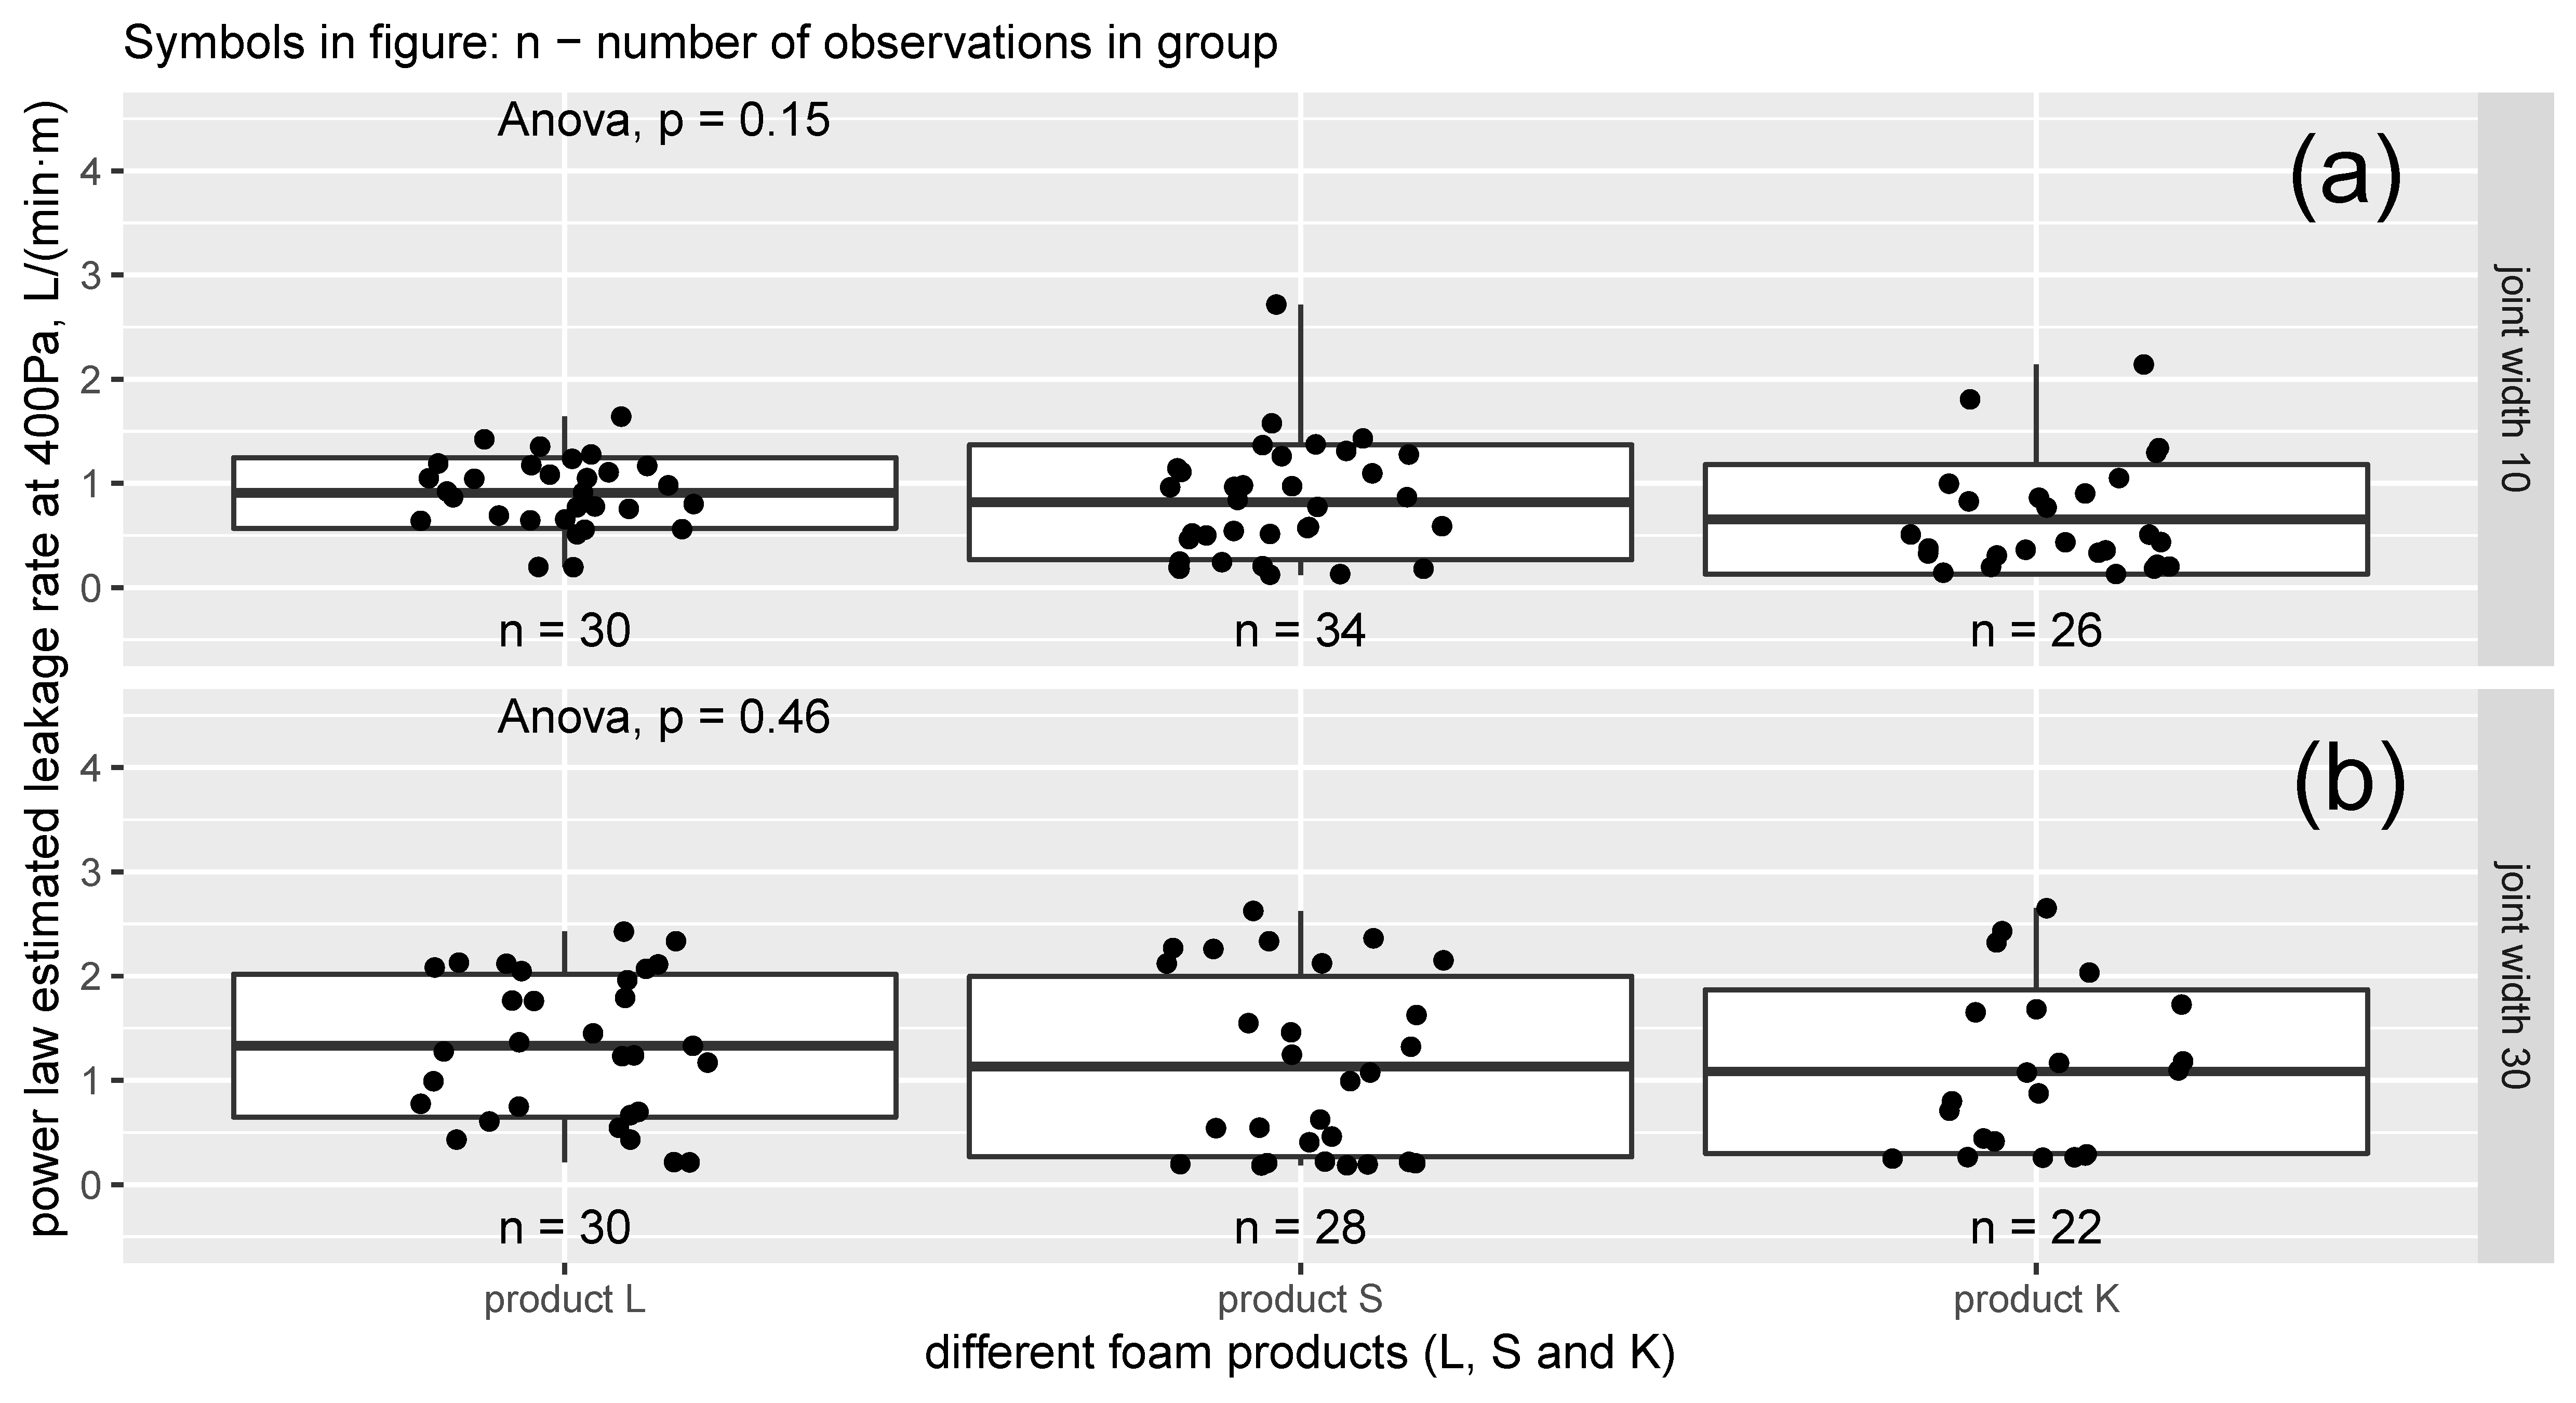
Although different analysed foam products performed slightly differently in the case of wider joints, an overall difference between these products was not statistically significant (Figure 12), mainly due to a large variation in the measured performance of the test specimens.
4. Discussion
Although the airtightness properties of foam joints have been previously tested and these foams have been proved to be almost airtight [13] and perform satisfactorily at the window–wall interface in cavity brick walls [14], the current study showed that the airtightness of actual joints could vary a lot and depends strongly on many parameters. A previous study in Belgium [14] assessed the airtightness joints filled with PU foam, among other insulating and sealing materials (tapes, mineral wool). Several joints with PU foam filling half of the cavity, full cavity and full cavity with plaster coating were measured for airtightness. Air leakage rates in the range of 1.06 to 1.77 m3/(h·m) were measured at 50 Pa pressure difference for the test specimens treated with pure PU foam, which corresponds to 17.6 to 29.5 L/(min·m). Additional coating with plaster or additional sealing with caulking lowered the air leakages below 0.10 m3/(h·m), which corresponds to 1.67 L/(min·m). In this study, the air leakages at 50 Pa pressure difference remained in the range of 0.156 to 0.565 L/(min·m) depending on the surface treatment and joint width. Other studies of window-to-wall interfaces sealed with PU foam have also shown somewhat higher air leakages in the range of 0.0 to 0.155 (mean 0.03) m3/(h·m) [15] and 0.10 m3/(h·m) [16].
Expanding montage foams need additional moisture from air and through adjacent surfaces to fully expand and fill the grooves and concavities. It was expected that the smooth planed surface of timber joints would provide good conditions for foam bonding, and the measured results confirmed this. The air leakages in the case of planed timber surfaces were significantly lower, averaging V400 = 0.549 L/(min·m) at 400 Pa pressure difference. During repetitive testing with three identical test specimens for each configuration, no airtightness failures were observed. The joints with sawn timber laths performed worse by more than a factor of two, averaging V400 = 1.132 L/(min·m) at 400 Pa pressure difference, and the fail rate under repetitive testing was huge, totalling 33% and 50% for 10 mm and 30 mm joint widths, respectively. This shows that the studied foams were often unable to bond with the uneven surface and, although some test specimens had air leakages comparable to those of planed timber surfaces, the foam–timber interface is systematically not airtight.
The failure rate of plastic-coated laths was significantly lower compared to that of sawn timber but, nonetheless, showed some bonding problems in the case of the wider joint, which had a failure rate of more than 28%. The surface of PVC-coated laths is smooth, but the inhibited transport of moisture through the plastic surface and the water droplets caused by surface moistening can, in some cases, create pathways for air leakages. Although this does not always cause major air leakages, it contributes to even higher average air leakage rates compared to sawn timber (V400 = 1.438 L/(min·m) at 400 Pa pressure difference).
The leakage rate through the window–wall interface can be compared to the leakage rate of the window itself to assess the additional effect of leakages on the overall airtightness. A large number of window products were tested in Belgium to assess the distribution and average airtightness of different window types [17]. Although the variation within the test specimens was high, the median airtightness of single and double windows (independently of the material) was 0.82 m3/(h·m2) and 1.36 m3/(h·m2), respectively, for 50 Pa pressure difference. For a hypothetical window with a size of 1.0 m × 1.0 m (joint length of 4.0 m), this corresponds to air leakage of 0.82 and 1.36 m3/(h·m2), respectively, for single and double windows at 50 Pa pressure difference. The average air leakage rate of joints in the range of 0.156 to 0.565 L/(min·m) according to this study would add 0.04 m3/(h·m2) to 0.14 m3/(h·m2), corresponding to a 5% to 17% increase in the case of a single window, and a 5% to 10% increase in the case of a double window. For larger windows with a favourable aspect ratio, the additional effect of window–wall interface will be lower.
Similarly, the potential effect of the measured joint air leakage can be calculated for an entire building envelope. For this, a cumulative joint length for all connections between the building envelope elements was calculated for a prefabricated two-storey wooden reference building with very good airtightness and optimised window connections [18]. The airtightness was achieved with the systematic use of special tapes and on-site quality assurance measures. The building was included in a larger study about airtightness of Estonian wooden buildings [1] and had an average measured air leakage rate q50 = 0.24 m3/(h·m2) at 50 Pa pressure difference corresponding to the measured air flow rate V50 = 91 m3/h. With cumulative joint length of 206 m and external envelope area of 373.5 m2, the average air leakage rate of the joints in the range of 0.156 to 0.565 L/(min·m) at 50 Pa pressure difference according to this study would contribute to additional 1.93 m3/h to 6.98 m3/h, respectively, corresponding to less than 0.02 m3/(h·m2) increase in air leakage of the entire building envelope. A previous study has shown that the actual average air leakage rate of the building envelope in newer wooden buildings is around 1.1 m3/(h·m2), with very high variation (standard deviation 1.6 m3/(h·m2)) [1]. This strongly suggests that the actual air leakage of the building envelope is mainly dependent on the ‘failure rate’ of the sealing measures rather than on the leakage properties of the sealing measure and its influencing factors. Previous studies have found that workmanship quality plays a critical role in achieving airtightness. Kalamees et al. [19] showed that a comparison between air leakage readings measured in field conditions and those calculated based on laboratory measurements showed significant differences.
The joint width and, accordingly, the volume of the joint are important factors when considering the use of expanding polyurethane foam to achieve airtightness of these connections. Although more foam is used for wider joints, the pressure during foam expansion is expected to be higher in the case of a smaller volume. This can be systematically seen from our measurements, where the 10 mm-wide joints performed significantly better for all surface types. The variation of the measured air leakages along with the failure rate during repetitive testing was always higher with a 30 mm joint width compared to a 10 mm joint. The effect of long-term expansion and periodic movement of the building elements has to be further studied, as a larger joint width with the same elasticity can withstand larger movements. It is shown that PU foams are prone to fast chemical degradation [20], which changes the mechanical properties of the foam. In this study, the measurements were carried out within a few months after the foam was applied, and the effect of ageing and chemical degradation was not considered.
Different foam products were compared in this study, and although our detailed analysis within subgroups of different lath surfaces and joint widths indicated some differences between specific foam products in some cases, statistically significant differences were not found. It has to be noted that top-of-the-line high-quality polyurethane foams from each producer applied by skilled workers in a laboratory setup were measured in this study. The skill level of the workers and real-life application conditions can significantly influence the performance of different foams and cause higher air leakages compared to those measured in the laboratory, although this has to be further studied.
5. Conclusions
Based on the measurement results, the surface properties have the most significant effect on the air leakage of joints filled with polyurethane montage foam. In everyday construction practice, it should be considered that the airtightness of foam-filled joints with a sawn timber surface finish can be very variable, with a failure rate up to 50%. On the other hand, the airtightness of foam-filled joints with a planed wood surface is better, characterized by much lower average air leakage rates and a 0% failure rate. Increasing the joint width increases the air leakage and its variation within all analysed factors. Contrary to the assumption, significant differences between different premium-class foam products could not be shown. A comparison of the estimated and previously measured overall airtightness of an entire building envelope showed a dependency on ‘failure rate’ rather than on average measured leakage rate. It should be taken into consideration that the results obtained in laboratory conditions may be better than the ones obtained on site; also, the effect of aging has to be further studied.
Author Contributions
The conceptualization of this study, project administration and funding acquisition for the tasks carried out was performed by T.K., the compilation of the testing methodology by T.K. and H.G., the preparation of the test specimens, practical laboratory measurements and data acquisition by H.G. The data curation, statistical analysis and original draft preparation by J.H., review and editing by J.H. and T.K.
Funding
This research was supported by the Estonian Research Council with Personal research funding PRG483 “Moisture safety of interior insulation, constructional moisture and thermally efficient building envelope”, Estonian Centre of Excellence in Zero Energy and Resource Efficient Smart Buildings and Districts, ZEBE, grant TK146 funded by the European Regional Development Fund and H2020 project No 754177: “NERO-Cost reduction of new Nearly Zero-Energy Wooden buildings in the Northern Climatic Conditions”.
Conflicts of Interest
The authors declare no conflict of interest.
References
- Hallik, J.; Kalamees, T. Development of airtightness of Estonian wooden buildings. J. Sustain. Archit. Civ. Eng. 2019, 24, 36–43. [Google Scholar] [CrossRef]
- Górzeński, R.; Szymański, M.; Górka, A.; Mróz, T. Airtightness of buildings in Poland. Int. J. Vent. 2014, 12, 391–400. [Google Scholar] [CrossRef]
- Relander, T.O.; Holøs, S.; Thue, J.V. Airtightness estimation—A state of the art review and an en route upper limit evaluation principle to increase the chances that wood-frame houses with a vapour- and wind-barrier comply with the airtightness requirements. Energy Build. 2012, 54, 444–452. [Google Scholar] [CrossRef]
- Vinha, J.; Manelius, E.; Korpi, M.; Salminen, K.; Kurnitski, J.; Kiviste, M.; Laukkarinen, A. Airtightness of residential buildings in Finland. Build. Environ. 2015, 93, 128–140. [Google Scholar] [CrossRef] [Green Version]
- Cuce, E. Role of airtightness in energy loss from windows: Experimental results from In-Situ tests. Energy Build. 2017, 139, 449–455. [Google Scholar] [CrossRef]
- CEN. EN 12114. Thermal Performance of Buildings—Air Permeability of Building Components and Building Elements—Laboratory Test Method; CEN: Brussels, Belgium, 2000. [Google Scholar]
- Kalamees, T.; Kurnitski, J.; Jokisalo, J.; Eskola, L.; Jokiranta, K.; Vinha, J. Measured and simulated air pressure conditions in Finnish residential buildings. Build. Serv. Eng. Res. Technol. 2010, 31, 177–190. [Google Scholar] [CrossRef]
- CEN. ISO 9972:2015 Thermal Performance of Buildings—Determination of Air Permeability of Buildings—Fan Pressurization Method; CEN: Geneva, Switzerland, 2015. [Google Scholar]
- CEN. EN 12207 Windows and Doors—Air Permeability—Classification; CEN: Brussels, Belgium, 2016. [Google Scholar]
- Beuth-Verlag. DIN 4108-2:2013-02 Wärmeschutz und Energie-Einsparung in Gebäuden—Teil 2: Mindestanforderungen an den Wärmeschutz; Beuth-Verlag: Berlin, Germany, 2013. [Google Scholar]
- R Core Team. R: A Language and Environment for Statistical Computing. Available online: https://www.r-project.org/ (accessed on 11 July 2019).
- Kassambara, A. Ggpubr: “Ggplot2” Based Publication Ready Plots. Available online: https://cran.r-project.org/package=ggpubr (accessed on 11 July 2019).
- Ift Rosenheim. Air Permeability of Montage Foam. Test Report 10533428; Ift Rosenheim: Rosenheim, Germany, 2007. [Google Scholar]
- Van Den Bossche, N.; Huyghe, W.; Moens, J.; Janssens, A.; Depaepe, M. Airtightness of the window-wall interface in cavity brick walls. Energy Build. 2012, 45, 32–42. [Google Scholar] [CrossRef]
- Proskiw, G. Air Leakage Characteristics of Various Rough-Opening Sealing Methods for Windows and Doors; ASTM International: West Conshohocken, PA, USA, 1995. [Google Scholar]
- Höglund, I.; Bengt, J. Joint Sealing between Window (Door) Frames and Walls—Development of New Types of Synthetic Rubber Stuffing Strips; Swedish Council for Building Research: Stockholm, Sweden, 1984. [Google Scholar]
- Van Den Bossche, N.; Janssens, A. Airtightness and watertightness of window frames: Comparison of performance and requirements. Build. Environ. 2016, 110, 129–139. [Google Scholar] [CrossRef]
- Kalbe, K.; Kalamees, T. Influence of Window Details on the Energy Performance of an nZEB. J. Sustain. Archit. Civ. Eng. 2019, 1, 61–70. [Google Scholar] [CrossRef]
- Kalamees, T.; Alev, Ü.; Pärnalaas, M. Air leakage levels in timber frame building envelope joints. Build. Environ. 2017, 116, 121–129. [Google Scholar] [CrossRef]
- Pellizzi, E.; Lattuati-Derieux, A.; Lavédrine, B.; Cheradame, H. Degradation of polyurethane ester foam artifacts: Chemical properties, mechanical properties and comparison between accelerated and natural degradation. Polym. Degrad. Stab. 2014, 107, 255–261. [Google Scholar] [CrossRef]
Figure 1.
Some joints of the building envelope where polyurethane filling may be used.

Figure 2.
Filling the joints in a wooden frame (a) and example of a cross section (from above) of a frame with filled joints (b).
Figure 2.
Filling the joints in a wooden frame (a) and example of a cross section (from above) of a frame with filled joints (b).

Figure 3.
Schematic of the equipment for the air leakage tests (dimensions in mm).

Figure 4.
Equipment for the air leakage tests.

Figure 5.
Air pressure difference over the studied joint (a) and its influence on the air flow rate (b).
Figure 5.
Air pressure difference over the studied joint (a) and its influence on the air flow rate (b).

Figure 6.
Cumulative distribution of leakage rates for different joint surface types at 100 Pa pressure difference and the limiting value for the failing specimens.
Figure 6.
Cumulative distribution of leakage rates for different joint surface types at 100 Pa pressure difference and the limiting value for the failing specimens.

Figure 7.
Number of test specimens with failed airtightness depending on lath surface treatment grouped by joint width (10 mm or 30 mm).
Figure 7.
Number of test specimens with failed airtightness depending on lath surface treatment grouped by joint width (10 mm or 30 mm).

Figure 8.
Mean air leakage rate (bold line) and standard deviation (white box) at 400 Pa depending on lath surface treatment (both joint widths are included).
Figure 8.
Mean air leakage rate (bold line) and standard deviation (white box) at 400 Pa depending on lath surface treatment (both joint widths are included).

Figure 9.
Mean air leakage rate (bold line) and standard deviation (white box) at 400 Pa depending on lath surface treatment grouped by joint width (10 mm or 30 mm) and foam product (K, L and S).
Figure 9.
Mean air leakage rate (bold line) and standard deviation (white box) at 400 Pa depending on lath surface treatment grouped by joint width (10 mm or 30 mm) and foam product (K, L and S).

Figure 10.
Mean air leakage rate (bold line) and standard deviation (white box) at 400 Pa depending on the joint width (10 mm (left) or 30 mm (right)).
Figure 10.
Mean air leakage rate (bold line) and standard deviation (white box) at 400 Pa depending on the joint width (10 mm (left) or 30 mm (right)).

Figure 11.
Mean air leakage rate (bold line) and standard deviation (white box) at 400 Pa depending on the joint width (10 mm or 30 mm), grouped by lath surface treatment.
Figure 11.
Mean air leakage rate (bold line) and standard deviation (white box) at 400 Pa depending on the joint width (10 mm or 30 mm), grouped by lath surface treatment.

Figure 12.
Mean air leakage rate (bold line) and standard deviation (white box) at 400 Pa depending on foam product, grouped by joint width (10 mm (a) or 30 mm (b)).
Figure 12.
Mean air leakage rate (bold line) and standard deviation (white box) at 400 Pa depending on foam product, grouped by joint width (10 mm (a) or 30 mm (b)).


Table 1.
Power curve-estimated air leakage rates and standard deviation at 400 Pa and 50 Pa pressure differences. PW: planed wood, PVC: plastic surface, SW: sawn wood.
Table 1.
Power curve-estimated air leakage rates and standard deviation at 400 Pa and 50 Pa pressure differences. PW: planed wood, PVC: plastic surface, SW: sawn wood.
| Joint Type | V400, L/(min·m) | V50, L/(min·m) | ||||
|---|---|---|---|---|---|---|
| Mean | σV400 | Mean | σV50 | |||
| PW | 10 | K | 0.301 | 0.141 | 0.203 | 0.109 |
| L | 0.604 | 0.229 | 0.203 | 0.076 | ||
| S | 0.299 | 0.169 | 0.156 | 0.054 | ||
| 30 | K | 0.606 | 0.618 | 0.214 | 0.092 | |
| L | 1.090 | 0.713 | 0.404 | 0.191 | ||
| S | 0.398 | 0.374 | 0.172 | 0.068 | ||
| PVC | 10 | K | 1.413 | 0.477 | 0.293 | 0.118 |
| L | 1.084 | 0.172 | 0.233 | 0.078 | ||
| S | 1.007 | 0.229 | 0.251 | 0.070 | ||
| 30 | K | 1.603 | 0.601 | 0.313 | 0.134 | |
| L | 1.758 | 0.438 | 0.441 | 0.123 | ||
| S | 2.067 | 0.311 | 0.483 | 0.071 | ||
| SW | 10 | K | 0.616 | 0.290 | 0.252 | 0.097 |
| L | 1.164 | 0.334 | 0.381 | 0.129 | ||
| S | 1.216 | 0.657 | 0.329 | 0.147 | ||
| 30 | K | 1.880 | 0.217 | 0.565 | 0.027 | |
| L | 1.165 | 0.714 | 0.392 | 0.207 | ||
| S | 1.298 | 0.787 | 0.402 | 0.195 | ||
© 2019 by the authors. Licensee MDPI, Basel, Switzerland. This article is an open access article distributed under the terms and conditions of the Creative Commons Attribution (CC BY) license (http://creativecommons.org/licenses/by/4.0/).
Share and Cite
MDPI and ACS Style
Hallik, J.; Gustavson, H.; Kalamees, T. Air Leakage of Joints Filled with Polyurethane Foam. Buildings 2019, 9, 172. https://doi.org/10.3390/buildings9070172
AMA Style
Hallik J, Gustavson H, Kalamees T. Air Leakage of Joints Filled with Polyurethane Foam. Buildings. 2019; 9(7):172. https://doi.org/10.3390/buildings9070172
Chicago/Turabian StyleHallik, Jaanus, Heleen Gustavson, and Targo Kalamees. 2019. "Air Leakage of Joints Filled with Polyurethane Foam" Buildings 9, no. 7: 172. https://doi.org/10.3390/buildings9070172
Note that from the first issue of 2016, this journal uses article numbers instead of page numbers. See further details here.