AT2 Receptor Mediated Activation of the Tyrosine Phosphatase PTP1B Blocks Caveolin-1 Enhanced Migration, Invasion and Metastasis of Cancer Cells

 ,
,  , , and
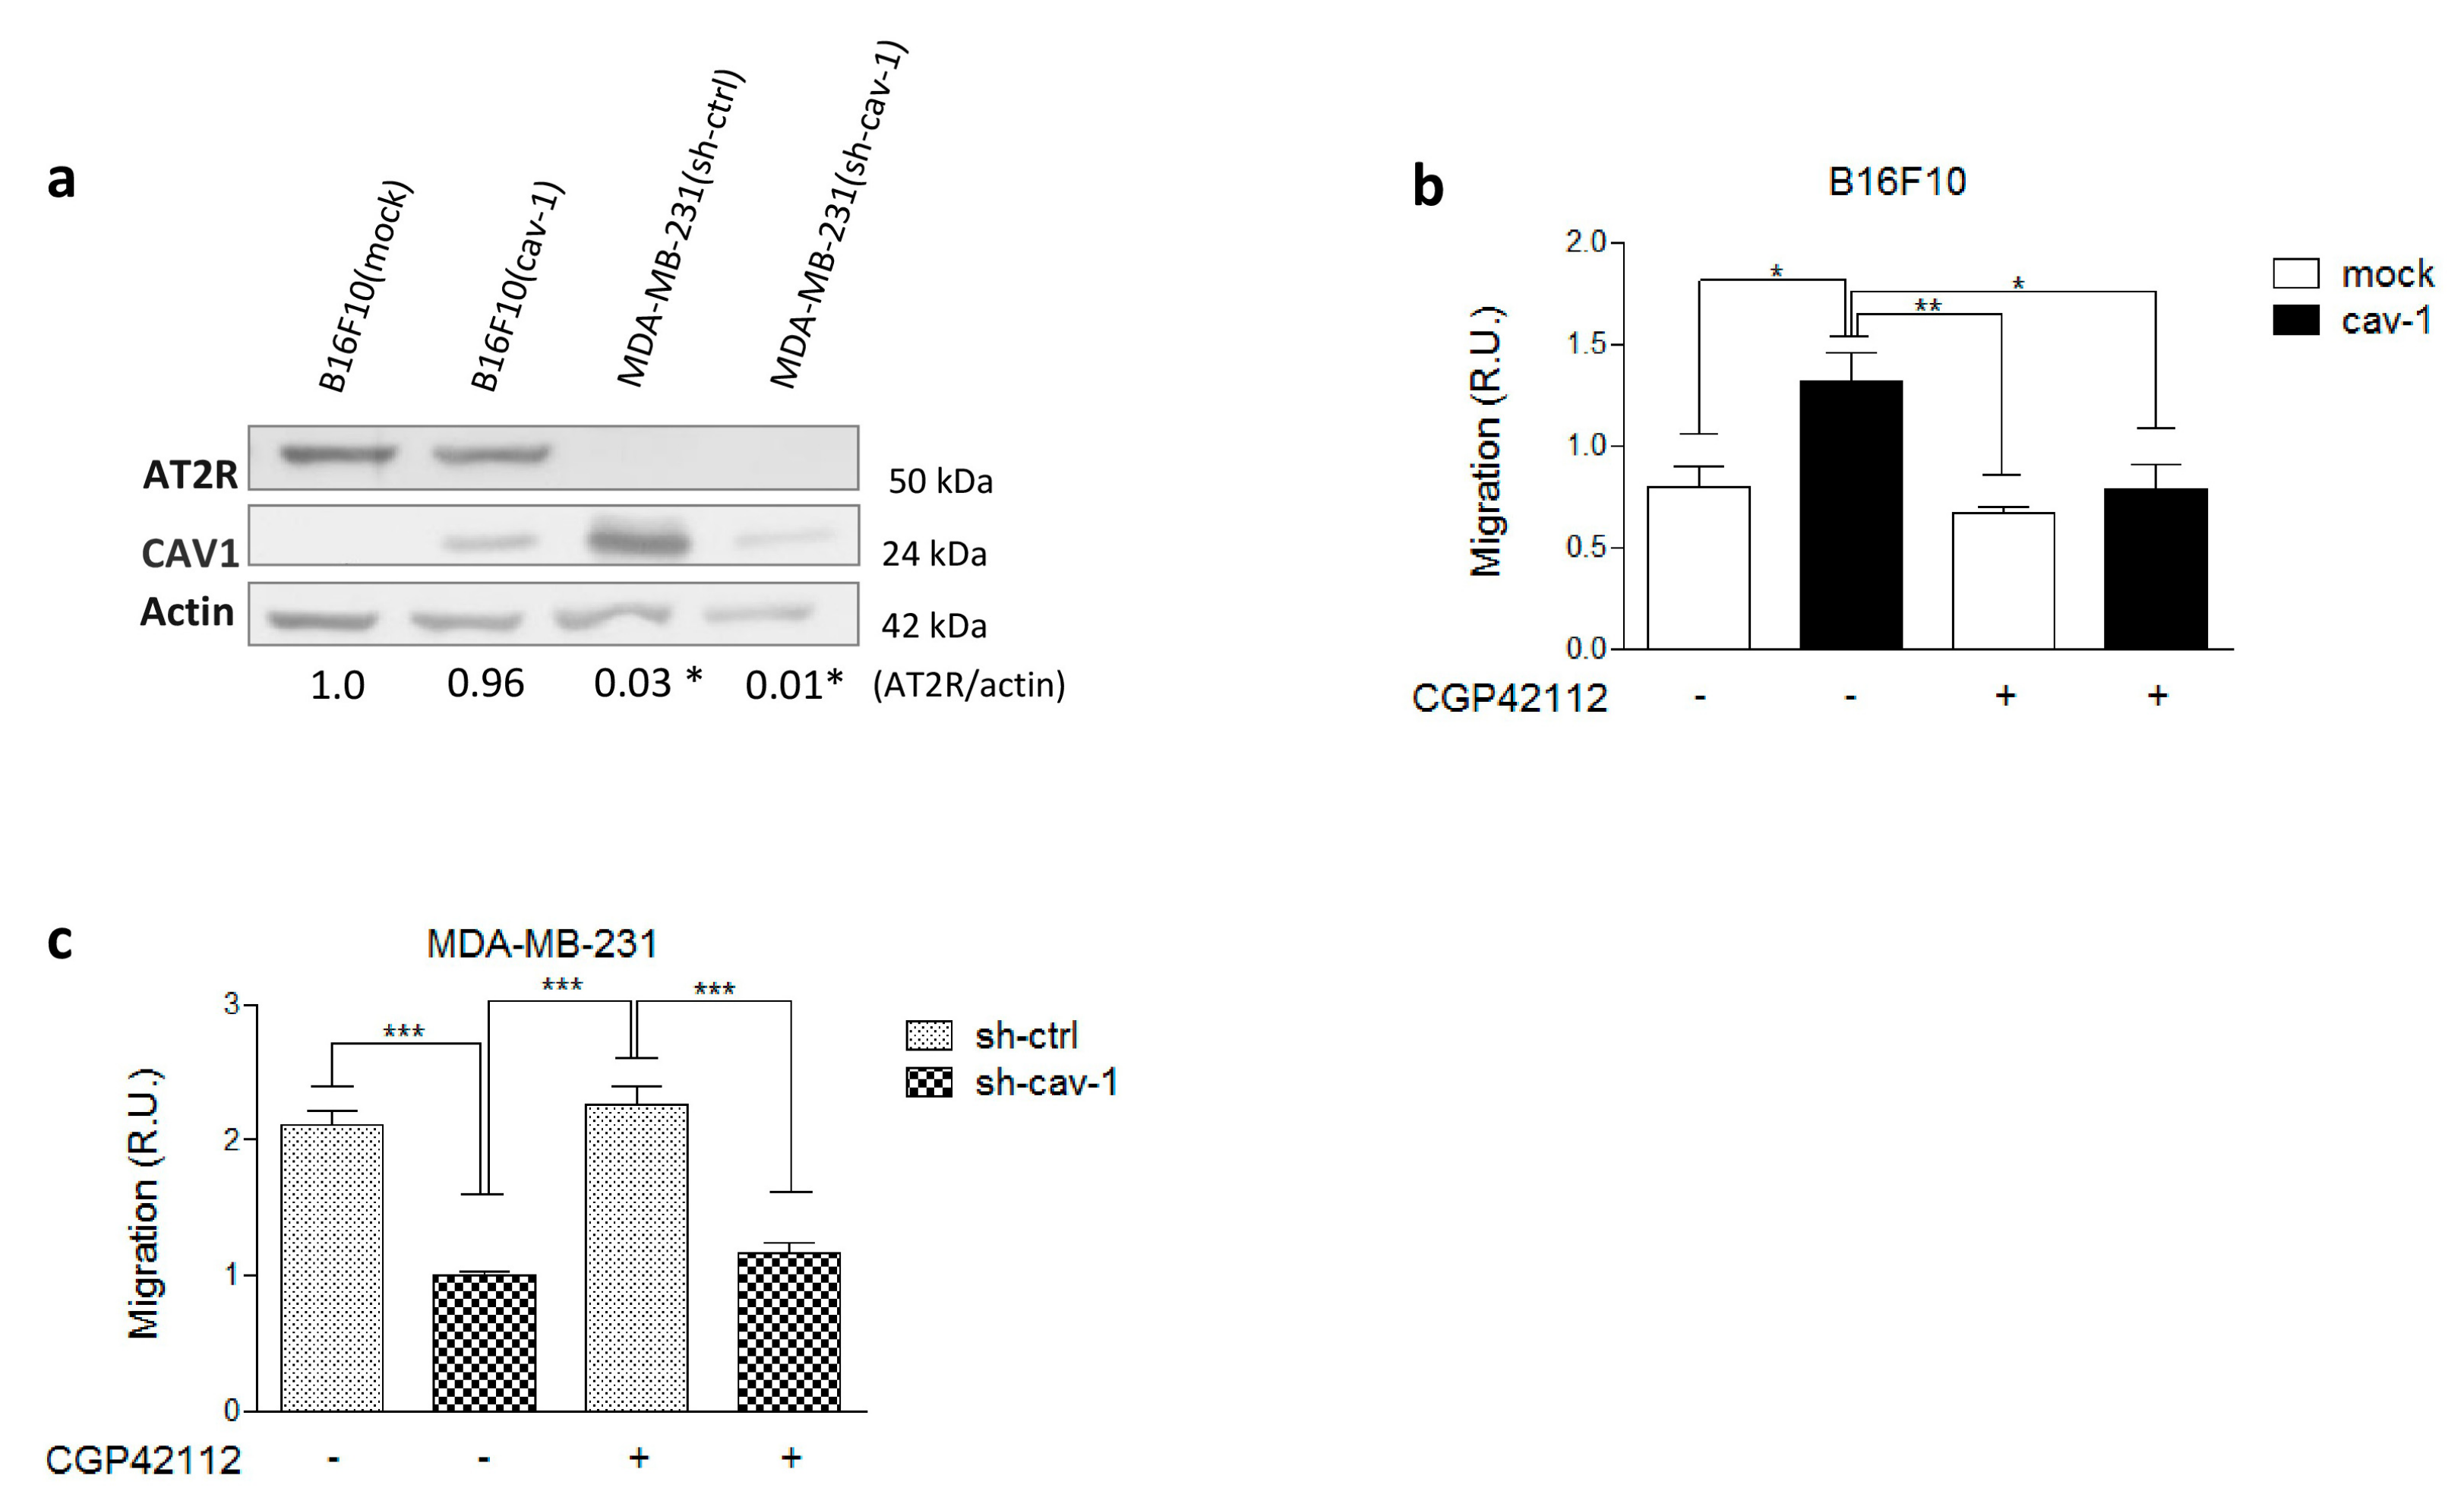
Abstract
:1. Introduction
2. Results
2.1. AT2R Is Differentially Expressed in Melanoma and Breast Cancer Cell Lines, and Its Activation Reduces Migration
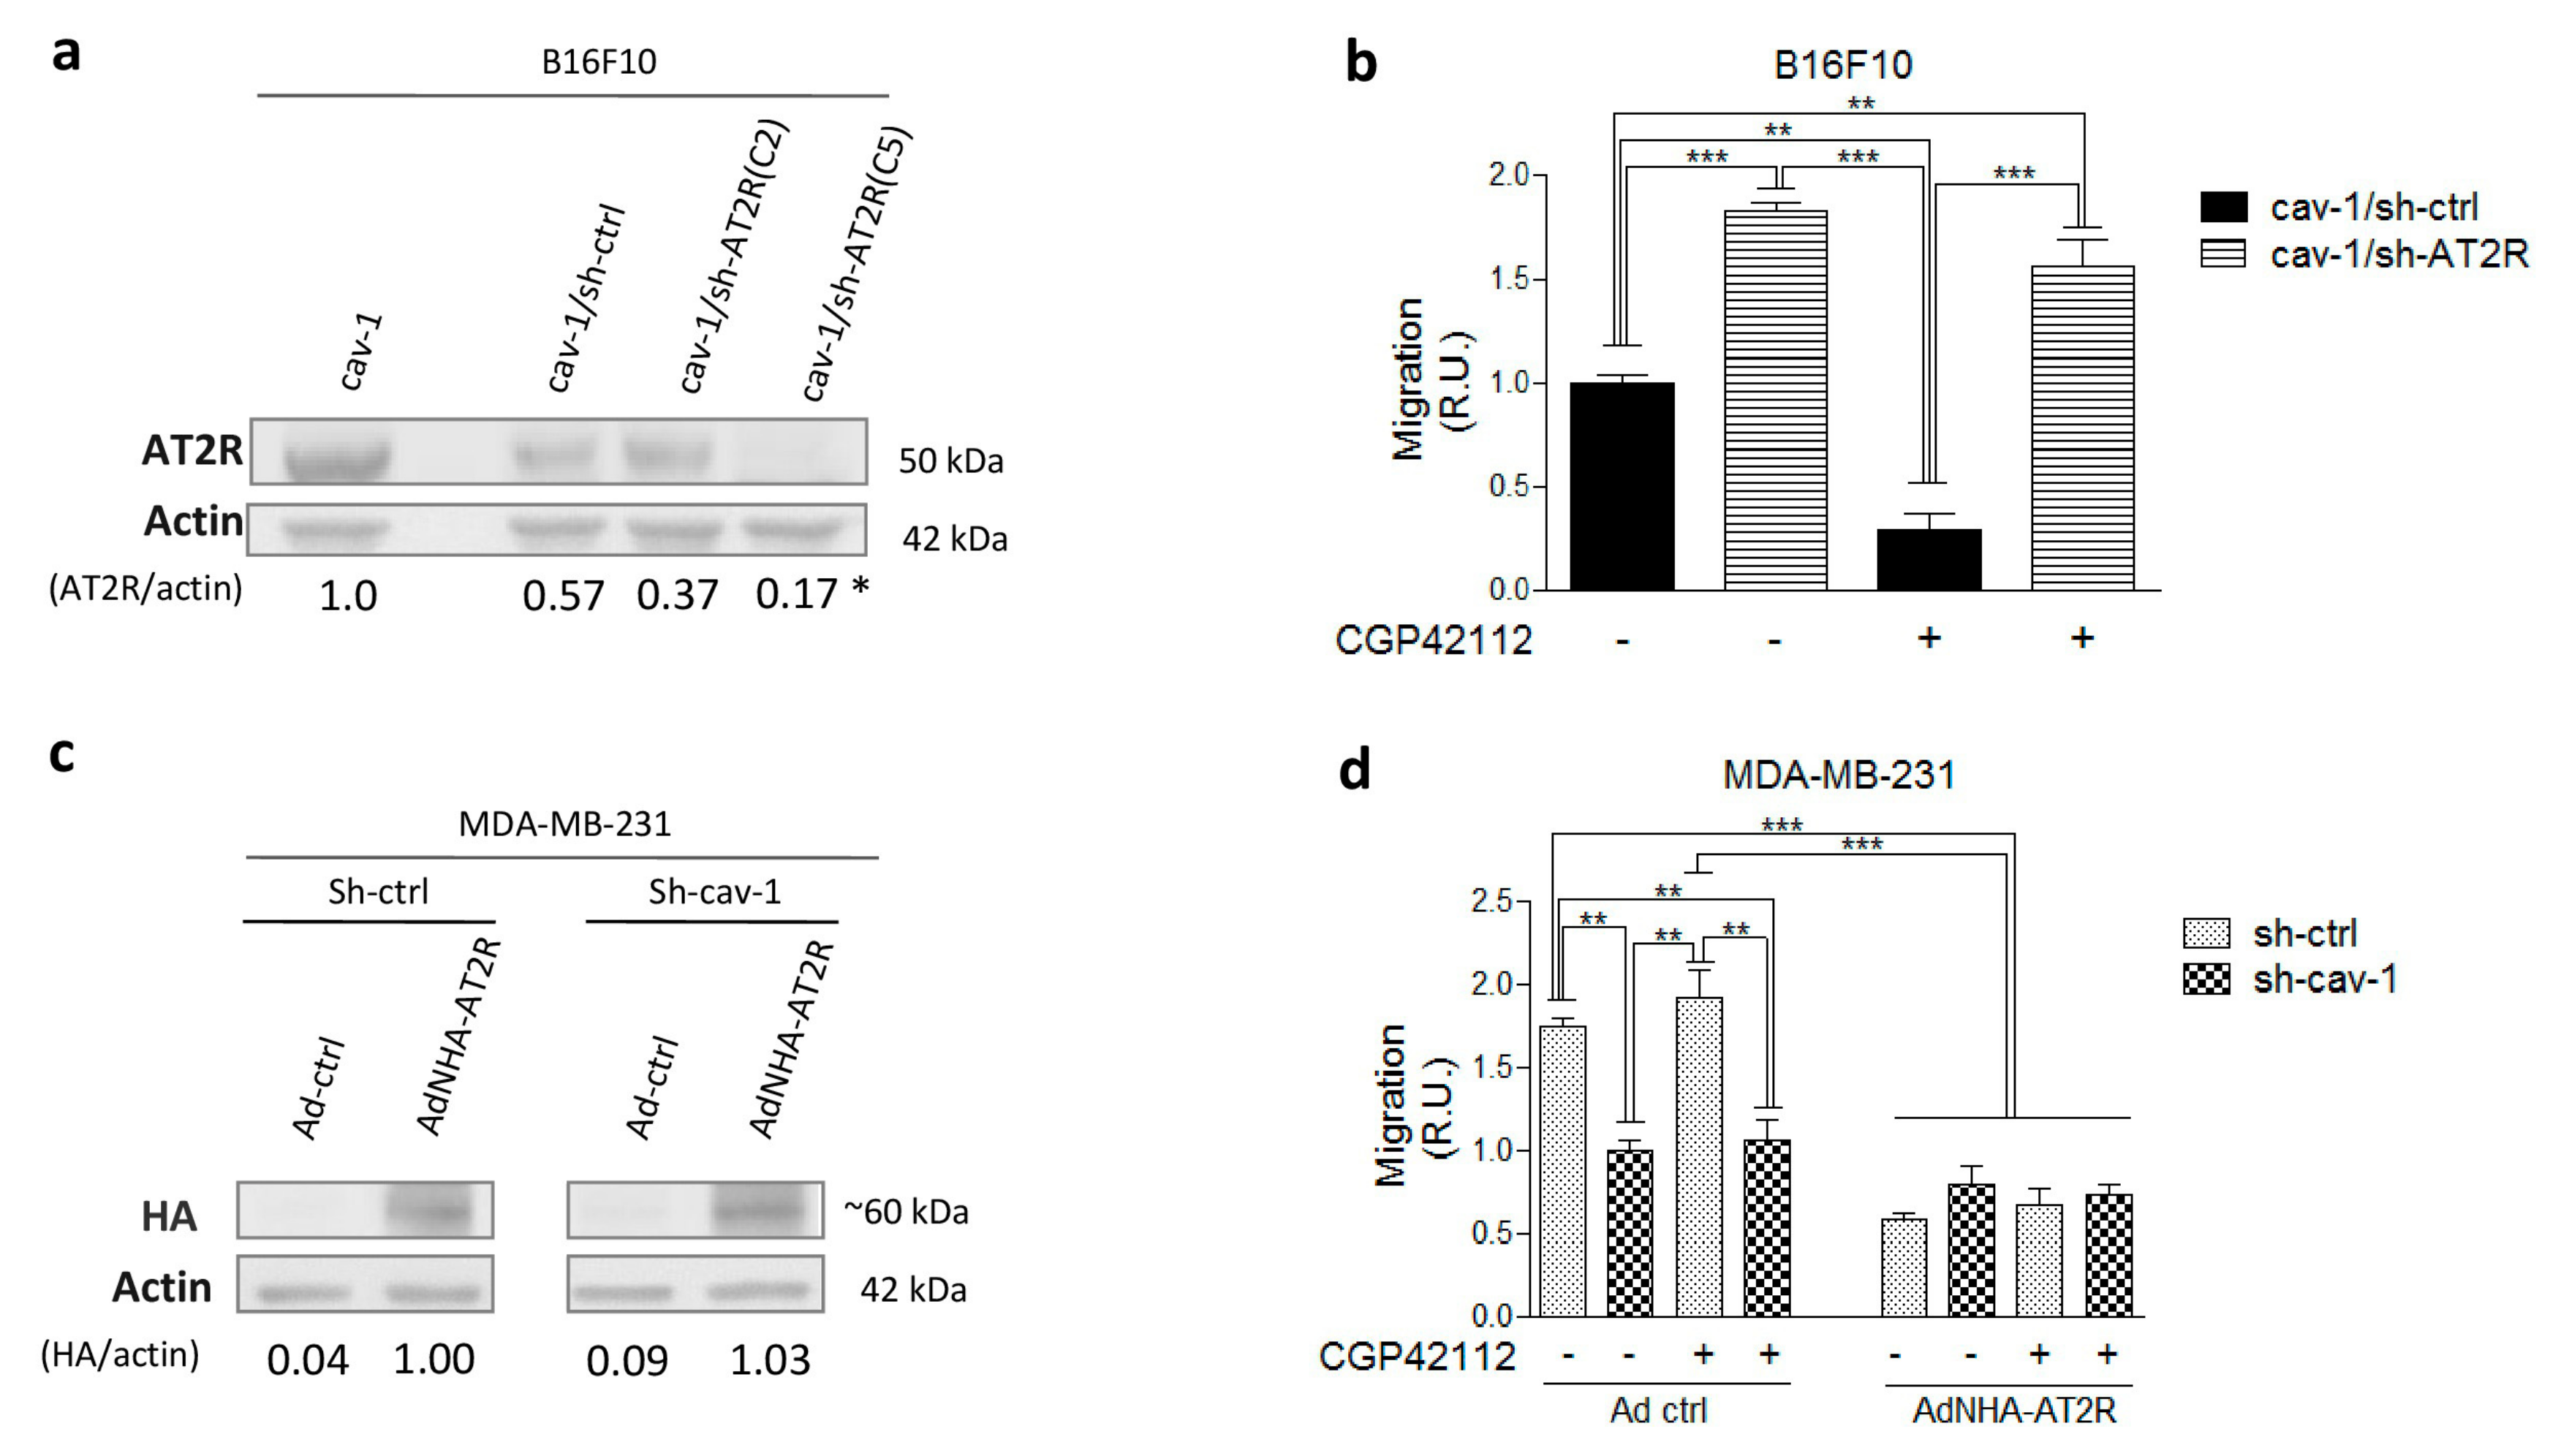
2.2. AT2R Decreases CAV1/Rab5/Rac1 Activity in Melanoma Cells
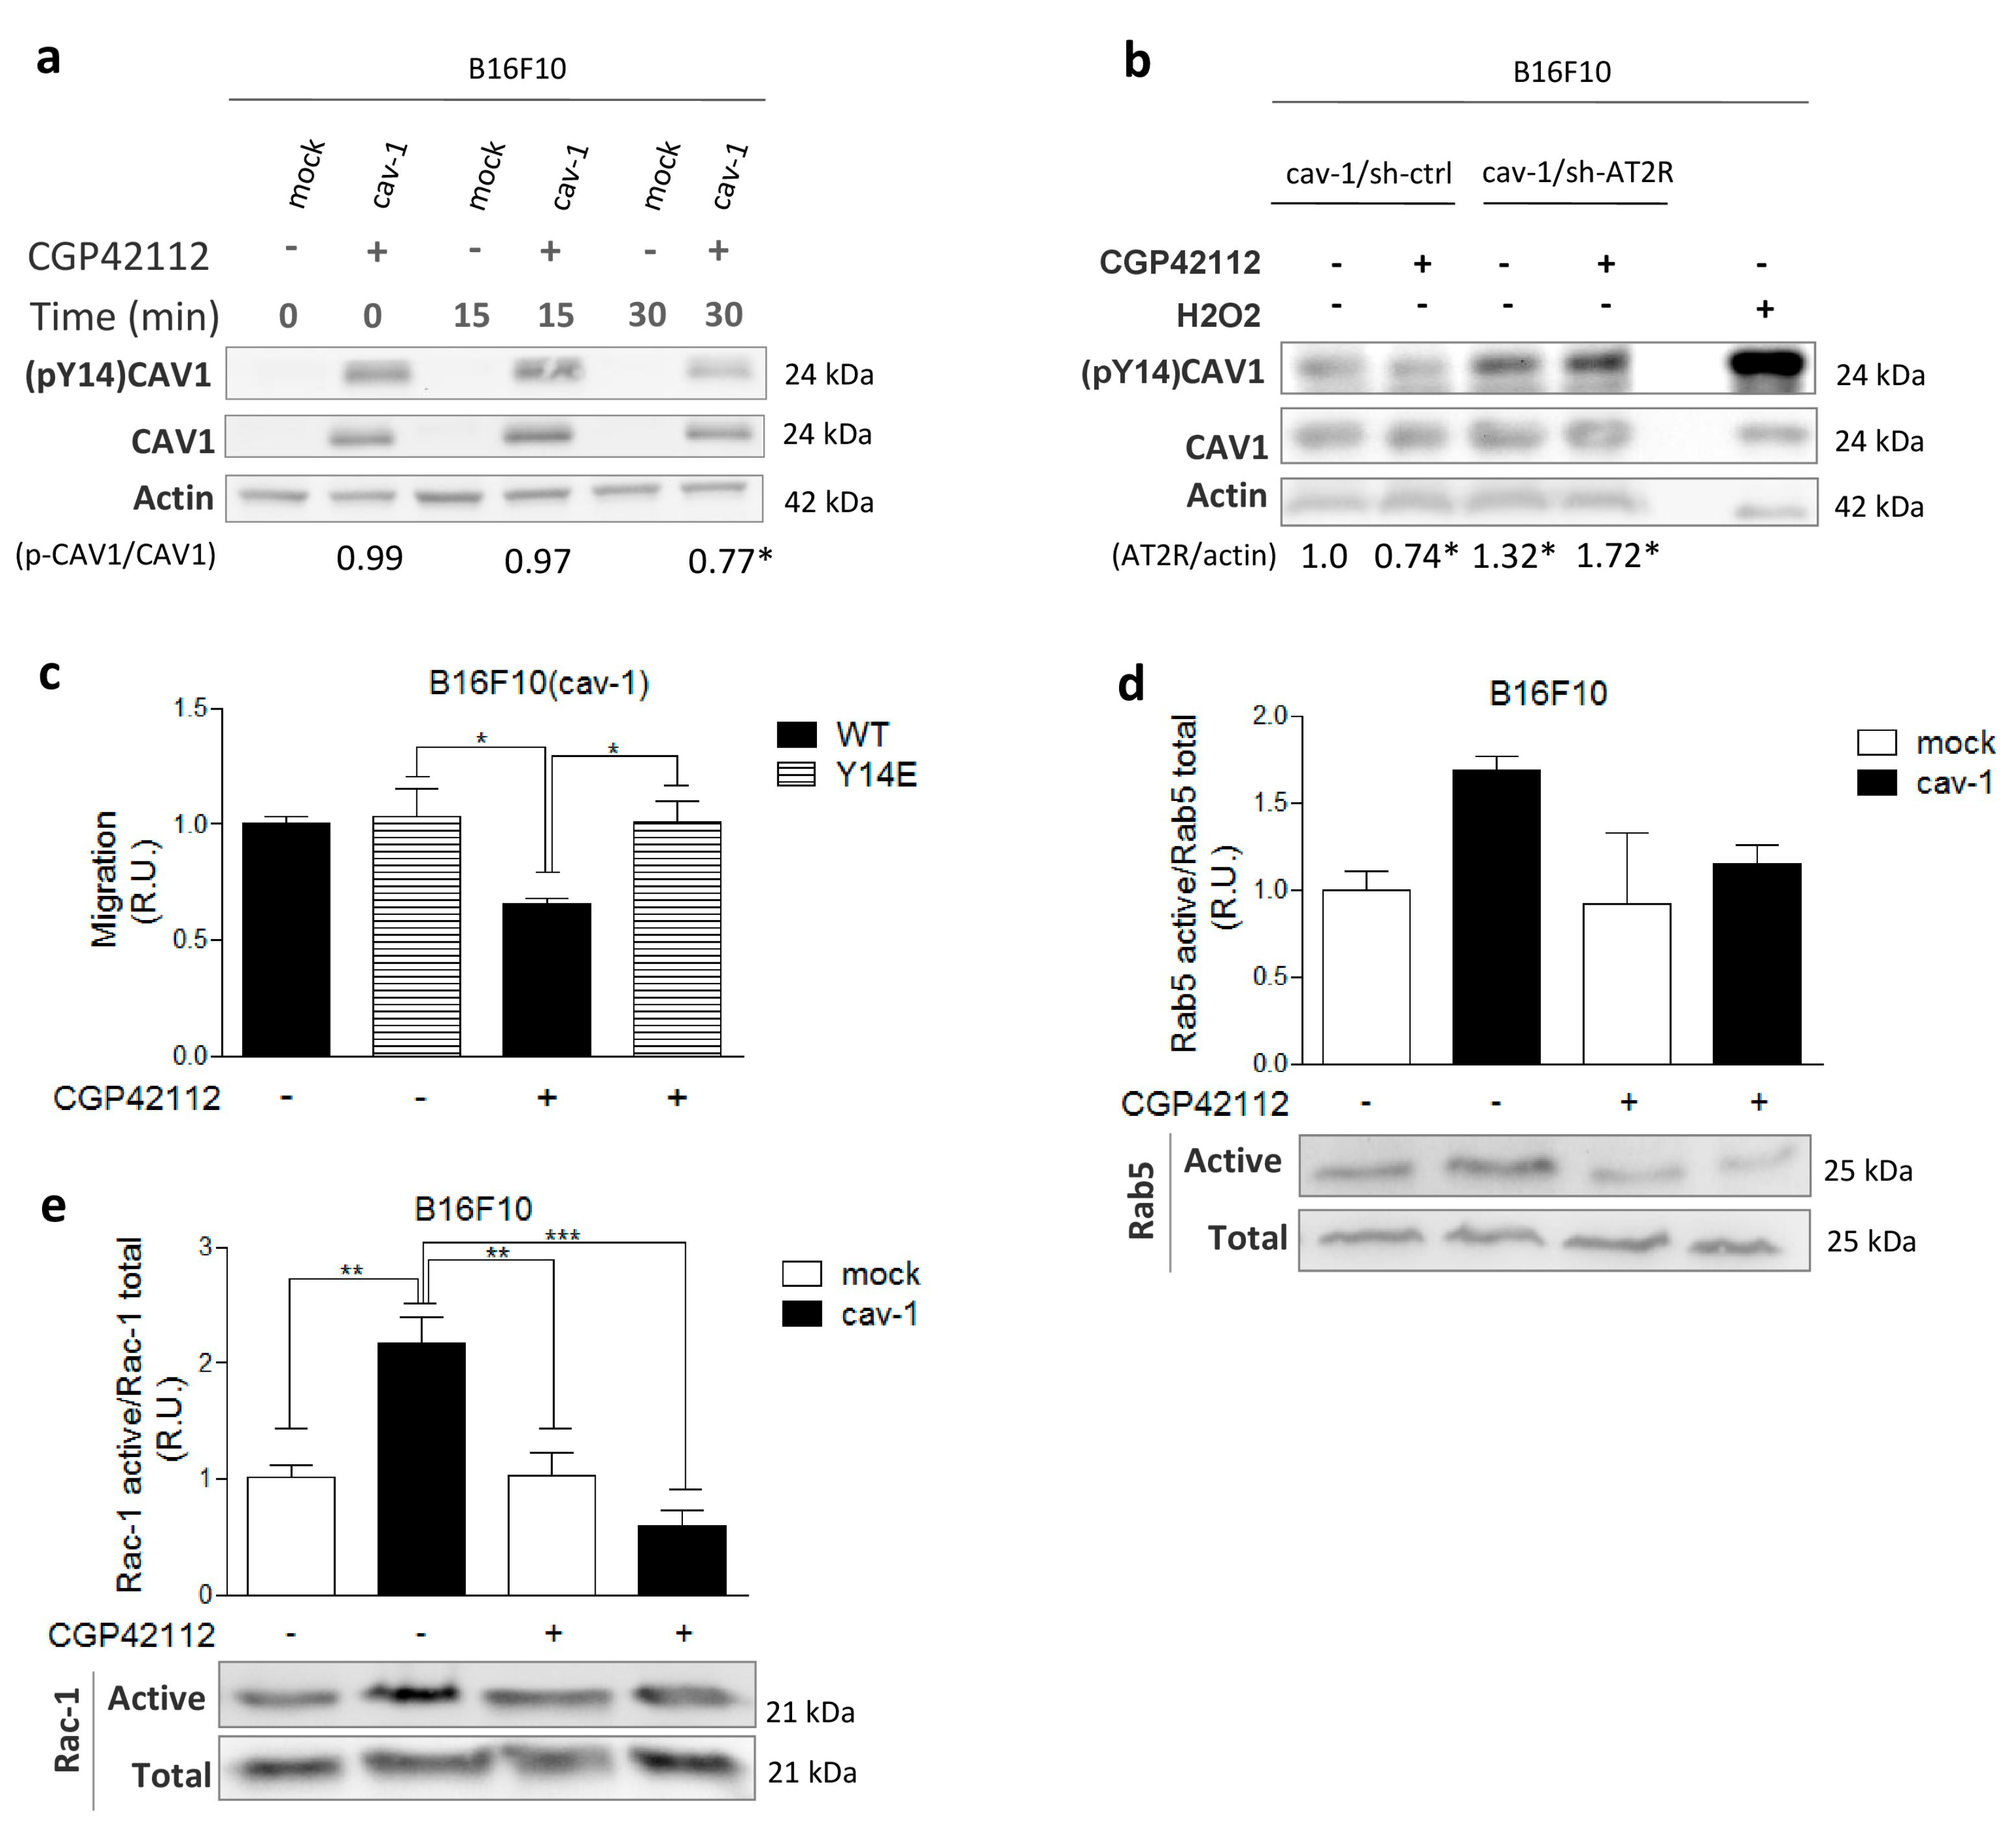
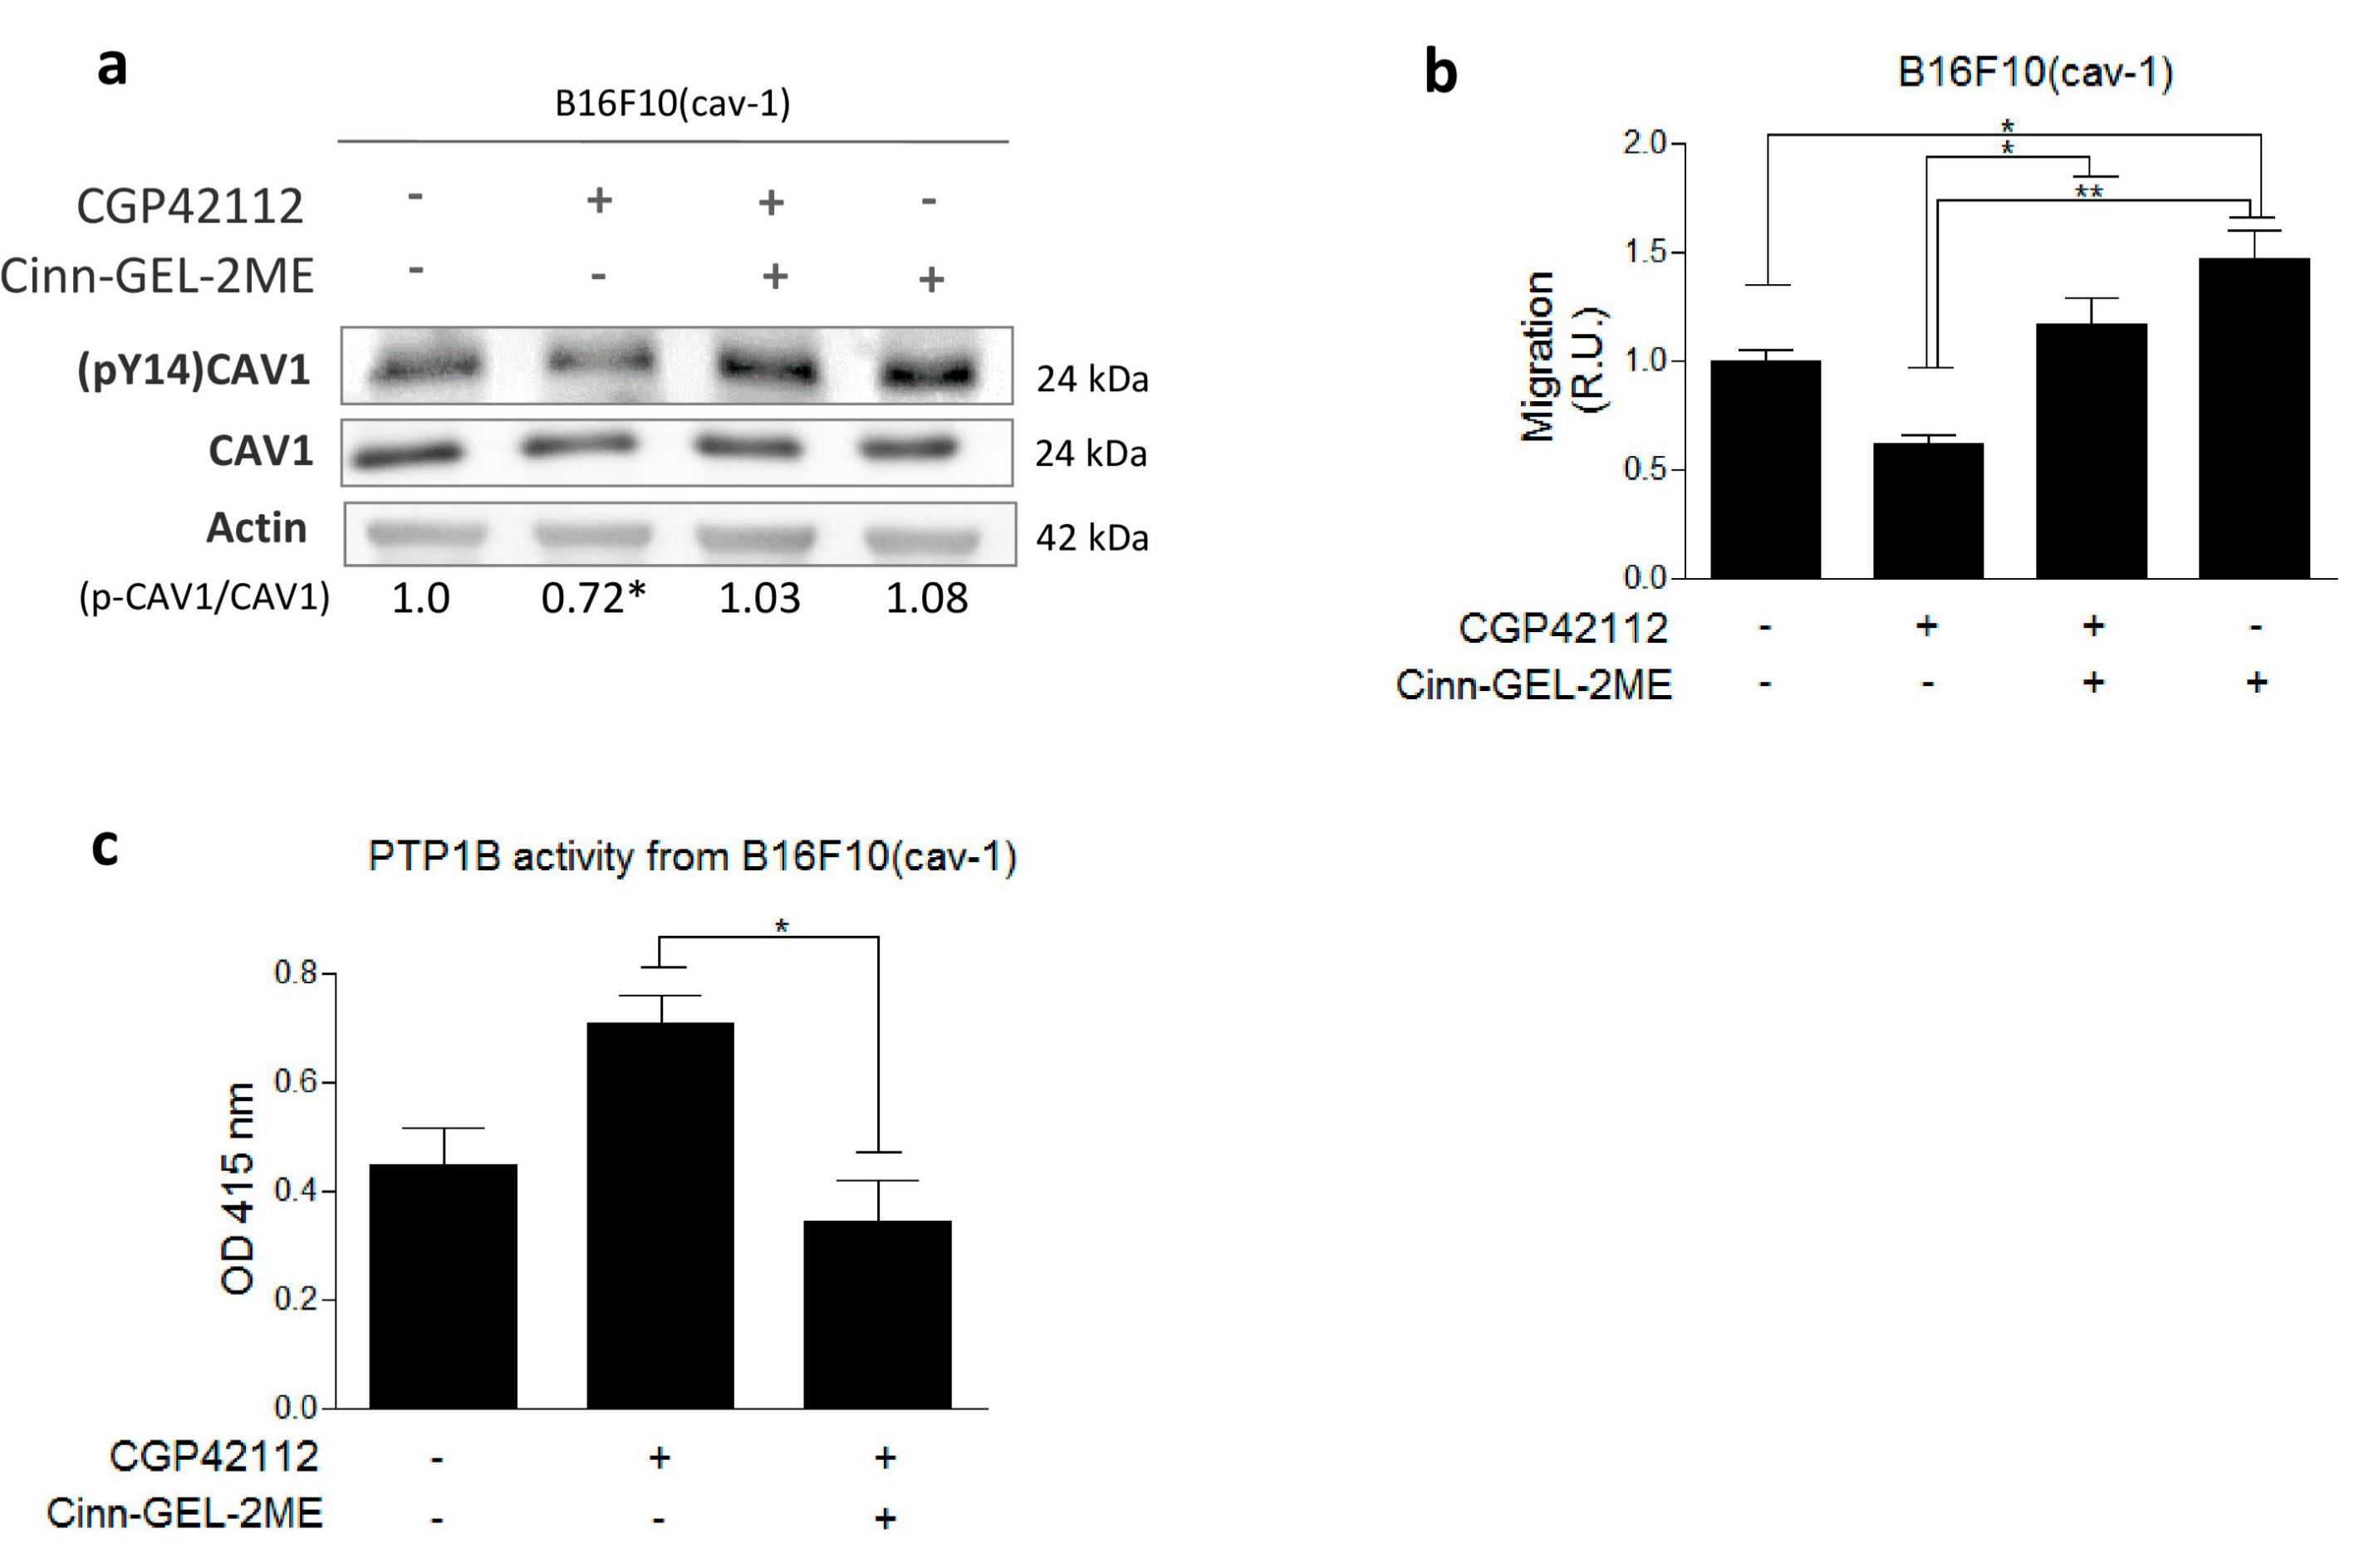
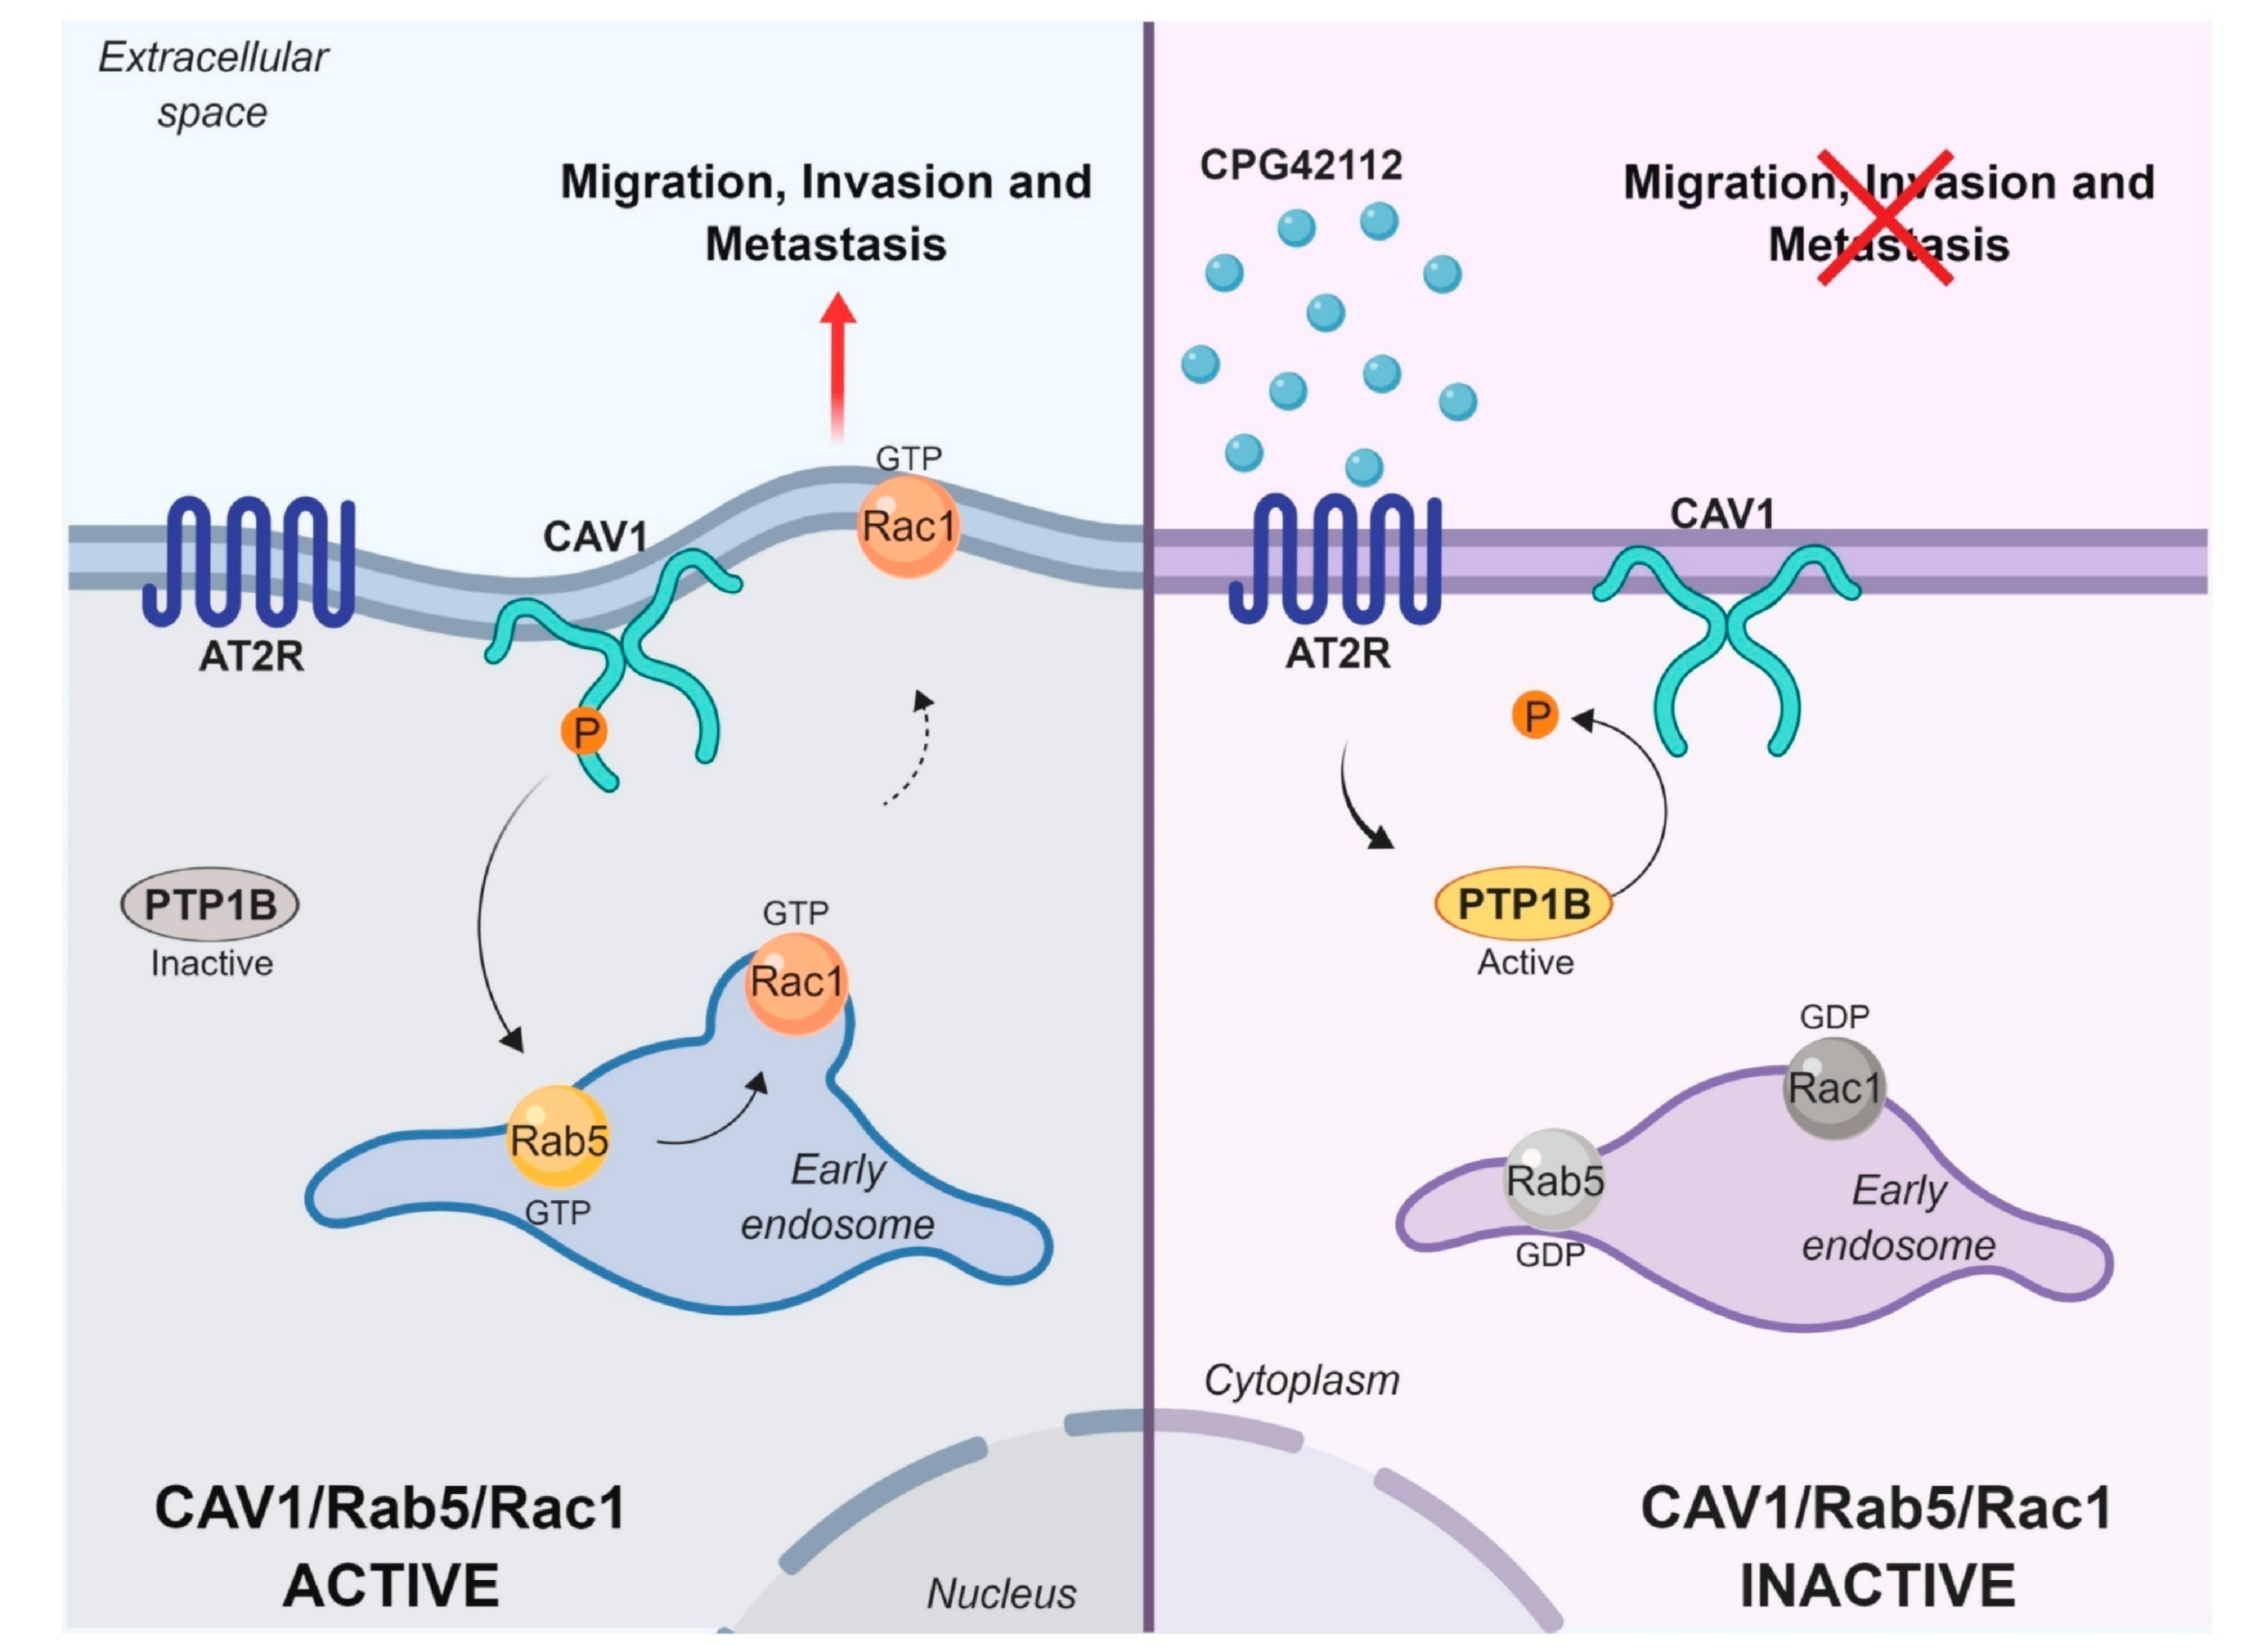
2.3. AT2R Inhibits the CAV1/Rab5/Rac-1 Pathway through PTP1B Activation
3. Discussion
4. Materials and Methods
4.1. Reagents
4.2. Cell Models and Cell Culture
4.3. Western Blots
4.4. Transwell Migration Assays
4.5. Transendothelial Migration Assay (TEM)
4.6. Silencing of AT2R by shRNA
4.7. AT2R Expression by Adenoviral Transduction
4.8. Rab5-GTP and Rac1-GTP Pull-Down Assays
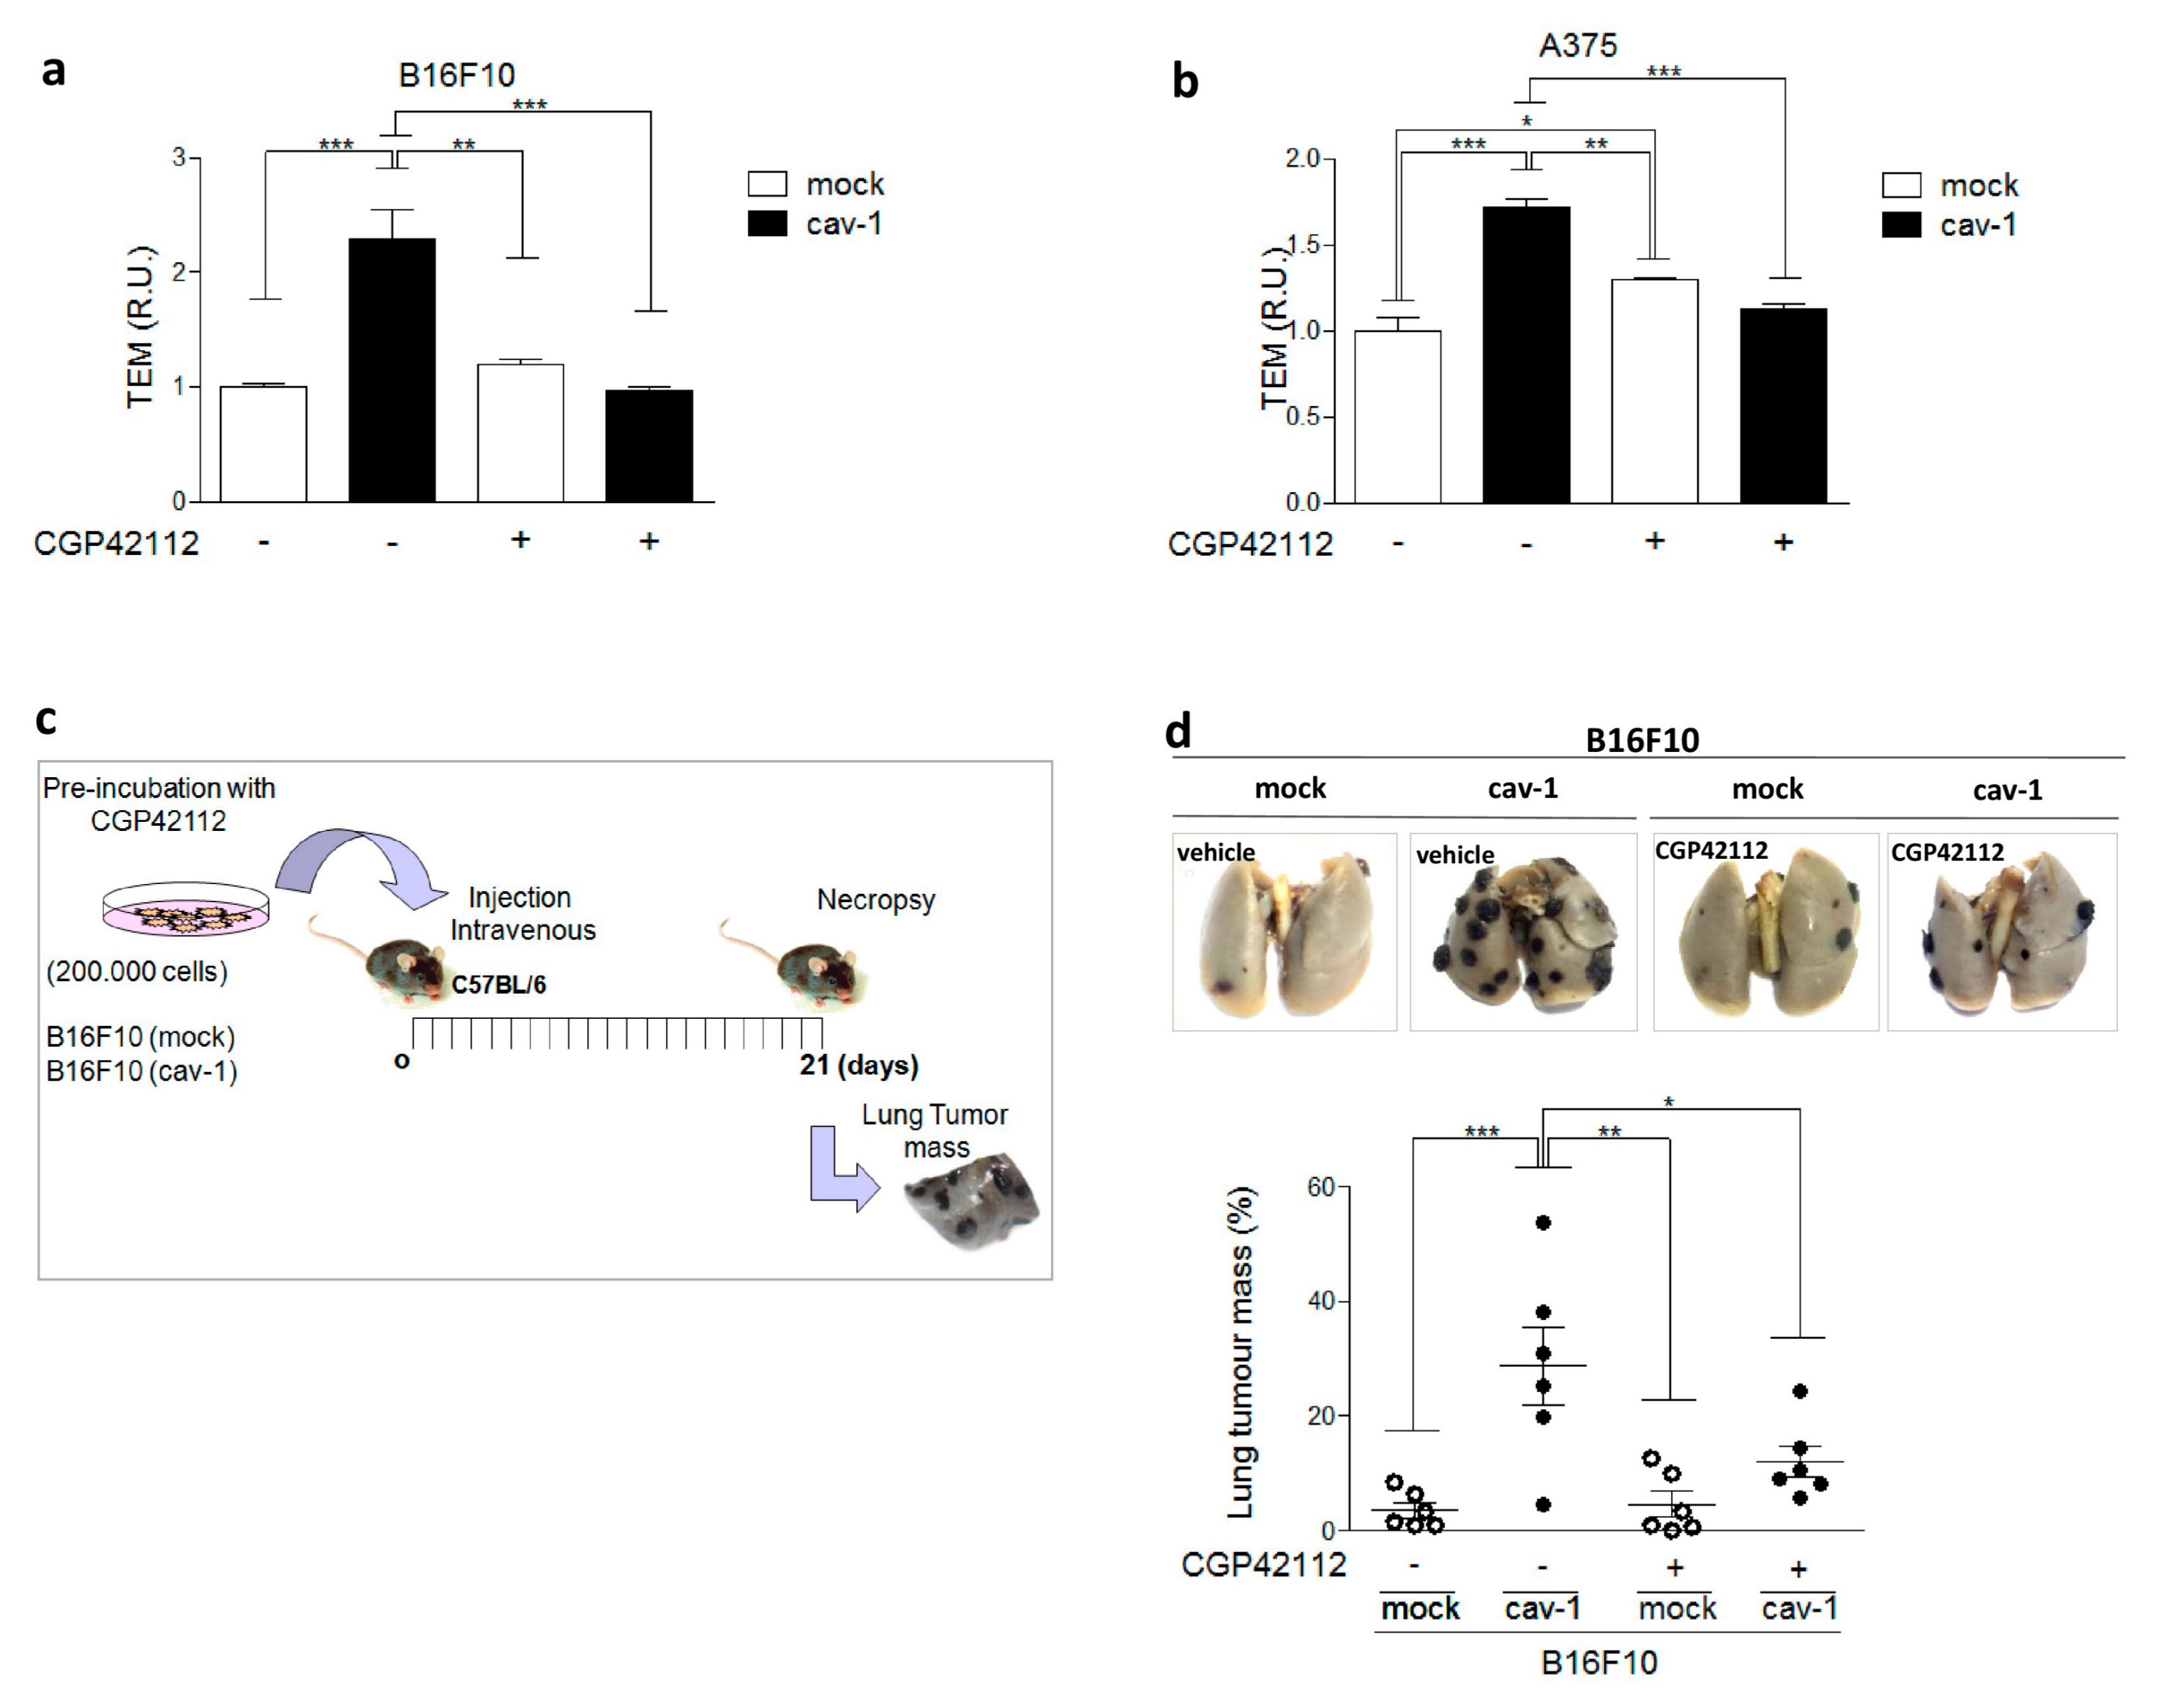
4.9. Metastasis Assays
4.10. Measurement of PTP1B Activity
4.11. Statistical Analysis
5. Conclusions
Supplementary Materials
Author Contributions
Funding
Conflicts of Interest
Availability of Data and Materials
References
- Castrop, H.; Hoecherl, K.; Kurtz, A.; Schweda, F.; Todorov, V.; Wagner, C. Physiology of Kidney Renin. Physiol. Rev. 2010, 90, 607–673. [Google Scholar] [CrossRef] [PubMed]
- Santhekadur, P.K.; Akiel, M.; Emdad, L.; Gredler, R.; Srivastava, J.; Rajasekaran, D.; Robertson, C.L.; Mukhopadhyay, N.D.; Fisher, P.B.; Sarkar, D. Staphylococcal nuclease domain containing-1 (SND1) promotes migration and invasion via angiotensin II type 1 receptor (AT1R) and TGFβ signaling. FEBS Open Biol. 2014, 1, 353–361. [Google Scholar] [CrossRef] [PubMed]
- Dasgupta, C.; Zhang, L. Angiotensin II receptors and drug discovery in cardiovascular disease. Drug Discov. Today 2011, 16, 22–34. [Google Scholar] [CrossRef] [Green Version]
- Berk, B.C. Angiotensin Type 2 Receptor (AT2R): A Challenging Twin. Sci. STKE 2003, 2003, 16. [Google Scholar] [CrossRef] [PubMed]
- Li, Y.; Li, X.H.; Yuan, H. Angiotensin II type-2 receptor-specific effects on the cardiovascular system. Cardiovasc. Diagn. Ther. 2012, 2, 56–62. [Google Scholar] [PubMed]
- George, A.J.; Thomas, W.G.; Hannan, R.D. The renin–angiotensin system and cancer: Old dog, new tricks. Nat. Rev. Cancer 2010, 10, 745–759. [Google Scholar] [CrossRef] [PubMed]
- Ager, E.I.; Neo, J.; Christophi, C. The renin—Angiotensin system and malignancy. Carcinogenesis 2008, 29, 1675–1684. [Google Scholar] [CrossRef]
- Akhavan, M.; Karimi, M.; Ghodrati, M.; Falahtpische, H. AT1 receptors activation enhances the expression of MMP-2, MMP-13 and VEGF but not MMP-9 in B16F10 melanoma cells. Pak. J. Biol. Sci. 2011, 14, 821–830. [Google Scholar] [CrossRef] [PubMed]
- Ager, E.I.; Chong, W.W.; Wen, S.W.; Christophi, C. Targeting the angiotensin II type 2 receptor (AT2R) in colorectal liver metastases. Cancer Cell Int. 2010, 10, 19. [Google Scholar] [CrossRef]
- Molina, A.; Velot, L.; Ghouinem, L.; Abdelkarim, M.; Bouchet, B.P.; Luissint, A.C.; Bouhlel, I.; Morel, M.; Sapharikas, E.; di Tommaso, A.; et al. ATIP3, a novel prognostic marker of breast cancer patient survival, limits cancer cell migration and slows metastatic progression by regulating microtubule. Cancer Res. 2003, 73, 2905–2915. [Google Scholar] [CrossRef]
- Guimond, M.-O.; Battista, M.-C.; Nikjouitavabi, F.; Carmel, M.; Barres, V.; Doueik, A.A.; Fazli, L.; Gleave, M.; Sabbagh, R.; Gallo-Payet, N. Expression and Role of the Angiotensin II AT2 Receptor in Human Prostate Tissue: In Search of a New Therapeutic Option for Prostate Cancer. Prostate 2013, 73, 1057–1068. [Google Scholar] [PubMed]
- Deshayes, F.; Nahmias, C. Angiotensin receptors: A new role in cancer? Trends Endocrinol. Metab. 2005, 16, 293–299. [Google Scholar] [CrossRef] [PubMed]
- Quest, A.F.; Gutierrez-Pajares, J.L.; Torres, V.A. Caveolin-1: An ambiguous partner in cell signalling and cancer. J. Cell. Mol. Med. 2008, 12, 1130–1150. [Google Scholar] [CrossRef]
- Nuñez-Wehinger, S.; Ortiz, R.J.; Díaz, N.; Díaz, J.; Lobos-Gonzalez, L.; Quest, A.F. Caveolin-1 in Cell Migration and Metastasis. Curr. Mol. Med. 2014, 14, 255–274. [Google Scholar] [PubMed]
- Urra, H.; Torres, V.A.; Ortiz, R.J.; Lobos, L.; Díaz, M.I.; Díaz, N.; Härtel, S.; Leyton, L.; Quest, A.F.G. Caveolin-1-enhanced motility and focal adhesion turnover require tyrosine-14 but not accumulation to the rear in metastatic cancer cells. PLoS ONE 2012, 7, e33085. [Google Scholar] [CrossRef] [PubMed]
- Díaz, J.; Mendoza, P.; Ortiz, R.; Díaz, N.; Leyton, L.; Stupack, D.; Quest, A.F.; Torres, V.A. Rab5 is required in metastatic cancer cells for Caveolin-1-enhanced Rac1 activation, migration and invasion. J. Cell Sci. 2014, 11, 2401–2406. [Google Scholar] [CrossRef] [PubMed]
- Ortiz, R.; Díaz, J.; Díaz, N.; Lobos-Gonzalez, L.; Cardenas, A.; Contreras, P.; Diaz, M.I.; Otte, E.; Cooper-White, J.; Torres, V.; et al. Extracellular matrix-specific Caveolin-1 phosphorylation on tyrosine 14 is linked to augmented melanoma metastasis but not tumorigenesis. Oncotarget 2016, 7, 40571–40593. [Google Scholar] [CrossRef] [PubMed] [Green Version]
- Lee, H.; Xie, L.; Luo, Y.; Lee, S.-Y.; Lawrence, D.S.; Wang, X.B.; Sotgia, F.; Lisanti, M.P.; Zhang, Z.-Y. Identification of Phosphocaveolin-1 as a Novel Protein Tyrosine Phosphatase 1B Substrate. Biochemistry 2006, 45, 234–240. [Google Scholar] [CrossRef]
- Koren, S.; Fantus, G.I. Inhibition of the protein tyrosine phosphatase PTP1B: Potential therapy for obesity, insulin resistance and type-2 diabetes mellitus. Best Pr. Res. Clin. Endocrinol. Metab. 2007, 21, 621–640. [Google Scholar] [CrossRef]
- Lessard, L.; Stuible, M.; Tremblay, M.L. The two faces of PTP1B in cancer. BBA-Proteins Proteom. 2010, 1804, 613–619. [Google Scholar] [CrossRef]
- Chen, J.; Chen, J.-K.; Harris, R.C. Angiotensin II induces epithelial-to-mesenchymal transition in renal epithelial cells through reactive oxygen species/Src/caveolin-mediated activation of an epidermal growth factor receptor-extracellular signal-regulated kinase signaling pathway. Mol. Cell. Biol. 2012, 32, 981–991. [Google Scholar] [CrossRef] [PubMed]
- Lobos-Gonzalez, L.; Aguilar, L.; Diaz, J.; Diaz, N.; Urra, H.; Torres, V.; Silva, V.; Fitzpatrick, C.; Lladser, A.; Hoek, K.S.; et al. E-cadherin determines Caveolin-1 tumor suppression or metastasis enhancing function in melanoma cells. Pigment Cell Melanoma Res. 2013, 26, 555–570. [Google Scholar] [CrossRef] [PubMed] [Green Version]
- Bosnyak, S.; Jones, E.S.; Christopoulos, A.; Aguilar, M.I.; Thomas, W.G.; Widdop, R.E. Relative affinity of angiotensin peptides and novel ligands at AT1 and AT2 receptors. Clin. Sci. 2011, 303, 297–303. [Google Scholar] [CrossRef] [PubMed]
- Aránguiz-Urroz, P.; Soto, D.; Contreras, A.; Troncoso, R.; Chiong, M.; Montenegro, J.; Venegas, D.; Smolic, C.; Ayala, P.; Thomas, W.G.; et al. Differential Participation of Angiotensin II Type 1 and 2 Receptors in the Regulation of Cardiac Cell Death Triggered by Angiotensin II. Am. J. Hypertens. 2009, 22, 569–576. [Google Scholar] [CrossRef] [PubMed] [Green Version]
- Mehlen, P.; Puisieux, A. Metastasis: A question of life or death. Nat. Rev. Cancer 2006, 6, 449–458. [Google Scholar] [PubMed]
- Lobos-Gonzalez, L.; Aguilar-Guzmán, L.; Fernandez, J.G.; Muñoz, N.; Hossain, M.; Bieneck, S.; Silva, V.; Burzio, V.; Sviderskaya, E.V.; Bennett, D.C.; et al. Caveolin-1 is a risk factor for postsurgery metastasis in preclinical melanoma models. Melanoma Res. 2014, 24, 108–119. [Google Scholar] [Green Version]
- Um, S.; Henz, B.M. Human skin: Source of and target organ for angiotensin II. Exp. Dermatol. 2004, 13, 148–154. [Google Scholar]
- Olschewski, D.N.; Hofschröer, V.; Nielsen, N.; Seidler, D.G.; Schwab, A.; Stock, C. The Angiotensin II Type 1 Receptor Antagonist Losartan Affects NHE1-Dependent Melanoma Cell Behavior. Cell. Physiol. Biochem. 2018, 45, 2560–2576. [Google Scholar] [CrossRef] [PubMed] [Green Version]
- De Paepe, B.; Verstraeten, V.M.; de Potter, C.R.; Bullock, G.R. Increased angiotensin II type-2 receptor density in hyperplasia, DCIS and invasive carcinoma of the breast is paralleled with increased iNOS expression. Histochem. Cell Biol. 2002, 117, 13–19. [Google Scholar] [CrossRef]
- Gandhi, A.; Chipitsyna, G.; Relles, D.; Yeo, C.J.; Arafat, H.A. Angiotensin II Type 2 Receptor: A Novel Modulator of Inflammation in Pancreatic Ductal Adenocarcinoma through Regulation of NF-ΚB Activity. J. Surg. Res. 2017, 172, 307. [Google Scholar] [CrossRef]
- Xu, X.P.; He, H.L.; Hu, S.L.; Han, J.B.; Huang, L.L.; Xu, J.Y.; Xie, J.F.; Liu, A.R.; Yang, Y.; Qiu, H.B. Ang II-AT2R increases mesenchymal stem cell migration by signaling through the FAK and RhoA/Cdc42 pathways in vitro. Stem Cell Res. Ther. 2017, 8, 164. [Google Scholar] [CrossRef] [PubMed]
- Rodrigues-ferreira, S.; Morel, M.; Reis, R.I.; Cornier, F.; Baud, V.; Costa-Neto, C.M.; Nahmias, C. A Novel Cellular Model to Study Angiotensin II AT2 Receptor Function in Breast Cancer Cells. Int. J. Pept. 2012, 2012, 745027. [Google Scholar] [PubMed]
- Oyarce, C.; Cruz-Gomez, S.; Galvez-Cancino, F.; Vargas, P.; Moreau, H.D.; Diaz-Valdivia, N.; Diaz, J.; Salazar-Onfray, F.A.; Pacheco, R.; Lennon-Dumenil, A.M.; et al. Caveolin-1 expression increases upon Maturation in Dendritic cells and Promotes Their Migration to lymph nodes Thereby Favoring the induction of CD8 + T cell responses. Front. Immunol. 2017, 8, 1794. [Google Scholar] [CrossRef] [PubMed]
- Nethe, M.; Hordijk, P.L. A model for phospho-caveolin-1-driven turnover of focal adhesions. Cell Adhes. Migr. 2011, 5, 59–64. [Google Scholar] [Green Version]
- Mahadev, K.; Zilbering, A.; Zhu, L.; Goldstein, B.J. Insulin-stimulated Hydrogen Peroxide Reversibly Inhibits Protein- tyrosine Phosphatase 1B in Vivo and Enhances the Early Insulin Action Cascade. J. Biol. Chem. 2001, 276, 21938–21942. [Google Scholar] [PubMed]
- Salsman, S.J.; Hensley, K.; Floyd, R.A. Sensitivity of Protein Tyrosine Phosphatase Activity to the Redox Environment, Cytochrome c, and Microperoxidase. Antioxid. Redox Signal. 2005, 7, 1078–1088. [Google Scholar] [CrossRef]
- Senbonmatsu, T.; Saito, T.; Landon, E.J.; Watanabe, O.; Price, E.; Roberts, R.L.; Imboden, H.; Fitzgerald, T.G.; Gaffney, F.A.; Inagami, T. A novel angiotensin II type 2 receptor signaling pathway: Possible role in cardiac hypertrophy. EMBO J. 2003, 22, 6471–6782. [Google Scholar] [CrossRef]
- Zhu, G.; Fan, Z.; Ding, M.; Zhang, H.; Mu, L.; Ding, Y.; Zhang, Y.; Jia, B.; Chen, L.; Chang, Z.; et al. An EGFR/PI3K/AKT axis promotes accumulation of the Rac1-GEF Tiam1 that is critical in EGFR-driven tumorigenesis. Oncogene 2015, 34, 5971–5982. [Google Scholar]
- Bousquet, E.; Calvayrac, O.; Mazières, J.; Boubekeur, N.; Favre, G.; Pradines, A. RhoB loss induces Rac1-dependent mesenchymal cell invasion in lung cells through PP2A inhibition. Oncogene 2016, 35, 1760–1769. [Google Scholar] [CrossRef]
- Arpaia, E.; Blaser, H.; Duncan, G.; Leong, H.S.; Ablack, A.; Nambiar, S.C.; Lind, E.F.; Silvester, J.; Fleming, C.K.; Rufini, A.; et al. The interaction between caveolin-1 and Rho-GTPases promotes metastasis by controlling the expression of alpha5-integrin and the activation of Src, Ras and Erk. Oncogene 2012, 31, 884–896. [Google Scholar] [CrossRef]
- Díaz-García, V.M.; Guerrero, S.; Díaz-Valdivia, N.; Lobos-González, L.; Kogan, M.; Pérez-Donoso, J.M.; Quest, A.F.G. Biomimetic quantum dot-labeled B16F10 murine melanoma cells as a tool to monitor early steps of lung metastasis by in vivo imaging. Int. J. Nanomed. 2018, 16, 6391–6412. [Google Scholar] [CrossRef] [PubMed]
- Miura, S.; Karnik, S.S.; Saku, K. Constitutively Active Homo-oligomeric Angiotensin II Type 2 Receptor Induces Cell Signaling Independent of Receptor Conformation and Ligand Stimulation. J. Biol. Chem. 2005, 280, 18237–18244. [Google Scholar] [PubMed] [Green Version]
- Li, H.; Qi, Y.; Li, C.; Braseth, L.N.; Gao, Y.; Shabashvili, A.E.; Katovich, M.J.; Sumners, C. Angiotensin type 2 receptor—Mediated apoptosis of human prostate cancer cells. Mol. Cancer Ther. 2009, 8, 3255–3266. [Google Scholar] [CrossRef] [PubMed]


© 2019 by the authors. Licensee MDPI, Basel, Switzerland. This article is an open access article distributed under the terms and conditions of the Creative Commons Attribution (CC BY) license (http://creativecommons.org/licenses/by/4.0/).
Share and Cite
Martínez-Meza, S.; Díaz, J.; Sandoval-Bórquez, A.; Valenzuela-Valderrama, M.; Díaz-Valdivia, N.; Rojas-Celis, V.; Contreras, P.; Huilcaman, R.; Ocaranza, M.P.; Chiong, M.; et al. AT2 Receptor Mediated Activation of the Tyrosine Phosphatase PTP1B Blocks Caveolin-1 Enhanced Migration, Invasion and Metastasis of Cancer Cells. Cancers 2019, 11, 1299. https://doi.org/10.3390/cancers11091299
Martínez-Meza S, Díaz J, Sandoval-Bórquez A, Valenzuela-Valderrama M, Díaz-Valdivia N, Rojas-Celis V, Contreras P, Huilcaman R, Ocaranza MP, Chiong M, et al. AT2 Receptor Mediated Activation of the Tyrosine Phosphatase PTP1B Blocks Caveolin-1 Enhanced Migration, Invasion and Metastasis of Cancer Cells. Cancers. 2019; 11(9):1299. https://doi.org/10.3390/cancers11091299
Chicago/Turabian StyleMartínez-Meza, Samuel, Jorge Díaz, Alejandra Sandoval-Bórquez, Manuel Valenzuela-Valderrama, Natalia Díaz-Valdivia, Victoria Rojas-Celis, Pamela Contreras, Ricardo Huilcaman, María Paz Ocaranza, Mario Chiong, and et al. 2019. "AT2 Receptor Mediated Activation of the Tyrosine Phosphatase PTP1B Blocks Caveolin-1 Enhanced Migration, Invasion and Metastasis of Cancer Cells" Cancers 11, no. 9: 1299. https://doi.org/10.3390/cancers11091299