Single-Cell Transcriptomic Analysis of Tumor-Derived Fibroblasts and Normal Tissue-Resident Fibroblasts Reveals Fibroblast Heterogeneity in Breast Cancer

 , , , and
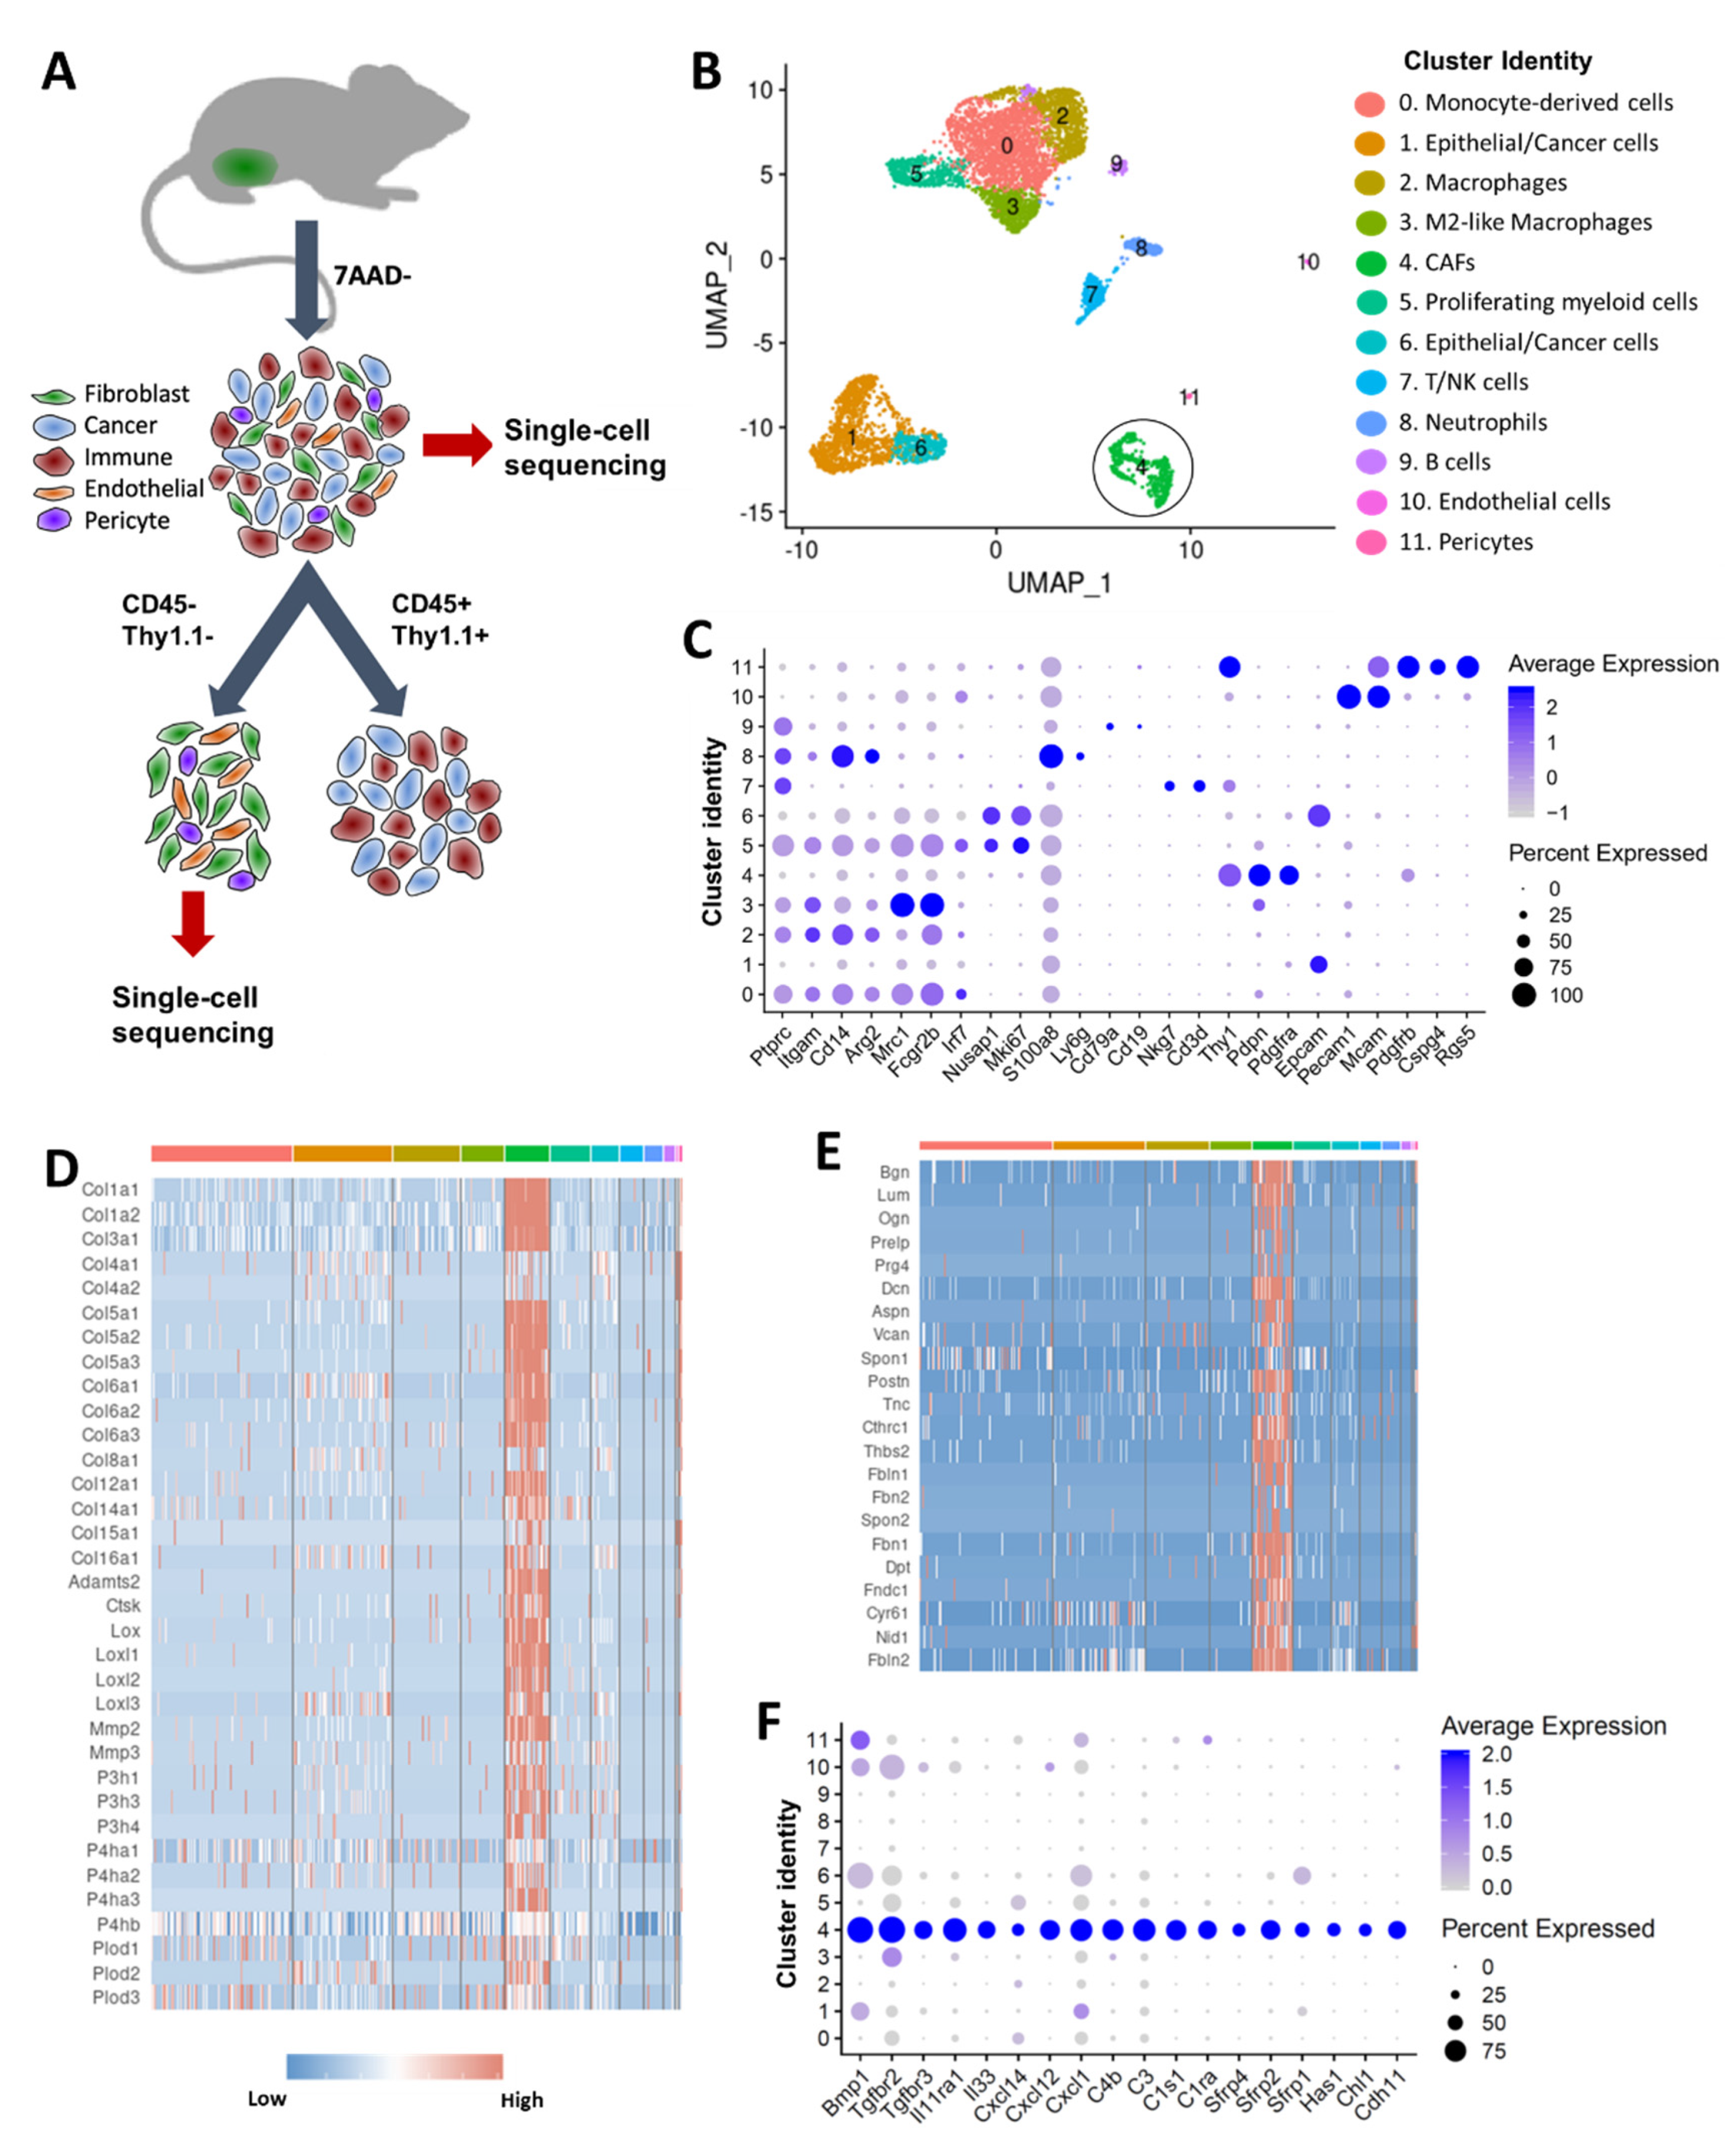
Abstract
:1. Introduction
2. Results
2.1. scRNA-seq Reveals Transcriptional Profiles of CAFs in Murine Mammary Tumors
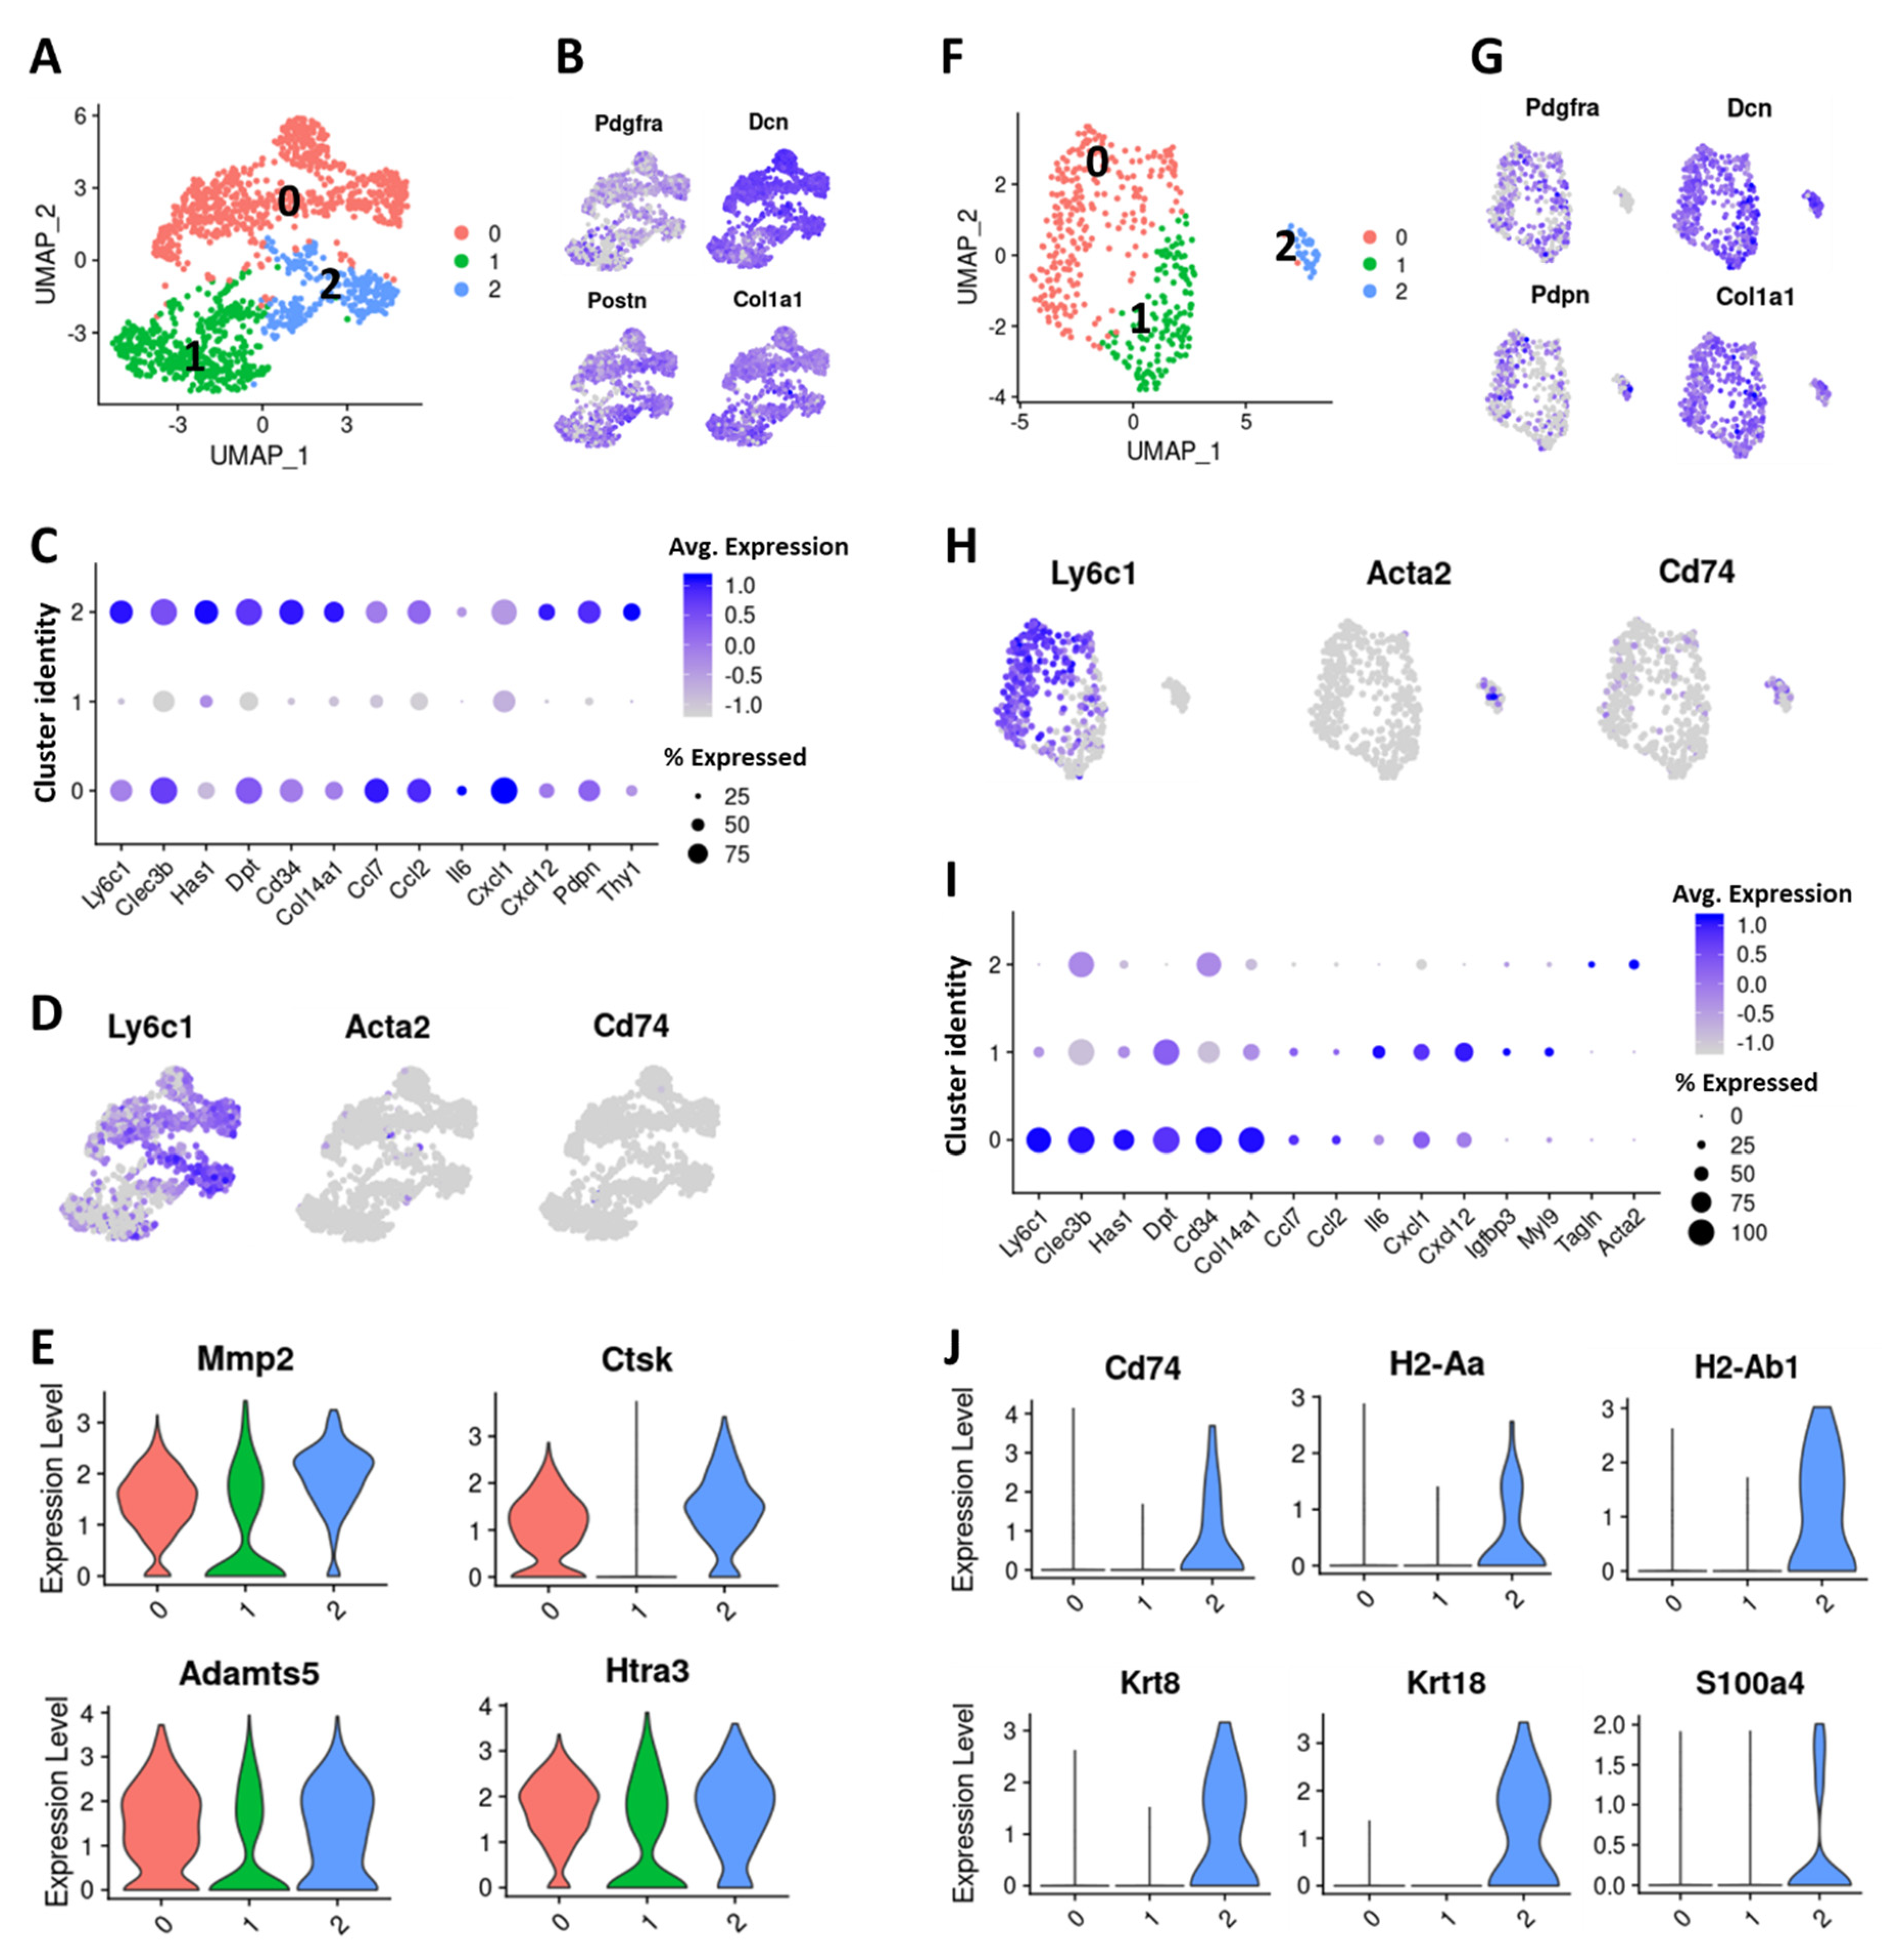
2.2. Six Distinct Subtypes of CAFs Were Detected in Murine Mammary Tumors
2.3. TNBC-Derived CAF Subtypes Share Molecular Features with Pancreatic Ductal Adenocarcinoma (PDAC)-Derived CAF Subtypes
2.4. Cells with Ly6c1high and Cd74high CAF Profiles are Present in Normal, Healthy Tissues
3. Discussion
4. Materials and Methods
4.1. Cell Lines
4.2. Generation of Orthotopic Mammary Tumors and Tumor Digestion
4.3. Single Cell Sequencing of 4T1 Tumors and Data Analysis
4.4. Single Cell Sequencing and Analysis of Stromal Cell-Enriched Fraction
4.5. Single-Cell Sequencing of Syngeneic mT3 Tumors and Data Analysis
4.6. Isolation and Sequencing of Fibroblasts from Normal Mammary Fat Pad
4.7. Analysis of Cancer-Associated Fibroblasts from Mouse Pancreatic Tumors
4.8. Analysis of Normal Fibroblasts from Mouse Pancreas
4.9. Analysis of Mammary Tumors from MMTV-PyMT Mice
4.10. Trajectory Finding
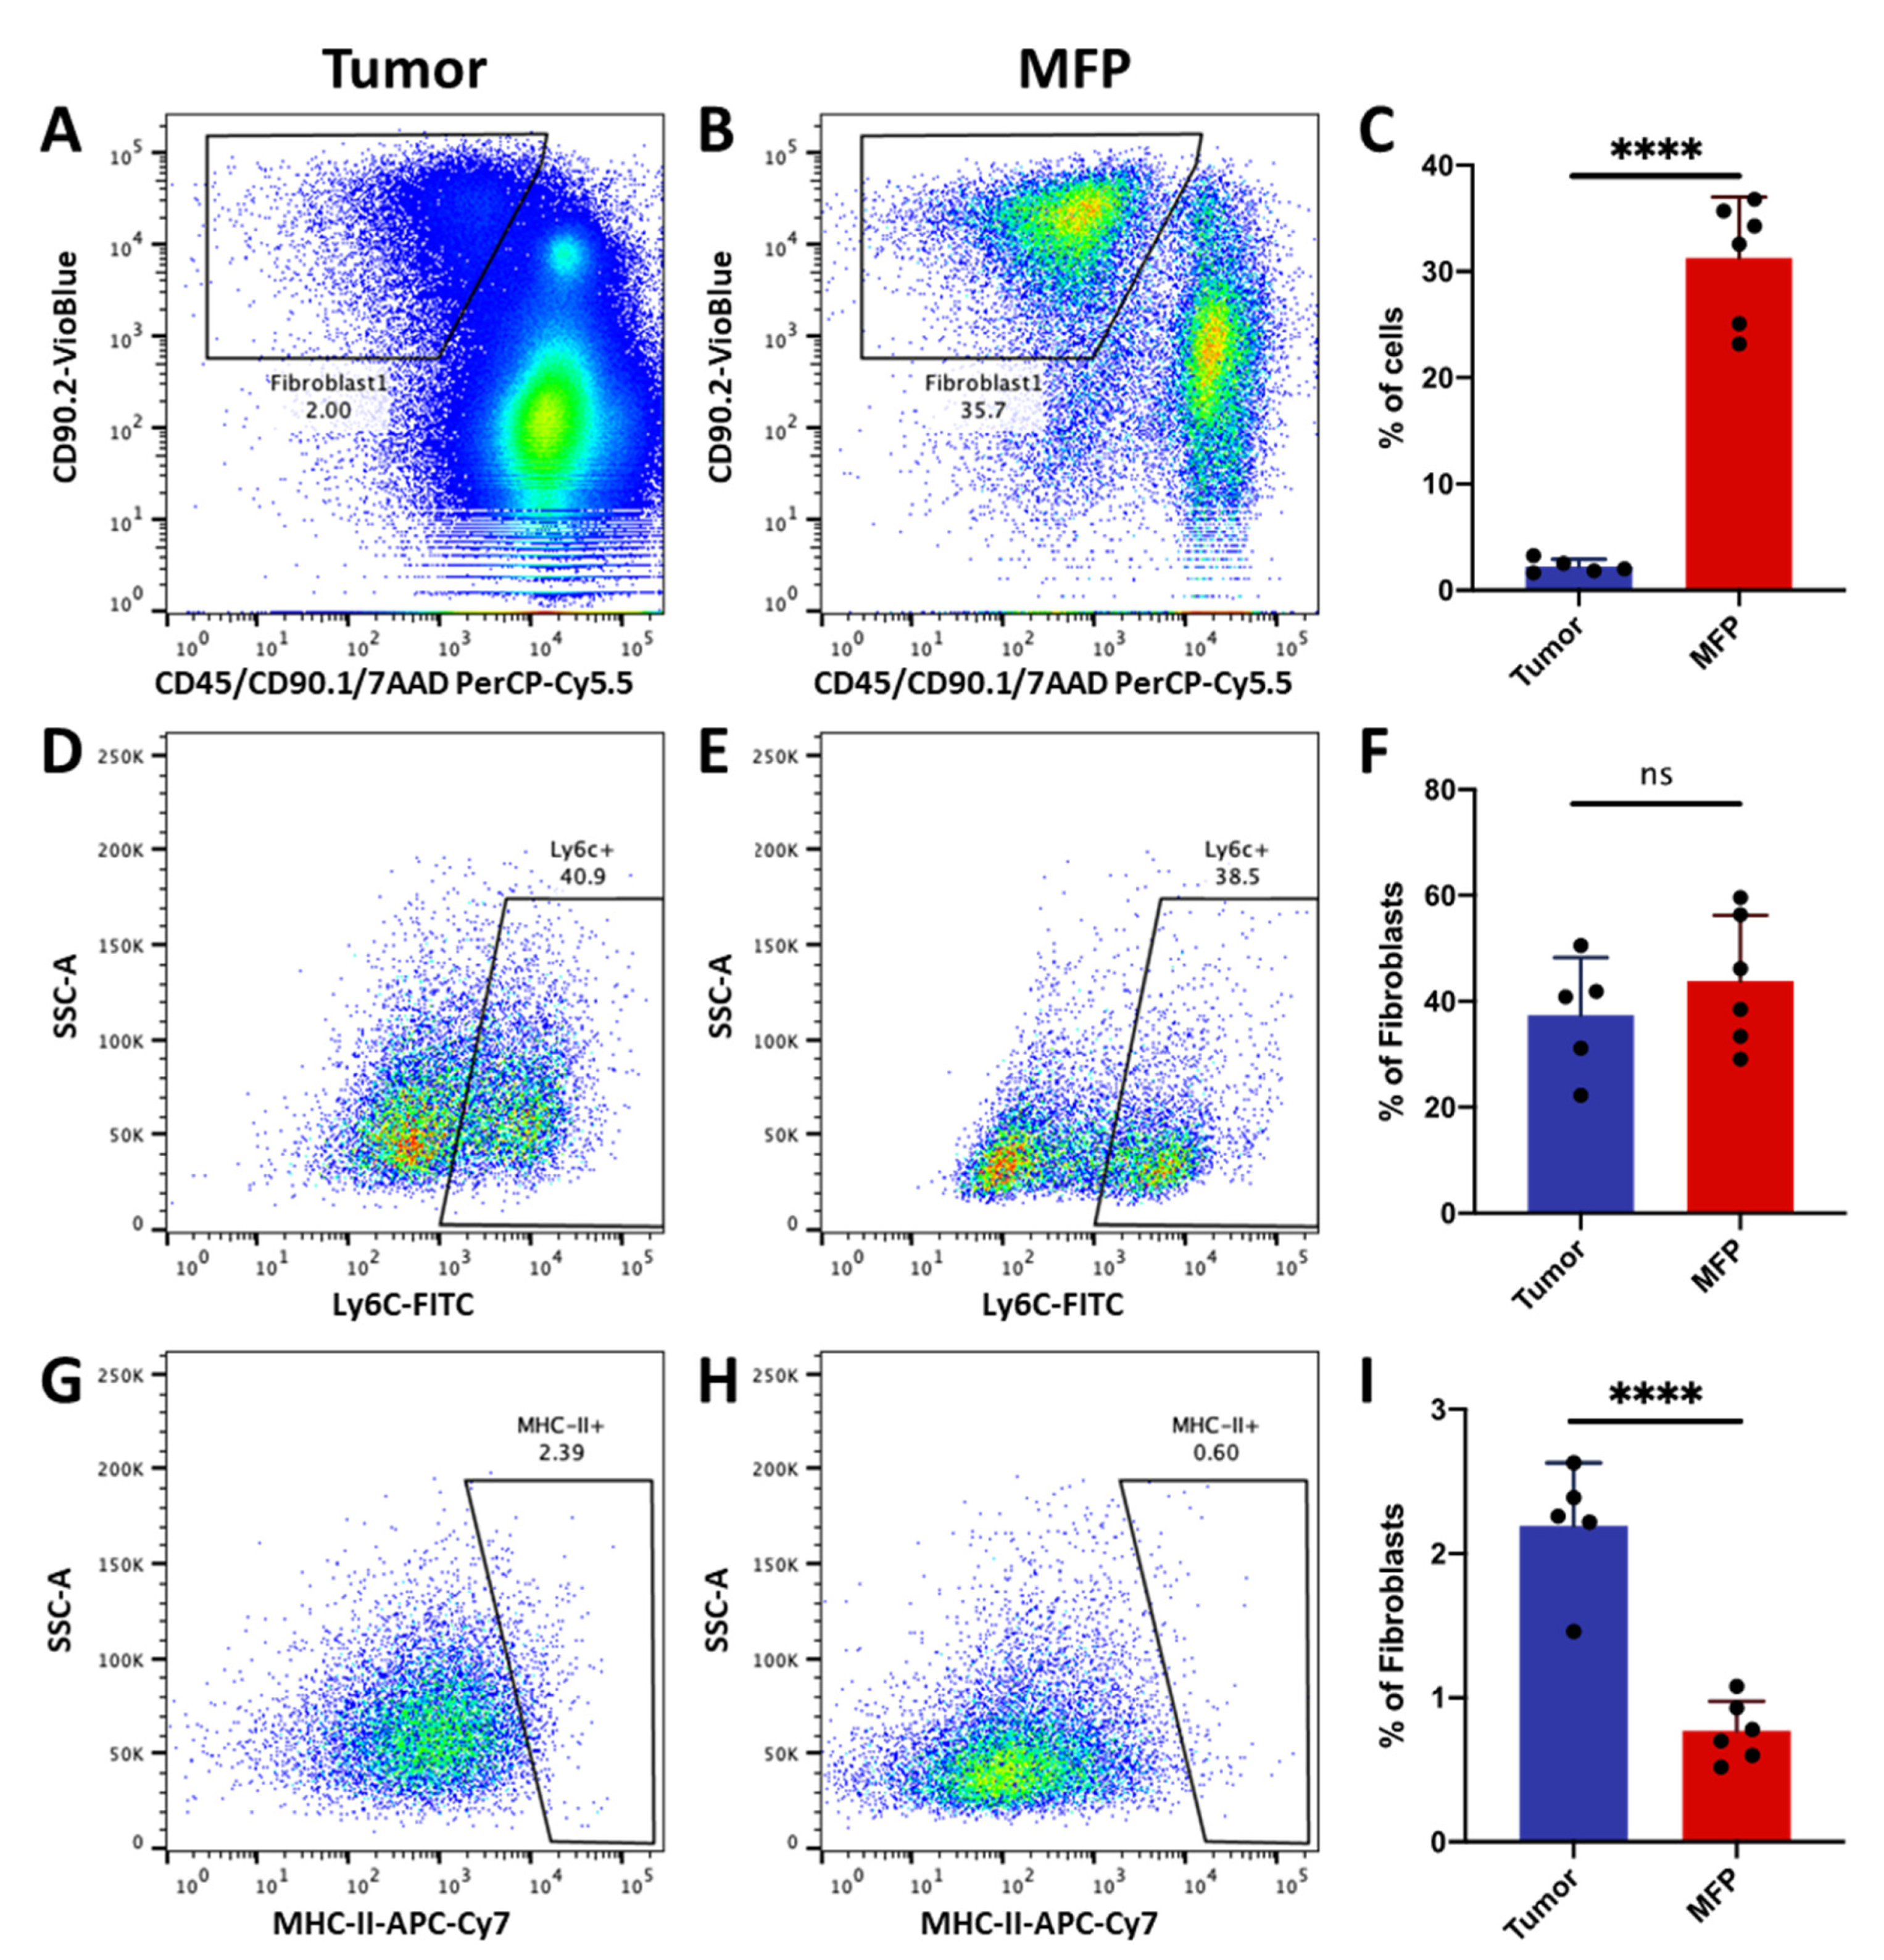
4.11. Flow Cytometric Analysis of Inflammatory and MHC Class II-Expressing Fibroblasts
5. Conclusions
Supplementary Materials
Author Contributions
Funding
Acknowledgments
Conflicts of Interest
References
- Zhang, W.; Huang, P. Cancer-stromal interactions: Role in cell survival, metabolism and drug sensitivity. Cancer Biol. Ther. 2011, 11, 150–156. [Google Scholar] [CrossRef] [PubMed] [Green Version]
- Werb, Z.; Lu, P. The Role of Stroma in Tumor Development. Cancer J. 2015, 21, 250–253. [Google Scholar] [CrossRef] [PubMed] [Green Version]
- Musa, M. Single-cell analysis on stromal fibroblasts in the microenvironment of solid tumours. Adv. Med. Sci. 2020, 65, 163–169. [Google Scholar] [CrossRef] [PubMed]
- Gandellini, P.; Andriani, F.; Merlino, G.; D’Aiuto, F.; Roz, L.; Callari, M. Complexity in the tumour microenvironment: Cancer associated fibroblast gene expression patterns identify both common and unique features of tumour-stroma crosstalk across cancer types. Semin. Cancer Biol. 2015, 35, 96–106. [Google Scholar] [CrossRef]
- Shiga, K.; Hara, M.; Nagasaki, T.; Sato, T.; Takahashi, H.; Takeyama, H. Cancer-Associated Fibroblasts: Their Characteristics and Their Roles in Tumor Growth. Cancers 2015, 7, 2443–2458. [Google Scholar] [CrossRef]
- Gascard, P.; Tlsty, T.D. Carcinoma-associated fibroblasts: Orchestrating the composition of malignancy. Genes Dev. 2016, 30, 1002–1019. [Google Scholar] [CrossRef]
- Cirri, P.; Chiarugi, P. Cancer associated fibroblasts: The dark side of the coin. Am. J. Cancer Res. 2011, 1, 482–497. [Google Scholar]
- Torre, L.A.; Islami, F.; Siegel, R.L.; Ward, E.M.; Jemal, A. Global Cancer in Women: Burden and Trends. Cancer Epidemiol. Biomark. Prev. 2017, 26, 444–457. [Google Scholar] [CrossRef] [Green Version]
- Podo, F.; Buydens, L.M.; Degani, H.; Hilhorst, R.; Klipp, E.; Gribbestad, I.S.; Van Huffel, S.; van Laarhoven, H.W.; Luts, J.; Monleon, D.; et al. Triple-negative breast cancer: Present challenges and new perspectives. Mol. Oncol. 2010, 4, 209–229. [Google Scholar] [CrossRef]
- Kumar, P.; Aggarwal, R. An overview of triple-negative breast cancer. Arch. Gynecol. Obstet. 2016, 293, 247–269. [Google Scholar] [CrossRef]
- Bauer, K.R.; Brown, M.; Cress, R.D.; Parise, C.A.; Caggiano, V. Descriptive analysis of estrogen receptor (ER)-negative, progesterone receptor (PR)-negative, and HER2-negative invasive breast cancer, the so-called triple-negative phenotype: A population-based study from the California cancer Registry. Cancer 2007, 109, 1721–1728. [Google Scholar] [CrossRef] [PubMed]
- Sugimoto, H.; Mundel, T.M.; Kieran, M.W.; Kalluri, R. Identification of fibroblast heterogeneity in the tumor microenvironment. Cancer Biol. Ther. 2006, 5, 1640–1646. [Google Scholar] [CrossRef] [PubMed] [Green Version]
- Ohlund, D.; Handly-Santana, A.; Biffi, G.; Elyada, E.; Almeida, A.S.; Ponz-Sarvise, M.; Corbo, V.; Oni, T.E.; Hearn, S.A.; Lee, E.J.; et al. Distinct populations of inflammatory fibroblasts and myofibroblasts in pancreatic cancer. J. Exp. Med. 2017, 214, 579–596. [Google Scholar] [CrossRef] [PubMed]
- Costa, A.; Kieffer, Y.; Scholer-Dahirel, A.; Pelon, F.; Bourachot, B.; Cardon, M.; Sirven, P.; Magagna, I.; Fuhrmann, L.; Bernard, C.; et al. Fibroblast Heterogeneity and Immunosuppressive Environment in Human Breast Cancer. Cancer Cell 2018, 33, 463–479.e10. [Google Scholar] [CrossRef] [PubMed] [Green Version]
- Elyada, E.; Bolisetty, M.; Laise, P.; Flynn, W.F.; Courtois, E.T.; Burkhart, R.A.; Teinor, J.A.; Belleau, P.; Biffi, G.; Lucito, M.S.; et al. Cross-Species Single-Cell Analysis of Pancreatic Ductal Adenocarcinoma Reveals Antigen-Presenting Cancer-Associated Fibroblasts. Cancer Discov. 2019, 9, 1102–1123. [Google Scholar] [CrossRef] [Green Version]
- Bartoschek, M.; Oskolkov, N.; Bocci, M.; Lovrot, J.; Larsson, C.; Sommarin, M.; Madsen, C.D.; Lindgren, D.; Pekar, G.; Karlsson, G.; et al. Spatially and functionally distinct subclasses of breast cancer-associated fibroblasts revealed by single cell RNA sequencing. Nat. Commun. 2018, 9, 1–13. [Google Scholar] [CrossRef] [Green Version]
- Gorchs, L.; Hellevik, T.; Bruun, J.A.; Camilio, K.A.; Al-Saad, S.; Stuge, T.B.; Martinez-Zubiaurre, I. Cancer-associated fibroblasts from lung tumors maintain their immunosuppressive abilities after high-dose irradiation. Front. Oncol. 2015, 5, 87. [Google Scholar] [CrossRef] [Green Version]
- Hu, C.; Wang, Z.; Zhai, L.; Yang, M.; Shan, L.; Chai, C.; Liu, M.; Wang, L. Effects of cancer-associated fibroblasts on the migration and invasion abilities of SGC-7901 gastric cancer cells. Oncol. Lett. 2013, 5, 609–612. [Google Scholar] [CrossRef] [Green Version]
- Nagasaki, T.; Hara, M.; Nakanishi, H.; Takahashi, H.; Sato, M.; Takeyama, H. Interleukin-6 released by colon cancer-associated fibroblasts is critical for tumour angiogenesis: Anti-interleukin-6 receptor antibody suppressed angiogenesis and inhibited tumour-stroma interaction. Br. J. Cancer 2014, 110, 469–478. [Google Scholar] [CrossRef] [Green Version]
- Tang, F.; Lao, K.; Surani, M.A. Development and applications of single-cell transcriptome analysis. Nat. Methods 2011, 8 (Suppl. 4), S6–S11. [Google Scholar] [CrossRef]
- Baslan, T.; Hicks, J. Unravelling biology and shifting paradigms in cancer with single-cell sequencing. Nat. Rev. Cancer 2017, 17, 557–569. [Google Scholar] [CrossRef] [PubMed]
- Hingorani, S.R.; Wang, L.; Multani, A.S.; Combs, C.; Deramaudt, T.B.; Hruban, R.H.; Rustgi, A.K.; Chang, S.; Tuveson, D.A. Trp53R172H and KrasG12D cooperate to promote chromosomal instability and widely metastatic pancreatic ductal adenocarcinoma in mice. Cancer Cell 2005, 7, 469–483. [Google Scholar] [CrossRef] [PubMed] [Green Version]
- Boj, S.F.; Hwang, C.I.; Baker, L.A.; Chio, I.I.; Engle, D.D.; Corbo, V.; Jager, M.; Ponz-Sarvise, M.; Tiriac, H.; Spector, M.S.; et al. Organoid models of human and mouse ductal pancreatic cancer. Cell 2015, 160, 324–338. [Google Scholar] [CrossRef] [PubMed] [Green Version]
- Butler, A.; Hoffman, P.; Smibert, P.; Papalexi, E.; Satija, R. Integrating single-cell transcriptomic data across different conditions, technologies, and species. Nat. Biotechnol. 2018, 36, 411–420. [Google Scholar] [CrossRef] [PubMed]
- Liu, T.; Han, C.; Wang, S.; Fang, P.; Ma, Z.; Xu, L.; Yin, R. Cancer-associated fibroblasts: An emerging target of anti-cancer immunotherapy. J. Hematol. Oncol. 2019, 12, 1–15. [Google Scholar] [CrossRef]
- Esteves, C.L.; Donadeu, F.X. Pericytes and their potential in regenerative medicine across species. Cytom. A 2018, 93, 50–59. [Google Scholar] [CrossRef] [Green Version]
- Shen, J.; Shrestha, S.; Yen, Y.H.; Scott, M.A.; Soo, C.; Ting, K.; Peault, B.; Dry, S.M.; James, A.W. The pericyte antigen RGS5 in perivascular soft tissue tumors. Hum. Pathol. 2016, 47, 121–131. [Google Scholar] [CrossRef] [Green Version]
- Liu, T.; Zhou, L.; Li, D.; Andl, T.; Zhang, Y. Cancer-Associated Fibroblasts Build and Secure the Tumor Microenvironment. Front. Cell Dev. Boil. 2019, 7, 60. [Google Scholar] [CrossRef] [Green Version]
- Canty, E.G.; Kadler, K.E. Procollagen trafficking, processing and fibrillogenesis. J. Cell Sci. 2005, 118 Pt 7, 1341–1353. [Google Scholar] [CrossRef] [Green Version]
- Trapnell, C.; Cacchiarelli, D.; Grimsby, J.; Pokharel, P.; Li, S.; Morse, M.; Lennon, N.J.; Livak, K.J.; Mikkelsen, T.S.; Rinn, J.L. The dynamics and regulators of cell fate decisions are revealed by pseudotemporal ordering of single cells. Nat. Biotechnol. 2014, 32, 381–386. [Google Scholar] [CrossRef] [Green Version]
- Lee, P.Y.; Wang, J.X.; Parisini, E.; Dascher, C.C.; Nigrovic, P.A. Ly6 family proteins in neutrophil biology. J. Leukoc. Biol. 2013, 94, 585–594. [Google Scholar] [CrossRef] [PubMed] [Green Version]
- Itano, N.; Sawai, T.; Atsumi, F.; Miyaishi, O.; Taniguchi, S.; Kannagi, R.; Hamaguchi, M.; Kimata, K. Selective expression and functional characteristics of three mammalian hyaluronan synthases in oncogenic malignant transformation. J. Biol. Chem. 2004, 279, 18679–18687. [Google Scholar] [CrossRef] [PubMed] [Green Version]
- Ansorge, H.L.; Meng, X.; Zhang, G.; Veit, G.; Sun, M.; Klement, J.F.; Beason, D.P.; Soslowsky, L.J.; Koch, M.; Birk, D.E. Type XIV Collagen Regulates Fibrillogenesis: Premature collagen fibril growth and tissue dysfunction in null mice. J. Biol. Chem. 2009, 284, 8427–8438. [Google Scholar] [CrossRef] [PubMed] [Green Version]
- Price, Z.K.; Lokman, N.A.; Ricciardelli, C. Differing Roles of Hyaluronan Molecular Weight on Cancer Cell Behavior and Chemotherapy Resistance. Cancers 2018, 10, 482. [Google Scholar] [CrossRef] [PubMed] [Green Version]
- Hu, X.; Li, Y.Q.; Li, Q.G.; Ma, Y.L.; Peng, J.J.; Cai, S.J. Osteoglycin (OGN) reverses epithelial to mesenchymal transition and invasiveness in colorectal cancer via EGFR/Akt pathway. J. Exp. Clin. Cancer Res. 2018, 37, 41. [Google Scholar] [CrossRef]
- Xu, T.; Zhang, R.; Dong, M.; Zhang, Z.; Li, H.; Zhan, C.; Li, X. Osteoglycin (OGN) Inhibits Cell Proliferation and Invasiveness in Breast Cancer via PI3K/Akt/mTOR Signaling Pathway. Onco Targets Ther. 2019, 12, 10639–10650. [Google Scholar] [CrossRef] [Green Version]
- Li, Y.; Gong, L.; Qi, R.; Sun, Q.; Xia, X.; He, H.; Ren, J.; Zhu, O.; Zhuo, D. Paeoniflorin suppresses pancreatic cancer cell growth by upregulating HTRA3 expression. Drug Des. Dev. Ther. 2017, 11, 2481–2491. [Google Scholar] [CrossRef] [Green Version]
- Hu, J.; Duan, B.; Jiang, W.; Fu, S.; Gao, H.; Lu, L. Epidermal growth factor-containing fibulin-like extracellular matrix protein 1 (EFEMP1) suppressed the growth of hepatocellular carcinoma cells by promoting Semaphorin 3B(SEMA3B). Cancer Med. 2019, 8, 3152–3166. [Google Scholar]
- Yin, X.; Fang, S.; Wang, M.; Wang, Q.; Fang, R.; Chen, J. EFEMP1 promotes ovarian cancer cell growth, invasion and metastasis via activated the AKT pathway. Oncotarget 2016, 7, 47938–47953. [Google Scholar] [CrossRef] [Green Version]
- Sarkar, A.; Chanda, A.; Regmi, S.C.; Karve, K.; Deng, L.; Jay, G.D.; Jirik, F.R.; Schmidt, T.A.; Bonni, S. Recombinant human PRG4 (rhPRG4) suppresses breast cancer cell invasion by inhibiting TGFbeta-Hyaluronan-CD44 signalling pathway. PLoS ONE 2019, 14, e0219697. [Google Scholar]
- Oikawa, K.; Mizusaki, A.; Takanashi, M.; Ozaki, T.; Sato, F.; Kuroda, M.; Muragaki, Y. PRG4 expression in myxoid liposarcoma maintains tumor cell growth through suppression of an antitumor cytokine IL-24. Biochem. Biophys. Res. Commun. 2017, 485, 209–214. [Google Scholar] [CrossRef] [PubMed]
- Hinz, B.; Phan, S.H.; Thannickal, V.J.; Galli, A.; Bochaton-Piallat, M.L.; Gabbiani, G. The myofibroblast: One function, multiple origins. Am. J. Pathol. 2007, 170, 1807–1816. [Google Scholar] [CrossRef] [PubMed]
- Guerrero-Juarez, C.F.; Dedhia, P.H.; Jin, S.; Ruiz-Vega, R.; Ma, D.; Liu, Y.; Yamaga, K.; Shestova, O.; Gay, D.L.; Yang, Z.; et al. Single-cell analysis reveals fibroblast heterogeneity and myeloid-derived adipocyte progenitors in murine skin wounds. Nat. Commun 2019, 10, 1–17. [Google Scholar] [CrossRef] [PubMed]
- Wendt, M.K.; Allington, T.M.; Schiemann, W.P. Mechanisms of the epithelial-mesenchymal transition by TGF-beta. Future Oncol. 2009, 5, 1145–1168. [Google Scholar] [CrossRef] [Green Version]
- Aguiar, D.P.; de Farias, G.C.; de Sousa, E.B.; de Mattos Coelho-Aguiar, J.; Lobo, J.C.; Casado, P.L.; Duarte, M.E.; Abreu, J.G., Jr. New strategy to control cell migration and metastasis regulated by CCN2/CTGF. Cancer Cell Int. 2014, 14, 61. [Google Scholar] [CrossRef] [Green Version]
- Nagy, J.A.; Dvorak, A.M.; Dvorak, H.F. VEGF-A and the induction of pathological angiogenesis. Annu. Rev. Pathol. 2007, 2, 251–275. [Google Scholar] [CrossRef]
- Dewerchin, M.; Carmeliet, P. Placental growth factor in cancer. Expert Opin. Ther. Targets 2014, 18, 1339–1354. [Google Scholar] [CrossRef]
- Zeng, R.; Huang, J.; Zhong, M.Z.; Li, L.; Yang, G.; Liu, L.; Wu, Y.; Yao, X.; Shi, J.; Wu, Z. Multiple Roles of WNT5A in Breast Cancer. Med. Sci. Monit. 2016, 22, 5058–5067. [Google Scholar] [CrossRef] [Green Version]
- Paulin, D.; Li, Z. Desmin: A major intermediate filament protein essential for the structural integrity and function of muscle. Exp. Cell Res. 2004, 301, 1–7. [Google Scholar] [CrossRef]
- Rick, J.W.; Chandra, A.; Dalle Ore, C.; Nguyen, A.T.; Yagnik, G.; Aghi, M.K. Fibronectin in malignancy: Cancer-specific alterations, protumoral effects, and therapeutic implications. Semin. Oncol. 2019, 46, 284–290. [Google Scholar] [CrossRef]
- Kumra, H.; Reinhardt, D.P. Fibronectin-targeted drug delivery in cancer. Adv. Drug Deliv. Rev. 2016, 97, 101–110. [Google Scholar] [CrossRef] [PubMed]
- Wang, J.P.; Hielscher, A. Fibronectin: How Its Aberrant Expression in Tumors May Improve Therapeutic Targeting. J. Cancer 2017, 8, 674–682. [Google Scholar] [CrossRef] [PubMed] [Green Version]
- Nangia-Makker, P.; Hogan, V.; Raz, A. Galectin-3 and cancer stemness. Glycobiology 2018, 28, 172–181. [Google Scholar] [CrossRef] [PubMed] [Green Version]
- Brauer, R.; Beck, I.M.; Roderfeld, M.; Roeb, E.; Sedlacek, R. Matrix metalloproteinase-19 inhibits growth of endothelial cells by generating angiostatin-like fragments from plasminogen. BMC Biochem. 2011, 12, 38. [Google Scholar] [CrossRef] [PubMed] [Green Version]
- Sharon, Y.; Alon, L.; Glanz, S.; Servais, C.; Erez, N. Isolation of normal and cancer-associated fibroblasts from fresh tissues by Fluorescence Activated Cell Sorting (FACS). J. Vis. Exp. 2013, 71, e4425. [Google Scholar] [CrossRef] [PubMed] [Green Version]
- Hosein, A.N.; Huang, H.; Wang, Z.; Parmar, K.; Du, W.; Huang, J.; Maitra, A.; Olson, E.; Verma, U.; Brekken, R.A. Cellular heterogeneity during mouse pancreatic ductal adenocarcinoma progression at single-cell resolution. JCI Insight 2019. [Google Scholar] [CrossRef] [Green Version]
- Li, H.; Courtois, E.T.; Sengupta, D.; Tan, Y.; Chen, K.H.; Goh, J.J.L.; Kong, S.L.; Chua, C.; Hon, L.K.; Tan, W.S.; et al. Reference component analysis of single-cell transcriptomes elucidates cellular heterogeneity in human colorectal tumors. Nat. Genet. 2017, 49, 708–718. [Google Scholar] [CrossRef]
- Evans, R.A.; Tian, Y.C.; Steadman, R.; Phillips, A.O. TGF-beta1-mediated fibroblast-myofibroblast terminal differentiation-the role of Smad proteins. Exp. Cell Res. 2003, 282, 90–100. [Google Scholar] [CrossRef]
- Biffi, G.; Oni, T.E.; Spielman, B.; Hao, Y.; Elyada, E.; Park, Y.; Preall, J.; Tuveson, D.A. IL1-Induced JAK/STAT Signaling Is Antagonized by TGFbeta to Shape CAF Heterogeneity in Pancreatic Ductal Adenocarcinoma. Cancer Discov. 2019, 9, 282–301. [Google Scholar] [CrossRef] [Green Version]
- Li, M.O.; Wan, Y.Y.; Sanjabi, S.; Robertson, A.K.; Flavell, R.A. Transforming growth factor-beta regulation of immune responses. Annu. Rev. Immunol. 2006, 24, 99–146. [Google Scholar] [CrossRef]
- Ozdemir, B.C.; Pentcheva-Hoang, T.; Carstens, J.L.; Zheng, X.; Wu, C.C.; Simpson, T.R.; Laklai, H.; Sugimoto, H.; Kahlert, C.; Novitskiy, S.V.; et al. Depletion of carcinoma-associated fibroblasts and fibrosis induces immunosuppression and accelerates pancreas cancer with reduced survival. Cancer Cell 2014, 25, 719–734. [Google Scholar] [CrossRef] [PubMed] [Green Version]
- Tsuyada, A.; Chow, A.; Wu, J.; Somlo, G.; Chu, P.; Loera, S.; Luu, T.; Li, A.X.; Wu, X.; Ye, W.; et al. CCL2 mediates cross-talk between cancer cells and stromal fibroblasts that regulates breast cancer stem cells. Cancer Res. 2012, 72, 2768–2779. [Google Scholar] [CrossRef] [PubMed] [Green Version]
- Zhang, J.; Chen, L.; Xiao, M.; Wang, C.; Qin, Z. FSP1+ fibroblasts promote skin carcinogenesis by maintaining MCP-1-mediated macrophage infiltration and chronic inflammation. Am. J. Pathol. 2011, 178, 382–390. [Google Scholar] [CrossRef] [PubMed]
- Shintani, Y.; Fujiwara, A.; Kimura, T.; Kawamura, T.; Funaki, S.; Minami, M.; Okumura, M. IL-6 Secreted from Cancer-Associated Fibroblasts Mediates Chemoresistance in NSCLC by Increasing Epithelial-Mesenchymal Transition Signaling. J. Thorac. Oncol. 2016, 11, 1482–1492. [Google Scholar] [CrossRef] [Green Version]
- Ebbing, E.A.; van der Zalm, A.P.; Steins, A.; Creemers, A.; Hermsen, S.; Rentenaar, R.; Klein, M.; Waasdorp, C.; Hooijer, G.K.J.; Meijer, S.L.; et al. Stromal-derived interleukin 6 drives epithelial-to-mesenchymal transition and therapy resistance in esophageal adenocarcinoma. Proc. Natl. Acad. Sci. USA 2019, 116, 2237–2242. [Google Scholar] [CrossRef] [Green Version]
- Sun, X.; Mao, Y.; Wang, J.; Zu, L.; Hao, M.; Cheng, G.; Qu, Q.; Cui, D.; Keller, E.T.; Chen, X.; et al. IL-6 secreted by cancer-associated fibroblasts induces tamoxifen resistance in luminal breast cancer. Oncogene 2014. [Google Scholar] [CrossRef]
- Wu, X.; Tao, P.; Zhou, Q.; Li, J.; Yu, Z.; Wang, X.; Li, J.; Li, C.; Yan, M.; Zhu, Z.; et al. IL-6 secreted by cancer-associated fibroblasts promotes epithelial-mesenchymal transition and metastasis of gastric cancer via JAK2/STAT3 signaling pathway. Oncotarget 2017, 8, 20741–20750. [Google Scholar] [CrossRef] [Green Version]
- Jeannin, P.; Duluc, D.; Delneste, Y. IL-6 and leukemia-inhibitory factor are involved in the generation of tumor-associated macrophage: Regulation by IFN-gamma. Immunotherapy 2011, 3 (Suppl. 4), 23–26. [Google Scholar] [CrossRef] [Green Version]
- Shen, J.X.; Liu, J.; Zhang, G.J. Interleukin-33 in Malignancies: Friends or Foes? Front. Immunol. 2018, 9, 3051. [Google Scholar] [CrossRef] [Green Version]
- Meng, W.; Xue, S.; Chen, Y. The role of CXCL12 in tumor microenvironment. Gene 2018, 641, 105–110. [Google Scholar] [CrossRef]
- Dominguez, C.X.; Muller, S.; Keerthivasan, S.; Koeppen, H.; Hung, J.; Gierke, S.; Breart, B.; Foreman, O.; Bainbridge, T.W.; Castiglioni, A.; et al. Single-Cell RNA Sequencing Reveals Stromal Evolution into LRRC15(+) Myofibroblasts as a Determinant of Patient Response to Cancer Immunotherapy. Cancer Discov. 2020, 10, 232–253. [Google Scholar] [CrossRef] [PubMed] [Green Version]
- Hum, N.R.; Sebastian, A.; Gilmore, S.F.; He, W.; Martin, K.A.; Hinckley, A.; Dubbin, K.R.; Moya, M.L.; Wheeler, E.K.; Coleman, M.A.; et al. Comparative Molecular Analysis of Cancer Behavior Cultured In Vitro, In Vivo, and Ex Vivo. Cancers 2020, 12, 690. [Google Scholar] [CrossRef] [PubMed] [Green Version]
- Sobral-Filho, R.G.; DeVorkin, L.; Macpherson, S.; Jirasek, A.; Lum, J.J.; Brolo, A.G. Ex Vivo Detection of Circulating Tumor Cells from Whole Blood by Direct Nanoparticle Visualization. ACS Nano 2018, 12, 1902–1909. [Google Scholar] [CrossRef] [PubMed]
- Stuart, T.; Butler, A.; Hoffman, P.; Hafemeister, C.; Papalexi, E.; Mauck, W.M., 3rd; Hao, Y.; Stoeckius, M.; Smibert, P.; Satija, R. Comprehensive Integration of Single-Cell Data. Cell 2019, 177, 1888–1902. [Google Scholar] [CrossRef] [PubMed]


© 2020 by the authors. Licensee MDPI, Basel, Switzerland. This article is an open access article distributed under the terms and conditions of the Creative Commons Attribution (CC BY) license (http://creativecommons.org/licenses/by/4.0/).
Share and Cite
Sebastian, A.; Hum, N.R.; Martin, K.A.; Gilmore, S.F.; Peran, I.; Byers, S.W.; Wheeler, E.K.; Coleman, M.A.; Loots, G.G. Single-Cell Transcriptomic Analysis of Tumor-Derived Fibroblasts and Normal Tissue-Resident Fibroblasts Reveals Fibroblast Heterogeneity in Breast Cancer. Cancers 2020, 12, 1307. https://doi.org/10.3390/cancers12051307
Sebastian A, Hum NR, Martin KA, Gilmore SF, Peran I, Byers SW, Wheeler EK, Coleman MA, Loots GG. Single-Cell Transcriptomic Analysis of Tumor-Derived Fibroblasts and Normal Tissue-Resident Fibroblasts Reveals Fibroblast Heterogeneity in Breast Cancer. Cancers. 2020; 12(5):1307. https://doi.org/10.3390/cancers12051307
Chicago/Turabian StyleSebastian, Aimy, Nicholas R. Hum, Kelly A. Martin, Sean F. Gilmore, Ivana Peran, Stephen W. Byers, Elizabeth K. Wheeler, Matthew A. Coleman, and Gabriela G. Loots. 2020. "Single-Cell Transcriptomic Analysis of Tumor-Derived Fibroblasts and Normal Tissue-Resident Fibroblasts Reveals Fibroblast Heterogeneity in Breast Cancer" Cancers 12, no. 5: 1307. https://doi.org/10.3390/cancers12051307