
Soft Tissue Sarcoma: An Insight on Biomarkers at Molecular, Metabolic and Cellular Level

 ,
, 
 , and
, and
Abstract
:Simple Summary
Abstract
1. Introduction
2. Molecular Markers Associated with Prognosis
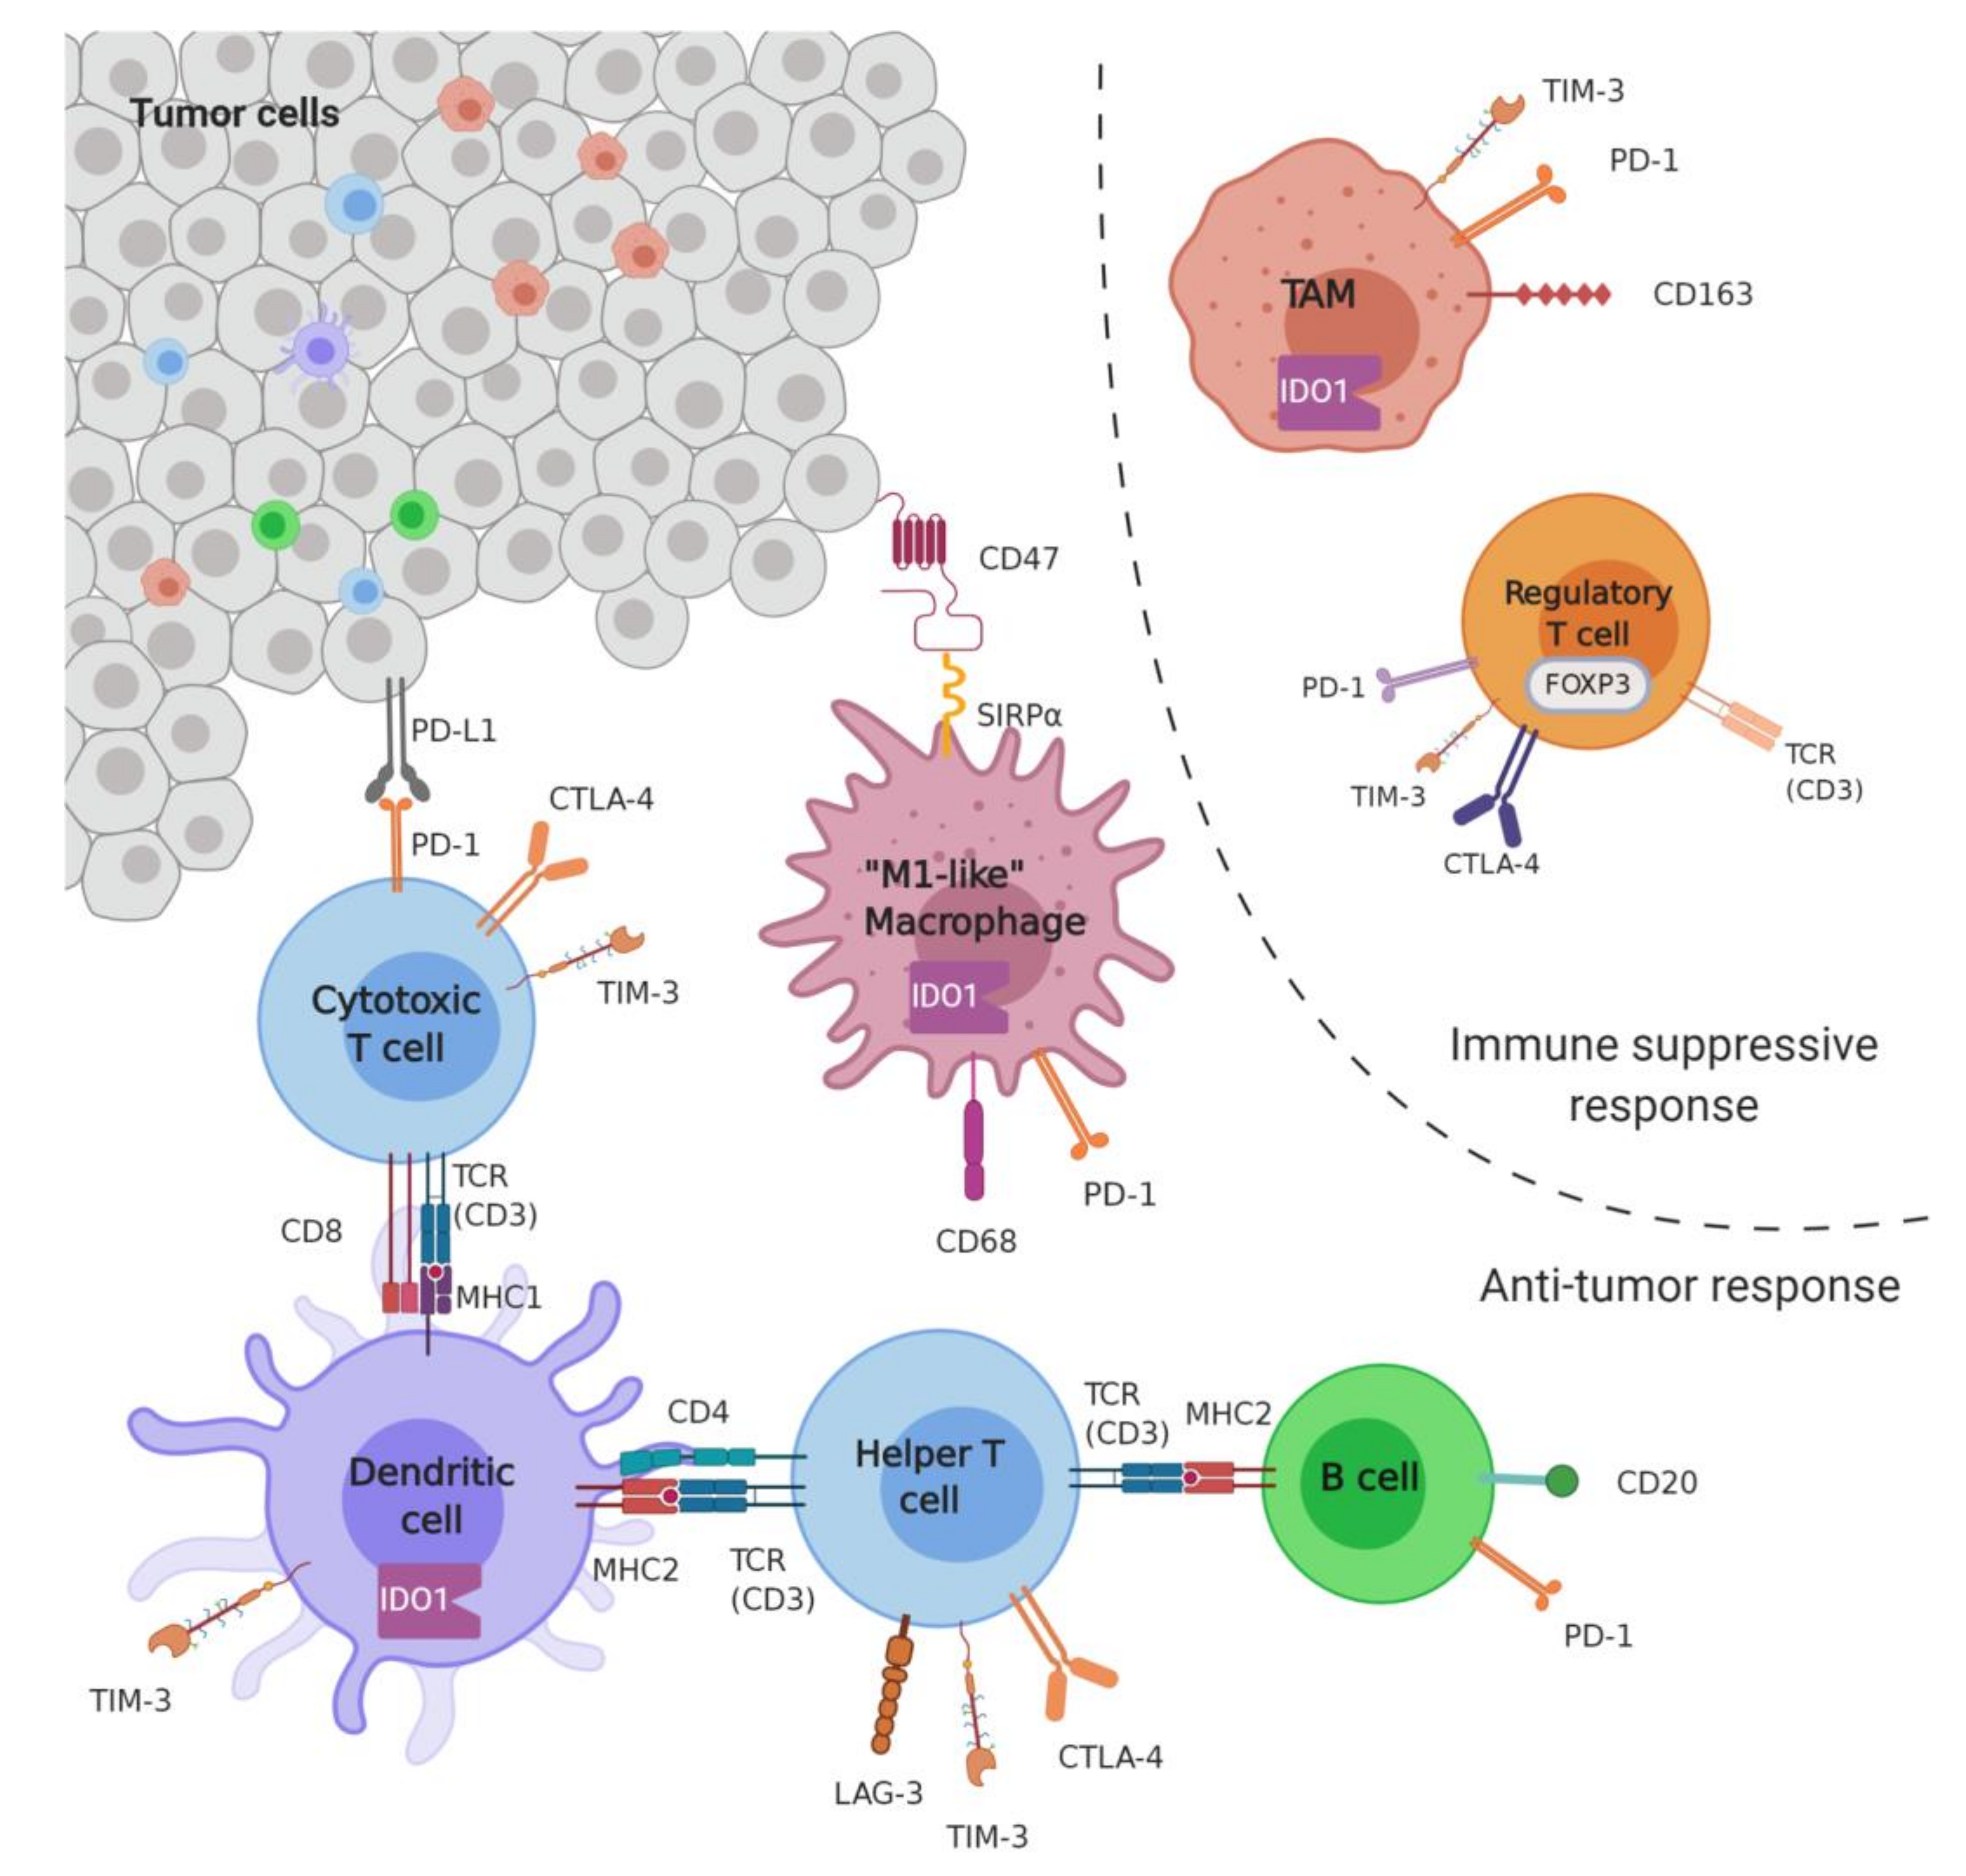
2.1. Microenvironment
2.1.1. Markers of Infiltration
B Cells
T Cells
Macrophages
2.1.2. Immune Checkpoints
PD1-PDL1
Others (IDO, LAG3, TIM3)
2.2. Genetics
2.2.1. Tumor Mutation Burden
2.2.2. Microsatellite Instability
2.2.3. Molecular Biomarkers
Tumor Suppressor Genes
Oncogenes
MicroRNA
Long Non-Coding RNA
Telomere-Maintenance Mechanism
3. Metabolite Biomarkers
4. Circulating Biomarkers
5. Biomarkers in Clinical Trials
6. Limitations
7. Future Perspectives and Conclusions
Author Contributions
Funding
Institutional Review Board Statement
Informed Consent Statement
Conflicts of Interest
References
- International Agency for Research on Cancer. WHO Classification of Tumours Editorial Board. Soft Tissue and Bone Tumours, 5th ed.; IARC: Lyon, France, 2020; Volume 3, ISBN 978-92-832-4502-5.
- Choi, J.H.; Ro, J.Y. The 2020 WHO Classification of Tumors of Soft Tissue: Selected Changes and New Entities. Adv. Anat. Pathol. 2021, 28, 44–58. [Google Scholar] [CrossRef] [PubMed]
- Trama, A.; Badalamenti, G.; Baldi, G.G.; Brunello, A.; Caira, M.; Drove, N.; Marrari, A.; Palmerini, E.; Vincenzi, B.; Dei Tos, A.P.; et al. Soft tissue sarcoma in Italy: From epidemiological data to clinical networking to improve patient care and outcomes. Cancer Epidemiol. 2019, 59, 258–264. [Google Scholar] [CrossRef] [PubMed]
- Ferrari, A.; Sultan, I.; Huang, T.T.; Rodriguez-Galindo, C.; Shehadeh, A.; Meazza, C.; Ness, K.K.; Casanova, M.; Spunt, S.L. Soft tissue sarcoma across the age spectrum: A population-based study from the Surveillance Epidemiology and End Results database. Pediatr. Blood Cancer 2011, 57, 943–949. [Google Scholar] [CrossRef] [Green Version]
- Blay, J.-Y.; Honoré, C.; Stoeckle, E.; Meeus, P.; Jafari, M.; Gouin, F.; Anract, P.; Ferron, G.; Rochwerger, A.; Ropars, M.; et al. Surgery in reference centers improves survival of sarcoma patients: A nationwide study. Ann. Oncol. Off. J. Eur. Soc. Med. Oncol. 2019, 30, 1143–1153. [Google Scholar] [CrossRef] [PubMed]
- Kleinerman, R.A.; Tucker, M.A.; Abramson, D.H.; Seddon, J.M.; Tarone, R.E.; Fraumeni, J.F., Jr. Risk of Soft Tissue Sarcomas by Individual Subtype in Survivors of Hereditary Retinoblastoma. JNCI J. Natl. Cancer Inst. 2007, 99, 24–31. [Google Scholar] [CrossRef]
- Italiano, A.; Bringer, S.; Blay, J.-Y.; Bonvalot, S.; Le Cesne, A.; Le Loarer, F.; Maingon, P. Patterns of Care and Outcome Radiation-Induced Soft Tissue Sarcomas. Int. J. Radiat. Oncol. Biol. Phys. 2019, 103, 449–452. [Google Scholar] [CrossRef] [PubMed]
- McClain, K.L.; Leach, C.T.; Jenson, H.B.; Joshi, V.V.; Pollock, B.H.; Parmley, R.T.; DiCarlo, F.J.; Chadwick, E.G.; Murphy, S.B. Association of Epstein-Barr virus with leiomyosarcomas in young people with AIDS. N. Engl. J. Med. 1995, 332, 12–18. [Google Scholar] [CrossRef]
- Viel, J.F.; Arveux, P.; Baverel, J.; Cahn, J.Y. Soft-tissue sarcoma and non-Hodgkin’s lymphoma clusters around a municipal solid waste incinerator with high dioxin emission levels. Am. J. Epidemiol. 2000, 152, 13–19. [Google Scholar] [CrossRef]
- Zambon, P.; Ricci, P.; Bovo, E.; Casula, A.; Gattolin, M.; Fiore, A.R.; Chiosi, F.; Guzzinati, S. Sarcoma risk and dioxin emissions from incinerators and industrial plants: A population-based case-control study (Italy). Environ. Health 2007, 6, 19. [Google Scholar] [CrossRef] [Green Version]
- Kabir, W.; Choong, P.F.M. The Epidemiology and Pathogenesis of Sarcoma BT—Sarcoma: A Practical Guide to Multidisciplinary Management; Choong, P.F.M., Ed.; Springer: Singapore, 2021; pp. 11–27. ISBN 978-981-15-9414-4. [Google Scholar]
- Casali, P.G.; Abecassis, N.; Aro, H.T.; Bauer, S.; Biagini, R.; Bielack, S.; Bonvalot, S.; Boukovinas, I.; Bovee, J.V.M.G.; Brodowicz, T.; et al. Soft tissue and visceral sarcomas: ESMO-EURACAN Clinical Practice Guidelines for diagnosis, treatment and follow-up. Ann. Oncol. Off. J. Eur. Soc. Med. Oncol. 2018, 29, iv51–iv67. [Google Scholar] [CrossRef]
- Abarca, T.; Gao, Y.; Monga, V.; Tanas, M.R.; Milhem, M.M.; Miller, B.J. Improved survival for extremity soft tissue sarcoma treated in high-volume facilities. J. Surg. Oncol. 2018, 117, 1479–1486. [Google Scholar] [CrossRef] [PubMed]
- Sarcoma Meta-Analysis Collaboration. Adjuvant chemotherapy for localised resectable soft-tissue sarcoma of adults: Meta-analysis of individual data. Lancet 1997, 350, 1647–1654. [Google Scholar] [CrossRef]
- Pervaiz, N.; Colterjohn, N.; Farrokhyar, F.; Tozer, R.; Figueredo, A.; Ghert, M. A systematic meta-analysis of randomized controlled trials of adjuvant chemotherapy for localized resectable soft-tissue sarcoma. Cancer 2008, 113, 573–581. [Google Scholar] [CrossRef]
- Gamboa, A.C.; Gronchi, A.; Cardona, K. Soft-tissue sarcoma in adults: An update on the current state of histiotype-specific management in an era of personalized medicine. CA. Cancer J. Clin. 2020, 70, 200–229. [Google Scholar] [CrossRef] [PubMed] [Green Version]
- Sharonov, G.V.; Serebrovskaya, E.O.; Yuzhakova, D.V.; Britanova, O.V.; Chudakov, D.M. B cells, plasma cells and antibody repertoires in the tumour microenvironment. Nat. Rev. Immunol. 2020, 20, 294–307. [Google Scholar] [CrossRef] [PubMed]
- Sorbye, S.W.; Kilvaer, T.; Valkov, A.; Donnem, T.; Smeland, E.; Al-Shibli, K.; Bremnes, R.M.; Busund, L.-T. Prognostic impact of lymphocytes in soft tissue sarcomas. PLoS ONE 2011, 6, e14611. [Google Scholar] [CrossRef] [PubMed] [Green Version]
- Tsagozis, P.; Augsten, M.; Zhang, Y.; Li, T.; Hesla, A.; Bergh, J.; Haglund, F.; Tobin, N.P.; Ehnman, M. An immunosuppressive macrophage profile attenuates the prognostic impact of CD20-positive B cells in human soft tissue sarcoma. Cancer Immunol. Immunother. 2019, 68, 927–936. [Google Scholar] [CrossRef] [PubMed] [Green Version]
- Lee, A.T.J.; Chew, W.; Wilding, C.P.; Guljar, N.; Smith, M.J.; Strauss, D.C.; Fisher, C.; Hayes, A.J.; Judson, I.; Thway, K.; et al. The adequacy of tissue microarrays in the assessment of inter- and intra-tumoural heterogeneity of infiltrating lymphocyte burden in leiomyosarcoma. Sci. Rep. 2019, 9, 14602. [Google Scholar] [CrossRef] [Green Version]
- Yan, L.; Wang, Z.; Cui, C.; Guan, X.; Dong, B.; Zhao, M.; Wu, J.; Tian, X.; Hao, C. Comprehensive immune characterization and T-cell receptor repertoire heterogeneity of retroperitoneal liposarcoma. Cancer Sci. 2019, 110, 3038–3048. [Google Scholar] [CrossRef] [Green Version]
- Kather, J.N.; Hörner, C.; Weis, C.-A.; Aung, T.; Vokuhl, C.; Weiss, C.; Scheer, M.; Marx, A.; Simon-Keller, K. CD163+ immune cell infiltrates and presence of CD54+ microvessels are prognostic markers for patients with embryonal rhabdomyosarcoma. Sci. Rep. 2019, 9, 9211. [Google Scholar] [CrossRef]
- Petitprez, F.; de Reyniès, A.; Keung, E.Z.; Chen, T.W.-W.; Sun, C.-M.; Calderaro, J.; Jeng, Y.-M.; Hsiao, L.-P.; Lacroix, L.; Bougoüin, A.; et al. B cells are associated with survival and immunotherapy response in sarcoma. Nature 2020, 577, 556–560. [Google Scholar] [CrossRef] [PubMed]
- Jochems, C.; Schlom, J. Tumor-infiltrating immune cells and prognosis: The potential link between conventional cancer therapy and immunity. Exp. Biol. Med. 2011, 236, 567–579. [Google Scholar] [CrossRef] [PubMed] [Green Version]
- Martin, F.; Ladoire, S.; Mignot, G.; Apetoh, L.; Ghiringhelli, F. Human FOXP3 and cancer. Oncogene 2010, 29, 4121–4129. [Google Scholar] [CrossRef] [PubMed] [Green Version]
- Budczies, J.; Mechtersheimer, G.; Denkert, C.; Klauschen, F.; Mughal, S.S.; Chudasama, P.; Bockmayr, M.; Jöhrens, K.; Endris, V.; Lier, A.; et al. PD-L1 (CD274) copy number gain, expression, and immune cell infiltration as candidate predictors for response to immune checkpoint inhibitors in soft-tissue sarcoma. Oncoimmunology 2017, 6, e1279777. [Google Scholar] [CrossRef] [PubMed] [Green Version]
- Zhu, M.M.T.; Shenasa, E.; Nielsen, T.O. Sarcomas: Immune biomarker expression and checkpoint inhibitor trials. Cancer Treat. Rev. 2020, 91, 102115. [Google Scholar] [CrossRef] [PubMed]
- Zheng, B.; Wang, J.; Cai, W.; Lao, I.; Shi, Y.; Luo, X.; Yan, W. Changes in the tumor immune microenvironment in resected recurrent soft tissue sarcomas. Ann. Transl. Med. 2019, 7, 387. [Google Scholar] [CrossRef]
- Van Erp, A.E.M.; Versleijen-Jonkers, Y.M.H.; Hillebrandt-Roeffen, M.H.S.; van Houdt, L.; Gorris, M.A.J.; van Dam, L.S.; Mentzel, T.; Weidema, M.E.; Savci-Heijink, C.D.; Desar, I.M.E.; et al. Expression and clinical association of programmed cell death-1, programmed death-ligand-1 and CD8(+) lymphocytes in primary sarcomas is subtype dependent. Oncotarget 2017, 8, 71371–71384. [Google Scholar] [CrossRef] [Green Version]
- Oike, N.; Kawashima, H.; Ogose, A.; Hotta, T.; Hatano, H.; Ariizumi, T.; Sasaki, T.; Yamagishi, T.; Umezu, H.; Endo, N. Prognostic impact of the tumor immune microenvironment in synovial sarcoma. Cancer Sci. 2018, 109, 3043–3054. [Google Scholar] [CrossRef] [Green Version]
- Berghuis, D.; Santos, S.J.; Baelde, H.J.; Taminiau, A.H.; Egeler, R.M.; Schilham, M.W.; Hogendoorn, P.C.; Lankester, A.C. Pro-inflammatory chemokine-chemokine receptor interactions within the Ewing sarcoma microenvironment determine CD8(+) T-lymphocyte infiltration and affect tumour progression. J. Pathol. 2011, 223, 347–357. [Google Scholar] [CrossRef]
- Fujii, H.; Arakawa, A.; Utsumi, D.; Sumiyoshi, S.; Yamamoto, Y.; Kitoh, A.; Ono, M.; Matsumura, Y.; Kato, M.; Konishi, K.; et al. CD8+ tumor-infiltrating lymphocytes at primary sites as a possible prognostic factor of cutaneous angiosarcoma. Int. J. Cancer 2014, 134, 2393–2402. [Google Scholar] [CrossRef] [Green Version]
- Klaver, Y.; Rijnders, M.; Oostvogels, A.; Wijers, R.; Smid, M.; Grünhagen, D.; Verhoef, C.; Sleijfer, S.; Lamers, C.; Debets, R. Differential quantities of immune checkpoint-expressing CD8 T cells in soft tissue sarcoma subtypes. J. Immunother. Cancer 2020, 8, e000271. [Google Scholar] [CrossRef]
- Raj, S.K.S.; Kooshki, M.; Winters, M.; Russell, G.B.; Miller, L.D.; Laurini, J.A.; Pierre, T.; Savage, P.D. Prognostic implications of tumor associated macrophages (TAMs) in soft tissue sarcoma. J. Clin. Oncol. 2019, 37, e22548. [Google Scholar] [CrossRef]
- Kuol, N.; Stojanovska, L.; Nurgali, K.; Apostolopoulos, V. PD-1/PD-L1 in disease. Immunotherapy 2018, 10, 149–160. [Google Scholar] [CrossRef]
- Zheng, B.; Ren, T.; Huang, Y.; Sun, K.; Wang, S.; Bao, X.; Liu, K.; Guo, W. PD-1 axis expression in musculoskeletal tumors and antitumor effect of nivolumab in osteosarcoma model of humanized mouse. J. Hematol. Oncol. 2018, 11, 16. [Google Scholar] [CrossRef] [PubMed] [Green Version]
- Torabi, A.; Amaya, C.N.; Wians, F.H.J.; Bryan, B.A. PD-1 and PD-L1 expression in bone and soft tissue sarcomas. Pathology 2017, 49, 506–513. [Google Scholar] [CrossRef]
- Kim, J.R.; Moon, Y.J.; Kwon, K.S.; Bae, J.S.; Wagle, S.; Kim, K.M.; Park, H.S.; Lee, H.; Moon, W.S.; Chung, M.J.; et al. Tumor infiltrating PD1-positive lymphocytes and the expression of PD-L1 predict poor prognosis of soft tissue sarcomas. PLoS ONE 2013, 8, e82870. [Google Scholar] [CrossRef]
- Kim, C.; Kim, E.K.; Jung, H.; Chon, H.J.; Han, J.W.; Shin, K.-H.; Hu, H.; Kim, K.S.; Choi, Y.D.; Kim, S.; et al. Prognostic implications of PD-L1 expression in patients with soft tissue sarcoma. BMC Cancer 2016, 16, 434. [Google Scholar] [CrossRef] [Green Version]
- Patel, K.R.; Martinez, A.; Stahl, J.M.; Logan, S.J.; Perricone, A.J.; Ferris, M.J.; Buchwald, Z.S.; Chowdhary, M.; Delman, K.A.; Monson, D.K.; et al. Increase in PD-L1 expression after pre-operative radiotherapy for soft tissue sarcoma. Oncoimmunology 2018, 7, e1442168. [Google Scholar] [CrossRef]
- Munn, D.H.; Sharma, M.D.; Hou, D.; Baban, B.; Lee, J.R.; Antonia, S.J.; Messina, J.L.; Chandler, P.; Koni, P.A.; Mellor, A.L. Expression of indoleamine 2,3-dioxygenase by plasmacytoid dendritic cells in tumor-draining lymph nodes. J. Clin. Investig. 2004, 114, 280–290. [Google Scholar] [CrossRef] [PubMed] [Green Version]
- Nafia, I.; Toulmonde, M.; Bortolotto, D.; Chaibi, A.; Bodet, D.; Rey, C.; Velasco, V.; Larmonier, C.B.; Cerf, L.; Adam, J.; et al. IDO Targeting in Sarcoma: Biological and Clinical Implications. Front. Immunol. 2020, 11, 274. [Google Scholar] [CrossRef] [PubMed]
- Friedlaender, A.; Addeo, A.; Banna, G. New emerging targets in cancer immunotherapy: The role of TIM3. ESMO Open 2019, 4, e000497. [Google Scholar] [CrossRef] [PubMed] [Green Version]
- Solinas, C.; Migliori, E.; De Silva, P.; Willard-Gallo, K. LAG3: The Biological Processes That Motivate Targeting This Immune Checkpoint Molecule in Human Cancer. Cancers 2019, 11, 1213. [Google Scholar] [CrossRef] [PubMed] [Green Version]
- Que, Y.; Fang, Z.; Guan, Y.; Xiao, W.; Xu, B.; Zhao, J.; Chen, H.; Zhang, X.; Zeng, M.; Liang, Y.; et al. LAG-3 expression on tumor-infiltrating T cells in soft tissue sarcoma correlates with poor survival. Cancer Biol. Med. 2019, 16, 331–340. [Google Scholar]
- Feng, M.; Jiang, W.; Kim, B.Y.S.; Zhang, C.C.; Fu, Y.-X.; Weissman, I.L. Phagocytosis checkpoints as new targets for cancer immunotherapy. Nat. Rev. Cancer 2019, 19, 568–586. [Google Scholar] [CrossRef] [PubMed]
- Dancsok, A.R.; Gao, D.; Lee, A.F.; Steigen, S.E.; Blay, J.-Y.; Thomas, D.M.; Maki, R.G.; Nielsen, T.O.; Demicco, E.G. Tumor-associated macrophages and macrophage-related immune checkpoint expression in sarcomas. Oncoimmunology 2020, 9, 1747340. [Google Scholar] [CrossRef] [PubMed] [Green Version]
- Goodman, A.M.; Kato, S.; Bazhenova, L.; Patel, S.P.; Frampton, G.M.; Miller, V.; Stephens, P.J.; Daniels, G.A.; Kurzrock, R. Tumor Mutational Burden as an Independent Predictor of Response to Immunotherapy in Diverse Cancers. Mol. Cancer Ther. 2017, 16, 2598–2608. [Google Scholar] [CrossRef] [Green Version]
- Comprehensive and Integrated Genomic Characterization of Adult Soft Tissue Sarcomas. Cell 2017, 171, 950–965.e28. [CrossRef] [Green Version]
- Xu, L.-B.; Zhao, Z.-G.; Xu, S.-F.; Zhang, X.-X.; Liu, T.; Jing, C.-Y.; Zhang, S.-G.; Yu, S.-J. The landscape of gene mutations and clinical significance of tumor mutation burden in patients with soft tissue sarcoma who underwent surgical resection and received conventional adjuvant therapy. Int. J. Biol. Markers 2020, 35, 14–22. [Google Scholar] [CrossRef]
- Chalmers, Z.R.; Connelly, C.F.; Fabrizio, D.; Gay, L.; Ali, S.M.; Ennis, R.; Schrock, A.; Campbell, B.; Shlien, A.; Chmielecki, J.; et al. Analysis of 100,000 human cancer genomes reveals the landscape of tumor mutational burden. Genome Med. 2017, 9, 34. [Google Scholar] [CrossRef]
- He, M.; Abro, B.; Kaushal, M.; Chen, L.; Chen, T.; Gondim, M.; Yan, W.; Neidich, J.; Dehner, L.P.; Pfeifer, J.D. Tumor mutation burden and checkpoint immunotherapy markers in primary and metastatic synovial sarcoma. Hum. Pathol. 2020, 100, 15–23. [Google Scholar] [CrossRef]
- Joseph, C.G.; Hwang, H.; Jiao, Y.; Wood, L.D.; Kinde, I.; Wu, J.; Mandahl, N.; Luo, J.; Hruban, R.H.; Diaz, L.A.J.; et al. Exomic analysis of myxoid liposarcomas, synovial sarcomas, and osteosarcomas. Genes. Chromosomes Cancer 2014, 53, 15–24. [Google Scholar] [CrossRef] [Green Version]
- Agelopoulos, K.; Richter, G.H.S.; Schmidt, E.; Dirksen, U.; von Heyking, K.; Moser, B.; Klein, H.-U.; Kontny, U.; Dugas, M.; Poos, K.; et al. Deep Sequencing in Conjunction with Expression and Functional Analyses Reveals Activation of FGFR1 in Ewing Sarcoma. Clin. Cancer Res. Off. J. Am. Assoc. Cancer Res. 2015, 21, 4935–4946. [Google Scholar] [CrossRef] [Green Version]
- Wooster, R.; Cleton-Jansen, A.M.; Collins, N.; Mangion, J.; Cornelis, R.S.; Cooper, C.S.; Gusterson, B.A.; Ponder, B.A.; von Deimling, A.; Wiestler, O.D. Instability of short tandem repeats (microsatellites) in human cancers. Nat. Genet. 1994, 6, 152–156. [Google Scholar] [CrossRef] [PubMed]
- Groisberg, R.; Roszik, J.; Conley, A.P.; Lazar, A.J.; Portal, D.E.; Hong, D.S.; Naing, A.; Herzog, C.E.; Somaiah, N.; Zarzour, M.A.; et al. Genomics, Morphoproteomics, and Treatment Patterns of Patients with Alveolar Soft Part Sarcoma and Response to Multiple Experimental Therapies. Mol. Cancer Ther. 2020, 19, 1165–1172. [Google Scholar] [CrossRef] [Green Version]
- Miquel, C.; Jacob, S.; Grandjouan, S.; Aimé, A.; Viguier, J.; Sabourin, J.-C.; Sarasin, A.; Duval, A.; Praz, F. Frequent alteration of DNA damage signalling and repair pathways in human colorectal cancers with microsatellite instability. Oncogene 2007, 26, 5919–5926. [Google Scholar] [CrossRef] [PubMed] [Green Version]
- Sinicrope, F.A.; Sargent, D.J. Molecular pathways: Microsatellite instability in colorectal cancer: Prognostic, predictive, and therapeutic implications. Clin. Cancer Res. Off. J. Am. Assoc. Cancer Res. 2012, 18, 1506–1512. [Google Scholar] [CrossRef] [PubMed] [Green Version]
- Rucińska, M.; Kozłowski, L.; Pepiński, W.; Skawrońska, M.; Janica, J.; Wojtukiewic, M.Z. High grade sarcomas are associated with microsatellite instability (chromosom 12) and loss of heterozygosity (chromosom 2). Med. Sci. Monit. Int. Med. J. Exp. Clin. Res. 2005, 11, BR65-8. [Google Scholar]
- Kawaguchi, K.-I.; Oda, Y.; Takahira, T.; Saito, T.; Yamamoto, H.; Kobayashi, C.; Tamiya, S.; Oda, S.; Iwamoto, Y.; Tsuneyoshi, M. Microsatellite instability and hMLH1 and hMSH2 expression analysis in soft tissue sarcomas. Oncol. Rep. 2005, 13, 241–246. [Google Scholar]
- Campanella, N.C.; Penna, V.; Ribeiro, G.; Abrahão-Machado, L.F.; Scapulatempo-Neto, C.; Reis, R.M. Absence of Microsatellite Instability in Soft Tissue Sarcomas. Pathobiology 2015, 82, 36–42. [Google Scholar] [CrossRef] [Green Version]
- Ranjan, A.; Iwakuma, T. Non-Canonical Cell Death Induced by p53. Int. J. Mol. Sci. 2016, 17, 2068. [Google Scholar] [CrossRef] [Green Version]
- Parrales, A.; Iwakuma, T. Targeting Oncogenic Mutant p53 for Cancer Therapy. Front. Oncol. 2015, 5, 288. [Google Scholar] [CrossRef] [Green Version]
- Oliner, J.D.; Pietenpol, J.A.; Thiagalingam, S.; Gyuris, J.; Kinzler, K.W.; Vogelstein, B. Oncoprotein MDM2 conceals the activation domain of tumour suppressor p53. Nature 1993, 362, 857–860. [Google Scholar] [CrossRef] [PubMed]
- Mariño-Enríquez, A.; Bovée, J.V.M.G. Molecular Pathogenesis and Diagnostic, Prognostic and Predictive Molecular Markers in Sarcoma. Surg. Pathol. Clin. 2016, 9, 457–473. [Google Scholar] [CrossRef] [PubMed] [Green Version]
- Ognjanovic, S.; Olivier, M.; Bergemann, T.L.; Hainaut, P. Sarcomas in TP53 germline mutation carriers: A review of the IARC TP53 database. Cancer 2012, 118, 1387–1396. [Google Scholar] [CrossRef] [PubMed]
- Nevins, J.R. The Rb/E2F pathway and cancer. Hum. Mol. Genet. 2001, 10, 699–703. [Google Scholar] [CrossRef] [PubMed]
- Kleinerman, R.A.; Schonfeld, S.J.; Tucker, M.A. Sarcomas in hereditary retinoblastoma. Clin. Sarcoma Res. 2012, 2, 15. [Google Scholar] [CrossRef] [PubMed] [Green Version]
- Korf, B.R. Neurofibromatosis. Handb. Clin. Neurol. 2013, 111, 333–340. [Google Scholar] [PubMed]
- Brems, H.; Beert, E.; de Ravel, T.; Legius, E. Mechanisms in the pathogenesis of malignant tumours in neurofibromatosis type 1. Lancet. Oncol. 2009, 10, 508–515. [Google Scholar] [CrossRef]
- Rodon, J.; Dienstmann, R.; Serra, V.; Tabernero, J. Development of PI3K inhibitors: Lessons learned from early clinical trials. Nat. Rev. Clin. Oncol. 2013, 10, 143–153. [Google Scholar] [CrossRef]
- Movva, S.; Wen, W.; Chen, W.; Millis, S.Z.; Gatalica, Z.; Reddy, S.; von Mehren, M.; Van Tine, B.A. Multi-platform profiling of over 2000 sarcomas: Identification of biomarkers and novel therapeutic targets. Oncotarget 2015, 6, 12234–12247. [Google Scholar] [CrossRef] [Green Version]
- Yin, L.; Liu, C.X.; Nong, W.X.; Chen, Y.Z.; Qi, Y.; Li, H.A.; Hu, W.H.; Sun, K.; Li, F. Mutational analysis of p53 and PTEN in soft tissue sarcoma. Mol. Med. Rep. 2012, 5, 457–461. [Google Scholar]
- Kourea, H.P.; Orlow, I.; Scheithauer, B.W.; Cordon-Cardo, C.; Woodruff, J.M. Deletions of the INK4A gene occur in malignant peripheral nerve sheath tumors but not in neurofibromas. Am. J. Pathol. 1999, 155, 1855–1860. [Google Scholar] [CrossRef] [Green Version]
- Berner, J.M.; Sørlie, T.; Mertens, F.; Henriksen, J.; Saeter, G.; Mandahl, N.; Brøgger, A.; Myklebost, O.; Lothe, R.A. Chromosome band 9p21 is frequently altered in malignant peripheral nerve sheath tumors: Studies of CDKN2A and other genes of the pRB pathway. Genes Chromosomes Cancer 1999, 26, 151–160. [Google Scholar] [CrossRef]
- Modena, P.; Lualdi, E.; Facchinetti, F.; Galli, L.; Teixeira, M.R.; Pilotti, S.; Sozzi, G. SMARCB1/INI1 tumor suppressor gene is frequently inactivated in epithelioid sarcomas. Cancer Res. 2005, 65, 4012–4019. [Google Scholar] [CrossRef] [Green Version]
- Davicioni, E.; Finckenstein, F.G.; Shahbazian, V.; Buckley, J.D.; Triche, T.J.; Anderson, M.J. Identification of a PAX-FKHR gene expression signature that defines molecular classes and determines the prognosis of alveolar rhabdomyosarcomas. Cancer Res. 2006, 66, 6936–6946. [Google Scholar] [CrossRef] [Green Version]
- Romualdi, C.; De Pittà, C.; Tombolan, L.; Bortoluzzi, S.; Sartori, F.; Rosolen, A.; Lanfranchi, G. Defining the gene expression signature of rhabdomyosarcoma by meta-analysis. BMC Genom. 2006, 7, 287. [Google Scholar] [CrossRef] [PubMed] [Green Version]
- Skapek, S.X.; Ferrari, A.; Gupta, A.A.; Lupo, P.J.; Butler, E.; Shipley, J.; Barr, F.G.; Hawkins, D.S. Rhabdomyosarcoma. Nat. Rev. Dis. Prim. 2019, 5, 1. [Google Scholar] [CrossRef] [PubMed]
- Nielsen, T.O.; West, R.B.; Linn, S.C.; Alter, O.; Knowling, M.A.; O’Connell, J.X.; Zhu, S.; Fero, M.; Sherlock, G.; Pollack, J.R.; et al. Molecular characterisation of soft tissue tumours: A gene expression study. Lancet 2002, 359, 1301–1307. [Google Scholar] [CrossRef]
- Allander, S.V.; Illei, P.B.; Chen, Y.; Antonescu, C.R.; Bittner, M.; Ladanyi, M.; Meltzer, P.S. Expression profiling of synovial sarcoma by cDNA microarrays: Association of ERBB2, IGFBP2, and ELF3 with epithelial differentiation. Am. J. Pathol. 2002, 161, 1587–1595. [Google Scholar] [CrossRef]
- Panagopoulos, I.; Mertens, F.; Isaksson, M.; Limon, J.; Gustafson, P.; Skytting, B.; Akerman, M.; Sciot, R.; Dal Cin, P.; Samson, I.; et al. Clinical impact of molecular and cytogenetic findings in synovial sarcoma. Genes Chromosomes Cancer 2001, 31, 362–372. [Google Scholar] [CrossRef]
- Shapiro, D.N.; Sublett, J.E.; Li, B.; Downing, J.R.; Naeve, C.W. Fusion of PAX3 to a Member of the Forkhead Family of Transcription Factors in Human Alveolar Rhabdomyosarcoma. Cancer Res. 1993, 53, 5108–5112. [Google Scholar]
- Sorensen, P.H.B.; Lynch, J.C.; Qualman, S.J.; Tirabosco, R.; Lim, J.F.; Maurer, H.M.; Bridge, J.A.; Crist, W.M.; Triche, T.J. Barr, alveolar rhabdomyosarcoma: A report from F.G. PAX3-FKHR and PAX7-FKHR gene fusions are prognostic indicators in the children’s oncology group. J. Clin. Oncol. Off. J. Am. Soc. Clin. Oncol. 2002, 20, 2672–2679. [Google Scholar] [CrossRef]
- Xie, Z.; Babiceanu, M.; Kumar, S.; Jia, Y.; Qin, F.; Barr, F.G.; Li, H. Fusion transcriptome profiling provides insights into alveolar rhabdomyosarcoma. Proc. Natl. Acad. Sci. USA 2016, 113, 13126–13131. [Google Scholar] [CrossRef] [PubMed] [Green Version]
- Xie, Z.; Tang, Y.; Su, X.; Cao, J.; Zhang, Y.; Li, H. PAX3-FOXO1 escapes miR-495 regulation during muscle differentiation. RNA Biol. 2019, 16, 144–153. [Google Scholar] [CrossRef] [PubMed] [Green Version]
- Vorburger, S.A.; Hunt, K.K. Experimental Approaches; Pollock, R.E., Ed.; BC Decker: Hamilton, ON, Canada, 2002. [Google Scholar]
- Jour, G.; Scarborough, J.D.; Jones, R.L.; Loggers, E.; Pollack, S.M.; Pritchard, C.C.; Hoch, B.L. Molecular profiling of soft tissue sarcomas using next-generation sequencing: A pilot study toward precision therapeutics. Hum. Pathol. 2014, 45, 1563–1571. [Google Scholar] [CrossRef] [PubMed]
- Ugras, S.; Brill, E.; Jacobsen, A.; Hafner, M.; Socci, N.D.; Decarolis, P.L.; Khanin, R.; O’Connor, R.; Mihailovic, A.; Taylor, B.S.; et al. Small RNA sequencing and functional characterization reveals MicroRNA-143 tumor suppressor activity in liposarcoma. Cancer Res. 2011, 71, 5659–5669. [Google Scholar] [CrossRef] [Green Version]
- Renner, M.; Czwan, E.; Hartmann, W.; Penzel, R.; Brors, B.; Eils, R.; Wardelmann, E.; Büttner, R.; Lichter, P.; Schirmacher, P.; et al. MicroRNA profiling of primary high-grade soft tissue sarcomas. Genes Chromosomes Cancer 2012, 51, 982–996. [Google Scholar] [CrossRef]
- Taylor, B.S.; DeCarolis, P.L.; Angeles, C.V.; Brenet, F.; Schultz, N.; Antonescu, C.R.; Scandura, J.M.; Sander, C.; Viale, A.J.; Socci, N.D.; et al. Frequent alterations and epigenetic silencing of differentiation pathway genes in structurally rearranged liposarcomas. Cancer Discov. 2011, 1, 587–597. [Google Scholar] [CrossRef] [Green Version]
- Fricke, A.; Cimniak, A.F.V.; Ullrich, P.V.; Becherer, C.; Bickert, C.; Pfeifer, D.; Heinz, J.; Stark, G.B.; Bannasch, H.; Braig, D.; et al. Whole blood miRNA expression analysis reveals miR-3613-3p as a potential biomarker for dedifferentiated liposarcoma. Cancer Biomark. 2018, 22, 199–207. [Google Scholar] [CrossRef]
- Zhang, P.; Bill, K.; Liu, J.; Young, E.; Peng, T.; Bolshakov, S.; Hoffman, A.; Song, Y.; Demicco, E.G.; Terrada, D.L.; et al. MiR-155 is a liposarcoma oncogene that targets casein kinase-1α and enhances β-catenin signaling. Cancer Res. 2012, 72, 1751–1762. [Google Scholar] [CrossRef] [Green Version]
- Borjigin, N.; Ohno, S.; Wu, W.; Tanaka, M.; Suzuki, R.; Fujita, K.; Takanashi, M.; Oikawa, K.; Goto, T.; Motoi, T.; et al. TLS-CHOP represses miR-486 expression, inducing upregulation of a metastasis regulator PAI-1 in human myxoid liposarcoma. Biochem. Biophys. Res. Commun. 2012, 427, 355–360. [Google Scholar] [CrossRef]
- Lee, D.H.; Amanat, S.; Goff, C.; Weiss, L.M.; Said, J.W.; Doan, N.B.; Sato-Otsubo, A.; Ogawa, S.; Forscher, C.; Koeffler, H.P. Overexpression of miR-26a-2 in human liposarcoma is correlated with poor patient survival. Oncogenesis 2013, 2, e47. [Google Scholar] [CrossRef] [Green Version]
- Ciarapica, R.; Russo, G.; Verginelli, F.; Raimondi, L.; Donfrancesco, A.; Rota, R.; Giordano, A. Deregulated expression of miR-26a and Ezh2 in rhabdomyosarcoma. Cell Cycle 2009, 8, 172–175. [Google Scholar] [CrossRef] [Green Version]
- Subramanian, S.; Lui, W.O.; Lee, C.H.; Espinosa, I.; Nielsen, T.O.; Heinrich, M.C.; Corless, C.L.; Fire, A.Z.; van de Rijn, M. MicroRNA expression signature of human sarcomas. Oncogene 2008, 27, 2015–2026. [Google Scholar] [CrossRef] [Green Version]
- Missiaglia, E.; Shepherd, C.J.; Patel, S.; Thway, K.; Pierron, G.; Pritchard-Jones, K.; Renard, M.; Sciot, R.; Rao, P.; Oberlin, O.; et al. MicroRNA-206 expression levels correlate with clinical behaviour of rhabdomyosarcomas. Br. J. Cancer 2010, 102, 1769–1777. [Google Scholar] [CrossRef] [Green Version]
- Armeanu-Ebinger, S.; Herrmann, D.; Bonin, M.; Leuschner, I.; Warmann, S.W.; Fuchs, J.; Seitz, G. Differential expression of miRNAs in rhabdomyosarcoma and malignant rhabdoid tumor. Exp. Cell Res. 2012, 318, 2567–2577. [Google Scholar] [CrossRef]
- Li, L.; Sarver, A.L.; Alamgir, S.; Subramanian, S. Downregulation of microRNAs miR-1, -206 and -29 stabilizes PAX3 and CCND2 expression in rhabdomyosarcoma. Lab. Investig. 2012, 92, 571–583. [Google Scholar] [CrossRef] [PubMed] [Green Version]
- Reichek, J.L.; Duan, F.; Smith, L.M.; Gustafson, D.M.; O’Connor, R.S.; Zhang, C.; Dunlevy, M.J.; Gastier-Foster, J.M.; Barr, F.G. Genomic and clinical analysis of amplification of the 13q31 chromosomal region in alveolar rhabdomyosarcoma: A report from the Children’s Oncology Group. Clin. Cancer Res. Off. J. Am. Assoc. Cancer Res. 2011, 17, 1463–1473. [Google Scholar] [CrossRef] [PubMed] [Green Version]
- Chen, C.-F.; He, X.; Arslan, A.D.; Mo, Y.-Y.; Reinhold, W.C.; Pommier, Y.; Beck, W.T. Novel regulation of nuclear factor-YB by miR-485-3p affects the expression of DNA topoisomerase IIα and drug responsiveness. Mol. Pharmacol. 2011, 79, 735–741. [Google Scholar] [CrossRef] [PubMed] [Green Version]
- Miyachi, M.; Tsuchiya, K.; Yoshida, H.; Yagyu, S.; Kikuchi, K.; Misawa, A.; Iehara, T.; Hosoi, H. Circulating muscle-specific microRNA, miR-206, as a potential diagnostic marker for rhabdomyosarcoma. Biochem. Biophys. Res. Commun. 2010, 400, 89–93. [Google Scholar] [CrossRef] [PubMed]
- Subramanian, S.; Thayanithy, V.; West, R.B.; Lee, C.-H.; Beck, A.H.; Zhu, S.; Downs-Kelly, E.; Montgomery, K.; Goldblum, J.R.; Hogendoorn, P.C.W.; et al. Genome-wide transcriptome analyses reveal p53 inactivation mediated loss of miR-34a expression in malignant peripheral nerve sheath tumours. J. Pathol. 2010, 220, 58–70. [Google Scholar] [CrossRef] [PubMed] [Green Version]
- Nuovo, G.J.; Schmittgen, T.D. Benign metastasizing leiomyoma of the lung: Clinicopathologic, immunohistochemical, and micro-RNA analyses. Diagn. Mol. Pathol. 2008, 17, 145–150. [Google Scholar] [CrossRef] [Green Version]
- Guled, M.; Pazzaglia, L.; Borze, I.; Mosakhani, N.; Novello, C.; Benassi, M.S.; Knuutila, S. Differentiating soft tissue leiomyosarcoma and undifferentiated pleomorphic sarcoma: A miRNA analysis. Genes Chromosomes Cancer 2014, 53, 693–702. [Google Scholar] [CrossRef] [PubMed]
- Sarver, A.L.; Phalak, R.; Thayanithy, V.; Subramanian, S. S-MED: Sarcoma microRNA expression database. Lab. Invest. 2010, 90, 753–761. [Google Scholar] [CrossRef] [PubMed] [Green Version]
- Fricke, A.; Ullrich, P.V.; Heinz, J.; Pfeifer, D.; Scholber, J.; Herget, G.W.; Hauschild, O.; Bronsert, P.; Stark, G.B.; Bannasch, H.; et al. Identification of a blood-borne miRNA signature of synovial sarcoma. Mol. Cancer 2015, 14, 151. [Google Scholar] [CrossRef] [Green Version]
- Presneau, N.; Eskandarpour, M.; Shemais, T.; Henderson, S.; Halai, D.; Tirabosco, R.; Flanagan, A.M. MicroRNA profiling of peripheral nerve sheath tumours identifies miR-29c as a tumour suppressor gene involved in tumour progression. Br. J. Cancer 2013, 108, 964–972. [Google Scholar] [CrossRef] [Green Version]
- Lee, Y.-B.; Bantounas, I.; Lee, D.-Y.; Phylactou, L.; Caldwell, M.A.; Uney, J.B. Twist-1 regulates the miR-199a/214 cluster during development. Nucleic Acids Res. 2009, 37, 123–128. [Google Scholar] [CrossRef] [Green Version]
- Gong, M.; Ma, J.; Li, M.; Zhou, M.; Hock, J.M.; Yu, X. MicroRNA-204 critically regulates carcinogenesis in malignant peripheral nerve sheath tumors. Neuro-Oncology 2012, 14, 1007–1017. [Google Scholar] [CrossRef] [Green Version]
- Zhang, P.; Garnett, J.; Creighton, C.J.; Al Sannaa, G.A.; Igram, D.R.; Lazar, A.; Liu, X.; Liu, C.; Pollock, R.E. EZH2-miR-30d-KPNB1 pathway regulates malignant peripheral nerve sheath tumour cell survival and tumourigenesis. J. Pathol. 2014, 232, 308–318. [Google Scholar] [CrossRef] [PubMed] [Green Version]
- Italiano, A.; Thomas, R.; Breen, M.; Zhang, L.; Crago, A.M.; Singer, S.; Khanin, R.; Maki, R.G.; Mihailovic, A.; Hafner, M.; et al. The miR-17-92 cluster and its target THBS1 are differentially expressed in angiosarcomas dependent on MYC amplification. Genes Chromosomes Cancer 2012, 51, 569–578. [Google Scholar] [CrossRef] [PubMed]
- Kim, J.H.; Jeon, S.; Shin, B.A. MicroRNA-29 Family Suppresses the Invasion of HT1080 Human Fibrosarcoma Cells by Regulating Matrix Metalloproteinase 2 Expression. Chonnam Med. J. 2017, 53, 161–167. [Google Scholar] [CrossRef] [PubMed] [Green Version]
- Liu, P.; Wilson, M.J. miR-520c and miR-373 upregulate MMP9 expression by targeting mTOR and SIRT1, and activate the Ras/Raf/MEK/Erk signaling pathway and NF-κB factor in human fibrosarcoma cells. J. Cell. Physiol. 2012, 227, 867–876. [Google Scholar] [CrossRef] [PubMed] [Green Version]
- Wong, P.; Hui, A.; Su, J.; Yue, S.; Haibe-Kains, B.; Gokgoz, N.; Xu, W.; Bruce, J.; Williams, J.; Catton, C.; et al. Prognostic microRNAs modulate the RHO adhesion pathway: A potential therapeutic target in undifferentiated pleomorphic sarcomas. Oncotarget 2015, 6, 39127–39139. [Google Scholar] [CrossRef] [PubMed] [Green Version]
- Papp, G.; Krausz, T.; Stricker, T.P.; Szendrői, M.; Sápi, Z. SMARCB1 expression in epithelioid sarcoma is regulated by miR-206, miR-381, and miR-671-5p on Both mRNA and protein levels. Genes Chromosomes Cancer 2014, 53, 168–176. [Google Scholar] [CrossRef] [PubMed]
- O’Hara, A.J.; Wang, L.; Dezube, B.J.; Harrington, W.J.J.; Damania, B.; Dittmer, D.P. Tumor suppressor microRNAs are underrepresented in primary effusion lymphoma and Kaposi sarcoma. Blood 2009, 113, 5938–5941. [Google Scholar] [CrossRef] [PubMed] [Green Version]
- Wu, Y.-H.; Hu, T.-F.; Chen, Y.-C.; Tsai, Y.-N.; Tsai, Y.-H.; Cheng, C.-C.; Wang, H.-W. The manipulation of miRNA-gene regulatory networks by KSHV induces endothelial cell motility. Blood 2011, 118, 2896–2905. [Google Scholar] [CrossRef] [PubMed]
- O’Hara, A.J.; Chugh, P.; Wang, L.; Netto, E.M.; Luz, E.; Harrington, W.J., Jr.; Dezube, B.J.; Damania, B.; Dittmer, D.P. Pre-Micro RNA Signatures Delineate Stages of Endothelial Cell Transformation in Kaposi Sarcoma. PLoS Pathog. 2009, 5, e1000389. [Google Scholar] [CrossRef] [PubMed]
- Greither, T.; Würl, P.; Grochola, L.; Bond, G.; Bache, M.; Kappler, M.; Lautenschläger, C.; Holzhausen, H.-J.; Wach, S.; Eckert, A.W.; et al. Expression of microRNA 210 associates with poor survival and age of tumor onset of soft-tissue sarcoma patients. Int. J. Cancer 2012, 130, 1230–1235. [Google Scholar] [CrossRef]
- Bao, X.; Ren, T.; Huang, Y.; Sun, K.; Wang, S.; Liu, K.; Zheng, B.; Guo, W. Knockdown of long non-coding RNA HOTAIR increases miR-454-3p by targeting Stat3 and Atg12 to inhibit chondrosarcoma growth. Cell Death Dis. 2017, 8, e2605. [Google Scholar] [CrossRef]
- Shao, Y.; Zhang, Y.; Hou, Y.; Tong, H.; Zhuang, R.; Ji, Z.; Wang, B.; Zhou, Y.; Lu, W. A novel long noncoding RNA PILRLS promote proliferation through TCL1A by activing MDM2 in Retroperitoneal liposarcoma. Oncotarget 2017, 8, 13971–13978. [Google Scholar] [CrossRef] [Green Version]
- He, R.-Q.; Wei, Q.-J.; Tang, R.-X.; Chen, W.-J.; Yang, X.; Peng, Z.-G.; Hu, X.-H.; Ma, J.; Chen, G. Prediction of clinical outcome and survival in soft-tissue sarcoma using a ten-lncRNA signature. Oncotarget 2017, 8, 80336–80347. [Google Scholar] [CrossRef] [PubMed] [Green Version]
- Barthel, F.P.; Wei, W.; Tang, M.; Martinez-Ledesma, E.; Hu, X.; Amin, S.B.; Akdemir, K.C.; Seth, S.; Song, X.; Wang, Q.; et al. Systematic analysis of telomere length and somatic alterations in 31 cancer types. Nat. Genet. 2017, 49, 349–357. [Google Scholar] [CrossRef] [PubMed]
- Koelsche, C.; Renner, M.; Hartmann, W.; Brandt, R.; Lehner, B.; Waldburger, N.; Alldinger, I.; Schmitt, T.; Egerer, G.; Penzel, R.; et al. TERT promoter hotspot mutations are recurrent in myxoid liposarcomas but rare in other soft tissue sarcoma entities. J. Exp. Clin. Cancer Res. 2014, 33, 33. [Google Scholar] [CrossRef] [Green Version]
- Dubbink, H.J.; Bakels, H.; Post, E.; Zwarthoff, E.C.; Verdijk, R.M. TERT promoter mutations and BRAF mutations are rare in sporadic, and TERT promoter mutations are absent in NF1-related malignant peripheral nerve sheath tumors. J. Neuro Oncol. 2014, 120, 267–272. [Google Scholar] [CrossRef]
- Castelo-Branco, P.; Leão, R.; Lipman, T.; Campbell, B.; Lee, D.; Price, A.; Zhang, C.; Heidari, A.; Stephens, D.; Boerno, S.; et al. A cancer specific hypermethylation signature of the TERT promoter predicts biochemical relapse in prostate cancer: A retrospective cohort study. Oncotarget 2016, 7, 57726–57736. [Google Scholar] [CrossRef] [Green Version]
- Yoo, J.; Robinson, R.A. Expression of telomerase activity and telomerase RNA in human soft tissue sarcomas. Arch. Pathol. Lab. Med. 2000, 124, 393–397. [Google Scholar] [CrossRef]
- Bryan, T.M.; Englezou, A.; Dalla-Pozza, L.; Dunham, M.A.; Reddel, R.R. Evidence for an alternative mechanism for maintaining telomere length in human tumors and tumor-derived cell lines. Nat. Med. 1997, 3, 1271–1274. [Google Scholar] [CrossRef] [PubMed]
- Costa, A.; Daidone, M.G.; Daprai, L.; Villa, R.; Cantù, S.; Pilotti, S.; Mariani, L.; Gronchi, A.; Henson, J.D.; Reddel, R.R.; et al. Telomere maintenance mechanisms in liposarcomas: Association with histologic subtypes and disease progression. Cancer Res. 2006, 66, 8918–8924. [Google Scholar] [CrossRef] [PubMed] [Green Version]
- Henson, J.D.; Hannay, J.A.; McCarthy, S.W.; Royds, J.A.; Yeager, T.R.; Robinson, R.A.; Wharton, S.B.; Jellinek, D.A.; Arbuckle, S.M.; Yoo, J.; et al. A robust assay for alternative lengthening of telomeres in tumors shows the significance of alternative lengthening of telomeres in sarcomas and astrocytomas. Clin. Cancer Res. Off. J. Am. Assoc. Cancer Res. 2005, 11, 217–225. [Google Scholar]
- Heaphy, C.M.; Subhawong, A.P.; Hong, S.-M.; Goggins, M.G.; Montgomery, E.A.; Gabrielson, E.; Netto, G.J.; Epstein, J.I.; Lotan, T.L.; Westra, W.H.; et al. Prevalence of the alternative lengthening of telomeres telomere maintenance mechanism in human cancer subtypes. Am. J. Pathol. 2011, 179, 1608–1615. [Google Scholar] [CrossRef]
- Liau, J.-Y.; Tsai, J.-H.; Yang, C.-Y.; Lee, J.-C.; Liang, C.-W.; Hsu, H.-H.; Jeng, Y.-M. Alternative lengthening of telomeres phenotype in malignant vascular tumors is highly associated with loss of ATRX expression and is frequently observed in hepatic angiosarcomas. Hum. Pathol. 2015, 46, 1360–1366. [Google Scholar] [CrossRef] [PubMed]
- Liau, J.-Y.; Tsai, J.-H.; Jeng, Y.-M.; Lee, J.-C.; Hsu, H.-H.; Yang, C.-Y. Leiomyosarcoma with alternative lengthening of telomeres is associated with aggressive histologic features, loss of ATRX expression, and poor clinical outcome. Am. J. Surg. Pathol. 2015, 39, 236–244. [Google Scholar] [CrossRef] [PubMed]
- Steele, C.D.; Tarabichi, M.; Oukrif, D.; Webster, A.P.; Ye, H.; Fittall, M.; Lombard, P.; Martincorena, I.; Tarpey, P.S.; Collord, G.; et al. Undifferentiated Sarcomas Develop through Distinct Evolutionary Pathways. Cancer Cell 2019, 35, 441–456.e8. [Google Scholar] [CrossRef] [PubMed] [Green Version]
- Miolo, G.; Di Gregorio, E.; Saorin, A.; Lombardi, D.; Scalone, S.; Buonadonna, A.; Steffan, A.; Corona, G. Integration of serum metabolomics into clinical assessment to improve outcome prediction of metastatic soft tissue sarcoma patients treated with trabectedin. Cancers 2020, 12, 1983. [Google Scholar] [CrossRef]
- Kowalczyk, T.; Ciborowski, M.; Kisluk, J.; Kretowski, A.; Barbas, C. Mass spectrometry based proteomics and metabolomics in personalized oncology. Biochim. Biophys. Acta Mol. Basis Dis. 2020, 1866, 165690. [Google Scholar] [CrossRef]
- Wishart, D.S. Metabolomics for investigating physiological and pathophysiological processes. Physiol. Rev. 2019, 99, 1819–1875. [Google Scholar] [CrossRef]
- Corona, G.; Rizzolio, F.; Giordano, A.; Toffoli, G. Pharmaco-metabolomics: An emerging “omics” tool for the personalization of anticancer treatments and identification of new valuable therapeutic targets. J. Cell. Physiol. 2012, 227, 2827–2831. [Google Scholar] [CrossRef]
- Wishart, D.S.; Feunang, Y.D.; Marcu, A.; Guo, A.C.; Liang, K.; Vázquez-Fresno, R.; Sajed, T.; Johnson, D.; Li, C.; Karu, N.; et al. HMDB 4.0: The human metabolome database for 2018. Nucleic Acids Res. 2018, 46, D608–D617. [Google Scholar] [CrossRef]
- Ulrich, E.L.; Akutsu, H.; Doreleijers, J.F.; Harano, Y.; Ioannidis, Y.E.; Lin, J.; Livny, M.; Mading, S.; Maziuk, D.; Miller, Z.; et al. BioMagResBank. Nucleic Acids Res. 2008, 36, D402–D408. [Google Scholar] [CrossRef] [Green Version]
- SDBS. Spectral Database for Organic Compounds. Available online: https://sdbs.db.aist.go.jp/sdbs/cgi-bin/cre_index.cgi (accessed on 14 May 2021).
- Chenomx. Chenomx NMR Suite 7.0 (Chenomx, Edmonton, Canada). Available online: https://www.chenomx.com/ (accessed on 14 May 2021).
- BBIOREFCODE. Metabolite Reference Database. Available online: https://www.bruker.com/en/products-and-solutions/mr/nmr-clinical-research-solutions/bbiorefcode.html (accessed on 14 May 2021).
- MetaboBase. Bruker MetatoBase Personal Lybrary. Available online: https://bruker-labscape.store/products/bruker-metabobase-personal-library-3-0 (accessed on 14 May 2021).
- Dona, A.C.; Kyriakides, M.; Scott, F.; Shephard, E.A.; Varshavi, D.; Veselkov, K.; Everett, J.R. A guide to the identification of metabolites in NMR-based metabonomics/metabolomics experiments. Comput. Struct. Biotechnol. J. 2016, 14, 135–153. [Google Scholar] [CrossRef] [Green Version]
- Huang, X.; Powers, R.; Tymiak, A.; Espina, R.; Roongta, V. Introduction to NMR and Its Application in Metabolite Structure Determination. In Drug Metabolism in Drug Design and Development; John Wiley & Sons, Inc.: Hoboken, NJ, USA, 2007; pp. 369–409. [Google Scholar]
- Bitchagno, G.T.M.; Fobofou Tanemossu, S.A. Computational methods for NMR and MS for structure elucidation III: More advanced approaches. Phys. Sci. Rev. 2019, 4. [Google Scholar] [CrossRef]
- Boiteau, R.M.; Hoyt, D.W.; Nicora, C.D.; Kinmonth-Schultz, H.A.; Ward, J.K.; Bingol, K. Structure elucidation of unknown metabolites in metabolomics by combined NMR and MS/MS prediction. Metabolites 2018, 8, 8. [Google Scholar] [CrossRef] [PubMed] [Green Version]
- Lou, S.; Balluff, B.; Cleven, A.H.G.; Bovée, J.V.M.G.; McDonnell, L.A. Prognostic Metabolite Biomarkers for Soft Tissue Sarcomas Discovered by Mass Spectrometry Imaging. J. Am. Soc. Mass Spectrom. 2017, 28, 376–383. [Google Scholar] [CrossRef] [Green Version]
- Schrimpe-Rutledge, A.C.; Codreanu, S.G.; Sherrod, S.D.; McLean, J.A. Untargeted Metabolomics Strategies—Challenges and Emerging Directions. J. Am. Soc. Mass Spectrom. 2016, 27, 1897–1905. [Google Scholar] [CrossRef] [PubMed] [Green Version]
- MetaboLights. Available online: https://www.ebi.ac.uk/metabolights/ (accessed on 14 May 2021).
- Zhang, W.T.; Zhang, Z.W.; Guo, Y.D.; Wang, L.S.; Mao, S.Y.; Zhang, J.F.; Liu, M.N.; Yao, X.D. Discovering biomarkers in bladder cancer by metabolomics. Biomark. Med. 2018, 12, 1347–1359. [Google Scholar] [CrossRef] [PubMed]
- Corona, G.; Cannizzaro, R.; Miolo, G.; Caggiari, L.; De Zorzi, M.; Repetto, O.; Steffan, A.; De Re, V. Use of metabolomics as a complementary omic approach to implement risk criteria for first-degree relatives of gastric cancer patients. Int. J. Mol. Sci. 2018, 19, 750. [Google Scholar] [CrossRef] [PubMed] [Green Version]
- Vignoli, A.; Muraro, E.; Miolo, G.; Tenori, L.; Turano, P.; Di Gregorio, E.; Steffan, A.; Luchinat, C.; Corona, G. Effect of estrogen receptor status on circulatory immune and metabolomics profiles of her2-positive breast cancer patients enrolled for neoadjuvant targeted chemotherapy. Cancers 2020, 12, 314. [Google Scholar] [CrossRef] [Green Version]
- Abooshahab, R.; Gholami, M.; Sanoie, M.; Azizi, F.; Hedayati, M. Advances in metabolomics of thyroid cancer diagnosis and metabolic regulation. Endocrine 2019, 65, 1–14. [Google Scholar] [CrossRef]
- Roy, J.; Dibaeinia, P.; Fan, T.M.; Sinha, S.; Das, A. Global analysis of osteosarcoma lipidomes reveal altered lipid profiles in metastatic versus nonmetastatic cells. J. Lipid Res. 2019, 60, 375–387. [Google Scholar] [CrossRef] [Green Version]
- Kelly, A.D.; Breitkopf, S.B.; Yuan, M.; Goldsmith, J.; Spentzos, D.; Asara, J.M. Metabolomic profiling from formalin-fixed, paraffin-embedded tumor tissue using targeted LC/MS/MS: Application in sarcoma. PLoS ONE 2011, 6, e25357. [Google Scholar] [CrossRef]
- Braas, D.; Ahler, E.; Tam, B.; Nathanson, D.; Riedinger, M.; Benz, M.R.; Smith, K.B.; Eilber, F.C.; Witte, O.N.; Tap, W.D.; et al. Metabolomics strategy reveals subpopulation of liposarcomas sensitive to gemcitabine treatment. Cancer Discov. 2012, 2, 1109–1117. [Google Scholar] [CrossRef] [PubMed] [Green Version]
- Lee, P.; Malik, D.; Perkons, N.; Huangyang, P.; Khare, S.; Rhoades, S.; Gong, Y.Y.; Burrows, M.; Finan, J.M.; Nissim, I.; et al. Targeting glutamine metabolism slows soft tissue sarcoma growth. Nat. Commun. 2020, 11, 1–15. [Google Scholar] [CrossRef] [Green Version]
- Le, A.; Lane, A.N.; Hamaker, M.; Bose, S.; Gouw, A.; Barbi, J.; Tsukamoto, T.; Rojas, C.J.; Slusher, B.S.; Zhang, H.; et al. Glucose-independent glutamine metabolism via TCA cycling for proliferation and survival in b cells. Cell Metab. 2012, 15, 110–121. [Google Scholar] [CrossRef] [Green Version]
- Son, J.; Lyssiotis, C.A.; Ying, H.; Wang, X.; Hua, S.; Ligorio, M.; Perera, R.M.; Ferrone, C.R.; Mullarky, E.; Shyh-Chang, N.; et al. Glutamine supports pancreatic cancer growth through a KRAS-regulated metabolic pathway. Nature 2013, 496, 101–105. [Google Scholar] [CrossRef] [PubMed]
- Birsoy, K.; Wang, T.; Chen, W.W.; Freinkman, E.; Abu-Remaileh, M.; Sabatini, D.M. An Essential Role of the Mitochondrial Electron Transport Chain in Cell Proliferation Is to Enable Aspartate Synthesis. Cell 2015, 162, 540–551. [Google Scholar] [CrossRef] [PubMed] [Green Version]
- Sullivan, L.B.; Gui, D.Y.; Hosios, A.M.; Bush, L.N.; Freinkman, E.; Vander Heiden, M.G. Supporting Aspartate Biosynthesis Is an Essential Function of Respiration in Proliferating Cells. Cell 2015, 162, 552–563. [Google Scholar] [CrossRef] [Green Version]
- Tardito, S.; Oudin, A.; Ahmed, S.U.; Fack, F.; Keunen, O.; Zheng, L.; Miletic, H.; Sakariassen, P.Ø.; Weinstock, A.; Wagner, A.; et al. Glutamine synthetase activity fuels nucleotide biosynthesis and supports growth of glutamine-restricted glioblastoma. Nat. Cell Biol. 2015, 17, 1556–1568. [Google Scholar] [CrossRef] [Green Version]
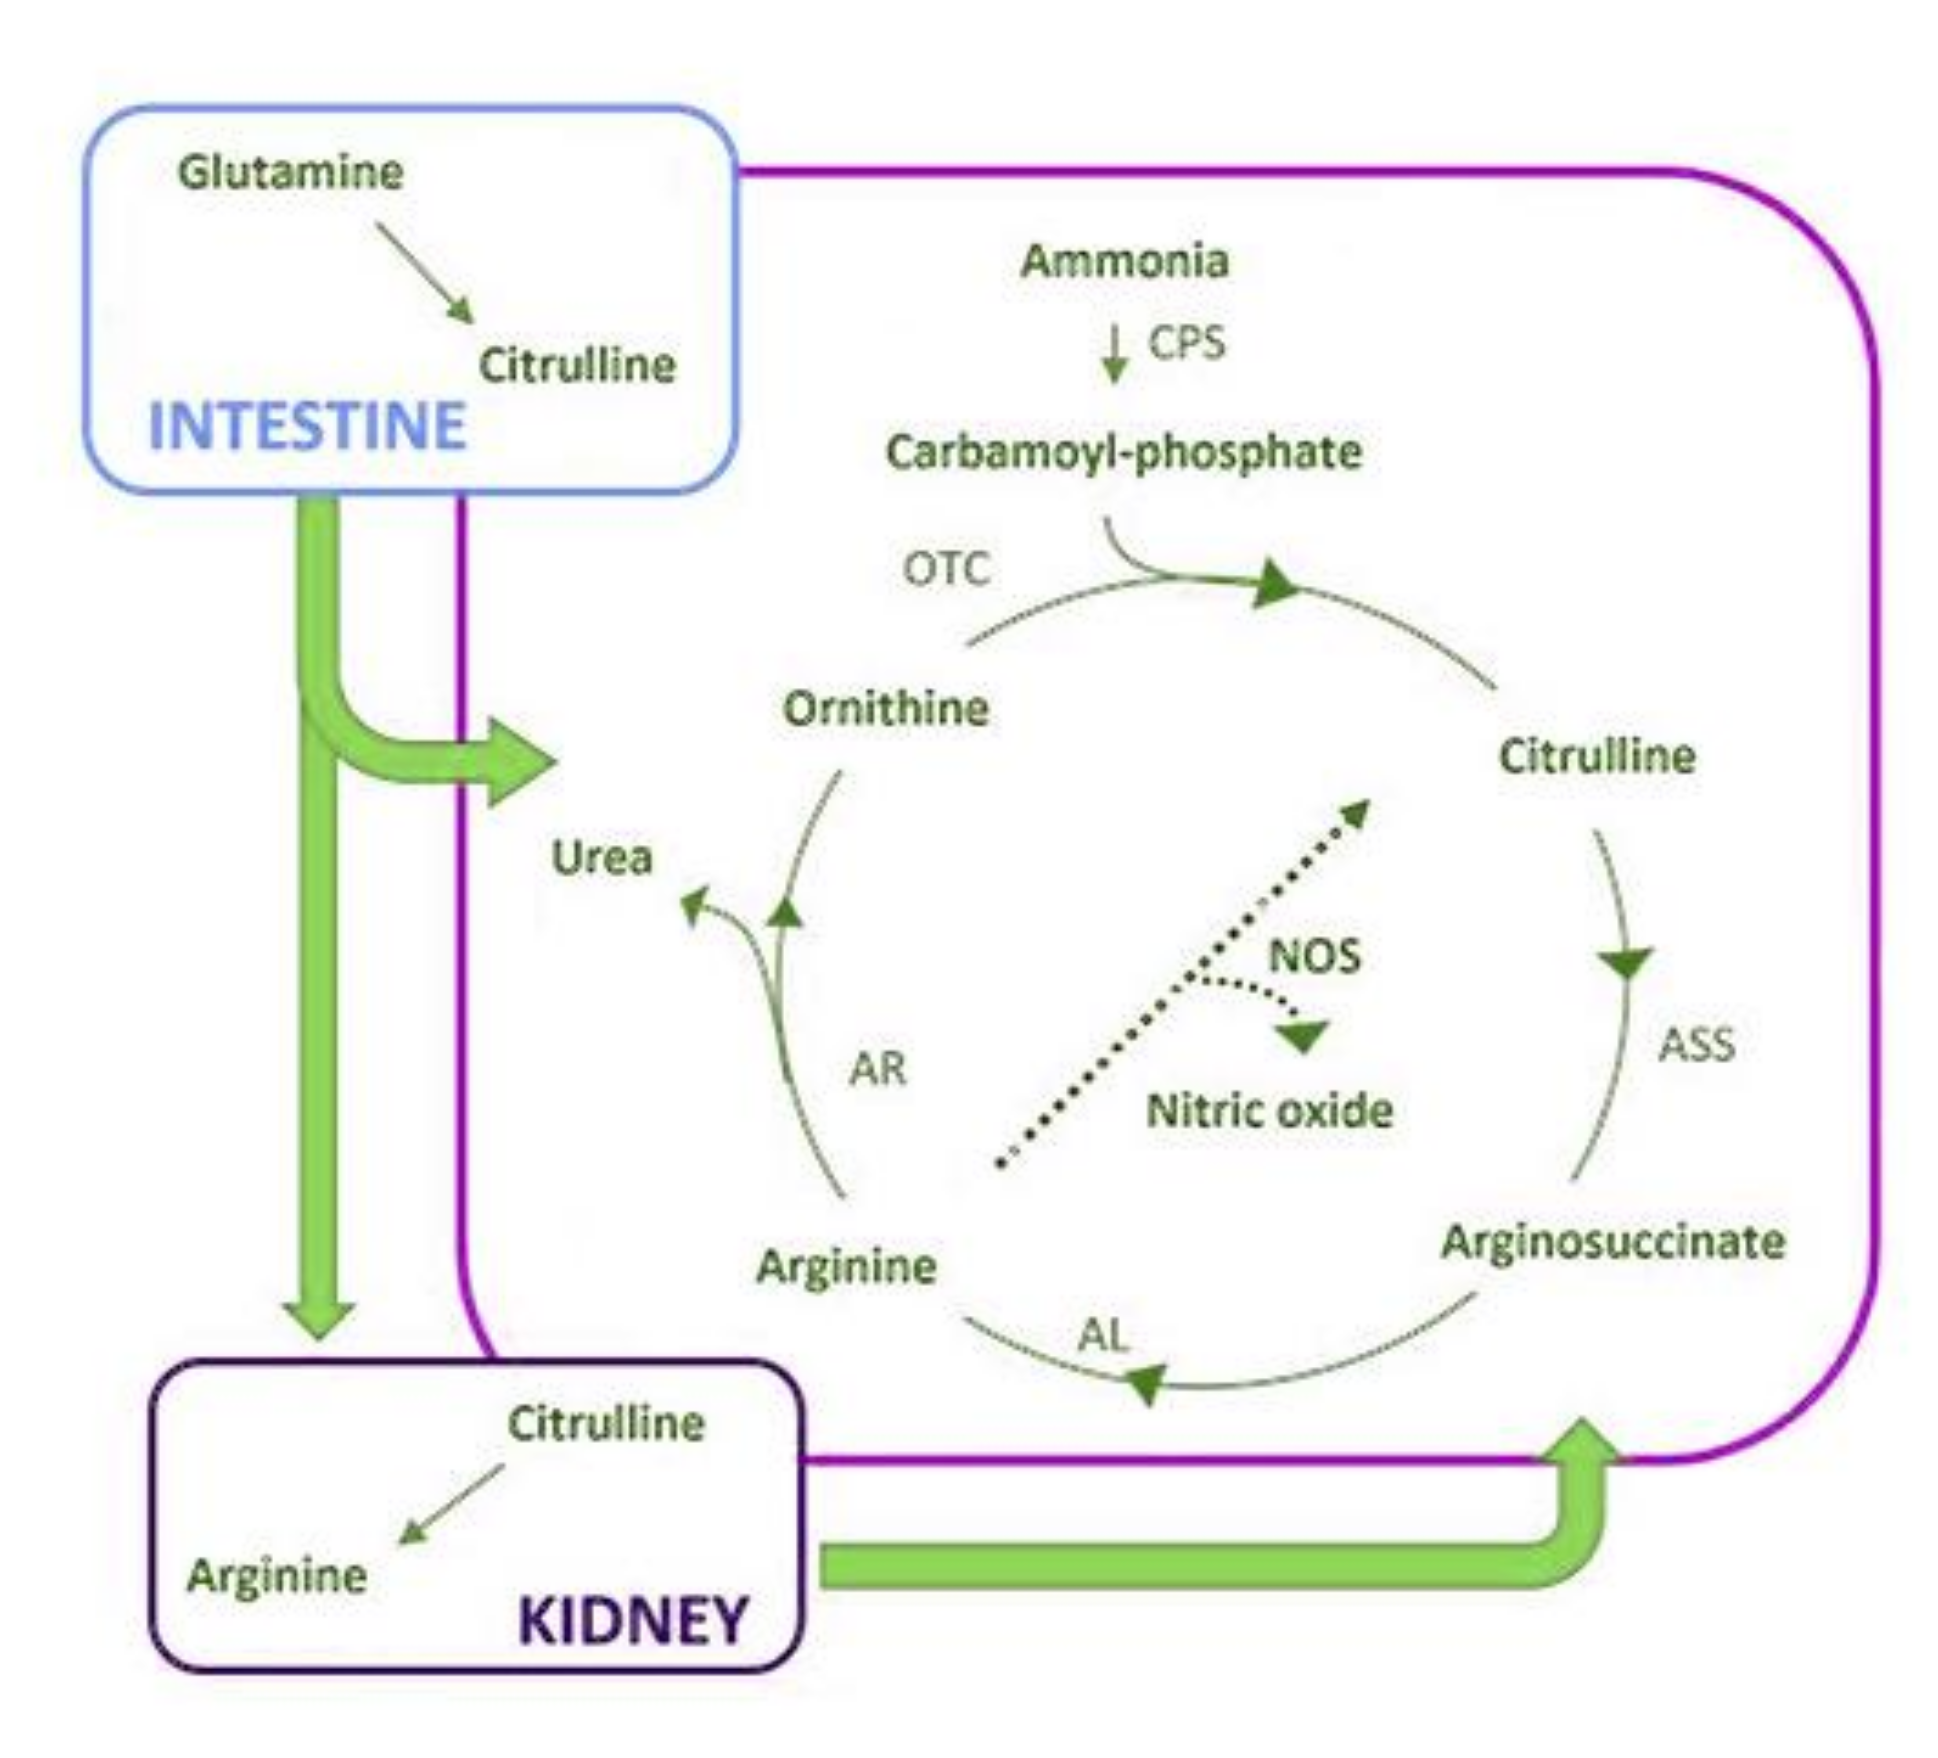
- Curis, E.; Crenn, P.; Cynober, L. Citrulline and the gut. Curr. Opin. Clin. Nutr. Metab. Care 2007, 10, 620–626. [Google Scholar] [CrossRef]
- Miolo, G.; Basile, D.; Carretta, A.; Santeufemia, D.A.; Steffan, A.; Corona, G. The metabolomic scent of cancer disease progression in soft tissue sarcoma: A case report. Int. J. Biol. Markers 2019, 34, 205–209. [Google Scholar] [CrossRef]
- Jia, B.; Wang, W.; Lin, S.; Shi, L.; Li, Y.; Gu, Y.; Gao, F.; Qin, Y. The free amino acid profiles and metabolic biomarkers of predicting the chemotherapeutic response in advanced sarcoma patients. Clin. Transl. Oncol. 2020, 22, 2213–2221. [Google Scholar] [CrossRef]
- Phillips, M.M.; Sheaff, M.T.; Szlosarek, P.W. Targeting arginine-dependent cancers with arginine-degrading enzymes: Opportunities and challenges. Cancer Res. Treat. 2013, 45, 251–262. [Google Scholar] [CrossRef]
- Zhang, Z.; Qiu, Y.; Hua, Y.; Wang, Y.; Chen, T.; Zhao, A.; Chi, Y.; Pan, L.; Hu, S.; Li, J.; et al. Serum and urinary metabonomic study of human osteosarcoma. J. Proteome Res. 2010, 9, 4861–4868. [Google Scholar] [CrossRef]
- López-Garrido, L.; Bañuelos-Hernández, A.E.; Pérez-Hernández, E.; Tecualt-Gómez, R.; Quiroz-Williams, J.; Ariza-Castolo, A.; Becerra-Martínez, E.; Pérez-Hernández, N. Metabolic profiling of serum in patients with cartilage tumours using 1H-NMR spectroscopy: A pilot study. Magn. Reson. Chem. 2020, 58, 65–76. [Google Scholar] [CrossRef] [PubMed]
- Merry, E.; Thway, K.; Jones, R.L.; Huang, P.H. Predictive and prognostic transcriptomic biomarkers in soft tissue sarcomas. Jnp. Precis. Oncol. 2021, 5, 17. [Google Scholar] [CrossRef] [PubMed]
- Min, L.; Shen, J.; Tu, C.; Hornicek, F.; Duan, Z. The roles and implications of exosomes in sarcoma. Cancer Metastasis Rev. 2016, 35, 377–390. [Google Scholar] [CrossRef] [PubMed] [Green Version]
- Grünewald, T.G.P.; Alonso, M.; Avnet, S.; Banito, A.; Burdach, S.; Cidre-Aranaz, F.; Di Pompo, G.; Distel, M.; Dorado-Garcia, H.; Garcia-Castro, J.; et al. Sarcoma treatment in the era of molecular medicine. EMBO Mol. Med. 2020, 12, e11131. [Google Scholar] [CrossRef]
- Chinen, L.T.D.; Mello, C.A.L.; Abdallah, E.A.; Ocea, L.M.; Buim, M.E.; Breve, N.M.; Gasparini, J.L.J.; Fanelli, M.F.; Paterlini-Bréchot, P. Isolation, detection, and immunomorphological characterization of circulating tumor cells (CTCs) from patients with different types of sarcoma using isolation by size of tumor cells: A window on sarcoma-cell invasion. OncoTargets Ther. 2014, 7, 1609–1617. [Google Scholar] [CrossRef] [PubMed] [Green Version]
- Tellez-Gabriel, M.; Brown, H.K.; Young, R.; Heymann, M.-F.; Heymann, D. The Challenges of Detecting Circulating Tumor Cells in Sarcoma. Front. Oncol. 2016, 6, 202. [Google Scholar] [CrossRef] [Green Version]
- Martín-Broto, J.; Pousa, A.L.; Brohl, A.S.; Van Tine, B.A.; Powers, B.; Stacchiotti, S.; Blay, J.-Y.; Hu, J.S.; Oakley, G.J.; Wang, H.; et al. Circulating Tumor Cells and Biomarker Modulation with Olaratumab Monotherapy Followed by Olaratumab plus Doxorubicin: Phase Ib Study in Patients with Soft-Tissue Sarcoma. Mol. Cancer Ther. 2021, 20, 132–141. [Google Scholar] [CrossRef]
- Miranda-Castro, R.; Palchetti, I.; de-los-Santos-Álvarez, N. The Translational Potential of Electrochemical DNA-Based Liquid Biopsy. Front. Chem. 2020, 8, 143. [Google Scholar] [CrossRef]
- Sfragano, P.S.; Pillozzi, S.; Palchetti, I. Electrochemical and PEC platforms for miRNA and other epigenetic markers of cancer diseases: Recent updates. Electrochem. Commun. 2021, 124, 106929. [Google Scholar] [CrossRef]
- Voccia, D.; Sosnowska, M.; Bettazzi, F.; Roscigno, G.; Fratini, E.; De Franciscis, V.; Condorelli, G.; Chitta, R.; D’Souza, F.; Kutner, W.; et al. Direct determination of small RNAs using a biotinylated polythiophene impedimetric genosensor. Biosens. Bioelectron. 2017, 87, 1012–1019. [Google Scholar] [CrossRef] [PubMed] [Green Version]
- Haddox, C.L.; Riedel, R.F. Individualizing systemic therapy for advanced soft tissue sarcomas based on tumor histology and biology. Expert Rev. Anticancer Ther. 2020, 20, 5–8. [Google Scholar] [CrossRef] [PubMed]
- Bertucci, F.; Finetti, P.; Monneur, A.; Perrot, D.; Chevreau, C.; Le Cesne, A.; Blay, J.-Y.; Mir, O.; Birnbaum, D. PARP1 expression in soft tissue sarcomas is a poor-prognosis factor and a new potential therapeutic target. Mol. Oncol. 2019, 13, 1577–1588. [Google Scholar] [CrossRef] [PubMed] [Green Version]
- Wilky, B.A.; Trucco, M.M.; Subhawong, T.K.; Florou, V.; Park, W.; Kwon, D.; Wieder, E.D.; Kolonias, D.; Rosenberg, A.E.; Kerr, D.A.; et al. Axitinib plus pembrolizumab in patients with advanced sarcomas including alveolar soft-part sarcoma: A single-centre, single-arm, phase 2 trial. Lancet. Oncol. 2019, 20, 837–848. [Google Scholar] [CrossRef]
- Van Tine, B.; Butler, M.; Araujo, D.; Johnson, M.; Clarke, J.; Liebner, D.; Odunsi, K.; Olszanski, A.; Basu, S.; Brophy, F.; et al. 1670OADP-A2M4 (MAGE-A4) in patients with synovial sarcoma. Ann. Oncol. 2019, 30. [Google Scholar] [CrossRef]
- Grignani, G.; D’Ambrosio, L.; Pignochino, Y.; Palmerini, E.; Zucchetti, M.; Boccone, P.; Aliberti, S.; Stacchiotti, S.; Bertulli, R.; Piana, R.; et al. Trabectedin and olaparib in patients with advanced and non-resectable bone and soft-tissue sarcomas (TOMAS): An open-label, phase 1b study from the Italian Sarcoma Group. Lancet. Oncol. 2018, 19, 1360–1371. [Google Scholar] [CrossRef]
- Pignochino, Y.; Capozzi, F.; D’Ambrosio, L.; Dell’Aglio, C.; Basiricò, M.; Canta, M.; Lorenzato, A.; Vignolo Lutati, F.; Aliberti, S.; Palesandro, E.; et al. PARP1 expression drives the synergistic antitumor activity of trabectedin and PARP1 inhibitors in sarcoma preclinical models. Mol. Cancer 2017, 16, 86. [Google Scholar] [CrossRef] [Green Version]
- Stacchiotti, S.; Schoffski, P.; Jones, R.; Agulnik, M.; Villalobos, V.M.; Jahan, T.M.; Chen, T.W.-W.; Italiano, A.; Demetri, G.D.; Cote, G.M.; et al. Safety and efficacy of tazemetostat, a first-in-class EZH2 inhibitor, in patients (pts) with epithelioid sarcoma (ES) (NCT02601950). J. Clin. Oncol. 2019, 37, 11003. [Google Scholar] [CrossRef]
- Wagner, A.J.; Ravi, V.; Ganjoo, K.N.; Van Tine, B.A.; Riedel, R.F.; Chugh, R.; Cranmer, L.D.; Gordon, E.M.; Hornick, J.L.; Kwiatkowski, D.J.; et al. ABI-009 (nab-sirolimus) in advanced malignant perivascular epithelioid cell tumors (PEComa): Preliminary efficacy, safety, and mutational status from AMPECT, an open label phase II registration trial. J. Clin. Oncol. 2019, 37, 11005. [Google Scholar] [CrossRef]
- Dickson, M.A.; Koff, A.; D’Angelo, S.P.; Gounder, M.M.; Keohan, M.L.; Kelly, C.M.; Chi, P.; Antonescu, C.R.; Landa, J.; Qin, L.-X.; et al. Phase 2 study of the CDK4 inhibitor abemaciclib in dedifferentiated liposarcoma. J. Clin. Oncol. 2019, 37, 11004. [Google Scholar] [CrossRef]
- Groisberg, R.; Hong, D.S.; Holla, V.; Janku, F.; Piha-Paul, S.; Ravi, V.; Benjamin, R.; Kumar Patel, S.; Somaiah, N.; Conley, A.; et al. Clinical genomic profiling to identify actionable alterations for investigational therapies in patients with diverse sarcomas. Oncotarget 2017, 8, 39254–39267. [Google Scholar] [CrossRef] [PubMed]
- Lucchesi, C.; Khalifa, E.; Laizet, Y.; Soubeyran, I.; Mathoulin-Pelissier, S.; Chomienne, C.; Italiano, A. Targetable Alterations in Adult Patients with Soft-Tissue Sarcomas: Insights for Personalized Therapy. JAMA Oncol. 2018, 4, 1398–1404. [Google Scholar] [CrossRef]
- Drilon, A.; Laetsch, T.W.; Kummar, S.; DuBois, S.G.; Lassen, U.N.; Demetri, G.D.; Nathenson, M.; Doebele, R.C.; Farago, A.F.; Pappo, A.S.; et al. Efficacy of Larotrectinib in TRK Fusion-Positive Cancers in Adults and Children. N. Engl. J. Med. 2018, 378, 731–739. [Google Scholar] [CrossRef] [PubMed]


| A. Main Molecular Markers Associated with Prognosis in STSs | ||
| Molecular Marker | Prognosis | References |
| Microenvironment | ||
| high B cells | better survival | [24] |
| high CD8+ T cells | improvement in survival | [24,29,30,31,32] |
| low CD8+ T cells at relapse | poor survival | [18] |
| high CD4+ T cells | improvement in survival | [24,28] |
| low CD163+ TIMs | favorable survival | [15] |
| high levels CD163+ | improvement in survival | [22] |
| PDL1+ | worse prognosis | [39] |
| LAG3+ CD8+ T cells | severe prognosis | [45] |
| LAG3+ CD4+ T cells | severe prognosis | [45] |
| Genetics | ||
| miR26a-2c amplification | poor survival | [95] |
| high expression of miR-17-92 cluster | poor prognosis | [101] |
| miRNA panel * | predicted in metastatic events | [108] |
| miR-138 overexpression | negative correlation with MFS | [116] |
| miR-210 | severe prognosis | [121] |
| LncRNAs: LINC00680, AC006129.2, RP11-274B21.9 and RP11-713P17.3 | favorable prognosis | [124] |
| LncRNAs: RP11-560J1.2, AP001432.14, RP4-665J23.1, RP11-230G5.2, BACH1-IT2, and RP11504A18.1 | severe prognosis | [124] |
| citrulline shortage | poor outcome | [137] |
| B. Main Molecular Markers Associated with Sensitivity/Resistance to Therapy in STSs. | ||
| Molecular Marker | Sensitivity/Resistance to Therapy | References |
| CD8+ and CD4+ T cells | response to therapies | [24] |
| Alterations in CD68+, CD163+ | neoadjuvant chemotherapy | [34] |
| increase in PDL1 levels | radiotherapy | [40] |
| IDO1/KP signaling pathway | resistance to PD1 inhibitors | [42] |
| miR-485-3p–Top2α–NF-YB pathway | sensitivity to therapies | [101,102] |
| Immune Checkpoint Inhibitor | Trial Number | Phase | Status |
|---|---|---|---|
| Ipilimumab (anti-CTLA4) | NCT01445379 | I | Completed |
| Pembrolizumab (anti-PD1) | NCT02301039NCT03316573 | II II | Completed Recruiting |
| Toripalimab (anti-PD1) | NCT03474640 | I | Recruiting |
| Spartalizumab (anti-PD1) | NCT04802876 | II | Not yet recruiting |
| Immune Checkpoint Inhibitors | Other Agents | Trial Number | Phase | Status |
|---|---|---|---|---|
| Immune checkpoint inhibitors in combination with other immunotherapy agents | ||||
| Pembrolizumab | IDO 1 Inhibitor (i) (epacadostat) | NCT03414229 | II | Active, not recruiting |
| Nivolumab (anti-PD1) | Ipilimumab (anti-CTLA4) | NCT04741438 | III | Recruiting |
| Relatlimab (anti-LAG3) | NCT04095208 | II | Recruiting | |
| NKTR-214 | NCT03282344 | II | Active, not recruiting | |
| Immune checkpoint inhibitors in combination with chemotherapy or radiation therapy | ||||
| Atezolizumab (anti-PDL1) | Radiation therapy | NCT03474094 | II | Recruiting |
| Nivolumab | Paclitaxel | NCT04339738 | II | Recruiting |
| Trabectedin | NCT03590210 | II | Active, not recruiting | |
| T-VEC and Trabectedin | NCT03886311 | II | Recruiting | |
| Pembrolizumab | Radiation therapy | NCT03338959 | I-II | Recruiting |
| Eribuline | NCT03899805 | II | Active, not recruiting | |
| T-VEC | NCT03069378 | II | Recruiting | |
| Lenvatinib (VEGFR/FGFR-i) | NCT04784247 | II | Recruiting | |
| Axitinib (VEGFR- i) | NCT02636725 | II | Active, not recruiting | |
| Immune checkpoint inhibitors in combination with other agents | ||||
| Atezolizumab | Bevacizumab (VEGF-i) | NCT03141684 | II | Recruiting |
| Rucaparib (PARP-i) | NCT04216953 | I-II | Recruiting | |
| Cobimetinib (MEK-i) | NCT04624178 | II | Recruiting | |
| Dual immune checkpoint inhibitors therapy in combination with other agents | ||||
| Nivolumab plus ipilimumab | Cabozantinib (VEGFR/MET/AXL-i) | NCT04551430 | II | Recruiting |
| Trabectedin | NCT03138161 | I-II | Recruiting | |
| PARP-Inhibitor | Other Agents | NCT Trial Number | Phase | Status |
|---|---|---|---|---|
| Olaparib | Radiation therapy | NCT02787642 | I | Recruiting |
| Olaparib | Temozolomide | NCT01858168 | I | Recruiting |
| Olaparib | Durvalumab | NCT03784014 | III | Recruiting |
| Olaparib | Trabectedin | NCT04076579 | II | Recruiting |
| Olaparib | Pembrolizumab | NCT04123366 | II | Recruiting |
| Olaparib | - | NCT03233204 | II | Recruiting |
| Rucaparib | - | NCT04171700 | II | Recruiting |
| Multitargeted TKI-i | Other Agents | NCT Trial Number | Phase | Status |
|---|---|---|---|---|
| EZH2 inhibitors (tazemetostat) | Doxorubicin | NCT04204941 | III | Recruiting |
| Nab-rapamycin | Nivolumab | NCT03190174 | I-II | Recruiting |
| TRK inhibitor (Larotrectinib) | - | NCT02576431 | II | Recruiting |
| CDK4 inhibitors (Abemaciclib) | - | NCT04040205 | II | Recruiting |
| Temozolomide and Irinotecan | NCT04238819 | I | Recruiting |
Publisher’s Note: MDPI stays neutral with regard to jurisdictional claims in published maps and institutional affiliations. |
© 2021 by the authors. Licensee MDPI, Basel, Switzerland. This article is an open access article distributed under the terms and conditions of the Creative Commons Attribution (CC BY) license (https://creativecommons.org/licenses/by/4.0/).
Share and Cite
Pillozzi, S.; Bernini, A.; Palchetti, I.; Crociani, O.; Antonuzzo, L.; Campanacci, D.; Scoccianti, G. Soft Tissue Sarcoma: An Insight on Biomarkers at Molecular, Metabolic and Cellular Level. Cancers 2021, 13, 3044. https://doi.org/10.3390/cancers13123044
Pillozzi S, Bernini A, Palchetti I, Crociani O, Antonuzzo L, Campanacci D, Scoccianti G. Soft Tissue Sarcoma: An Insight on Biomarkers at Molecular, Metabolic and Cellular Level. Cancers. 2021; 13(12):3044. https://doi.org/10.3390/cancers13123044
Chicago/Turabian StylePillozzi, Serena, Andrea Bernini, Ilaria Palchetti, Olivia Crociani, Lorenzo Antonuzzo, Domenico Campanacci, and Guido Scoccianti. 2021. "Soft Tissue Sarcoma: An Insight on Biomarkers at Molecular, Metabolic and Cellular Level" Cancers 13, no. 12: 3044. https://doi.org/10.3390/cancers13123044