
Drug Repositioning Based on the Reversal of Gene Expression Signatures Identifies TOP2A as a Therapeutic Target for Rectal Cancer

 ,
,  , , , and
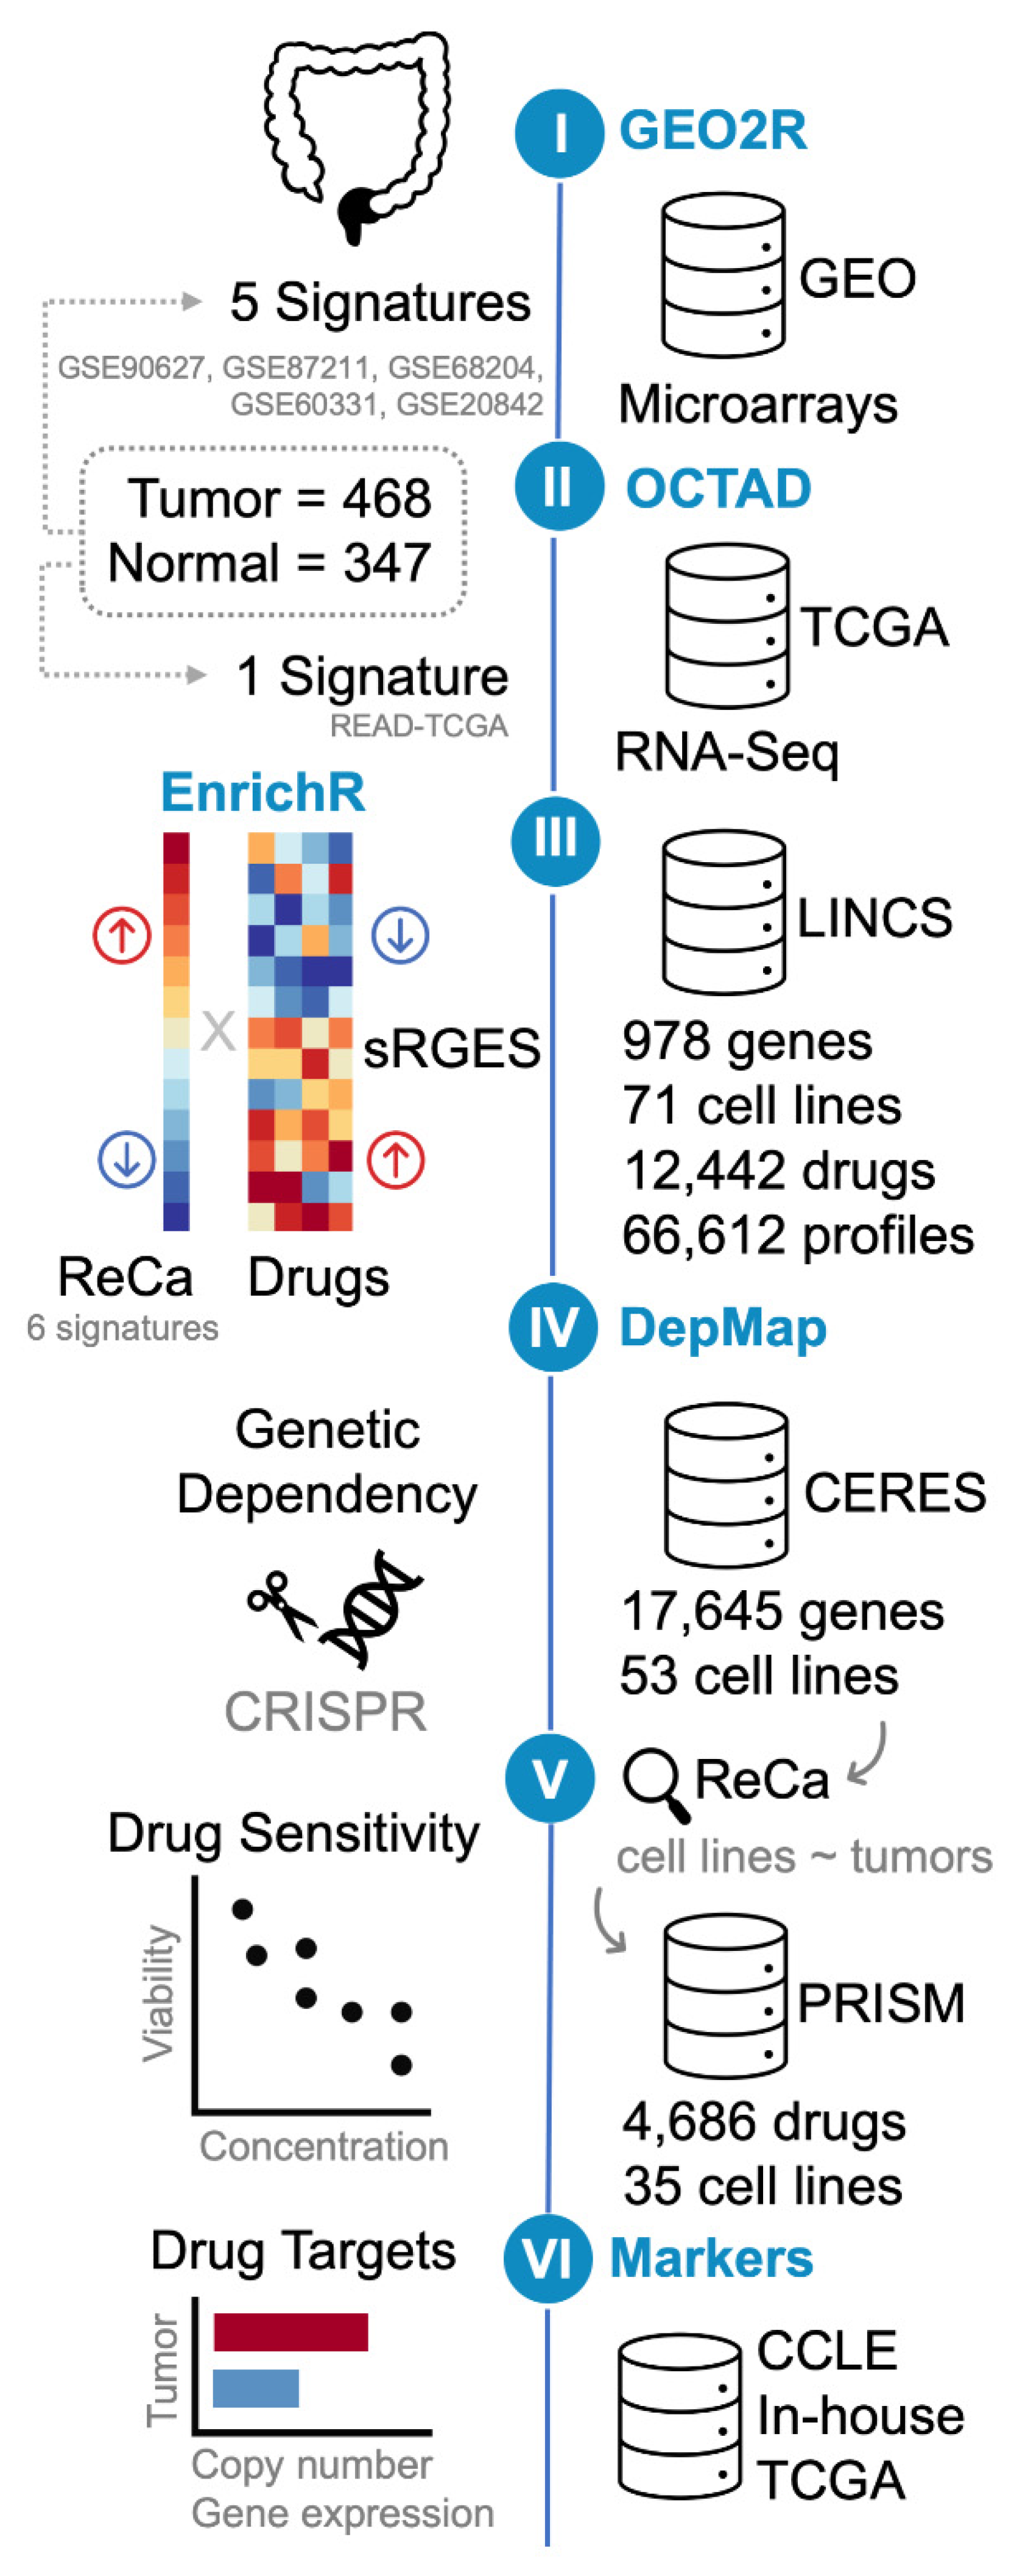
Abstract
:Simple Summary
Abstract
1. Introduction
2. Methods
2.1. Acquisition and Processing of Publicly Available ReCa Transcriptomic Datasets
2.2. Generation of ReCa Signatures
2.3. Gene Set Enrichment Analysis
2.4. Screening Drugs Targeting ReCa Using Gene Expression Signatures
2.5. Genetic Dependencies of Target Drugs in CRC Cell Lines
2.6. Drug Sensitivity in CRC Cell Lines
2.7. Identification of Predictive Markers of Drug-Based Neoadjuvant Chemotherapy Efficacy
2.8. Data Representation and Analysis
3. Results
3.1. Acquisition and Processing of Publicly Available Transcriptomic Datasets for ReCa
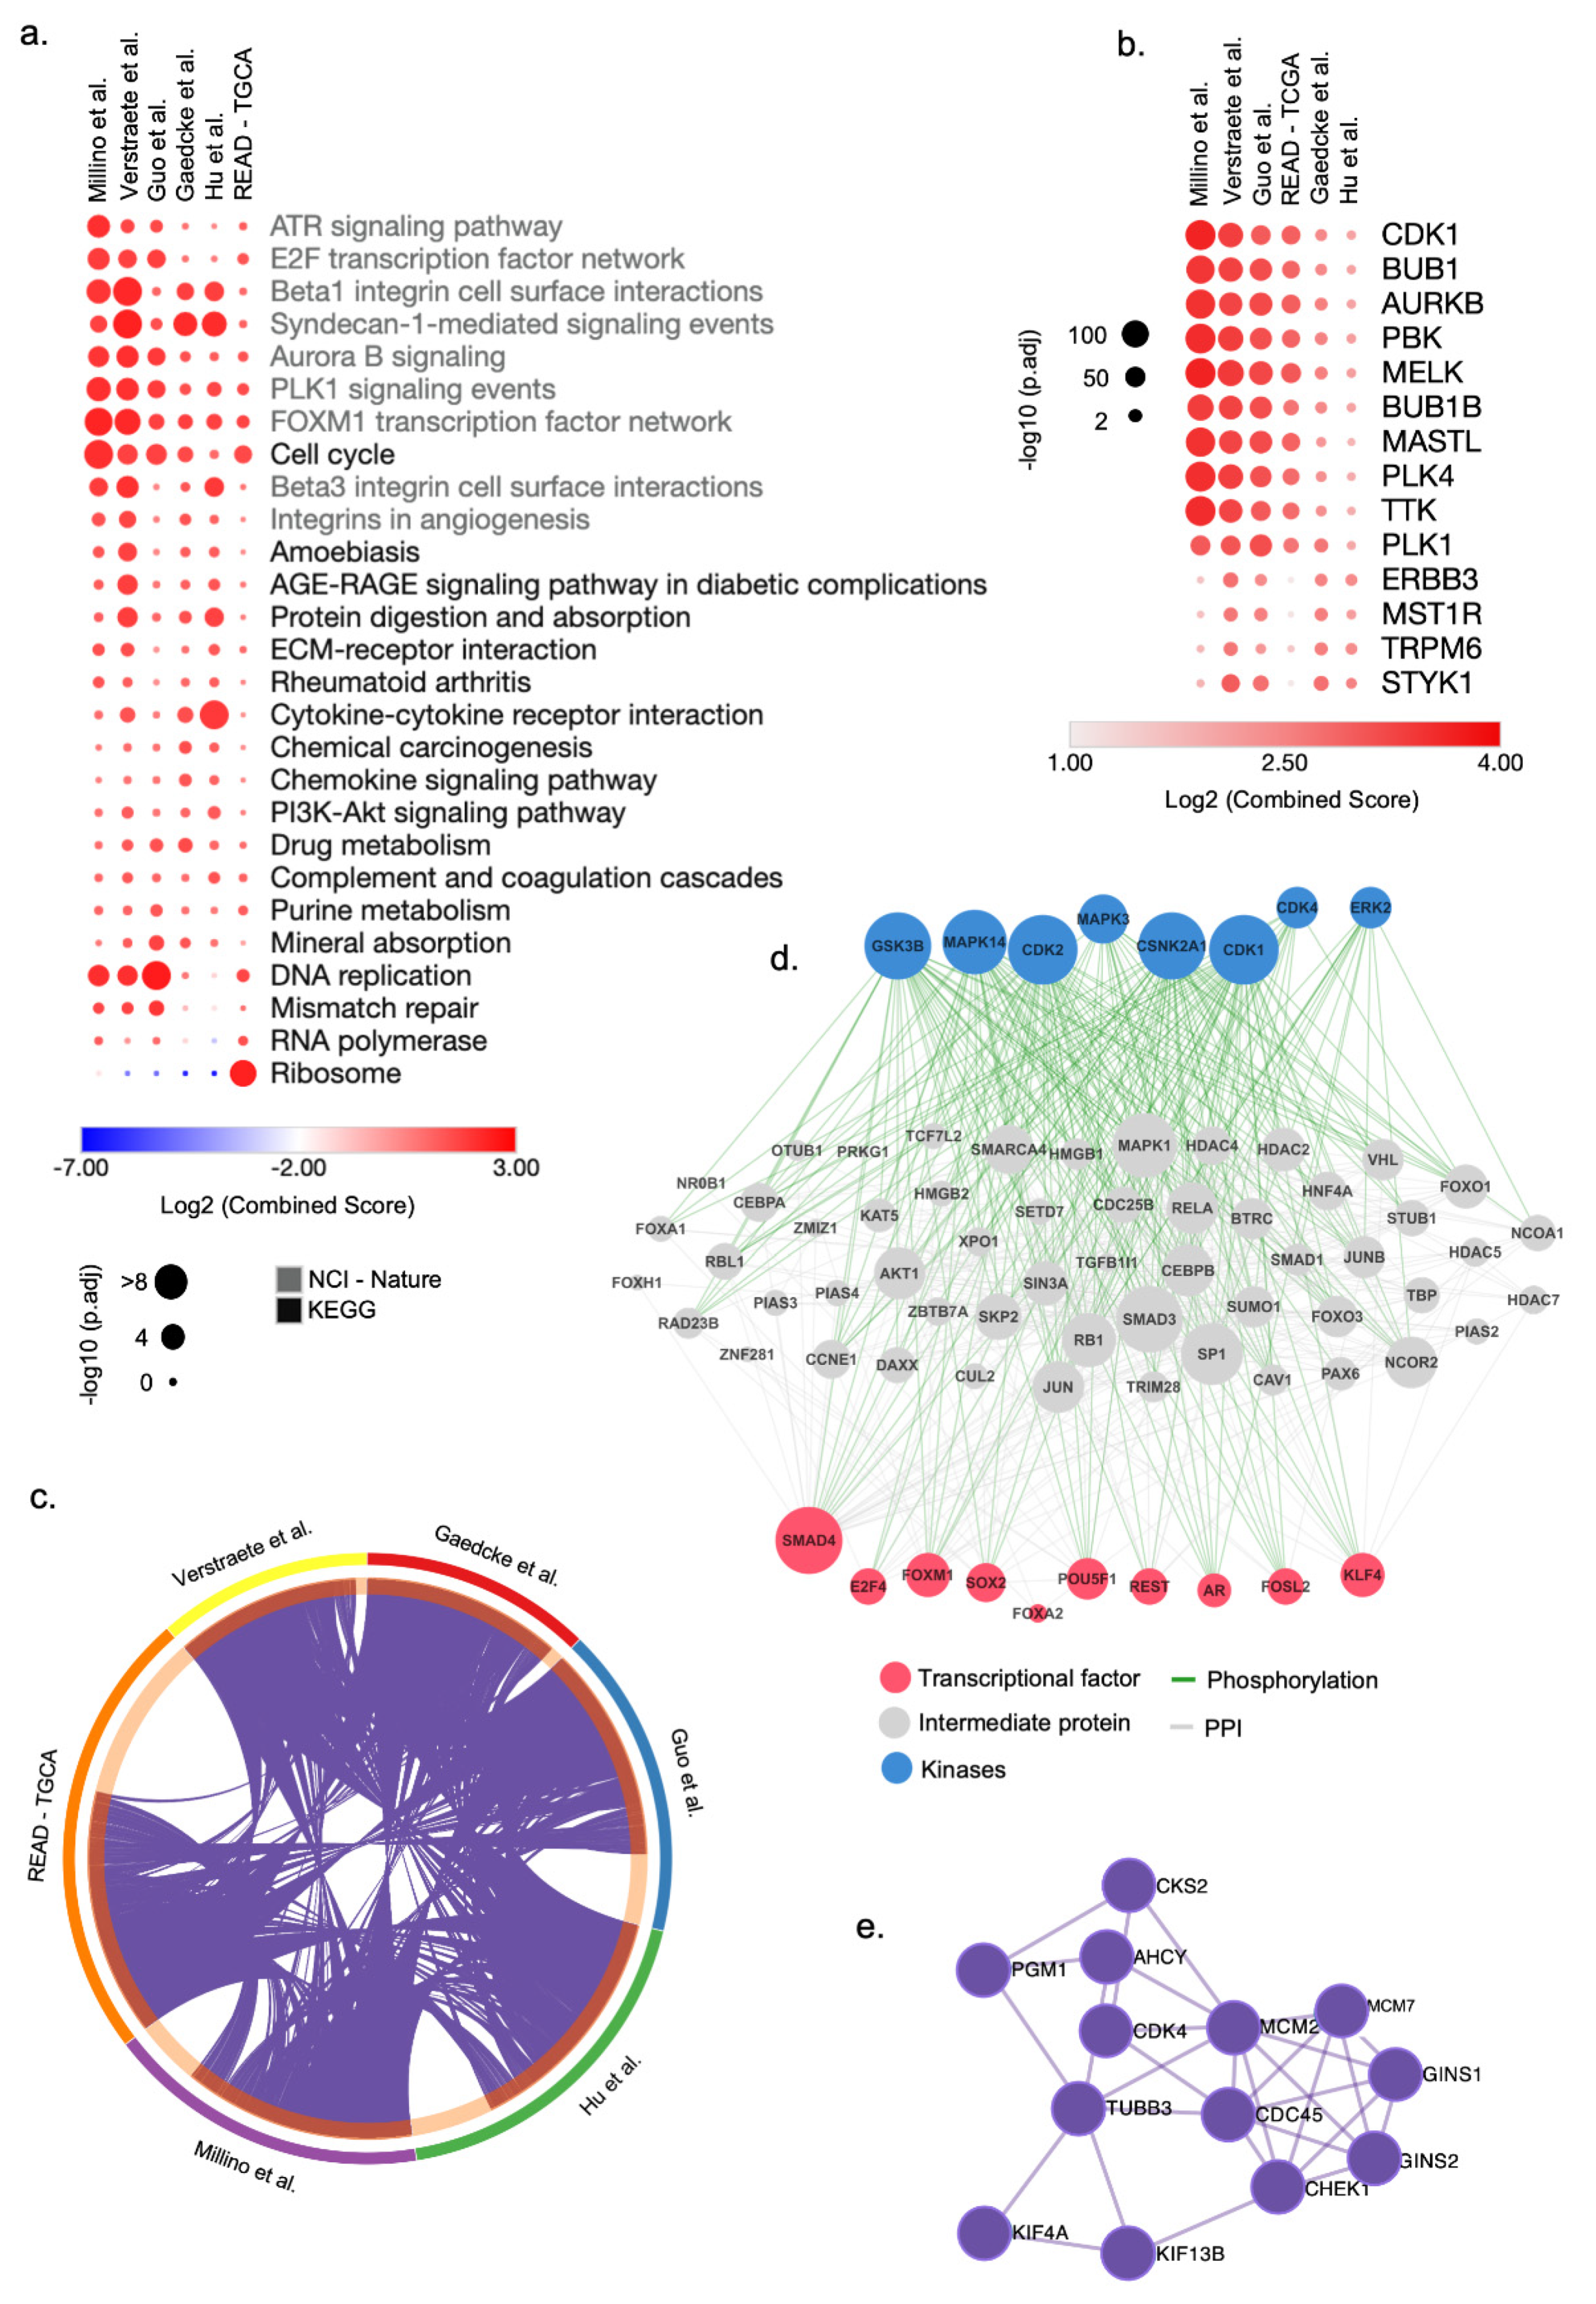
3.2. Integrative Transcriptomic Analysis Reveals Cell Cycle Genes as Potential Drug Targets for ReCa
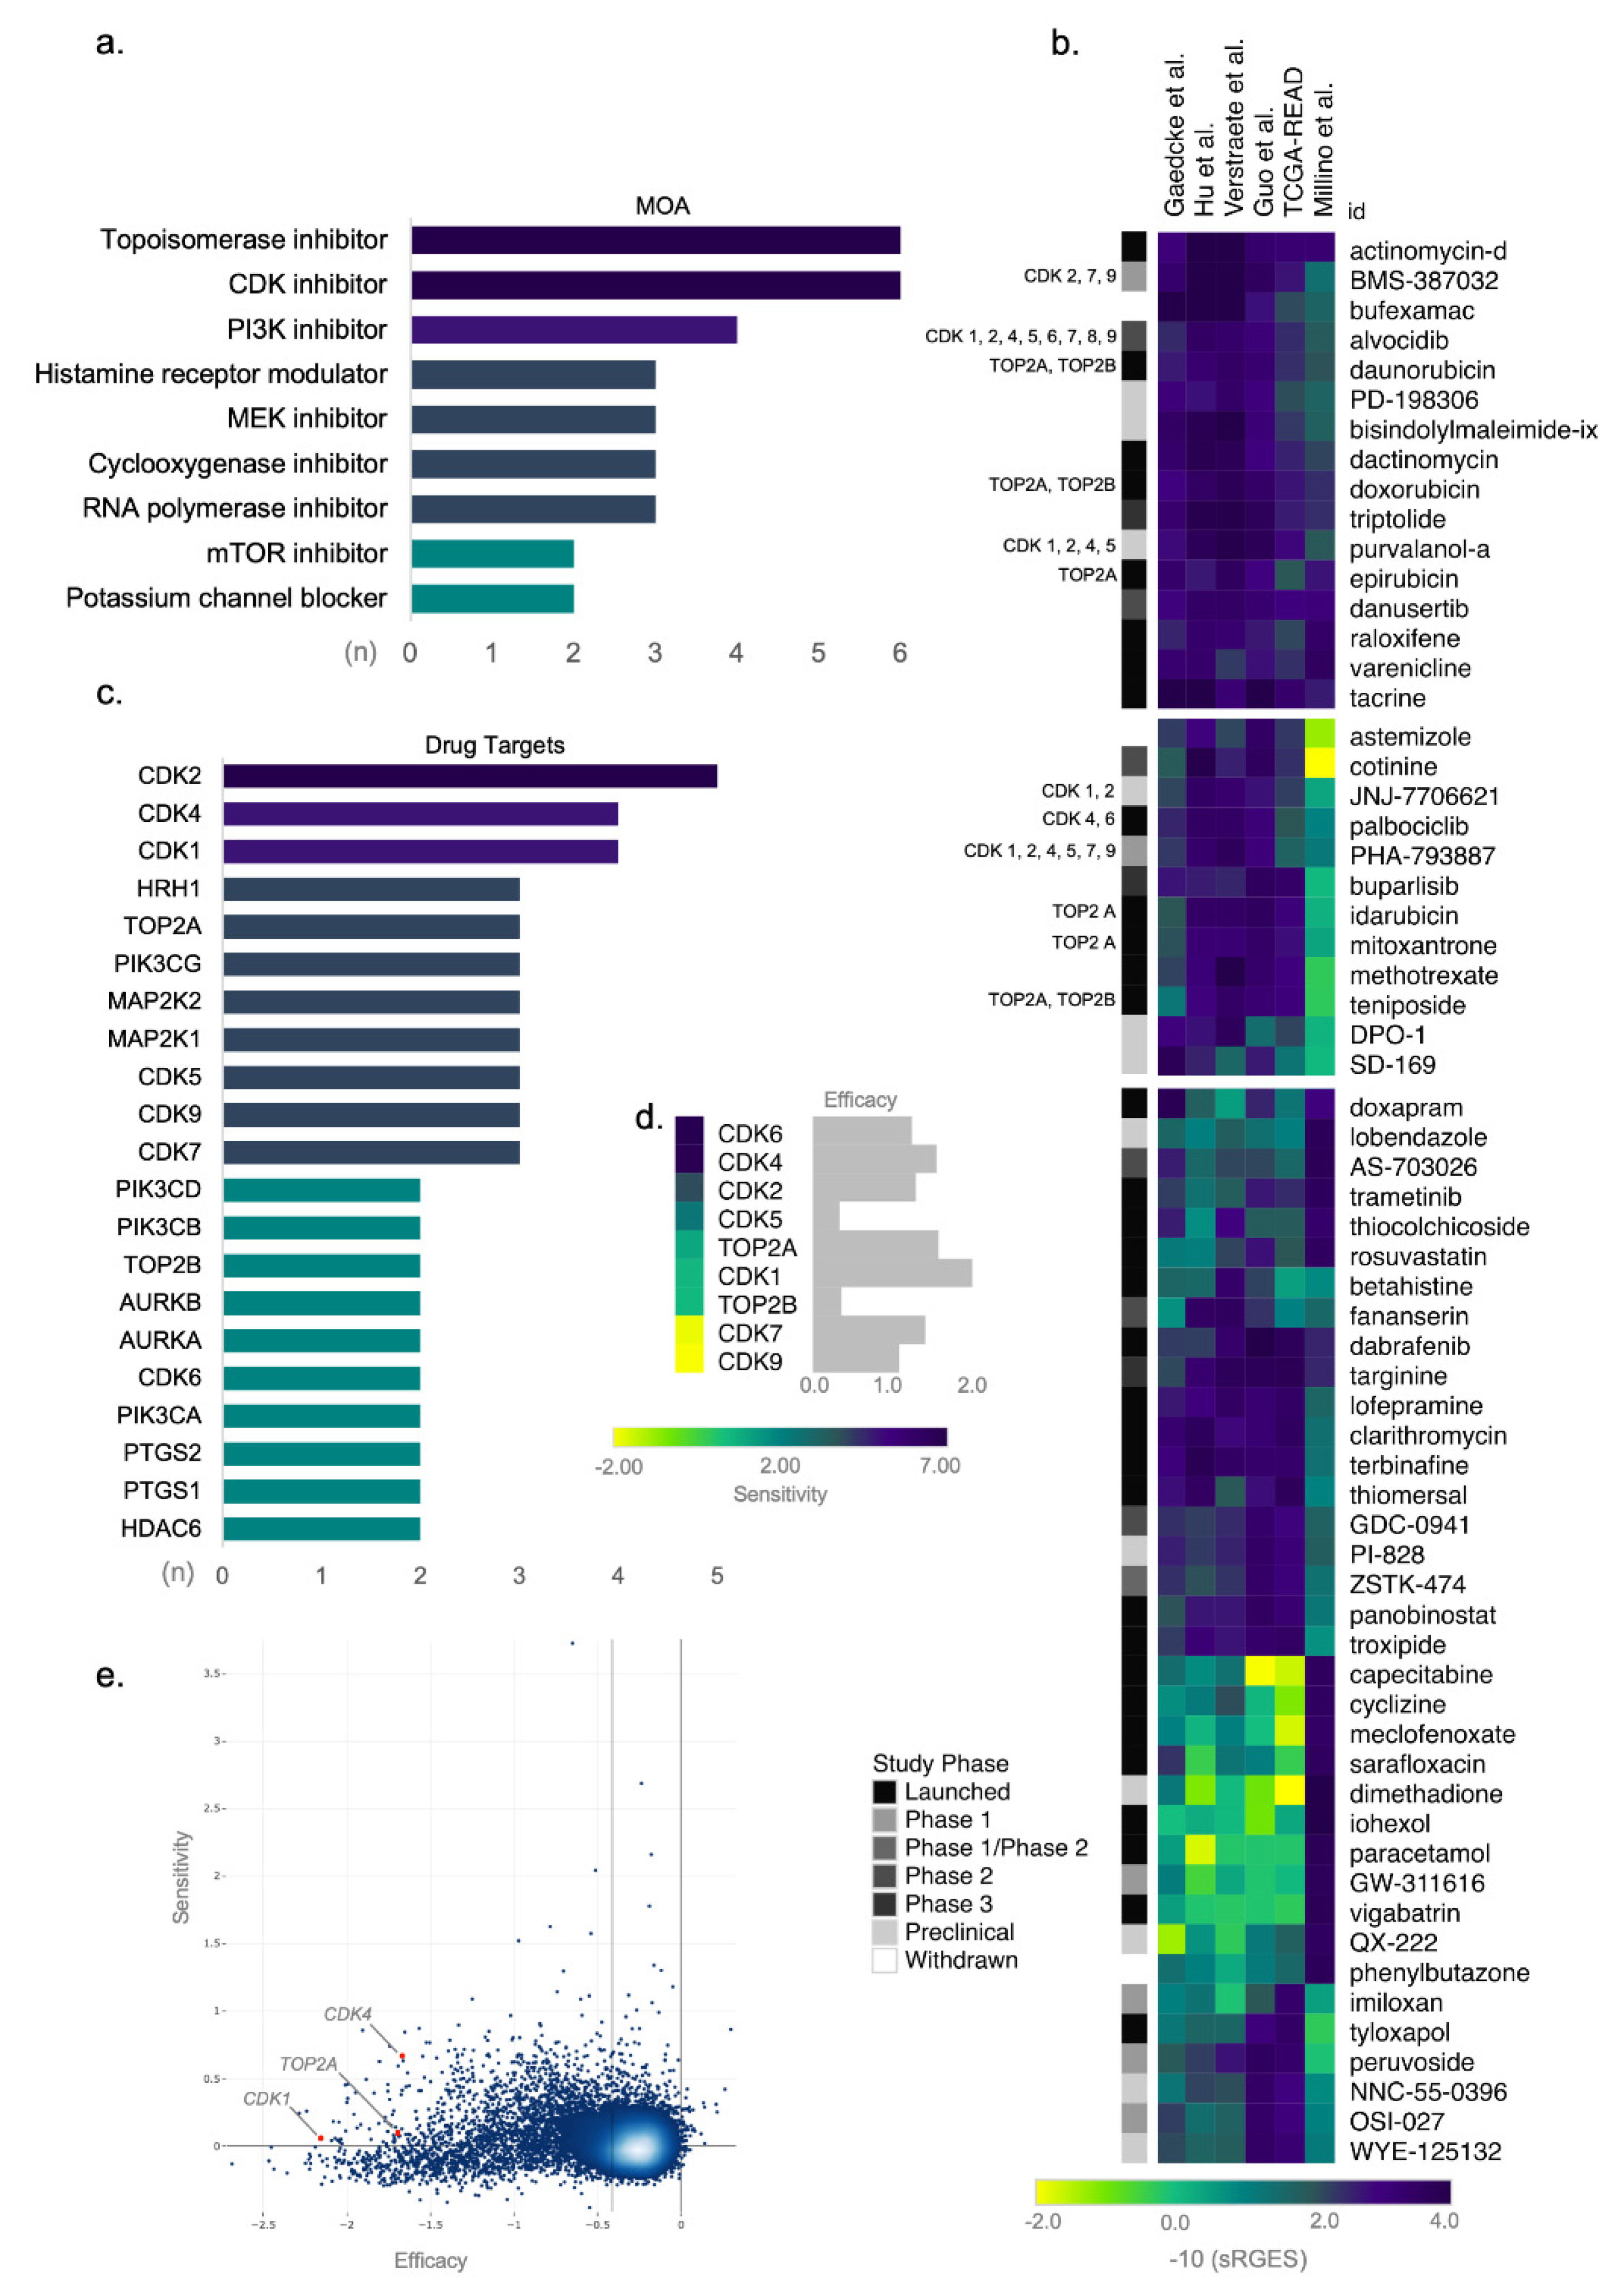
3.3. Topoisomerase and CDK Inhibitors Are Candidate Targets for Drug Repositioning in ReCa
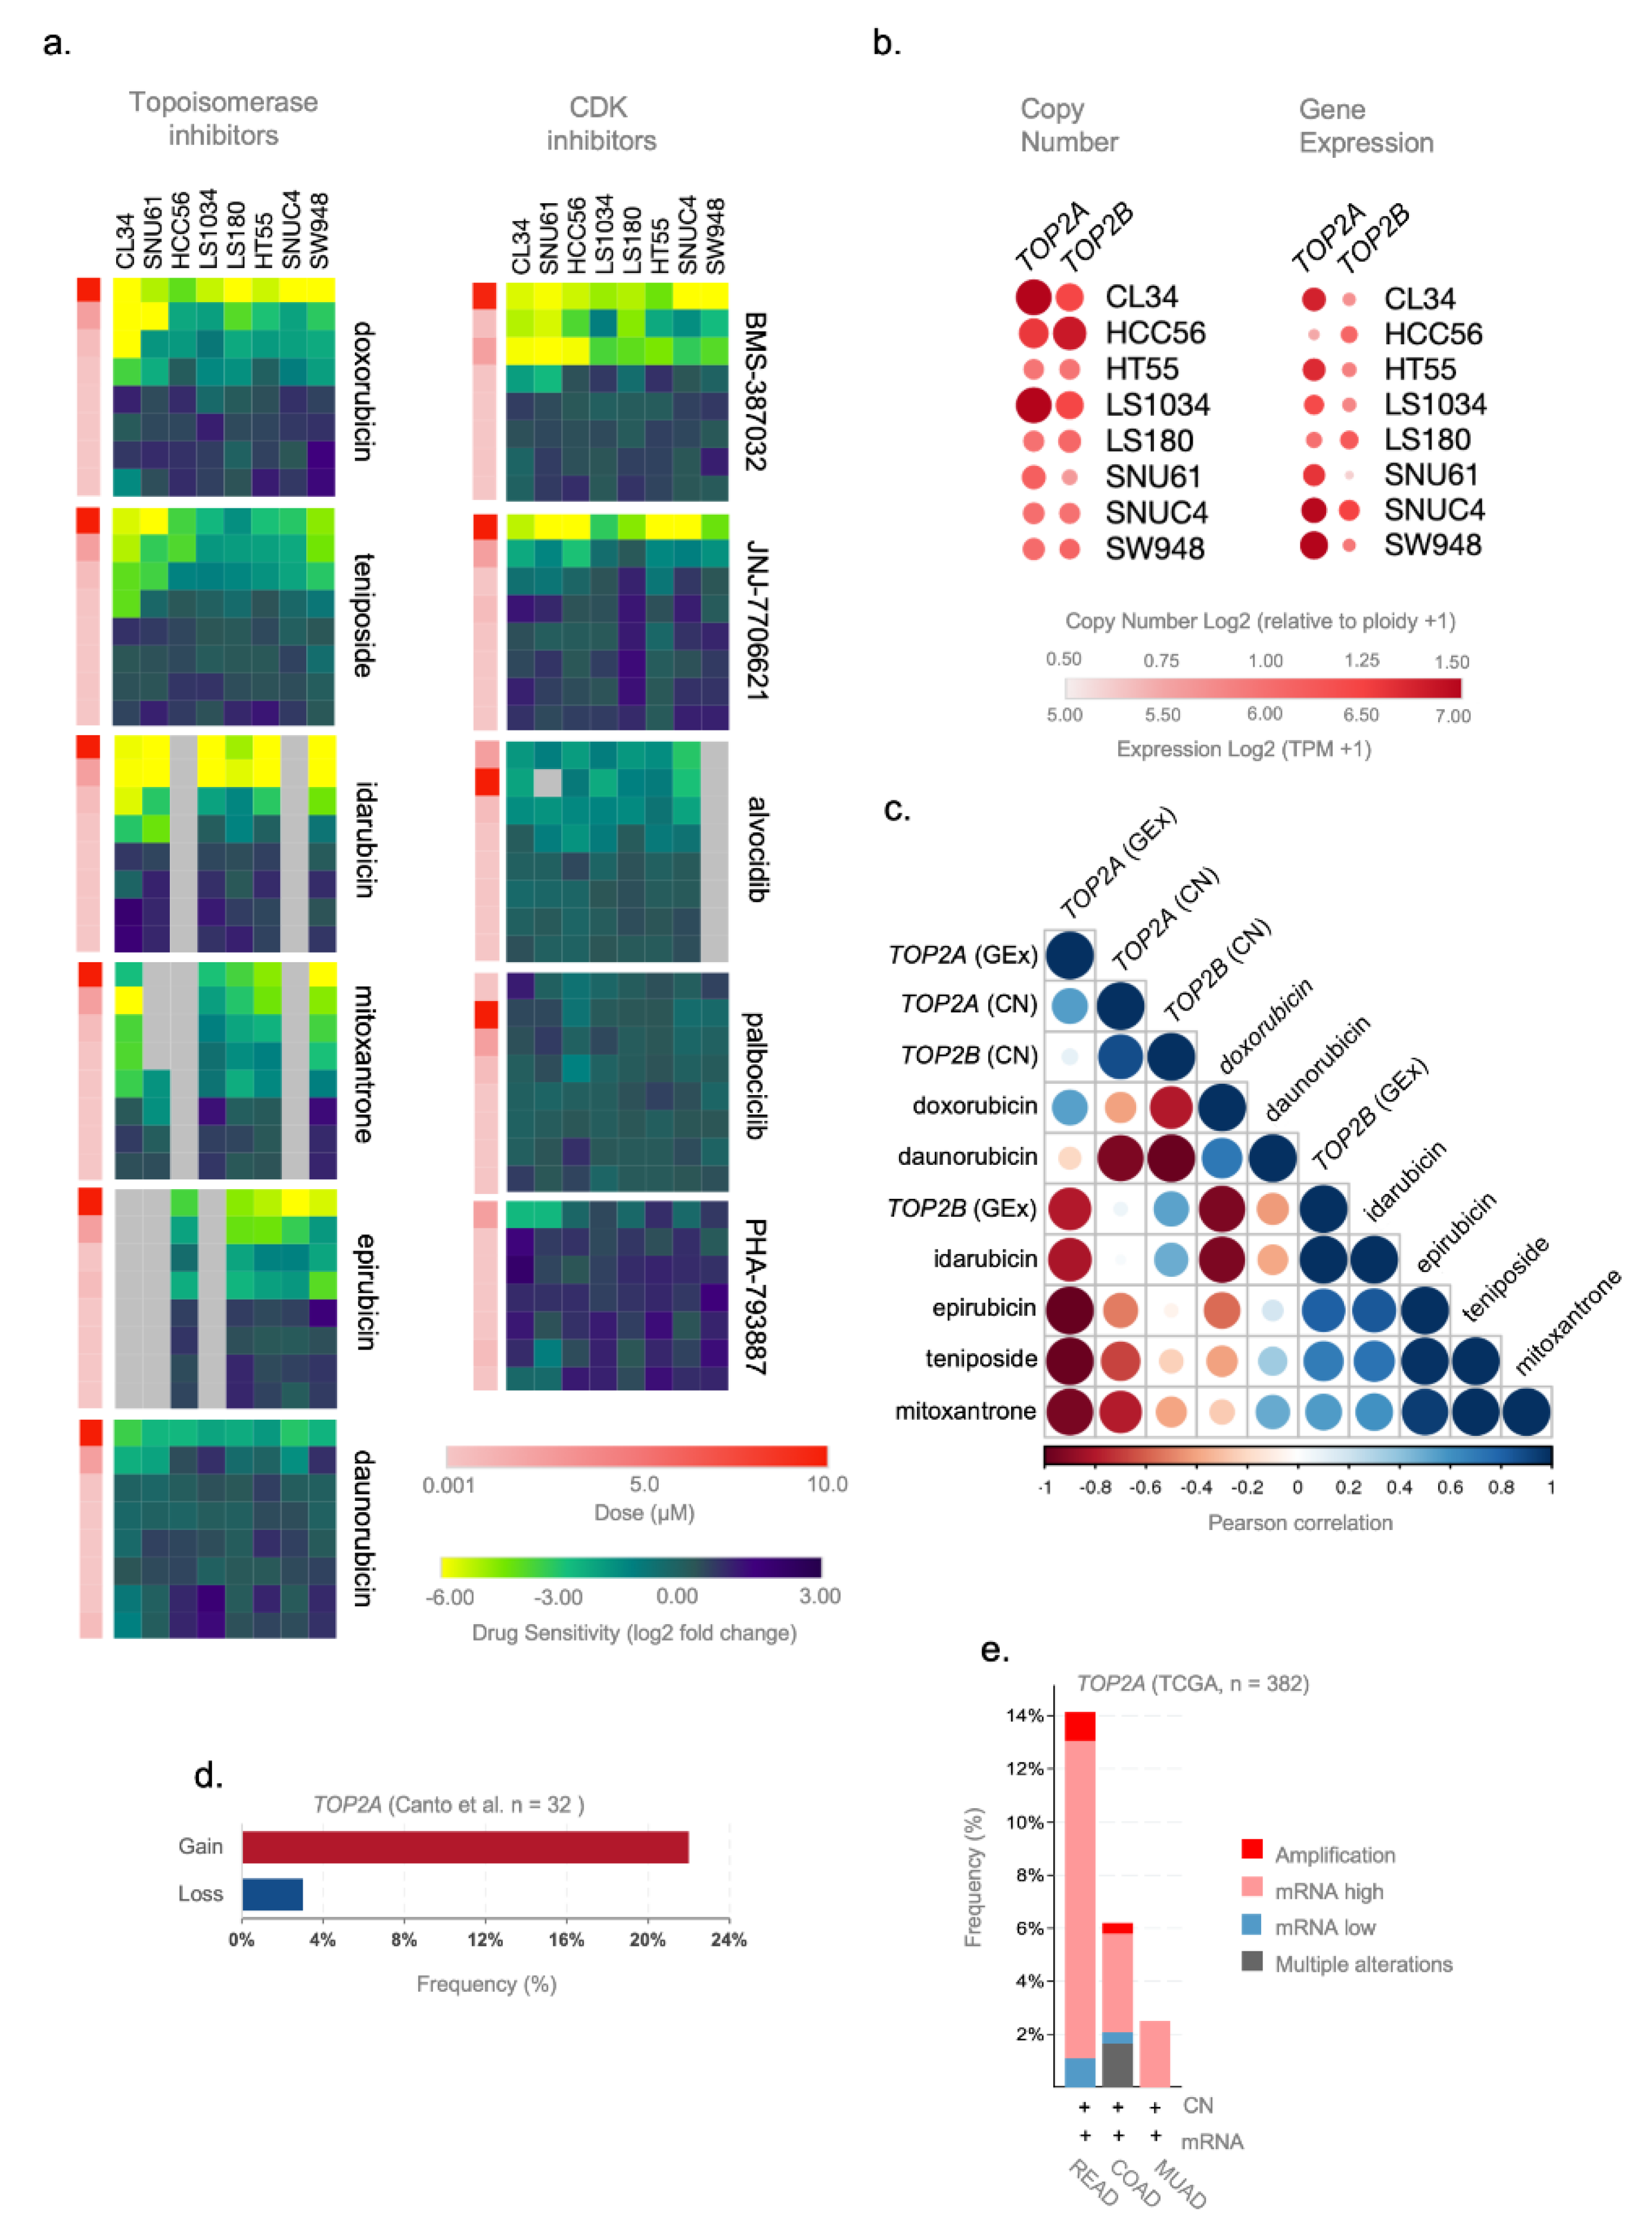
3.4. TOP2A Gene Expression and Copy Number Gene Are Potential Predictive Markers of Topoisomerase Inhibitors Efficacy in ReCa
4. Discussion
Supplementary Materials
Author Contributions
Funding
Institutional Review Board Statement
Informed Consent Statement
Data Availability Statement
Acknowledgments
Conflicts of Interest
References
- Sung, H.; Ferlay, J.; Siegel, R.L.; Laversanne, M.; Soerjomataram, I.; Jemal, A.; Bray, F. Global Cancer Statistics 2020: GLOBOCAN Estimates of Incidence and Mortality Worldwide for 36 Cancers in 185 Countries. CA Cancer J. Clin. 2021, 71, 209–249. [Google Scholar] [CrossRef] [PubMed]
- Moffat, J.G.; Rudolph, J.; Bailey, D. Phenotypic Screening in Cancer Drug Discovery—Past, Present and Future. Nat. Rev. Drug Discov. 2014, 13, 588–602. [Google Scholar] [CrossRef] [PubMed]
- Eder, J.; Sedrani, R.; Wiesmann, C. The Discovery of First-in-Class Drugs: Origins and Evolution. Nat. Rev. Drug Discov. 2014, 13, 577–587. [Google Scholar] [CrossRef] [PubMed]
- Munos, B. Lessons from 60 Years of Pharmaceutical Innovation. Nat. Rev. Drug Discov. 2009, 8, 959–968. [Google Scholar] [CrossRef]
- Paul, S.M.; Mytelka, D.S.; Dunwiddie, C.T.; Persinger, C.C.; Munos, B.H.; Lindborg, S.R.; Schacht, A.L. How to Improve R&D Productivity: The Pharmaceutical Industry’s Grand Challenge. Nat. Rev. Drug Discov. 2010, 9, 203–214. [Google Scholar] [CrossRef]
- Petsko, G.A. When Failure Should Be the Option. BMC Biol. 2010, 8, 61. [Google Scholar] [CrossRef] [Green Version]
- Li, J.; Zheng, S.; Chen, B.; Butte, A.J.; Swamidass, S.J.; Lu, Z. A Survey of Current Trends in Computational Drug Repositioning. Brief. Bioinform. 2016, 17, 2–12. [Google Scholar] [CrossRef] [Green Version]
- Pushpakom, S.; Iorio, F.; Eyers, P.A.; Escott, K.J.; Hopper, S.; Wells, A.; Doig, A.; Guilliams, T.; Latimer, J.; McNamee, C.; et al. Drug Repurposing: Progress, Challenges and Recommendations. Nat. Rev. Drug Discov. 2019, 18, 41–58. [Google Scholar] [CrossRef]
- Ashburn, T.T.; Thor, K.B. Drug Repositioning: Identifying and Developing New Uses for Existing Drugs. Nat. Rev. Drug Discov. 2004, 3, 673–683. [Google Scholar] [CrossRef] [PubMed]
- Zhang, Z.; Zhou, L.; Xie, N.; Nice, E.C.; Zhang, T.; Cui, Y.; Huang, C. Overcoming Cancer Therapeutic Bottleneck by Drug Repurposing. Signal Transduct. Target. Ther. 2020, 5, 113. [Google Scholar] [CrossRef]
- Mottini, C.; Napolitano, F.; Li, Z.; Gao, X.; Cardone, L. Computer-Aided Drug Repurposing for Cancer Therapy: Approaches and Opportunities to Challenge Anticancer Targets. Semin. Cancer Biol. 2021, 68, 59–74. [Google Scholar] [CrossRef]
- Siegel, R.L.; Miller, K.D.; Goding Sauer, A.; Fedewa, S.A.; Butterly, L.F.; Anderson, J.C.; Cercek, A.; Smith, R.A.; Jemal, A. Colorectal Cancer Statistics, 2020. CA Cancer J. Clin. 2020, 70, 145–164. [Google Scholar] [CrossRef] [PubMed] [Green Version]
- Dozois, E.J.; Boardman, L.A.; Suwanthanma, W.; Limburg, P.J.; Cima, R.R.; Bakken, J.L.; Vierkant, R.A.; Aakre, J.A.; Larson, D.W. Young-Onset Colorectal Cancer in Patients with No Known Genetic Predisposition: Can We Increase Early Recognition and Improve Outcome? Medicine 2008, 87, 259–263. [Google Scholar] [CrossRef] [Green Version]
- Vuik, F.E.; Nieuwenburg, S.A.; Bardou, M.; Lansdorp-Vogelaar, I.; Dinis-Ribeiro, M.; Bento, M.J.; Zadnik, V.; Pellisé, M.; Esteban, L.; Kaminski, M.F.; et al. Increasing Incidence of Colorectal Cancer in Young Adults in Europe over the Last 25 Years. Gut 2019, 68, 1820–1826. [Google Scholar] [CrossRef] [PubMed]
- Keller, D.S.; Berho, M.; Perez, R.O.; Wexner, S.D.; Chand, M. The Multidisciplinary Management of Rectal Cancer. Nat. Rev. Gastroenterol. Hepatol. 2020, 17, 414–429. [Google Scholar] [CrossRef] [PubMed]
- Glynne-Jones, R.; Wyrwicz, L.; Tiret, E.; Brown, G.; Rödel, C.; Cervantes, A.; Arnold, D.; ESMO Guidelines Committee. Rectal Cancer: ESMO Clinical Practice Guidelines for Diagnosis, Treatment and Follow-Up. Ann. Oncol. Off. J. Eur. Soc. Med. Oncol. 2017, 28, iv22–iv40. [Google Scholar] [CrossRef]
- Deschner, B.W.; VanderWalde, N.A.; Grothey, A.; Shibata, D. Evolution and Current Status of the Multidisciplinary Management of Locally Advanced Rectal Cancer. JCO Oncol. Pract. 2021, 17, 383–402. [Google Scholar] [CrossRef]
- Marsh, P.J.; James, R.D.; Schofield, P.F. Adjuvant Preoperative Radiotherapy for Locally Advanced Rectal Carcinoma: Results of a Prospective, Randomized Trial. Dis. Colon Rectum 1994, 37, 1205–1214. [Google Scholar] [CrossRef] [PubMed]
- Chang, G.J. Simulating Watch and Wait for Rectal Cancer. Dis. Colon Rectum 2015, 58, 155–156. [Google Scholar] [CrossRef] [Green Version]
- Habr-Gama, A.; São Julião, G.P.; Perez, R.O. Nonoperative Management of Rectal Cancer. Hematol. Oncol. Clin. N. Am. 2015, 29, 135–151. [Google Scholar] [CrossRef]
- Bruheim, K.; Guren, M.G.; Skovlund, E.; Hjermstad, M.J.; Dahl, O.; Frykholm, G.; Carlsen, E.; Tveit, K.M. Late Side Effects and Quality of Life After Radiotherapy for Rectal Cancer. Int. J. Radiat. Oncol. 2010, 76, 1005–1011. [Google Scholar] [CrossRef] [PubMed] [Green Version]
- Emmertsen, K.J.; Laurberg, S. Bowel Dysfunction after Treatment for Rectal Cancer. Acta Oncol. 2008, 47, 994–1003. [Google Scholar] [CrossRef]
- Zorcolo, L.; Rosman, A.S.; Restivo, A.; Pisano, M.; Nigri, G.R.; Fancellu, A.; Melis, M. Complete Pathologic Response after Combined Modality Treatment for Rectal Cancer and Long-Term Survival: A Meta-Analysis. Ann. Surg. Oncol. 2012, 19, 2822–2832. [Google Scholar] [CrossRef]
- Park, I.J.; You, Y.N.; Agarwal, A.; Skibber, J.M.; Rodriguez-Bigas, M.A.; Eng, C.; Feig, B.W.; Das, P.; Krishnan, S.; Crane, C.H.; et al. Neoadjuvant Treatment Response As an Early Response Indicator for Patients With Rectal Cancer. J. Clin. Oncol. 2012, 30, 1770–1776. [Google Scholar] [CrossRef] [PubMed] [Green Version]
- Chand, M.; Siddiqui, M.R.S.; Swift, I.; Brown, G. Systematic Review of Prognostic Importance of Extramural Venous Invasion in Rectal Cancer. World J. Gastroenterol. 2016, 22, 1721–1726. [Google Scholar] [CrossRef] [PubMed] [Green Version]
- Van der Geest, L.G.M.; Lam-Boer, J.; Koopman, M.; Verhoef, C.; Elferink, M.A.G.; De Wilt, J.H.W. Nationwide Trends in Incidence, Treatment and Survival of Colorectal Cancer Patients with Synchronous Metastases. Clin. Exp. Metastasis 2015, 32, 457–465. [Google Scholar] [CrossRef]
- Corsello, S.M.; Nagari, R.T.; Spangler, R.D.; Rossen, J.; Kocak, M.; Bryan, J.G.; Humeidi, R.; Peck, D.; Wu, X.; Tang, A.A.; et al. Discovering the Anticancer Potential of Non-Oncology Drugs by Systematic Viability Profiling. Nat. Cancer 2020, 1, 235–248. [Google Scholar] [CrossRef] [Green Version]
- Subramanian, A.; Narayan, R.; Corsello, S.M.; Peck, D.D.; Natoli, T.E.; Lu, X.; Gould, J.; Davis, J.F.; Tubelli, A.A.; Asiedu, J.K.; et al. A Next Generation Connectivity Map: L1000 Platform and the First 1,000,000 Profiles. Cell 2017, 171, 1437–1452.e17. [Google Scholar] [CrossRef]
- Wang, Z.; Lachmann, A.; Ma’ayan, A. Mining Data and Metadata from the Gene Expression Omnibus. Biophys. Rev. 2019, 11, 103–110. [Google Scholar] [CrossRef] [Green Version]
- Weinstein, J.N.; Collisson, E.A.; Mills, G.B.; Shaw, K.R.M.; Ozenberger, B.A.; Ellrott, K.; Shmulevich, I.; Sander, C.; Stuart, J.M.; The Cancer Genome Atlas Research Network. The Cancer Genome Atlas Pan-Cancer Analysis Project. Nat. Genet. 2013, 45, 1113–1120. [Google Scholar] [CrossRef]
- Barretina, J.; Caponigro, G.; Stransky, N.; Venkatesan, K.; Margolin, A.A.; Kim, S.; Wilson, C.J.; Lehár, J.; Kryukov, G.V.; Sonkin, D.; et al. The Cancer Cell Line Encyclopedia Enables Predictive Modelling of Anticancer Drug Sensitivity. Nature 2012, 483, 603–607. [Google Scholar] [CrossRef]
- Ghandi, M.; Huang, F.W.; Jané-Valbuena, J.; Kryukov, G.V.; Lo, C.C.; McDonald, E.R.; Barretina, J.; Gelfand, E.T.; Bielski, C.M.; Li, H.; et al. Next-Generation Characterization of the Cancer Cell Line Encyclopedia. Nature 2019, 569, 503–508. [Google Scholar] [CrossRef]
- Lamb, J. The Connectivity Map: Using Gene-Expression Signatures to Connect Small Molecules, Genes, and Disease. Science 2006, 313, 1929–1935. [Google Scholar] [CrossRef] [Green Version]
- Corsello, S.M.; Bittker, J.A.; Liu, Z.; Gould, J.; McCarren, P.; Hirschman, J.E.; Johnston, S.E.; Vrcic, A.; Wong, B.; Khan, M.; et al. The Drug Repurposing Hub: A next-Generation Drug Library and Information Resource. Nat. Med. 2017, 23, 405–408. [Google Scholar] [CrossRef] [Green Version]
- Sirota, M.; Dudley, J.T.; Kim, J.; Chiang, A.P.; Morgan, A.A.; Sweet-Cordero, A.; Sage, J.; Butte, A.J. Discovery and Preclinical Validation of Drug Indications Using Compendia of Public Gene Expression Data. Sci. Transl. Med. 2011, 3, 96ra77. [Google Scholar] [CrossRef] [PubMed] [Green Version]
- Jahchan, N.S.; Dudley, J.T.; Mazur, P.K.; Flores, N.; Yang, D.; Palmerton, A.; Zmoos, A.-F.; Vaka, D.; Tran, K.Q.T.; Zhou, M.; et al. A Drug Repositioning Approach Identifies Tricyclic Antidepressants as Inhibitors of Small Cell Lung Cancer and Other Neuroendocrine Tumors. Cancer Discov. 2013, 3, 1364–1377. [Google Scholar] [CrossRef] [Green Version]
- Van Noort, V.; Schölch, S.; Iskar, M.; Zeller, G.; Ostertag, K.; Schweitzer, C.; Werner, K.; Weitz, J.; Koch, M.; Bork, P. Novel Drug Candidates for the Treatment of Metastatic Colorectal Cancer through Global Inverse Gene-Expression Profiling. Cancer Res. 2014, 74, 5690–5699. [Google Scholar] [CrossRef] [PubMed] [Green Version]
- Chen, B.; Wei, W.; Ma, L.; Yang, B.; Gill, R.M.; Chua, M.-S.; Butte, A.J.; So, S. Computational Discovery of Niclosamide Ethanolamine, a Repurposed Drug Candidate That Reduces Growth of Hepatocellular Carcinoma Cells In Vitro and in Mice by Inhibiting Cell Division Cycle 37 Signaling. Gastroenterology 2017, 152, 2022–2036. [Google Scholar] [CrossRef]
- Pessetto, Z.Y.; Chen, B.; Alturkmani, H.; Hyter, S.; Flynn, C.A.; Baltezor, M.; Ma, Y.; Rosenthal, H.G.; Neville, K.A.; Weir, S.J.; et al. In Silico and in Vitro Drug Screening Identifies New Therapeutic Approaches for Ewing Sarcoma. Oncotarget 2017, 8, 4079–4095. [Google Scholar] [CrossRef] [PubMed] [Green Version]
- Mirza, A.N.; Fry, M.A.; Urman, N.M.; Atwood, S.X.; Roffey, J.; Ott, G.R.; Chen, B.; Lee, A.; Brown, A.S.; Aasi, S.Z.; et al. Combined Inhibition of Atypical PKC and Histone Deacetylase 1 Is Cooperative in Basal Cell Carcinoma Treatment. JCI Insight 2017, 2, e97071. [Google Scholar] [CrossRef] [PubMed]
- Zerbini, L.F.; Bhasin, M.K.; De Vasconcellos, J.F.; Paccez, J.D.; Gu, X.; Kung, A.L.; Libermann, T.A. Computational Repositioning and Preclinical Validation of Pentamidine for Renal Cell Cancer. Mol. Cancer Ther. 2014, 13, 1929–1941. [Google Scholar] [CrossRef] [Green Version]
- Chen, B.; Ma, L.; Paik, H.; Sirota, M.; Wei, W.; Chua, M.-S.; So, S.; Butte, A.J. Reversal of Cancer Gene Expression Correlates with Drug Efficacy and Reveals Therapeutic Targets. Nat. Commun. 2017, 8, 16022. [Google Scholar] [CrossRef]
- Hanash, S. Integrated Global Profiling of Cancer. Nat. Rev. Cancer 2004, 4, 638–644. [Google Scholar] [CrossRef]
- Gundersen, G.W.; Jagodnik, K.M.; Woodland, H.; Fernandez, N.F.; Sani, K.; Dohlman, A.B.; Ung, P.M.-U.; Monteiro, C.D.; Schlessinger, A.; Ma’ayan, A. GEN3VA: Aggregation and Analysis of Gene Expression Signatures from Related Studies. BMC Bioinform. 2016, 17, 461. [Google Scholar] [CrossRef] [Green Version]
- The Cancer Genome Atlas Network. Comprehensive Molecular Characterization of Human Colon and Rectal Cancer. Nature 2012, 487, 330–337. [Google Scholar] [CrossRef] [PubMed] [Green Version]
- Lonsdale, J.; Thomas, J.; Salvatore, M.; Phillips, R.; Lo, E.; Shad, S.; Hasz, R.; Walters, G.; Garcia, F.; Young, N.; et al. The Genotype-Tissue Expression (GTEx) Project. Nat. Genet. 2013, 45, 580–585. [Google Scholar] [CrossRef]
- Smyth, G.K. Limma: Linear Models for Microarray Data. In Bioinformatics and Computational Biology Solutions Using R and Bioconductor; Statistics for Biology and Health; Gentleman, R., Carey, V.J., Huber, W., Irizarry, R.A., Dudoit, S., Eds.; Springer: New York, NY, USA, 2005; pp. 397–420. ISBN 978-0-387-25146-2. [Google Scholar]
- Robinson, M.D.; McCarthy, D.J.; Smyth, G.K. EdgeR: A Bioconductor Package for Differential Expression Analysis of Digital Gene Expression Data. Bioinforma. Oxf. Engl. 2010, 26, 139–140. [Google Scholar] [CrossRef] [PubMed] [Green Version]
- Zeng, B.; Glicksberg, B.S.; Newbury, P.; Chekalin, E.; Xing, J.; Liu, K.; Wen, A.; Chow, C.; Chen, B. OCTAD: An Open Workspace for Virtually Screening Therapeutics Targeting Precise Cancer Patient Groups Using Gene Expression Features. Nat. Protoc. 2021, 16, 728–753. [Google Scholar] [CrossRef] [PubMed]
- Zeng, W.Z.D.; Glicksberg, B.S.; Li, Y.; Chen, B. Selecting Precise Reference Normal Tissue Samples for Cancer Research Using a Deep Learning Approach. BMC Med. Genom. 2019, 12, 21. [Google Scholar] [CrossRef] [Green Version]
- Kuleshov, M.V.; Jones, M.R.; Rouillard, A.D.; Fernandez, N.F.; Duan, Q.; Wang, Z.; Koplev, S.; Jenkins, S.L.; Jagodnik, K.M.; Lachmann, A.; et al. Enrichr: A Comprehensive Gene Set Enrichment Analysis Web Server 2016 Update. Nucleic Acids Res. 2016, 44, W90–W97. [Google Scholar] [CrossRef] [Green Version]
- Chen, E.Y.; Tan, C.M.; Kou, Y.; Duan, Q.; Wang, Z.; Meirelles, G.; Clark, N.R.; Ma’ayan, A. Enrichr: Interactive and Collaborative HTML5 Gene List Enrichment Analysis Tool. BMC Bioinform. 2013, 14, 128. [Google Scholar] [CrossRef] [PubMed] [Green Version]
- Xie, Z.; Bailey, A.; Kuleshov, M.V.; Clarke, D.J.B.; Evangelista, J.E.; Jenkins, S.L.; Lachmann, A.; Wojciechowicz, M.L.; Kropiwnicki, E.; Jagodnik, K.M.; et al. Gene Set Knowledge Discovery with Enrichr. Curr. Protoc. 2021, 1, e90. [Google Scholar] [CrossRef]
- Zhou, Y.; Zhou, B.; Pache, L.; Chang, M.; Khodabakhshi, A.H.; Tanaseichuk, O.; Benner, C.; Chanda, S.K. Metascape Provides a Biologist-Oriented Resource for the Analysis of Systems-Level Datasets. Nat. Commun. 2019, 10, 1523. [Google Scholar] [CrossRef]
- Cohen, J. A Coefficient of Agreement for Nominal Scales. Educ. Psychol. Meas. 1960, 20, 37–46. [Google Scholar] [CrossRef]
- Bader, G.D.; Hogue, C.W.V. An Automated Method for Finding Molecular Complexes in Large Protein Interaction Networks. BMC Bioinform. 2003, 4, 2. [Google Scholar] [CrossRef] [Green Version]
- Shimada, K.; Bachman, J.A.; Muhlich, J.L.; Mitchison, T.J. ShinyDepMap, a Tool to Identify Targetable Cancer Genes and Their Functional Connections from Cancer Dependency Map Data. eLife 2021, 10, e57116. [Google Scholar] [CrossRef]
- Tsherniak, A.; Vazquez, F.; Montgomery, P.G.; Weir, B.A.; Kryukov, G.; Cowley, G.S.; Gill, S.; Harrington, W.F.; Pantel, S.; Krill-Burger, J.M.; et al. Defining a Cancer Dependency Map. Cell 2017, 170, 564–576.e16. [Google Scholar] [CrossRef] [Green Version]
- Depmap Release: Broad, D. Public_21q1. 2021. Available online: https://doi.org/10.6084/m9.figshare.13681534.v1 (accessed on 11 June 2021).
- Meyers, R.M.; Bryan, J.G.; McFarland, J.M.; Weir, B.A.; Sizemore, A.E.; Xu, H.; Dharia, N.V.; Montgomery, P.G.; Cowley, G.S.; Pantel, S.; et al. Computational Correction of Copy Number Effect Improves Specificity of CRISPR–Cas9 Essentiality Screens in Cancer Cells. Nat. Genet. 2017, 49, 1779–1784. [Google Scholar] [CrossRef] [Green Version]
- Dempster, J.M.; Rossen, J.; Kazachkova, M.; Pan, J.; Kugener, G.; Root, D.E.; Tsherniak, A. Extracting Biological Insights from the Project Achilles Genome-Scale CRISPR Screens in Cancer Cell Lines. BioRxiv 2019, 720243. [Google Scholar] [CrossRef]
- Warren, A.; Chen, Y.; Jones, A.; Shibue, T.; Hahn, W.C.; Boehm, J.S.; Vazquez, F.; Tsherniak, A.; McFarland, J.M. Global Computational Alignment of Tumor and Cell Line Transcriptional Profiles. Nat. Commun. 2021, 12, 22. [Google Scholar] [CrossRef] [PubMed]
- Yu, K.; Chen, B.; Aran, D.; Charalel, J.; Yau, C.; Wolf, D.M.; Van ’t Veer, L.J.; Butte, A.J.; Goldstein, T.; Sirota, M. Comprehensive Transcriptomic Analysis of Cell Lines as Models of Primary Tumors across 22 Tumor Types. Nat. Commun. 2019, 10, 3574. [Google Scholar] [CrossRef] [PubMed] [Green Version]
- do Canto, L.M.; Larsen, S.J.; Catin Kupper, B.E.; Begnami, M.D.F.S.; Scapulatempo-Neto, C.; Petersen, A.H.; Aagaard, M.M.; Baumbach, J.; Aguiar, S.; Rogatto, S.R. Increased Levels of Genomic Instability and Mutations in Homologous Recombination Genes in Locally Advanced Rectal Carcinomas. Front. Oncol. 2019, 9, 395. [Google Scholar] [CrossRef]
- Cerami, E.; Gao, J.; Dogrusoz, U.; Gross, B.E.; Sumer, S.O.; Aksoy, B.A.; Jacobsen, A.; Byrne, C.J.; Heuer, M.L.; Larsson, E.; et al. The CBio Cancer Genomics Portal: An Open Platform for Exploring Multidimensional Cancer Genomics Data: Figure 1. Cancer Discov. 2012, 2, 401–404. [Google Scholar] [CrossRef] [Green Version]
- Gao, J.; Aksoy, B.A.; Dogrusoz, U.; Dresdner, G.; Gross, B.; Sumer, S.O.; Sun, Y.; Jacobsen, A.; Sinha, R.; Larsson, E.; et al. Integrative Analysis of Complex Cancer Genomics and Clinical Profiles Using the CBioPortal. Sci. Signal. 2013, 6, pl1. [Google Scholar] [CrossRef] [PubMed] [Green Version]
- Khan, A.; Mathelier, A. Intervene: A Tool for Intersection and Visualization of Multiple Gene or Genomic Region Sets. BMC Bioinform. 2017, 18, 287. [Google Scholar] [CrossRef] [PubMed] [Green Version]
- Clarke, D.J.B.; Kuleshov, M.V.; Schilder, B.M.; Torre, D.; Duffy, M.E.; Keenan, A.B.; Lachmann, A.; Feldmann, A.S.; Gundersen, G.W.; Silverstein, M.C.; et al. EXpression2Kinases (X2K) Web: Linking Expression Signatures to Upstream Cell Signaling Networks. Nucleic Acids Res. 2018, 46, W171–W179. [Google Scholar] [CrossRef] [PubMed] [Green Version]
- Starruß, J.; de Back, W.; Brusch, L.; Deutsch, A. Morpheus: A User-Friendly Modeling Environment for Multiscale and Multicellular Systems Biology. Bioinformatics 2014, 30, 1331–1332. [Google Scholar] [CrossRef] [PubMed] [Green Version]
- Goedhart, J.; Luijsterburg, M.S. VolcaNoseR Is a Web App for Creating, Exploring, Labeling and Sharing Volcano Plots. Sci. Rep. 2020, 10, 20560. [Google Scholar] [CrossRef] [PubMed]
- Guo, H.; Zeng, W.; Feng, L.; Yu, X.; Li, P.; Zhang, K.; Zhou, Z.; Cheng, S. Integrated Transcriptomic Analysis of Distance-Related Field Cancerization in Rectal Cancer Patients. Oncotarget 2017, 8, 61107–61117. [Google Scholar] [CrossRef] [Green Version]
- Hu, Y.; Gaedcke, J.; Emons, G.; Beissbarth, T.; Grade, M.; Jo, P.; Yeager, M.; Chanock, S.J.; Wolff, H.; Camps, J.; et al. Colorectal Cancer Susceptibility Loci as Predictive Markers of Rectal Cancer Prognosis after Surgery. Genes Chromosomes Cancer 2018, 57, 140–149. [Google Scholar] [CrossRef]
- Millino, C.; Maretto, I.; Pacchioni, B.; Digito, M.; De Paoli, A.; Canzonieri, V.; D’Angelo, E.; Agostini, M.; Rizzolio, F.; Giordano, A.; et al. Gene and MicroRNA Expression Are Predictive of Tumor Response in Rectal Adenocarcinoma Patients Treated With Preoperative Chemoradiotherapy: Combined Mirnas and Gene Expression. J. Cell. Physiol. 2017, 232, 426–435. [Google Scholar] [CrossRef] [PubMed]
- Verstraete, M.; Debucquoy, A.; Dekervel, J.; Van Pelt, J.; Verslype, C.; Devos, E.; Chiritescu, G.; Dumon, K.; D’Hoore, A.; Gevaert, O.; et al. Combining Bevacizumab and Chemoradiation in Rectal Cancer. Translational Results of the AXEBeam Trial. Br. J. Cancer 2015, 112, 1314–1325. [Google Scholar] [CrossRef] [PubMed] [Green Version]
- Gaedcke, J.; Grade, M.; Jung, K.; Camps, J.; Jo, P.; Emons, G.; Gehoff, A.; Sax, U.; Schirmer, M.; Becker, H.; et al. Mutated KRAS Results in Overexpression of DUSP4, a MAP-Kinase Phosphatase, and SMYD3, a Histone Methyltransferase, in Rectal Carcinomas. Genes Chromosomes Cancer 2010, 49, 1024–1034. [Google Scholar] [CrossRef] [Green Version]
- Benson, J.D.; Chen, Y.-N.P.; Cornell-Kennon, S.A.; Dorsch, M.; Kim, S.; Leszczyniecka, M.; Sellers, W.R.; Lengauer, C. Validating Cancer Drug Targets. Nature 2006, 441, 451–456. [Google Scholar] [CrossRef]
- Lapenna, S.; Giordano, A. Cell Cycle Kinases as Therapeutic Targets for Cancer. Nat. Rev. Drug Discov. 2009, 8, 547–566. [Google Scholar] [CrossRef]
- Lachmann, A.; Torre, D.; Keenan, A.B.; Jagodnik, K.M.; Lee, H.J.; Wang, L.; Silverstein, M.C.; Ma’ayan, A. Massive Mining of Publicly Available RNA-Seq Data from Human and Mouse. Nat. Commun. 2018, 9, 1366. [Google Scholar] [CrossRef] [PubMed] [Green Version]
- Ganesh, K.; Wu, C.; O’Rourke, K.P.; Szeglin, B.C.; Zheng, Y.; Sauvé, C.-E.G.; Adileh, M.; Wasserman, I.; Marco, M.R.; Kim, A.S.; et al. A Rectal Cancer Organoid Platform to Study Individual Responses to Chemoradiation. Nat. Med. 2019, 25, 1607–1614. [Google Scholar] [CrossRef]
- Hevener, E.; Verstak, T.A.; Lutat, K.E.; Riggsbee, D.L.; Mooney, J.W. Recent Developments in Topoisomerase-Targeted Cancer Chemotherapy. Acta Pharm. Sin. B 2018, 8, 844–861. [Google Scholar] [CrossRef]
- Schettini, F.; De Santo, I.; Rea, C.G.; De Placido, P.; Formisano, L.; Giuliano, M.; Arpino, G.; De Laurentiis, M.; Puglisi, F.; De Placido, S.; et al. CDK 4/6 Inhibitors as Single Agent in Advanced Solid Tumors. Front. Oncol. 2018, 8, 608. [Google Scholar] [CrossRef] [PubMed] [Green Version]
- Gilbert, D.C.; Chalmers, A.J.; El-Khamisy, S.F. Topoisomerase I Inhibition in Colorectal Cancer: Biomarkers and Therapeutic Targets. Br. J. Cancer 2012, 106, 18–24. [Google Scholar] [CrossRef] [Green Version]
- Willeke, F.; Horisberger, K.; Kraus-Tiefenbacher, U.; Wenz, F.; Leitner, A.; Hochhaus, A.; Grobholz, R.; Willer, A.; Kähler, G.; Post, S.; et al. A Phase II Study of Capecitabine and Irinotecan in Combination with Concurrent Pelvic Radiotherapy (CapIri-RT) as Neoadjuvant Treatment of Locally Advanced Rectal Cancer. Br. J. Cancer 2007, 96, 912–917. [Google Scholar] [CrossRef] [PubMed]
- Glynne-Jones, R.; Falk, S.; Maughan, T.S.; Meadows, H.M.; Sebag-Montefiore, D. A Phase I/II Study of Irinotecan When Added to 5-Fluorouracil and Leucovorin and Pelvic Radiation in Locally Advanced Rectal Cancer: A Colorectal Clinical Oncology Group Study. Br. J. Cancer 2007, 96, 551–558. [Google Scholar] [CrossRef] [PubMed] [Green Version]
- Gollins, S.; Sun Myint, A.; Haylock, B.; Wise, M.; Saunders, M.; Neupane, R.; Essapen, S.; Samuel, L.; Dougal, M.; Lloyd, A.; et al. Preoperative Chemoradiotherapy Using Concurrent Capecitabine and Irinotecan in Magnetic Resonance Imaging–Defined Locally Advanced Rectal Cancer: Impact on Long-Term Clinical Outcomes. J. Clin. Oncol. 2011, 29, 1042–1049. [Google Scholar] [CrossRef]
- Wang, J.; Fan, J.; Li, C.; Yang, L.; Wan, J.; Zhang, H.; Zhang, Z.; Zhu, J. The Impact of Chemotherapy Completion on the Efficacy of Irinotecan in the Preoperative Chemoradiotherapy of Locally Advanced Rectal Cancer: An Expanded Analysis of the CinClare Phase III Trial. Clin. Colorectal Cancer 2020, 19, e58–e69. [Google Scholar] [CrossRef]
- Kolarić, K.; Potrebica, V.; Stanovnik, M. Controlled Phase III Clinical Study of 4-Epi-Doxorubicin + 5-Fluorouracil versus 5-Fluorouracil Alone in Metastatic Gastric and Rectosigmoid Cancer. Oncology 1986, 43, 73–77. [Google Scholar] [CrossRef]
- Ferrazzi, E.; Pappagallo, G.L.; Nicoletto, O.; Fornasiero, A.; Refatti, F.; Cartei, G.; Vinante, O.; Fiorentino, M.V. Phase II Evaluation of 4’epi-Doxorubicin in Patients with Metastatic Colorectal Carcinoma. Tumori 1984, 70, 297–300. [Google Scholar] [CrossRef] [PubMed]
- Leo, A.D.; Desmedt, C.; Bartlett, J.M.S.; Piette, F.; Ejlertsen, B.; Pritchard, K.I.; Larsimont, D.; Poole, C.; Isola, J.; Earl, H.; et al. HER2 and TOP2A as Predictive Markers for Anthracycline-Containing Chemotherapy Regimens as Adjuvant Treatment of Breast Cancer: A Meta-Analysis of Individual Patient Data. Lancet Oncol. 2011, 12, 1134–1142. [Google Scholar] [CrossRef]
- Du, Y.; Zhou, Q.; Yin, W.; Zhou, L.; Di, G.; Shen, Z.; Shao, Z.; Lu, J. The Role of Topoisomerase IIα in Predicting Sensitivity to Anthracyclines in Breast Cancer Patients: A Meta-Analysis of Published Literatures. Breast Cancer Res. Treat. 2011, 129, 839–848. [Google Scholar] [CrossRef]
- Al-Kuraya, K.; Novotny, H.; Bavi, P.; Siraj, A.K.; Uddin, S.; Ezzat, A.; Sanea, N.A.; Al-Dayel, F.; Al-Mana, H.; Sheikh, S.S.; et al. HER2, TOP2A, CCND1, EGFR and C-MYC Oncogene Amplification in Colorectal Cancer. J. Clin. Pathol. 2006, 60, 768–772. [Google Scholar] [CrossRef]
- Sønderstrup, I.M.H.; Nygård, S.B.; Poulsen, T.S.; Linnemann, D.; Stenvang, J.; Nielsen, H.J.; Bartek, J.; Brünner, N.; Nørgaard, P.; Riis, L. Topoisomerase-1 and -2A Gene Copy Numbers Are Elevated in Mismatch Repair-Proficient Colorectal Cancers. Mol. Oncol. 2015, 9, 1207–1217. [Google Scholar] [CrossRef]
- Nygård, S.B.; Christensen, I.J.; Smith, D.H.; Nielsen, S.L.; Jensen, N.F.; Nielsen, H.J.; Vainer, B.; Brünner, N. Underpinning the Repurposing of Anthracyclines towards Colorectal Cancer: Assessment of Topoisomerase II Alpha Gene Copy Number Alterations in Colorectal Cancer. Scand. J. Gastroenterol. 2013, 48, 1436–1443. [Google Scholar] [CrossRef]
- Coss, A.; Tosetto, M.; Fox, E.J.; Sapetto-Rebow, B.; Gorman, S.; Kennedy, B.N.; Lloyd, A.T.; Hyland, J.M.; O’Donoghue, D.P.; Sheahan, K.; et al. Increased Topoisomerase IIα Expression in Colorectal Cancer Is Associated with Advanced Disease and Chemotherapeutic Resistance via Inhibition of Apoptosis. Cancer Lett. 2009, 276, 228–238. [Google Scholar] [CrossRef]
- Tarpgaard, L.S.; Qvortrup, C.; Nielsen, S.L.; Stenvang, J.; Detlefsen, S.; Brünner, N.; Pfeiffer, P. New Use for Old Drugs: Epirubicin in Colorectal Cancer. Acta Oncol. 2021, 60, 954–956. [Google Scholar] [CrossRef] [PubMed]
- Karnitz, L.M.; Zou, L. Molecular Pathways: Targeting ATR in Cancer Therapy. Clin. Cancer Res. 2015, 21, 4780–4785. [Google Scholar] [CrossRef] [Green Version]
- Kent, L.N.; Leone, G. The Broken Cycle: E2F Dysfunction in Cancer. Nat. Rev. Cancer 2019, 19, 326–338. [Google Scholar] [CrossRef] [PubMed]
- Jahangiri, A.; Aghi, M.K.; Carbonell, W.S. Β1 Integrin: Critical Path to Antiangiogenic Therapy Resistance and Beyond. Cancer Res. 2014, 74, 3–7. [Google Scholar] [CrossRef] [Green Version]
- Stewart, M.D.; Sanderson, R.D. Heparan Sulfate in the Nucleus and Its Control of Cellular Functions. Matrix Biol. 2014, 35, 56–59. [Google Scholar] [CrossRef] [PubMed]
- Girdler, F.; Gascoigne, K.E.; Eyers, P.A.; Hartmuth, S.; Crafter, C.; Foote, K.M.; Keen, N.J.; Taylor, S.S. Validating Aurora B as an Anti-Cancer Drug Target. J. Cell Sci. 2006, 119, 3664–3675. [Google Scholar] [CrossRef] [Green Version]
- Pohl, A.; Azuma, M.; Zhang, W.; Yang, D.; Ning, Y.; Winder, T.; Danenberg, K.; Lenz, H.-J. Pharmacogenetic Profiling of Aurora Kinase B Is Associated with Overall Survival in Metastatic Colorectal Cancer. Pharm. J. 2011, 11, 93–99. [Google Scholar] [CrossRef] [Green Version]
- Pillaire, M.-J.; Selves, J.; Gordien, K.; Gouraud, P.-A.; Gentil, C.; Danjoux, M.; Do, C.; Negre, V.; Bieth, A.; Guimbaud, R.; et al. A ‘DNA Replication’ Signature of Progression and Negative Outcome in Colorectal Cancer. Oncogene 2010, 29, 876–887. [Google Scholar] [CrossRef]
- Solier, S.; Zhang, Y.-W.; Ballestrero, A.; Pommier, Y.; Zoppoli, G. DNA Damage Response Pathways and Cell Cycle Checkpoints in Colorectal Cancer: Current Concepts and Future Perspectives for Targeted Treatment. Curr. Cancer Drug Targets 2012, 12, 356–371. [Google Scholar] [CrossRef] [PubMed]
- Nakagawa, S.; Miyoshi, N.; Ishii, H.; Mimori, K.; Tanaka, F.; Sekimoto, M.; Doki, Y.; Mori, M. Expression of CLDN1 in Colorectal Cancer: A Novel Marker for Prognosis. Int. J. Oncol. 2011, 39, 791–796. [Google Scholar] [CrossRef] [PubMed] [Green Version]
- Imai, K.; Hirata, S.; Irie, A.; Senju, S.; Ikuta, Y.; Yokomine, K.; Harao, M.; Inoue, M.; Tsunoda, T.; Nakatsuru, S.; et al. Identification of a Novel Tumor-Associated Antigen, Cadherin 3/P-Cadherin, as a Possible Target for Immunotherapy of Pancreatic, Gastric, and Colorectal Cancers. Clin. Cancer Res. 2008, 14, 6487–6495. [Google Scholar] [CrossRef] [Green Version]
- Kaneda, H.; Arao, T.; Tanaka, K.; Tamura, D.; Aomatsu, K.; Kudo, K.; Sakai, K.; De Velasco, M.A.; Matsumoto, K.; Fujita, Y.; et al. FOXQ1 Is Overexpressed in Colorectal Cancer and Enhances Tumorigenicity and Tumor Growth. Cancer Res. 2010, 70, 2053–2063. [Google Scholar] [CrossRef] [Green Version]
- Lin, J.; Fan, X.; Chen, J.; Xie, X.; Yu, H. Small Interfering RNA-mediated Knockdown of KRT80 Suppresses Colorectal Cancer Proliferation. Exp. Ther. Med. 2020, 20, 176. [Google Scholar] [CrossRef] [PubMed]
- Weeber, F.; Ooft, S.N.; Dijkstra, K.K.; Voest, E.E. Tumor Organoids as a Pre-Clinical Cancer Model for Drug Discovery. Cell Chem. Biol. 2017, 24, 1092–1100. [Google Scholar] [CrossRef] [PubMed]
- LeSavage, B.L.; Suhar, R.A.; Broguiere, N.; Lutolf, M.P.; Heilshorn, S.C. Next-Generation Cancer Organoids. Nat. Mater. 2021. [Google Scholar] [CrossRef]
- Driehuis, E.; Kretzschmar, K.; Clevers, H. Establishment of Patient-Derived Cancer Organoids for Drug-Screening Applications. Nat. Protoc. 2020, 15, 3380–3409. [Google Scholar] [CrossRef]


Publisher’s Note: MDPI stays neutral with regard to jurisdictional claims in published maps and institutional affiliations. |
© 2021 by the authors. Licensee MDPI, Basel, Switzerland. This article is an open access article distributed under the terms and conditions of the Creative Commons Attribution (CC BY) license (https://creativecommons.org/licenses/by/4.0/).
Share and Cite
Carvalho, R.F.; do Canto, L.M.; Cury, S.S.; Frøstrup Hansen, T.; Jensen, L.H.; Rogatto, S.R. Drug Repositioning Based on the Reversal of Gene Expression Signatures Identifies TOP2A as a Therapeutic Target for Rectal Cancer. Cancers 2021, 13, 5492. https://doi.org/10.3390/cancers13215492
Carvalho RF, do Canto LM, Cury SS, Frøstrup Hansen T, Jensen LH, Rogatto SR. Drug Repositioning Based on the Reversal of Gene Expression Signatures Identifies TOP2A as a Therapeutic Target for Rectal Cancer. Cancers. 2021; 13(21):5492. https://doi.org/10.3390/cancers13215492
Chicago/Turabian StyleCarvalho, Robson Francisco, Luisa Matos do Canto, Sarah Santiloni Cury, Torben Frøstrup Hansen, Lars Henrik Jensen, and Silvia Regina Rogatto. 2021. "Drug Repositioning Based on the Reversal of Gene Expression Signatures Identifies TOP2A as a Therapeutic Target for Rectal Cancer" Cancers 13, no. 21: 5492. https://doi.org/10.3390/cancers13215492