
Treatment with Autophagy Inducer Trehalose Alleviates Memory and Behavioral Impairments and Neuroinflammatory Brain Processes in db/db Mice


 ,
,  and
and 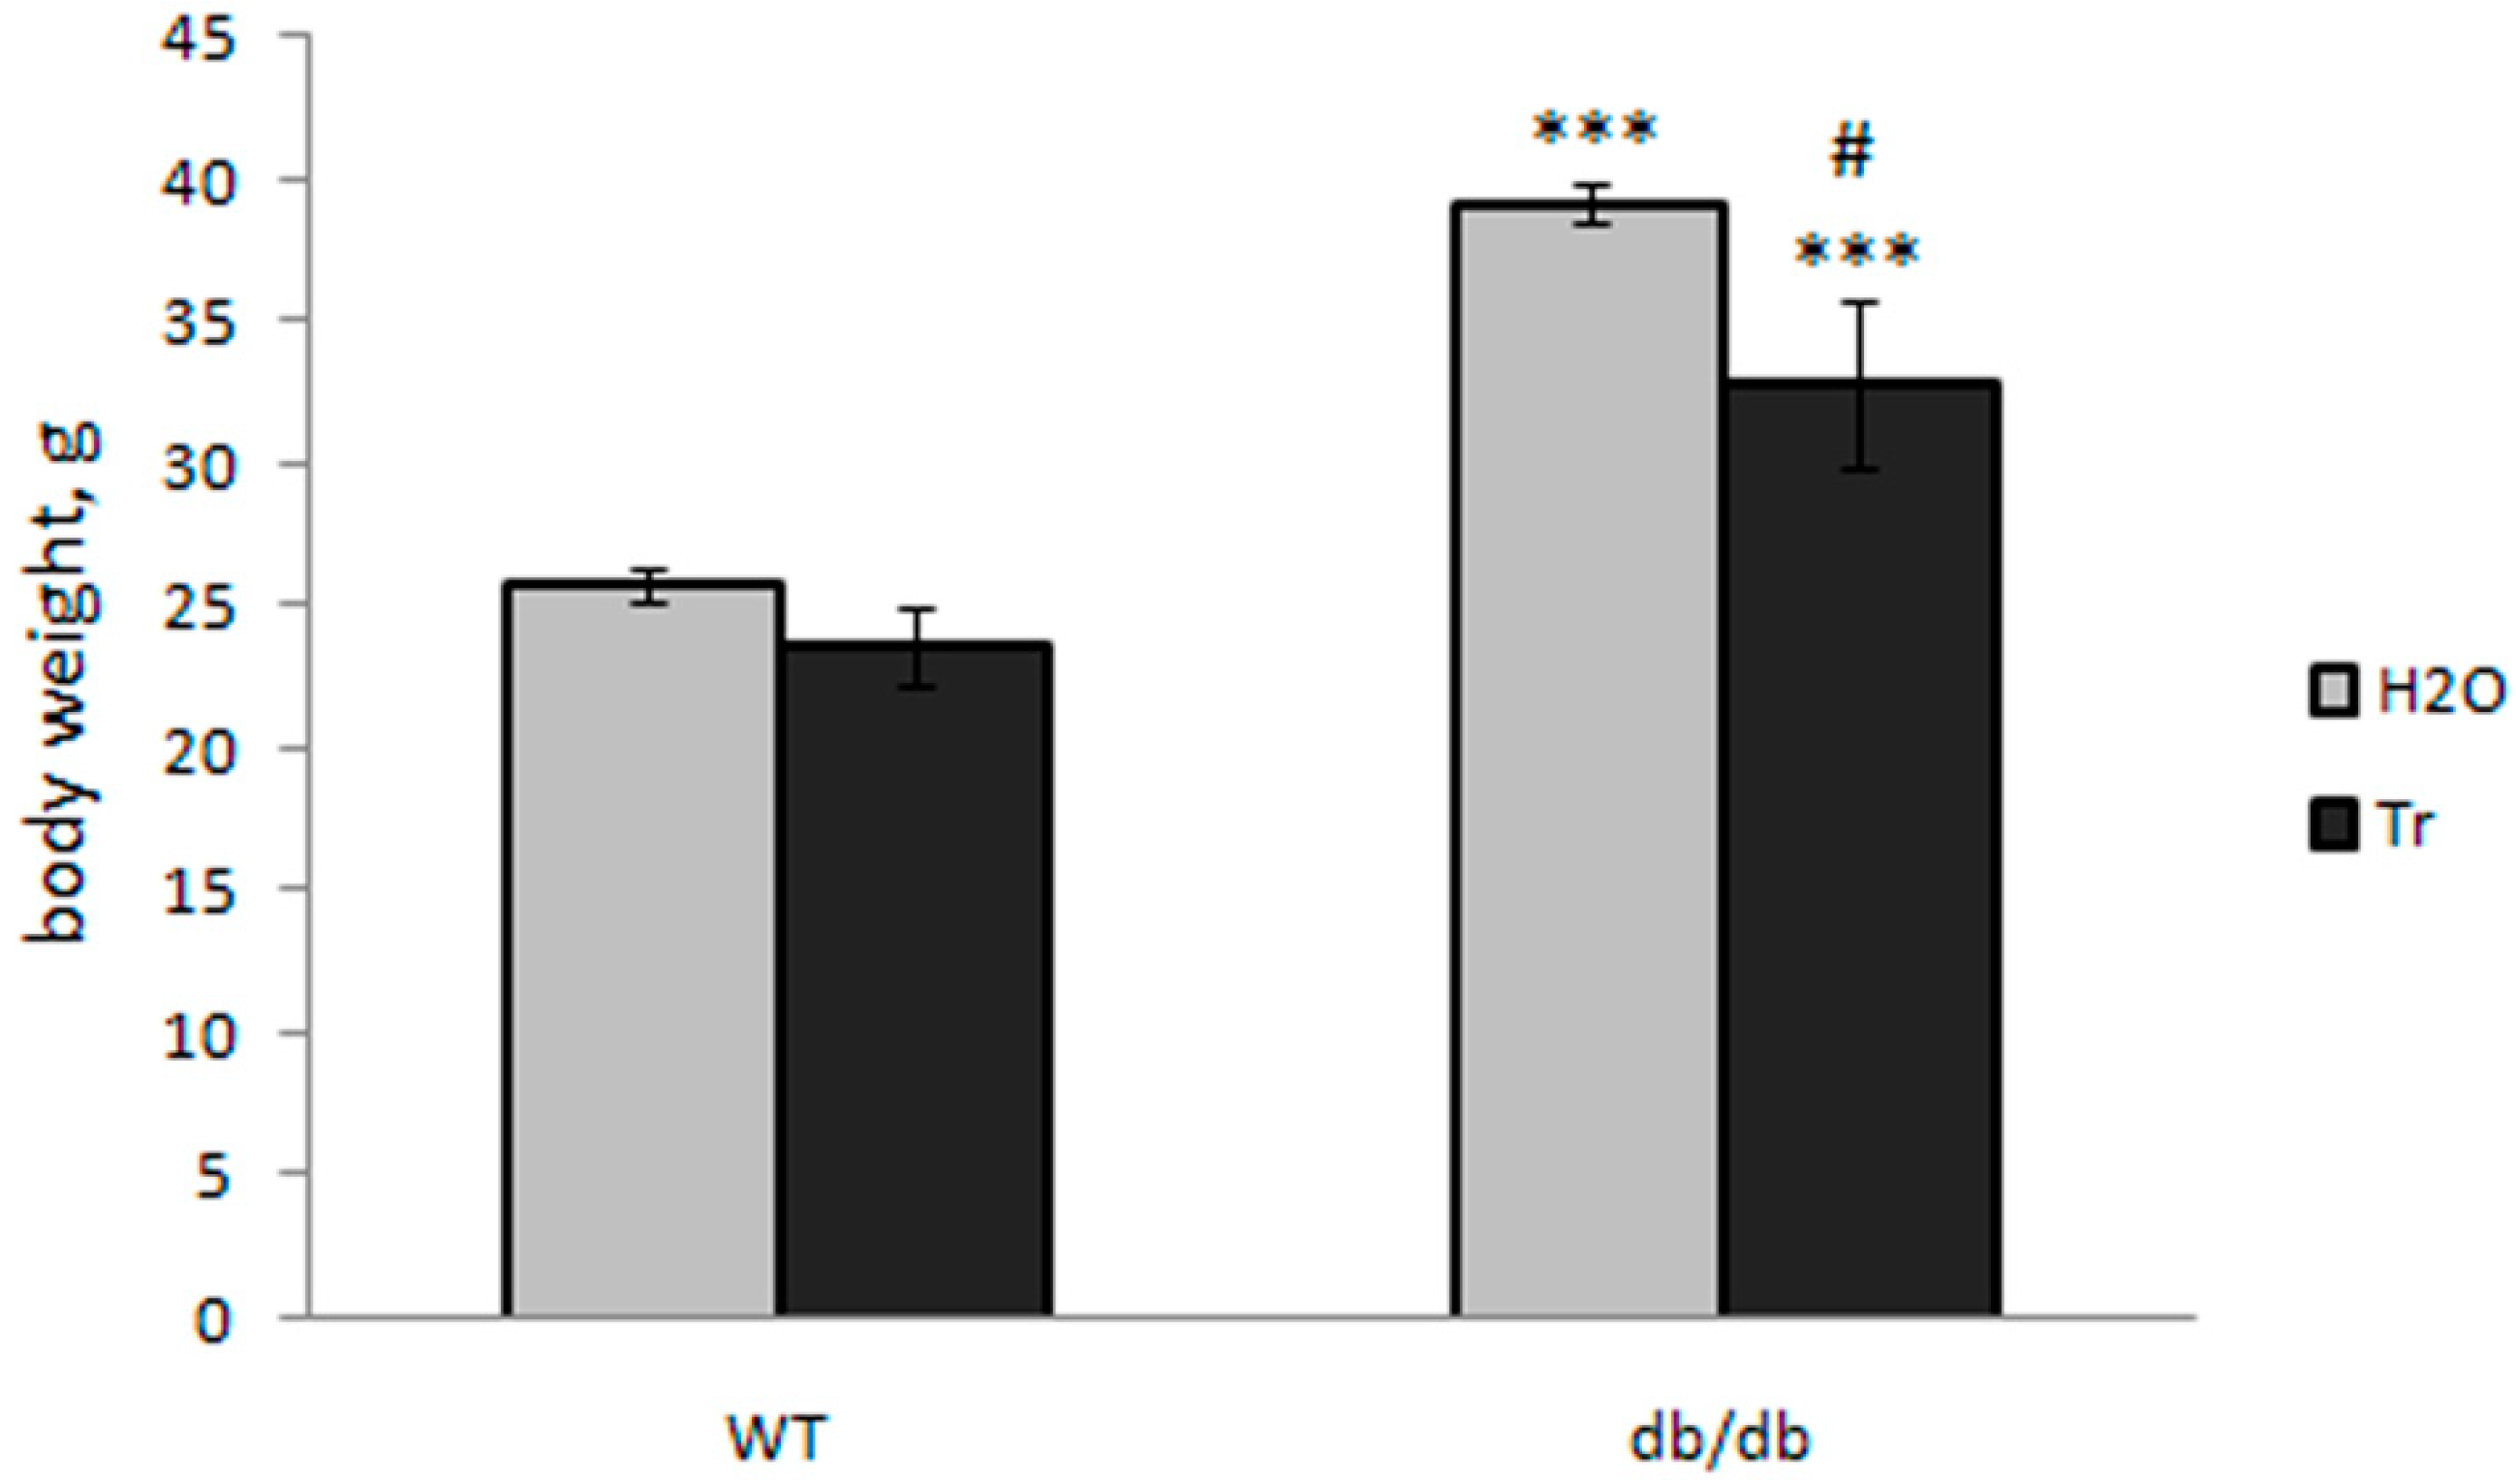
Abstract
:1. Introduction
2. Materials and Methods
2.1. Animal Used
2.2. Experimental Design
2.3. Biochemical Assays
2.4. Behavioral Tests
Pre-Pulse Inhibition Test (PPI)
The Open-Field Test (OFT)
Elevated Plus Maze (EPM) Test
Tail Suspension Test (TST)
Passive Avoidance Test
2.5. Immunohistochemical (IHC) Analysis
2.6. Transmission Electron Microscopy
2.7. Statistical Analysis
3. Results
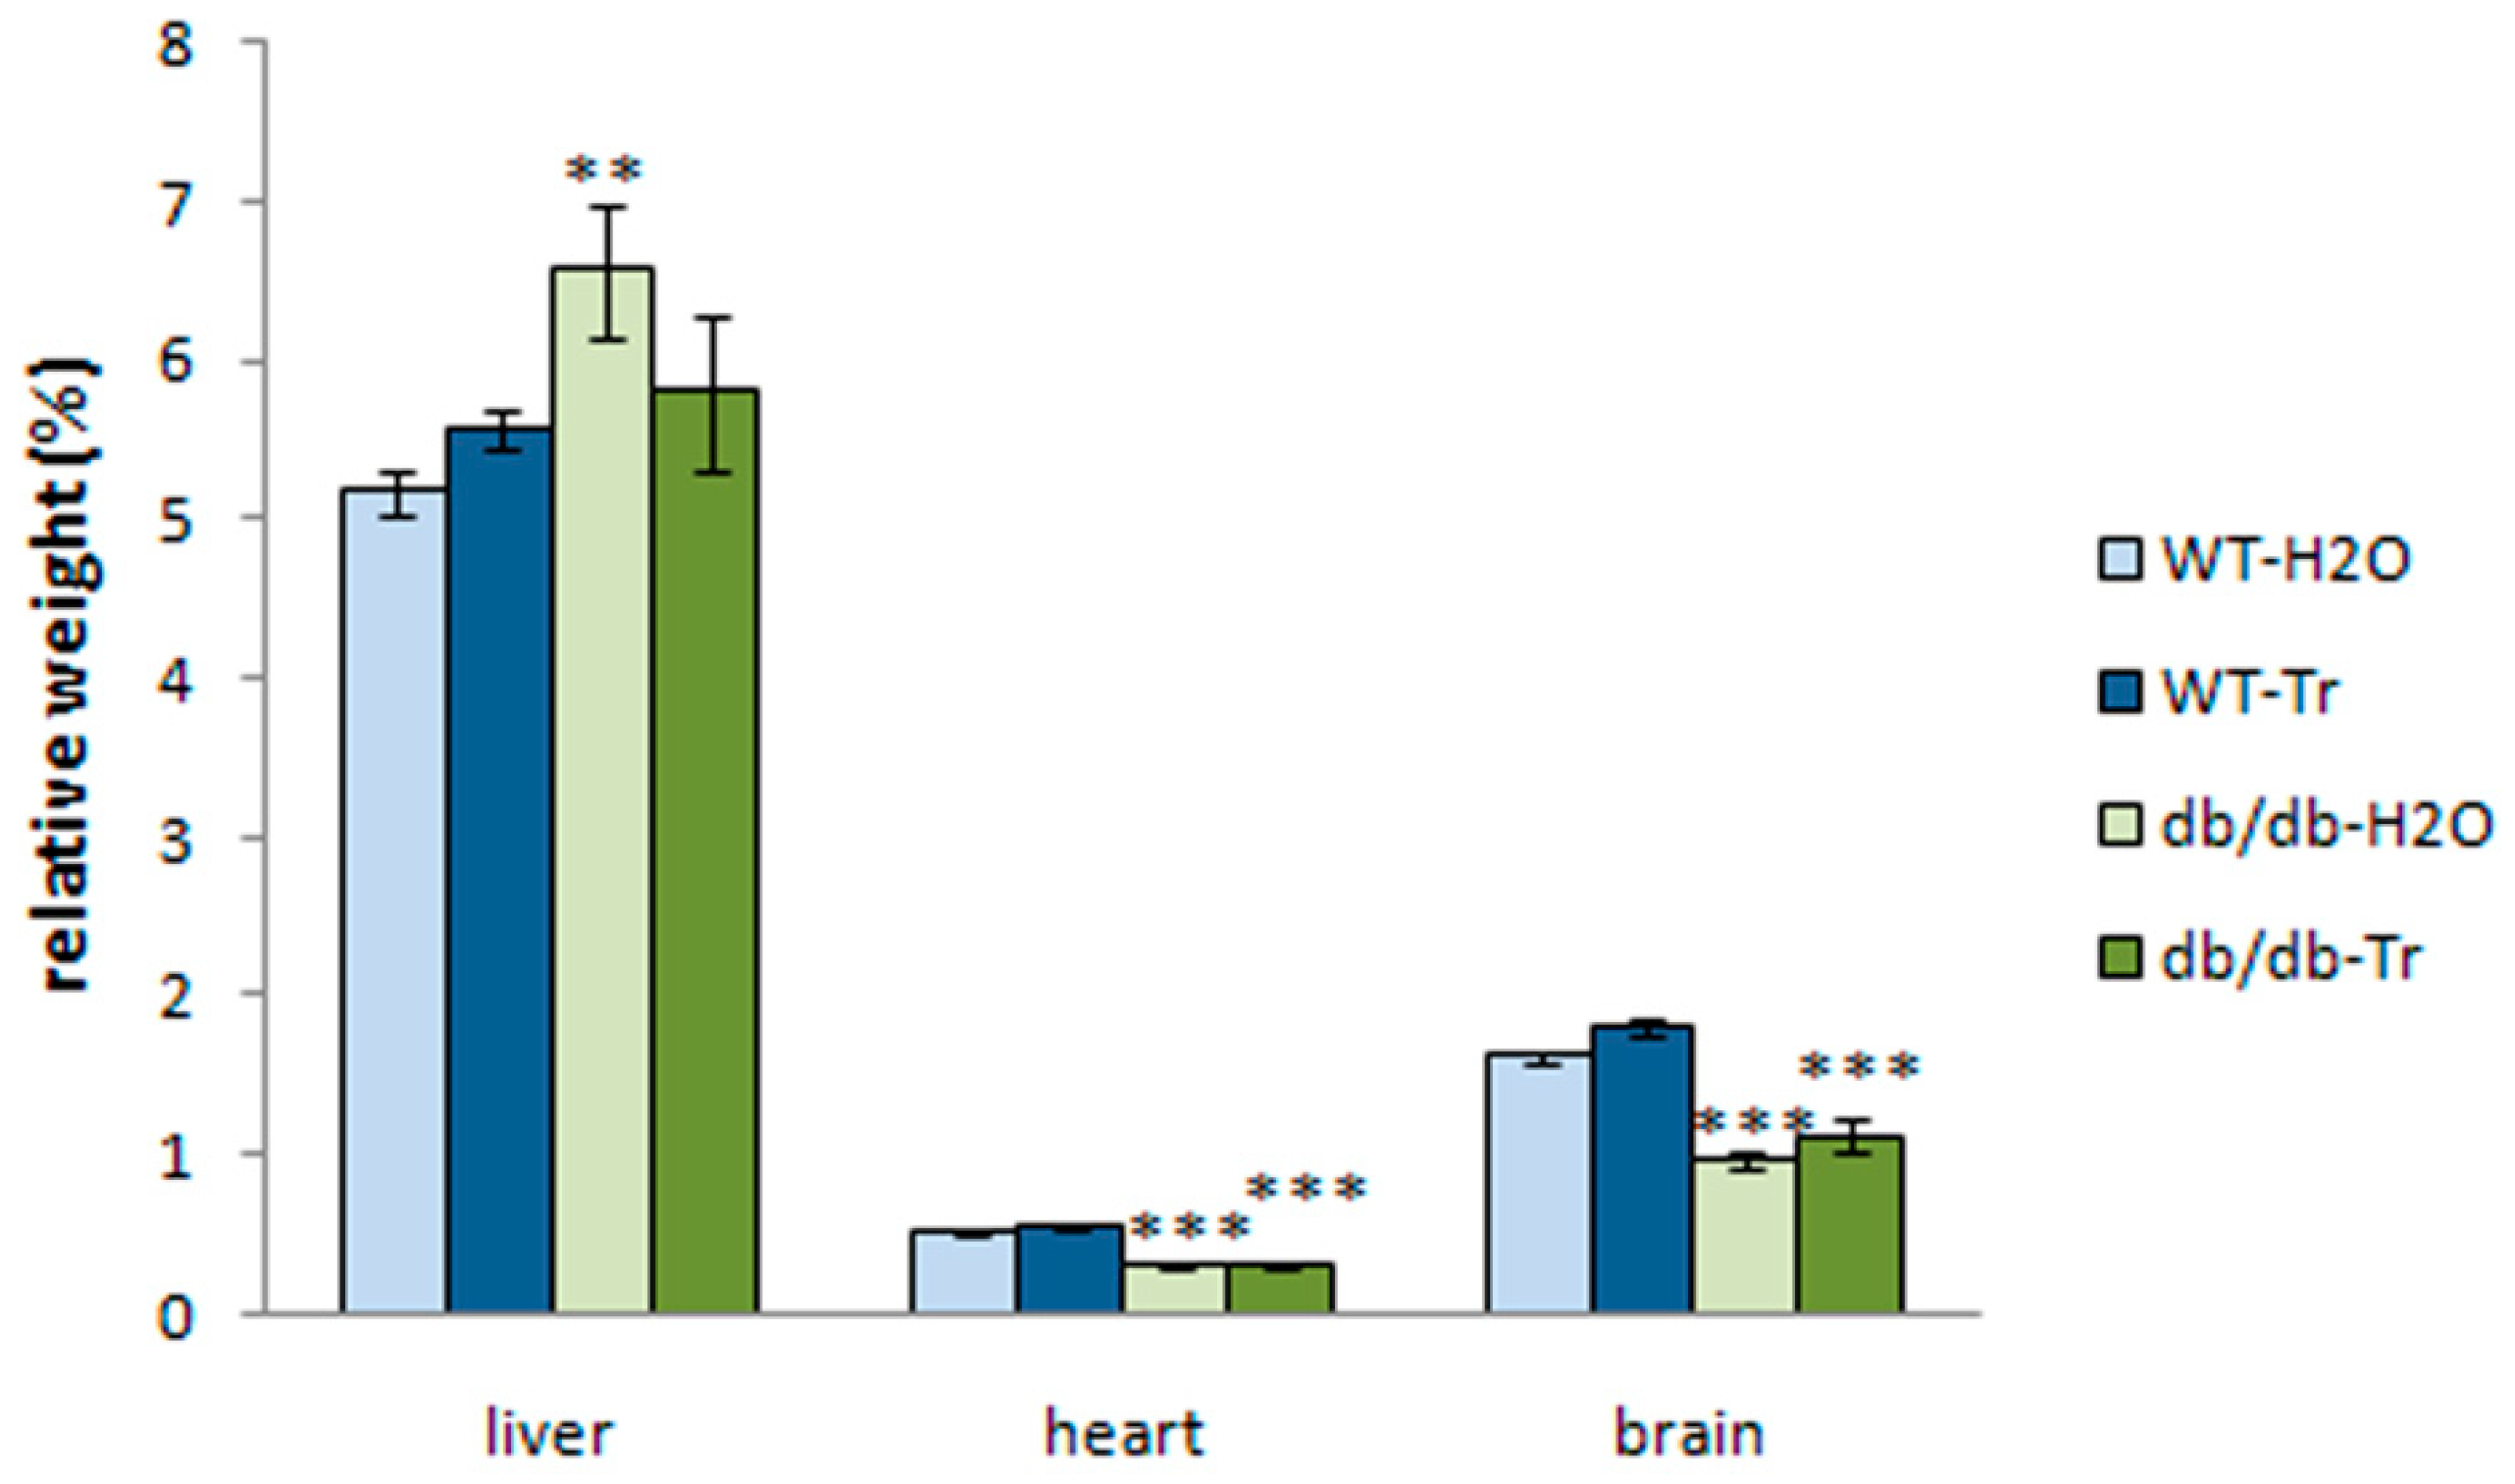
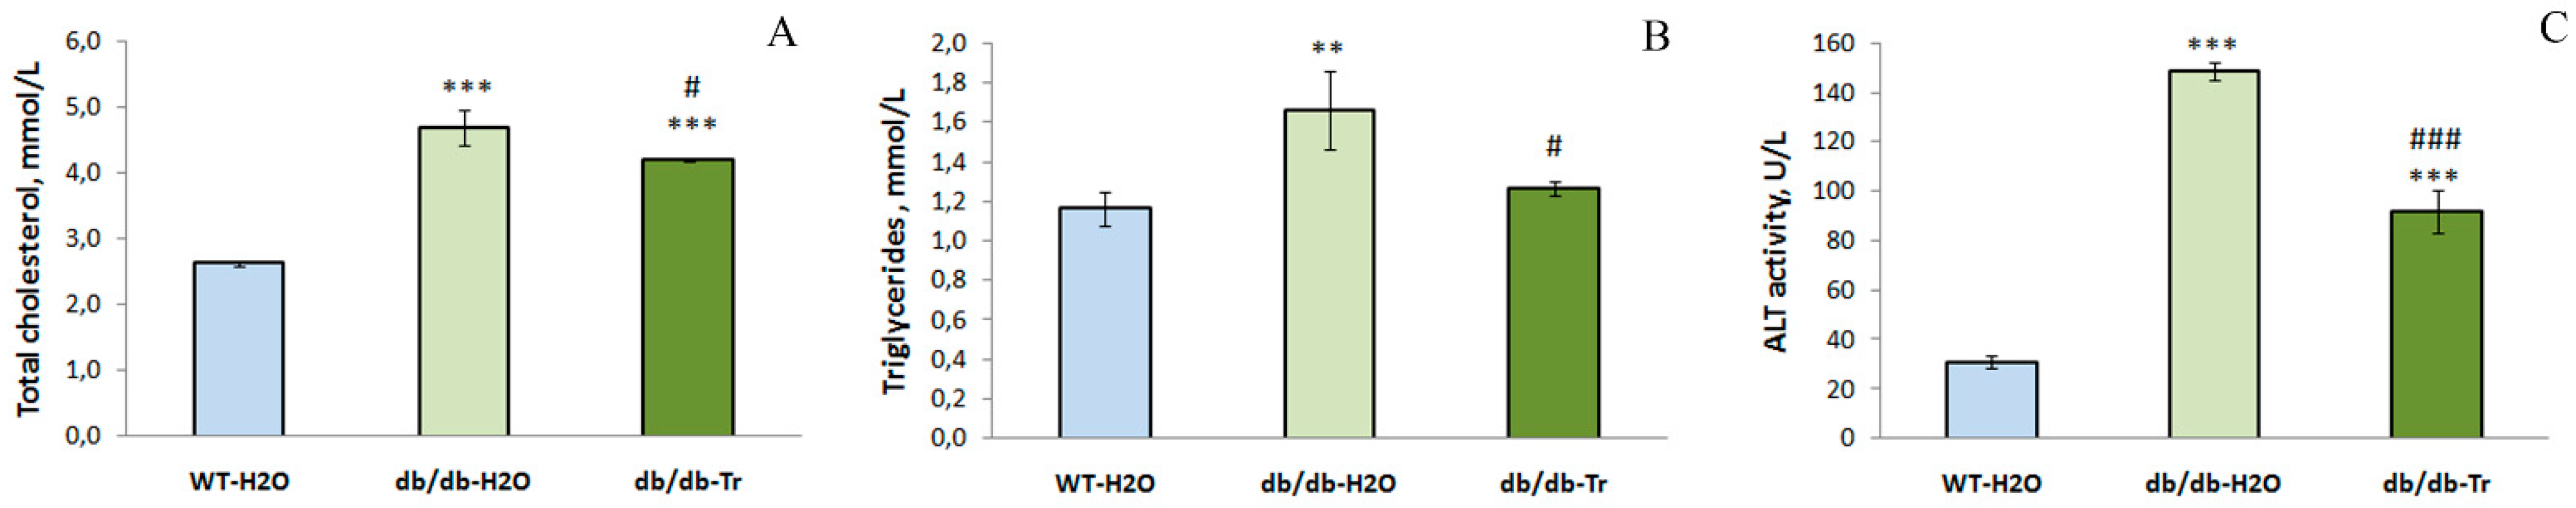
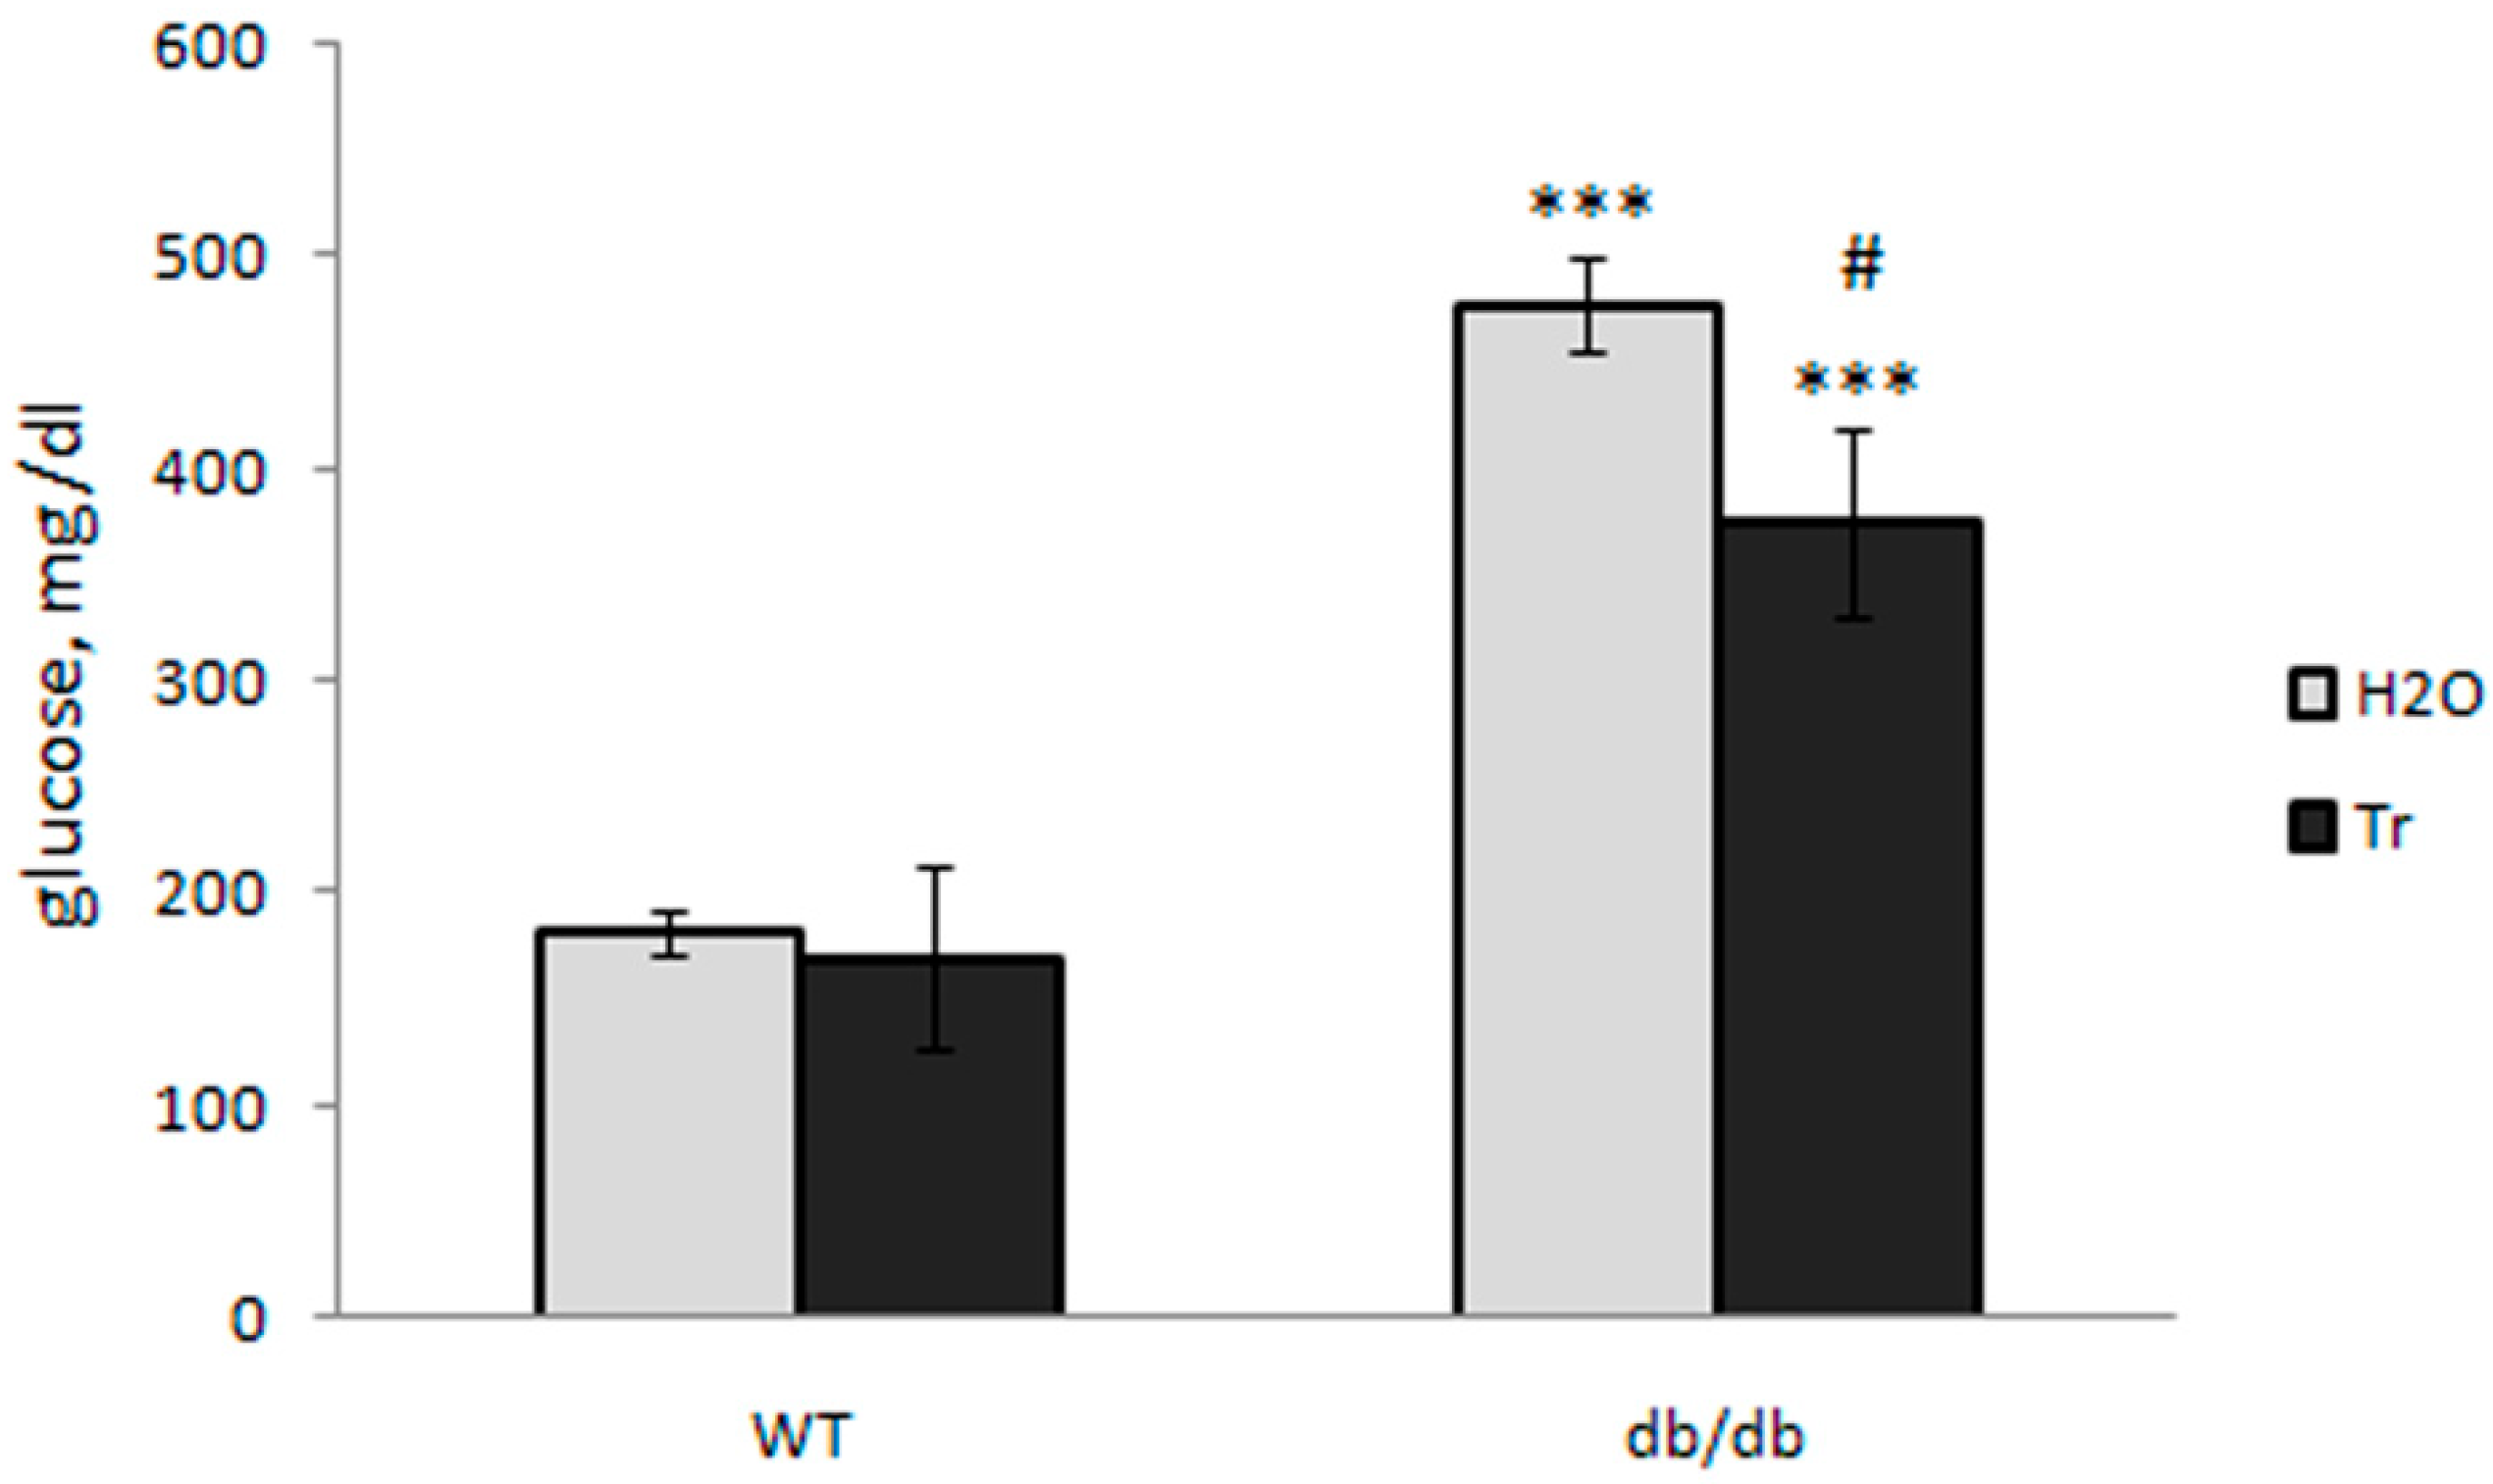
3.1. Effect of Trehalose Treatment on db/db Mice
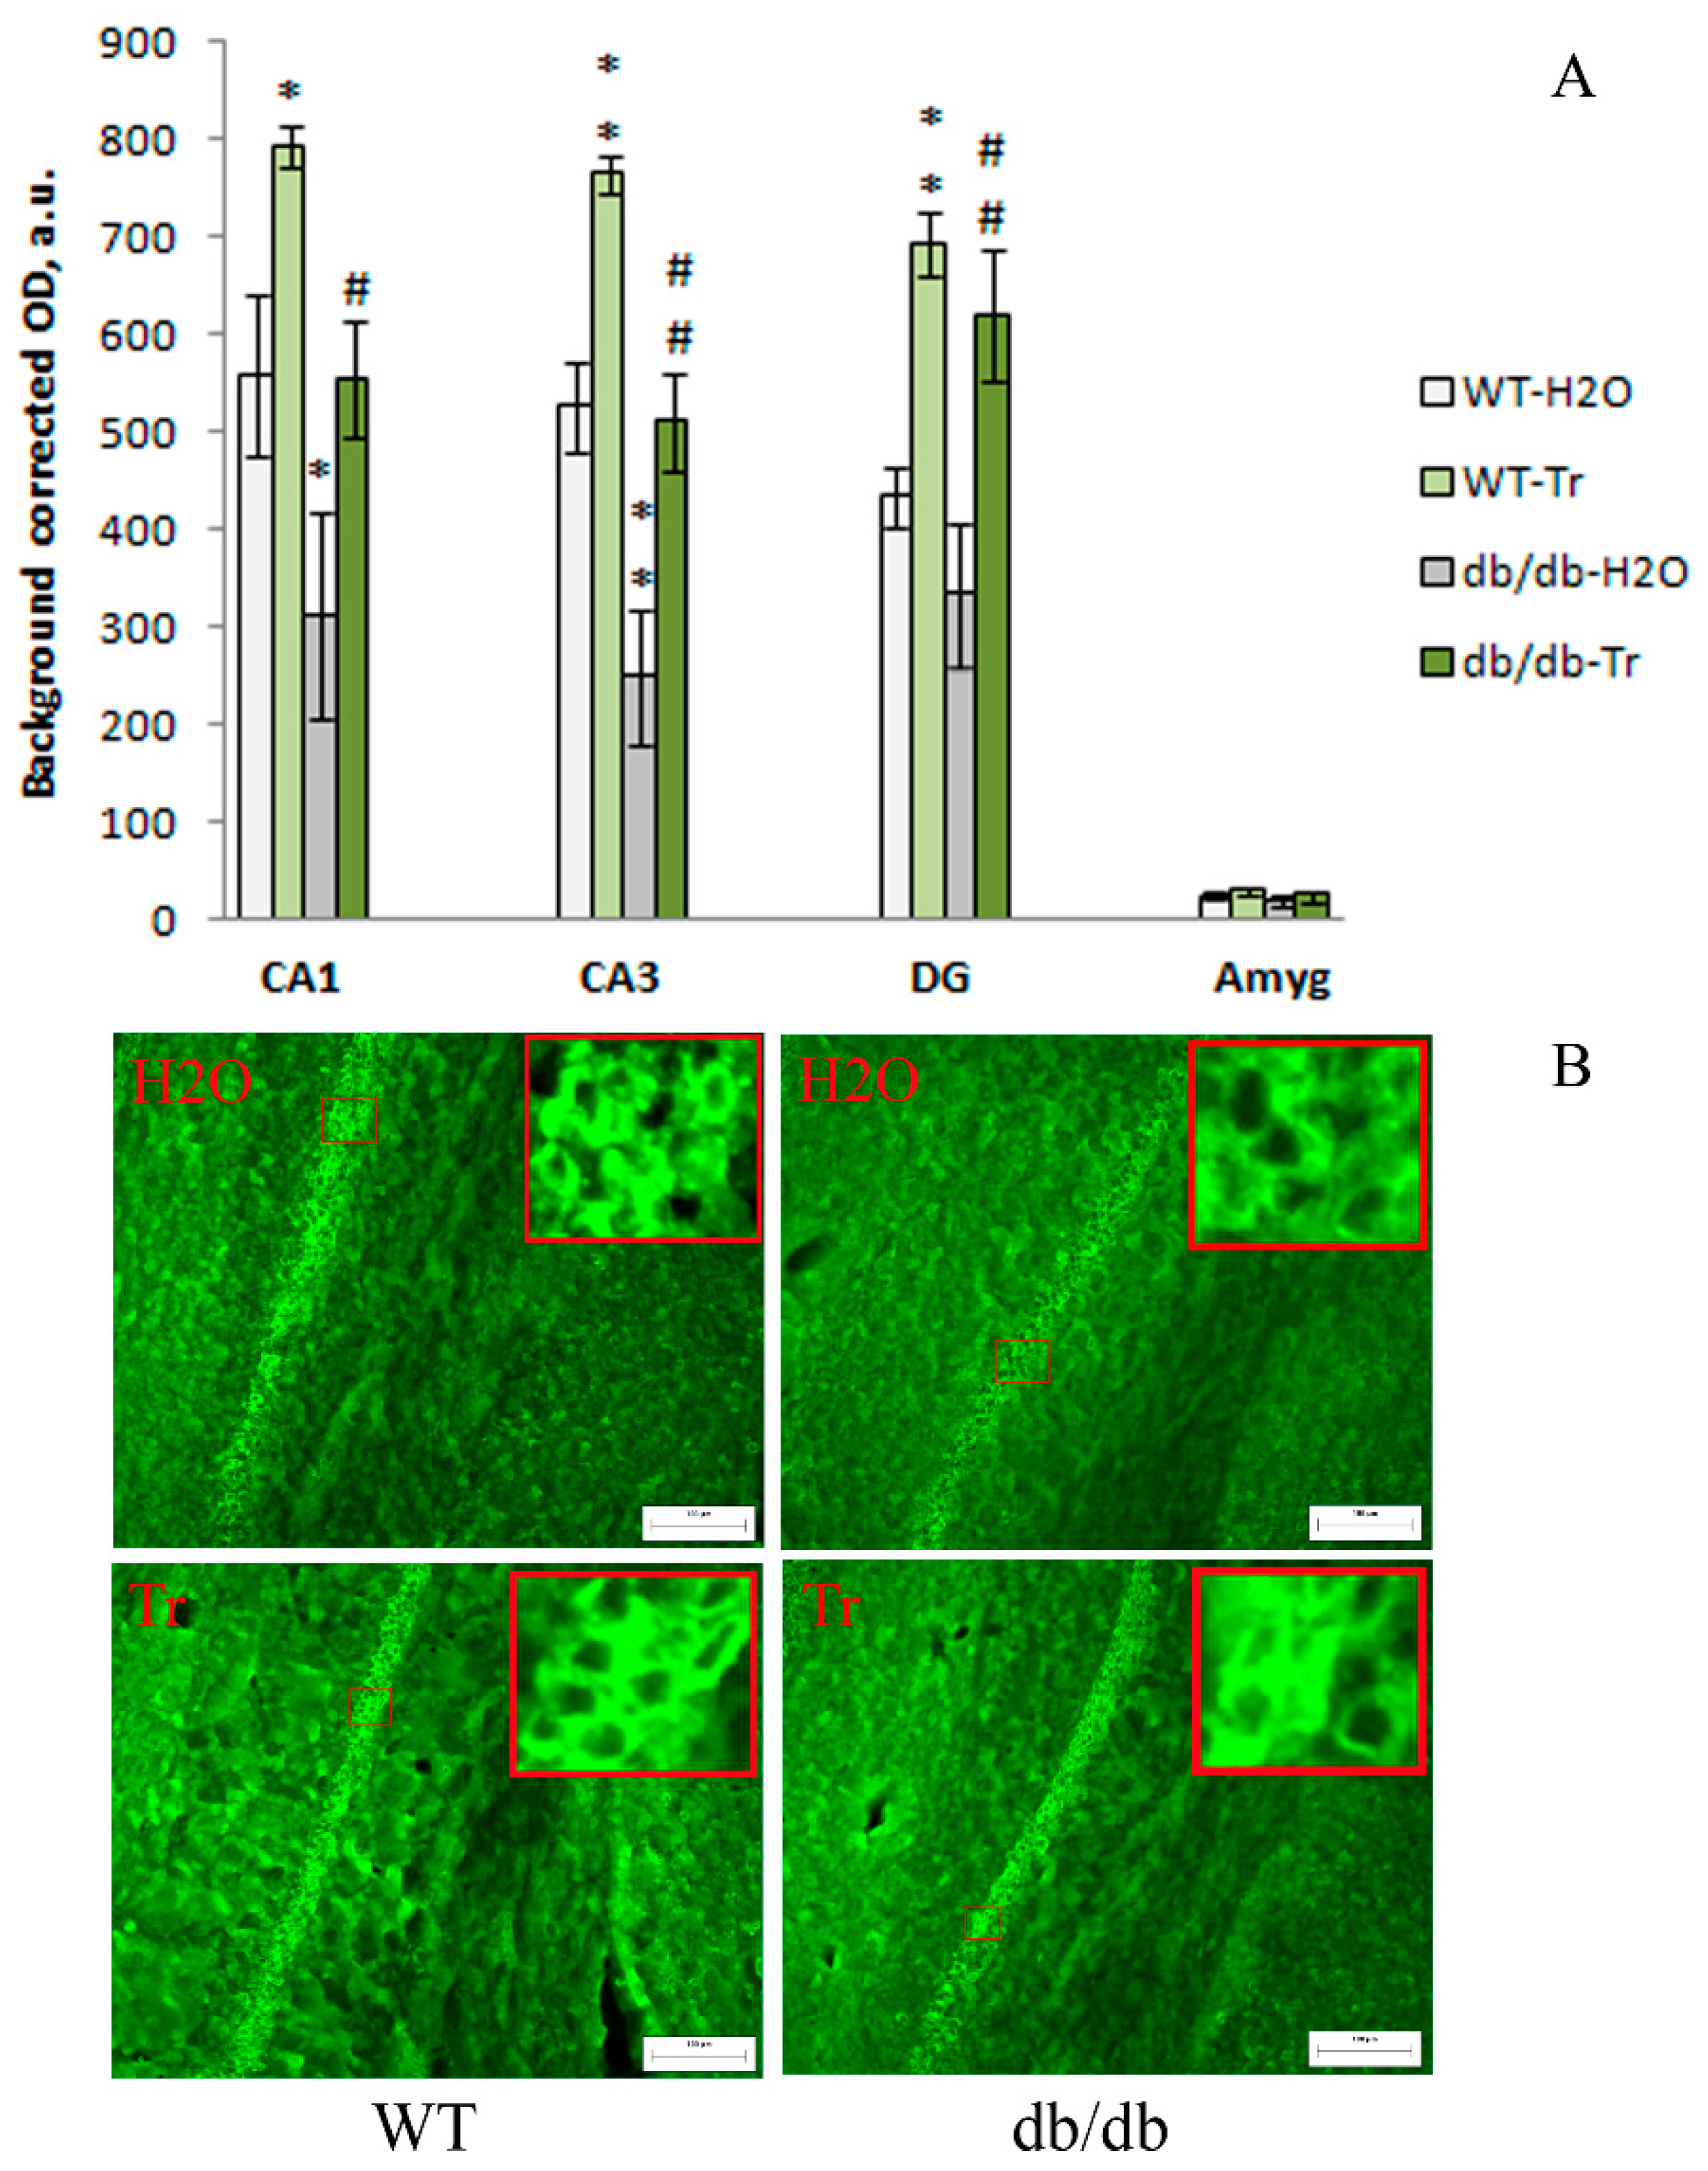
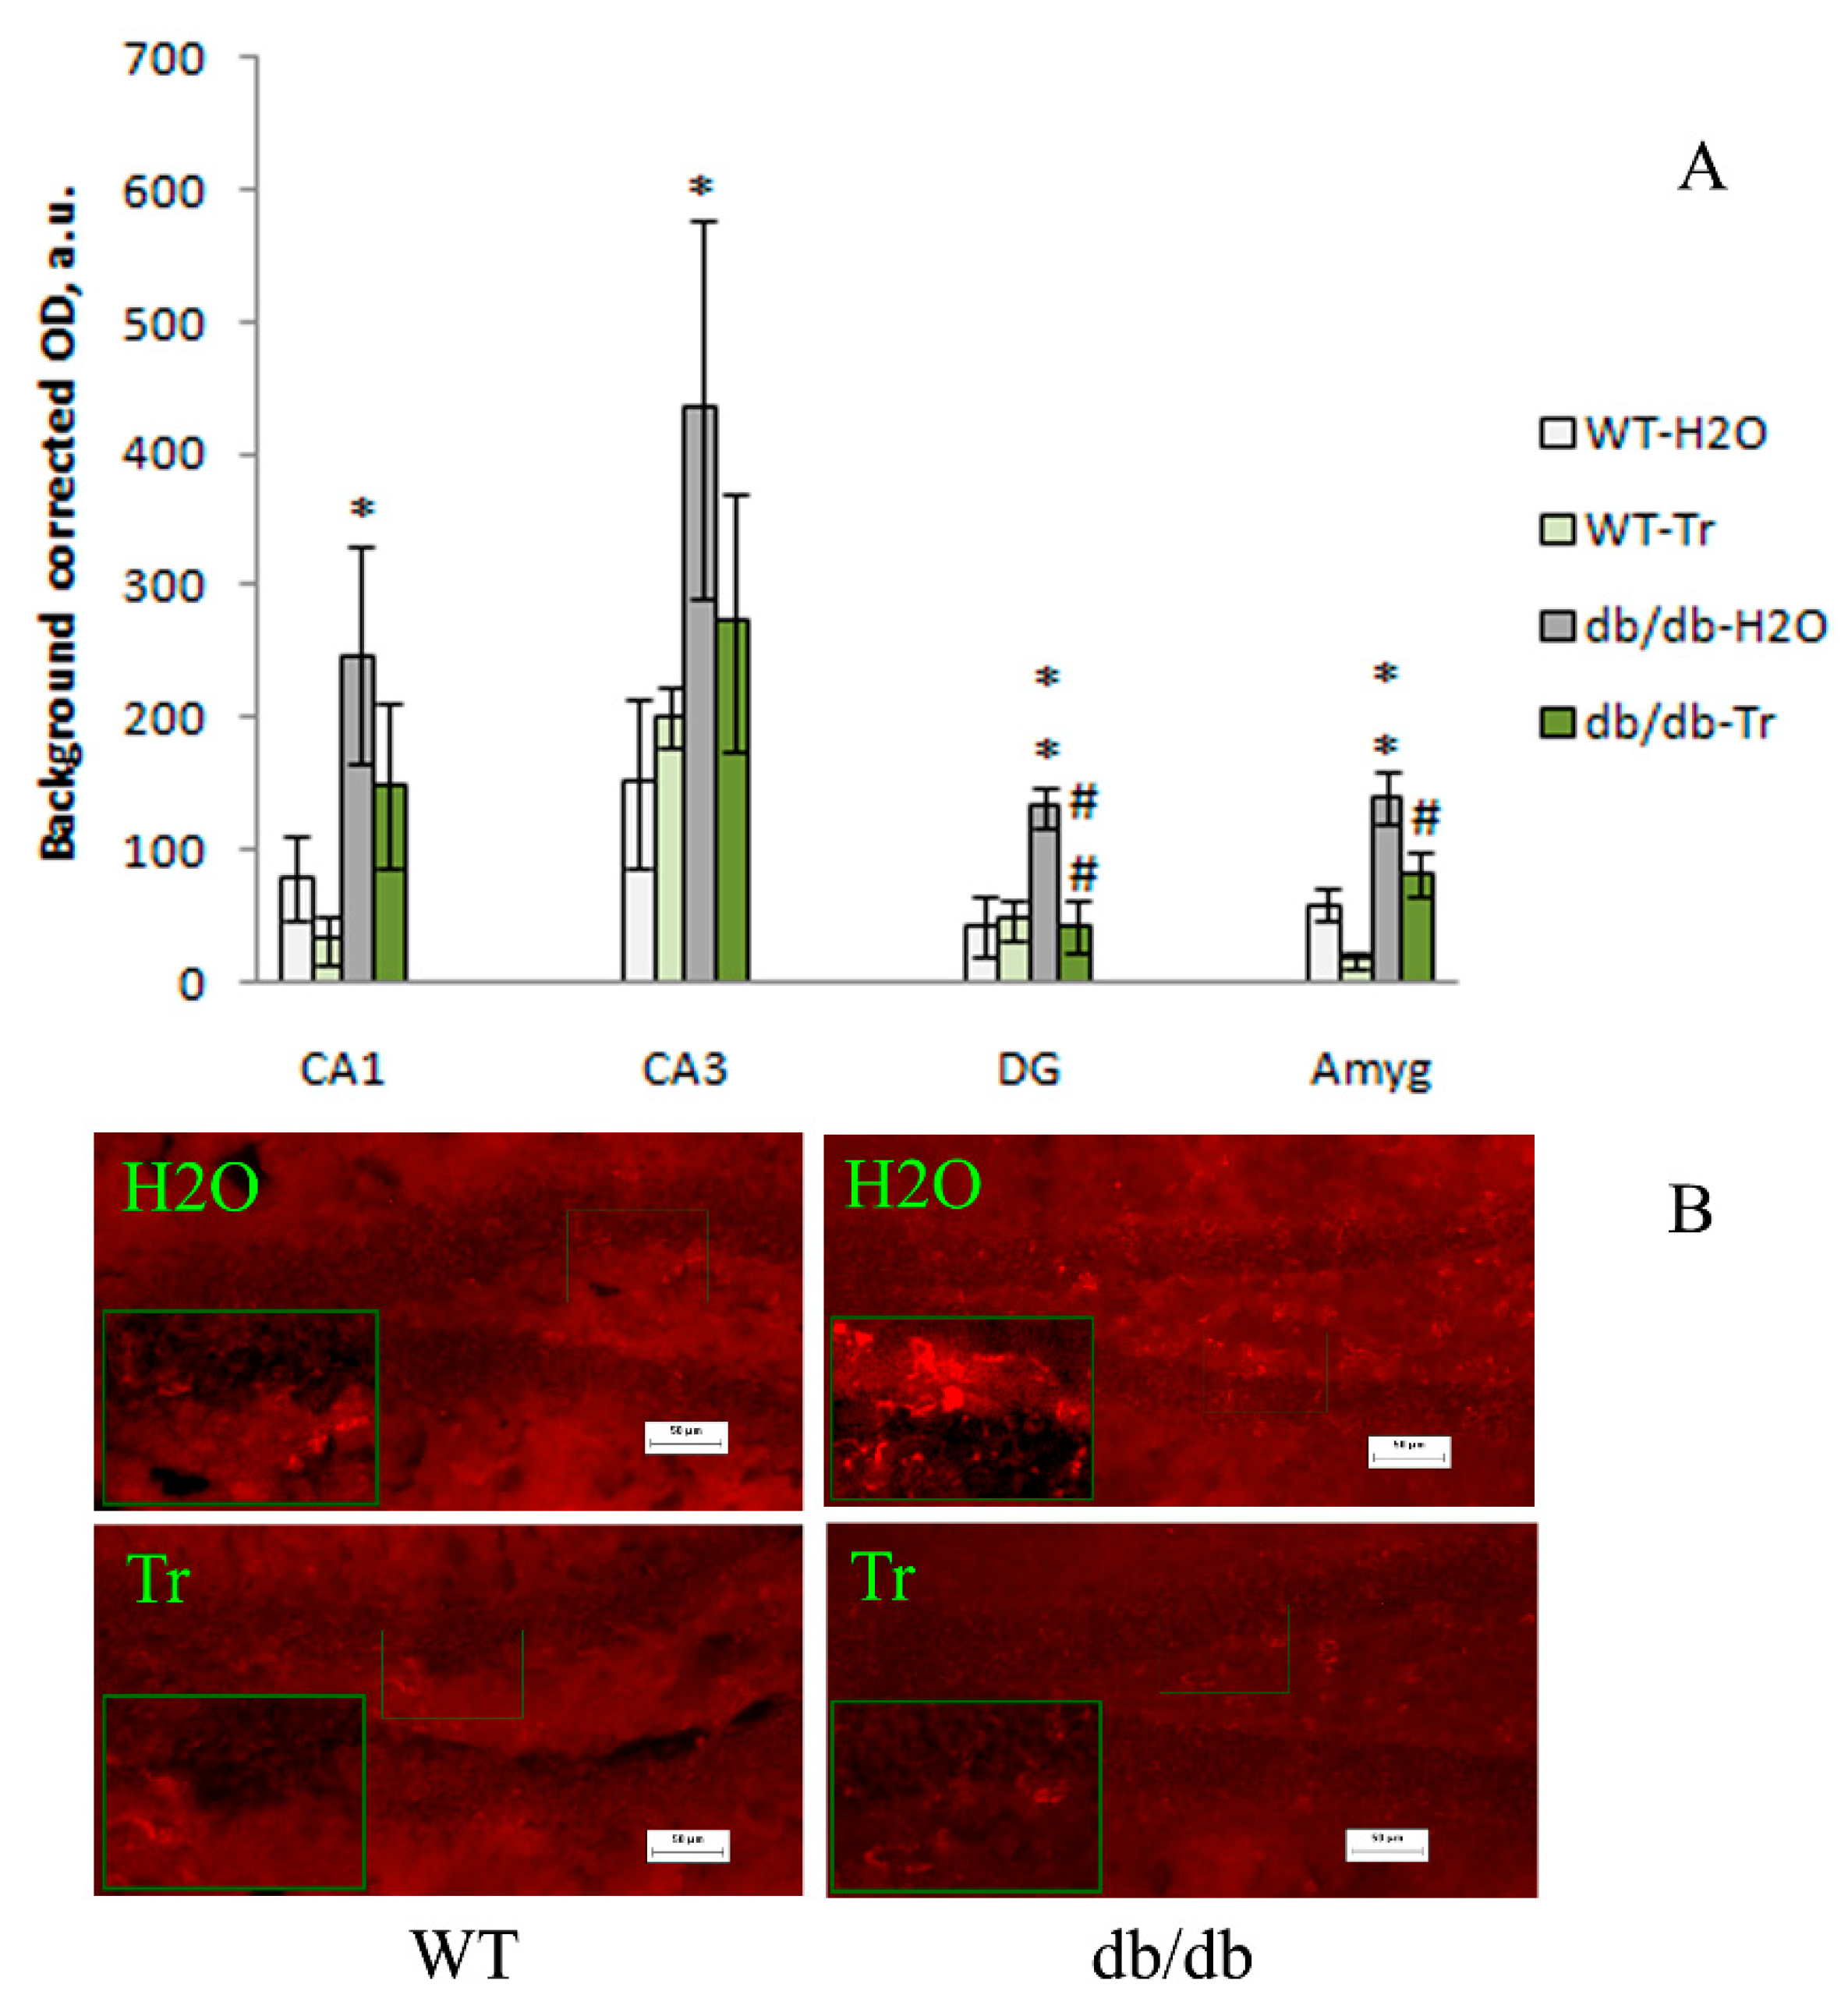
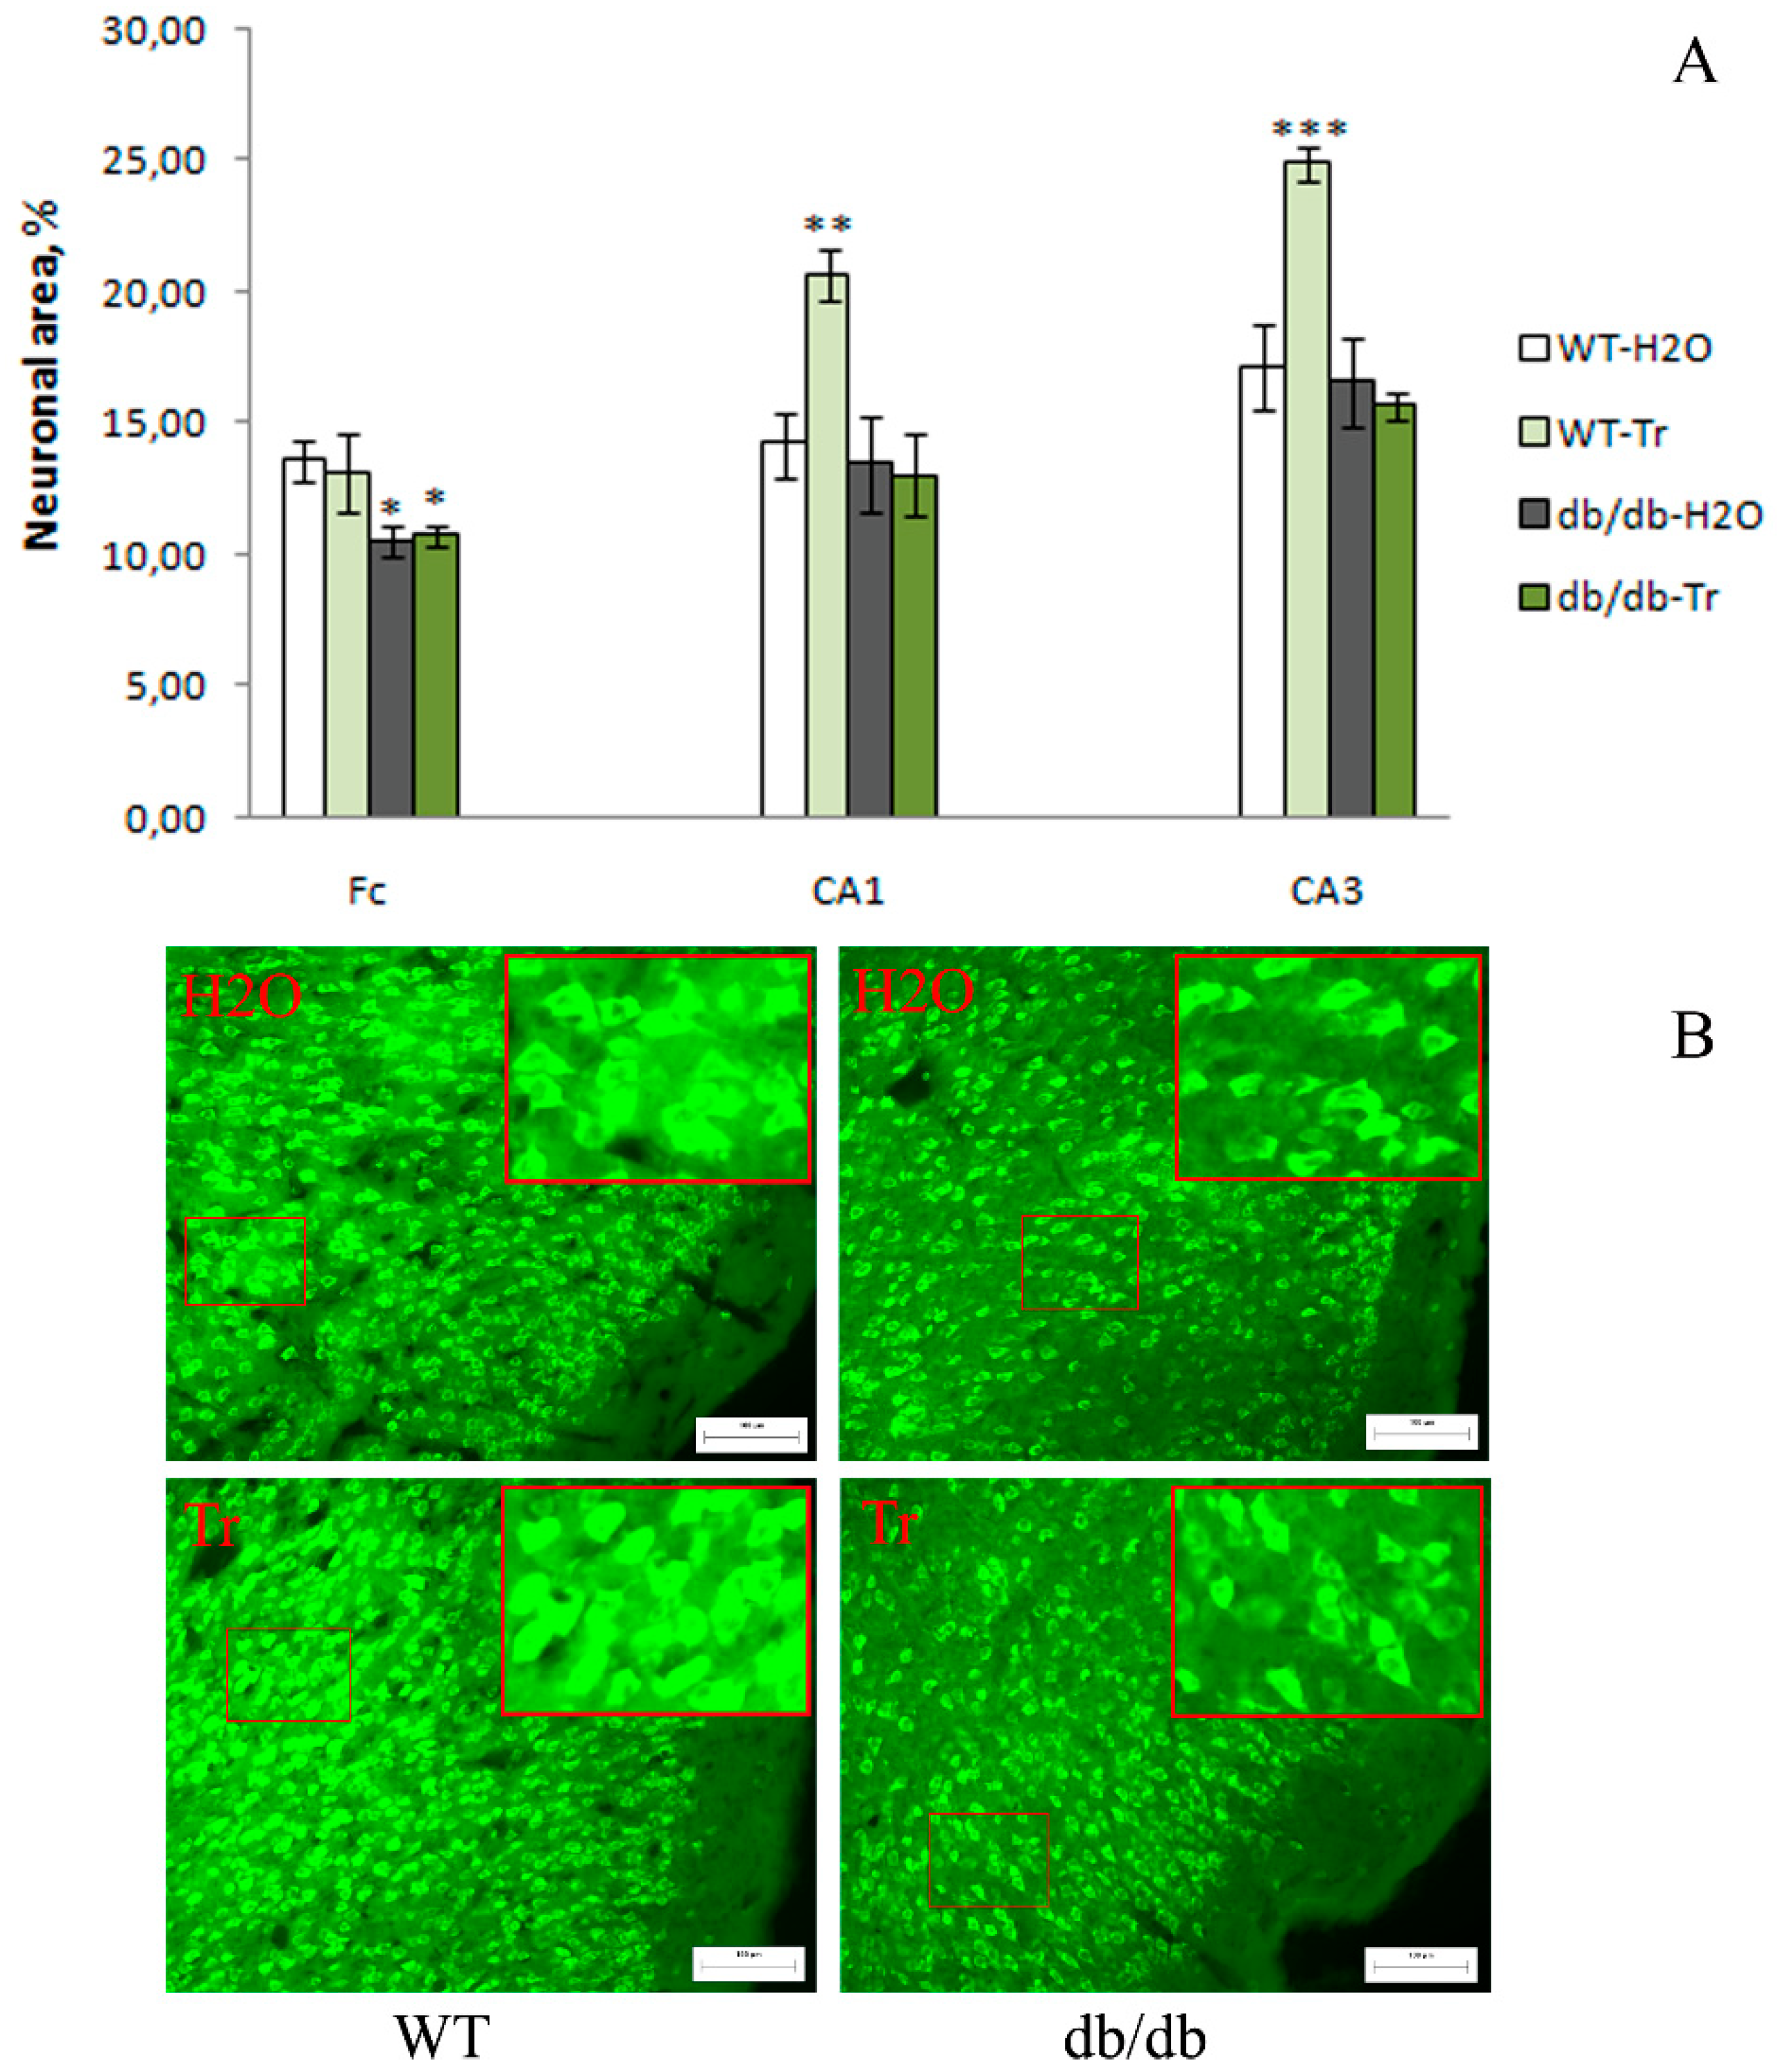
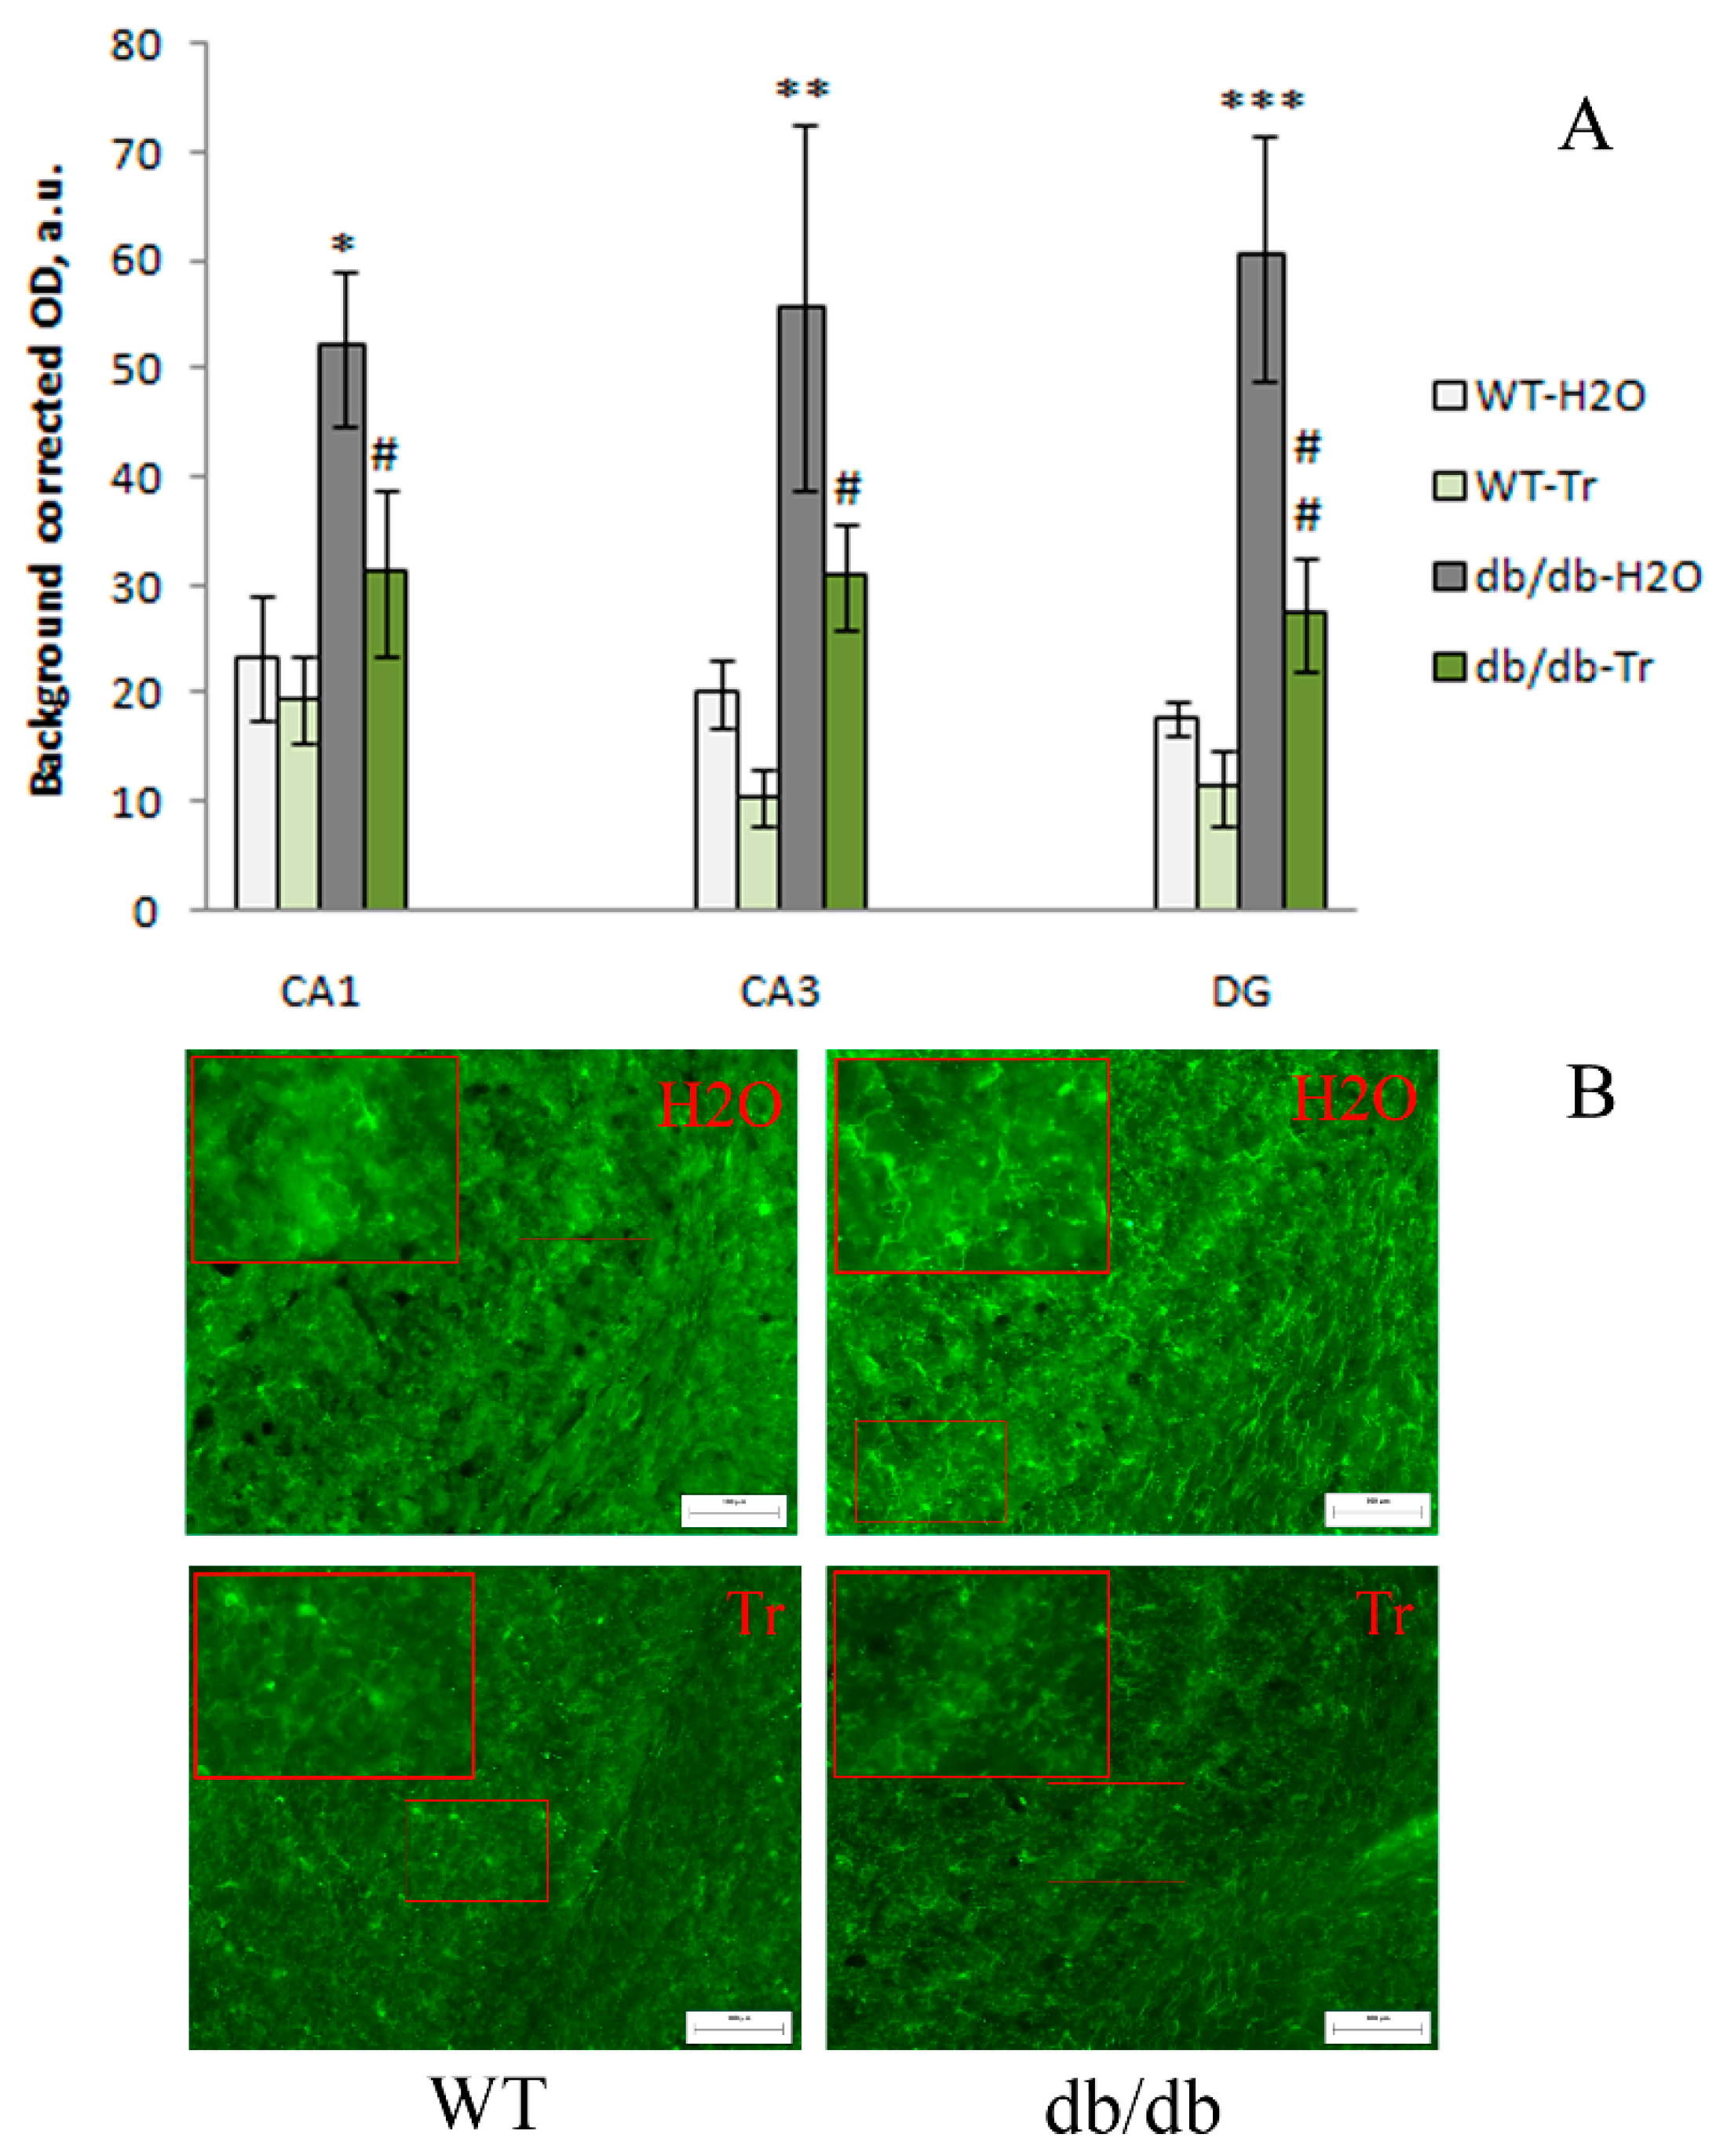
3.2. IHC Analysis
3.3. Behavioral Changes in db/db Mice and Protective Effects of Trehalose
3.3.1. PPI of the ASR
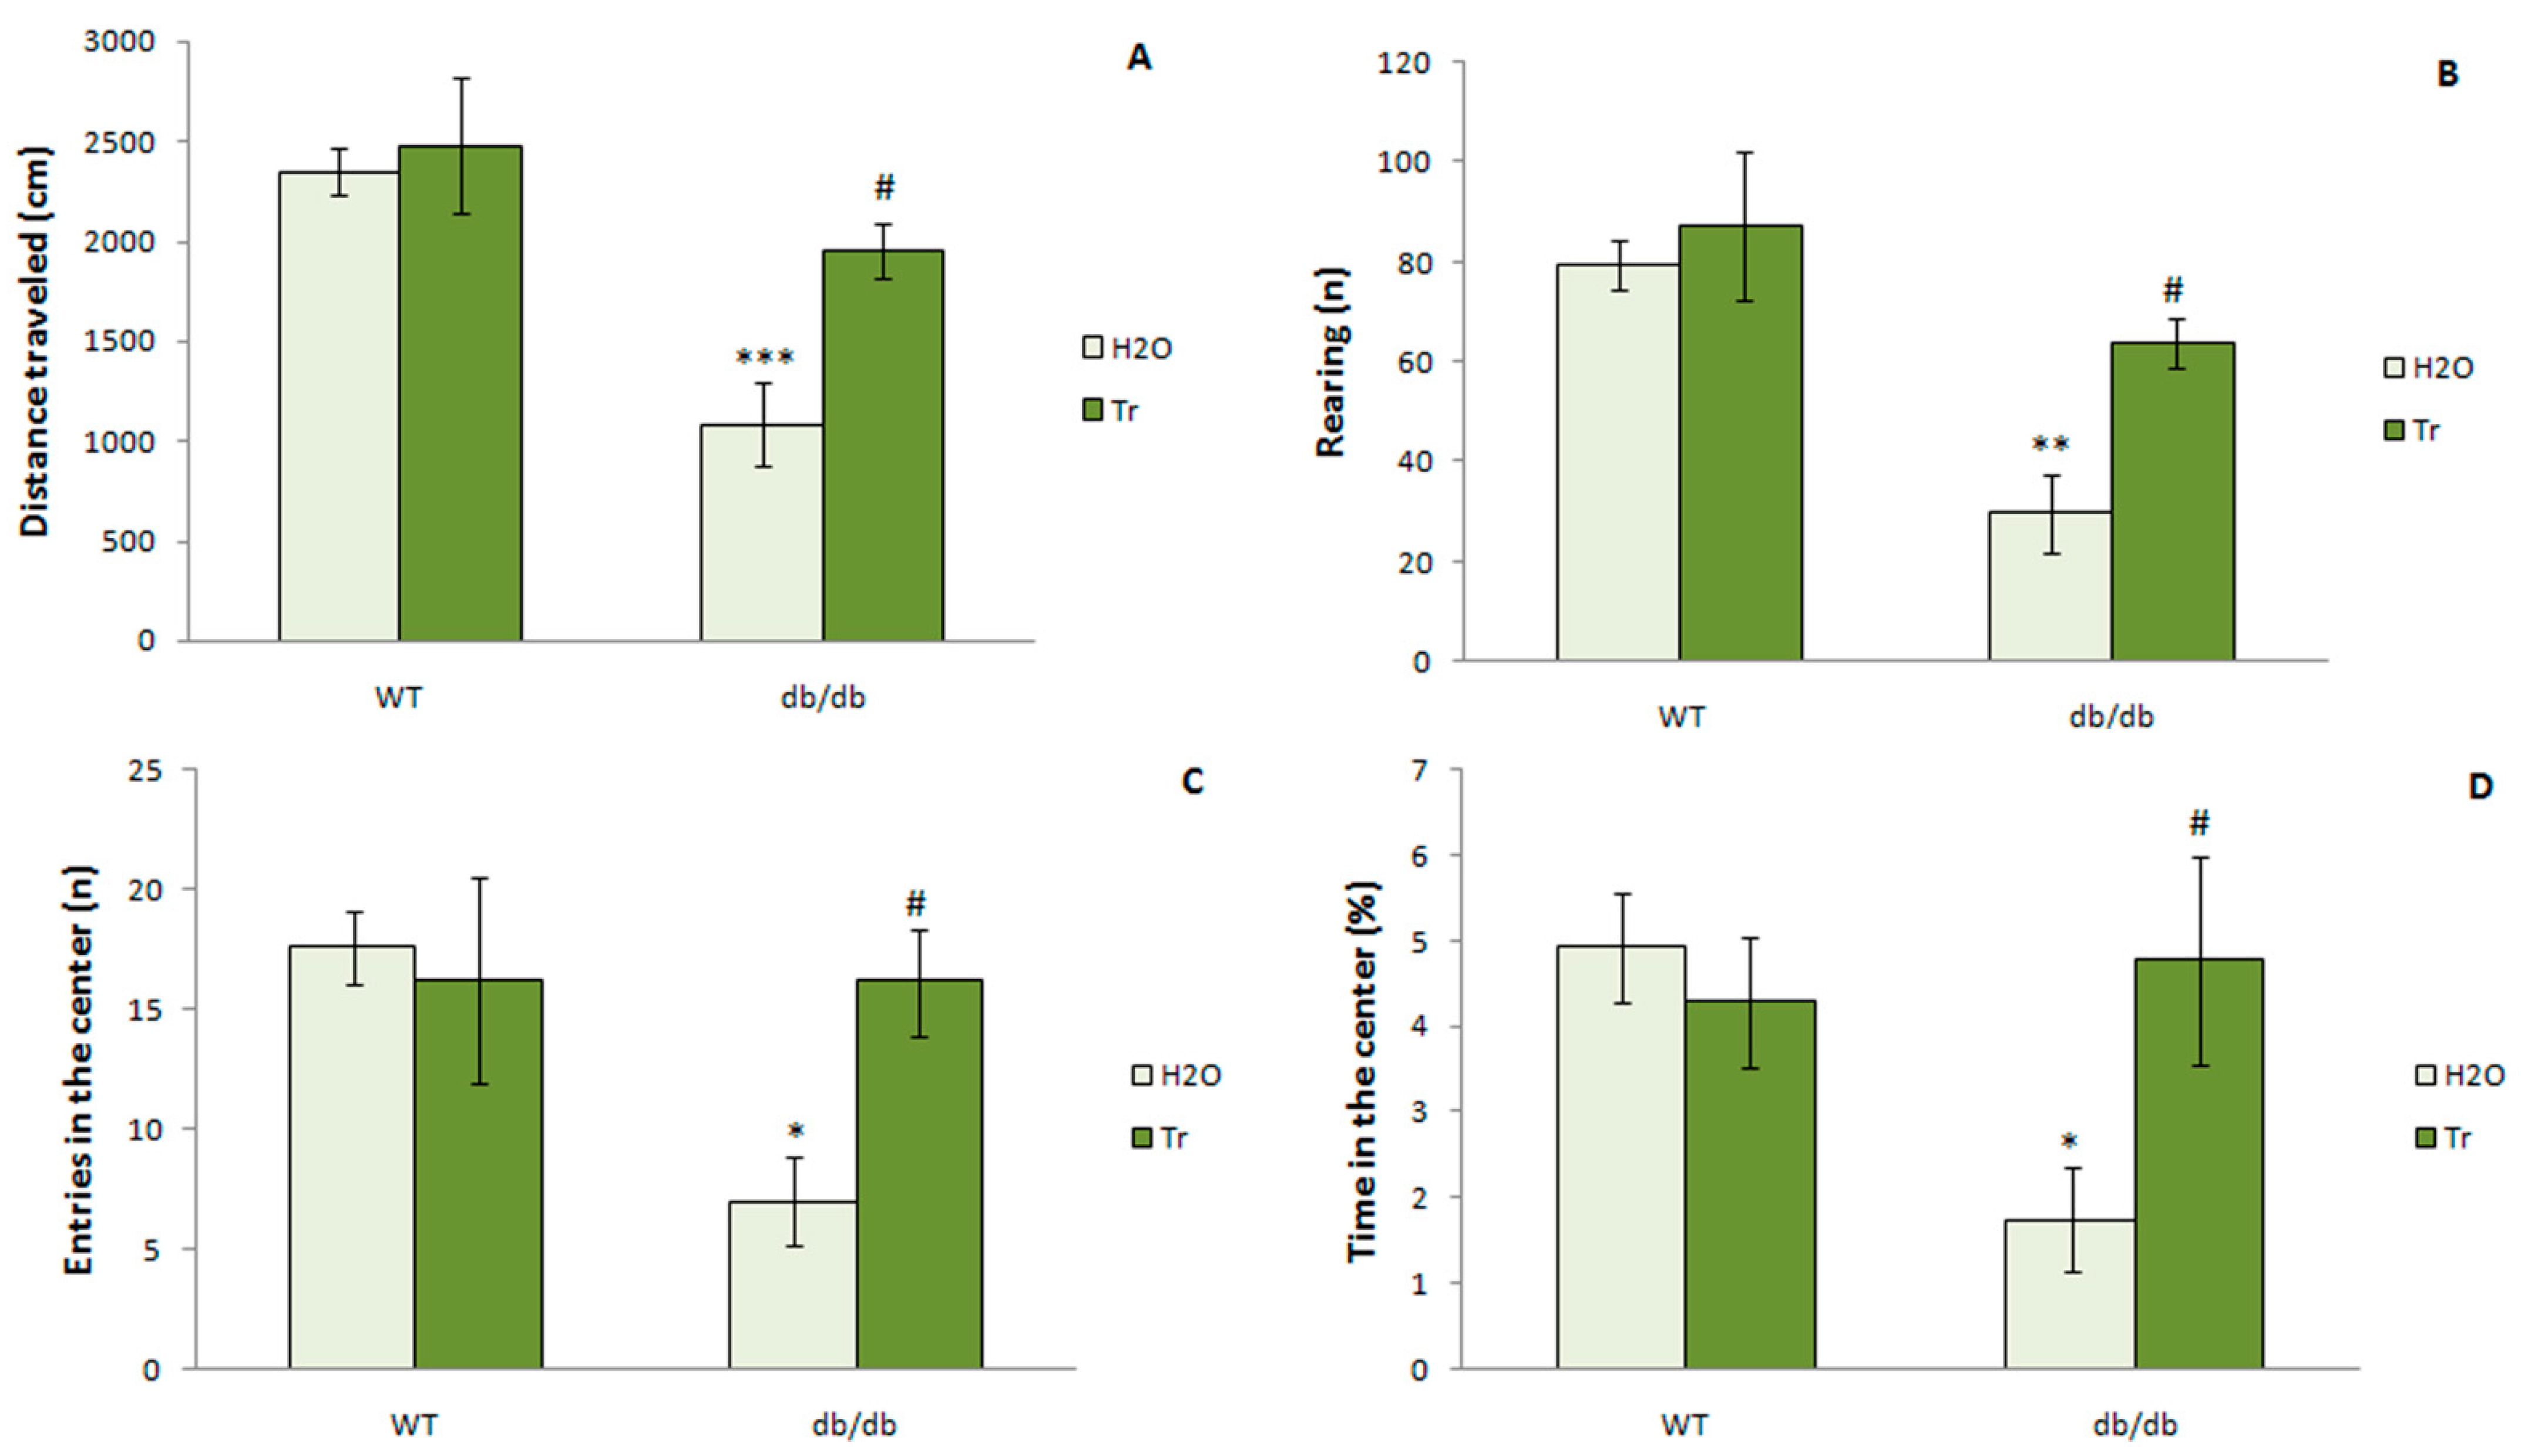
3.3.2. The OFT
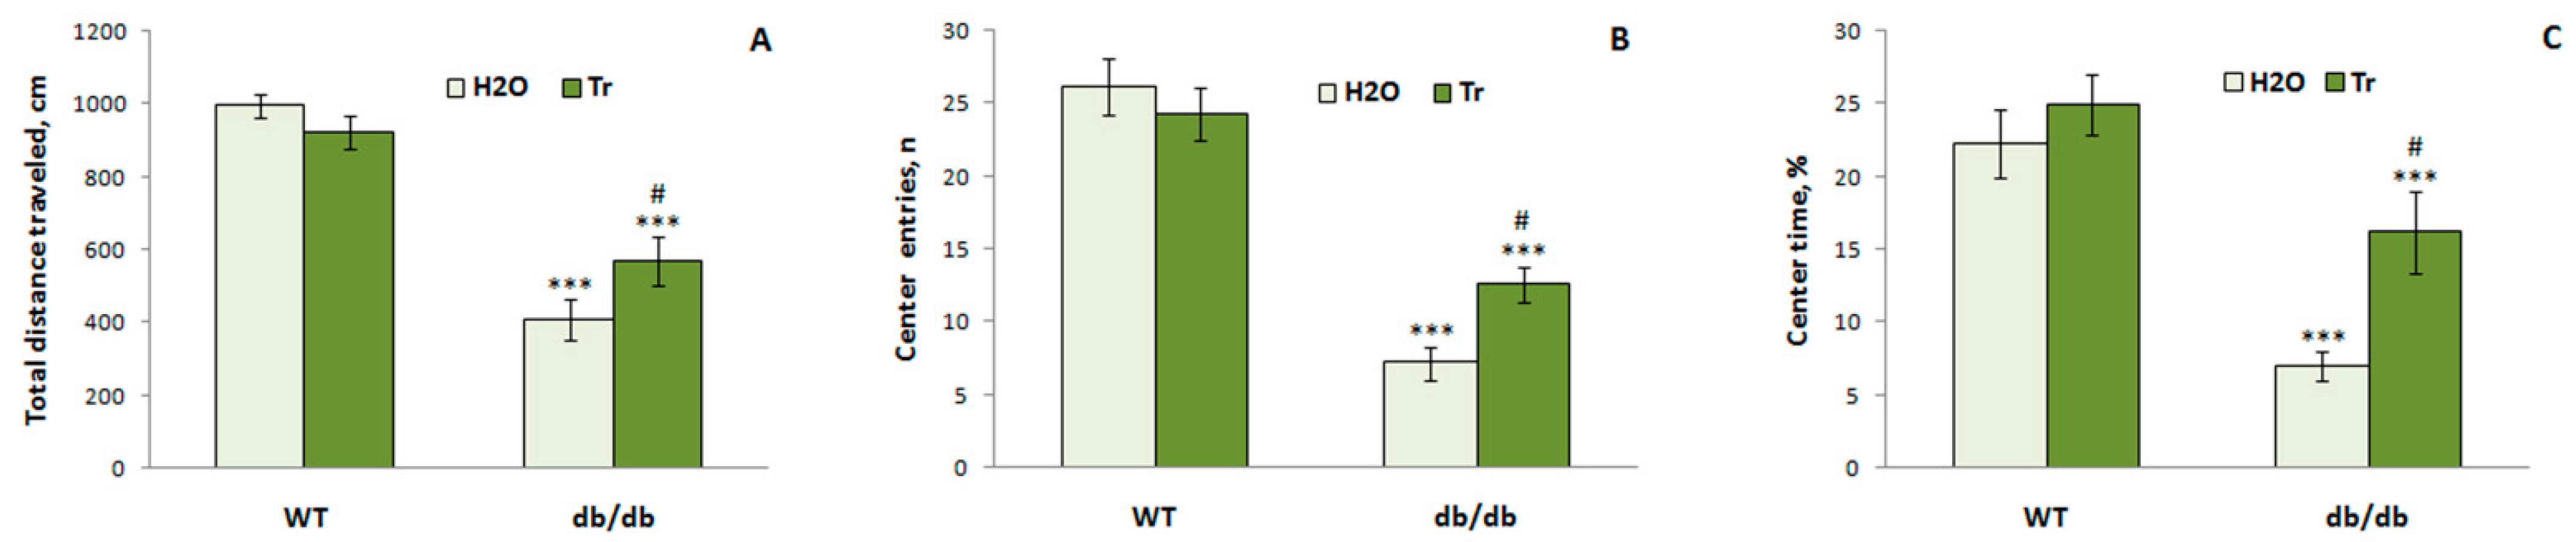
3.3.3. EPM Test
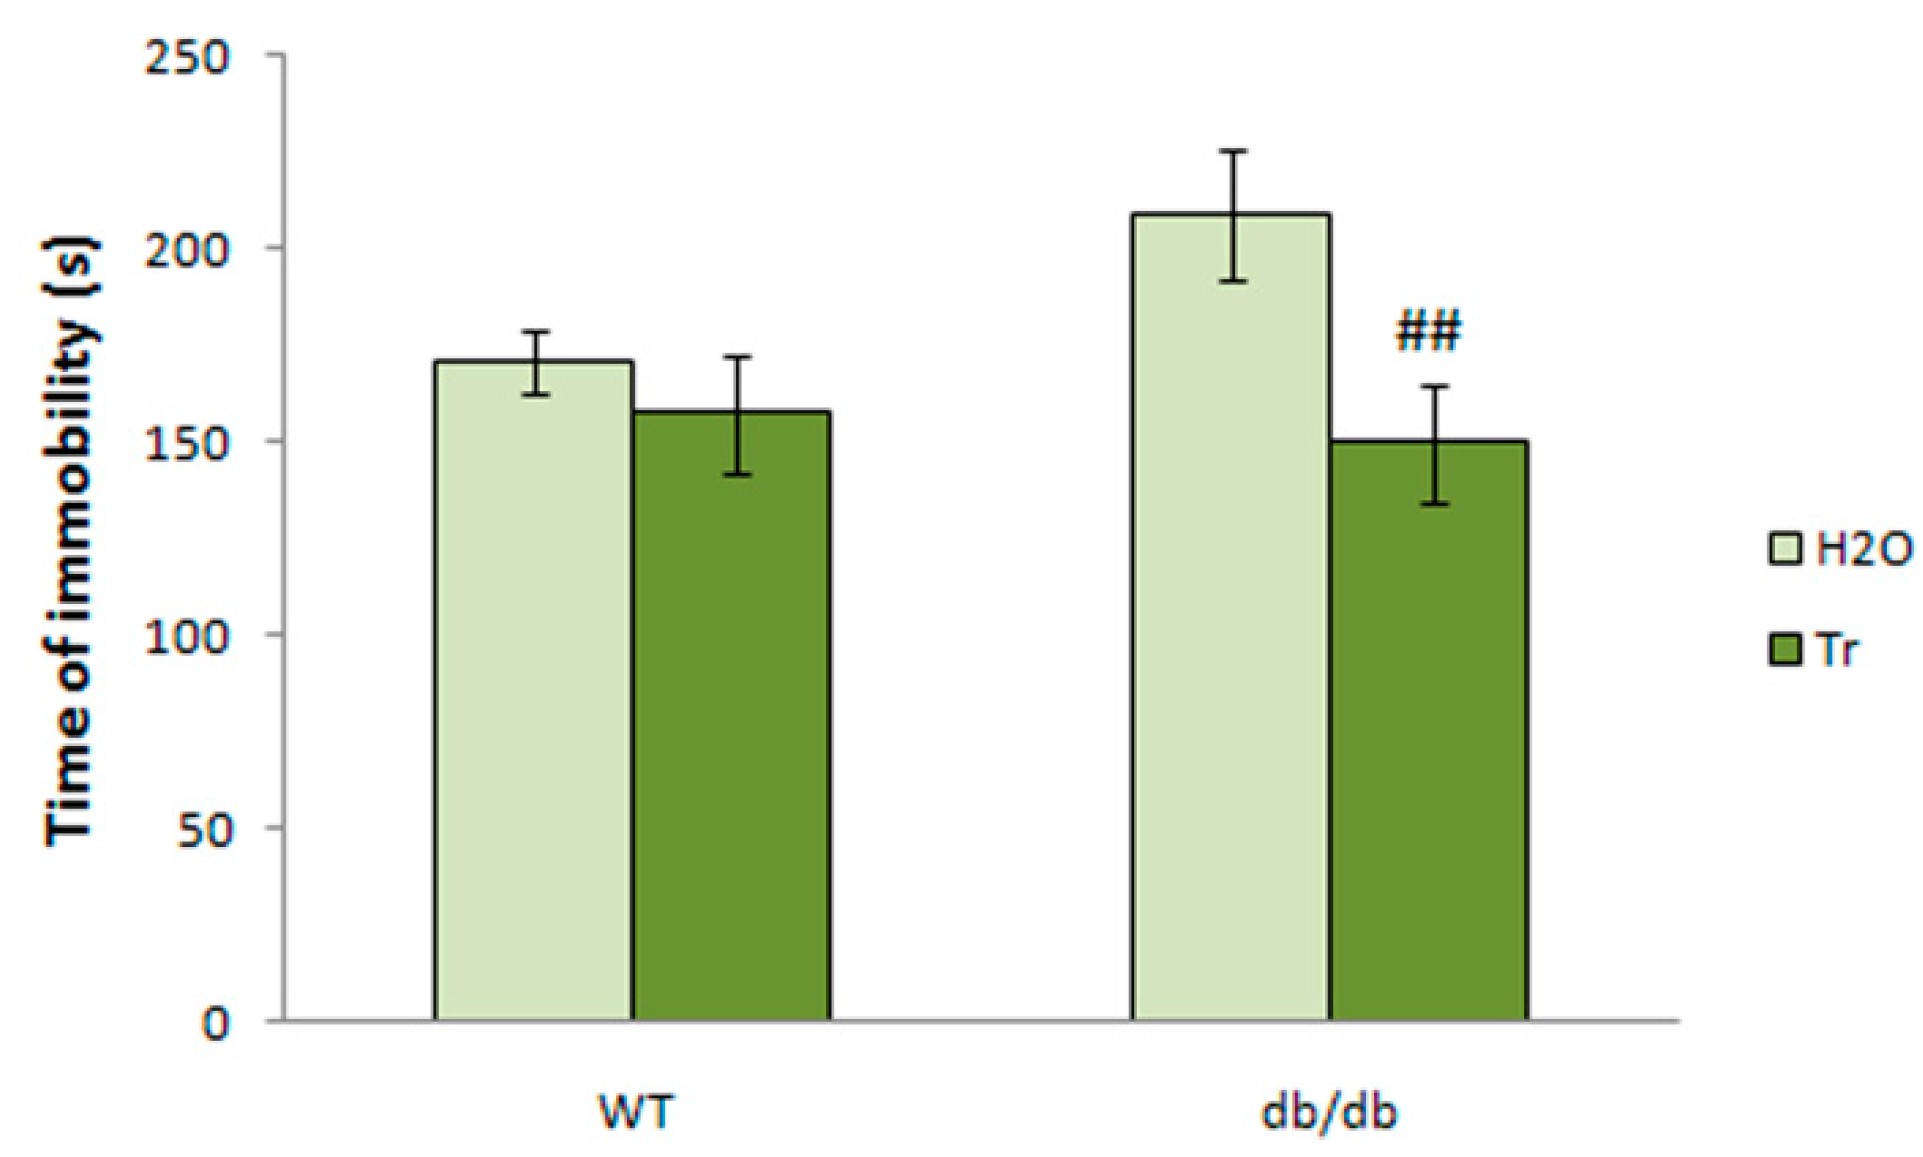
3.3.4. TST
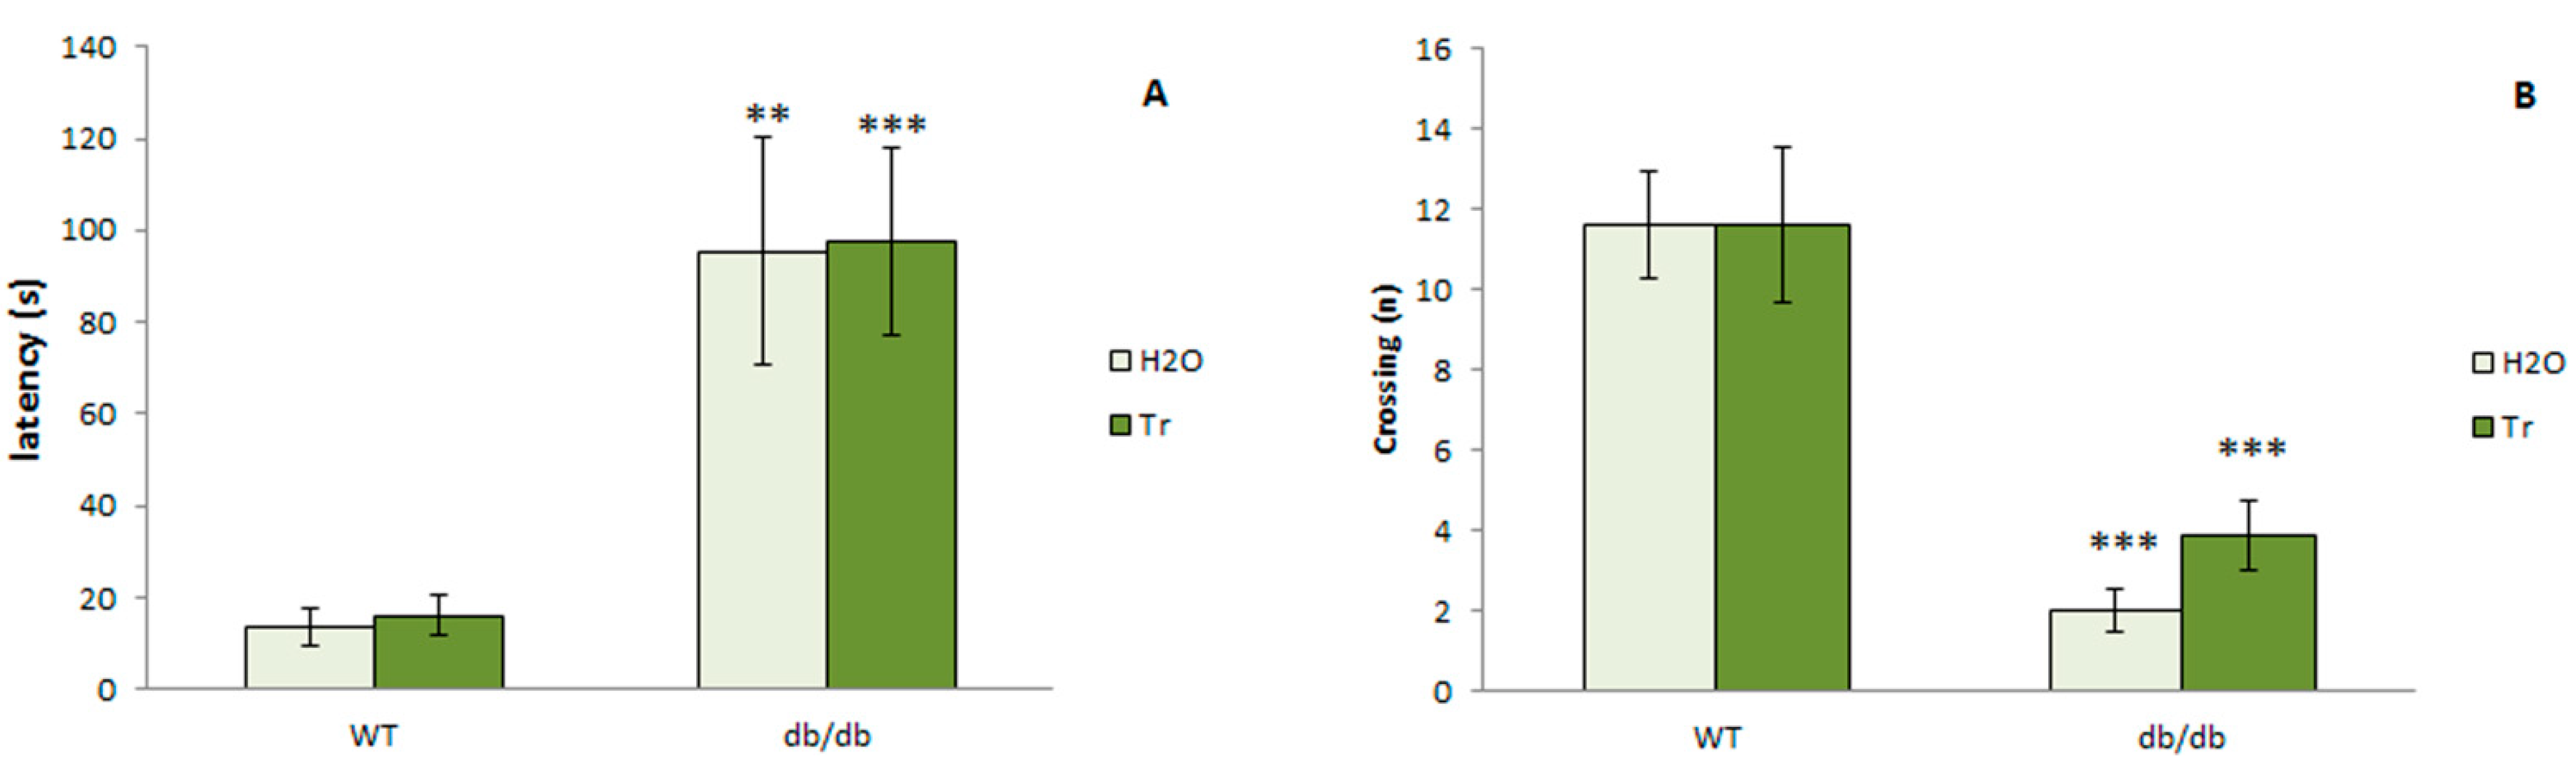
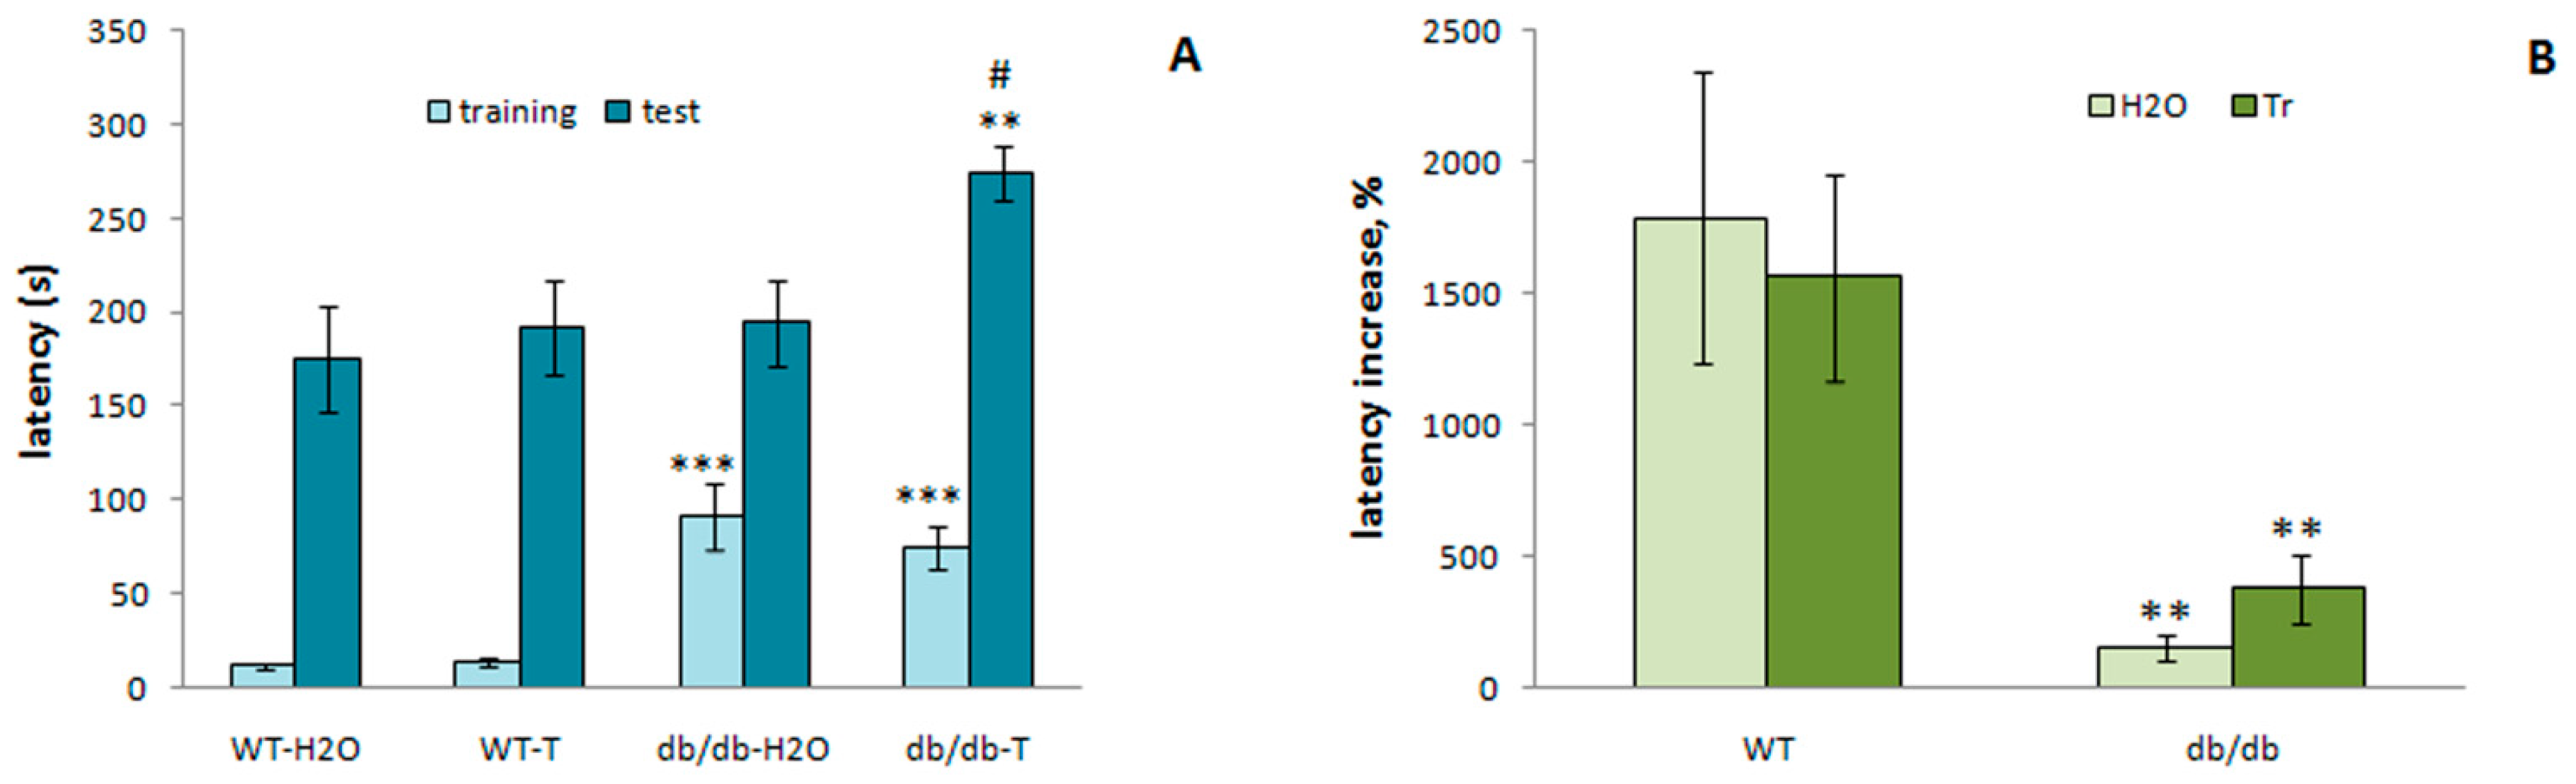
3.3.5. Passive Avoidance Test
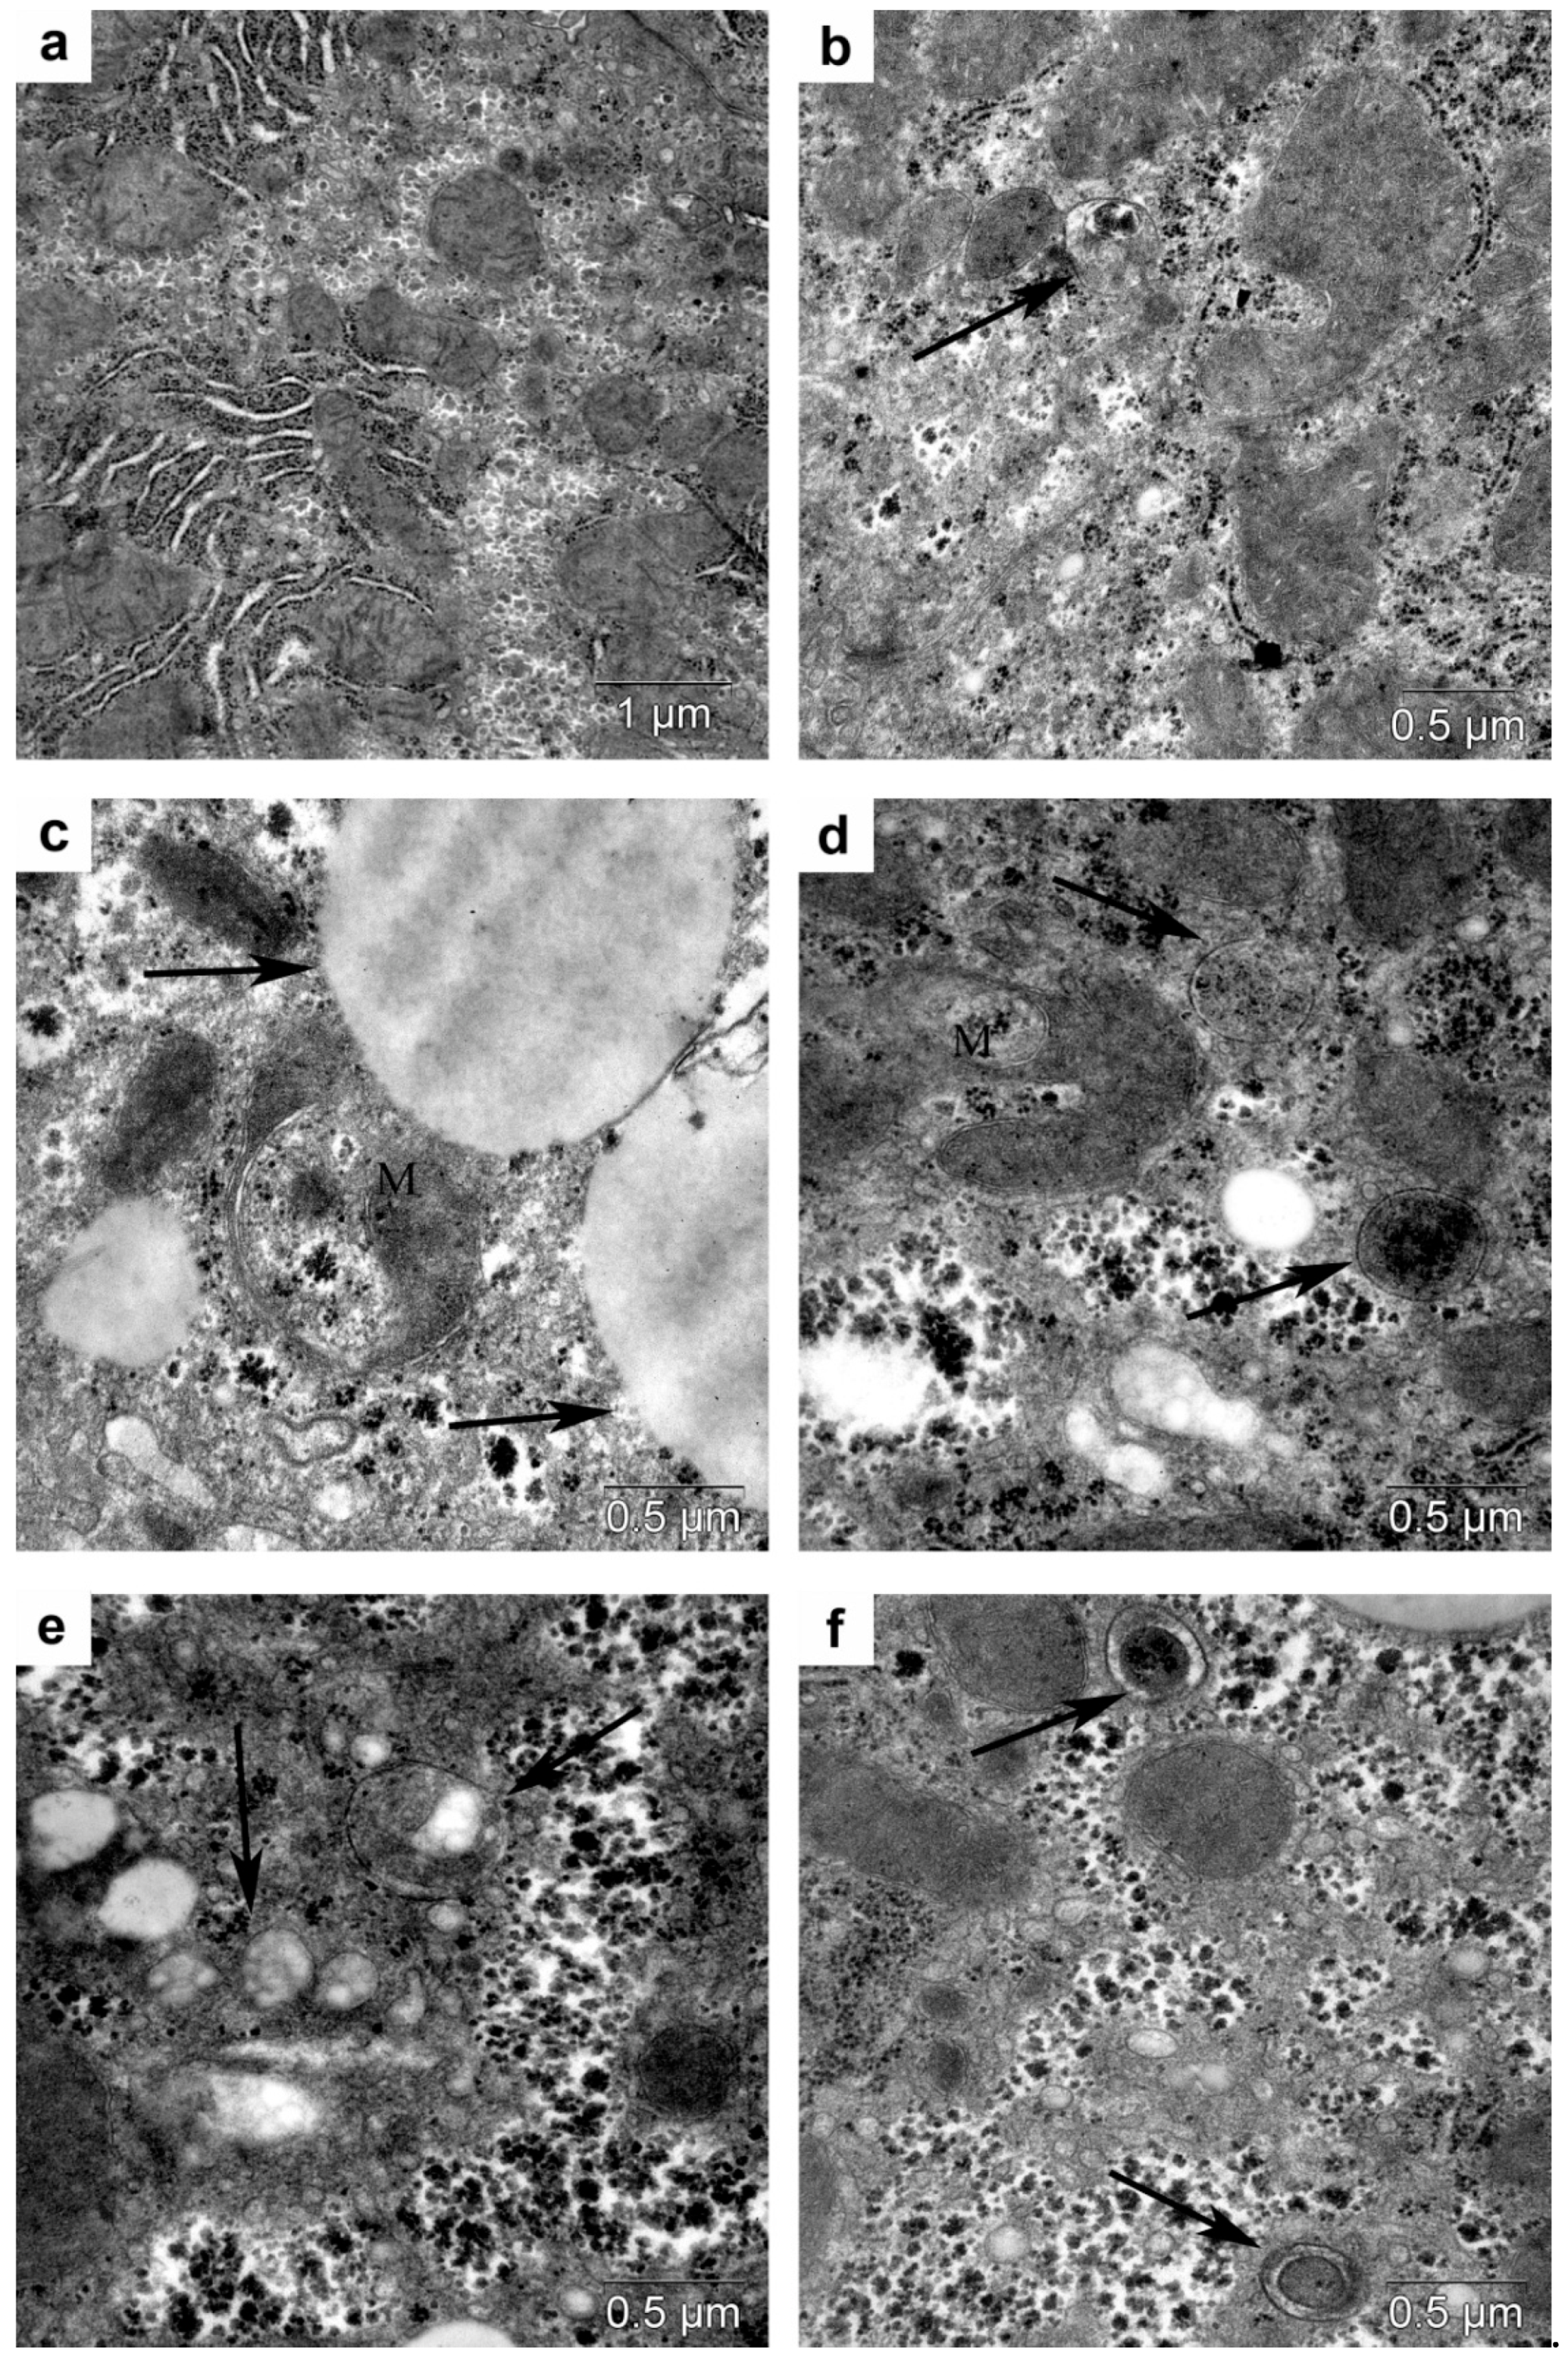
3.4. Morphological Analysis of Autophagy in the Liver
4. Discussion
5. Conclusions
Supplementary Materials
Author Contributions
Funding
Institutional Review Board Statement
Informed Consent Statement
Data Availability Statement
Acknowledgments
Conflicts of Interest
References
- Zhang, Y.; Pan, X.F.; Chen, J.; Xia, L.; Cao, A.; Zhang, Y.; Wang, J.; Li, H.; Yang, K.; Guo, K.; et al. Combined lifestyle factors and risk of incident type 2 diabetes and prognosis among individuals with type 2 diabetes: A systematic review and meta-analysis of prospective cohort studies. Diabetologia 2020, 63, 21–33. [Google Scholar] [CrossRef]
- Rojas, M.; Chavez-Castillo, M.; Bautista, J.; Ortega, A.; Nava, M.; Salazar, J.; Diaz-Camargo, E.; Medina, O.; Rojas-Quintero, J.; Bermudez, V. Alzheimer’s disease and type 2 diabetes mellitus: Pathophysiologic and pharmacotherapeutics links. World J. Diabetes 2021, 12, 745–766. [Google Scholar] [CrossRef]
- Hamed, S.A. Brain injury with diabetes mellitus: Evidence, mechanisms and treatment implications. Expert Rev. Clin. Pharmacol. 2017, 10, 409–428. [Google Scholar] [CrossRef]
- Pugazhenthi, S.; Qin, L.; Reddy, P.H. Common neurodegenerative pathways in obesity, diabetes, and Alzheimer’s disease. Biochim. Biophys. Acta (BBA) Mol. Basis Dis. 2017, 1863, 1037–1045. [Google Scholar] [CrossRef] [PubMed]
- Kim, J.; Park, K.; Kim, M.J.; Lim, H.; Kim, K.H.; Kim, S.W.; Lee, E.S.; Kim, H.H.; Kim, S.J.; Hur, K.Y.; et al. An autophagy enhancer ameliorates diabetes of human IAPP-transgenic mice through clearance of amyloidogenic oligomer. Nat. Commun. 2021, 12, 183. [Google Scholar] [CrossRef] [PubMed]
- Lim, H.; Lim, Y.M.; Kim, K.H.; Jeon, Y.E.; Park, K.; Kim, J.; Hwang, H.Y.; Lee, D.J.; Pagire, H.; Kwon, H.J.; et al. A novel autophagy enhancer as a therapeutic agent against metabolic syndrome and diabetes. Nat. Commun. 2018, 9, 1438. [Google Scholar] [CrossRef]
- Lazarov, O.; Minshall, R.D.; Bonini, M.G. Harnessing neurogenesis in the adult brain-A role in type 2 diabetes mellitus and Alzheimer’s disease. Int. Rev. Neurobiol. 2020, 155, 235–269. [Google Scholar] [CrossRef] [PubMed]
- Wijesekara, N.; Ahrens, R.; Sabale, M.; Wu, L.; Ha, K.; Verdile, G.; Fraser, P.E. Amyloid-beta and islet amyloid pathologies link Alzheimer’s disease and type 2 diabetes in a transgenic model. FASEB J. 2017, 31, 5409–5418. [Google Scholar] [CrossRef] [PubMed]
- Alpers, C.E.; Hudkins, K.L. Mouse models of diabetic nephropathy. Curr. Opin. Nephrol. Hypertens. 2011, 20, 278–284. [Google Scholar] [CrossRef] [PubMed]
- Bonds, J.A.; Shetti, A.; Stephen, T.K.L.; Bonini, M.G.; Minshall, R.D.; Lazarov, O. Deficits in hippocampal neurogenesis in obesity-dependent and -independent type-2 diabetes mellitus mouse models. Sci. Rep. 2020, 10, 16368. [Google Scholar] [CrossRef] [PubMed]
- Li, C.W.; Deng, M.Z.; Gao, Z.J.; Dang, Y.Y.; Zheng, G.D.; Yang, X.J.; Chao, Y.X.; Cai, Y.F.; Wu, X.L. Effects of compound K, a metabolite of ginsenosides, on memory and cognitive dysfunction in db/db mice involve the inhibition of ER stress and the NLRP3 inflammasome pathway. Food Funct. 2020, 11, 4416–4427. [Google Scholar] [CrossRef]
- Yaribeygi, H.; Yaribeygi, A.; Sathyapalan, T.; Sahebkar, A. Molecular mechanisms of trehalose in modulating glucose homeostasis in diabetes. Diabetes Metab. Syndr. Clin. Res. Rev. 2019, 13, 2214–2218. [Google Scholar] [CrossRef]
- Zhang, Y.; DeBosch, B.J. Using trehalose to prevent and treat metabolic function: Effectiveness and mechanisms. Curr. Opin. Clin. Nutr. Metab. Care 2019, 22, 303–310. [Google Scholar] [CrossRef]
- Jayaraman, A.; Pike, C.J. Alzheimer’s disease and type 2 diabetes: Multiple mechanisms contribute to interactions. Curr. Diabetes Rep. 2014, 14, 476. [Google Scholar] [CrossRef]
- Rom, S.; Zuluaga-Ramirez, V.; Gajghate, S.; Seliga, A.; Winfield, M.; Heldt, N.A.; Kolpakov, M.A.; Bashkirova, Y.V.; Sabri, A.K.; Persidsky, Y. Hyperglycemia-Driven Neuroinflammation Compromises BBB Leading to Memory Loss in Both Diabetes Mellitus (DM) Type 1 and Type 2 Mouse Models. Mol. Neurobiol. 2019, 56, 1883–1896. [Google Scholar] [CrossRef]
- Yaribeygi, H.; Panahi, Y.; Javadi, B.; Sahebkar, A. The Underlying Role of Oxidative Stress in Neurodegeneration: A Mechanistic Review. CNS Neurol. Disord. Drug Targets 2018, 17, 207–215. [Google Scholar] [CrossRef]
- Dinel, A.L.; Andre, C.; Aubert, A.; Ferreira, G.; Laye, S.; Castanon, N. Cognitive and emotional alterations are related to hippocampal inflammation in a mouse model of metabolic syndrome. PLoS ONE 2011, 6, e24325. [Google Scholar] [CrossRef]
- Sharma, A.N.; Elased, K.M.; Garrett, T.L.; Lucot, J.B. Neurobehavioral deficits in db/db diabetic mice. Physiol. Behav. 2010, 101, 381–388. [Google Scholar] [CrossRef]
- Yermakov, L.M.; Griggs, R.B.; Drouet, D.E.; Sugimoto, C.; Williams, M.T.; Vorhees, C.V.; Susuki, K. Impairment of cognitive flexibility in type 2 diabetic db/db mice. Behav. Brain Res. 2019, 371, 111978. [Google Scholar] [CrossRef]
- Du, J.; Liang, Y.; Xu, F.; Sun, B.; Wang, Z. Trehalose rescues Alzheimer’s disease phenotypes in APP/PS1 transgenic mice. J. Pharm. Pharmacol. 2013, 65, 1753–1756. [Google Scholar] [CrossRef]
- Hosseinpour-Moghaddam, K.; Caraglia, M.; Sahebkar, A. Autophagy induction by trehalose: Molecular mechanisms and therapeutic impacts. J. Cell. Physiol. 2018, 233, 6524–6543. [Google Scholar] [CrossRef] [PubMed]
- Goncharova, N.V.; Pupyshev, A.B.; Filyushina, E.E.; Loktev, K.V.; Korolenko, E.; Lushnikova, E.L.; Molodykh, O.P.; Korolenko, T.A.; Churin, B.V. Depression of Macrophages Modifies Serum Lipid Profile in Hyperlipidemia. Bull. Exp. Biol. Med. 2016, 160, 617–621. [Google Scholar] [CrossRef] [PubMed]
- Korolenko, T.A.; Svechnikova, I.G.; Filjushina, E.E.; Kaledin, V.I.; Vakulin, G.M.; Usynin, I.F.; Tsyrendordjiev, D.D. Macrophage stimulation and antitumor effect of Ukrain. Drugs Exp. Clin. Res. 1998, 24, 253–260. [Google Scholar] [PubMed]
- Poteryaeva, O.N.; Falameyeva, O.V.; Korolenko, T.A.; Kaledin, V.I.; Djanayeva, S.J.; Nowicky, J.W.; Sandula, J. Cysteine proteinase inhibitor level in tumor and normal tissues in control and cured mice. Drugs Exp. Clin. Res. 2000, 26, 301–306. [Google Scholar]
- Geyer, M.A.; Dulawa, S.C. Assessment of murine startle reactivity, prepulse inhibition, and habituation. Curr. Protoc. Neurosci. 2003, 24, 8–17. [Google Scholar] [CrossRef]
- Pupyshev, A.B.; Tikhonova, M.A.; Akopyan, A.A.; Tenditnik, M.V.; Dubrovina, N.I.; Korolenko, T.A. Therapeutic activation of autophagy by combined treatment with rapamycin and trehalose in a mouse MPTP-induced model of Parkinson’s disease. Pharmacol. Biochem. Behav. 2019, 177, 1–11. [Google Scholar] [CrossRef]
- Seibenhener, M.L.; Wooten, M.C. Use of the Open Field Maze to measure locomotor and anxiety-like behavior in mice. JoVE J. Vis. Exp. 2015, 96, e52434. [Google Scholar] [CrossRef]
- Cryan, J.F.; Mombereau, C.; Vassout, A. The tail suspension test as a model for assessing antidepressant activity: Review of pharmacological and genetic studies in mice. Neurosci. Biobehav. Rev. 2005, 29, 571–625. [Google Scholar] [CrossRef]
- Berrocoso, E.; Ikeda, K.; Sora, I.; Uhl, G.R.; Sanchez-Blazquez, P.; Mico, J.A. Active behaviours produced by antidepressants and opioids in the mouse tail suspension test. Int. J. Neuropsychopharmacol. 2013, 16, 151–162. [Google Scholar] [CrossRef]
- Sarnat, H.B. Histochemistry and immunocytochemistry of the developing ependyma and choroid plexus. Microsc. Res. Tech. 1998, 41, 14–28. [Google Scholar] [CrossRef]
- Tikhonova, M.A.; Shoeva, O.Y.; Tenditnik, M.V.; Ovsyukova, M.V.; Akopyan, A.A.; Dubrovina, N.I.; Amstislavskaya, T.G.; Khlestkina, E.K. Evaluating the Effects of Grain of Isogenic Wheat Lines Differing in the Content of Anthocyanins in Mouse Models of Neurodegenerative Disorders. Nutrients 2020, 12, 3877. [Google Scholar] [CrossRef]
- Bgatova, N.P.; Bakhbaeva, S.A.; Taskaeva, Y.S.; Makarova, V.V.; Borodin, Y.I. Autophagy in Hepatocytes during Distant Tumor Growth. Bull. Exp. Biol. Med. 2018, 165, 390–393. [Google Scholar] [CrossRef]
- Di Meco, A.; Li, J.G.; Blass, B.E.; Abou-Gharbia, M.; Lauretti, E.; Pratico, D. 12/15-Lipoxygenase Inhibition Reverses Cognitive Impairment, Brain Amyloidosis, and Tau Pathology by Stimulating Autophagy in Aged Triple Transgenic Mice. Biol. Psychiatry 2017, 81, 92–100. [Google Scholar] [CrossRef]
- Korolenko, T.A.; Johnston, T.P.; Vetvicka, V. Lysosomotropic Features and Autophagy Modulators among Medical Drugs: Evaluation of Their Role in Pathologies. Molecules 2020, 25, 5052. [Google Scholar] [CrossRef]
- Filfan, M.; Sandu, R.E.; Zavaleanu, A.D.; GresiTa, A.; Glavan, D.G.; Olaru, D.G.; Popa-Wagner, A. Autophagy in aging and disease. Rom. J. Morphol. Embryol. 2017, 58, 27–31. [Google Scholar]
- Stacchiotti, A.; Corsetti, G. Natural Compounds and Autophagy: Allies Against Neurodegeneration. Front. Cell Dev. Biol. 2020, 8, 555409. [Google Scholar] [CrossRef]
- Korbut, A.I.; Taskaeva, I.S.; Bgatova, N.P.; Muraleva, N.A.; Orlov, N.B.; Dashkin, M.V.; Khotskina, A.S.; Zavyalov, E.L.; Konenkov, V.I.; Klein, T.; et al. SGLT2 Inhibitor Empagliflozin and DPP4 Inhibitor Linagliptin Reactivate Glomerular Autophagy in db/db Mice, a Model of Type 2 Diabetes. Int. J. Mol. Sci. 2020, 21, 2987. [Google Scholar] [CrossRef]
- Omori, K.; Nakamura, A.; Miyoshi, H.; Takahashi, K.; Kitao, N.; Nomoto, H.; Kameda, H.; Cho, K.Y.; Takagi, R.; Hatanaka, K.C.; et al. Effects of dapagliflozin and/or insulin glargine on beta cell mass and hepatic steatosis in db/db mice. Metabolism 2019, 98, 27–36. [Google Scholar] [CrossRef]
- Kim, J.; Lim, Y.M.; Lee, M.S. The Role of Autophagy in Systemic Metabolism and Human-Type Diabetes. Mol. Cells 2018, 41, 11–17. [Google Scholar] [CrossRef]
- Xu, C.; Chen, X.; Sheng, W.B.; Yang, P. Trehalose restores functional autophagy suppressed by high glucose. Reprod. Toxicol. 2019, 85, 51–58. [Google Scholar] [CrossRef]
- Xu, C.; Li, X.; Wang, F.; Weng, H.; Yang, P. Trehalose prevents neural tube defects by correcting maternal diabetes-suppressed autophagy and neurogenesis. Am. J. Physiol. Endocrinol. Metab. 2013, 305, E667–E678. [Google Scholar] [CrossRef] [PubMed]
- Commins, S.; Kirby, B.P. The complexities of behavioural assessment in neurodegenerative disorders: A focus on Alzheimer’s disease. Pharmacol. Res. 2019, 147, 104363. [Google Scholar] [CrossRef] [PubMed]
- Guan, Z.F.; Tao, Y.H.; Zhang, X.M.; Guo, Q.L.; Liu, Y.C.; Zhang, Y.; Wang, Y.M.; Ji, G.; Wu, G.F.; Wang, N.N.; et al. G-CSF and cognitive dysfunction in elderly diabetic mice with cerebral small vessel disease: Preventive intervention effects and underlying mechanisms. CNS Neurosci. Ther. 2017, 23, 462–474. [Google Scholar] [CrossRef] [PubMed]
- Wu, X.L.; Deng, M.Z.; Gao, Z.J.; Dang, Y.Y.; Li, Y.C.; Li, C.W. Neferine alleviates memory and cognitive dysfunction in diabetic mice through modulation of the NLRP3 inflammasome pathway and alleviation of endoplasmic-reticulum stress. Int. Immunopharmacol. 2020, 84, 106559. [Google Scholar] [CrossRef]
- Zuloaga, K.L.; Johnson, L.A.; Roese, N.E.; Marzulla, T.; Zhang, W.; Nie, X.; Alkayed, F.N.; Hong, C.; Grafe, M.R.; Pike, M.M.; et al. High fat diet-induced diabetes in mice exacerbates cognitive deficit due to chronic hypoperfusion. J. Cereb. Blood Flow Metab. 2016, 36, 1257–1270. [Google Scholar] [CrossRef]
- Pentkowski, N.S.; Rogge-Obando, K.K.; Donaldson, T.N.; Bouquin, S.J.; Clark, B.J. Anxiety and Alzheimer’s disease: Behavioral analysis and neural basis in rodent models of Alzheimer’s-related neuropathology. Neurosci. Biobehav. Rev. 2021, 127, 647–658. [Google Scholar] [CrossRef]
- Singh, A.; Dawson, T.M.; Kulkarni, S. Neurodegenerative disorders and gut-brain interactions. J. Clin. Investig. 2021, 131, e143775. [Google Scholar] [CrossRef]
- Macias-Ceja, D.C.; Cosin-Roger, J.; Ortiz-Masia, D.; Salvador, P.; Hernandez, C.; Esplugues, J.V.; Calatayud, S.; Barrachina, M.D. Stimulation of autophagy prevents intestinal mucosal inflammation and ameliorates murine colitis. Br. J. Pharmacol. 2017, 174, 2501–2511. [Google Scholar] [CrossRef]
- Zhang, W.; Xu, J.H.; Yu, T.; Chen, Q.K. Effects of berberine and metformin on intestinal inflammation and gut microbiome composition in db/db mice. Biomed. Pharmacother. 2019, 118, 109131. [Google Scholar] [CrossRef]
- Ahima, R.S.; Bjorbaek, C.; Osei, S.; Flier, J.S. Regulation of neuronal and glial proteins by leptin: Implications for brain development. Endocrinology 1999, 140, 2755–2762. [Google Scholar] [CrossRef]
- Yoshizane, C.; Mizote, A.; Yamada, M.; Arai, N.; Arai, S.; Maruta, K.; Mitsuzumi, H.; Ariyasu, T.; Ushio, S.; Fukuda, S. Glycemic, insulinemic and incretin responses after oral trehalose ingestion in healthy subjects. Nutr. J. 2017, 16, 9. [Google Scholar] [CrossRef]
- Mardones, P.; Rubinsztein, D.C.; Hetz, C. Mystery solved: Trehalose kickstarts autophagy by blocking glucose transport. Sci. Signal. 2016, 9, fs2. [Google Scholar] [CrossRef]
- Arai, C.; Arai, N.; Mizote, A.; Kohno, K.; Iwaki, K.; Hanaya, T.; Arai, S.; Ushio, S.; Fukuda, S. Trehalose prevents adipocyte hypertrophy and mitigates insulin resistance. Nutr. Res. 2010, 30, 840–848. [Google Scholar] [CrossRef]
- Arai, C.; Miyake, M.; Matsumoto, Y.; Mizote, A.; Yoshizane, C.; Hanaya, Y.; Koide, K.; Yamada, M.; Hanaya, T.; Arai, S.; et al. Trehalose prevents adipocyte hypertrophy and mitigates insulin resistance in mice with established obesity. J. Nutr. Sci. Vitaminol. 2013, 59, 393–401. [Google Scholar] [CrossRef]
- Sokolowska, E.; Sadowska, A.; Sawicka, D.; Kotulska-Bablinska, I.; Car, H. A head-to-head comparison review of biological and toxicological studies of isomaltulose, d-tagatose, and trehalose on glycemic control. Crit. Rev. Food Sci. Nutr. 2021. [Google Scholar] [CrossRef]
- Jeong, S.J.; Stitham, J.; Evans, T.D.; Zhang, X.; Rodriguez-Velez, A.; Yeh, Y.S.; Tao, J.; Takabatake, K.; Epelman, S.; Lodhi, I.J.; et al. Trehalose causes low-grade lysosomal stress to activate TFEB and the autophagy-lysosome biogenesis response. Autophagy 2021. [Google Scholar] [CrossRef]
- Rusmini, P.; Cortese, K.; Crippa, V.; Cristofani, R.; Cicardi, M.E.; Ferrari, V.; Vezzoli, G.; Tedesco, B.; Meroni, M.; Messi, E.; et al. Trehalose induces autophagy via lysosomal-mediated TFEB activation in models of motoneuron degeneration. Autophagy 2019, 15, 631–651. [Google Scholar] [CrossRef]
- Mizunoe, Y.; Kobayashi, M.; Sudo, Y.; Watanabe, S.; Yasukawa, H.; Natori, D.; Hoshino, A.; Negishi, A.; Okita, N.; Komatsu, M.; et al. Trehalose protects against oxidative stress by regulating the Keap1-Nrf2 and autophagy pathways. Redox Biol. 2018, 15, 115–124. [Google Scholar] [CrossRef]
- Zhang, Y.; DeBosch, B.J. Microbial and metabolic impacts of trehalose and trehalose analogues. Gut Microbes 2020, 11, 1475–1482. [Google Scholar] [CrossRef]
- Yoshizane, C.; Mizote, A.; Arai, C.; Arai, N.; Ogawa, R.; Endo, S.; Mitsuzumi, H.; Ushio, S. Response to: Can one teaspoon of trehalose a day mitigate metabolic syndrome and diabetes risks? Nutr. J. 2021, 20, 26. [Google Scholar] [CrossRef]


Publisher’s Note: MDPI stays neutral with regard to jurisdictional claims in published maps and institutional affiliations. |
© 2021 by the authors. Licensee MDPI, Basel, Switzerland. This article is an open access article distributed under the terms and conditions of the Creative Commons Attribution (CC BY) license (https://creativecommons.org/licenses/by/4.0/).
Share and Cite
Korolenko, T.A.; Dubrovina, N.I.; Ovsyukova, M.V.; Bgatova, N.P.; Tenditnik, M.V.; Pupyshev, A.B.; Akopyan, A.A.; Goncharova, N.V.; Lin, C.-L.; Zavjalov, E.L.; et al. Treatment with Autophagy Inducer Trehalose Alleviates Memory and Behavioral Impairments and Neuroinflammatory Brain Processes in db/db Mice. Cells 2021, 10, 2557. https://doi.org/10.3390/cells10102557
Korolenko TA, Dubrovina NI, Ovsyukova MV, Bgatova NP, Tenditnik MV, Pupyshev AB, Akopyan AA, Goncharova NV, Lin C-L, Zavjalov EL, et al. Treatment with Autophagy Inducer Trehalose Alleviates Memory and Behavioral Impairments and Neuroinflammatory Brain Processes in db/db Mice. Cells. 2021; 10(10):2557. https://doi.org/10.3390/cells10102557
Chicago/Turabian StyleKorolenko, Tatiana A., Nina I. Dubrovina, Marina V. Ovsyukova, Nataliya P. Bgatova, Michael V. Tenditnik, Alexander B. Pupyshev, Anna A. Akopyan, Natalya V. Goncharova, Chih-Li Lin, Evgeny L. Zavjalov, and et al. 2021. "Treatment with Autophagy Inducer Trehalose Alleviates Memory and Behavioral Impairments and Neuroinflammatory Brain Processes in db/db Mice" Cells 10, no. 10: 2557. https://doi.org/10.3390/cells10102557