Inhibition of Mitochondrial Complex Function—The Hepatotoxicity Mechanism of Emodin Based on Quantitative Proteomic Analyses

1
Institute Chinese materia medica china academy of Chinese medical sciences, Beijing 100700, China
2
School of Chinese material medica, Beijing University of Chinese Medicine, Beijing 100102, China
*
Authors to whom correspondence should be addressed.
Cells 2019, 8(3), 263; https://doi.org/10.3390/cells8030263
Submission received: 18 December 2018
/
Revised: 12 March 2019
/
Accepted: 13 March 2019
/
Published: 20 March 2019
(This article belongs to the Section Autophagy)
Abstract
:Emodin is the main component of traditional Chinese medicines including rhubarb, Polygonum multiflorum, and Polygonum cuspidatum. It has confirmed hepatotoxicity and may be the main causative agent of liver damage associated with the above-mentioned traditional Chinese medicines. However, current research does not explain the mechanism of emodin in hepatotoxicity. In this study, L02 cells were used as a model to study the mechanism of emodin-induced hepatocyte apoptosis using quantitative proteomics, and the results were verified by Western blot. A total of 662 differentially expressed proteins were discovered and analyzed using Gene Ontology (GO) and pathway enrichment analysis. The results show that the oxidative phosphorylation pathway is highly represented. Abnormalities in this pathway result in impaired mitochondrial function and represent mitochondrial damage. This result is consistent with mitochondria membrane potential measurements. Analysis of differentially expressed proteins revealed that emodin mainly affects oxidative phosphorylation pathways by inhibiting the function of the mitochondrial respiratory chain complexes; the mitochondrial respiratory chain complex activity assay result also confirmed that emodin could inhibit the activity of all mitochondrial complexes. This results in an increase in caspase-3, a decrease in mitochondrial membrane potential (MMP,) an increase in reactive oxygen species (ROS), and disorders in ATP synthesis, etc., eventually leading to mitochondrial damage and hepatocyte apoptosis in vitro.
1. Introduction
Emodin is an anthraquinone mainly found in traditional Chinese medicines such as rhubarb, Polygonum multiflorum, and Polygonum cuspidatum. It has many pharmacological activities, such as anti-cancer and anti-inflammatory effects, constipation relief, liver protection, and anti-aging effects [1,2,3,4,5,6]. Emodin has a high content in those plants mentioned above, reaching close to 1% in Polygonum cuspidatum and Polygonum multiflorum [7,8,9,10]. The daily dose of Polygonum cuspidatum should be 9–15 g, as stipulated in the Chinese Pharmacopoeia, so the dose of emodin can be up to 150 mg when taken in Polygonum cuspidatum. Furthermore, in recent years, the liver damage caused by Chinese herbal medicines such as P. multiflorum and rhubarb [11,12,13,14,15] has attracted widespread attention. Many studies have shown that the main component, emodin, has strong hepatotoxicity and can cause liver damage [13,16,17]. The U.S. National Toxicology Program (NTP) verified this finding through a two-year study of emodin [18]. Previous in vitro studies have also shown that emodin can cause apoptosis in normal human L02 cells [13,16]. These studies employed high-content analysis, which confirmed that emodin-induced apoptosis of L02 cells is related to changes in mitochondrial membrane potential (MMP) and increased reactive oxygen species (ROS). However, there are currently no in-depth studies on the mechanism of action of emodin hepatotoxicity. Our study uses quantitative proteomic techniques to study the mechanism behind emodin-induced apoptosis in L02 cells and to verify these findings by Western blot. This study will allow us to better understand how liver damage can be caused by emodin and emodin-containing traditional Chinese medicines and to provide a reference for future research.
2. Materials and Methods
2.1. Materials
Normal human liver cell line L02 cells were purchased from China Cell Bank (Shanghai). Cells were cultured in complete Dulbecco’s Modified Eagle Medium(DMEM) medium containing 10% fetal bovine serum (FBS, v/v) and 100 U/mL streptomycin. The culture conditions were 37 °C under 5% CO2. Emodin was purchased from Shanghai Yuanye Bio-Technology Co., Ltd. (Shanghai, China). Reducing reagent, denaturing reagent, iodoacetamide, quenching reagent, dissolution buffer, and the Protein Assay Kit were purchased from Thermo Scientific (Thermo Fisher Scientific Corp., MA, USA). Carbamide and 3-((3-cholamidopropyl) dimethylammonio)-1-propanesulfonate) (CHAPS) were purchased from Bio-Rad Laboratories, Inc. (Hercules, CA, USA). Thiourea and bovine serum albumin were purchased from Sigma-Aldrich Corporation (St. Louis, MO, USA). Caspase-8, caspase-3, Ndufs1, Cox7A2, ATP6, SDHA, and Bax inhibitor 1 antibodies were purchased from Cell Signaling Technology (Danvers, MA, USA). The mitochondrial extraction kit was purchased from Solarbio Science & Technology Corporation (Beijing, China). The Electron transport chain Complex assay kits I, II, III, IV, and V were purchased from Nanjing Jiancheng Bioengineering Institute (Nanjing, China).
2.2. Cell Culture
L02 cells were cultured in DMEM complete medium containing 10% FBS in a cell culture incubator under 37 °C, 5% CO2, and saturated humidity. When the cells were grown to 80–90% confluence, they were treated with 0.25% trypsin solution, passaged, and cells in good condition with vigorous proliferation were used for subsequent tests.
2.3. CCK8 Cell Survival Assay
L02 cells in logarithmic growth phase were treated with 0.25% trypsin and adjusted to a cell density of 5 × 10⁴ cells/mL; 100 μL cells per well were seeded in a 96-well plate, and cultured at 37 °C under 5% CO2 and saturated humidity. After incubation for 24 h, 100 μL of each test solution were added to each well at different concentrations. The test was set up with a positive control group (5% DMSO group) and a negative control group (same volume of culture medium), and each group contained four repeats. After the cells were cultured for 24 h to 48 h, the culture medium was removed, and 100 μL of fresh complete medium and 10 μL of CCK-8 reagent were added. The plate was placed in the incubator for another 3.5 h and a microplate reader was used to analyze the cells. Absorbance (A) at 450 nm was measured and the survival rate and inhibition rate of L02 cells were calculated as follows:
% survival = [OD value (test well) − OD value (background well)]/[OD value (negative control well) − OD value (background well)] × 100. % inhibition = 100% − % survival.
(OD is an abbreviation of optical density)
2.4. Quantitative Proteomic Assays
2.4.1. Protein Extraction and Quantification
L02 cells were cultured in DMEM medium containing 10% FBS, 100 U/mL penicillin, and 100 U/mL streptomycin in a 5% CO2 incubator (Osaka, Japan) at 37 °C. The cell culture medium was replaced once every three days. L02 cells in logarithmic phase were collected, and 2 × 10⁵ cells/well were inoculated in 6-well plates. Cells were incubated at 37 °C until the cell density reached 80%, then were treated with culture medium and emodin for 48 h. The cells were collected, centrifuged, and the cell pellet was retained. An appropriate amount of lysis buffer (7 M urea, 2 M thiourea, and 0.1% CHAPS) was added to the pellet, and the sample was vortexed, sonicated, and centrifuged at 14,000× g for 30 min. The supernatant was taken for protein quantification by Bovine Serum Albumin (BCA); the control group and the administered group samples were prepared in triplicate, respectively.
2.4.2. Proteolysis and Tandem Mass Tag (TMT) Labeling
From each sample, 100 μg of protein were taken and placed in a centrifuge tube, and dissolution buffer was added to a final volume of 100 μL. Reducing reagent was then added, and the samples were allowed to incubate at 55 °C for 1 h. Iodoacetamide solution was added and the samples were incubated at room temperature for 30 min in the dark. Dissolution buffer was added, following which the samples were centrifuged at 12,000 rpm for 20 min and solution was collected from the inner tube of the annular tubes (discard the solution in the outer tube). This step was repeated four times. The total volume was completed to 100 μL with dissolution buffer and 2 μg of trypsin were added to each sample (100 μg), which was allowed to incubate at 37 °C overnight. The tube was washed three times with ultrapure water, freeze-dried, and reconstituted with dissolution buffer.
TMT reagent was taken and 41 μL of absolute ethanol was added to each tube, which was then added to the enzyme-treated sample and allowed to react at room temperature for 1 h. Eight microliters of 5% quenching reagent was added and the samples were incubated for 15 min to stop the reaction. The labeled samples were mixed, vortexed, and centrifuged to the bottom of the tube. They were then vacuum-dried and frozen until use.
2.4.3. LC/MS/MS Analysis
Reverse-phase chromatography at high pH: The mixed-labeled sample was dissolved in 100 μL of mobile phase A (98% ddH2O, 2% acetonitrile, pH 10), centrifuged at 14,000× g for 20 min, and the supernatant was taken for analysis. Separation was carried out using 400 μg of enzymatically digested bovine serum albumin (BSA). The column temperature was 45 °C, the detection wavelength was 214 nm, and 100 μL sample was loaded.
Nano-LC-Q exactive protein analysis: the components obtained by high pH reverse phase separation were reconstituted with 20 μL of 2% methanol and 0.1% formic acid, and centrifuged at 12,000 rpm for 10 min. The supernatant was aspirated and 10 μL were loaded using the sandwich method. The loading pump flow rate was 350 nl/min, for 15 min (mass spectrometry parameters).
2.4.4. Analysis of Proteomics Data
The mass spectrometric analysis of TMT was performed by Thermo Q-Exactive mass spectrometry. The original mass spectrometry data generated were processed using Thermo’s commercial software Proteome Discoverer 2.1. The databases used were the UniProt and Homo sapiens databases. Using bioinformatics analysis tools, differentially expressed proteins were subjected to GO-based enrichment analysis (BP, cellular component (CC), and MF), and pathway enrichment analysis was performed using the KEGG database.
2.5. Western Blot Analysis
Total protein was extracted using the same method as described in Section 2.4.1, and a 6% stacking gel was poured onto a 10% SDS-polyacrylamide gel. After samples were loaded, electrophoresis was carried out and the gel was transferred to a polyvinylidene fluoride (PVDF) membrane. After blocking with 50 g/L skim milk for 1 h, the following primary antibodies were used: rabbit anti-human caspase-8, caspase-3, Ndufs1, Cox7A2, ATP6, SDHA, Bax inhibitor 1 protein, and anti-GAPDH antibody (1:1000 dilution). The secondary antibody was horseradish peroxidase-labeled goat anti-rabbit antibody (1:5000 dilution). The membrane was washed three times with phosphate tween buffer and the chemiluminescence reagent was developed. Each sample was run three times. After color development, the intensity of the bands was analyzed for semi-quantitative comparative analysis. The expression level of the protein was expressed as the ratio of the target protein intensity to the intensity of GAPDH.
2.6. MMP Measurement
Tetraethylbenzimidazolylcarbocyanine iodide (JC-1) is a widely used fluorescent probe for the measurement of MMP. When the MMP is high, the polymer emits red fluorescence. When the MMP is low, JC-1 takes on a monomeric form that emits green fluorescence. The positive control was the mitochondrial uncoupler carbonyl cyanide m-chlorophenyl hydrazone (CCCP). JC-1 was diluted with ultrapure water, and then JC-1 staining buffer was added and mixed to make the JC-1 working solution. The control group, drug administration group, and vehicle group were cultured, and CCCP (10 mM) was added to the sample at a ratio of 1:1000 and incubated for 20 min. The JC-1 monomer was measured by the microplate reader at excitation/emission wavelengths of 490/530 nm, while the JC-1 polymer was measured at excitation/emission wavelengths of 525/590 nm.
2.7. Mitochondrial Respiratory Chain Complexes Activity Assay
L02 cells were cultured in DMEM medium containing 10% FBS, 100 U/mL penicillin, and 100 U/mL streptomycin in a 5% CO2 incubator at 37 °C. L02 cells in logarithmic phase were collected, and 2 × 10⁵ cells/well were inoculated in 6-well plates. Cells were incubated at 37 °C until the cell density reached 80%, then treated with culture medium and emodin at 50 μΜ for 48 h. After treatment the cells were collected, centrifuged, and the cell pellet was retained. An appropriate amount of lysis buffer was added for suspended cell, and then the mitochondria were extracted according to the instructions, and 5 × 10⁷ cells per time. After that, the activities of mitochondrial respiratory chain complexes I, II, III, IV, and V were quantitatively detected through the colorimetric method; the control group and the administered group samples were prepared in triplicate, respectively.
The activity values of the complexes are calculated as follows:
Activity value = [(test sample OD value − background OD value) × system volume × test sample dilution multiple]/[test sample volume × X (millimole absorptivity) × reaction time(min) × test sample protein concentration (mg prot/mL)]
Different complexes have different X values, these being 5.5, 21.8, 21.84, 21.84, and 6.22 for complexes I, II, III, IV, and V, respectively. Prot is an abbreviation of protein.
3. Results
3.1. Cell Counting Kit-8(CCK-8) Analysis
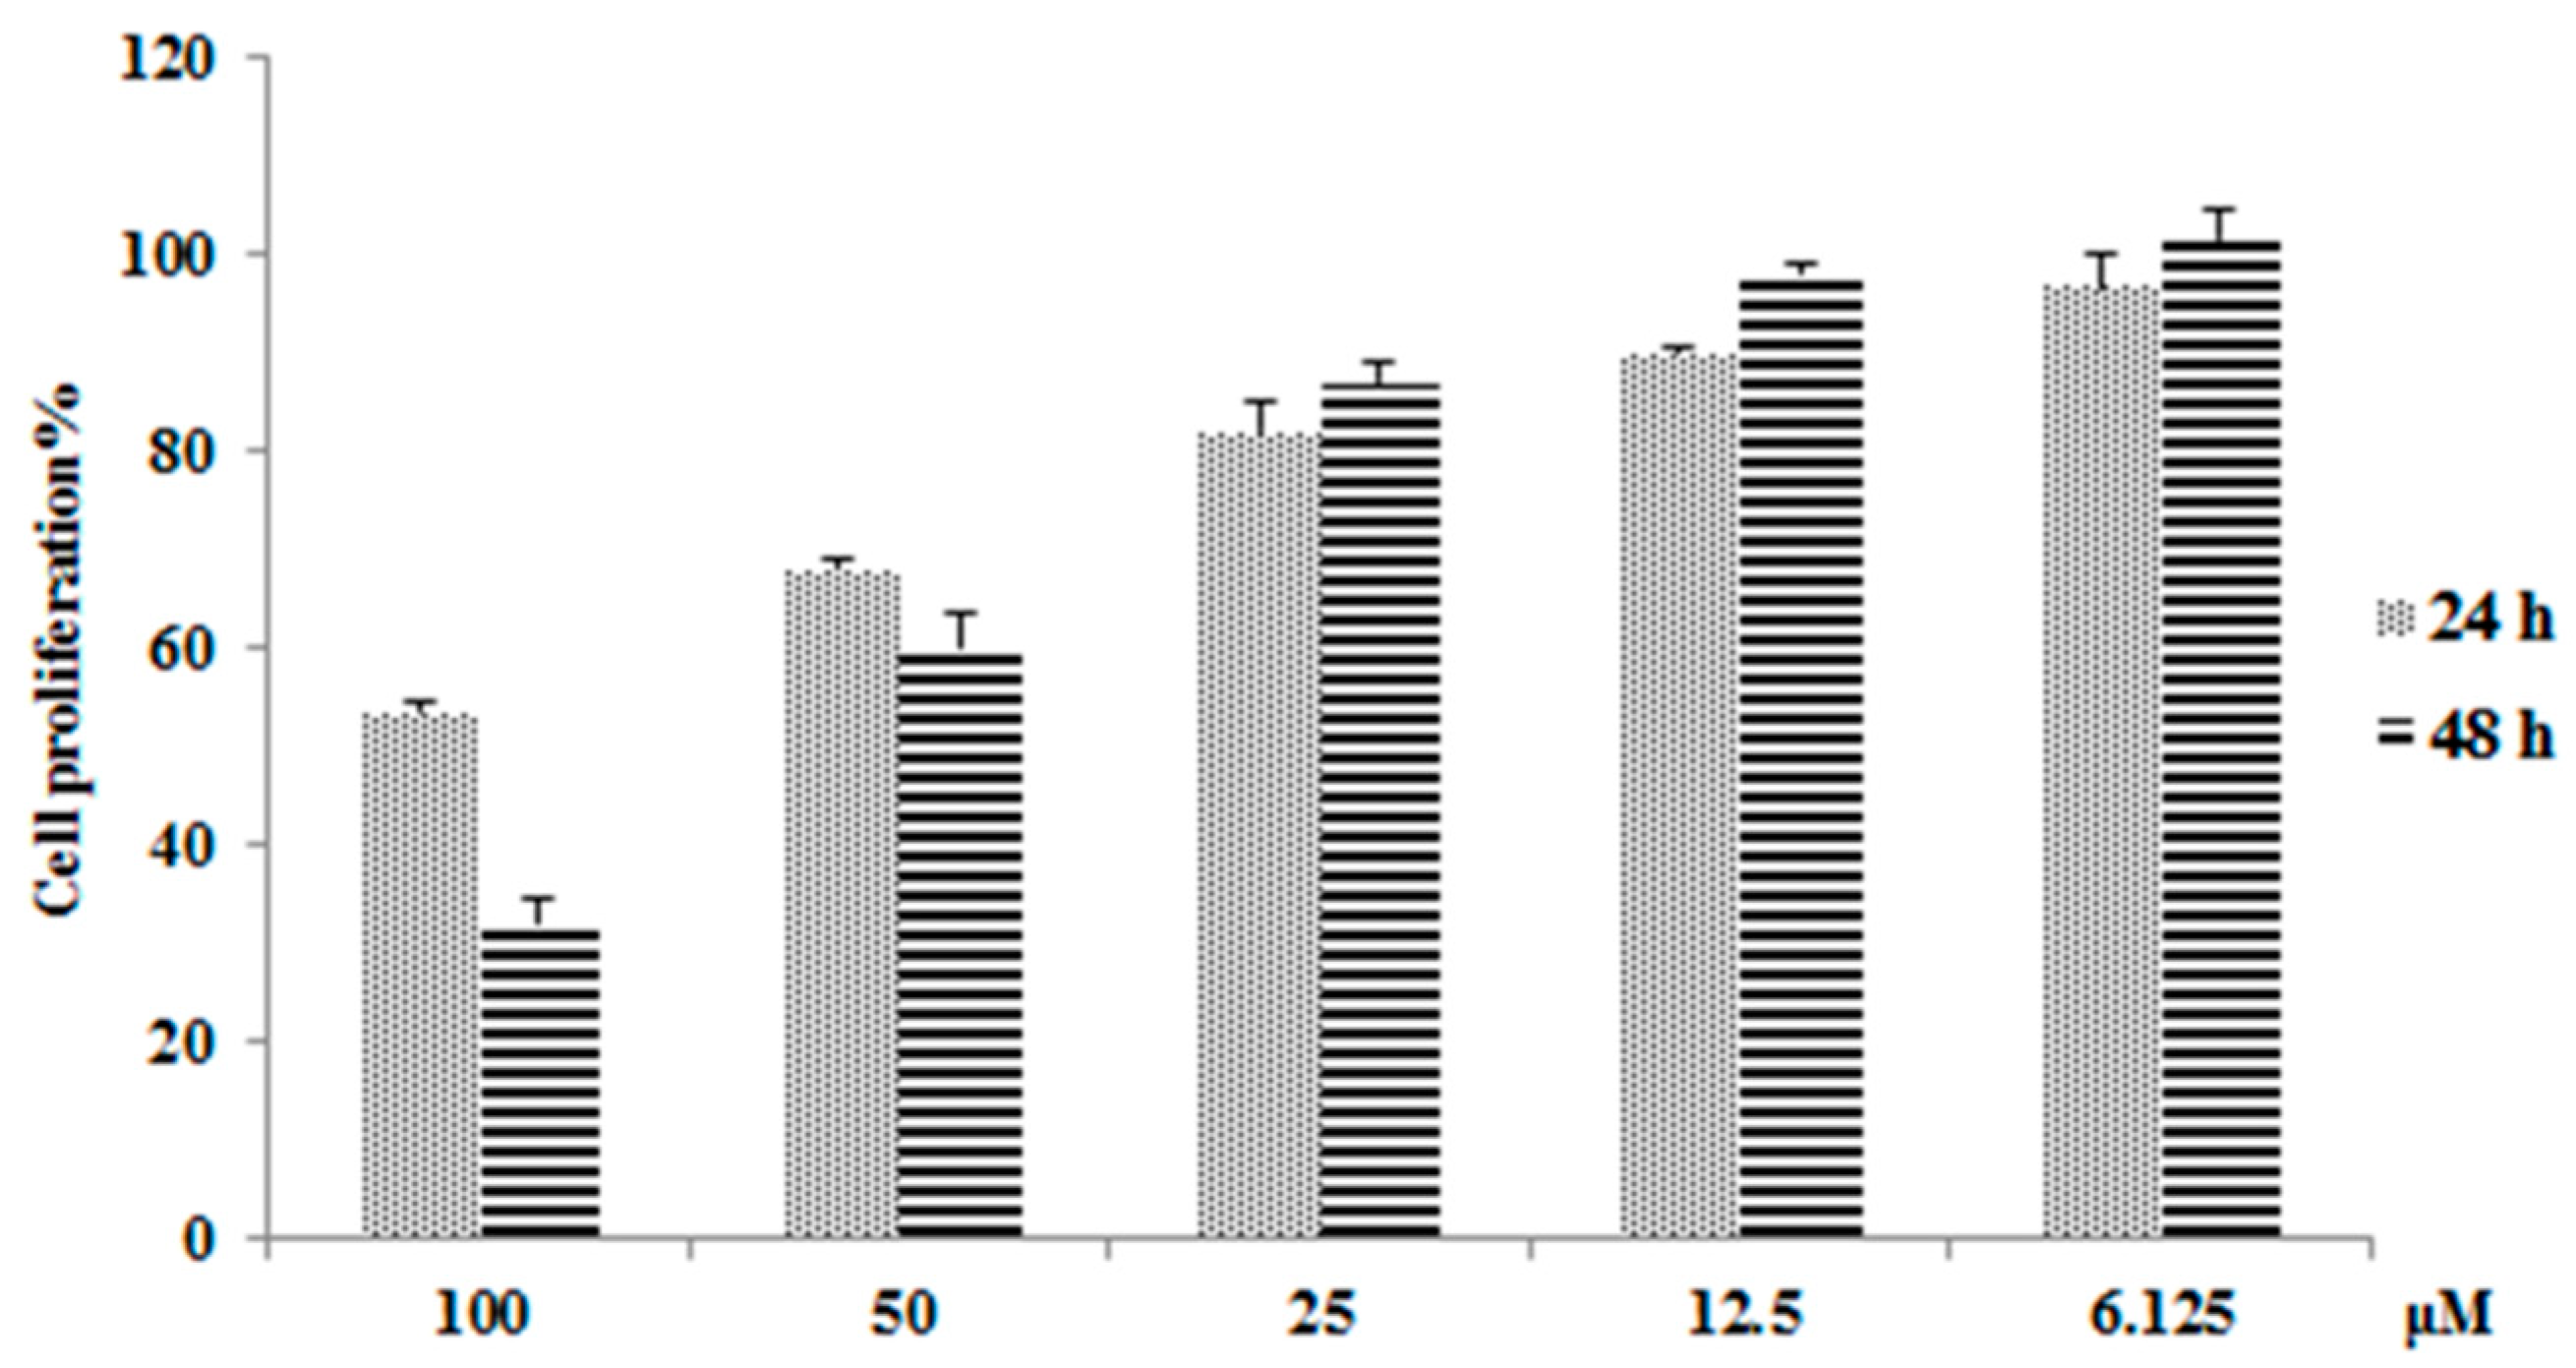
As shown in Figure 1, emodin has a strong ability to inhibit hepatocyte proliferation, inhibiting 46.7% of L02 cell growth (after 24 h) and 67.9% of L02 cell growth (after 48 h) at a concentration of 100 μM. This result is consistent with previous studies that showed that emodin has strong hepatotoxicity [16]. To further study the mechanism of action of emodin-induced hepatotoxicity, we planned to use proteomic analysis tools. To ensure the accuracy and consistency of our proteomics research, dose selection mainly refers to the concentration of emodin in plasma and liver after oral administration of Polygonum cuspidatum or other herbs which contain emodin. Studies have shown that a concentration of emodin up to 50 µM indicates a mitochondrial respiratory equivalent of 20 μM in plasma and 12 μg/g (approximately 27.8 μM, when considering the volume of 1 g liver tissue ≈ 1 mL) in liver after oral administration of Polygonum cuspidatum or rhubarb in rats, equal to the effective dose in humans [19,20]. Studies also shown that the plasma concentrations of emodin in diseased groups are higher than normal after administration [21]. Thus, the dose of emodin was kept to 50 μM in all samples, and the dosage time was 48 h. In addition, under these conditions, the hepatotoxic effect can be fully expressed while ensuring a sufficient number of viable cells required for downstream proteomic analyses.
3.2. Protein Identification and Screening of Differentially Expressed Proteins
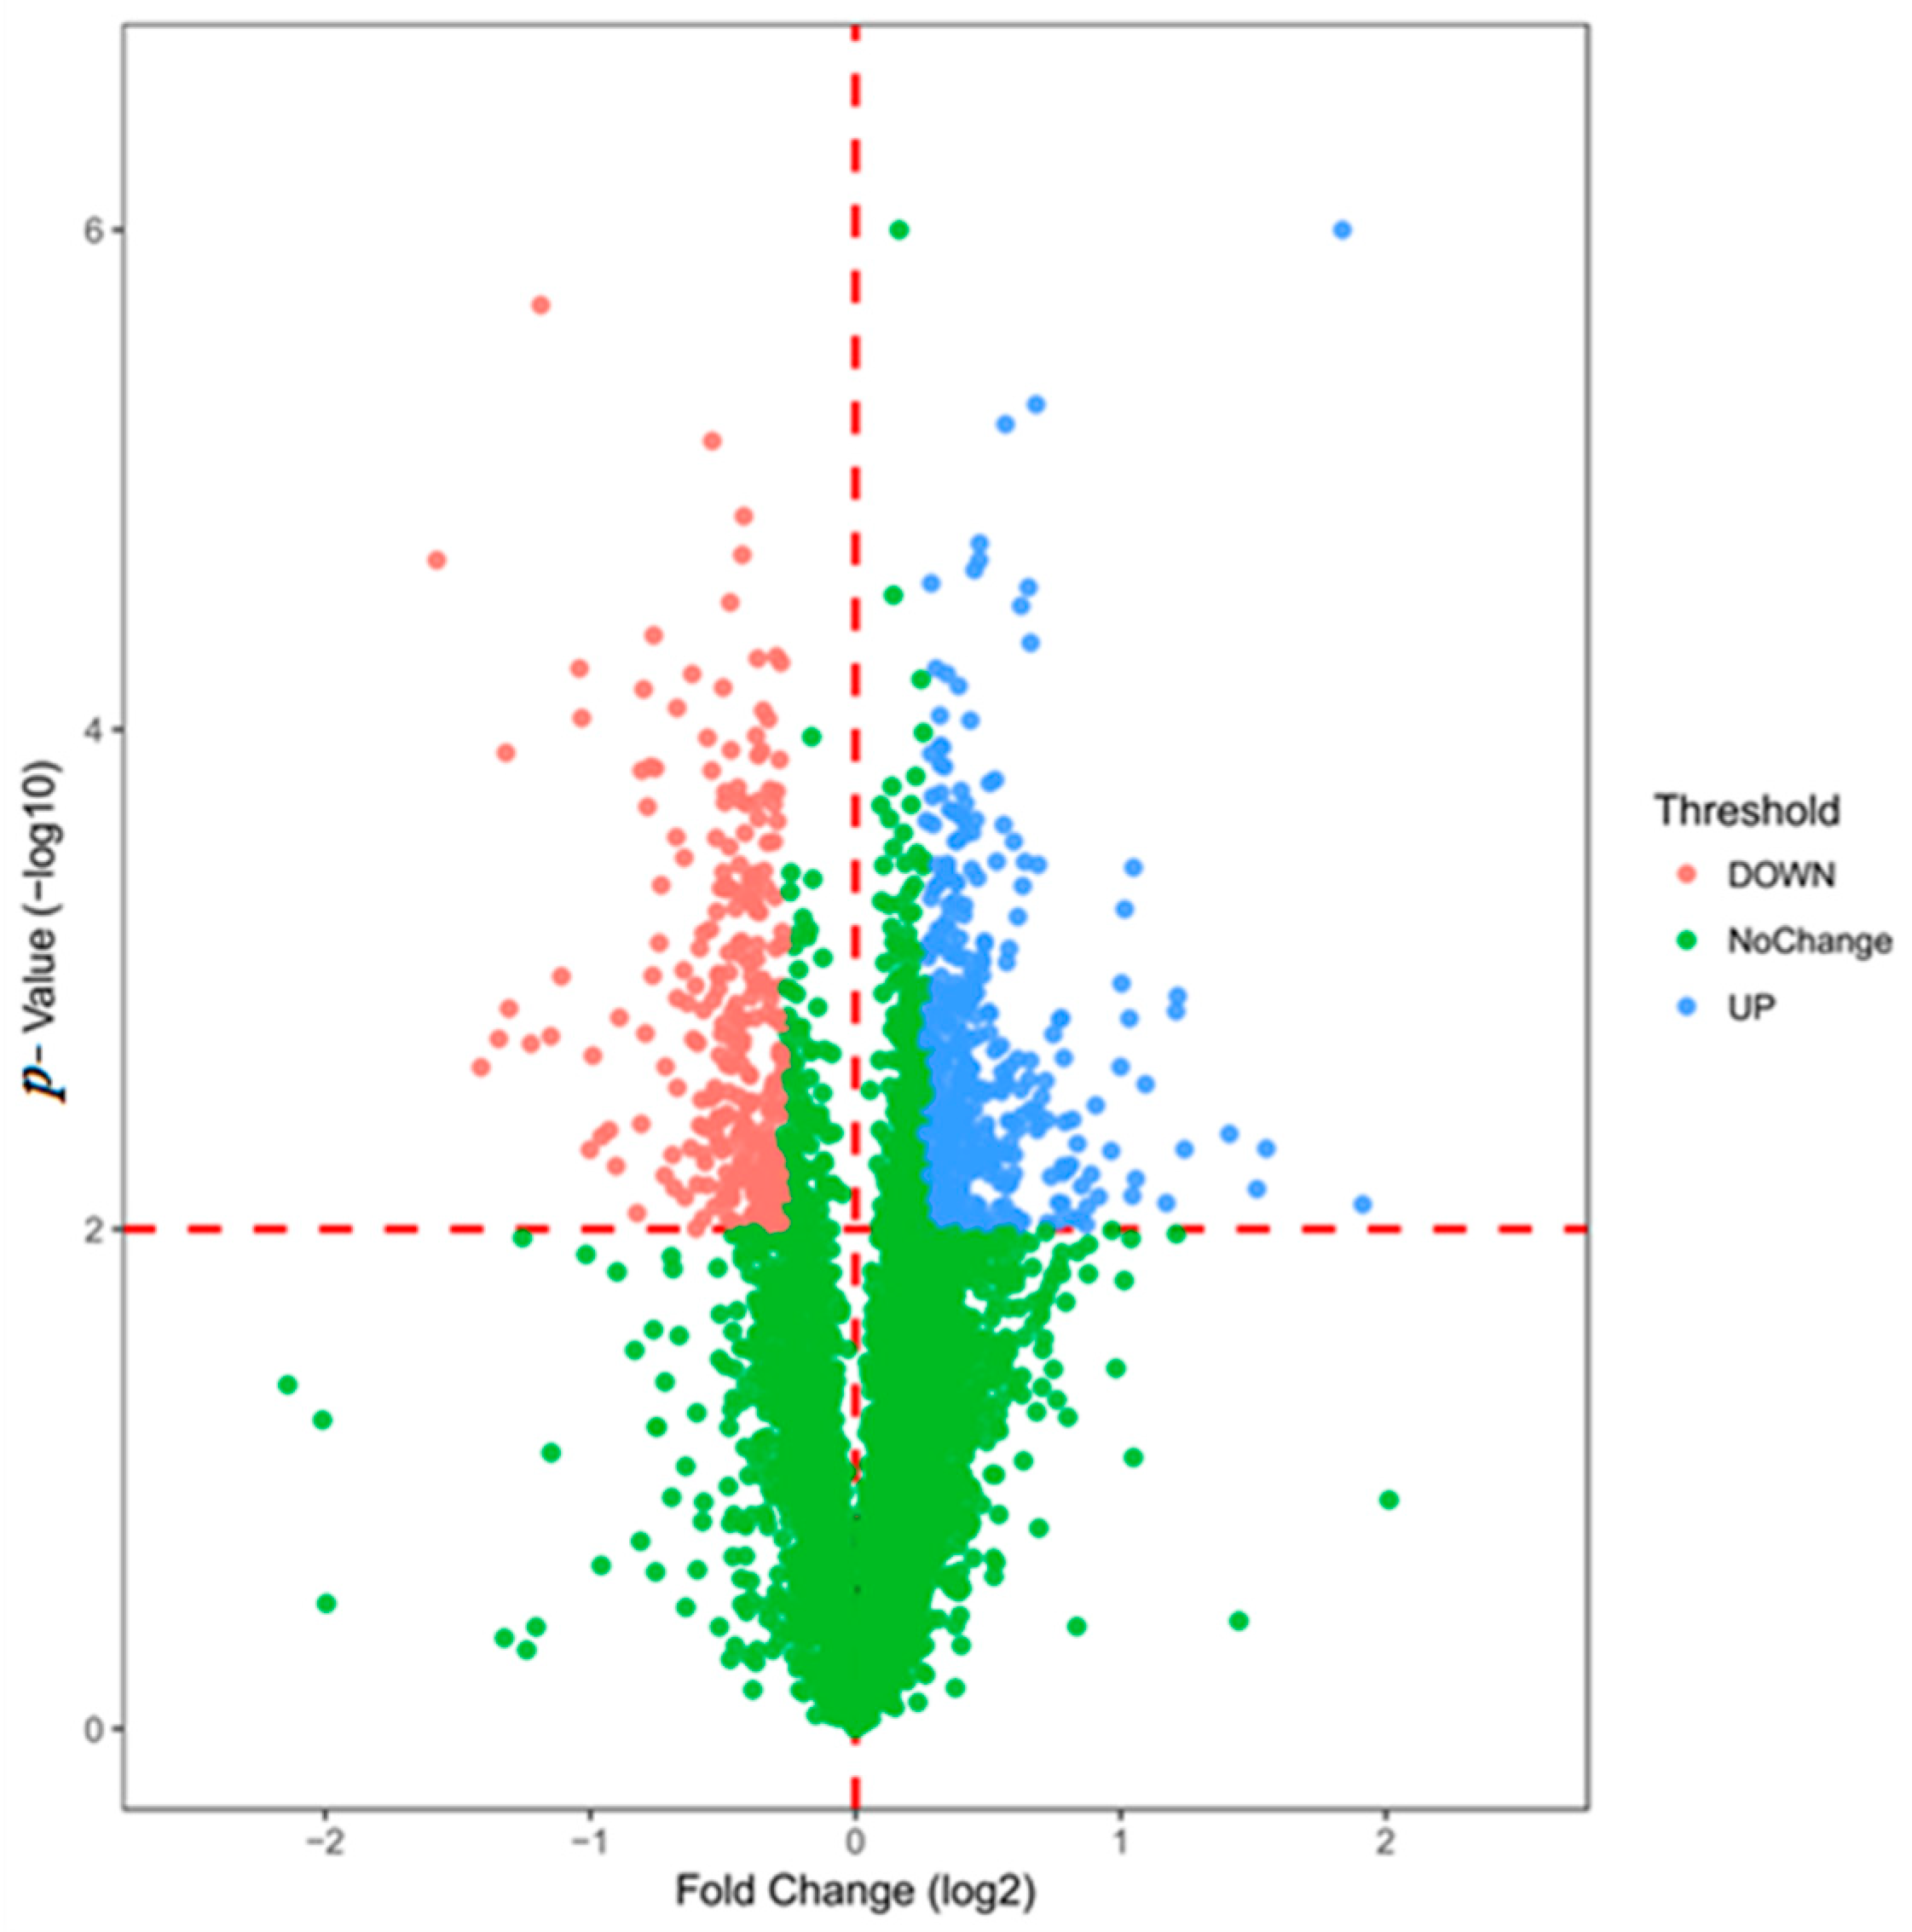
After data processing, a total of 5758 proteins were identified. The identification criteria for differentially expressed proteins are as follows: p-value <0.01 and fold change >1.2 times were considered to be significant differences. The differential protein volcano map is shown in Figure 2. After screening, there were 662 differentially expressed proteins, of which 401 were up-regulated and 261 were down-regulated (Detailed in supplementary data). The expression pattern clustering analysis between multiple samples was used to observe the up-regulation and down-regulation of different proteins when compared between different samples. Figure 3 shows the method used for hierarchical clustering of total protein and differentially expressed proteins. The standard used to calculate the clustering distance index D was Euclidean distance. The distance between each group was calculated by the full connection method. Each row in the cluster heat map represents one protein. Each column represents a sample group. In these, the different colors represent the degree of differential expression, where green to black to red indicates increasing levels of differential expression. The length of the Euclidean distance between samples reflects their degree of similarity. A closer distance indicates that the data from the two groups are more similar, and a longer distance indicates that the data are less similar. Visually, the total protein and the differentially expressed proteins from the drug administration group and the control group show good clustering effects. The annotation on the right represents the significance of the difference in protein expression, which was generated by log2 conversion by the fold multiple. Red indicates an increase and blue indicates a decrease.
3.3. Gene Ontology (GO) and Pathway Enrichment Analysis
Differentially expressed proteins were analyzed using the Database for Annotation, Visualization and Integrated Discovery (DAVID) database and the results are shown in Figure 4. The biological processes (BPs) subcategory involved the cellular process, macromolecular complex subunit organization, and the cellular macromolecule metabolic process, etc. Molecular function (MF) represented the elemental activities of a gene product at the molecular level, such as binding or catalysis. For the analysis of MF, we found that most of the differentially expressed proteins were enriched in protein binding, small molecule binding, nucleoside phosphate binding, organic cyclic compound binding, and so on. For the analysis of the cellular component (CC), we found that most of the differentially expressed proteins were associated with the intracellular part, membrane-bounded organelle, organelle, cytoplasm, etc. Since mitochondrial function is closely related to apoptosis, mitochondria-related functions were further screened and the results are shown in Table 1. Clearly, emodin can cause a variety of mitochondrial dysfunctions, especially as these relate to mitochondrial respiratory chain functions, including the assembly and biosynthesis of mitochondrial respiratory chain complex I.
In order to explore the signaling pathways through which emodin promotes the development of liver injury, the differentially expressed proteins were analyzed using the DAVID and Kyoto Encyclopedia of Genes and Genomes (KEGG) databases, and the pathways associated with emodin are shown in Figure 5. These mainly include oxidative phosphorylation, non-alcoholic fatty liver disease (NAFLD), Alzheimer’s disease, Parkinson’s disease, Huntington’s disease, etc. Interestingly, all of the identified pathways are signaling pathways that are closely related to the mitochondrial respiratory chain and the respiratory chain complex. The above results indicate that hepatocyte apoptosis induced by emodin may be related to mitochondrial respiratory chain dysfunction.
3.4. Western Blot Analysis
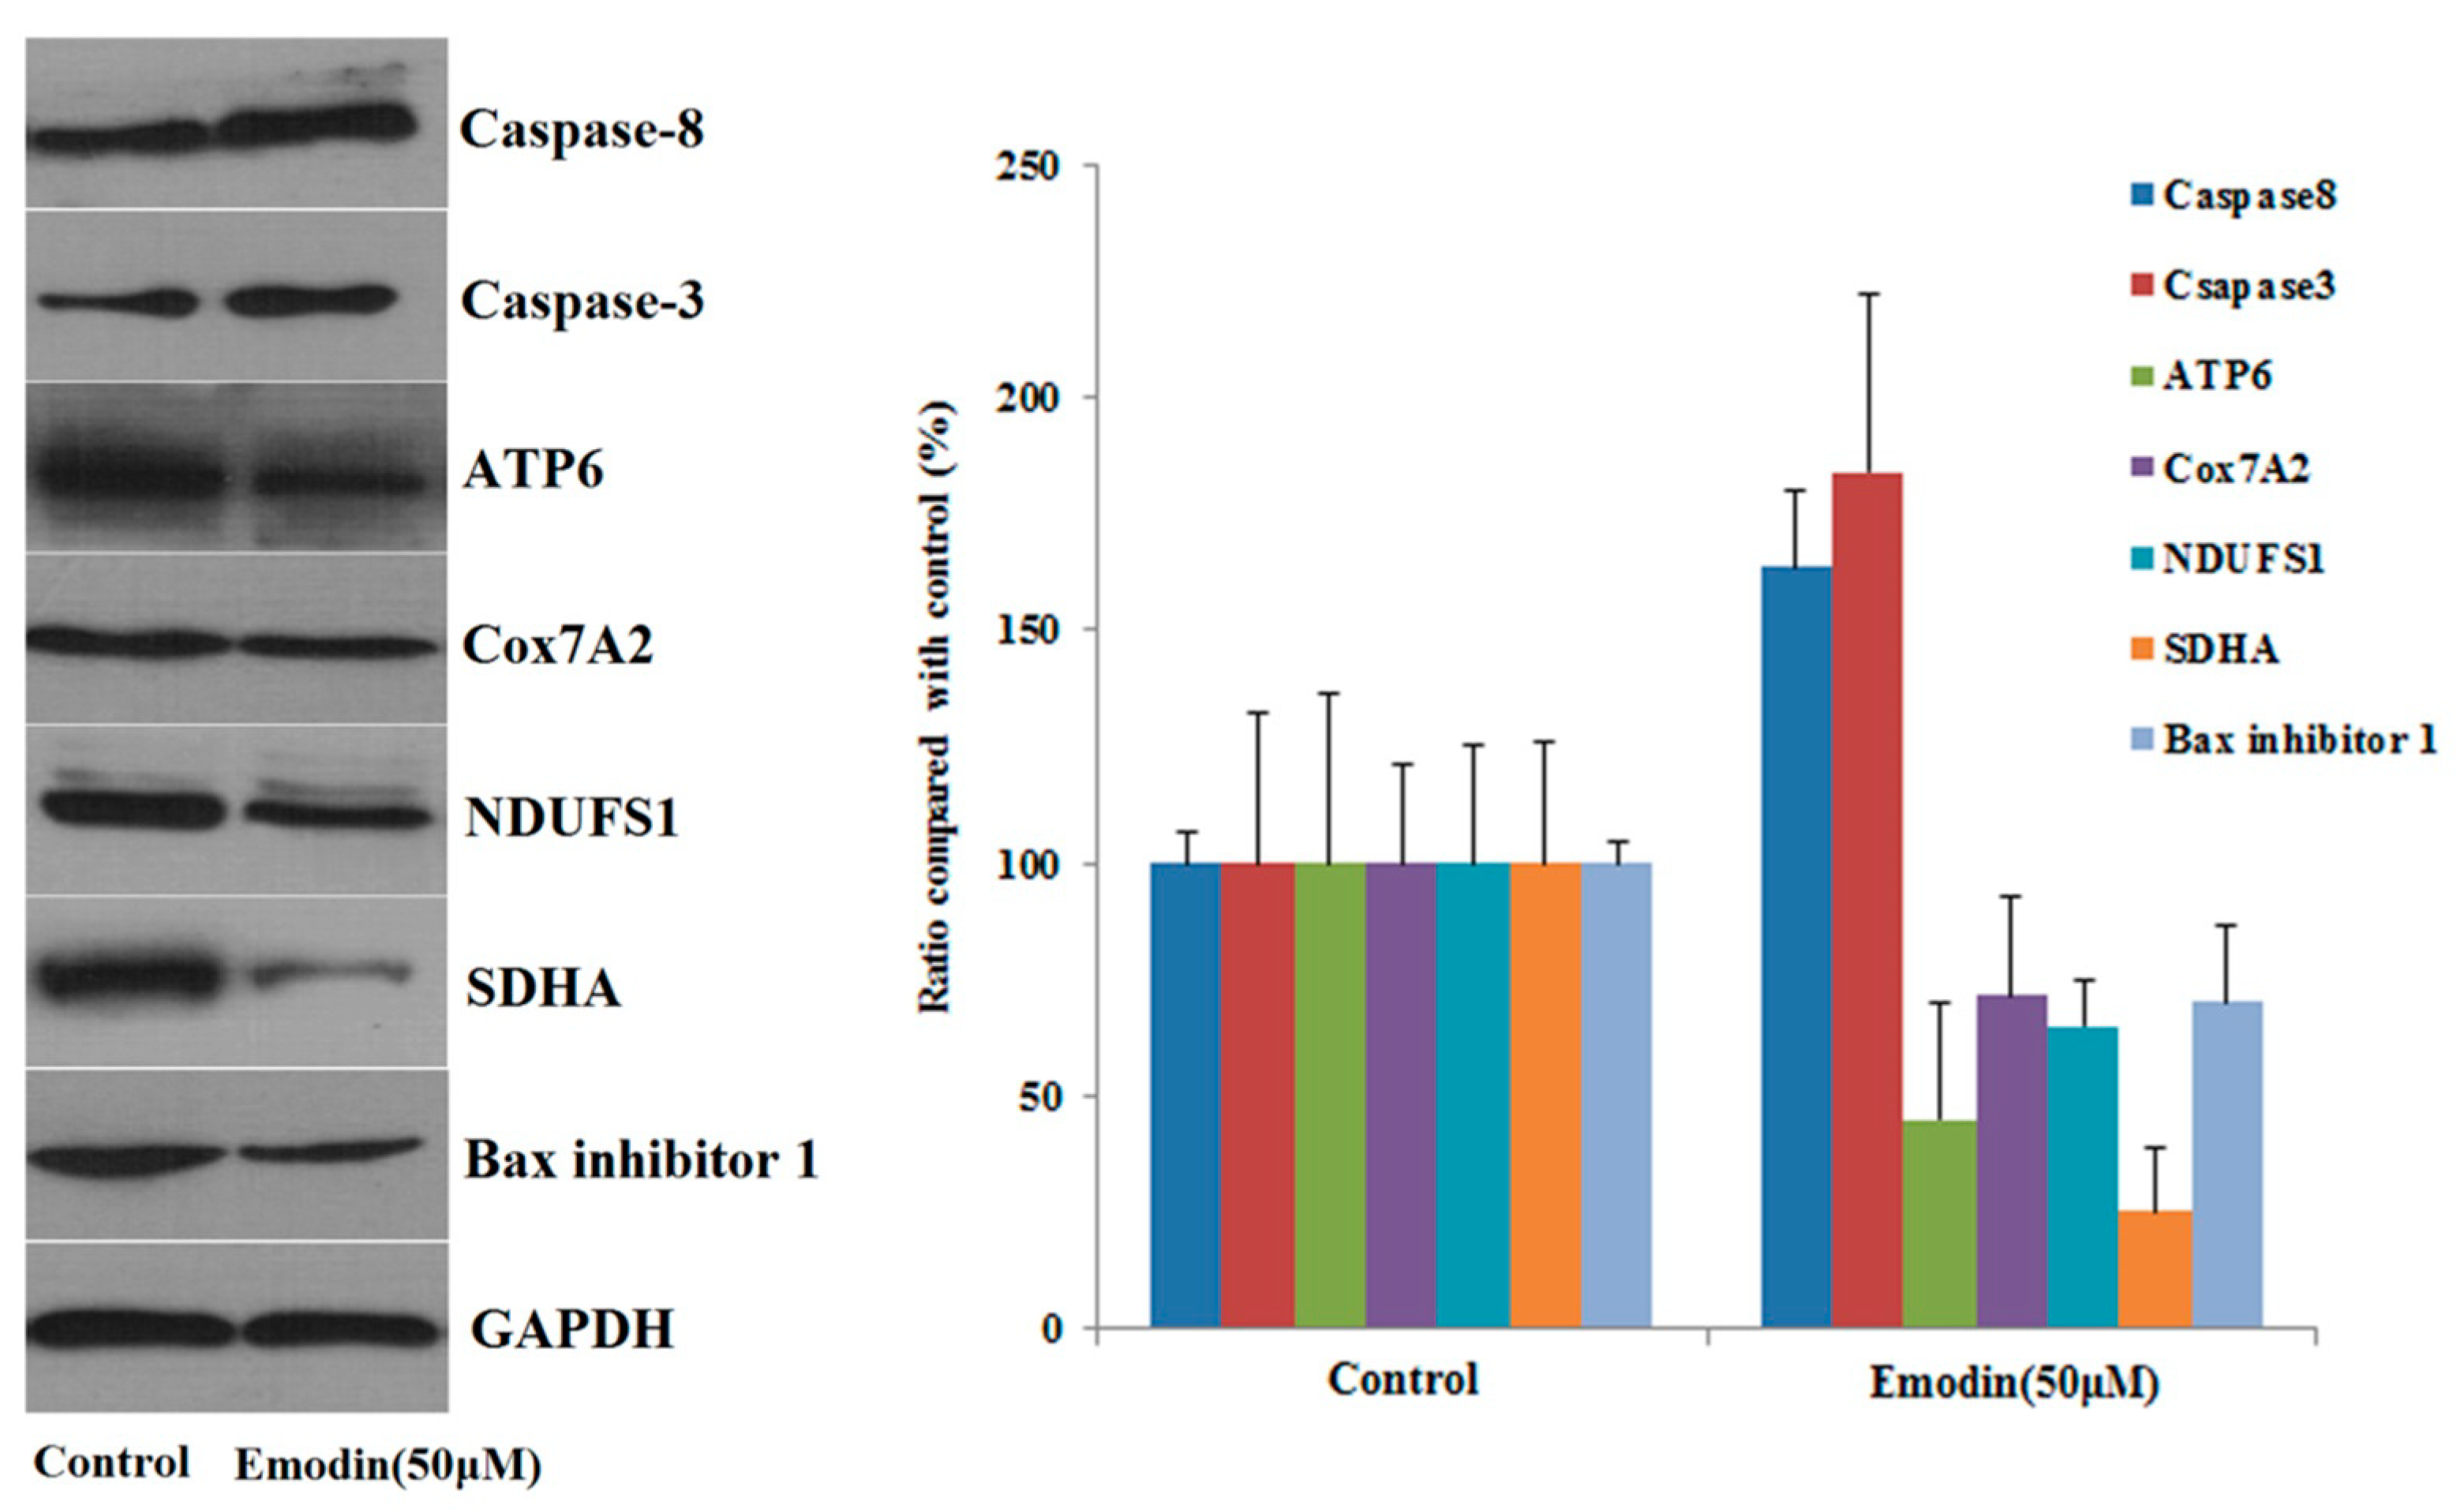
Western blotting was used to verify the accuracy of quantitative proteomic results and to further investigate the mechanism of emodin-induced apoptosis. The results of Western blot analysis of seven proteins show that the expression of caspase-8 increased after L-02 cells were treated with emodin, while the expression of Ndufs1, Cox7A2, ATP6, succinate dehydrogenase complex flavoprotein subunit A (SDHA), and Bax inhibitor 1 decreased. These findings are consistent with our proteomic analysis results, which indicate the reliability of our proteomics data. In addition, the increased expression of caspase-3 also indicates that the apoptotic pathway is activated with emodin treatment; the Western blot analysis results are shown in Figure 6.
3.5. MMP and Complex Activity Measurement
As shown in Figure 7, emodin has a significant influence on MMP. At concentrations of 25 μM and 50 μM, the MMP basically disappeared regardless of duration of drug treatment (24 h or 48 h). Even lower concentrations of emodin (e.g., 6.125 μM) cause a significant downward trend in MMP. The mitochondrial respiratory chain complex activity assay results are shown in Figure 8. The activity of all five complexes was reduced significantly after treatment with emodin at concentrations of 50 μM; as compared with control group, it was decreased by 30–40%. This result indicates that emodin could inhibit the activity of mitochondrial complexes, leading to oxidative phosphorylation pathway abnormality. This result is corroborated by the results of proteomics, and also indicates that the hepatotoxicity of emodin is indeed related to mitochondrial dysfunction.
4. Discussion
Mitochondria are abundant in mammalian liver cells and they are involved in a series of cellular physiological activities, including the regulation of electrolyte homeostasis in hepatocytes, ion transmembrane transport, oxygen free radical generation, cell signal transduction, and apoptosis [22,23,24]. Eighty percent of the energy required for cell life activities is provided by mitochondria; they are also the main organelles of cells for biological oxidation and energy conversion. Meanwhile, mitochondria are also among the most vulnerable organelles and can be indicators of the extent of cellular damage. A growing number of studies show that mitochondrial damage may be a predisposing factor and pathway for drug-induced liver injury [25]. Existing studies show that emodin or some anthraquinones can inhibit proton transport and induce activation of the mitochondrial apoptotic pathway, leading to liver damage [26,27,28,29].
Through proteomic analyses, we have shown that emodin-associated hepatotoxicity is associated with oxidative phosphorylation pathways, and our Western blots have confirmed the reliability of our proteomics results. Oxidative phosphorylation refers to the process by which electrons are transferred from NADH or FADH2 to molecular oxygen, producing water via an electron transport chain; this is coupled to the process that combines ADP with Pi to form ATP and is the main pathway for the synthesis of ATP. Inhibition of mitochondrial respiratory chain complex activity will lead to severe mitochondrial dysfunction. The results of complex activity measurement indicated that emodin affects expression of respiratory chain subunits and thus results in lower capacities. Furthermore, the results of MMP assays also show that the MMP of L02 cells is significantly decreased after emodin administration. Therefore, it is possible to speculate that energy deficiency and defective MMP could cause apoptosis [30,31,32].
Through KEGG pathway analysis, we can see that emodin mainly induces abnormalities in the oxidative phosphorylation pathway by affecting the activity of the respiratory chain complex. As shown in Table 2, emodin induces abnormalities in 20 subunits from four distinct complexes, of which 19 were shown to be abnormalities that are inhibitory to the function of the subunits. The most important of these is the inhibition of the activity of mitochondrial complex I, in which emodin inhibits the activity of 12 subunits in total. Mitochondrial complex I is the largest multi-subunit complex in the respiratory chain, and mutations that can lead to pathogenesis occur most frequently in this complex. Mitochondria are an important source of ROS, and complex I produces ROS through reverse electron transport. Inhibition of mitochondrial complexes leads to destruction of the electron transport chain and leads to a decrease in the production of intracellular ubiquinone, which in turn leads to an increase in ROS [33].
ROS can also cause the mitochondrial permeability transition pore (MPTP) to open by oxidizing two redox-sensitive sites on the MPTP, causing changes in mitochondrial membrane permeability [34]. In addition, the MMP established by the substrates of complex I and II is destroyed, which also leads to a decrease in transmembrane potential and promotes the opening of MPTP. The MPTP opening leads to the release of cytochrome C (Cyt C) into the matrix and Cyt C activates the apoptotic factor aspartate-specific caspase [35], which in turn causes cytotoxicity and leads to apoptosis. In addition, the release of Cyt C causes the electron transport chain to be blocked at Cyt C oxidase, leading to electron leaks and producing more ROS. Furthermore, the decrease or disappearance of MMP induces uncoupling in oxidative phosphorylation, thereby inhibiting the phosphorylation of ADP for the production of ATP, thus affecting mitochondrial energy metabolism [36,37,38].
Cytochrome oxidase (COX) is a key enzyme in the mitochondrial respiratory chain and the oxidative phosphorylation process and is also a major component of complex IV, which affects ATP synthesis and ROS production. COX has 13 subunits and mitochondrial DNA (mtDNA) encodes the largest of these, subunits I, II, and III. When mitochondria are damaged by oxidation, mtDNA undergoes structural changes such as fragment deletion, and this change in mtDNA is counterproductive to the production of COX [39,40], leading to errors in the assembly of COX I, II, III, and ATPase subunits of the respiratory chain. These errors in turn lead to a decrease in ATP and cause cell damage [40]. In addition, COX7A is a protein subunit that functions in complex IV. The abnormal expression of this protein subunit directly impedes the formation of respiratory complexes, causing functional defects of mitochondria and even cancer [41]. Besides, the result of proteomics and Western blot showed that the protein levels of SDHA in the administered group were significantly lower compared to those of the control group. SDHA encodes a major catalytic subunit of succinate-ubiquinone oxidoreductase, and it contains the flavin adenine dinucleotide (FAD) binding site where succinate is deprotonated and converted to fumarate. Abnormal SDHA expression was associated with mitochondrial respiratory chain deficiency. Studies have shown that decreased steady-state levels of SDHA will lead to impairment of complex II assembly and further cause mitochondrial respiratory chain disease [42,43].
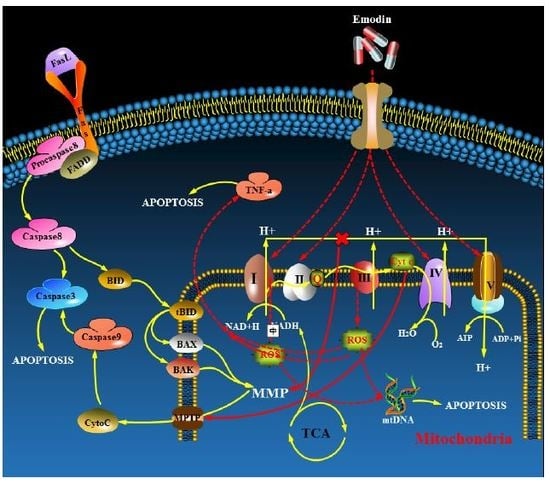
In conclusion, emodin-induced hepatocyte apoptosis mainly plays a role in the inhibition of the mitochondrial respiratory chain complex, then leading to mitochondrial dysfunction and energy deficiency. The mechanism of action is shown in Figure 9.
5. Conclusions
Emodin is a main component of rhubarb, P. multiflorum, and P. cuspidatum, and several studies have confirmed that it is related to the liver damage caused by these traditional Chinese medicinal herbs. In this study, quantitative proteomics were used to study the mechanism of action of L02 cell apoptosis caused by emodin in vitro. A total of 662 differentially expressed proteins were found. Through GO functional annotation, functional enrichment analysis, localization analysis, and pathway enrichment analysis, our results show that the oxidative phosphorylation pathway contributes highly to the mechanism of action of emodin, and abnormalities in the oxidative phosphorylation signaling pathway are representative of mitochondrial dysfunction and mitochondrial injury. The results of our study are consistent with those of other studies on the mechanism of liver injury caused by P. multiflorum. Further mitochondrial respiratory chain complex activity analysis revealed that emodin mainly inhibits the function of all mitochondrial respiratory chain complexes, leading to abnormalities in the oxidative phosphorylation pathway, a further reduction of MMP, and increasing ROS, leading to ATP synthesis disorders and eventually resulting in mitochondrial damage and apoptosis.
Supplementary Materials
The supplementary materials are available online at https://www.mdpi.com/2073-4409/8/3/263/s1.
Author Contributions
L.L. designed research and conceived the main experiments; Y.L. conducted the increased experiments; S.F. analyzed the proteomics data; C.Q. wrote the manuscript and prepared figures; H.L. revised the manuscript and performed revised manuscript review; J.N. conceived the study and performed manuscript review.
Funding
This work was financially supported by the China Academy of Chinese Medical Sciences (Project No. ZZ11-092) and the Young Elite Scientists Sponsorship Program by CACM (2018QNRC2-C01), and was also supported by the Beijing Municipal Natural Science Foundation (No. 7194300).
Conflicts of Interest
The authors declare no conflicts of interest.
Abbreviations
| BP | Biological processes |
| BSA | Bovine serum albumin |
| CC | Cellular component |
| CCCP | Carbonyl cyanide m-chlorophenyl hydrazine |
| CCK-8 | Cell Counting Kit-8 |
| CHAPS | 3-((3-cholamidopropyl) dimethylammonio)-1-propanesulfonate) |
| COX | Cytochrome oxidase |
| Cyt C | Cytochrome C |
| DAVID | Database for Annotation, Visualization and Integrated Discovery |
| DMEM | Dulbecco’s Modified Eagle Medium |
| FAD | Flavin adenine dinucleotide |
| GO | Gene ontology |
| JC-1 | Tetraethylbenzimidazolylcarbocyanine iodide |
| KEGG | Kyoto Encyclopedia of Genes and Genomes |
| MF | Molecular function |
| MMP | Mitochondrial membrane potential |
| MPTP | Mitochondrial permeability transition pore |
| mtDNA | Mitochondrial DNA |
| NADH | Nicotinamide adenine dinucleotide |
| NAFLD | Non-alcoholic fatty liver disease |
| NTP | National Toxicology Program |
| PVDF | Polyvinylidene fluoride |
| Q | Coenzyme Q |
| ROS | Reactive oxygen species |
| SDHA | Succinate dehydrogenase complex flavoprotein subunit A |
| TMT | Tandem Mass Tag |
| TNF-α | Tumor necrosis factor-α |
References
- Zhang, Y.X.; Li, J.S.; Peng, W.W.; Liu, X.; Yang, G.M.; Chen, L.H.; Cai, B.C. Comparative pharmacokinetics of aloe-emodin, rhein and emodin determined by liquid chromatography-mass spectrometry after oral administration of a rhubarb peony decoction and rhubarb extract to rats. Pharmazie 2013, 68, 333–339. [Google Scholar] [PubMed]
- Jin, J.H.; Ngoc, T.M.; Bae, K.; Kim, Y.S.; Kim, H.P. Inhibition of experimental atopic dermatitis by rhubarb (rhizomes of Rheum tanguticum) and 5-lipoxygenase inhibition of its major constituent, emodin. Phytother. Res. 2011, 25, 755–759. [Google Scholar] [CrossRef]
- Cai, J.; Razzak, A.; Hering, J.; Saed, A.; Babcock, T.A.; Helton, S.; Espat, N.J. Feasibility evaluation of emodin (rhubarb extract) as an inhibitor of pancreatic cancer cell proliferation in vitro. J. Parenter. Enter. Nutr. 2008, 32, 190–196. [Google Scholar] [CrossRef] [PubMed]
- Ahn, S.M.; Kim, H.N.; Kim, Y.R.; Choi, Y.W.; Kim, C.M.; Shin, H.K.; Choi, B.T. Emodin from Polygonum multiflorum ameliorates oxidative toxicity in HT22 cells and deficits in photothrombotic ischemia. J. Ethnopharmacol. 2016, 188, 13–20. [Google Scholar] [CrossRef] [PubMed]
- Lee, B.H.; Huang, Y.Y.; Duh, P.D.; Wu, S.C. Hepatoprotection of emodin and Polygonum multiflorum against CCl(4)-induced liver injury. Pharm. Biol. 2012, 50, 351–359. [Google Scholar] [CrossRef] [PubMed]
- Lin, L.; Ni, B.; Lin, H.; Zhang, M.; Li, X.; Yin, X.; Qu, C.; Ni, J. Traditional usages, botany, phytochemistry, pharmacology and toxicology of Polygonum multiflorum Thunb.: A review. J. Ethnopharmacol. 2015, 159, 158–183. [Google Scholar] [CrossRef] [PubMed]
- Chen, A.Z.; Sun, L.; Yuan, H.; Wu, A.Y.; Lu, J.G.; Ma, S.C. Simultaneous qualitative and quantitative analysis of 11 active compounds in rhubarb using two reference substances by UHPLC. J. Sep. Sci. 2018, 41. [Google Scholar] [CrossRef] [PubMed]
- Lin, L.F.; Ni, B.R.; Lin, H.M.; Zhang, M.; Yan, L.; Qu, C.H.; Ni, J. Simultaneous determination of 14 constituents of Radix polygoni multiflori from different geographical areas by liquid chromatography-tandem mass spectrometry. Biomed. Chromatogr. 2015, 29, 1048–1055. [Google Scholar] [CrossRef] [PubMed]
- Chu, Q.C.; Peng, Y.Y.; Ye, J.N. Determination of active ingredients of Polygonum cuspidatum Sied. et Zucc. by capillary electrophoresis with electrochemical detection. Electroanal 2004, 16, 1434–1438. [Google Scholar]
- He, D.; Chen, B.; Tian, Q.; Yao, S. Simultaneous determination of five anthraquinones in medicinal plants and pharmaceutical preparations by HPLC with fluorescence detection. J. Pharm. Biomed. Anal. 2009, 49, 1123–1127. [Google Scholar] [CrossRef]
- Dong, H.; Slain, D.; Cheng, J.; Ma, W.; Liang, W. Eighteen cases of liver injury following ingestion of Polygonum multiflorum. Complement. Ther. Med. 2014, 22, 70–74. [Google Scholar] [CrossRef]
- Li, Y.X.; Gong, X.H.; Liu, M.C.; Peng, C.; Li, P.; Wang, Y.T. Investigation of Liver Injury of Polygonum multiflorum Thunb. in Rats by Metabolomics and Traditional Approaches. Front. Pharm. 2017, 8, 791. [Google Scholar]
- Lin, L.; Li, H.; Lin, H.; Zhang, M.; Qu, C.; Yan, L.; Yin, X.; Ni, J. A New Perspective on Liver Injury by Traditional Chinese Herbs Such as Polygonum multiflorum: The Geographical Area of Harvest as an Important Contributory Factor. Front. Pharm. 2017, 8, 349. [Google Scholar] [CrossRef]
- Li, C.Y.; He, Q.; Gao, D.; Li, R.Y.; Zhu, Y.; Li, H.F.; Feng, W.W.; Yang, M.H.; Xiao, X.H.; Wang, J.B. Idiosyncratic drug-induced liver injury linked to Polygonum multiflorum: A case study by pharmacognosy. Chin. J. Integr. Med. 2017, 23, 625–630. [Google Scholar] [CrossRef] [PubMed]
- Wang, J.B.; Kong, W.J.; Wang, H.J.; Zhao, H.P.; Xiao, H.Y.; Dai, C.M.; Xiao, X.H.; Zhao, Y.L.; Jin, C.; Zhang, L.; et al. Toxic effects caused by rhubarb (Rheum palmatum L.) are reversed on immature and aged rats. J. Ethnopharmacol. 2011, 134, 216–220. [Google Scholar]
- Lin, L.; Lin, H.; Zhang, M.; Ni, B.; Yin, X.; Qu, C.; Ni, J. A novel method to analyze hepatotoxic components in Polygonum multiflorum using ultra-performance liquid chromatography-quadrupole time-of-flight mass spectrometry. J. Hazard. Mater. 2015, 299, 249–259. [Google Scholar] [CrossRef]
- Tu, C.; Gao, D.; Li, X.F.; Li, C.Y.; Li, R.S.; Zhao, Y.L.; Li, N.; Jia, G.L.; Pang, J.Y.; Cui, H.R.; et al. Inflammatory stress potentiates emodin-induced liver injury in rats. Front. Pharm. 2015, 6, 233. [Google Scholar] [CrossRef] [PubMed]
- National Toxicology, P. NTP Toxicology and Carcinogenesis Studies of EMODIN (CAS NO. 518-82-1) Feed Studies in F344/N Rats and B6C3F1 Mice. Natl. Toxicol. Program. Tech. Rep. Ser. 2001, 493, 1–278. [Google Scholar]
- Lin, S.P.; Chu, P.M.; Tsai, S.Y.; Wu, M.H.; Hou, Y.C. Pharmacokinetics and tissue distribution of resveratrol, emodin and their metabolites after intake of Polygonum cuspidatum in rats. J. Ethnopharmacol. 2012, 144, 671–676. [Google Scholar] [CrossRef] [PubMed]
- Peng, J.; Song, Z.F.; Ma, C. Emodin Studies on Pharmacokinetics and Distribution in Rat Liver after Polygonum cuspidatum Sieb. et Zucc. Extract Administration. World Sci. Technol. 2008, 10, 64–67. [Google Scholar] [CrossRef]
- Gong, X.H.; Li, Y.; Zhang, R.Q.; Xie, X.F.; Peng, C.; Li, Y.X. The synergism mechanism of Rhubarb Anthraquinones on constipation elucidated by comparative pharmacokinetics of Rhubarb extract between normal and diseased rats. Eur. J. Drug Metab. Pharmacokinet. 2015, 40, 379–388. [Google Scholar] [CrossRef]
- Sharma, V.; Anderson, D.; Dhawan, A. Zinc oxide nanoparticles induce oxidative DNA damage and ROS-triggered mitochondria mediated apoptosis in human liver cells (HepG2). Apoptosis 2012, 17, 852–870. [Google Scholar] [CrossRef] [PubMed]
- Lee, J.; Giordano, S.; Zhang, J. Autophagy, mitochondria and oxidative stress: Cross-talk and redox signalling. Biochem. J. 2012, 441, 523–540. [Google Scholar] [CrossRef] [PubMed]
- Dudkina, N.V.; Folea, I.M.; Boekema, E.J. Towards structural and functional characterization of photosynthetic and mitochondrial supercomplexes. Micron 2015, 72, 39–51. [Google Scholar] [CrossRef]
- Fishbein, W.N.; Stowell, R.E. Studies on the mechanism of freezing damage to mouse liver using a mitochondrial enzyme assay. I. Temporal localization of the injury phase during slow freezing. Cryobiology 1968, 4, 283–289. [Google Scholar] [CrossRef]
- Dong, X.; Fu, J.; Yin, X.; Yang, C.; Ni, J. Aloe-emodin Induces Apoptosis in Human Liver HL-7702 Cells through Fas Death Pathway and the Mitochondrial Pathway by Generating Reactive Oxygen Species. Phytother. Res. 2017, 31, 927–936. [Google Scholar] [CrossRef] [PubMed]
- Wang, X.D.; Gu, L.Q.; Wu, J.Y. Apoptosis-inducing activity of new pyrazole emodin derivatives in human hepatocellular carcinoma HepG2 cells. Biol. Pharm. Bull. 2007, 30, 1113–1116. [Google Scholar] [CrossRef] [PubMed]
- Yi, J.; Yang, J.; He, R.; Gao, F.; Sang, H.; Tang, X.; Ye, R.D. Emodin enhances arsenic trioxide-induced apoptosis via generation of reactive oxygen species and inhibition of survival signaling. Cancer Res. 2004, 64, 108–116. [Google Scholar] [CrossRef] [PubMed]
- Zhang, L.; He, D.; Li, K.; Liu, H.; Wang, B.; Zheng, L.; Li, J. Emodin targets mitochondrial cyclophilin D to induce apoptosis in HepG2 cells. Biomed. Pharmacother. Biomed. Pharmacother. 2017, 90, 222–228. [Google Scholar] [CrossRef]
- De Lonlay, P.; Valnot, I.; Barrientos, A.; Gorbatyuk, M.; Tzagoloff, A.; Taanman, J.W.; Benayoun, E.; Chretien, D.; Kadhom, N.; Lombes, A.; et al. A mutant mitochondrial respiratory chain assembly protein causes complex III deficiency in patients with tubulopathy, encephalopathy and liver failure. Nat. Genet. 2001, 29, 57–60. [Google Scholar] [CrossRef]
- Kwong, J.Q.; Henning, M.S.; Starkov, A.A.; Manfredi, G. The mitochondrial respiratory chain is a modulator of apoptosis. J. Cell Biol. 2007, 179, 1163–1177. [Google Scholar] [CrossRef] [Green Version]
- Vendemiale, G.; Grattagliano, I.; Caraceni, P.; Caraccio, G.; Domenicali, M.; Dall’Agata, M.; Trevisani, F.; Guerrieri, F.; Bernardi, M.; Altomare, E. Mitochondrial oxidative injury and energy metabolism alteration in rat fatty liver: Effect of the nutritional status. Hepatology 2001, 33, 808–815. [Google Scholar] [CrossRef] [PubMed] [Green Version]
- Kim, J.S.; He, L.; Lemasters, J.J. Mitochondrial permeability transition: A common pathway to necrosis and apoptosis. Biochem. Biophys. Res. Commun. 2003, 304, 463–470. [Google Scholar] [CrossRef]
- Schriewer, J.M.; Peek, C.B.; Bass, J.; Schumacker, P.T. ROS-mediated PARP activity undermines mitochondrial function after permeability transition pore opening during myocardial ischemia-reperfusion. J. Am. Heart Assoc. 2013, 2, e000159. [Google Scholar] [CrossRef]
- Higuchi, M.; Proske, R.J.; Yeh, E.T. Inhibition of mitochondrial respiratory chain complex I by TNF results in cytochrome c release, membrane permeability transition, and apoptosis. Oncogene 1998, 17, 2515–2524. [Google Scholar] [CrossRef] [PubMed] [Green Version]
- Spierings, D.; McStay, G.; Saleh, M.; Bender, C.; Chipuk, J.; Maurer, U.; Green, D.R. Connected to death: The (unexpurgated) mitochondrial pathway of apoptosis. Science 2005, 310, 66–67. [Google Scholar] [CrossRef]
- Trost, L.C.; Lemasters, J.J. Role of the mitochondrial permeability transition in salicylate toxicity to cultured rat hepatocytes: Implications for the pathogenesis of Reye’s syndrome. Toxicol. Appl. Pharm. 1997, 147, 431–441. [Google Scholar] [CrossRef] [PubMed]
- Serviddio, G.; Bellanti, F.; Giudetti, A.M.; Gnoni, G.V.; Capitanio, N.; Tamborra, R.; Romano, A.D.; Quinto, M.; Blonda, M.; Vendemiale, G.; et al. Mitochondrial oxidative stress and respiratory chain dysfunction account for liver toxicity during amiodarone but not dronedarone administration. Free Radic. Biol. Med. 2011, 51, 2234–2242. [Google Scholar] [CrossRef]
- Van Houten, B.; Woshner, V.; Santos, J.H. Role of mitochondrial DNA in toxic responses to oxidative stress. DNA Repair 2006, 5, 145–152. [Google Scholar] [CrossRef]
- Wallace, D.C. Mitochondrial DNA mutations in disease and aging. Environ. Mol. Mutagenesis 2010, 51, 440–450. [Google Scholar] [CrossRef]
- Kashimshetty, R.; Desai, V.G.; Kale, V.M.; Lee, T.; Moland, C.L.; Branham, W.S.; New, L.S.; Chan, E.C.; Younis, H.; Boelsterli, U.A. Underlying mitochondrial dysfunction triggers flutamide-induced oxidative liver injury in a mouse model of idiosyncratic drug toxicity. Toxicol. Appl. Pharm. 2009, 238, 150–159. [Google Scholar] [CrossRef] [PubMed]
- Alston, C.L.; Davison, J.E.; Meloni, F.; van der Westhuizen, F.H.; He, L.; Hornig-Do, H.T.; Peet, A.C.; Gissen, P.; Goffrini, P.; Ferrero, I.; et al. Recessive germline SDHA and SDHB mutations causing leukodystrophy and isolated mitochondrial complex II deficiency. J. Med. Genet. 2012, 49, 569–577. [Google Scholar] [CrossRef] [PubMed] [Green Version]
- Renkema, G.H.; Wortmann, S.B.; Smeets, R.J.; Venselaar, H.; Antoine, M.; Visser, G.; Ben-Omran, T.; van den Heuvel, L.P.; Timmers, H.J.; Smeitink, J.A.; et al. SDHA mutations causing a multisystem mitochondrial disease: Novel mutations and genetic overlap with hereditary tumors. Eur. J. Hum. Genet. 2015, 23, 202–209. [Google Scholar] [CrossRef] [PubMed]
Figure 1.
Cell proliferation results by Cell Counting Kit-8 (CCK-8) assay after emodin administrated for 24 h and 48 h (means ± SD, n = 3).
Figure 1.
Cell proliferation results by Cell Counting Kit-8 (CCK-8) assay after emodin administrated for 24 h and 48 h (means ± SD, n = 3).

Figure 2.
The differentially expressed proteins filter through a volcano map.

Figure 3.
The hierarchical clustering of total protein (A) and differentially expressed proteins (B). * K1,2,3 are the three control groups; G11-1, -2, -3 are the three administered groups (n = 3).
Figure 3.
The hierarchical clustering of total protein (A) and differentially expressed proteins (B). * K1,2,3 are the three control groups; G11-1, -2, -3 are the three administered groups (n = 3).

Figure 4.
The results of Gene Ontology (GO) enrichment analysis of the differentially expressed proteins.
Figure 4.
The results of Gene Ontology (GO) enrichment analysis of the differentially expressed proteins.

Figure 5.
The results of pathway analysis of the differentially expressed proteins.

Figure 6.
The expression of seven protein in L02 cells after treated with emodin for 48 h, (means ± SD, n = 3).
Figure 6.
The expression of seven protein in L02 cells after treated with emodin for 48 h, (means ± SD, n = 3).

Figure 7.
The changes of mitochondrial membrane potential (MMP) in L02 cells after treatment with emodin for 24 h and 48 h under different concentrations, (means ± SD, n = 3).
Figure 7.
The changes of mitochondrial membrane potential (MMP) in L02 cells after treatment with emodin for 24 h and 48 h under different concentrations, (means ± SD, n = 3).

Figure 8.
The results of mitochondrial respiratory chain complex activity assay (means ± SD, n = 3).
Figure 8.
The results of mitochondrial respiratory chain complex activity assay (means ± SD, n = 3).

Figure 9.
The possible hepatotoxicity signal pathway of apoptosis induced by emodin.


Table 1.
Representative results of GO enrichment analysis related to mitochondria functions.
| GO.ID | Term | Annotated | Significant | p-Value | p Adjust | Names (Uniport Accession) | GO Category |
|---|---|---|---|---|---|---|---|
| GO:0098573 | intrinsic component of mitochondrial membrane | 86 | 6 | 9.4 × 10⁻⁵ | 1.12 × 10⁻⁴ | A0A140TA86, P50416, Q16891, Q9Y3D6, P17152, Q99595 | Cellular Component |
| GO:0032592 | integral component of mitochondrial membrane | 85 | 6 | 8.8 × 10⁻⁵ | 1.06 × 10⁻⁴ | A0A140TA86, P50416, Q16891, Q9Y3D6, P17152, Q99595 | Cellular Component |
| GO:0032543 | mitochondrial translation | 130 | 18 | 5.9 × 10⁻¹⁶ | 3.02 × 10⁻¹⁵ | Q9BQC6, Q96EY7, Q9NYK5, Q9Y3D9, Q8N983, Q96A35, Q9BZE1, Q9H2W6, Q13084, O95182, Q8IXM3, Q969S9, Q9Y291, P82932, P82675, P46199, P42704, Q96DV4 | Biological Process |
| GO:0140053 | mitochondrial gene expression | 147 | 18 | 5.3 × 10⁻¹⁵ | 2.33 × 10⁻¹⁴ | Q9BQC6, Q96EY7, Q9NYK5, Q9Y3D9, Q8N983, Q96A35, Q9BZE1, Q9H2W6, Q13084, O95182, Q8IXM3, Q969S9, Q9Y291, P82932, P82675, P46199, P42704, Q96DV4 | Biological Process |
| GO:0005747 | mitochondrial respiratory chain complex I | 75 | 11 | 4.3 × 10⁻¹¹ | 1.29 × 10⁻¹⁰ | P56556, O95182, O95139, O00217, Q16718, O00483, P28331, O43678, Q9NX14, O75306, P49821 | Cellular Component |
| GO:0005746 | mitochondrial respiratory chain | 138 | 17 | 4.2 × 10⁻¹⁵ | 1.57 × 10⁻¹⁴ | P56556, P31040, P13073, O95182, O95139, P21912, O00217, Q16718, O00483, H0UI06, P28331, O43678, P20674, Q7KZN9, Q9NX14, O75306, P49821 | Cellular Component |
| GO:0033108 | mitochondrial respiratory chain complex assembly | 101 | 11 | 3.8 × 10⁻⁹ | 8.99 × 10⁻⁹ | P56556, Q9NPL8, O95182, O95139, O00217, Q16718, P28331, O43678, Q9NX14, O75306, P49821 | Biological Process |
| GO:0098800 | inner mitochondrial membrane protein complex | 400 | 20 | 3.6 × 10⁻¹⁰ | 9.53 × 10⁻¹⁰ | P56556, A0A140TA86, Q9Y5J7, P31040, P13073, Q16891, O95182, O95139, P00846, P21912, O00217, Q16718, O00483, P28331, O43678, P20674, Q9NX14, O75306, Q99595, P49821 | Cellular Component |
| GO:0006123 | mitochondrial electron transport, cytochrome c to oxygen | 20 | 4 | 3.5 × 10⁻⁵ | 3.9 × 10⁻⁵ | P13073, O00483, P20674, Q7KZN9 | Biological Process |
| GO:0098798 | mitochondrial protein complex | 430 | 22 | 3.0 × 10⁻¹¹ | 9.43 × 10⁻¹⁰ | O76031, P56556, A0A140TA86, Q9Y5J7, P31040, P13073, Q16891, O95182, O95139, P00846, F8W8Z9, P21912, O00217, Q16718, O00483, P28331, O43678, P20674, Q9NX14, O75306, Q99595, P49821 | Cellular Component |
| GO:0006839 | mitochondrial transport | 316 | 14 | 2.6 × 10⁻⁶ | 3.88 × 10⁻⁶ | Q9Y5J7, P50416, Q9Y3D6, O00170, Q9H300, P00846, Q14790, Q99436, P40763, Q5HYI7, O00165, Q9NQZ5, Q9BZL1, Q99595 | Biological Process |
| GO:0070125 | mitochondrial translational elongation | 86 | 13 | 2.1 × 10⁻¹² | 7.04 × 10⁻¹² | Q96EY7, Q9NYK5, Q9Y3D9, Q8N983, Q96A35, Q9BZE1, Q9H2W6, Q13084, Q8IXM3, Q9Y291, P82932, P82675, Q96DV4 | Biological Process |
| GO:0032981 | mitochondrial respiratory chain complex I assembly | 62 | 11 | 1.7 × 10⁻¹¹ | 5.13 × 10⁻¹¹ | P56556, Q9NPL8, O95182, O95139, O00217, Q16718, P28331, O43678, Q9NX14, O75306, P49821 | Biological Process |
| GO:0097031 | mitochondrial respiratory chain complex I biogenesis | 62 | 11 | 1.7 × 10⁻¹¹ | 5.13 × 10⁻¹¹ | P56556, Q9NPL8, O95182, O95139, O00217, Q16718, P28331, O43678, Q9NX14, O75306, P49821 | Biological Process |
| GO:0005759 | mitochondrial matrix | 506 | 30 | 1.5 × 10⁻¹⁶ | 5.7 × 10⁻¹⁶ | O76031, P48735, Q9BQC6, Q96RQ3, Q9UNQ2, Q07820, Q9NYK5, Q32P41, Q6NVY1, Q8N983, Q9BZE1, Q9H2W6, Q16822, Q13084, O95182, P30038, Q8IXM3, Q969S9, Q9Y291, P11498, Q5U5X0, Q8NFF5, P82932, O00217, P82675, P28331, O75306, P42704, Q96AG4, Q13057 | Cellular Component |
| GO:0005761 | mitochondrial ribosome | 84 | 11 | 1.5 × 10⁻¹⁰ | 4.08 × 10⁻¹⁰ | Q9BQC6, Q9NYK5, Q8N983, Q9BZE1, Q9H2W6, Q13084, O95182, Q8IXM3, Q9Y291, P82932, P82675 | Cellular Component |
| GO:0005741 | mitochondrial outer membrane | 242 | 12 | 1.3 × 10⁻⁶ | 2.29 × 10⁻⁶ | Q9NUQ2, Q07820, P50416, Q9Y3D6, Q969Z3, P00387, Q14790, F8W8Z9, Q5HYI7, O00165, Q13057, A0A0C4DFN1 | Cellular Component |
| GO:0070126 | mitochondrial translational termination | 86 | 14 | 1.0 × 10⁻¹³ | 3.73 × 10⁻¹³ | Q96EY7, Q9NYK5, Q9Y3D9, Q8N983, Q96A35, Q9BZE1, Q9H2W6, Q13084, Q8IXM3, Q969S9, Q9Y291, P82932, P82675, Q96DV4 | Biological Process |
Table 2.
The differentially expressed proteins involved in the oxidative phosphorylation pathway and respiratory chain complex.
Table 2.
The differentially expressed proteins involved in the oxidative phosphorylation pathway and respiratory chain complex.
| Accession | Description | Complex | Log Ratio (3/1) | p-Value |
|---|---|---|---|---|
| P28331 | NADH:ubiquinone oxidoreductase core subunit S1 (NDUFS1) | Complex I | −0.7842 | 0.0002 |
| O75306 | NADH:ubiquinone oxidoreductase core subunit S2 (NDUFS2) | −0.4512 | 0.0017 | |
| O00217 | NADH:ubiquinone oxidoreductase core subunit S8 (NDUFS8) | −0.3746 | 0.0005 | |
| P49821 | NADH:ubiquinone oxidoreductase core subunit V1 (NDUFV1) | −0.5872 | 0.0008 | |
| E7EPT4 | NADH:ubiquinone oxidoreductase core subunit V2 (NDUFV2) | −0.4440 | 0.0063 | |
| O43678 | NADH:ubiquinone oxidoreductase subunit A2 (NDUFA2) | −0.2866 | 0.0001 | |
| Q16718 | NADH:ubiquinone oxidoreductase subunit A5 (NDUFA5) | −0.4784 | 0.0028 | |
| P56556 | NADH:ubiquinone oxidoreductase subunit A6 (NDUFA6) | −0.7647 | 0.0010 | |
| O95182 | NADH:ubiquinone oxidoreductase subunit A7 (NDUFA7) | 0.4626 | 0.0017 | |
| Q9NX14 | NADH:ubiquinone oxidoreductase subunit B11 (NDUFB11) | −0.5076 | 0.0004 | |
| O95139 | NADH:ubiquinone oxidoreductase subunit B6 (NDUFB6) | −0.3481 | 0.0001 | |
| O00483 | NDUFA4, mitochondrial complex associated (NDUFA4) | −0.4872 | 0.0004 | |
| P31040 | succinate dehydrogenase complex flavoprotein subunit A (SDHA) | Complex II | −0.7329 | 0.0004 |
| P21912 | succinate dehydrogenase complex iron sulfur subunit B (SDHB) | −0.5184 | 0.0046 | |
| Q7KZN9 | COX15, cytochrome c oxidase assembly homolog (COX15) | Complex IV | −0.4991 | 0.0001 |
| P13073 | cytochrome c oxidase subunit 4I1 (COX4I1) | −0.3085 | 0.0003 | |
| P20674 | cytochrome c oxidase subunit 5A (COX5A) | −0.5156 | 0.0011 | |
| H0UI06 | cytochrome c oxidase subunit 7A2 (COX7A2) | −0.7194 | 0.0061 | |
| P00846 | ATP synthase F0 subunit 6 (ATP6) | Complex V | −1.0014 | 0.0048 |
| Q9Y487 | ATPase H+ transporting V0 subunit a2 (ATP6V0A2) | 0.3322 | 0.0043 |
© 2019 by the authors. Licensee MDPI, Basel, Switzerland. This article is an open access article distributed under the terms and conditions of the Creative Commons Attribution (CC BY) license (http://creativecommons.org/licenses/by/4.0/).
Share and Cite
MDPI and ACS Style
Lin, L.; Liu, Y.; Fu, S.; Qu, C.; Li, H.; Ni, J. Inhibition of Mitochondrial Complex Function—The Hepatotoxicity Mechanism of Emodin Based on Quantitative Proteomic Analyses. Cells 2019, 8, 263. https://doi.org/10.3390/cells8030263
AMA Style
Lin L, Liu Y, Fu S, Qu C, Li H, Ni J. Inhibition of Mitochondrial Complex Function—The Hepatotoxicity Mechanism of Emodin Based on Quantitative Proteomic Analyses. Cells. 2019; 8(3):263. https://doi.org/10.3390/cells8030263
Chicago/Turabian StyleLin, Longfei, Yuling Liu, Sai Fu, Changhai Qu, Hui Li, and Jian Ni. 2019. "Inhibition of Mitochondrial Complex Function—The Hepatotoxicity Mechanism of Emodin Based on Quantitative Proteomic Analyses" Cells 8, no. 3: 263. https://doi.org/10.3390/cells8030263
Note that from the first issue of 2016, this journal uses article numbers instead of page numbers. See further details here.