Combinatory Treatment of Canavanine and Arginine Deprivation Efficiently Targets Human Glioblastoma Cells via Pleiotropic Mechanisms


Abstract
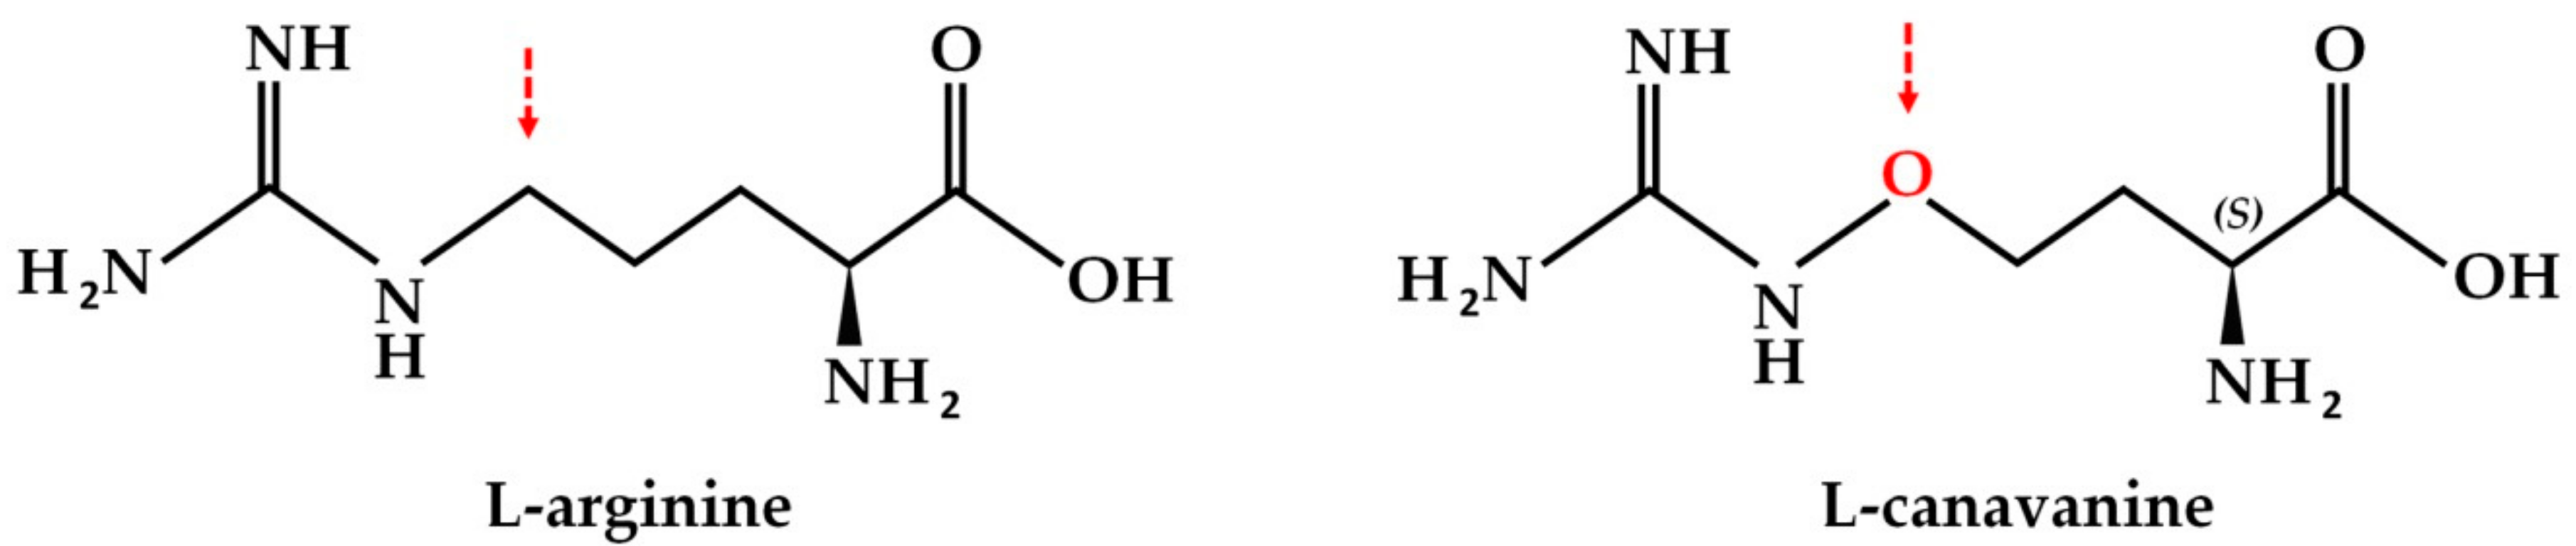
:1. Introduction
2. Materials and Methods
2.1. Materials
2.2. Cell Lines and Culture Conditions
2.3. Primary Rat Glial Cell Culture
2.4. MTS Cell Viability Assay
2.5. Western Blot Analysis
2.6. Immunocytochemical Staining and Microscopy Analysis
2.7. Confocal Endoplasmic Reticulum Localization
2.8. Transwell Migration Assay
2.9. Cell Adhesion Assay
2.10. Stable Isotope Labeling by Amino Acids in Cell Culture (SILAC)
2.11. Protein Extraction and Digestion
2.12. LC-MS/MS Analysis
2.13. Proteomics Data Analysis
2.14. Theoretical Calculation of Necessary Mass Spectrometer Resolution
2.15. Statistical Analysis
3. Results
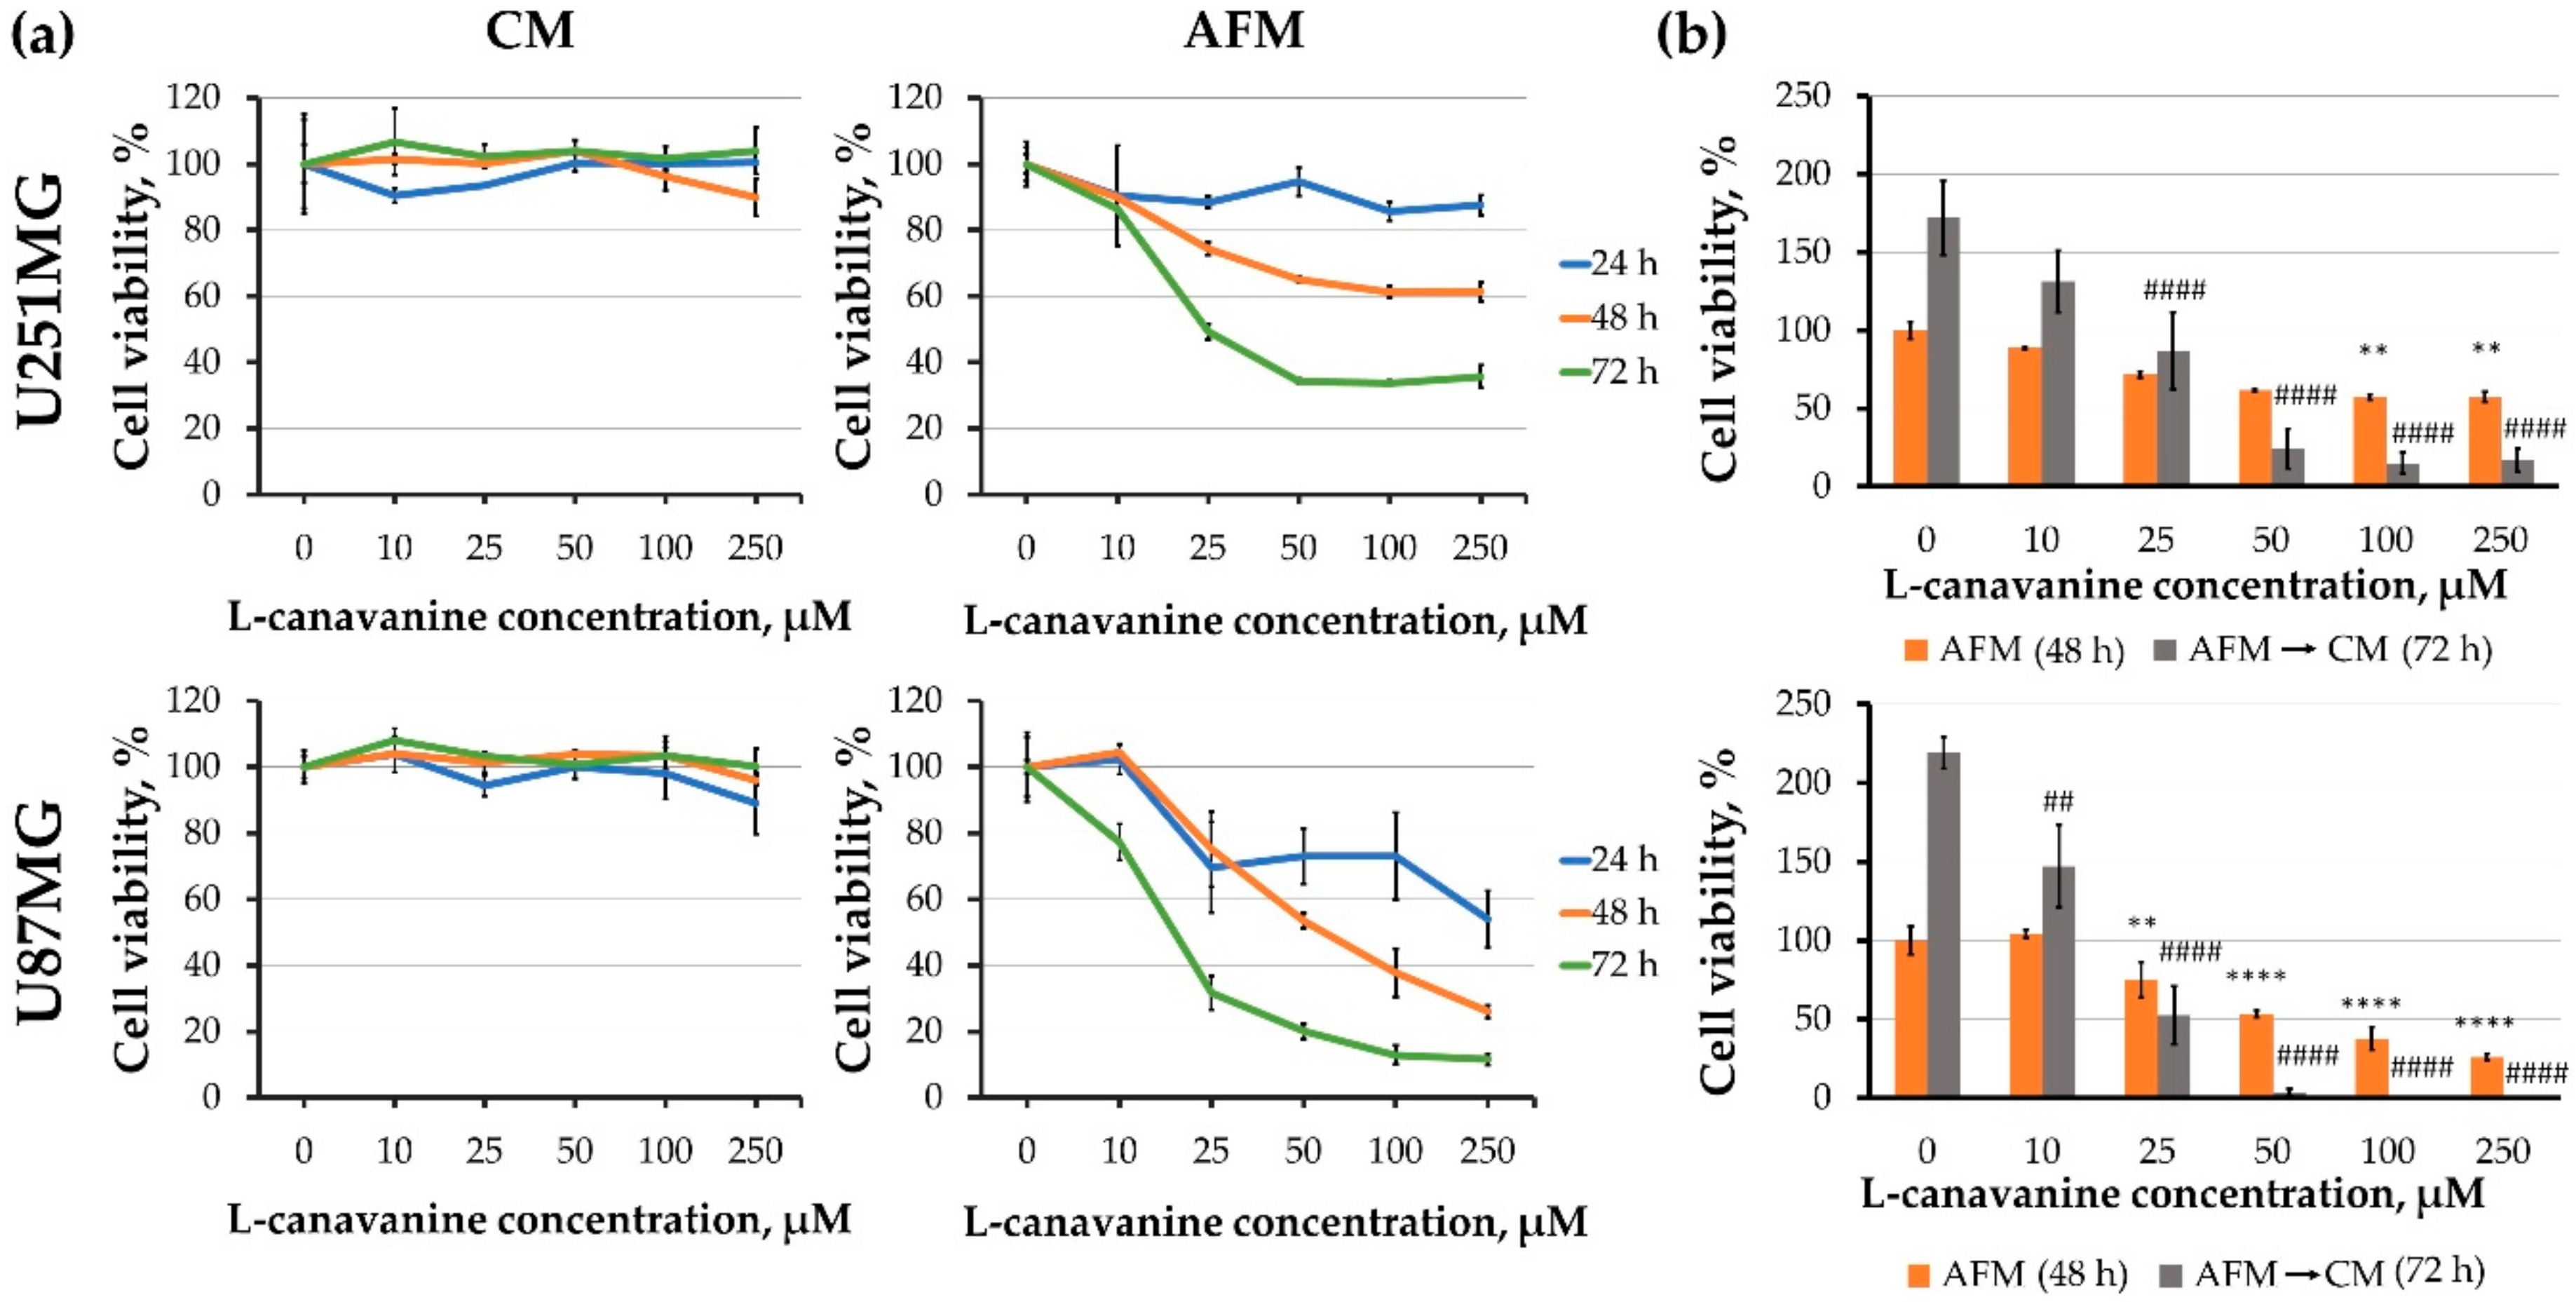
3.1. Canavanine Treatment Decreases the Viability and Proliferative Potential of Human Glioblastoma Cells under Arginine Deprivation
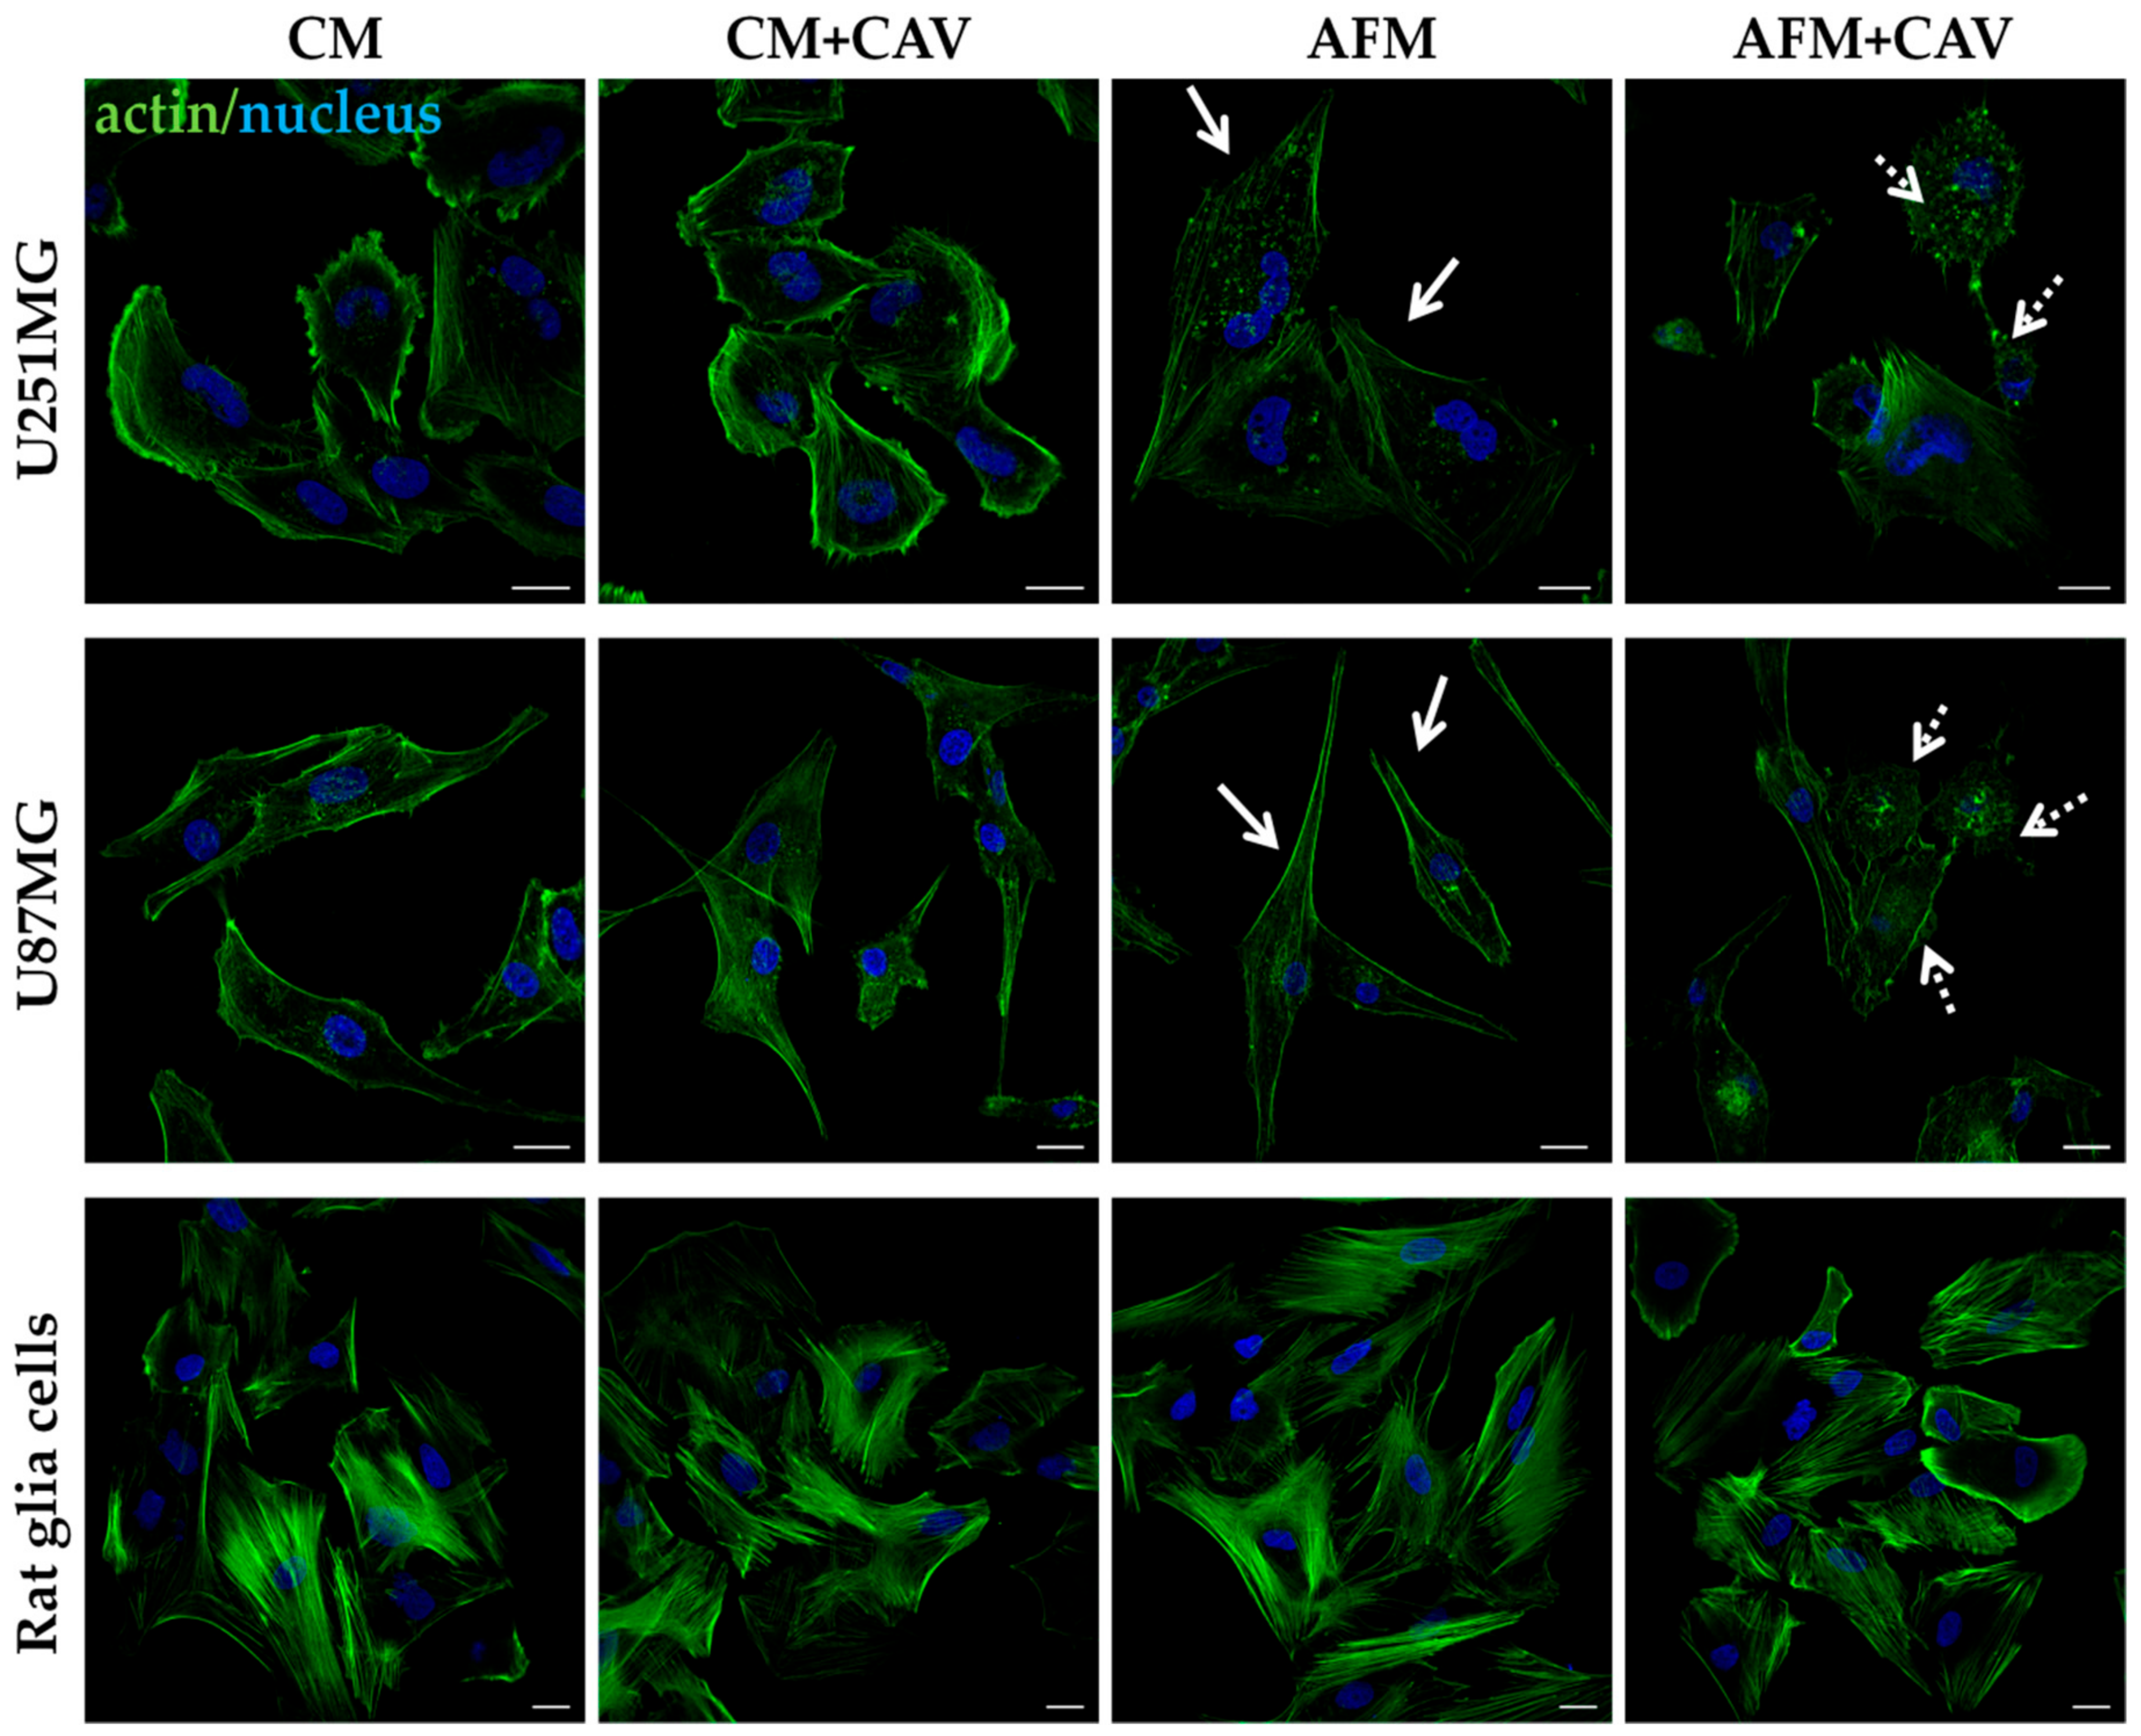
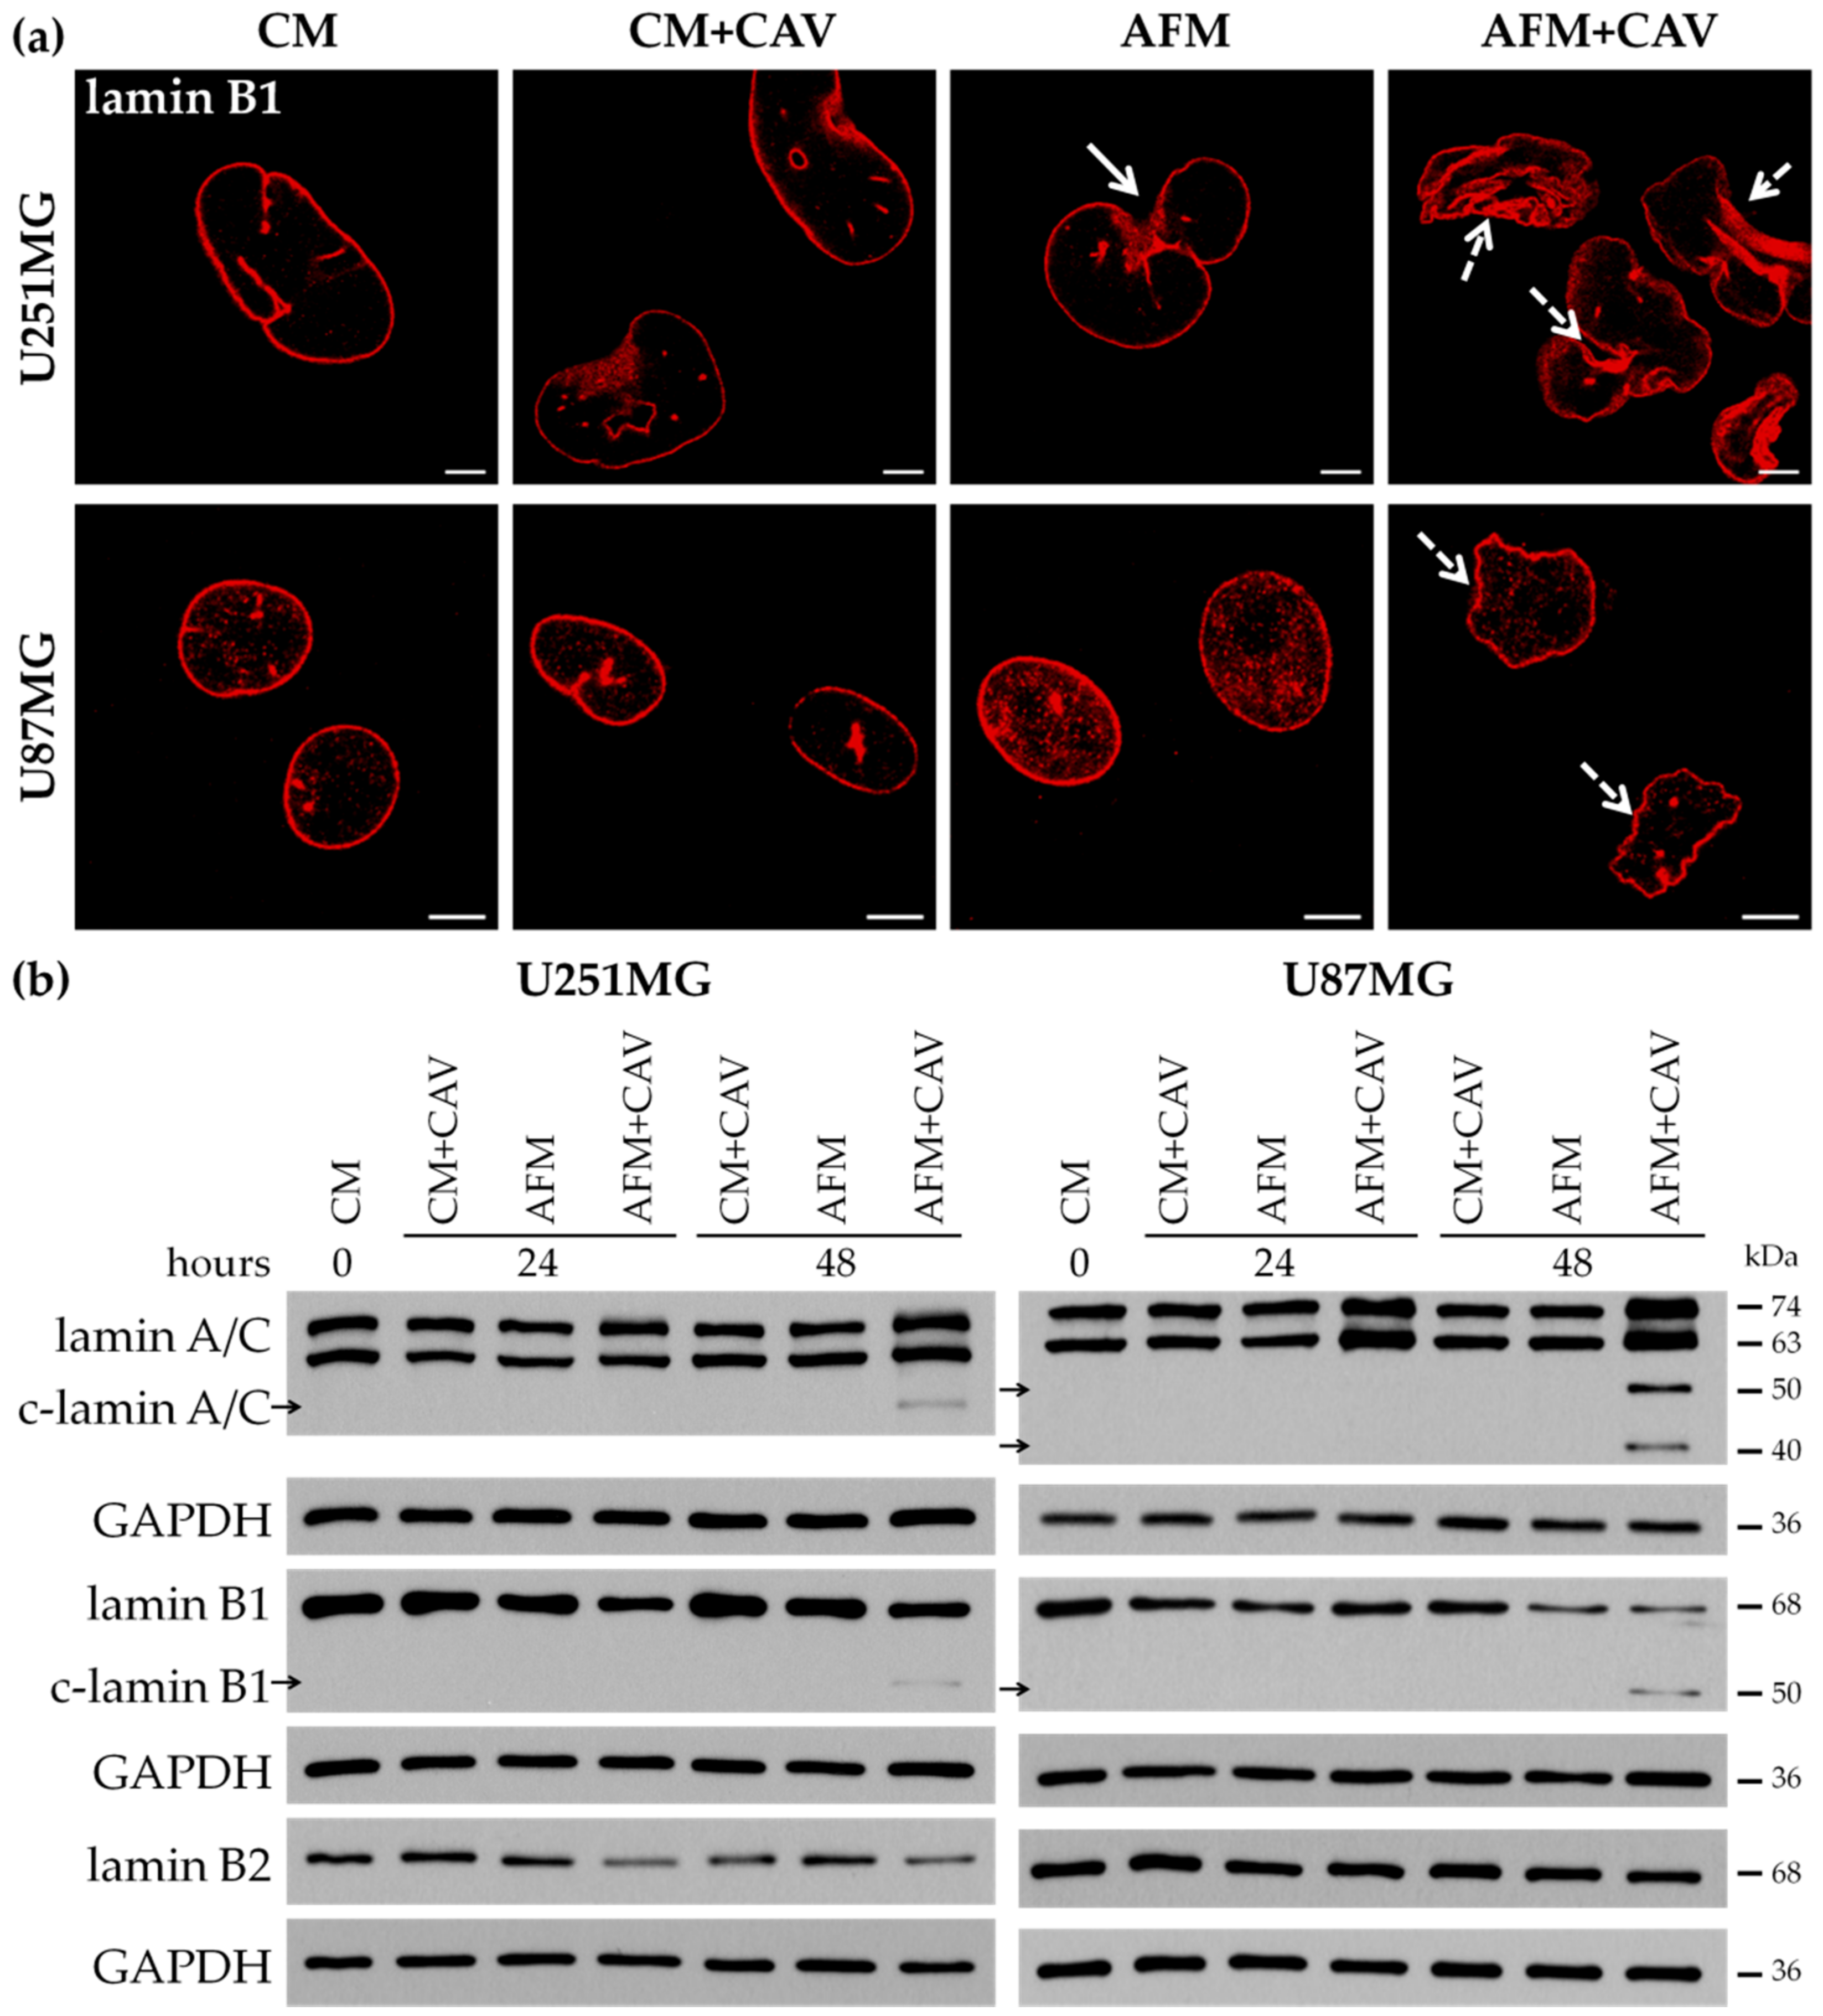
3.2. Canavanine Profoundly Affects Morphology of U251MG and U87MG Cells under Arginine Deprivation
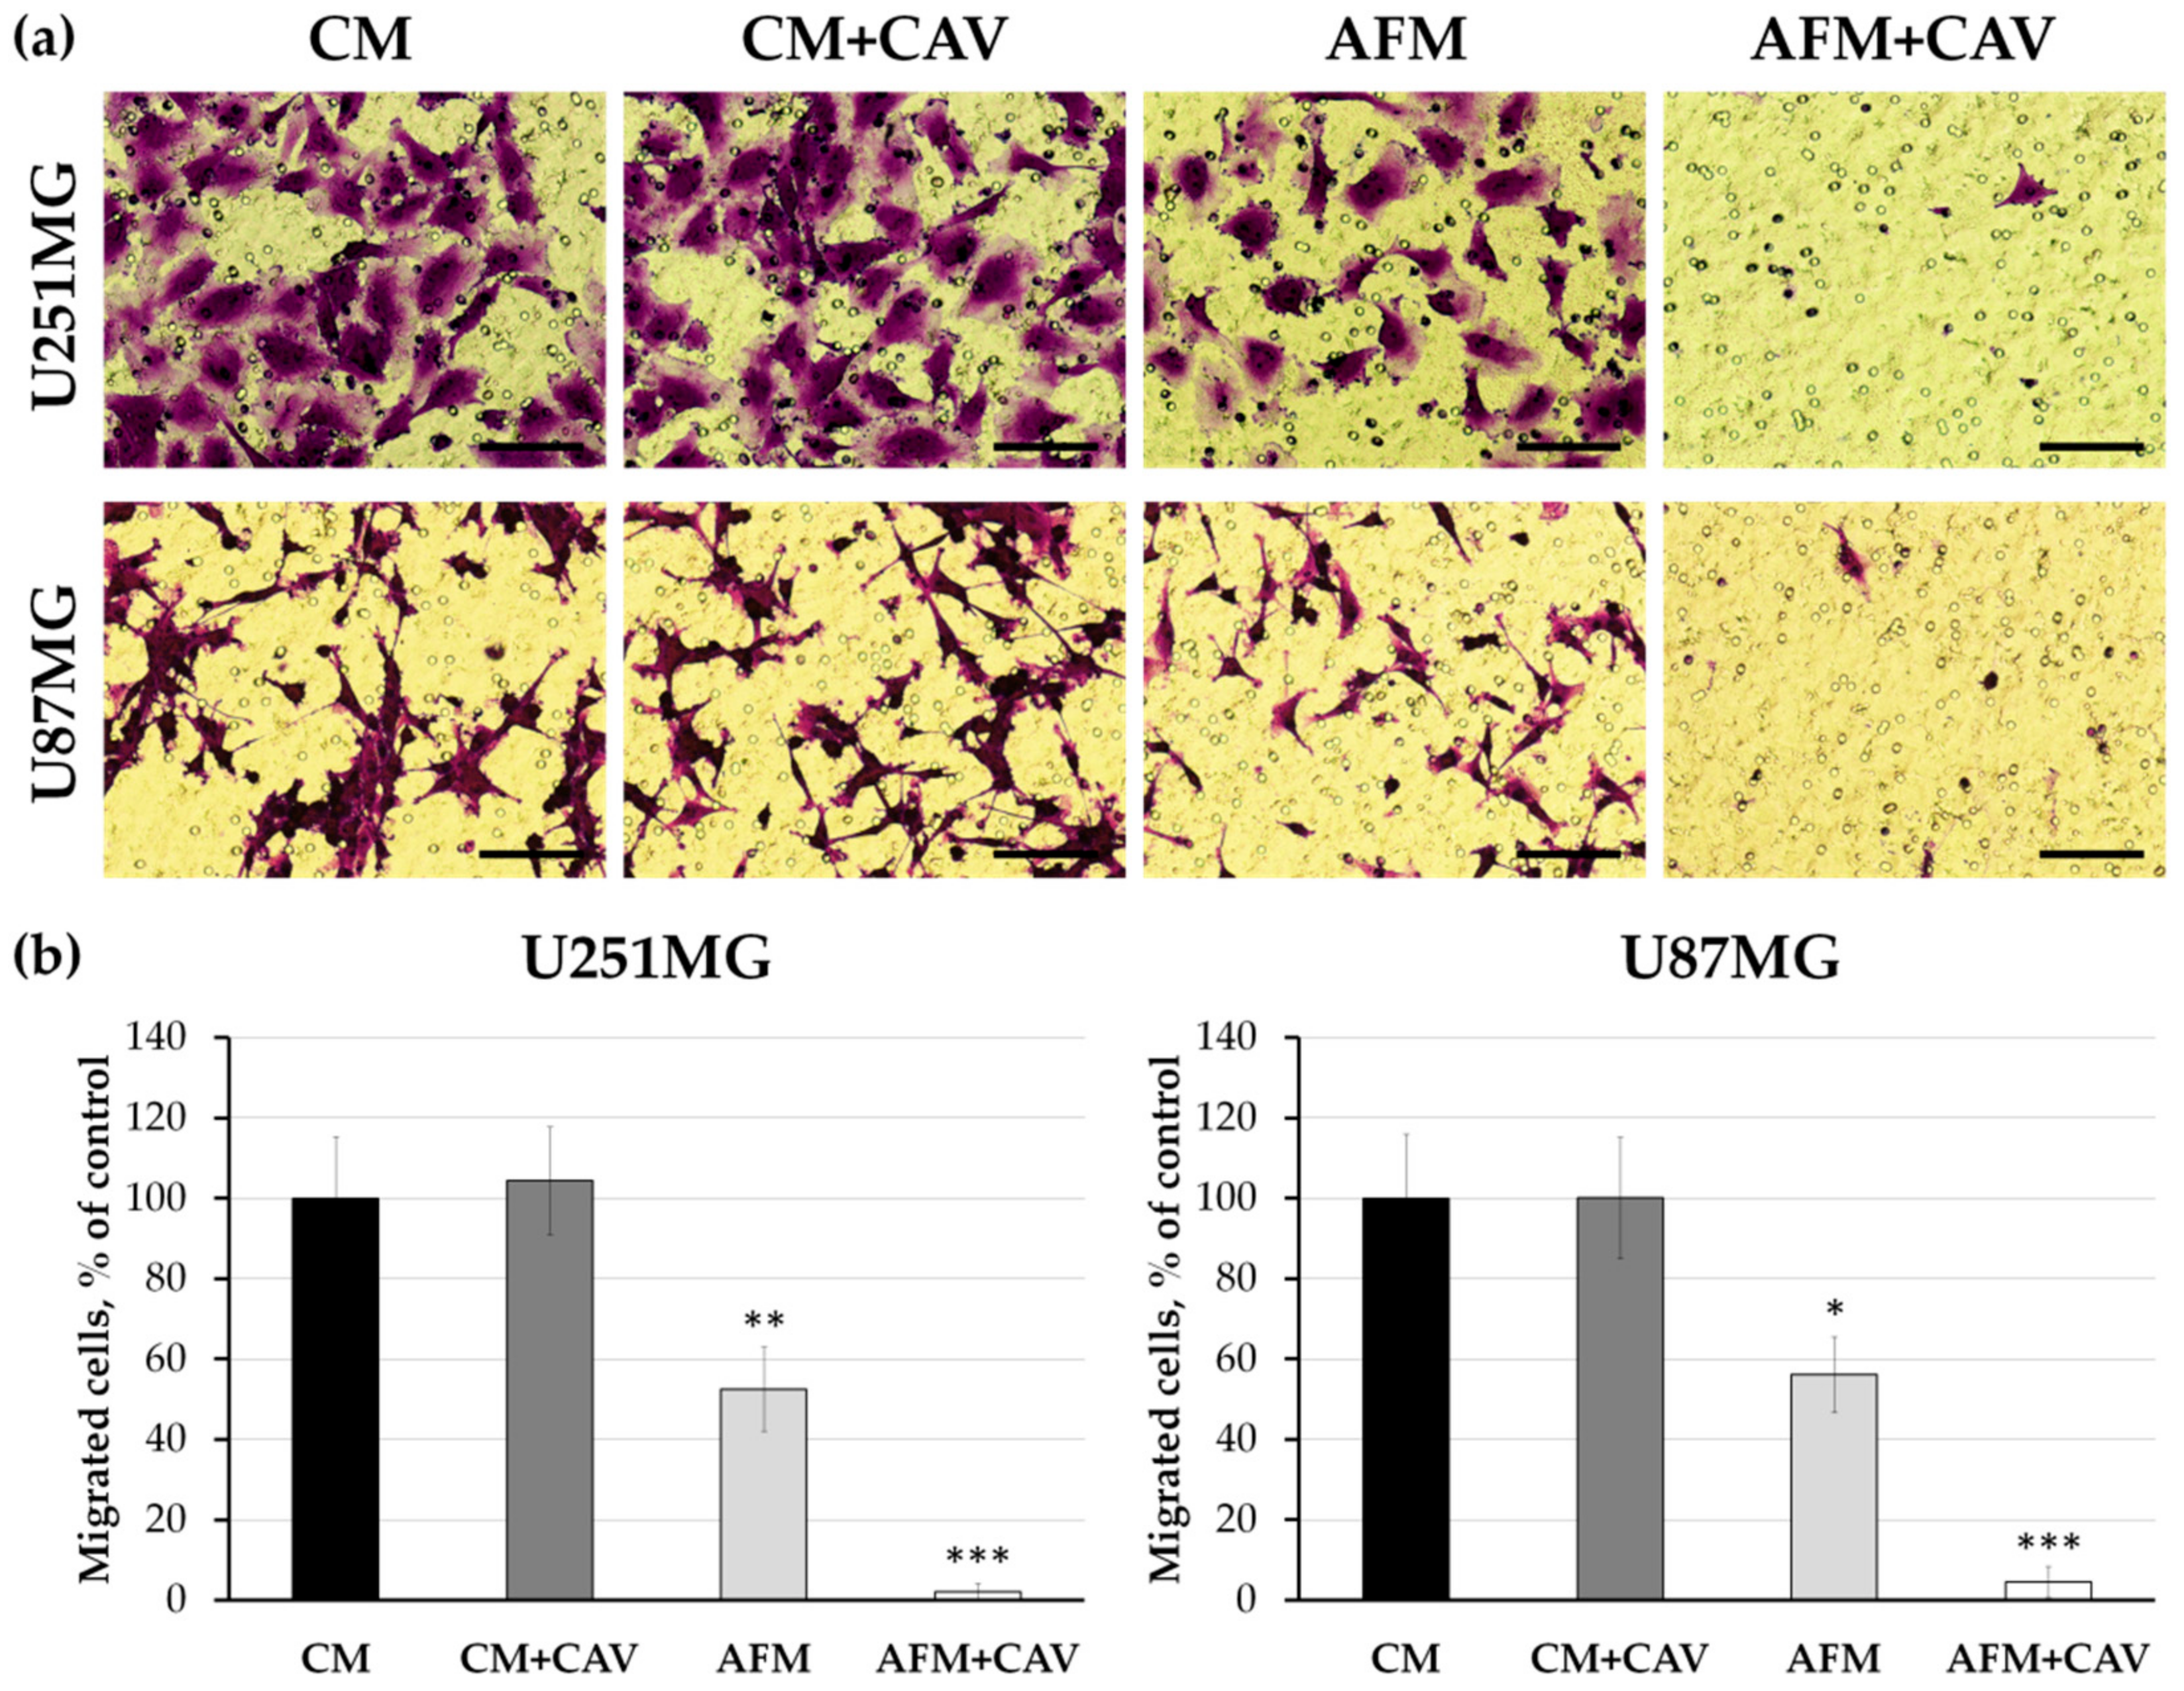
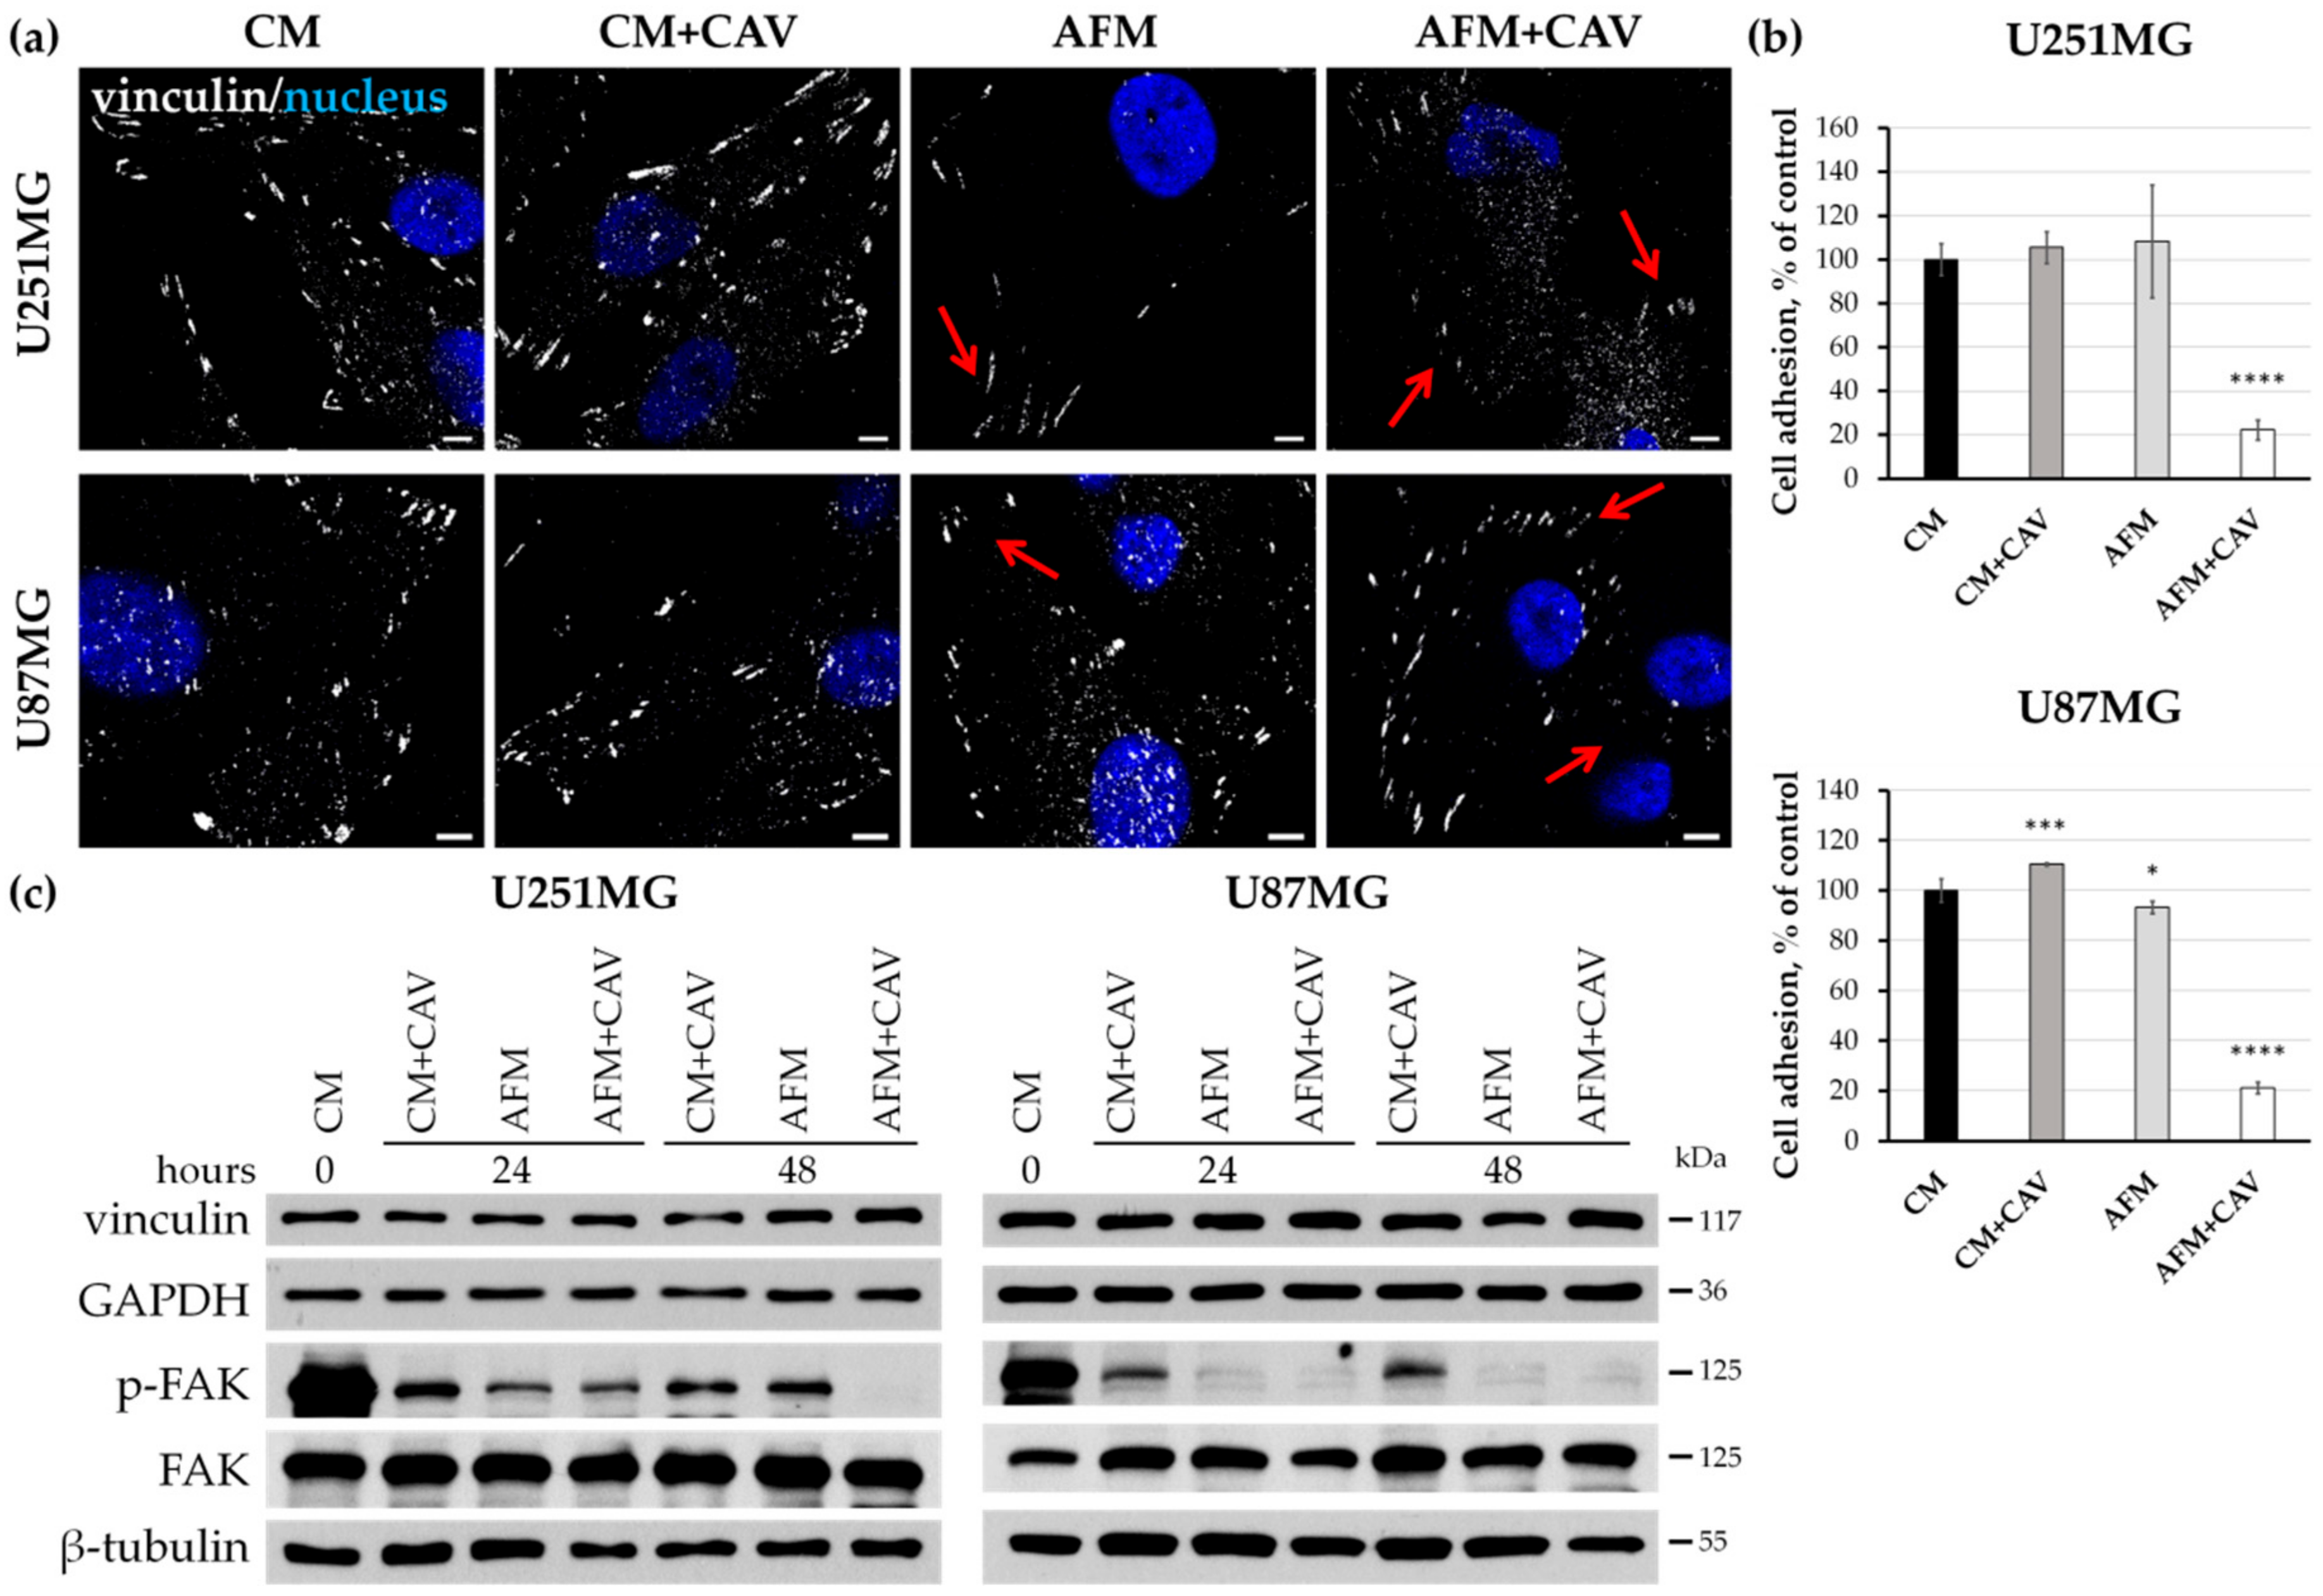
3.3. Lack of Arginine in Combination with Canavanine Profoundly Impairs Migration and Adhesion of Human Glioblastoma Cell Lines
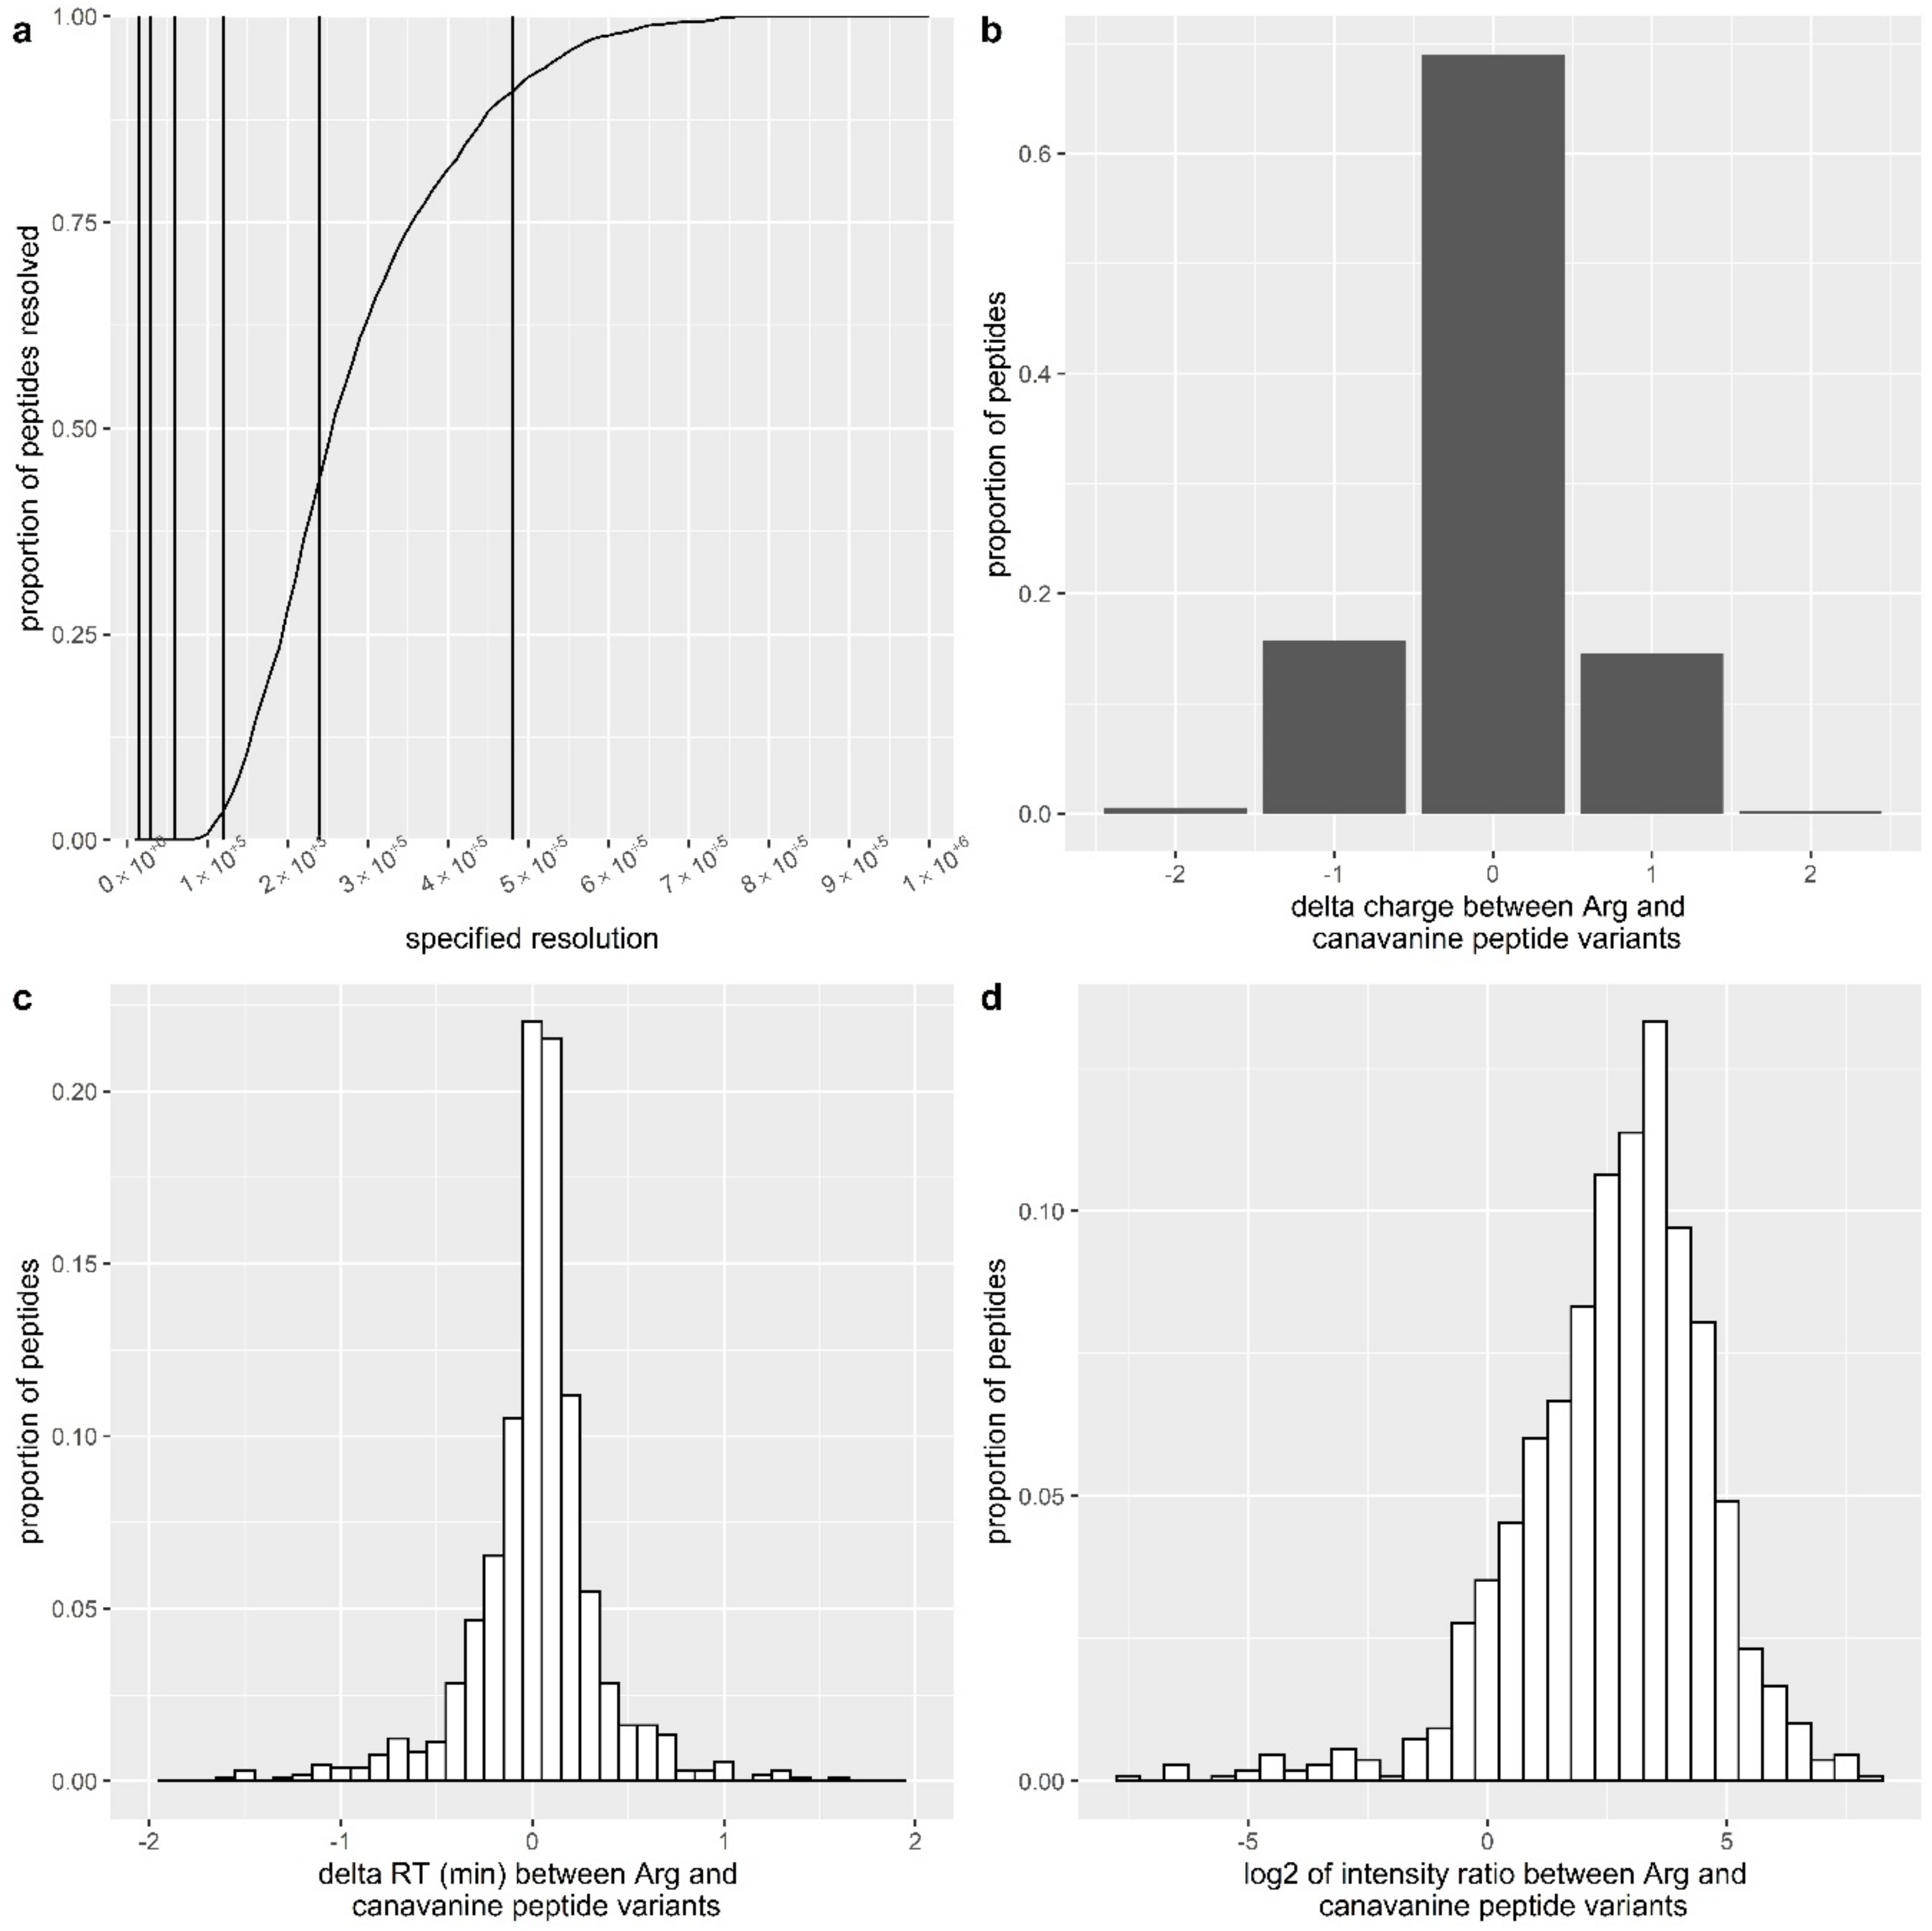
3.4. Proteomics Analysis of Canavanine Incorporation into Proteins in U251MG Glioblastoma Cells
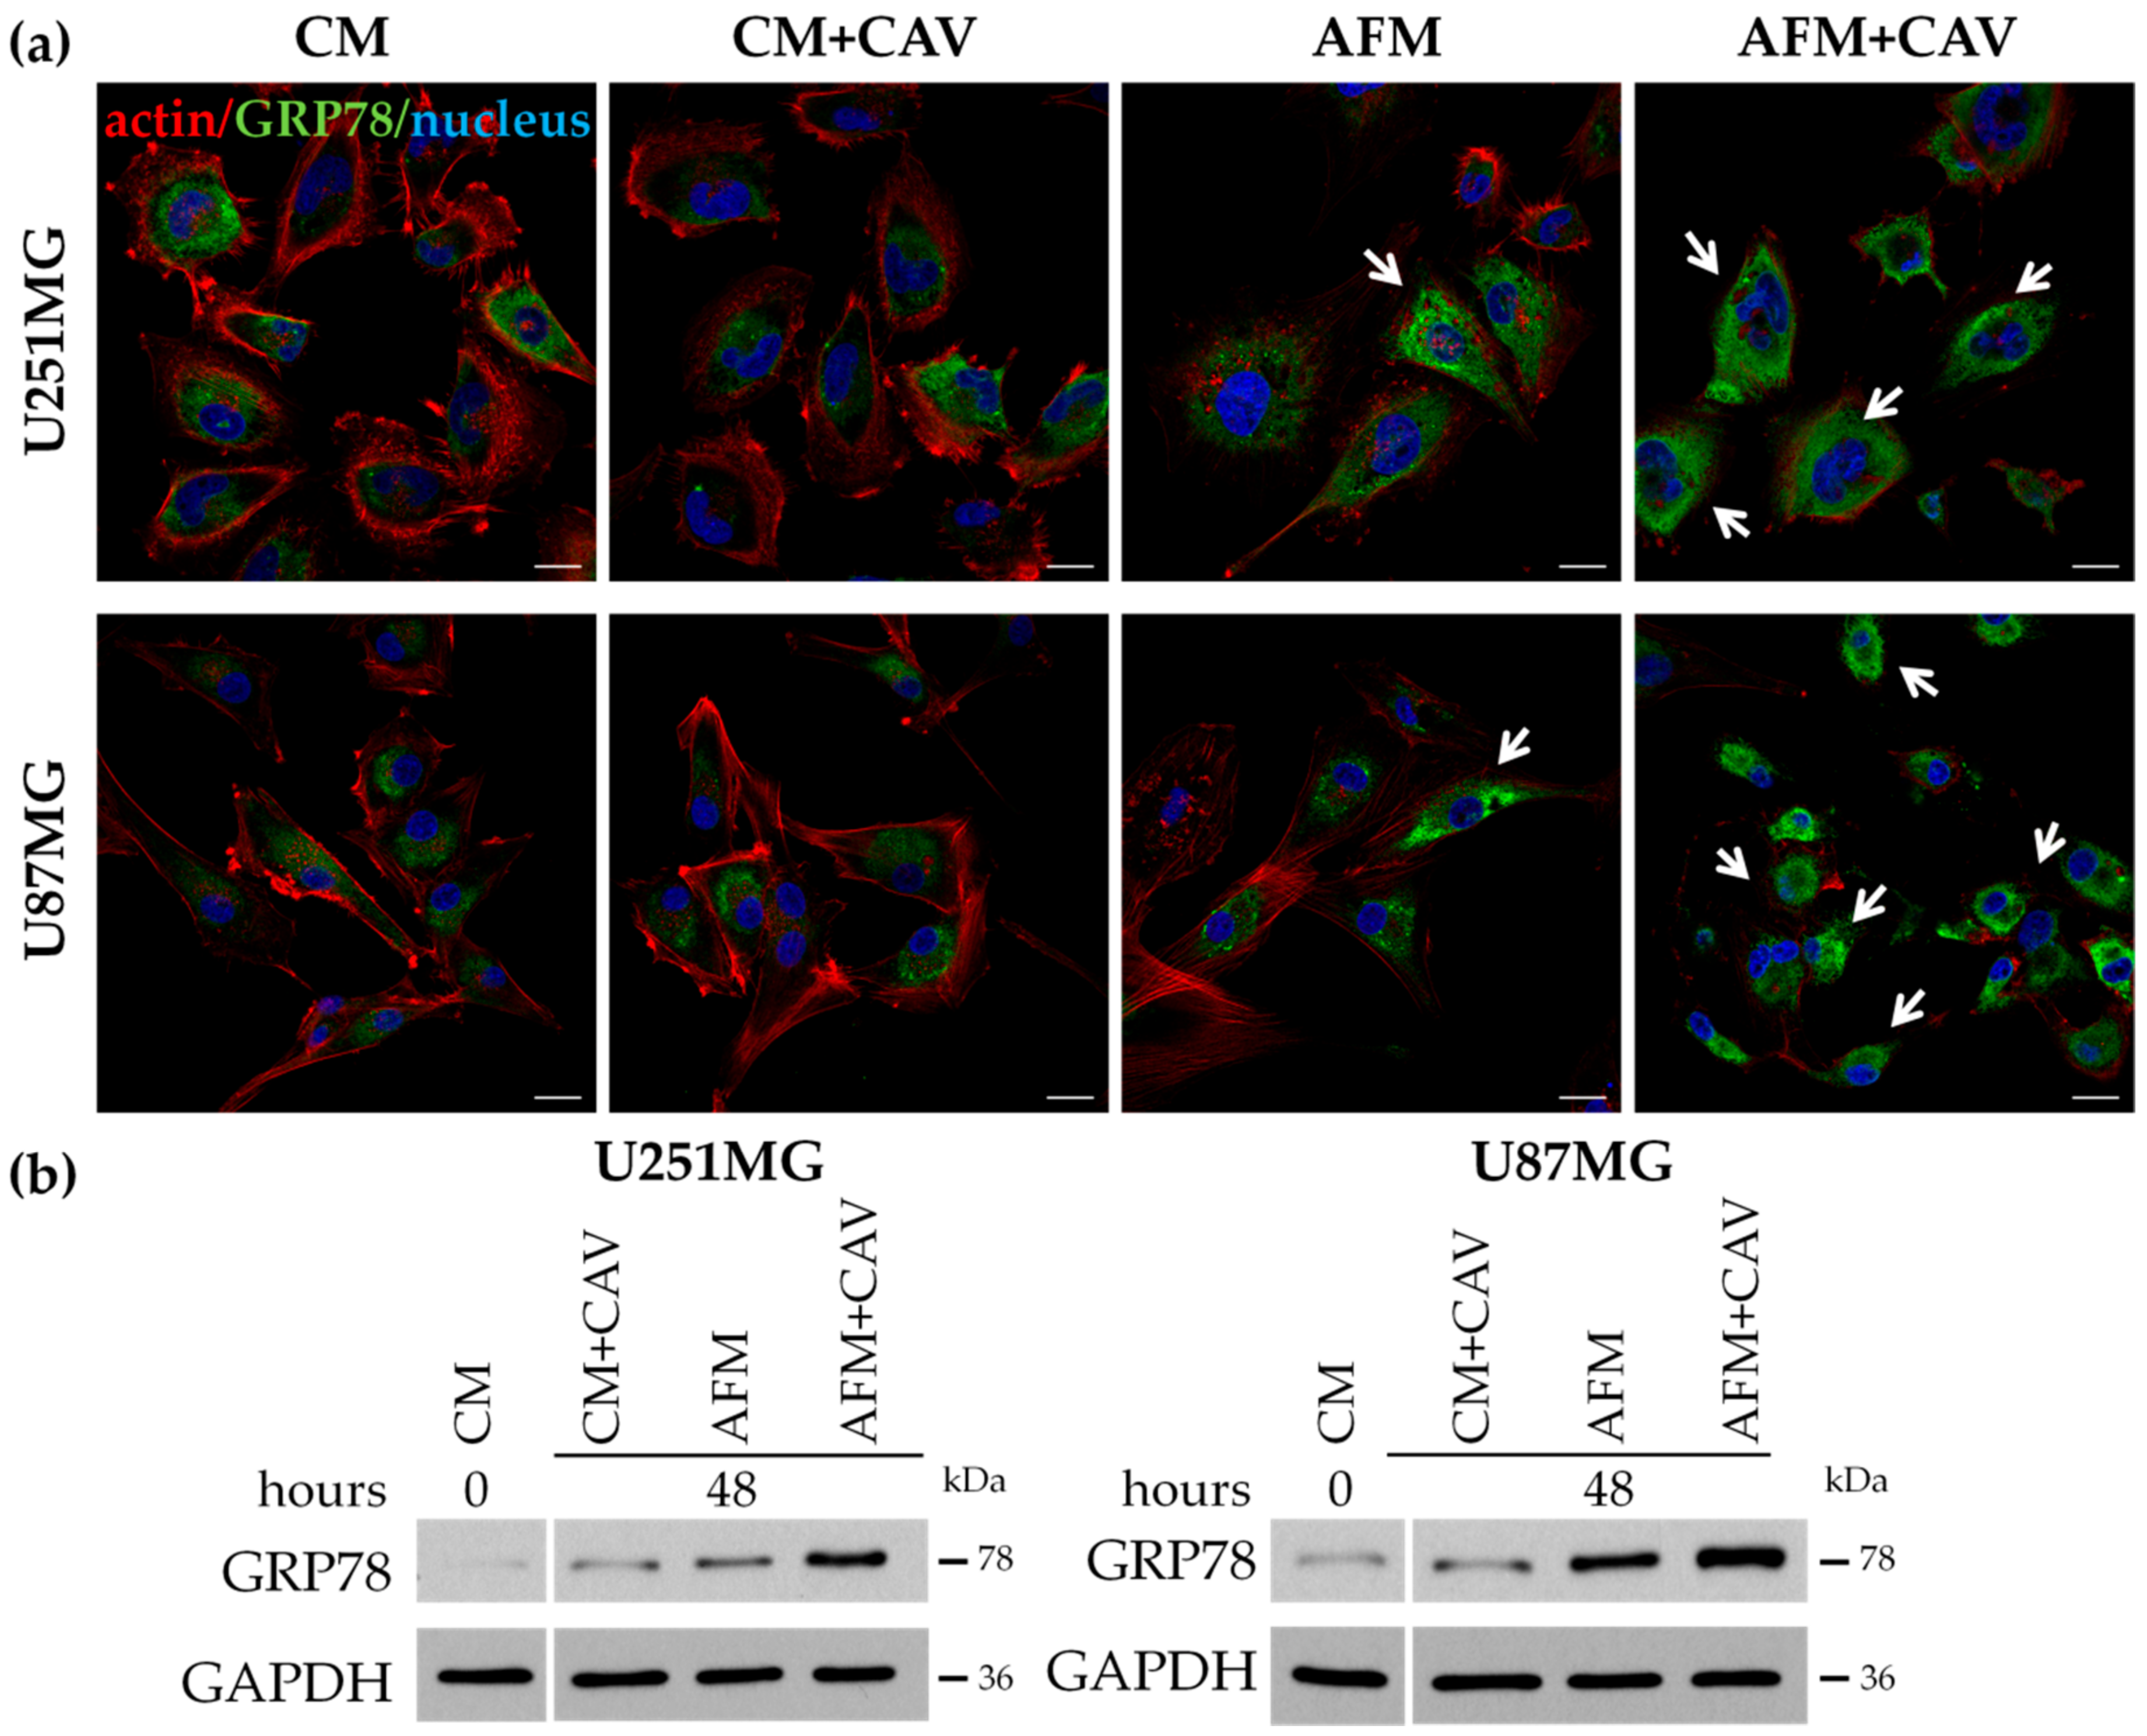
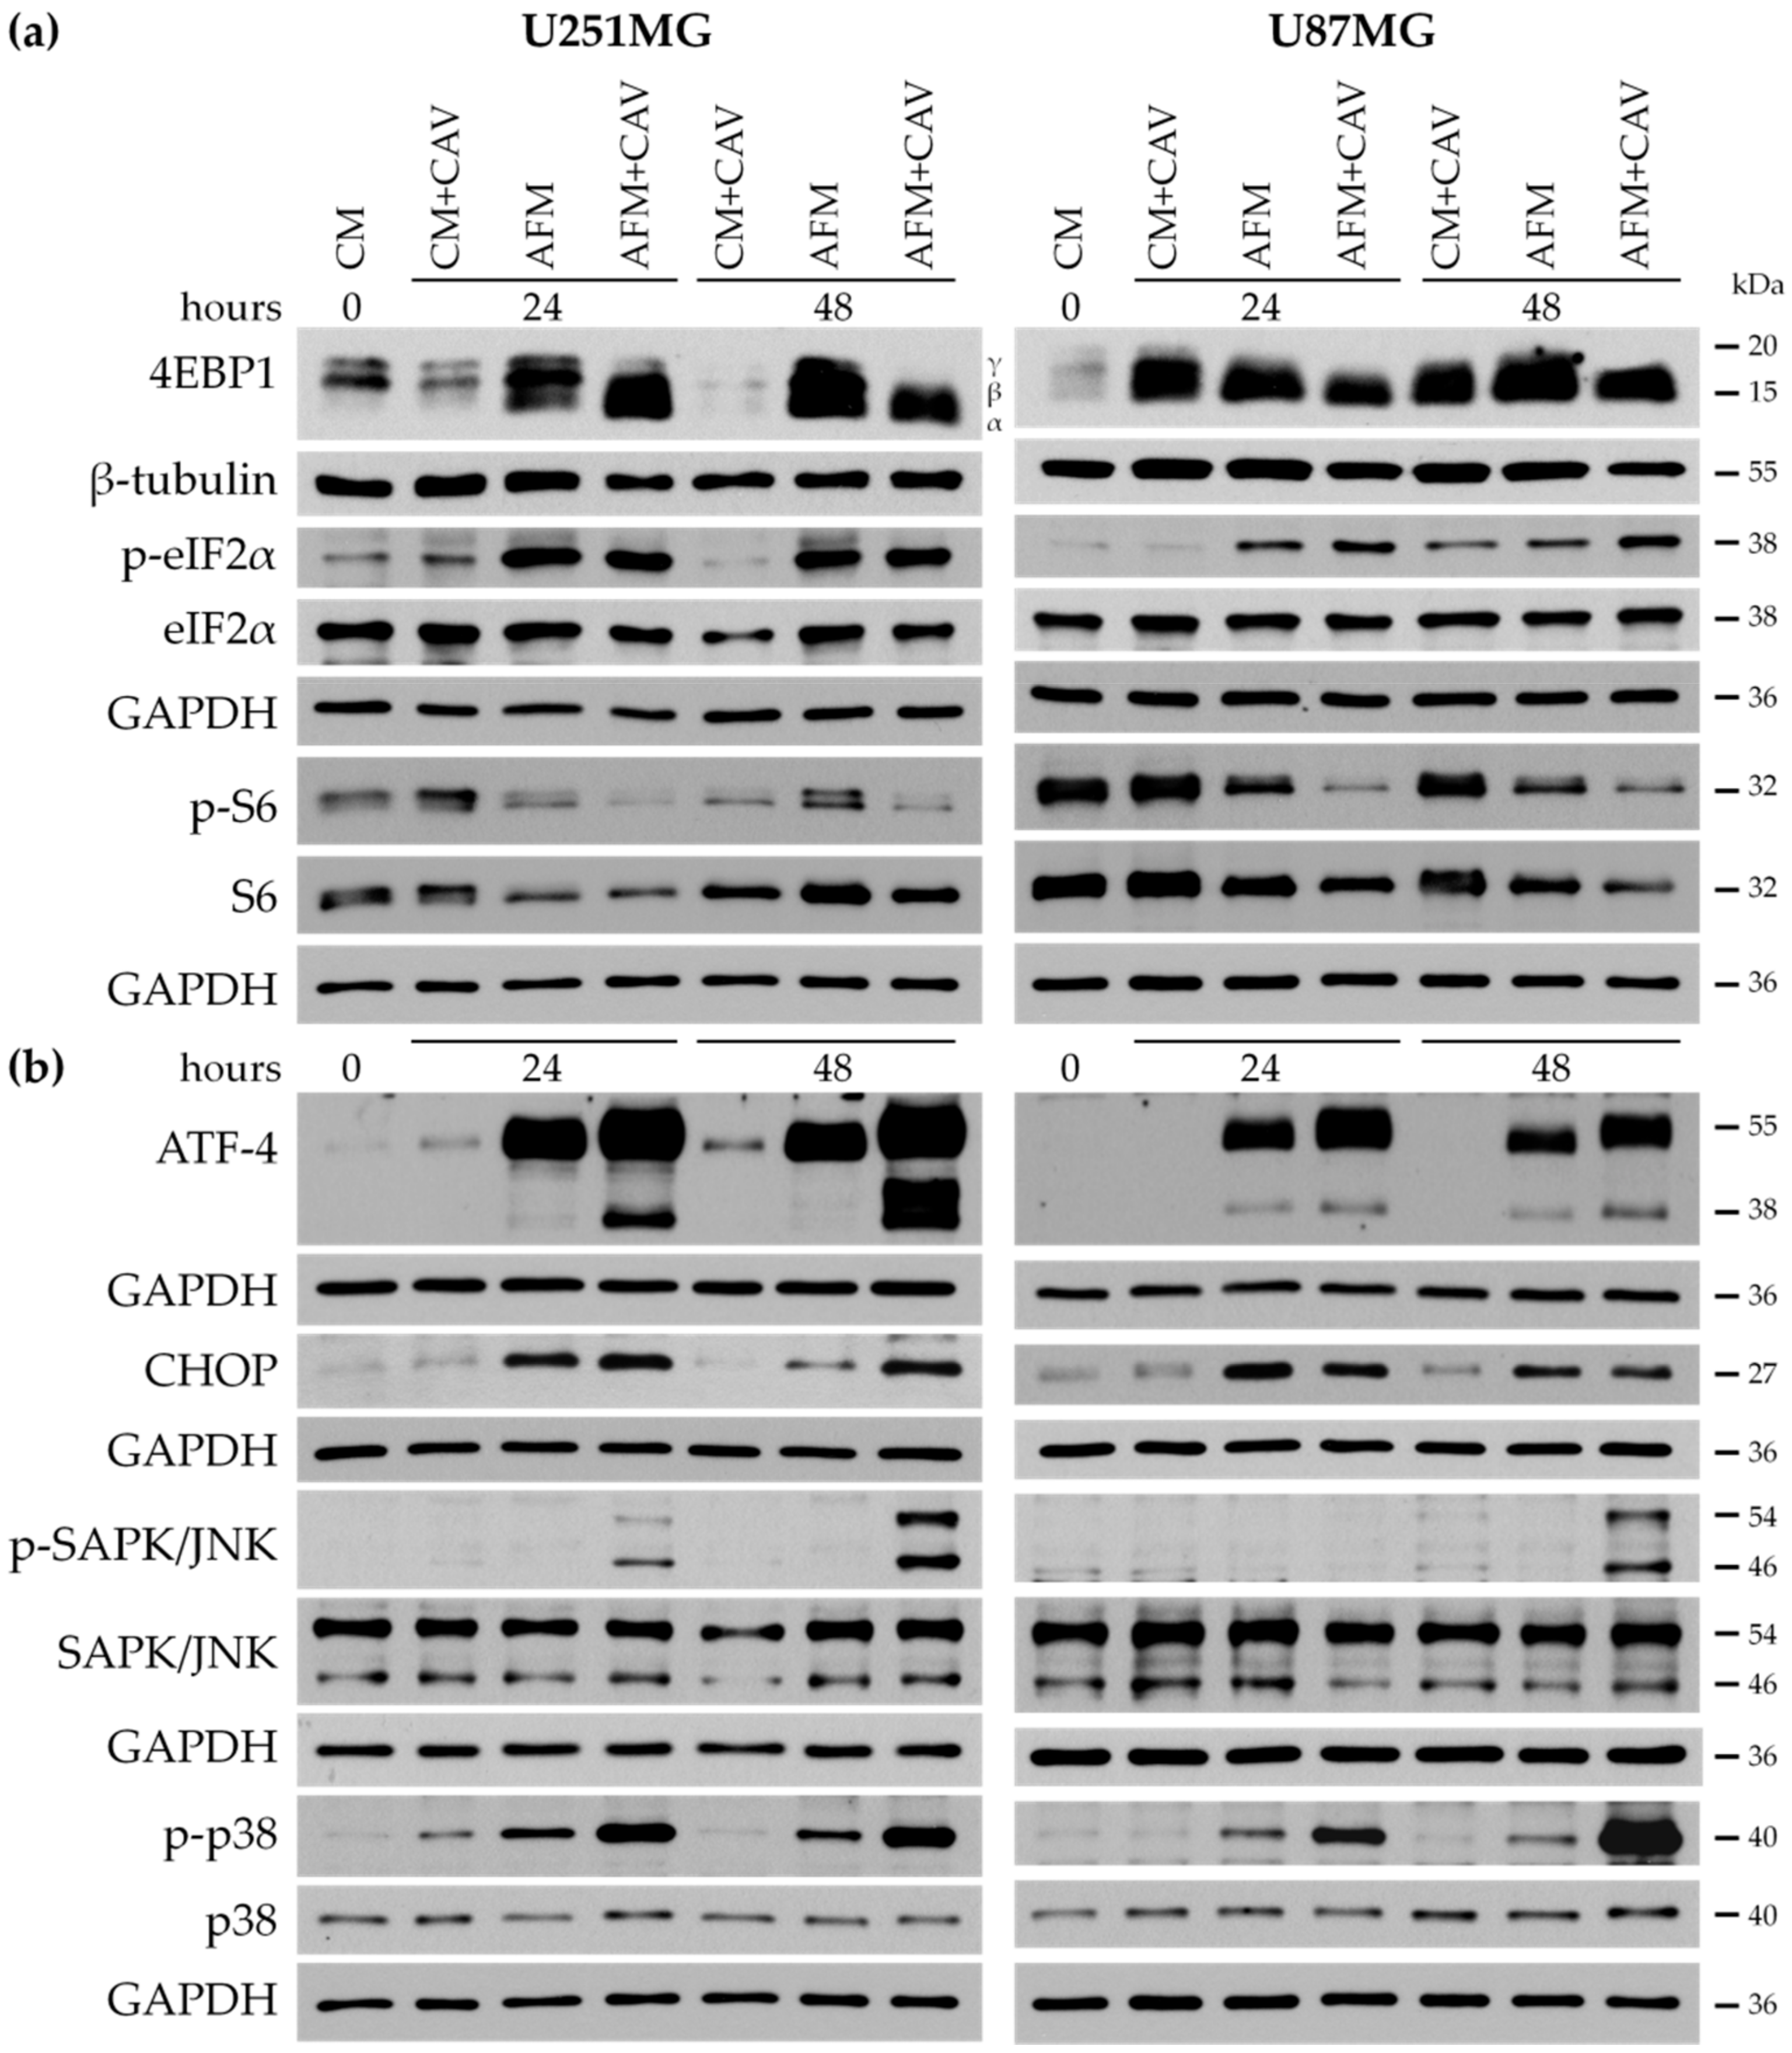
3.5. Canavanine Enhances ER Stress Evoked by Arginine Deprivation
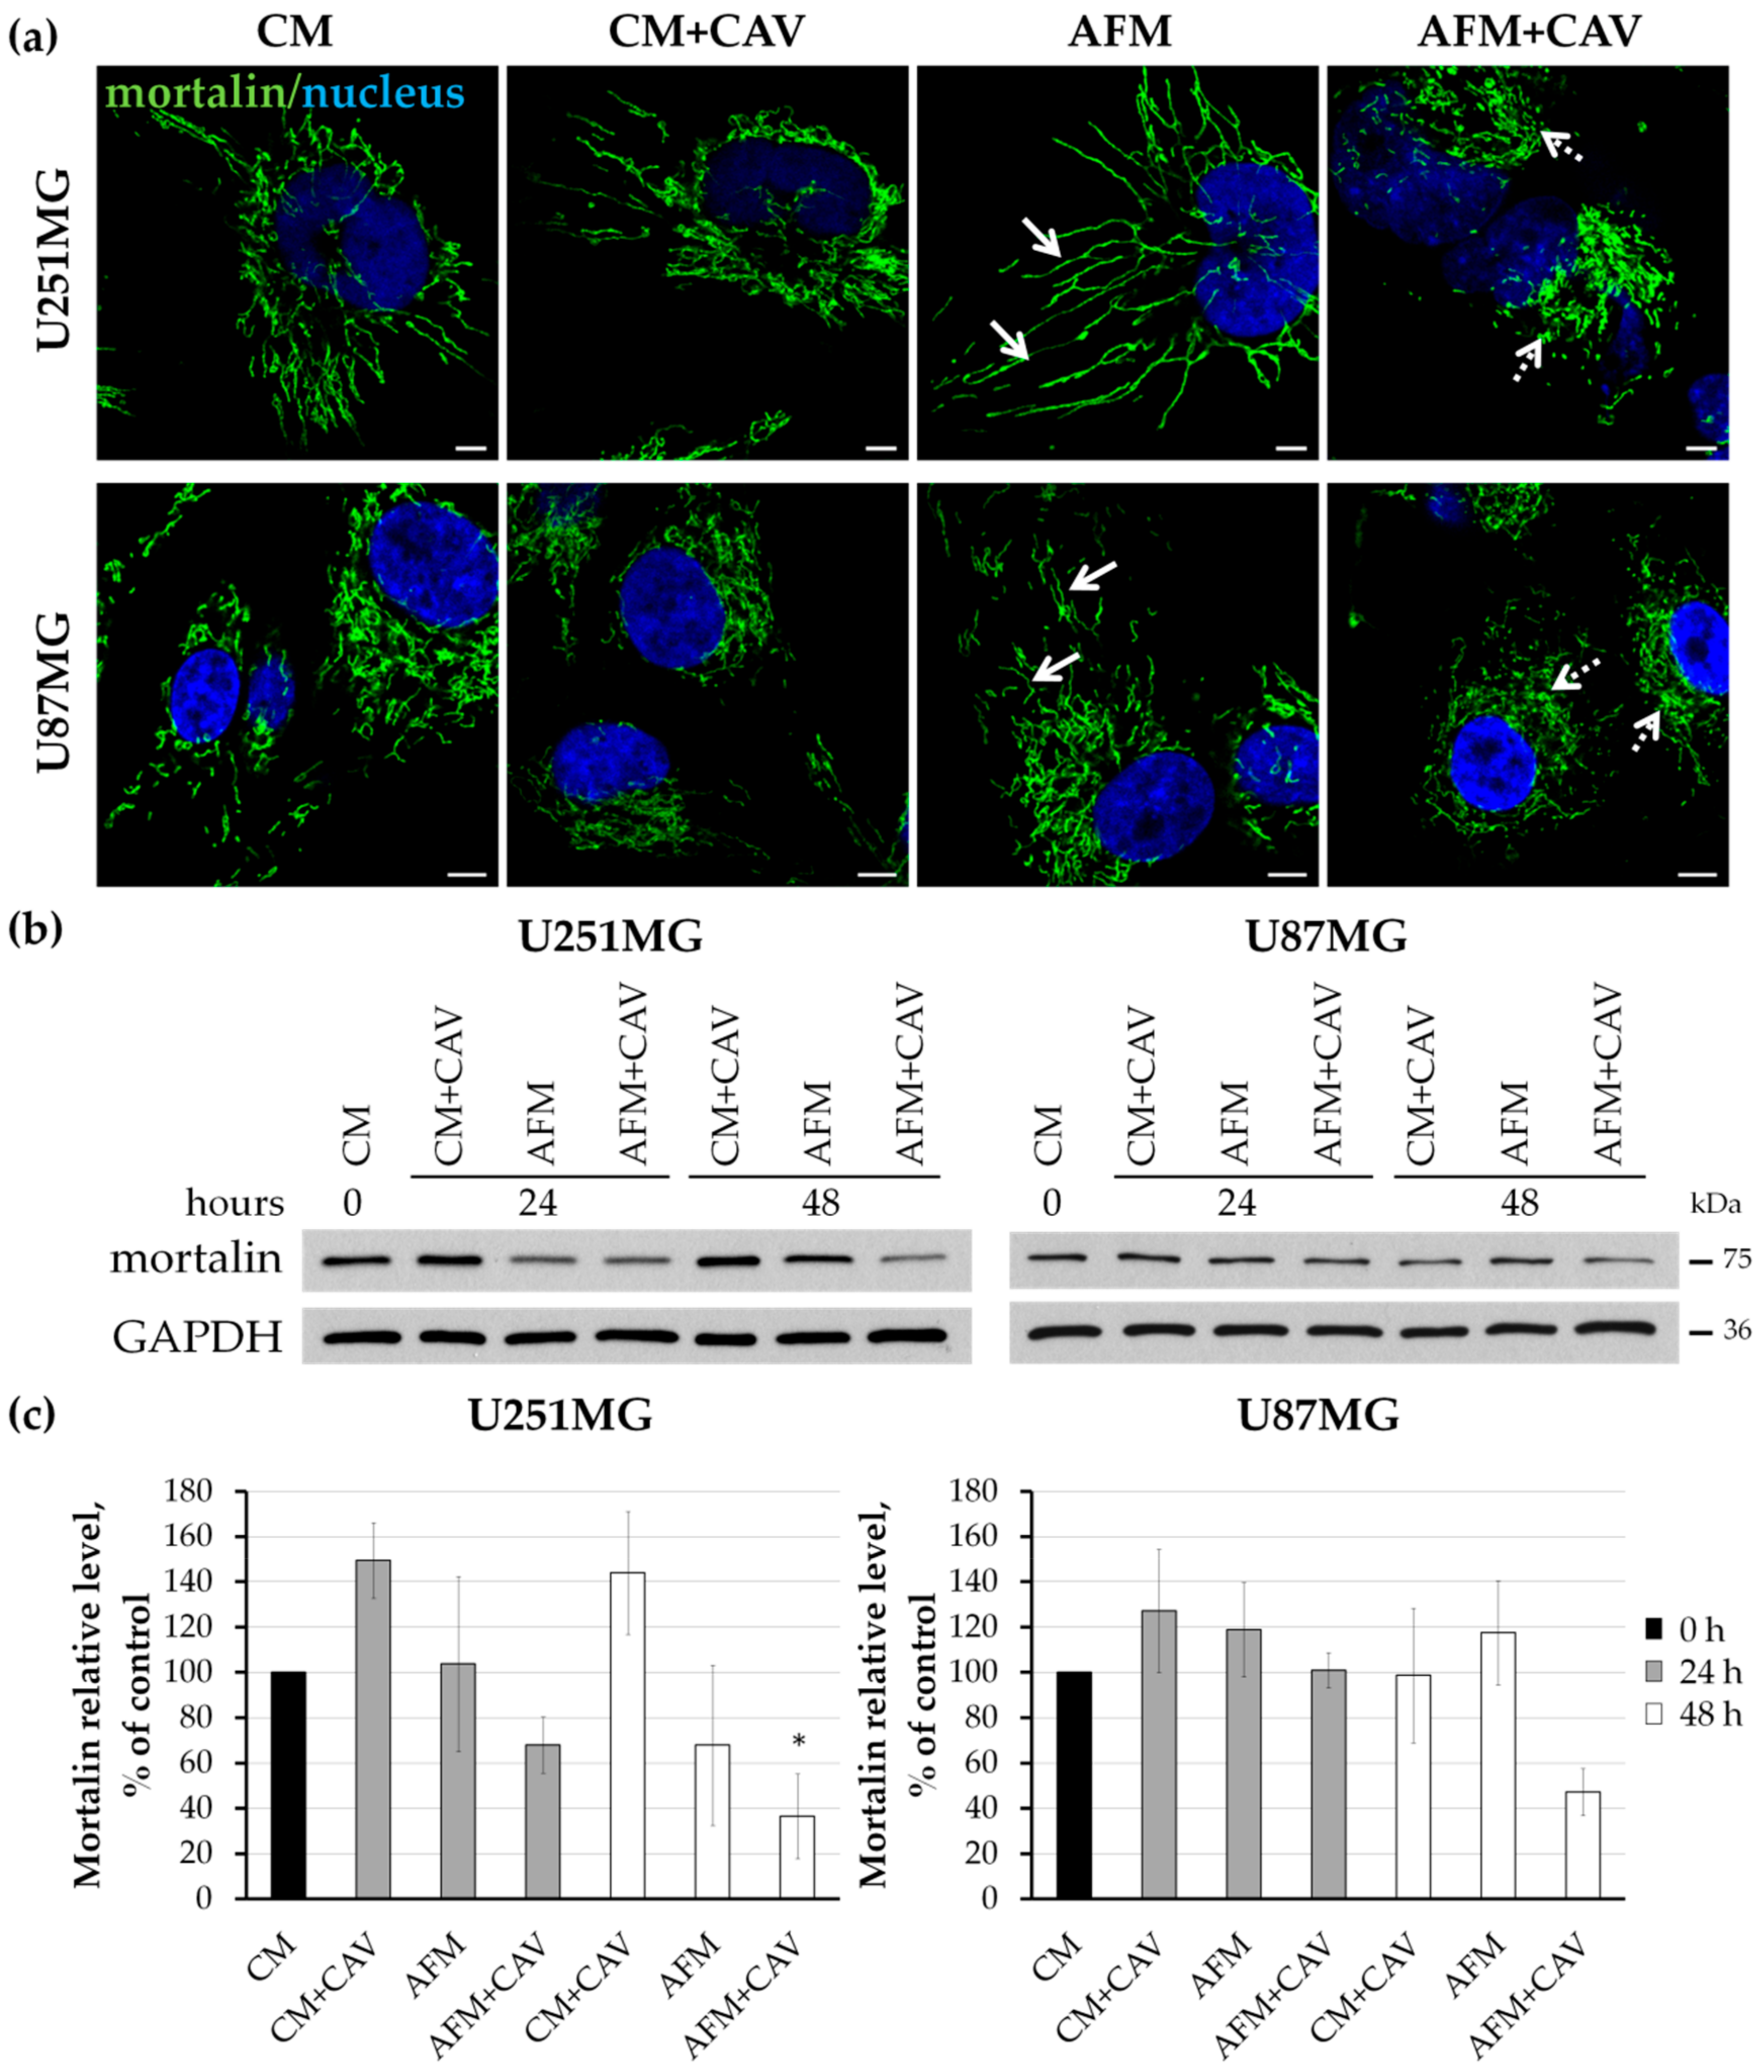
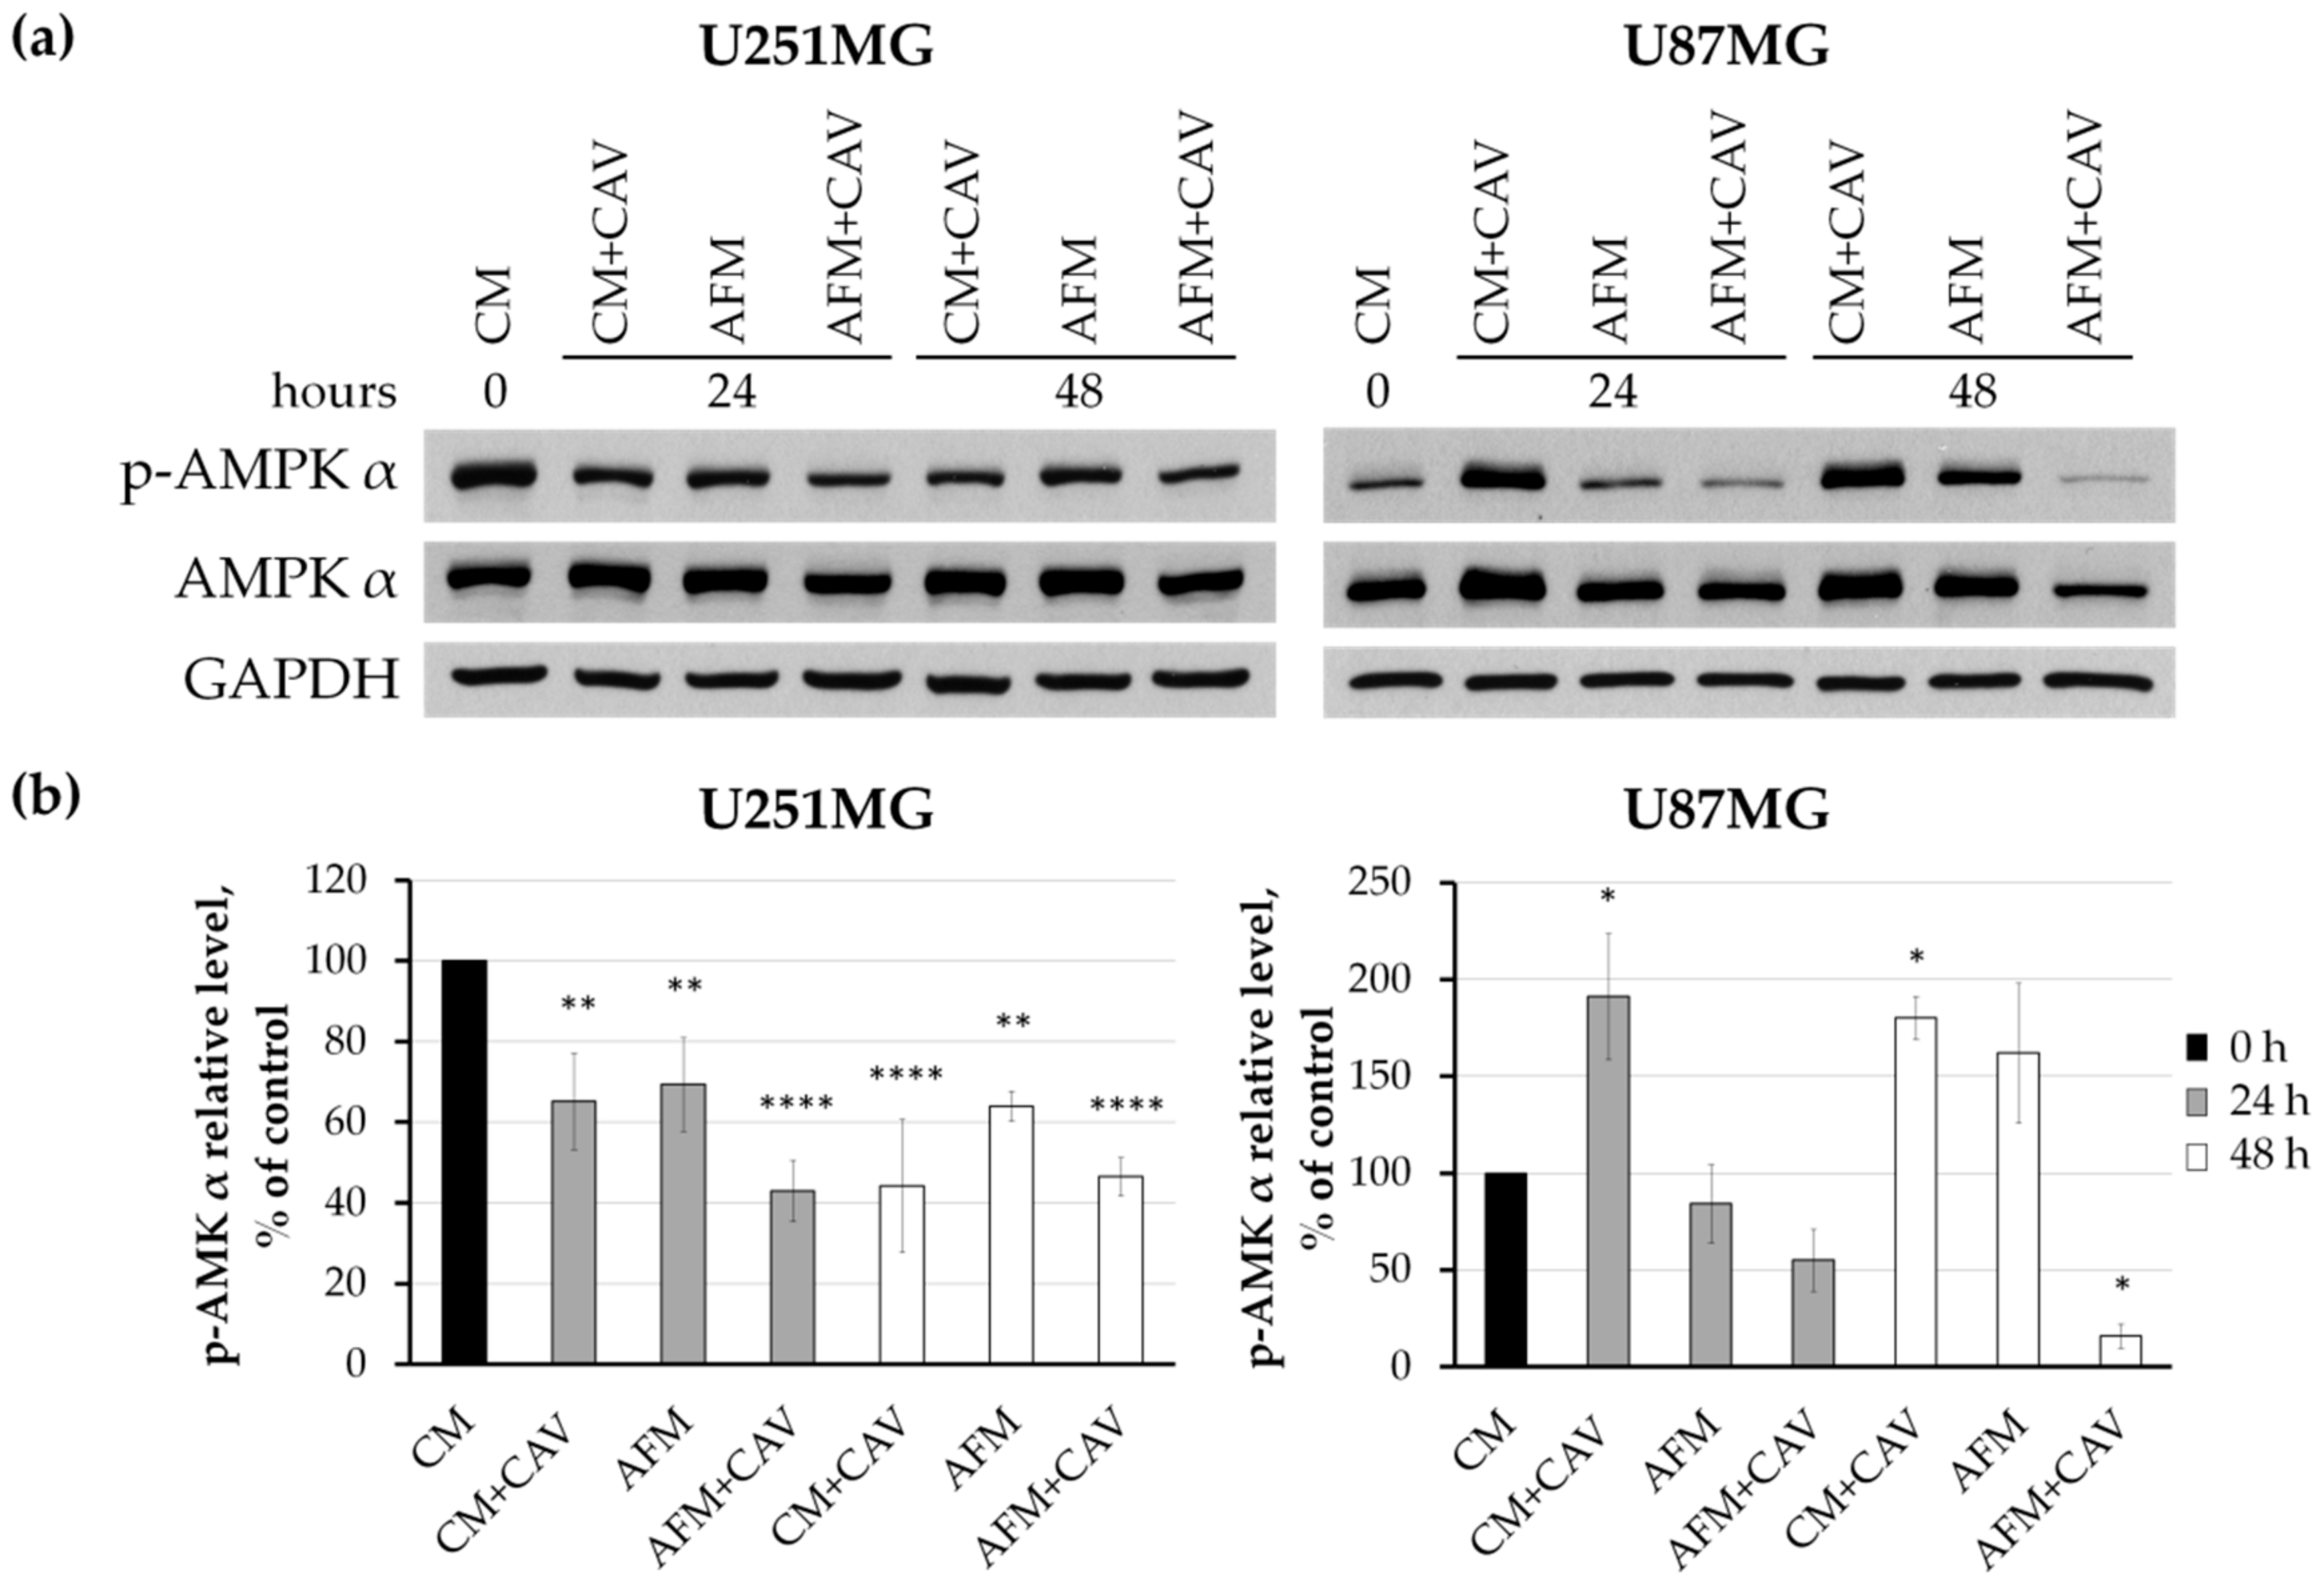
3.6. Canavanine Affects Mitochondria under Arginine Deficiency
4. Discussion
Supplementary Materials
Author Contributions
Funding
Acknowledgments
Conflicts of Interest
References
- Hinrichs, C.N.; Ingargiola, M.; Käubler, T.; Löck, S.; Temme, A.; Köhn-Luque, A.; Deutsch, A.; Vovk, O.; Stasyk, O.; Kunz-Schughart, L.A. Arginine Deprivation Therapy: Putative Strategy to Eradicate Glioblastoma Cells by Radiosensitization. Mol. Cancer Ther. 2018, 17, 393–406. [Google Scholar] [CrossRef] [PubMed] [Green Version]
- Tapiero, H.; Mathé, G.; Couvreur, P.; Tew, K.D.I. Arginine. Biomed. Pharmacother. 2002, 56, 439–445. [Google Scholar] [CrossRef]
- Tabe, Y.; Lorenzi, P.L.; Konopleva, M. Amino acid metabolism in hematologic malignancies and the era of targeted therapy. Blood 2019, 134, 1014–1023. [Google Scholar] [CrossRef] [PubMed]
- Riess, C.; Shokraie, F.; Classen, C.F.; Kreikemeyer, B.; Fiedler, T.; Junghanss, C.; Maletzki, C. Arginine-Depleting Enzymes—An Increasingly Recognized Treatment Strategy for Therapy-Refractory Malignancies. Cell. Physiol. Biochem. 2018, 51, 854–870. [Google Scholar] [CrossRef]
- Patil, M.D.; Bhaumik, J.; Babykutty, S.; Banerjee, U.C.; Fukumura, D. Arginine dependence of tumor cells: Targeting a chink in cancer’s armor. Oncogene 2016, 35, 4957–4972. [Google Scholar] [CrossRef]
- Vynnytska-Myronovska, B.; Bobak, Y.; Garbe, Y.; Dittfeld, C.; Stasyk, O.; Kunz-Schughart, L.A. Single amino acid arginine starvation efficiently sensitizes cancer cells to canavanine treatment and irradiation. Int. J. Cancer 2012, 130, 2164–2175. [Google Scholar] [CrossRef]
- Karatsai, O.; Stasyk, O.; Redowicz, M.J. Effects of Arginine and Its Deprivation on Human Glioblastoma Physiology and Signaling. Adv. Exp. Med. Biol. 2020, 1202, 243–258. [Google Scholar] [CrossRef]
- Szefel, J.; Danielak, A.; Kruszewski, W.J. Metabolic pathways of L-arginine and therapeutic consequences in tumors. Adv. Med. Sci. 2019, 64, 104–110. [Google Scholar] [CrossRef]
- Mörén, L.; Perryman, R.; Crook, T.; Langer, J.K.; Oneill, K.; Syed, N.; Antti, H. Metabolomic profiling identifies distinct phenotypes for ASS1 positive and negative GBM. BMC Cancer 2018, 18, 167. [Google Scholar] [CrossRef] [Green Version]
- Feun, L.; You, M.; Wu, C.J.; Kuo, M.T.; Wangpaichitr, M.; Spector, S.; Savaraj, N. Arginine Deprivation as a Targeted Therapy for Cancer. Curr. Pharm. Des. 2008, 14, 1049–1057. [Google Scholar] [CrossRef] [Green Version]
- Syed, N.; Langer, J.; Janczar, K.; Singh, P.; Nigro, C.L.; Lattanzio, L.; Coley, H.M.; Hatzimichael, E.; Bomalaski, J.; Szlosarek, P.; et al. Epigenetic status of argininosuccinate synthetase and argininosuccinate lyase modulates autophagy and cell death in glioblastoma. Cell Death Dis. 2013, 4, e458. [Google Scholar] [CrossRef] [PubMed] [Green Version]
- Cheng, C.-T.; Qi, Y.; Wang, Y.-C.; Chi, K.K.; Chung, Y.; Ouyang, C.; Chen, Y.-R.; Oh, M.E.; Sheng, X.; Tang, Y.; et al. Arginine starvation kills tumor cells through aspartate exhaustion and mitochondrial dysfunction. Commun. Biol. 2018, 1. [Google Scholar] [CrossRef] [PubMed] [Green Version]
- Vynnytska, B.; Mayevska, O.; Kurlishchuk, Y.; Bobak, Y.; Stasyk, O. Canavanine augments proapoptotic effects of arginine deprivation in cultured human cancer cells. Anti-Cancer Drugs 2011, 22, 148–157. [Google Scholar] [CrossRef]
- Phillips, M.M.; Sheaff, M.T.; Szlosarek, P.W. Targeting arginine-dependent cancers with arginine-degrading enzymes: Opportunities and challenges. Cancer Res. Treat. 2013, 45, 251–262. [Google Scholar] [CrossRef]
- Stasyk, O.V.; Boretsky, Y.R.; Gonchar, M.V.; Sibirny, A.A. Recombinant arginine-degrading enzymes in metabolic anticancer therapy and bioanalytics. Cell Biol. Int. 2015, 39, 246–252. [Google Scholar] [CrossRef] [PubMed]
- Glazer, E.S.; Piccirillo, M.; Albino, V.; Di Giacomo, R.; Palaia, R.; Mastro, A.A.; Beneduce, G.; Castello, G.; De Rosa, V.; Petrillo, A.; et al. Phase II Study of Pegylated Arginine Deiminase for Nonresectable and Metastatic Hepatocellular Carcinoma. J. Clin. Oncol. 2010, 28, 2220–2226. [Google Scholar] [CrossRef]
- Ott, P.A.; Carvajal, R.D.; Pandit-Taskar, N.; Jungbluth, A.A.; Hoffman, E.W.; Wu, B.-W.; Bomalaski, J.S.; Venhaus, R.; Pan, L.; Old, L.J.; et al. Phase I/II study of pegylated arginine deiminase (ADI-PEG 20) in patients with advanced melanoma. Investig. New Drugs 2013, 31, 425–434. [Google Scholar] [CrossRef] [Green Version]
- Szlosarek, P.W.; Steele, J.P.; Nolan, L.; Gilligan, D.; Taylor, P.; Spicer, J.; Lind, M.; Mitra, S.; Shamash, J.; Phillips, M.M.; et al. Arginine Deprivation With Pegylated Arginine Deiminase in Patients With Argininosuccinate Synthetase 1–Deficient Malignant Pleural Mesothelioma: A Randomized Clinical Trial. JAMA Oncol. 2017, 3, 58–66. [Google Scholar] [CrossRef]
- Beddowes, E.; Spicer, J.; Chan, P.Y.; Khadeir, R.; Corbacho, J.G.; Repana, D.; Steele, J.P.; Schmid, P.; Szyszko, T.; Cook, G.; et al. Phase 1 Dose-Escalation Study of Pegylated Arginine Deiminase, Cisplatin, and Pemetrexed in Patients With Argininosuccinate Synthetase 1-Deficient Thoracic Cancers. J. Clin. Oncol. 2017, 35, 1778–1785. [Google Scholar] [CrossRef] [Green Version]
- Lowery, M.A.; Yu, K.H.; Kelsen, D.P.; Harding, J.J.; Bomalaski, J.S.; Glassman, D.C.; Covington, C.M.; Brenner, R.; Hollywood, E.; Barba, A.; et al. A phase 1/1B trial of ADI-PEG 20 plus nab-paclitaxel and gemcitabine in patients with advanced pancreatic adenocarcinoma. Cancer 2017, 123, 4556–4565. [Google Scholar] [CrossRef]
- Harding, J.J.; Do, R.K.; Dika, I.E.; Hollywood, E.; Uhlitskykh, K.; Valentino, E.; Wan, P.; Hamilton, C.; Feng, X.; Johnston, A.; et al. A phase 1 study of ADI-PEG 20 and modified FOLFOX6 in patients with advanced hepatocellular carcinoma and other gastrointestinal malignancies. Cancer Chemother. Pharmacol. 2018, 82, 429–440. [Google Scholar] [CrossRef] [PubMed]
- Abou-Alfa, G.K.; Qin, S.; Ryoo, B.-Y.; Lu, S.-N.; Yen, C.-J.; Feng, Y.-H.; Lim, H.Y.; Izzo, F.; Colombo, M.; Sarker, D.; et al. Phase III randomized study of second line ADI-PEG 20 plus best supportive care versus placebo plus best supportive care in patients with advanced hepatocellular carcinoma. Ann. Oncol. 2018, 29, 1402–1408. [Google Scholar] [CrossRef] [PubMed]
- Khoury, O.; Ghazale, N.; Stone, E.; El-Sibai, M.; Frankel, A.E.; Abi-Habib, R.J. Human recombinant arginase I (Co)-PEG5000 [HuArgI (Co)-PEG5000]-induced arginine depletion is selectively cytotoxic to human glioblastoma cells. J. Neurooncol. 2015, 122, 75–85. [Google Scholar] [CrossRef] [PubMed]
- Fiedler, T.; Strauss, M.; Hering, S.; Redanz, U.; William, D.; Rosche, Y.; Classen, C.F.; Kreikemeyer, B.; Linnebacher, M.; Maletzki, C. Arginine deprivation by arginine deiminase of Streptococcus pyogenes controls primary glioblastoma growth in vitro and in vivo. Cancer Biol. Ther. 2015, 16, 1047–1055. [Google Scholar] [CrossRef] [Green Version]
- Pavlyk, I.; Rzhepetskyy, Y.; Jagielski, A.K.; Drozak, J.; Wasik, A.; Pereverzieva, G.; Olchowik, M.; Kunz-Schugart, L.A.; Stasyk, O.; Redowicz, M.J. Arginine deprivation affects glioblastoma cell adhesion, invasiveness and actin cytoskeleton organization by impairment of β-actin arginylation. Amino Acids 2015, 47, 199–212. [Google Scholar] [CrossRef] [Green Version]
- Rosenthal, G.A. l-Canavanine: A higher plant insecticidal allelochemical. Amino Acids 2001, 21, 319–330. [Google Scholar] [CrossRef]
- D’Mello, J.P.F. (Ed.) Amino Acids in Human Nutrition and Health; CAB International: Wallingford, UK, 2012. [Google Scholar] [CrossRef]
- Zawadzka, M.; Kaminska, B. Immunosuppressant FK506 affects multiple signaling pathways and modulates gene expression in astrocytes. Mol. Cell. Neurosci. 2003, 22, 202–209. [Google Scholar] [CrossRef]
- Ong, S.-E.; Mann, M. A practical recipe for stable isotope labeling by amino acids in cell culture (SILAC). Nat. Protoc. 2006, 1, 2650–2660. [Google Scholar] [CrossRef]
- Kelly, R.T.; Page, J.S.; Luo, Q.; Moore, R.J.; Orton, D.J.; Tang, K.; Smith, R.D. Chemically etched open tubular and monolithic emitters for nanoelectrospray ionization mass spectrometry. Anal. Chem. 2006, 78, 7796–7801. [Google Scholar] [CrossRef] [Green Version]
- Wickham, H.; François, R.; Henry, L.; Müller, K.; RStudio. Dplyr: A Grammar of Data Manipulation. 2020. Available online: https://cran.r-project.org/web/packages/dplyr/index.html (accessed on 3 July 2020).
- Silva, J.C.; Gorenstein, M.V.; Li, G.-Z.; Vissers, J.P.C.; Geromanos, S.J. Absolute quantification of proteins by LCMSE: A virtue of parallel MS acquisition. Mol. Cell. Proteom. 2006, 5, 144–156. [Google Scholar] [CrossRef] [Green Version]
- Yu, G.; Wang, L.-G.; Han, Y.; He, Q.-Y. ClusterProfiler: An R package for comparing biological themes among gene clusters. OMICS 2012, 16, 284–287. [Google Scholar] [CrossRef] [PubMed]
- Perez-Riverol, Y.; Csordas, A.; Bai, J.; Bernal-Llinares, M.; Hewapathirana, S.; Kundu, D.J.; Inuganti, A.; Griss, J.; Mayer, G.; Eisenacher, M.; et al. The PRIDE database and related tools and resources in 2019: Improving support for quantification data. Nucleic Acids Res. 2019, 47, D442–D450. [Google Scholar] [CrossRef] [PubMed]
- Merrill, A.E.; Hebert, A.S.; MacGilvray, M.E.; Rose, C.M.; Bailey, D.J.; Bradley, J.C.; Wood, W.W.; El Masri, M.; Westphall, M.S.; Gasch, A.P.; et al. NeuCode labels for relative protein quantification. Mol. Cell Proteom. 2014, 13, 2503–2512. [Google Scholar] [CrossRef] [Green Version]
- CIAAW Commission on Isotopic Abundances and Atomic Weights. Available online: https://ciaaw.org/atomic-masses.htm (accessed on 3 July 2020).
- Li, H.; Lei, B.; Xiang, W.; Wang, H.; Feng, W.; Liu, Y.; Qi, S. Differences in Protein Expression between the U251 and U87 Cell Lines. Turk. Neurosurg. 2017, 27, 894–903. [Google Scholar] [CrossRef] [PubMed] [Green Version]
- Lee, S.H.; Dominguez, R. Regulation of actin cytoskeleton dynamics in cells. Mol. Cells 2010, 29, 311–325. [Google Scholar] [CrossRef]
- Yarar, D.; Waterman-Storer, C.M.; Schmid, S.L. A dynamic actin cytoskeleton functions at multiple stages of clathrin-mediated endocytosis. Mol. Biol. Cell 2005, 16, 964–975. [Google Scholar] [CrossRef] [Green Version]
- Capell, B.C.; Collins, F.S. Human laminopathies: Nuclei gone genetically awry. Nat. Rev. Genet. 2006, 7, 940–952. [Google Scholar] [CrossRef]
- Ho, C.Y.; Lammerding, J. Lamins at a glance. J. Cell Sci. 2012, 125, 2087–2093. [Google Scholar] [CrossRef] [Green Version]
- Dechat, T.; Adam, S.A.; Taimen, P.; Shimi, T.; Goldman, R.D. Nuclear Lamins. Cold Spring Harb. Perspect. Biol. 2010, 2. [Google Scholar] [CrossRef] [Green Version]
- Burke, B. Lamins and Apoptosis: A Two-Way Street? J. Cell Biol. 2001, 153, F5–F7. [Google Scholar] [CrossRef] [Green Version]
- Bravo-Cordero, J.J.; Hodgson, L.; Condeelis, J. Directed Cell Invasion and Migration During Metastasis. Curr. Opin. Cell Biol. 2012, 24, 277–283. [Google Scholar] [CrossRef] [PubMed] [Green Version]
- Mayevska, O.; Chen, O.; Karatsai, O.; Bobak, Y.; Barska, M.; Lyniv, L.; Pavlyk, I.; Rzhepetskyy, Y.; Igumentseva, N.; Redowicz, M.J.; et al. Nitric oxide donor augments antineoplastic effects of arginine deprivation in human melanoma cells. Exp. Cell Res. 2017, 355, 162–171. [Google Scholar] [CrossRef]
- Pijuan, J.; Barceló, C.; Moreno, D.F.; Maiques, O.; Sisó, P.; Marti, R.M.; Macià, A.; Panosa, A. In vitro Cell Migration, Invasion, and Adhesion Assays: From Cell Imaging to Data Analysis. Front. Cell Dev. Biol. 2019, 7. [Google Scholar] [CrossRef] [PubMed] [Green Version]
- Lodish, H.; Berk, A.; Zipursky, S.L.; Matsudaira, P.; Baltimore, D.; Darnell, J. Cell-Matrix Adhesion. In Molecular Cell Biology, 4th ed.; W.H. Freeman: New York, NY, USA, 2000. Available online: https://www.ncbi.nlm.nih.gov/books/NBK21539/ (accessed on 23 October 2019).
- Matsunaga, T.; Iyoda, T.; Fukai, F. Chapter 12—Adhesion-dependent cell Regulation via Adhesion molecule, integrin: Therapeutic application of integrin activation-modulating factors. In Colloid and Interface Science in Pharmaceutical Research and Development; Ohshima, H., Makino, K., Eds.; Elsevier: Amsterdam, The Netherlands, 2014; pp. 243–260. [Google Scholar] [CrossRef]
- Goodman, S.R. (Ed.) Chapter 6—Cell Adhesion and the Extracellular Matrix. In Medical Cell Biology, 3rd ed.; Academic Press: Cambridge, MA, USA, 2008; pp. 191–225. [Google Scholar] [CrossRef]
- Chin, Y.R.; Toker, A. Function of Akt/PKB signaling to cell motility, invasion and the tumor stroma in cancer. Cell. Signal. 2009, 21, 470–476. [Google Scholar] [CrossRef] [PubMed] [Green Version]
- Boccafoschi, F.; Bosetti, M.; Sandra, P.M.; Leigheb, M.; Cannas, M. Effects of mechanical stress on cell adhesion: A possible mechanism for morphological changes. Cell Adhes. Migr. 2010, 4, 19–25. [Google Scholar] [CrossRef] [Green Version]
- Fayard, E.; Tintignac, L.A.; Baudry, A.; Hemmings, B.A. Protein kinase B/Akt at a glance. J. Cell Sci. 2005, 118, 5675–5678. [Google Scholar] [CrossRef] [Green Version]
- Hart, J.R.; Vogt, P.K. Phosphorylation of AKT: A Mutational Analysis. Oncotarget 2011, 2, 467–476. [Google Scholar] [CrossRef] [Green Version]
- Kelstrup, C.D.; Jersie-Christensen, R.R.; Batth, T.S.; Arrey, T.N.; Kuehn, A.; Kellmann, M.; Olsen, J.V. Rapid and deep proteomes by faster sequencing on a benchtop quadrupole ultra-high-field Orbitrap mass spectrometer. J. Proteome Res. 2014, 13, 6187–6195. [Google Scholar] [CrossRef]
- Chou, M.F.; Schwartz, D. Using the scan-x Web site to predict protein post-translational modifications. Curr. Protoc. Bioinform. 2011. [Google Scholar] [CrossRef]
- Bobak, Y.; Kurlishchuk, Y.; Vynnytska-Myronovska, B.; Grydzuk, O.; Shuvayeva, G.; Redowicz, M.J.; Kunz-Schughart, L.A.; Stasyk, O. Arginine deprivation induces endoplasmic reticulum stress in human solid cancer cells. Int. J. Biochem. Cell Boil. 2016, 70, 29–38. [Google Scholar] [CrossRef]
- Wang, M.; Wey, S.; Zhang, Y.; Ye, R.; Lee, A.S. Role of the unfolded protein response regulator GRP78/BiP in development, cancer, and neurological disorders. Antioxid. Redox Signal. 2009, 11, 2307–2316. [Google Scholar] [CrossRef] [PubMed]
- Bernales, S.; Soto, M.M.; McCullagh, E. Unfolded protein stress in the endoplasmic reticulum and mitochondria: A role in neurodegeneration. Front. Aging Neurosci. 2012, 4, 5. [Google Scholar] [CrossRef] [PubMed] [Green Version]
- Van Vliet, A.; Sassano, M.; Agostinis, P. The Unfolded Protein Response and Membrane Contact Sites: Tethering as a Matter of Life and Death? Contact 2018, 1. [Google Scholar] [CrossRef] [Green Version]
- Nguyen, L.; Lucke-Wold, B.P.; Mookerjee, S.A.; Cavendish, J.Z.; Robson, M.J.; Scandinaro, A.L.; Matsumoto, R.R. Role of sigma-1 receptors in neurodegenerative diseases. J. Pharmacol. Sci. 2015, 127, 17–29. [Google Scholar] [CrossRef] [Green Version]
- Tissue Expression of ATF4—Summary—The Human Protein Atlas. Available online: https://v18.proteinatlas.org/ENSG00000128272-ATF4/tissue (accessed on 15 January 2020).
- Tilokani, L.; Nagashima, S.; Paupe, V.; Prudent, J. Mitochondrial dynamics: Overview of molecular mechanisms. Essays Biochem. 2018, 62, 341–360. [Google Scholar] [CrossRef] [Green Version]
- Kühlbrandt, W. Structure and function of mitochondrial membrane protein complexes. BMC Biol. 2015, 13, 89. [Google Scholar] [CrossRef] [Green Version]
- Honrath, B.; Culmsee, C.; Dolga, A.M. One protein, different cell fate: The differential outcome of depleting GRP75 during oxidative stress in neurons. Cell Death Dis. 2018, 9, 32. [Google Scholar] [CrossRef] [Green Version]
- Liu, Y.; Zhu, X. Endoplasmic reticulum-mitochondria tethering in neurodegenerative diseases. Transl. Neurodegener. 2017, 6, 21. [Google Scholar] [CrossRef] [Green Version]
- Obacz, J.; Avril, T.; Le Reste, P.-J.; Urra, H.; Quillien, V.; Hetz, C.; Chevet, E. Endoplasmic reticulum proteostasis in glioblastoma-From molecular mechanisms to therapeutic perspectives. Sci. Signal. 2017, 10. [Google Scholar] [CrossRef] [Green Version]
- Glioblastoma Multiforme—Symptoms, Diagnosis and Treatment Options. Available online: https://www.aans.org/en/Patients/Neurosurgical-Conditions-and-Treatments/Glioblastoma-Multiforme (accessed on 2 January 2020).
- Thongkum, A.; Wu, C.; Li, Y.-Y.; Wangpaichitr, M.; Navasumrit, P.; Parnlob, V.; Sricharunrat, T.; Bhudhisawasdi, V.; Ruchirawat, M.; Savaraj, N. The Combination of Arginine Deprivation and 5-Fluorouracil Improves Therapeutic Efficacy in Argininosuccinate Synthetase Negative Hepatocellular Carcinoma. Int. J. Mol. Sci. 2017, 18, 1175. [Google Scholar] [CrossRef] [Green Version]
- Vynnytska-Myronovska, B.; Kurlishchuk, Y.; Bobak, Y.; Dittfeld, C.; Kunz-Schughart, L.A.; Stasyk, O. Three-dimensional environment renders cancer cells profoundly less susceptible to a single amino acid starvation. Amino Acids. 2013, 45, 1221–1230. [Google Scholar] [CrossRef] [PubMed]
- Al-Koussa, H.; Al-Haddad, M.; Abi-Habib, R.; El-Sibai, M. Human Recombinant Arginase I [HuArgI (Co)-PEG5000]-Induced Arginine Depletion Inhibits Colorectal Cancer Cell Migration and Invasion. Int. J. Mol. Sci. 2019, 20, 6018. [Google Scholar] [CrossRef] [PubMed] [Green Version]
- Zhao, X.; Guan, J.-L. Focal adhesion kinase and its signaling pathways in cell migration and angiogenesis. Adv. Drug Deliv. Rev. 2011, 63, 610–615. [Google Scholar] [CrossRef] [PubMed] [Green Version]
- Méjat, A.; Misteli, T. LINC complexes in health and disease. Nucleus 2010, 1, 40–52. [Google Scholar] [CrossRef] [Green Version]
- Shimi, T.; Kittisopikul, M.; Tran, J.; Goldman, A.E.; Adam, S.A.; Zheng, Y.; Jaqaman, K.; Goldman, R.D. Structural organization of nuclear lamins A, C, B1, and B2 revealed by superresolution microscopy. Mol. Biol. Cell. 2015, 26, 4075–4086. [Google Scholar] [CrossRef]
- Lammerding, J.; Fong, L.G.; Ji, J.Y.; Reue, K.; Stewart, C.L.; Young, S.G.; Lee, R.T. Lamins A and C but Not Lamin B1 Regulate Nuclear Mechanics. J. Biol. Chem. 2006, 281, 25768–25780. [Google Scholar] [CrossRef] [Green Version]
- He, B.; Lu, N.; Zhou, Z. Cellular and Nuclear Degradation during Apoptosis. Curr. Opin. Cell Biol. 2009, 21, 900–912. [Google Scholar] [CrossRef] [Green Version]
- Neamati, N.; Fernandez, A.; Wright, S.; Kiefer, J.; McConkey, D.J. Degradation of lamin B1 precedes oligonucleosomal DNA fragmentation in apoptotic thymocytes and isolated thymocyte nuclei. J. Immunol. 1995, 154, 3788–3795. [Google Scholar]
- Vovk, O.; Chen, O.; Igumentseva, N.; Senchuk, O.; Barska, M.; Sybirna, N.; Stasyk, O. Effects of the combined arginase and canavanine treatment on leukemic cells in vitro and in vivo. Ukr. Biochem. J. 2016, 88, 45–55. [Google Scholar] [CrossRef] [Green Version]
- Tang, X.; Keenan, M.M.; Wu, J.; Lin, C.-A.; Dubois, L.; Thompson, J.W.; Freedland, S.J.; Murphy, S.K.; Chi, J.-T. Comprehensive Profiling of Amino Acid Response Uncovers Unique Methionine-Deprived Response Dependent on Intact Creatine Biosynthesis. PLoS Genet. 2015, 11. [Google Scholar] [CrossRef]
- Caso, G.; Mcnurlan, M.A.; Mcmillan, N.D.; Eremin, O.; Garlick, P.J. Tumour cell growth in culture: Dependence on arginine. Clin. Sci. 2004, 107, 371–379. [Google Scholar] [CrossRef] [PubMed] [Green Version]
- Zhang, S.X.; Ma, J.H.; Bhatta, M.; Fliesler, S.J.; Wang, J.J. The Unfolded Protein Response in Retinal Vascular Diseases: Implications and Therapeutic Potential Beyond Protein Folding. Prog. Retin. Eye Res. 2015, 111–131. [Google Scholar] [CrossRef] [PubMed] [Green Version]
- Barnes, P.J. Corticosteroid effects on cell signalling. Eur. Respir. J. 2006, 27, 413–426. [Google Scholar] [CrossRef] [PubMed]
- Zhu, Y.; Chen, G.; Chen, L.; Zhang, W.; Feng, D.; Liu, L.; Chen, Q. Chapter Three—Monitoring Mitophagy in Mammalian Cells. In Methods in Enzymology; Murphy, A.N., Chan, D.C., Eds.; Mitochondrial Function; Academic Press: Cambridge, MA, USA, 2014; Volume 547, pp. 39–55. [Google Scholar] [CrossRef]
- Mijaljica, D.; Prescott, M.; Devenish, R.J. Mitophagy: An overview. In Autophagy—Cancer, Other Pathologies, Inflammation, Immunity, Infection and Aging; Academic Press: Cambridge, MA, USA, 2014; Volume 4, pp. 103–116. [Google Scholar] [CrossRef]
- Zou, S.; Wang, X.; Liu, P.; Ke, C.; Xu, S. Arginine metabolism and deprivation in cancer therapy. Biomed. Pharmacother. 2019, 118, 109210. [Google Scholar] [CrossRef] [PubMed]


| ArgH, 48 h | ArgL, 48 h | CAV, 24 h | CAV, 48 h | |
|---|---|---|---|---|
| % of identifications | ||||
| ArgH | 97.16 ± 0.19 | 33.85 ± 0.86 | 83.59 ± 0.47 | 76.91 ± 0.26 |
| ArgL | 2.78 ± 0.2 | 65.94 ± 0.83 | 6.48 ± 0.44 | 6.3 ± 0.23 |
| CAV | 0.06 ± 0.03 | 0.22 ± 0.04 | 9.93 ± 0.28 | 16.79 ± 0.46 |
| % of total intensity | ||||
| ArgH | 98.72 ± 0.07 | 31.59 ± 0.95 | 90.09 ± 0.39 | 83.48 ± 0.38 |
| ArgL | 1.24 ± 0.06 | 68.34 ± 0.95 | 4.08 ± 0.38 | 3.88 ± 0.63 |
| CAV | 0.04 ± 0 | 0.06 ± 0.01 | 5.83 ± 0.11 | 12.63 ± 0.39 |
© 2020 by the authors. Licensee MDPI, Basel, Switzerland. This article is an open access article distributed under the terms and conditions of the Creative Commons Attribution (CC BY) license (http://creativecommons.org/licenses/by/4.0/).
Share and Cite
Karatsai, O.; Shliaha, P.; Jensen, O.N.; Stasyk, O.; Rędowicz, M.J. Combinatory Treatment of Canavanine and Arginine Deprivation Efficiently Targets Human Glioblastoma Cells via Pleiotropic Mechanisms. Cells 2020, 9, 2217. https://doi.org/10.3390/cells9102217
Karatsai O, Shliaha P, Jensen ON, Stasyk O, Rędowicz MJ. Combinatory Treatment of Canavanine and Arginine Deprivation Efficiently Targets Human Glioblastoma Cells via Pleiotropic Mechanisms. Cells. 2020; 9(10):2217. https://doi.org/10.3390/cells9102217
Chicago/Turabian StyleKaratsai, Olena, Pavel Shliaha, Ole N. Jensen, Oleh Stasyk, and Maria Jolanta Rędowicz. 2020. "Combinatory Treatment of Canavanine and Arginine Deprivation Efficiently Targets Human Glioblastoma Cells via Pleiotropic Mechanisms" Cells 9, no. 10: 2217. https://doi.org/10.3390/cells9102217