Application of Artificial Neural Network to Predict Load Bearing Capacity and Stiffness of Perforated Masonry Walls

 ,
,  , , and
Abstract
:1. Introduction
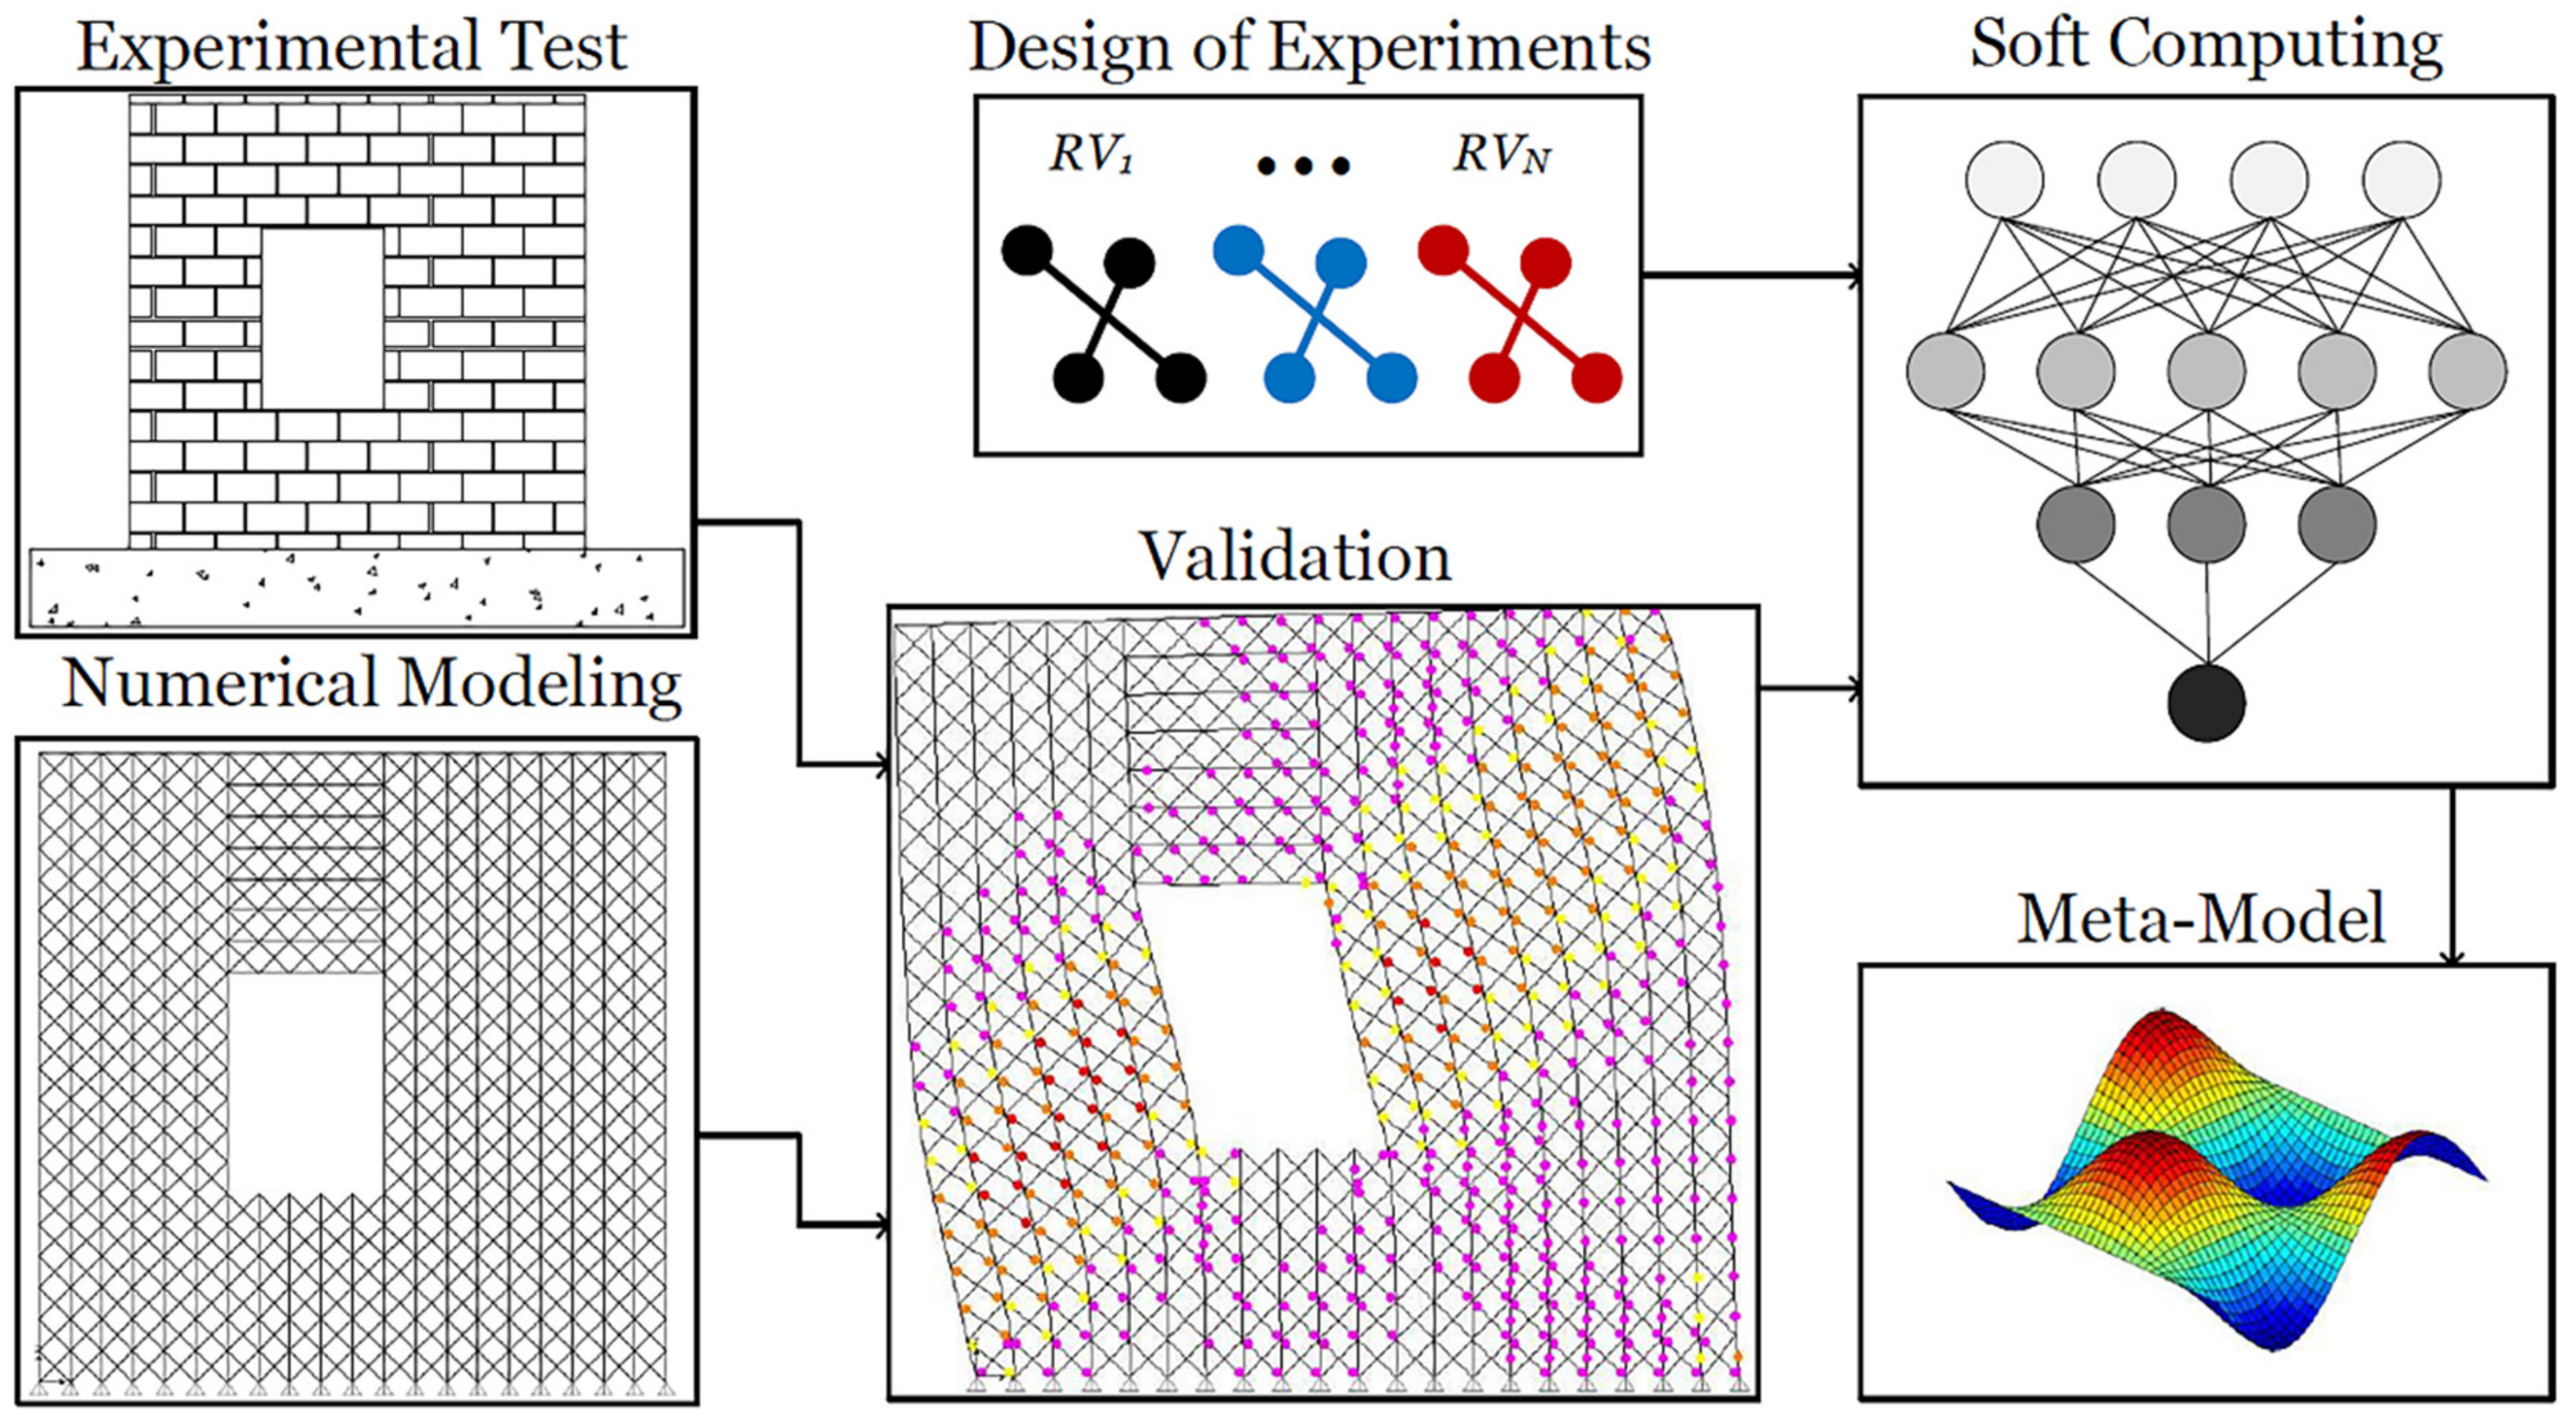
2. Adopted Methodology
2.1. Proposed Discrete Element Method Approach
2.2. Theoretical Basis of the MP Method
2.3. Multi-Pier Algorithm for Perforated and Unreinforced Masonry Wall
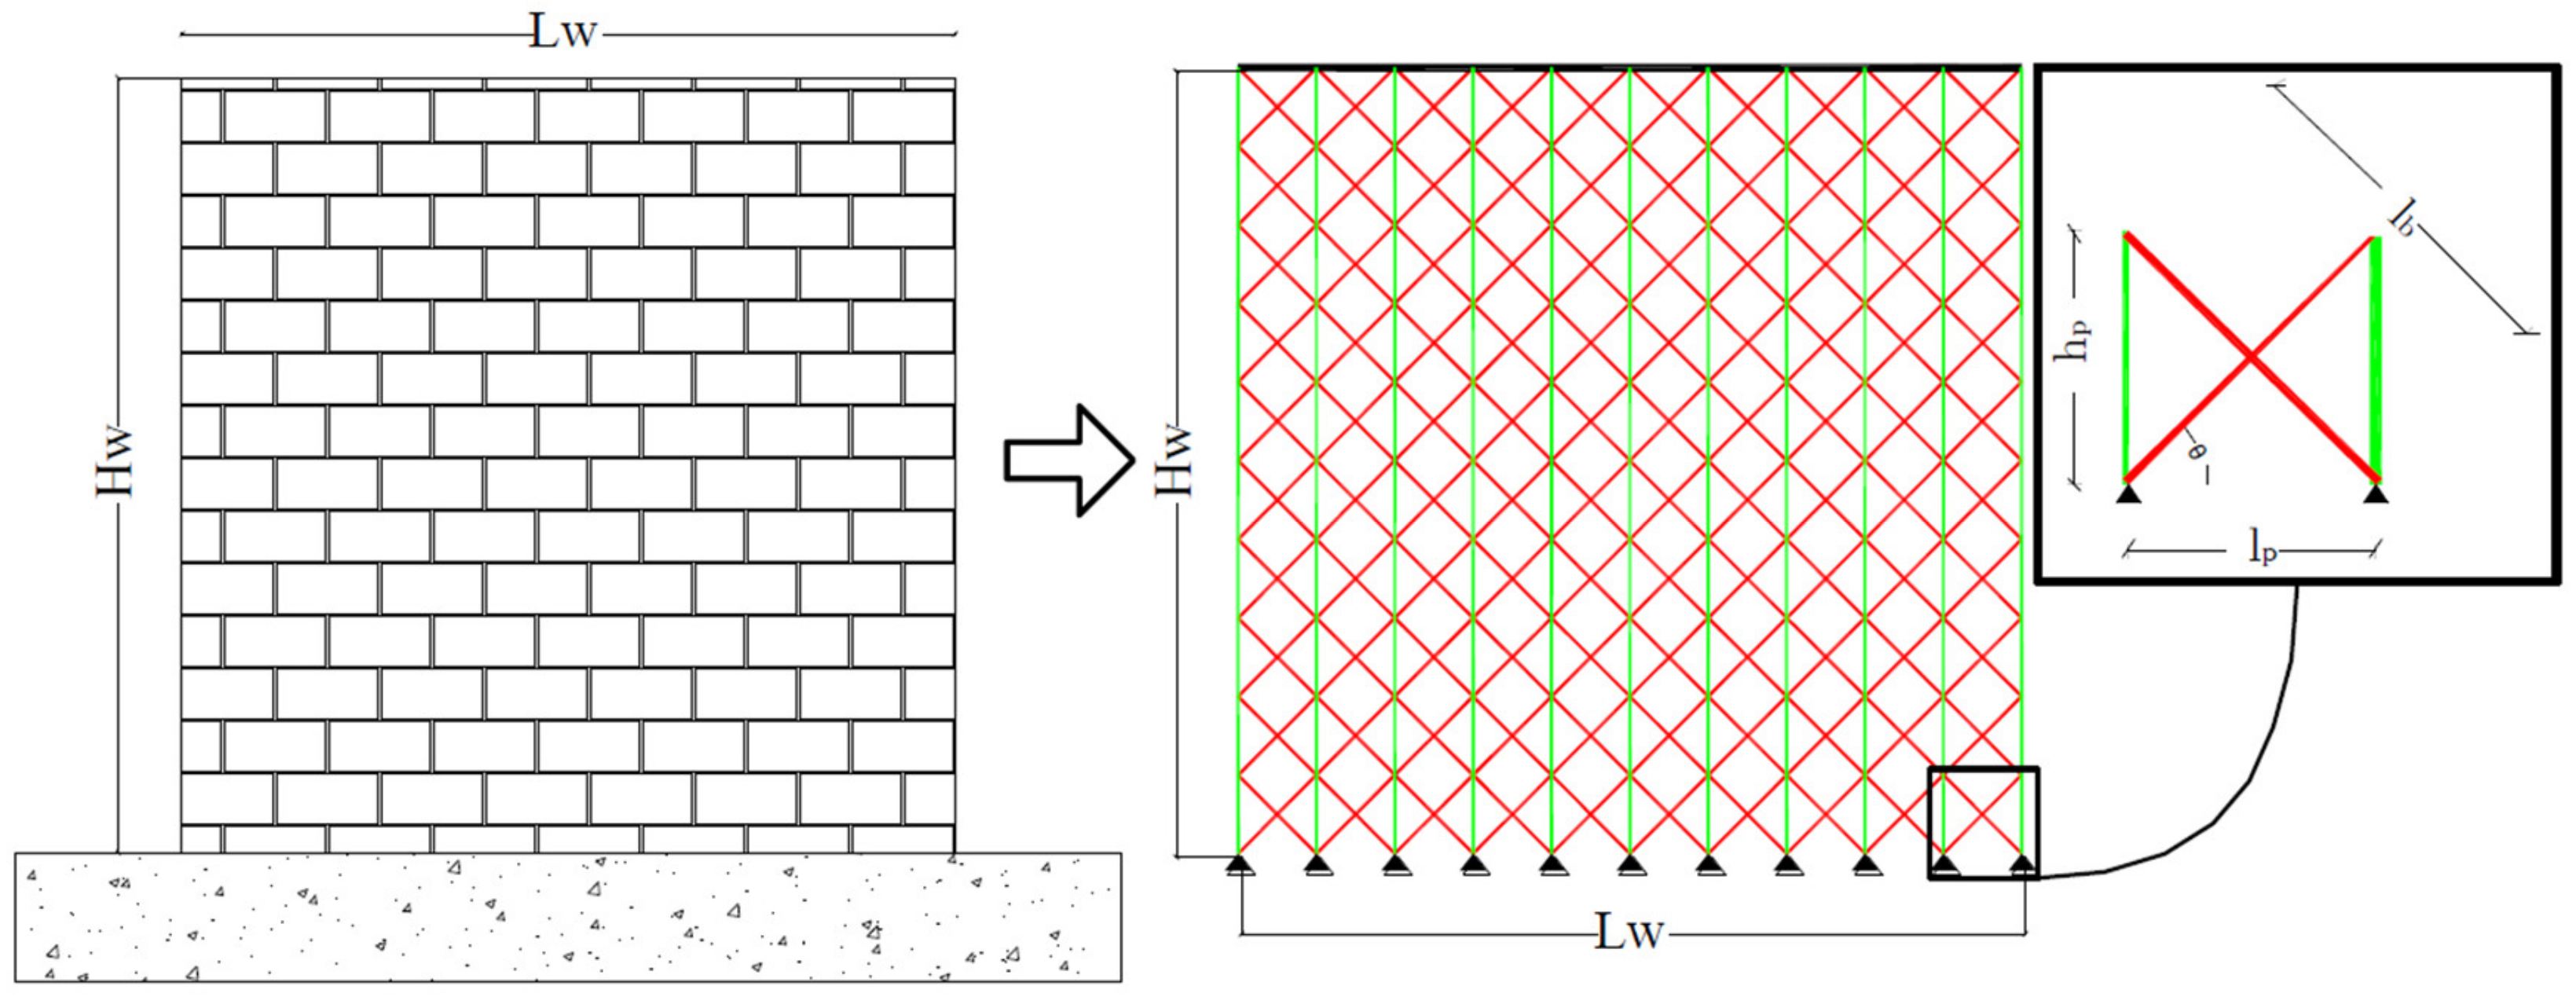
- Split the wall into nearly square cells.
- Create continuous vertical piers with an equal thickness of the wall section for the middle and side piers equal to Equations (6) and (7), respectively.
- Determine the cross-section area of the braces and assign it to the brace elements in the proposed equivalent system, using the Equation (5).
- Evaluate the material characteristics in the non-linear phase and assign them to the members.
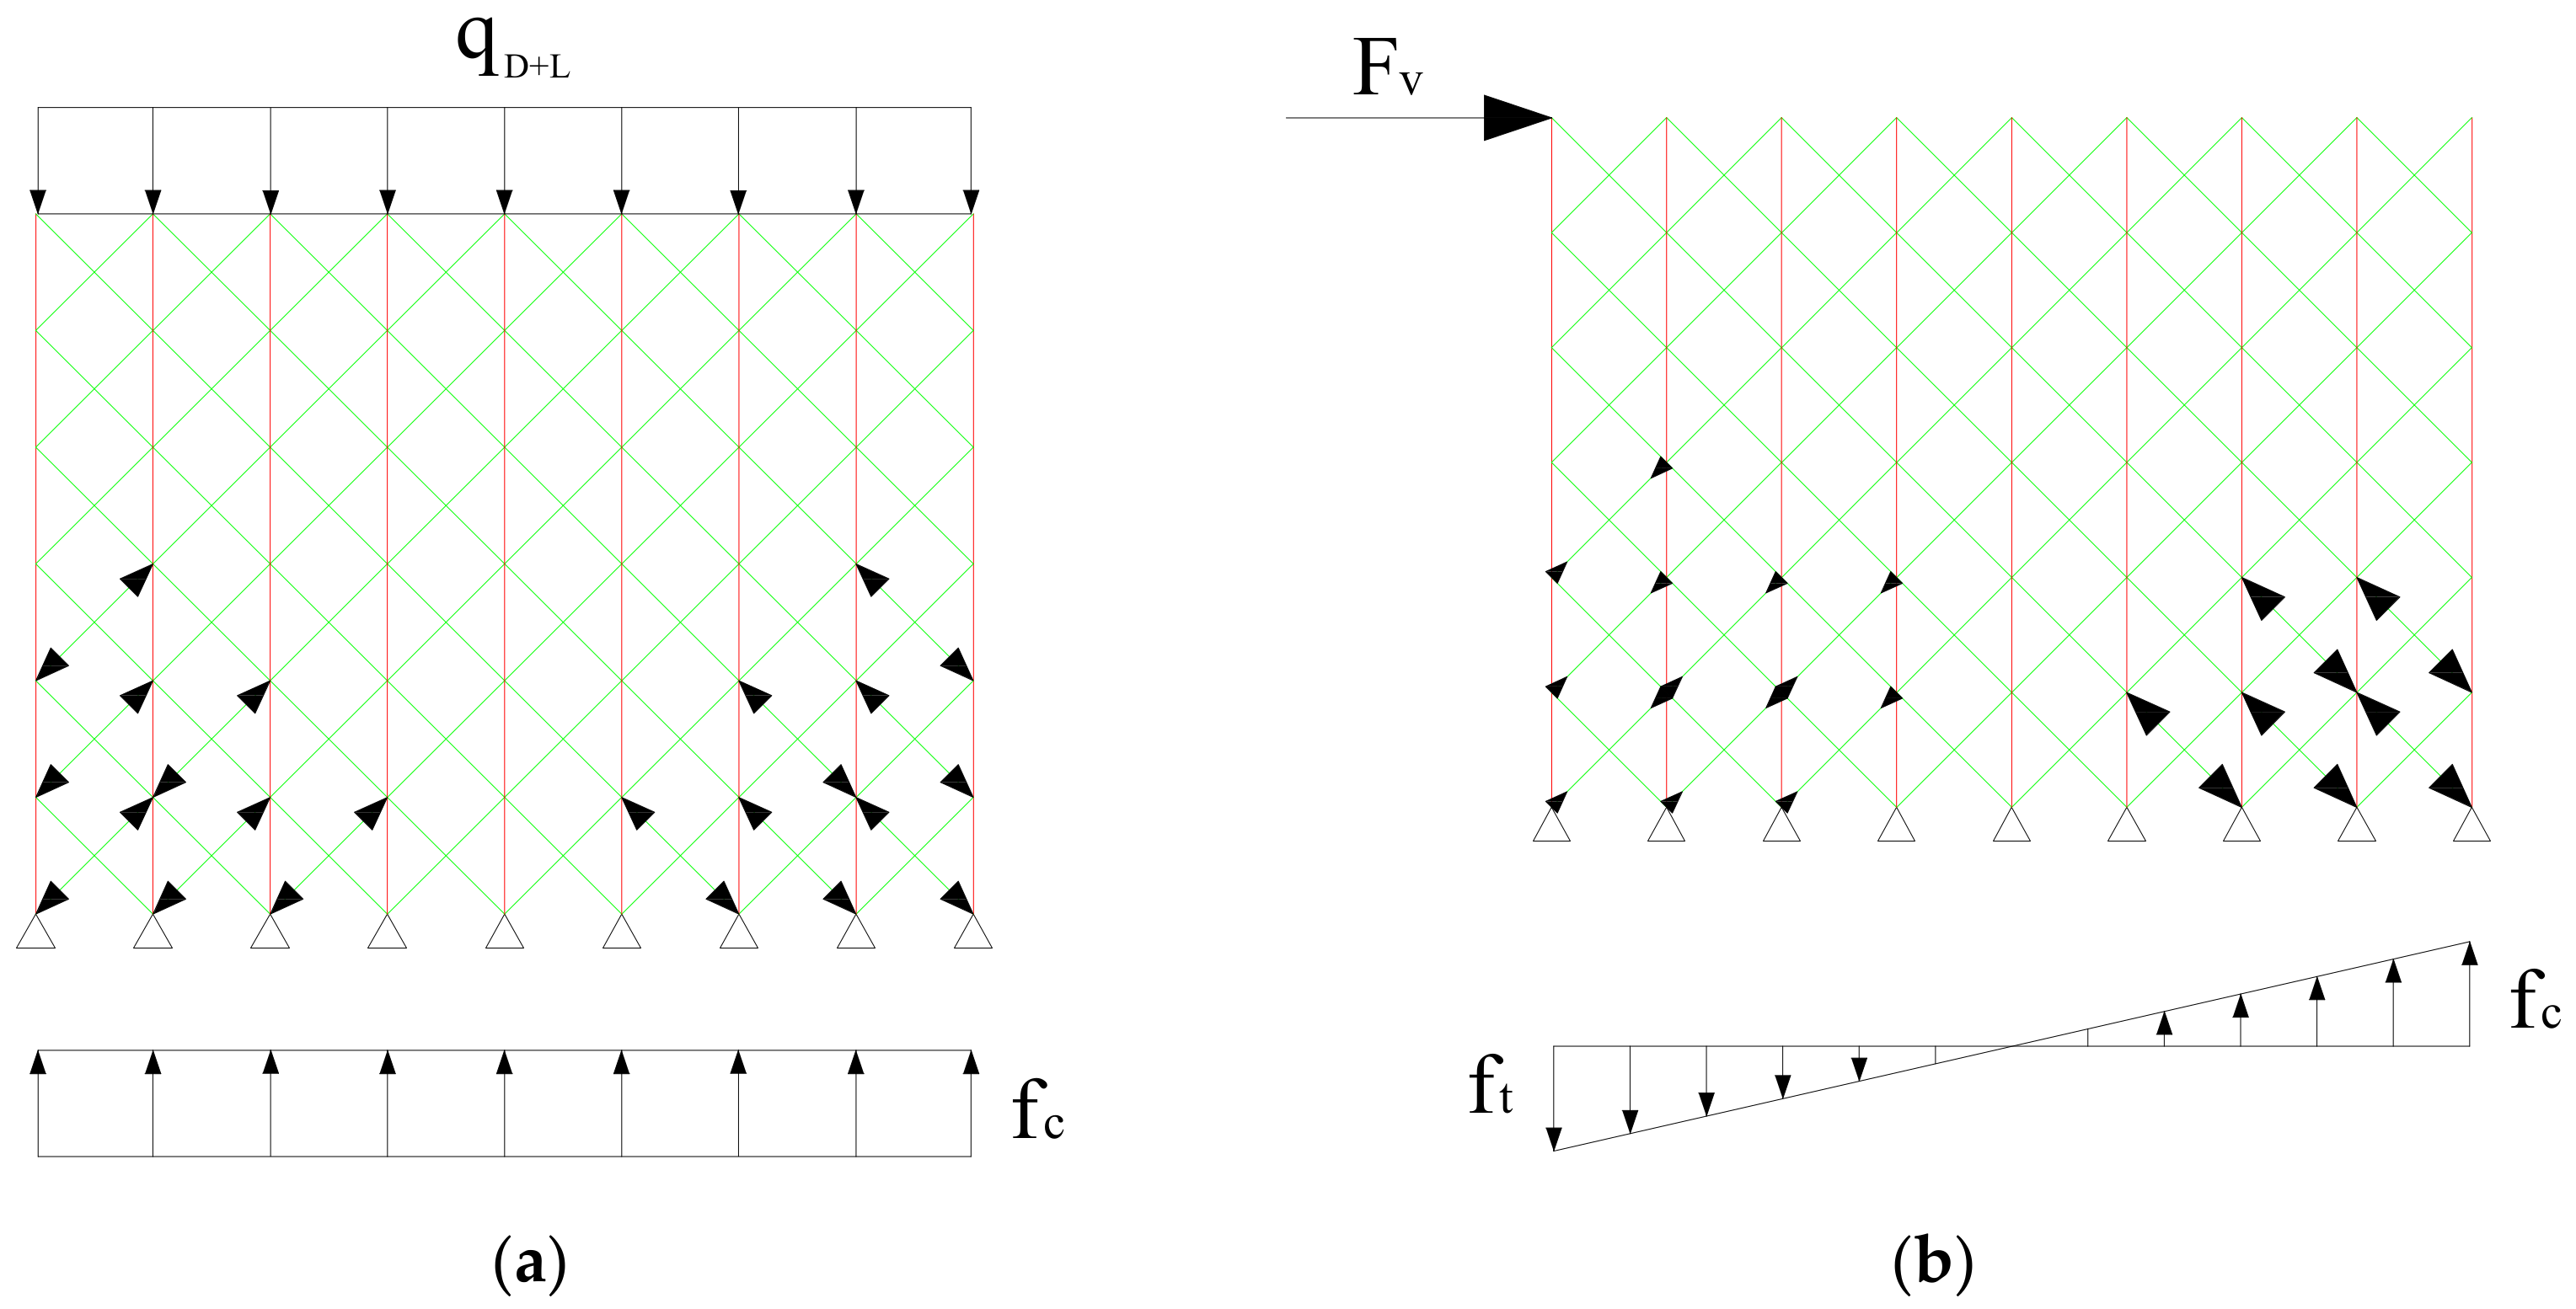
- Analyze the load-control static nonlinear behavior of the wall subjected to the gravity loads.
- Analyze displacement-control static nonlinear response of the wall by applying lateral loads.
- Extract the ultimate load capacity and the related displacement values using the pushover curve. Some correction needs to be implemented in order to utilize the MP method for perforated masonry walls. The equivalent truss system of braces and piers, in which there are spandrels, should be rotated and placed horizontally to sustain horizontal stresses.
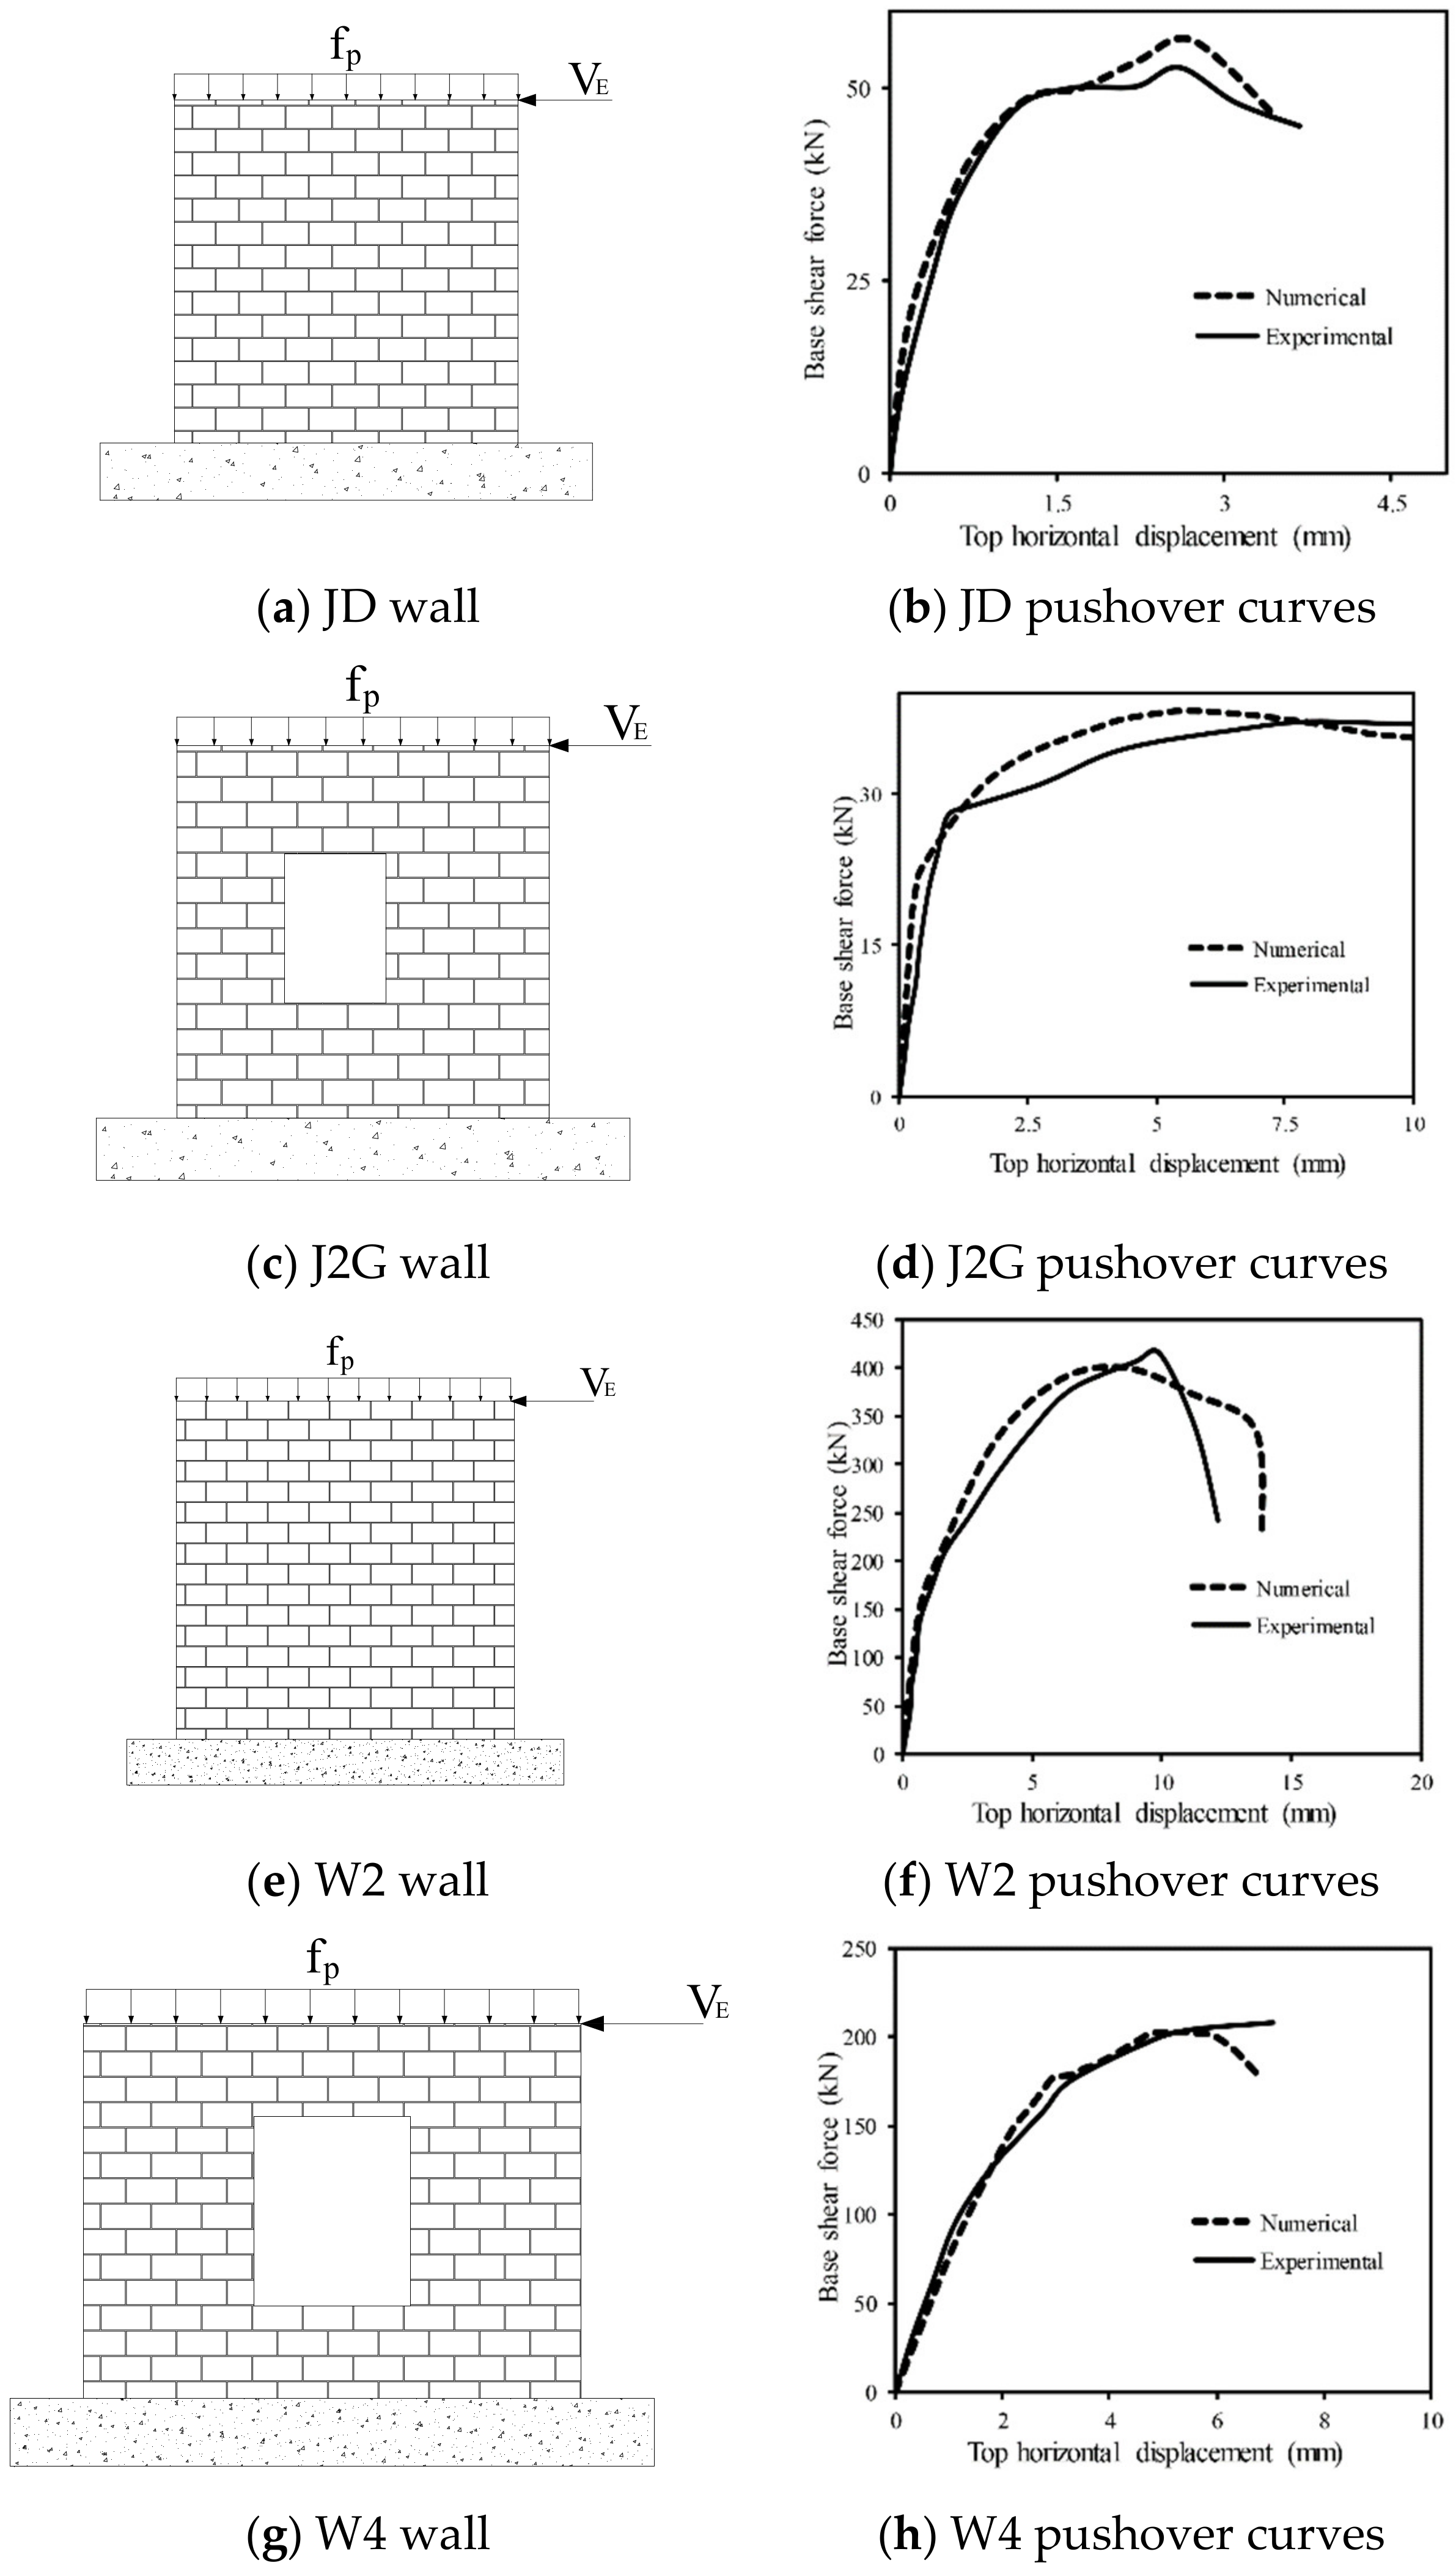
2.4. Validation of MP Modeling with Experimental Data
2.5. Generating Database by Numerical Simulation for ANN Application
3. Artificial Neural Network Analysis
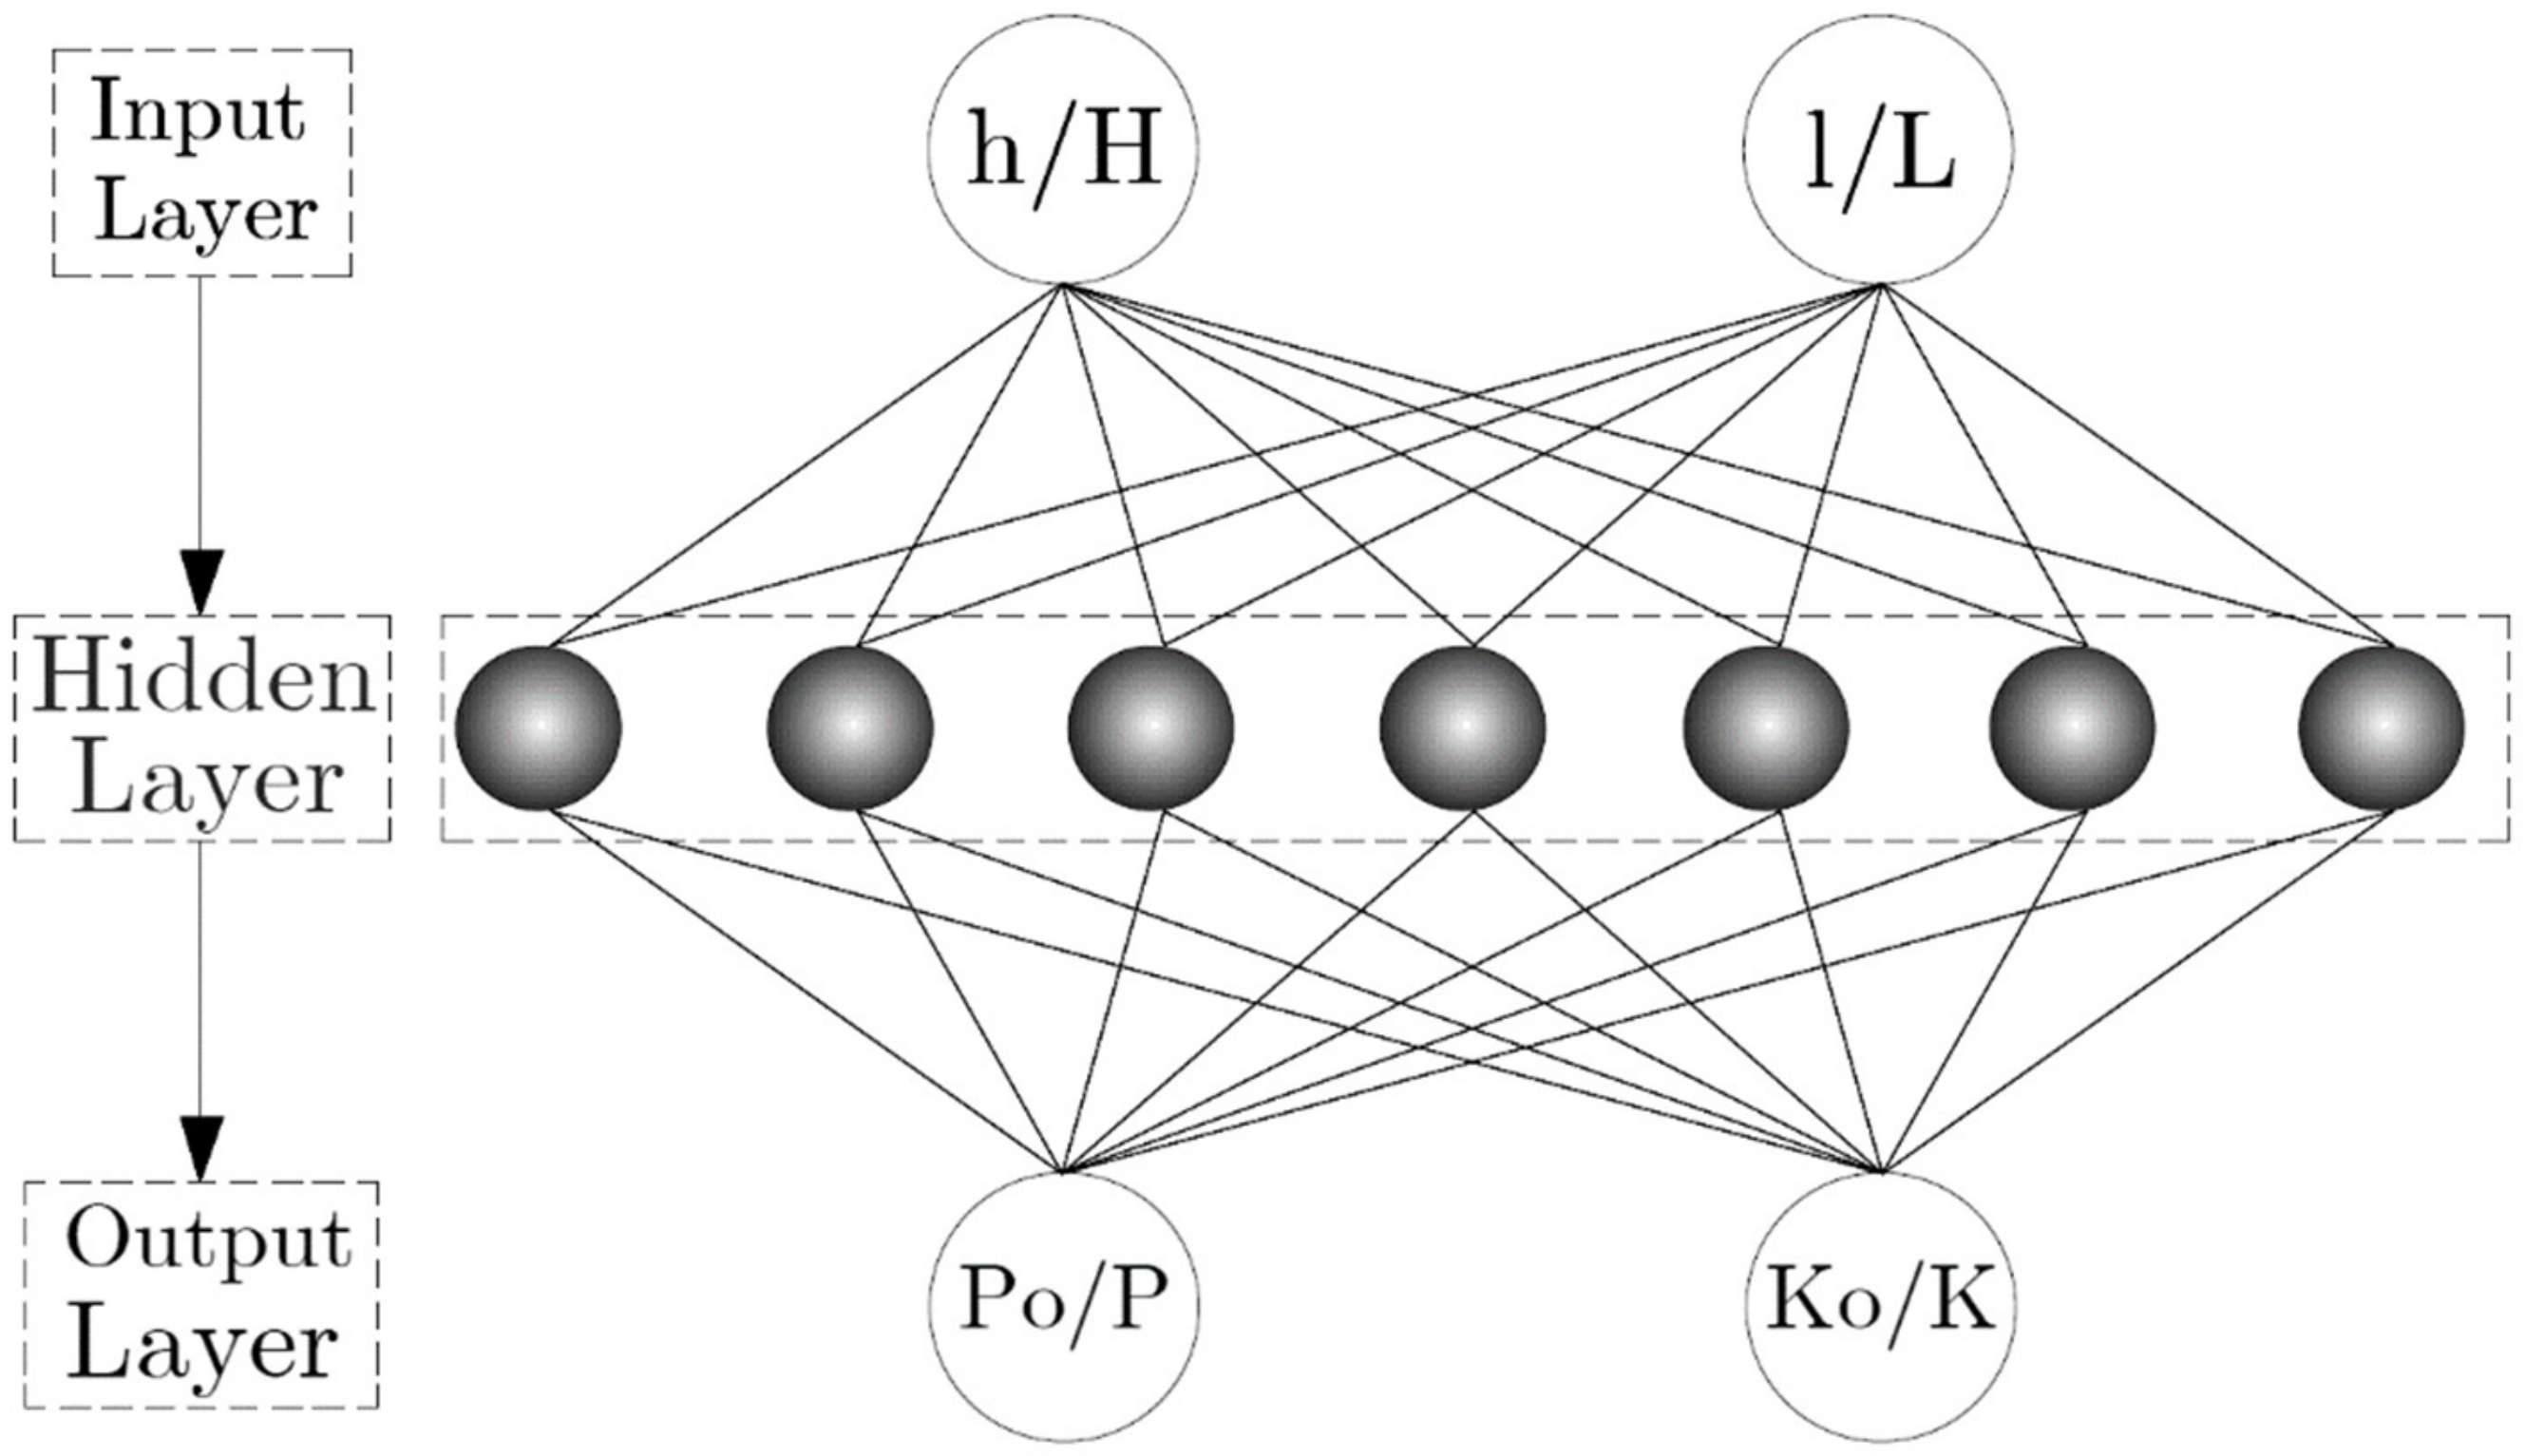
3.1. ANN Background
- Information process using simple members named neurons.
- Signal transmission from neurons to connection links.
- Assigned specific weight values to each connection
- Each neuron transmits inputs from the activation function and determines the outputs.
3.2. ANN Analysis
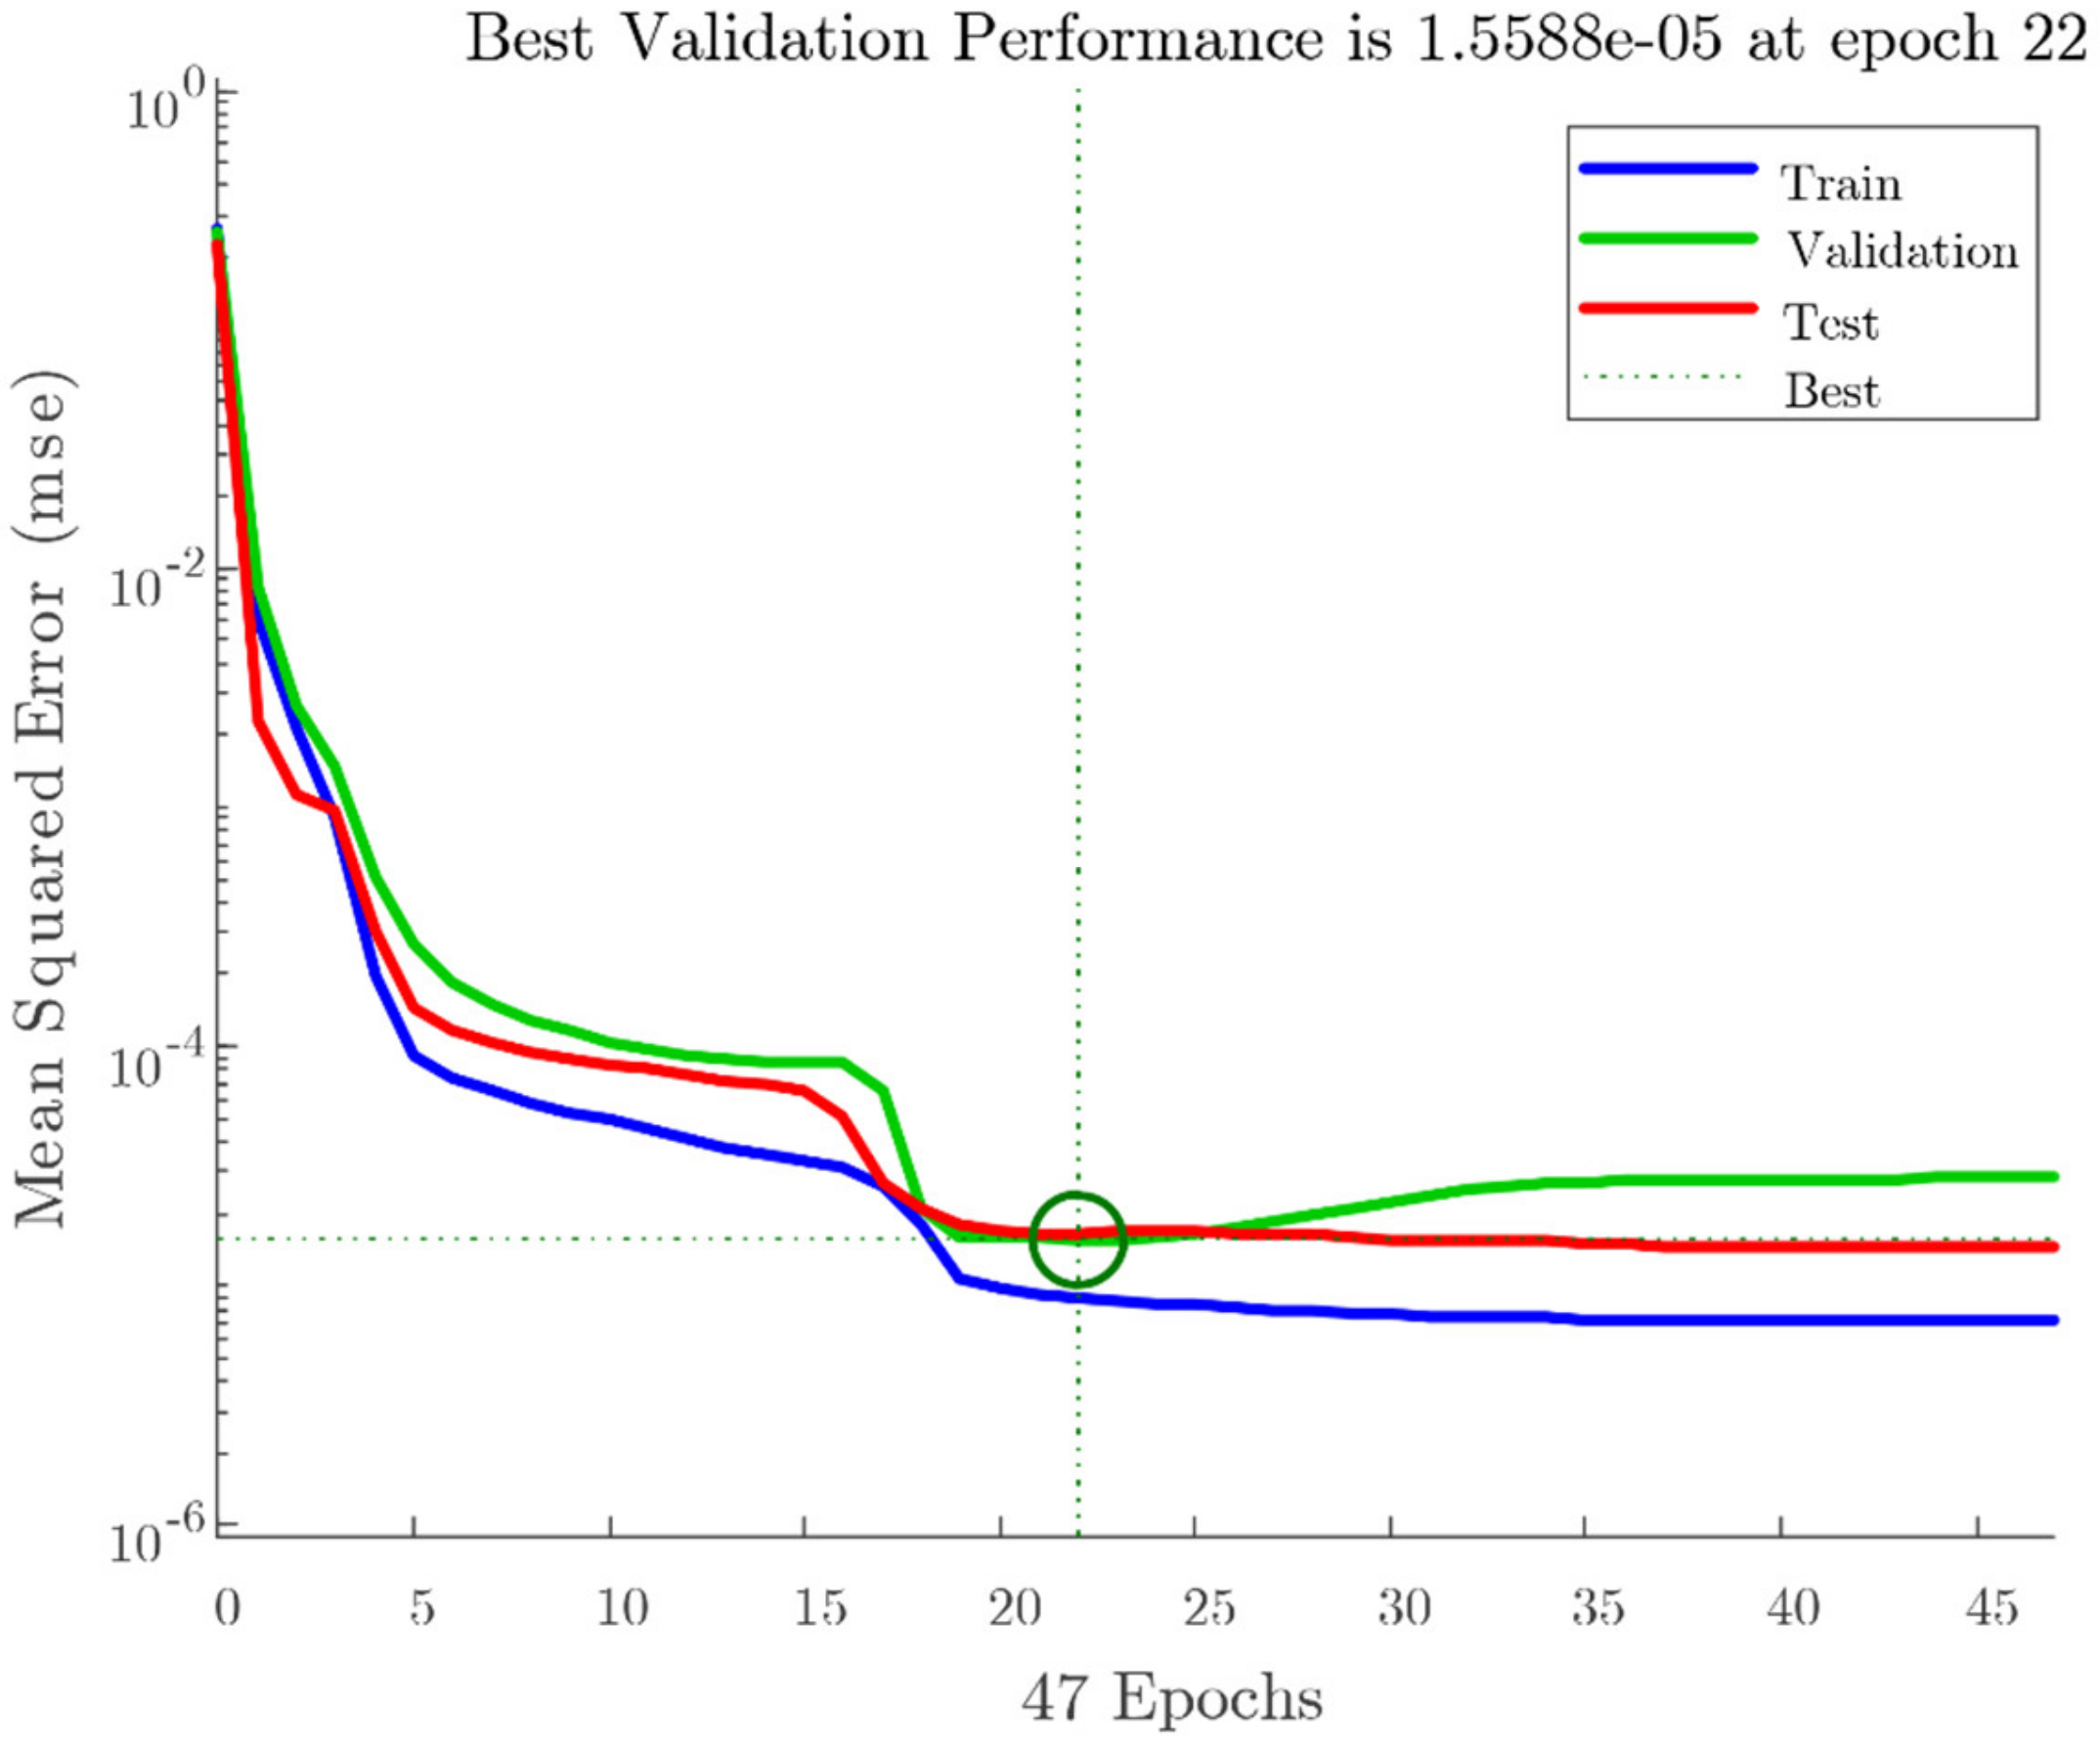
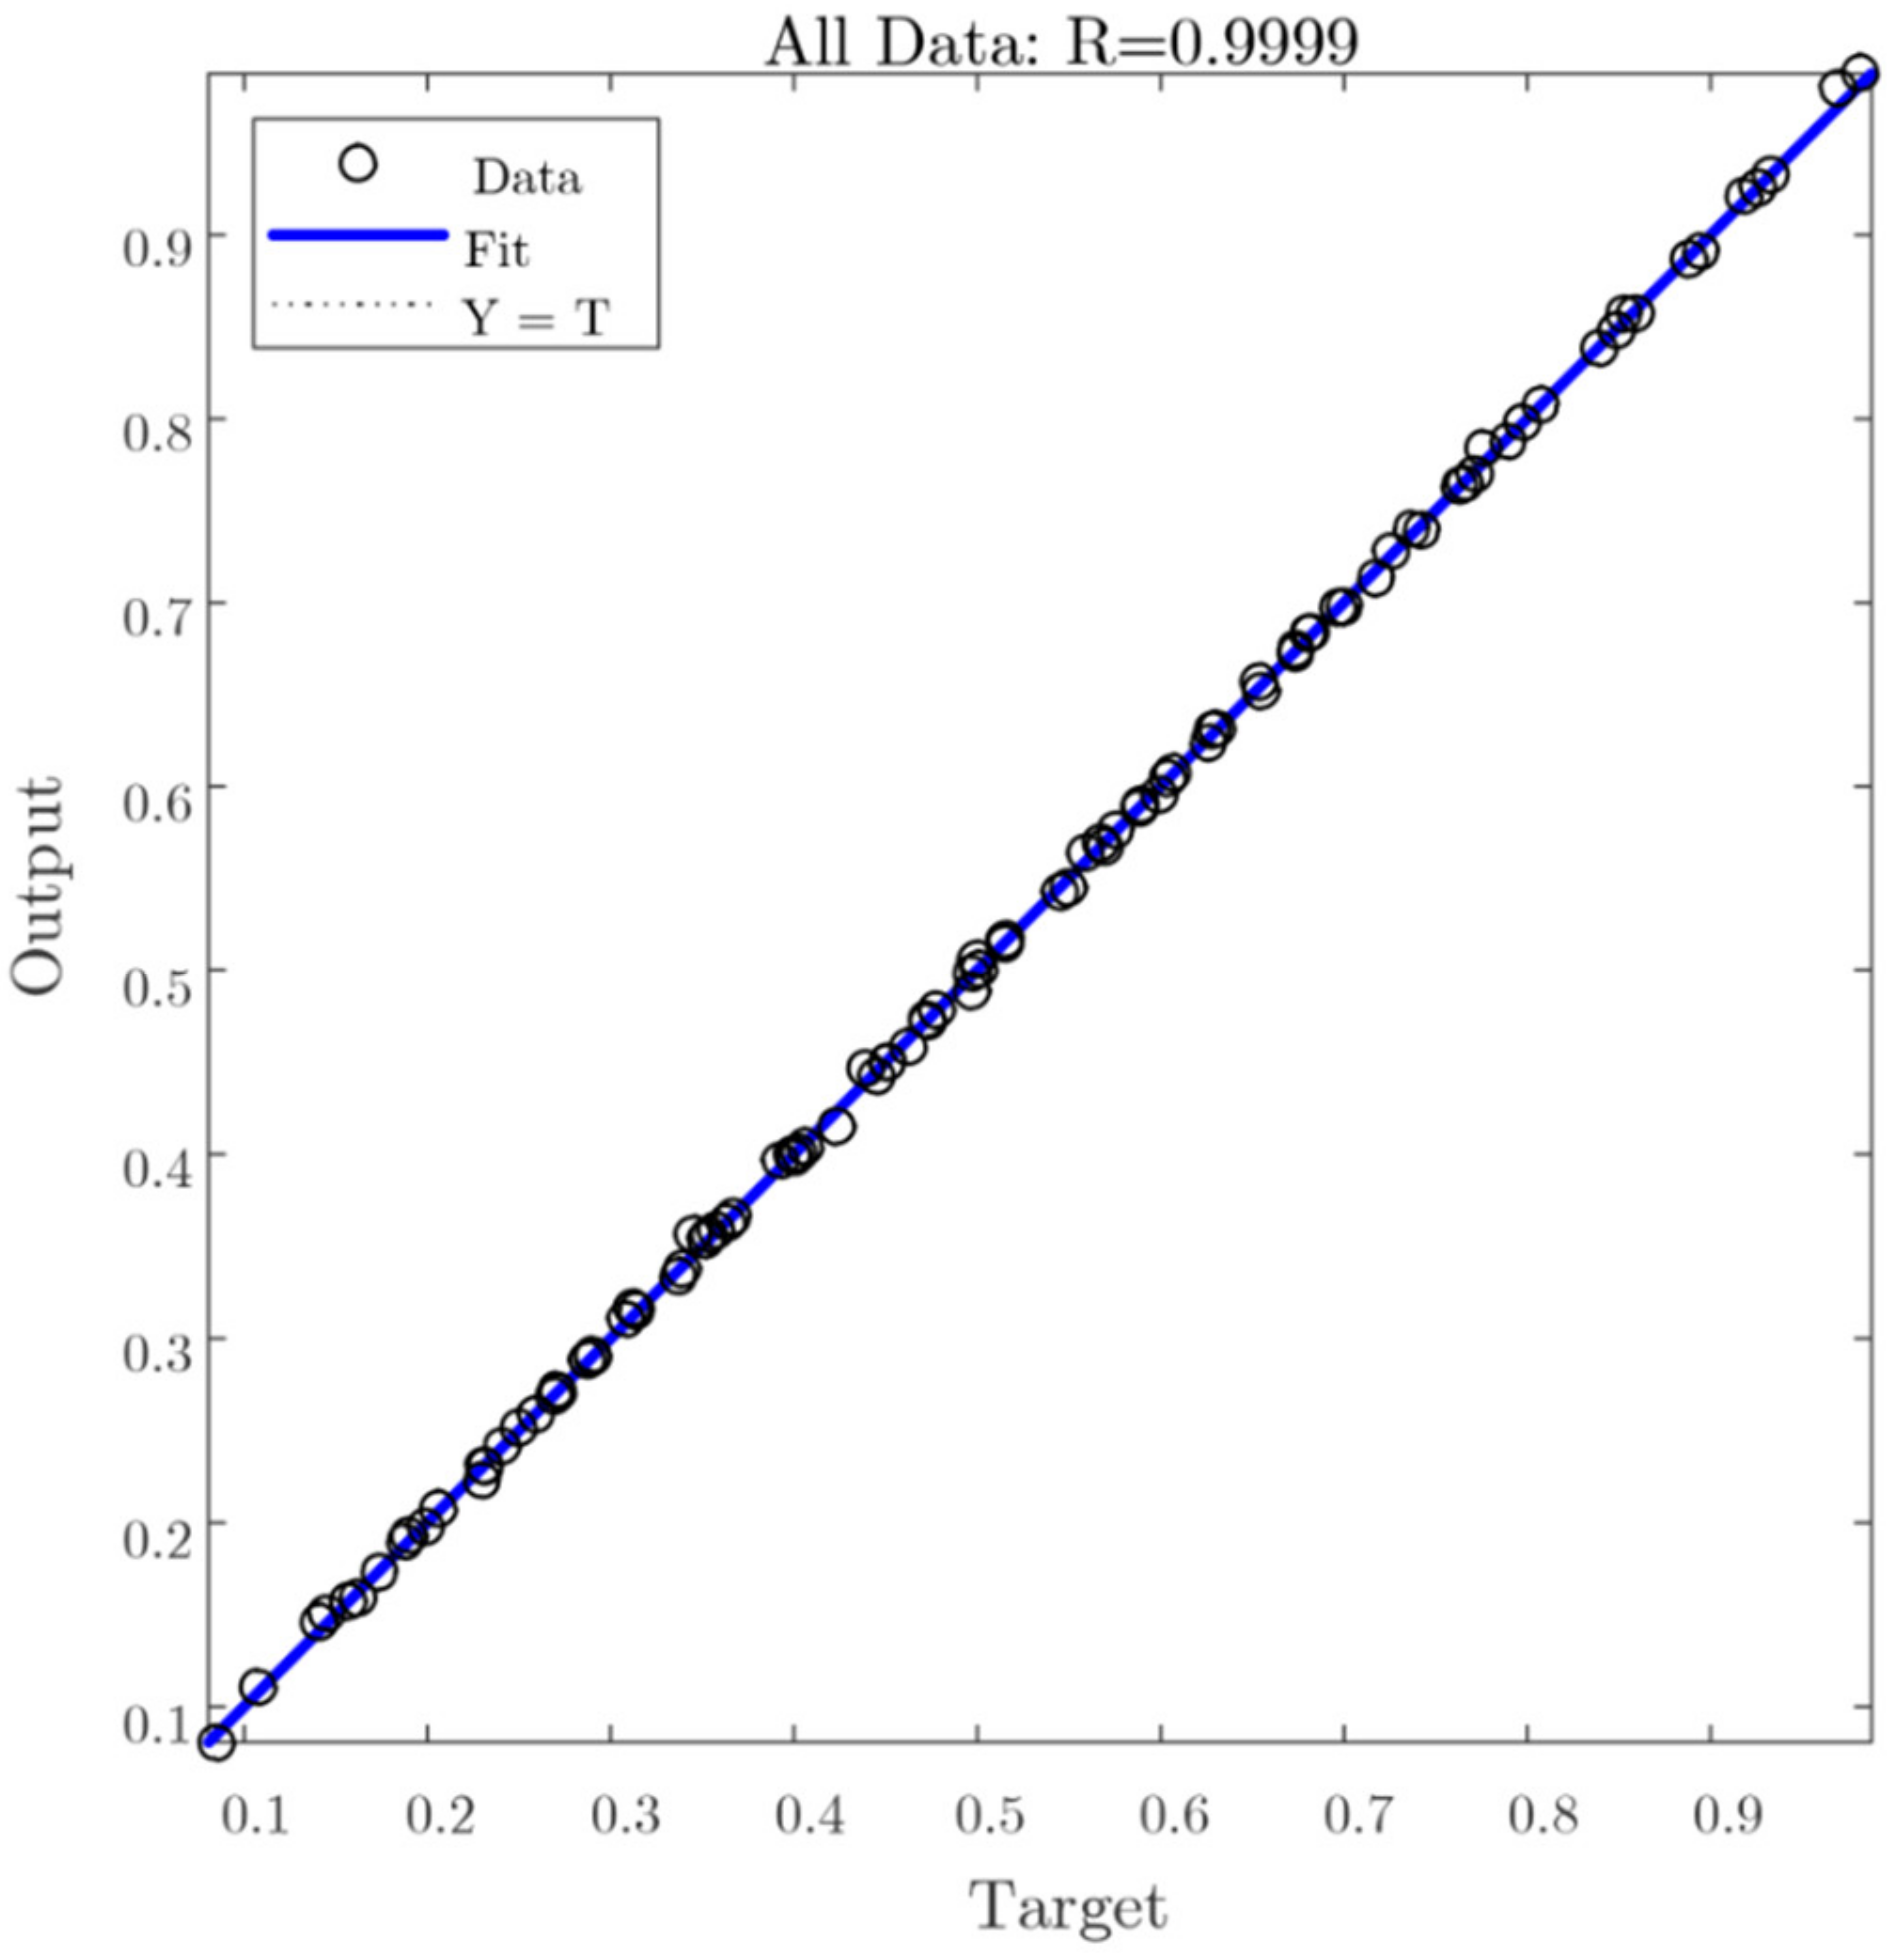
3.3. ANN Model Performance
4. Results and Discussion
4.1. ANN Design of Experiments
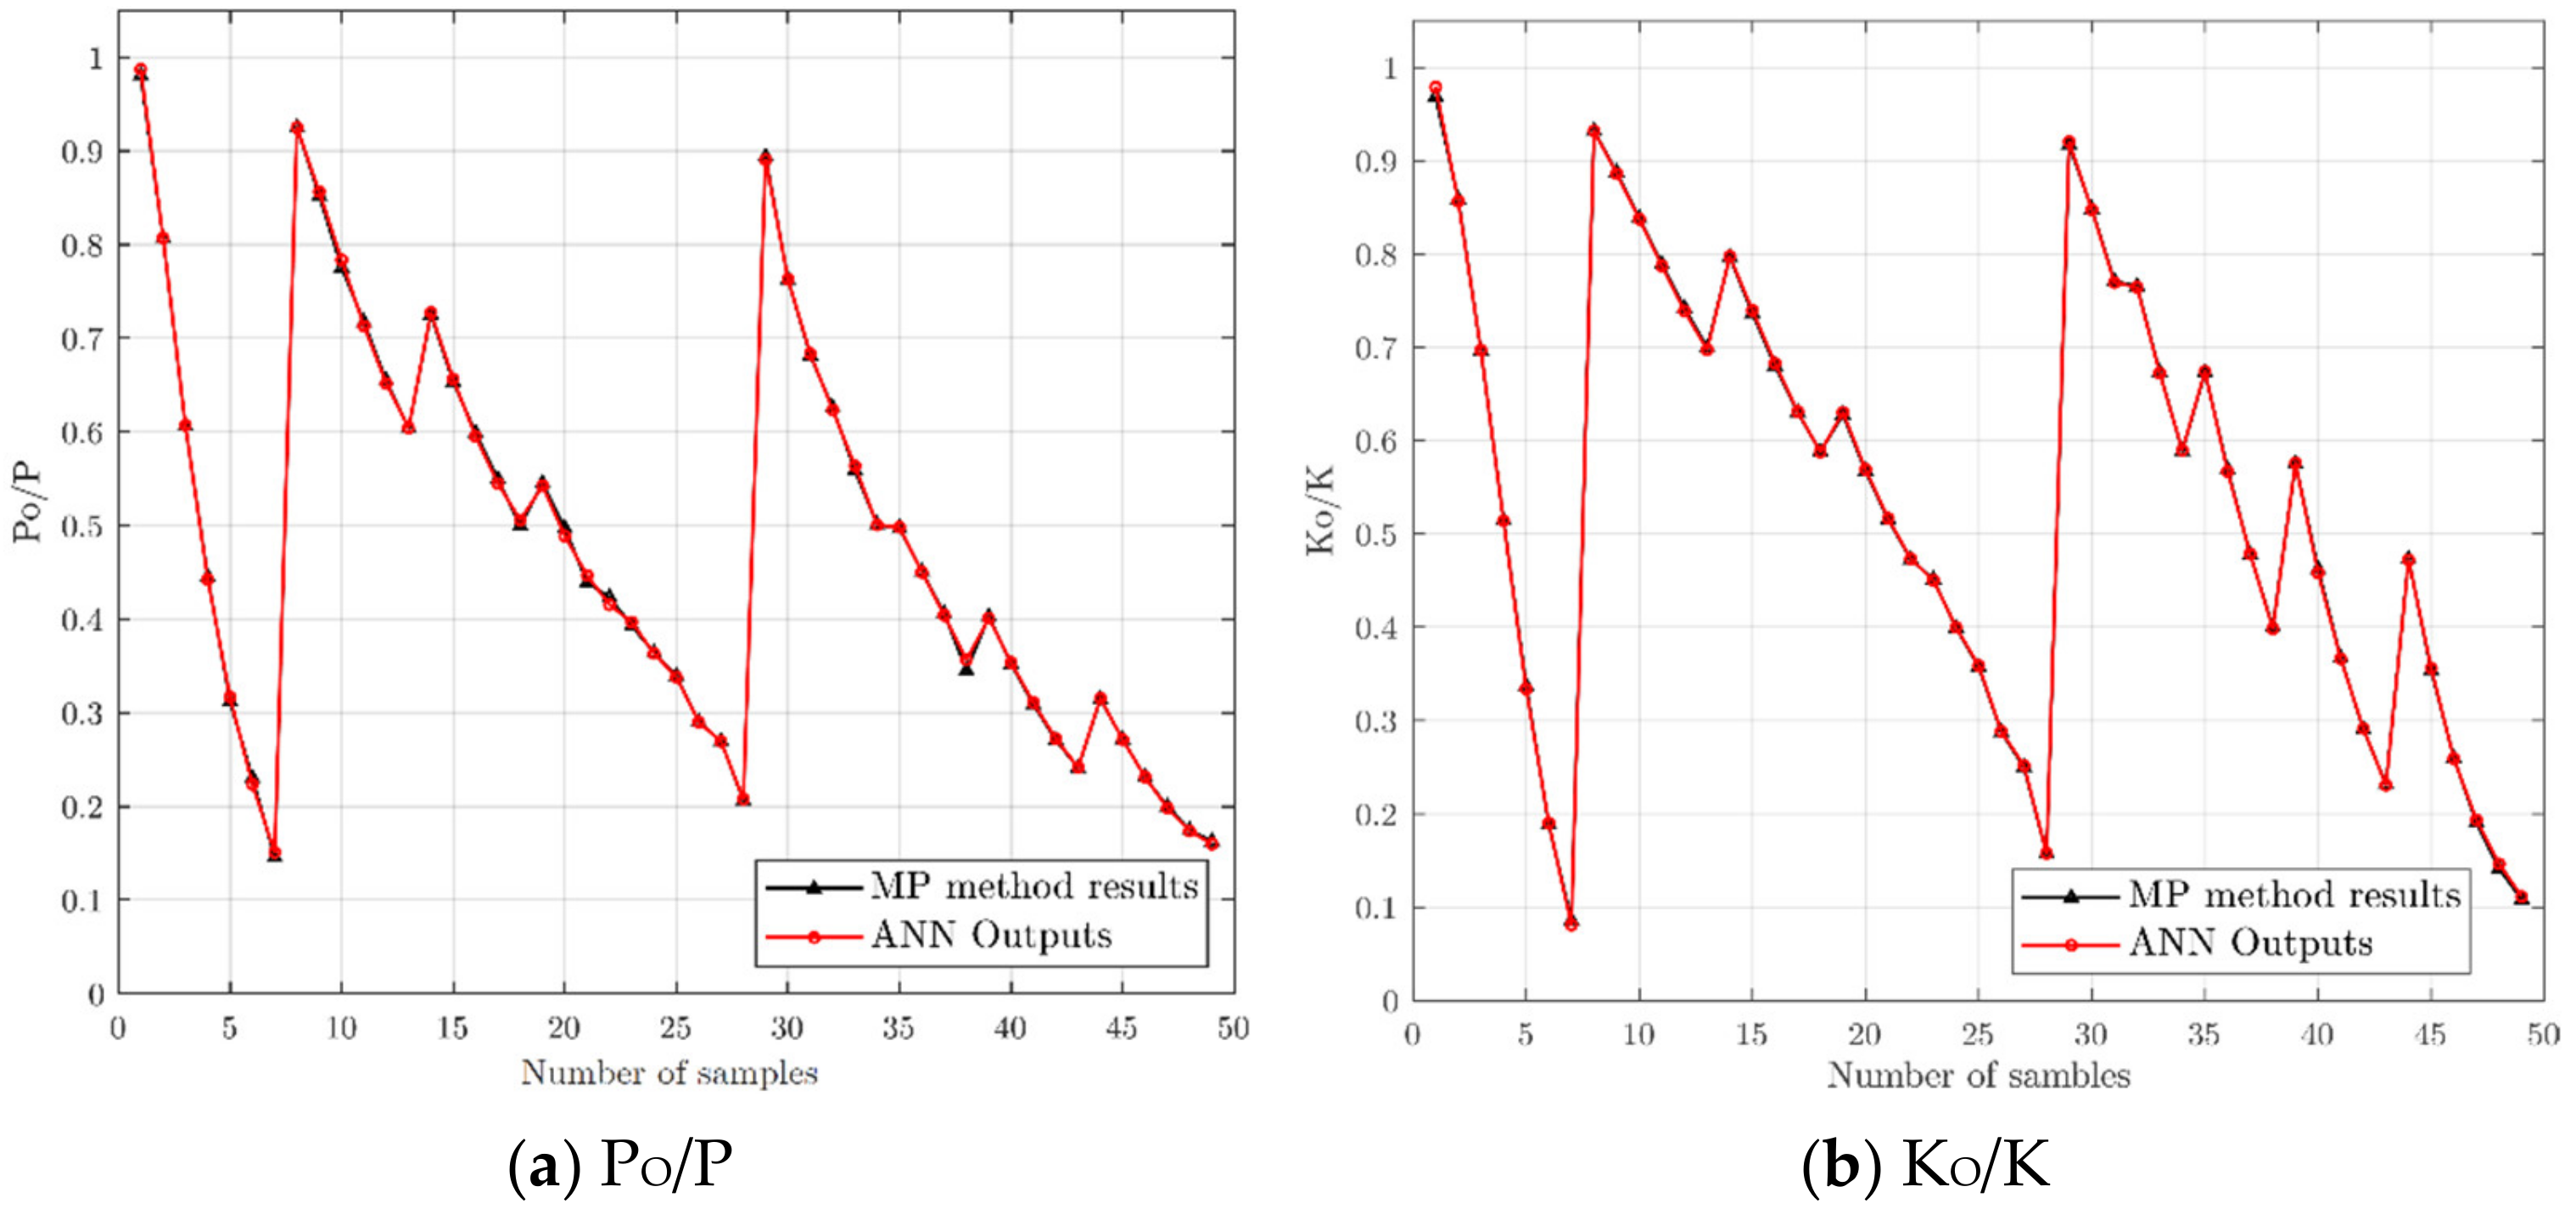
4.2. Meta-Model Based on ANN
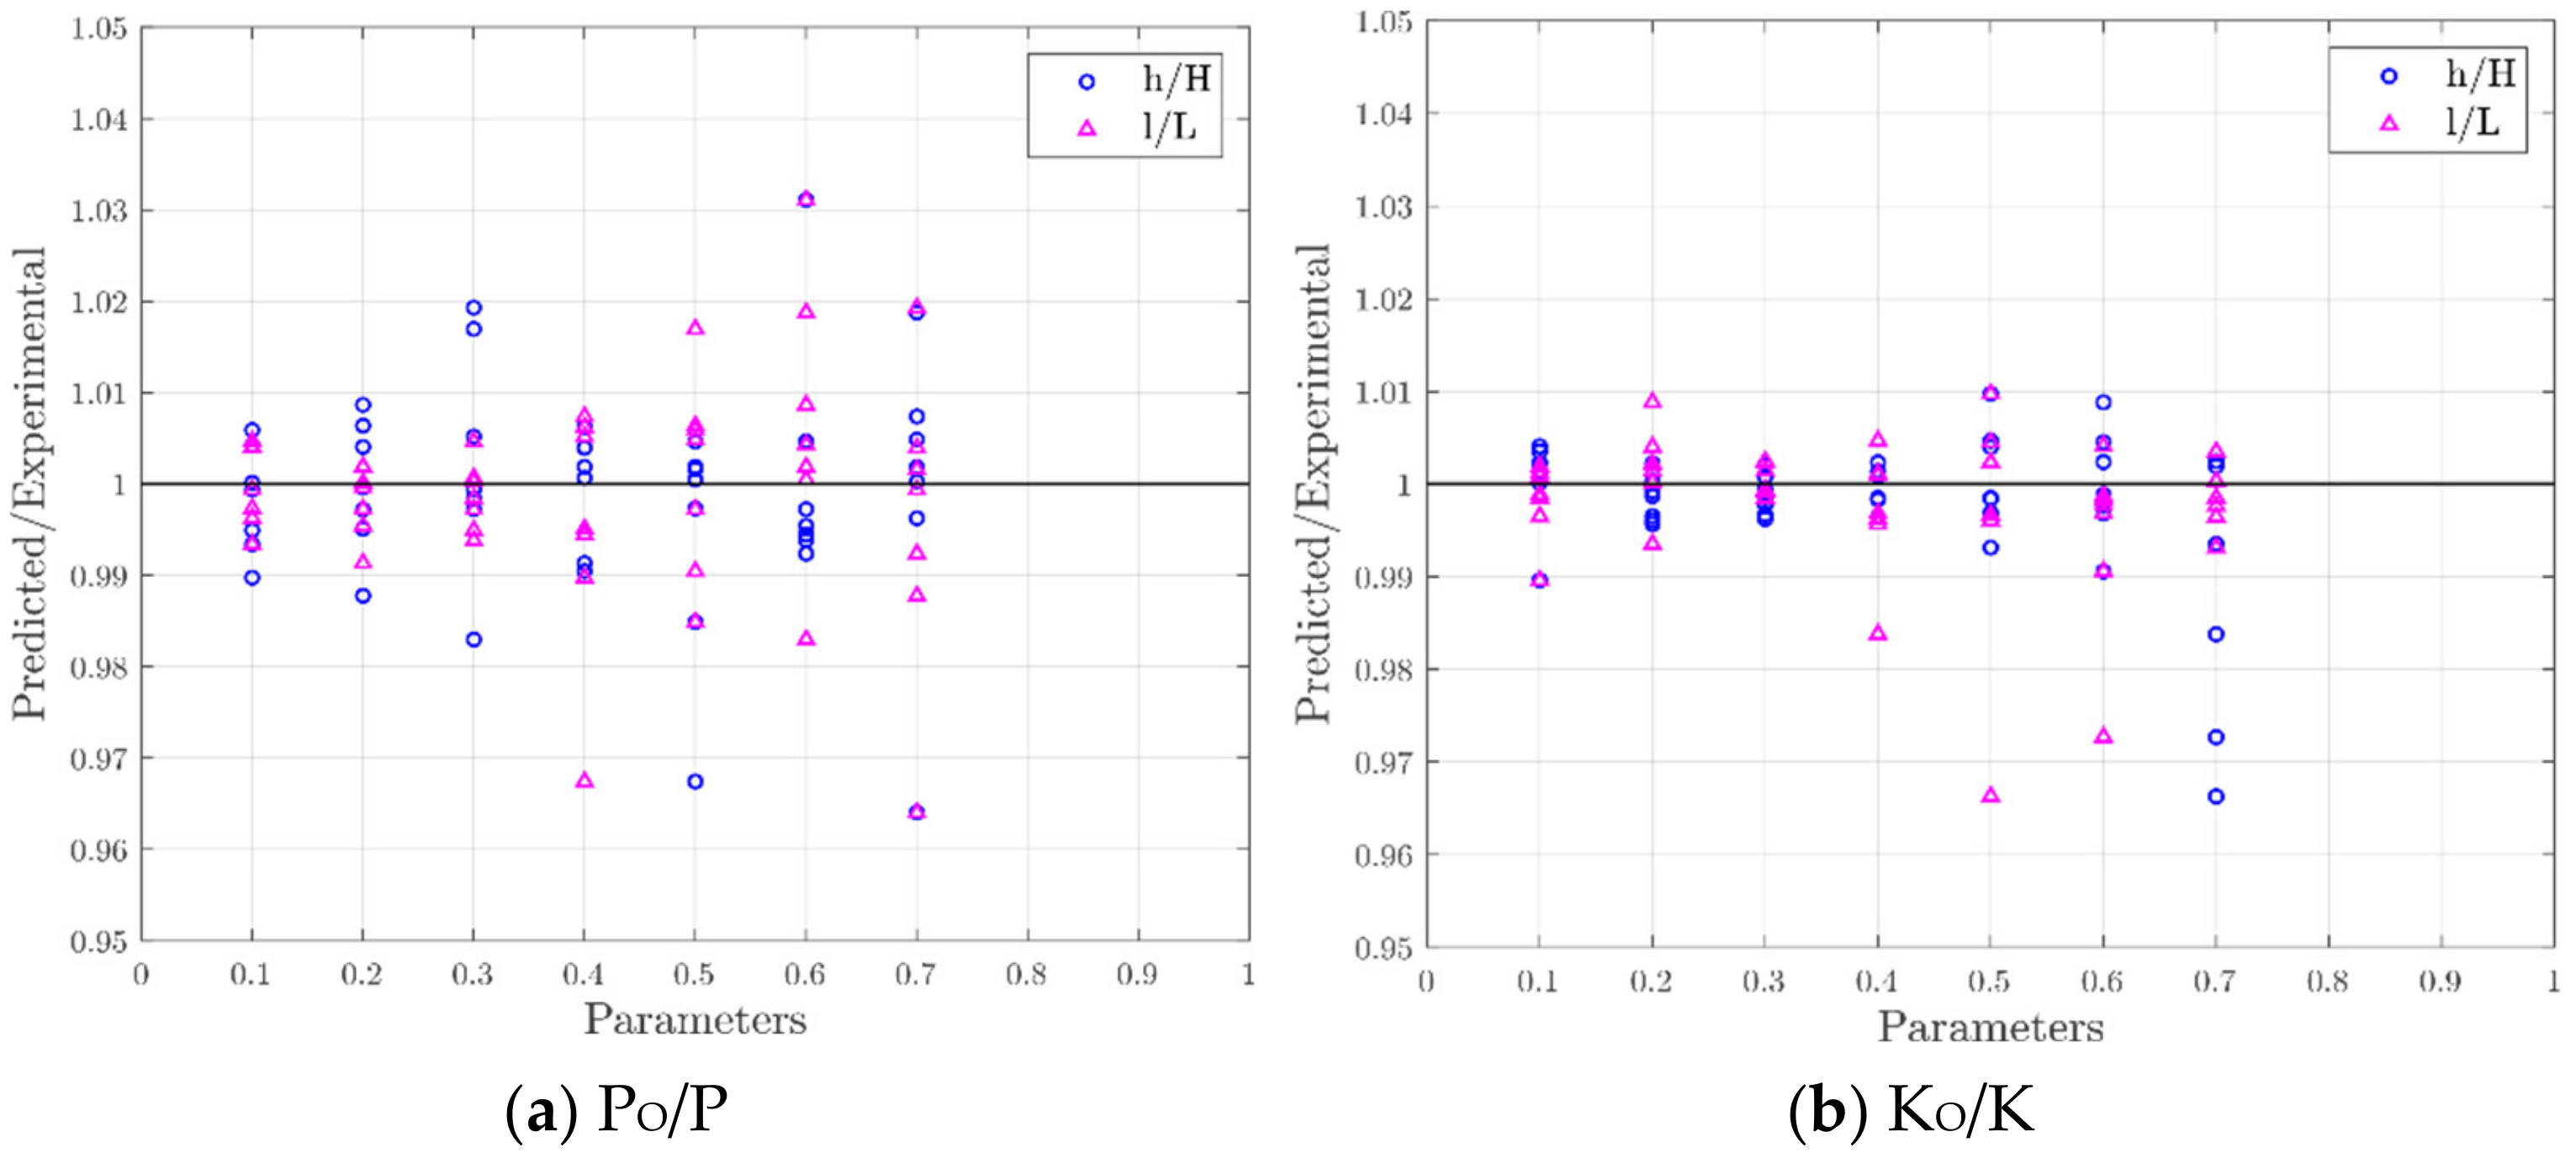
4.3. Stability Analysis of the ANN Model
4.4. Sensitivity Analysis of the ANN Model
4.5. Development of Predictive Equations for Perforated UMW Behavior
5. Conclusions
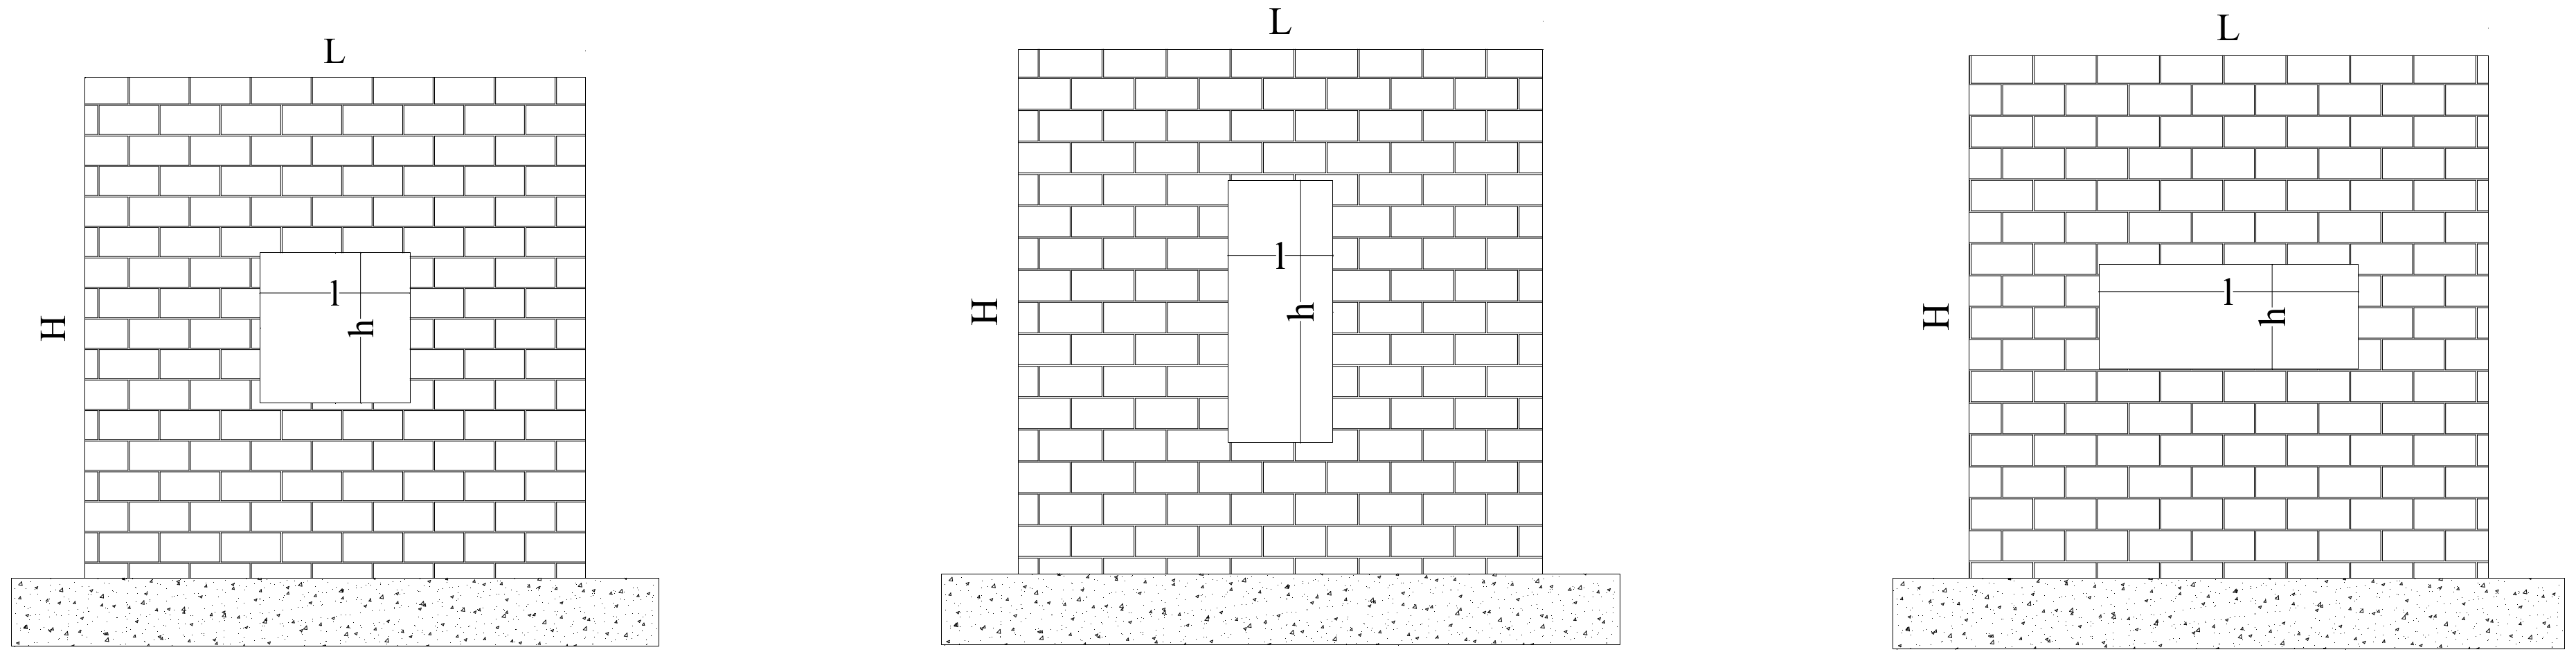
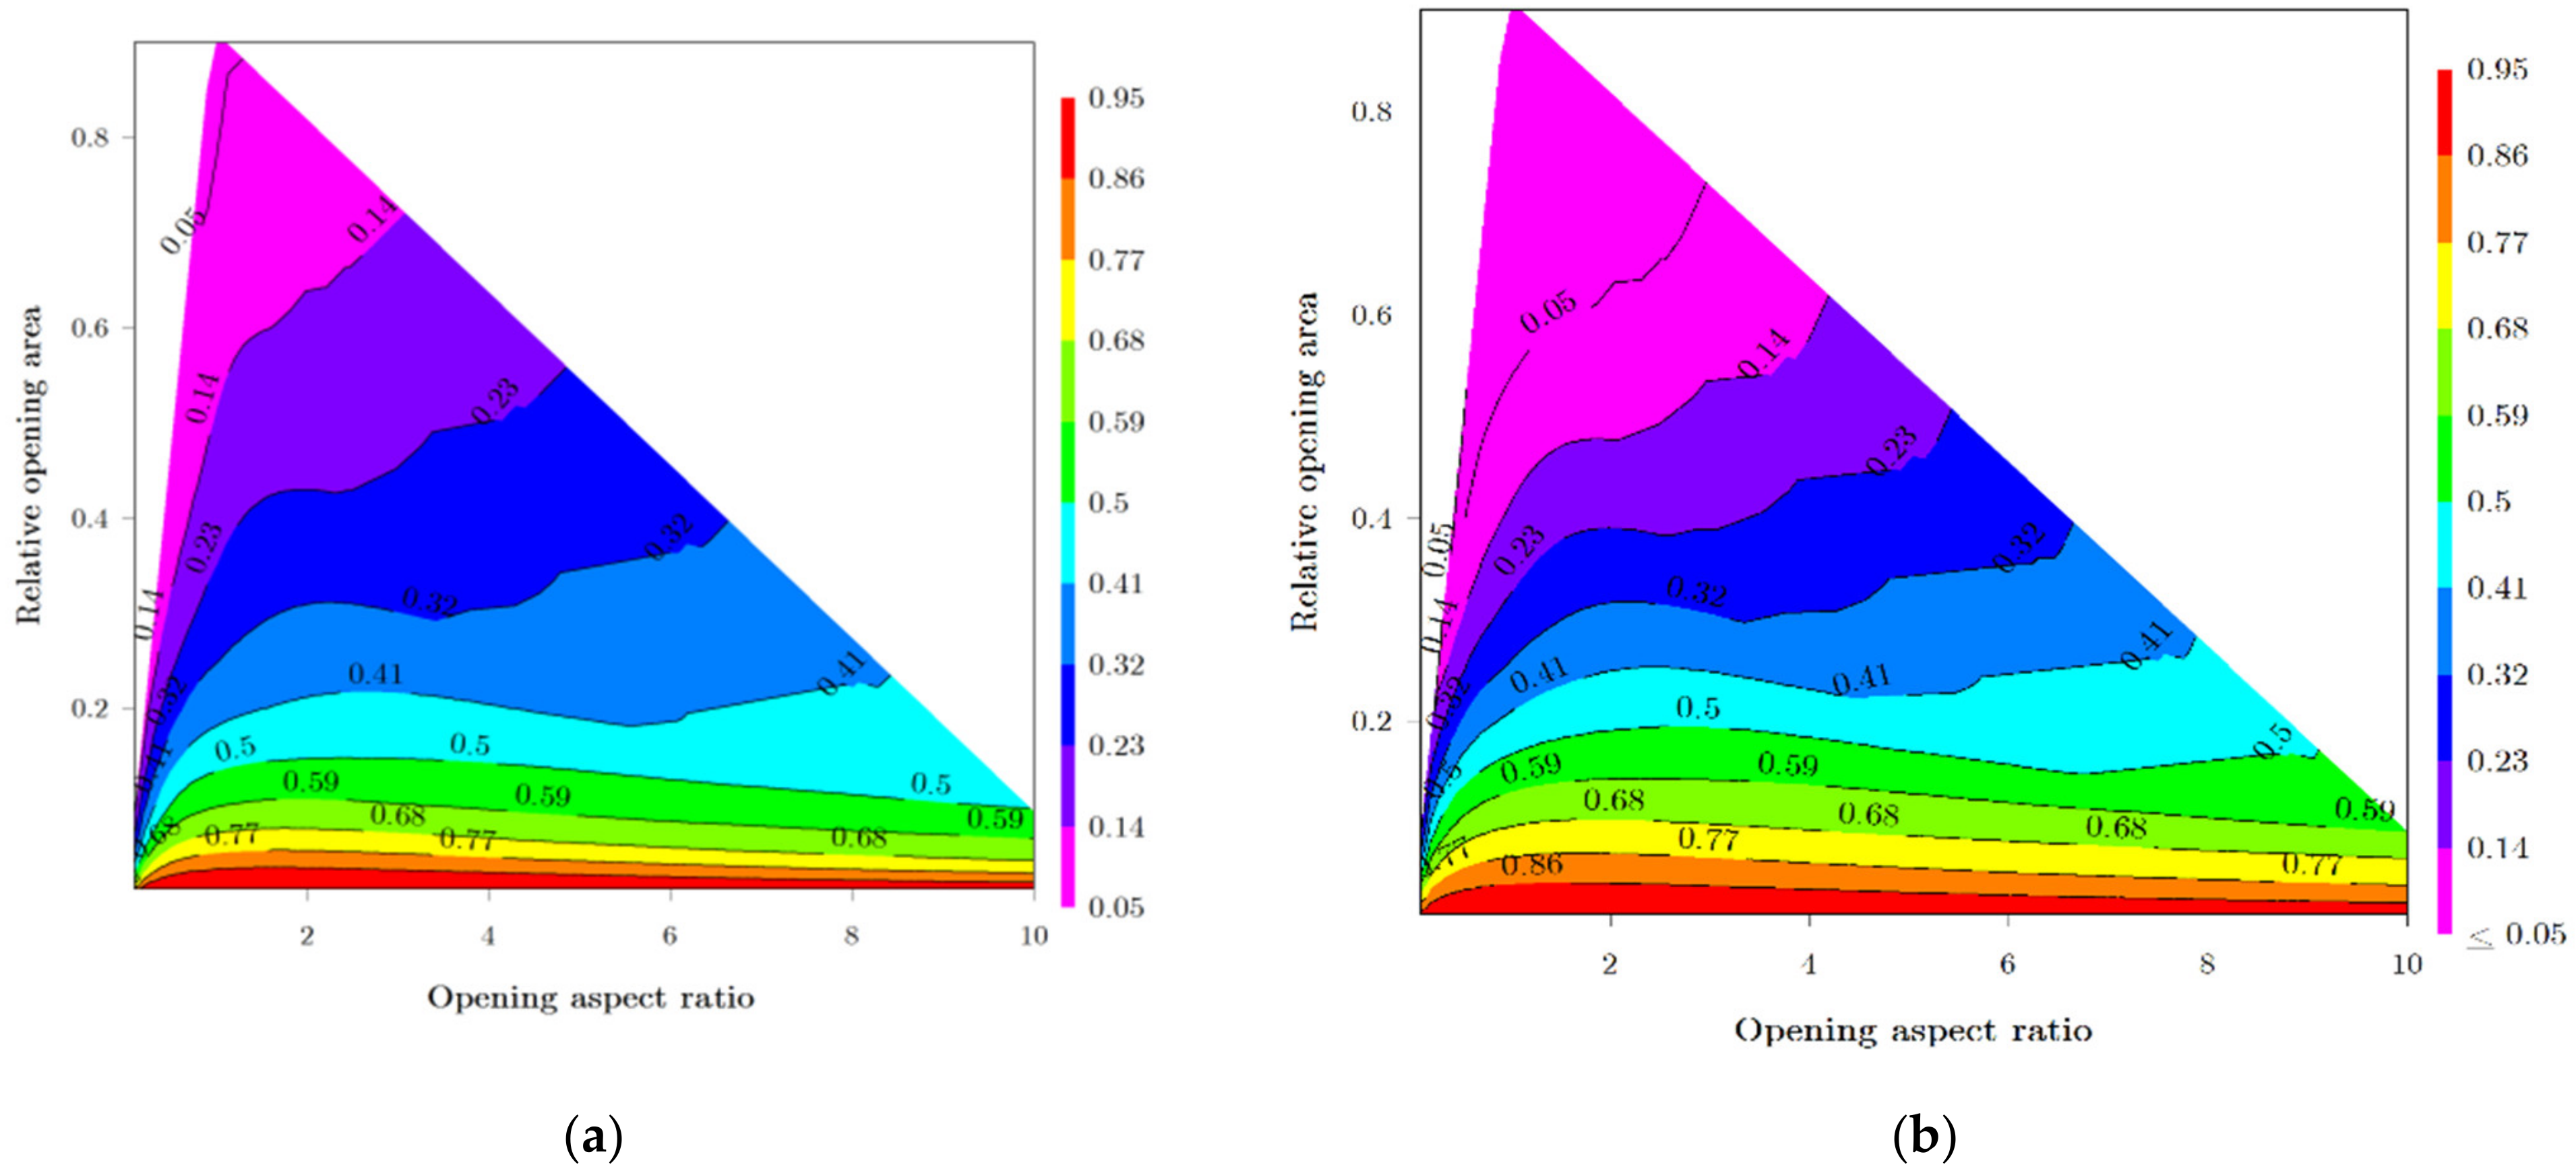
- Increasing the relative opening area in the wall leads to a reduction in the load bearing strength and initial stiffness of a perforated masonry wall. Such a decrease is reported as more considerable in lower aspect ratios of perforated area to the total area of the wall.
- It was observed that the presence of opening areas with aspect ratios greater than 1 does not have a significant effect of the masonry wall’s structural capacity.
- The suitable shape of incorporating openings in the masonry walls is reported as vertical rectangular with aspect ratios greater than 1. This opening arrangement leads to further structural capacity compared to other opening arrangements with similar opening area.
- For practical purposes, simple and empirical equations are developed to predict the reduction in the load bearing capacity and initial stiffness of the perforated masonry walls. The equations are introduced based on the ratios of height and width of the existing perforations to the total dimensions of the wall.
- Useful charts are presented to predict the reductions in the wall’s load bearing resistance and stiffness based on the opening aspect ratios and relative opening areas.
Author Contributions
Funding
Institutional Review Board Statement
Informed Consent Statement
Data Availability Statement
Conflicts of Interest
References
- Abdulla, K.F.; Cunningham, L.S.; Gillie, M. Simulating masonry wall behaviour using a simplified micro-model approach. Eng. Struct. 2017, 151, 349–365. [Google Scholar] [CrossRef]
- Al-Chaar, G.; Lamb, G.E. Effect of openings on structural performance of unreinforced masonry infilled frames. ACI Spec. Publ. 2003, 211–212, 247–261. [Google Scholar]
- Mondal, G.; Jain, S.K. Lateral stiffness of masonry infilled reinforced concrete (RC) frames with central opening. Earthq. Spectra 2008, 24, 701–723. [Google Scholar] [CrossRef]
- Tasnimi, A.A.; Mohebkhah, A. Investigation on the behavior of brick-infilled steel frames with openings, experimental and analytical approaches. Eng. Struct. 2011, 33, 968–980. [Google Scholar] [CrossRef]
- Asteris, P.G.; Giannopoulos, I.P.; Chrysostomou, C.Z. Modeling of Infilled Frames with Openings. Open Constr. Build. Technol. J. 2012, 6, 81–91. [Google Scholar] [CrossRef] [Green Version]
- Mohammadi, M.; Nikfar, F. Strength and Stiffness of Masonry-Infilled Frames with Central Openings Based on Experimental Results. J. Struct. Eng. 2013, 139, 974–984. [Google Scholar] [CrossRef]
- Chen, X.; Liu, Y. Numerical study of in-plane behaviour and strength of concrete masonry infills with openings. Eng. Struct. 2015, 82, 226–235. [Google Scholar] [CrossRef]
- Berti, M.; Salvatori, L.; Orlando, M.; Spinelli, P. Unreinforced masonry walls with irregular opening layouts: Reliability of equivalent-frame modelling for seismic vulnerability assessment. Bull. Earthq. Eng. 2017, 15, 1213–1239. [Google Scholar] [CrossRef]
- Parisi, F.; Augenti, N. Seismic capacity of irregular unreinforced masonry walls with openings. Earthq. Eng. Struct. Dyn. 2013, 42, 101–121. [Google Scholar] [CrossRef]
- Ganapathi, S.C.; Murthy, A.R.C.; Iyer, N.R.; Lakshmanan, N.; Bhagavan, N.G. Experimental and numerical study on in-plane behavior of brick masonry wall panels. Int. J. Struct. Stab. Dyn. 2011, 11, 431–450. [Google Scholar] [CrossRef]
- Oliveira, D.V. Experimental and Numerical Analysis of Blocky Masonry Structures under Cyclic Loading. 2003, 221. Available online: https://repositorium.sdum.uminho.pt/handle/1822/180 (accessed on 5 January 2021).
- Morandi, P.; Albanesi, L.; Graziotti, F.; Li Piani, T.; Penna, A.; Magenes, G. Development of a dataset on the in-plane experimental response of URM piers with bricks and blocks. Constr. Build. Mater. 2018, 190, 593–611. [Google Scholar] [CrossRef]
- Kakaletsis, D.J.; Karayannis, C.G. Influence of masonry strength and openings on infilled R/C frames under cycling loading. J. Earthq. Eng. 2008, 12, 197–221. [Google Scholar] [CrossRef]
- Mallick, D.V.; Garg, R.P. Effect of openings on the lateral stiffness of infilled frames. Proc. Inst. Civ. Eng. 1971, 49, 193–209. [Google Scholar] [CrossRef]
- Dawe, J.L.; Seah, C.K. Behaviour of masonry infilled steel frames. Can. J. Civ. Eng. 1989, 16, 865–876. [Google Scholar] [CrossRef]
- ACI A 530. ASCE 5/TMS 402-Building Code Requirements for Masonry Structures; American Concrete Institute International: Farmington Hills, MI, USA, 2011. [Google Scholar]
- Canadian Standards Association, Mississauga. CAN/CSA S304. 1-04—Design of Masonry Structures; Canadian Standards As-sociation, Mississauga: Mississauga, ON, Canada, 2005. [Google Scholar]
- Kato, D.; Kabeyasawa, T.; Otani, S.; Aoyama, H. Earthquake-resistant design of shearwalls with one opening. ACI Mater. J. 1995, 92, 495–500. [Google Scholar] [CrossRef]
- Qamaruddin, M. In-plane stiffness of shearwallswith openings. Build. Environ. 1998, 34, 109–127. [Google Scholar] [CrossRef]
- Qamaruddin, M.; Al-Oraimi, S.; Hago, A.W. Mathematical Model for Lateral Stiffness of ShearWall with Openings. In Proceedings of the Seventh North American Masonry Conference; University of Notre Dame: South Bend, IN, USA, 1996; pp. 605–617. [Google Scholar]
- Zhang, X.; Singh, S.; Bull, D.K.; Cooke, N. Out-of-Plane Performance of Reinforced Masonry Walls with Openings. J. Struct. Eng. 2001, 127, 51–57. [Google Scholar] [CrossRef]
- Ghobarah, A.; El Mandooh Galal, K. Out-of-Plane Strengthening of Unreinforced Masonry Walls with Openings. J. Compos. Constr. 2004, 8, 298–305. [Google Scholar] [CrossRef]
- Wight, G.D.; Kowalsky, M.J.; Ingham, J.M. Shake Table Testing of Posttensioned Concrete Masonry Walls with Openings. J. Struct. Eng. 2007, 133, 1551–1559. [Google Scholar] [CrossRef]
- Augenti, N.; Parisi, F.; Prota, A.; Manfredi, G. In-Plane Lateral Response of a Full-Scale Masonry Subassemblage with and without an Inorganic Matrix-Grid Strengthening System. J. Compos. Constr. 2011, 15, 578–590. [Google Scholar] [CrossRef]
- Vanin, A.; Foraboschi, P. In-plane behavior of perforated brick masonry walls. Mater. Struct./Mater. Constr. 2012, 45, 1019–1034. [Google Scholar] [CrossRef]
- Chavez, K.H. Parametric Study on Multi-Story, Partially Grouted, Perforated, Masonry Shear Walls by Finite Element Analysis. Master’s Thesis, Brigham Young University, Provo, UT, USA, 2018. [Google Scholar]
- Howlader, M.K.; Masia, M.J.; Griffith, M.C. In-Plane Response of Perforated Unreinforced Masonry Walls under Cyclic Loading: Experimental Study. J. Struct. Eng. 2020, 146, 04020106. [Google Scholar] [CrossRef]
- Howlader, M.K.; Masia, M.J.; Griffith, M.C. Numerical analysis and parametric study of unreinforced masonry walls with arch openings under lateral in-plane loading. Eng. Struct. 2020, 208. [Google Scholar] [CrossRef]
- Sandoli, A.; Musella, C.; Piero Lignola, G.; Calderoni, B.; Prota, A. Spandrel panels in masonry buildings: Effectiveness of the diagonal strut model within the equivalent frame model. Structures 2020, 27, 879–893. [Google Scholar] [CrossRef]
- Guadagnuolo, M.; Aurilio, M.; Faella, G. Retrofit assessment of masonry buildings through simplified structural analysis. Frat. Integrita Strutt. 2020, 14, 398–409. [Google Scholar] [CrossRef]
- Pirsaheb, H.; Javad Moradi, M.; Milani, G. A Multi-Pier MP procedure for the non-linear analysis of in-plane loaded masonry walls. Eng. Struct. 2020, 212. [Google Scholar] [CrossRef]
- Pirsaheb, H.; Javad Moradi, M.; Milani, G. A Multi-Pier MP method for the non-linear static analysis of out-of-plane loaded masonry walls. Eng. Struct. 2020, 223. [Google Scholar] [CrossRef]
- Dizhur, D.; Ingham, J.M. Diagonal tension strength of vintage unreinforced clay brick masonry wall panels. Constr. Build. Mater. 2013, 43, 418–427. [Google Scholar] [CrossRef]
- Ganz, H.R.; Thürlimann, B. Strength of brick walls under normal force and shear. In Proceedings of the 8th International Sympo-sium on Load Bearing Brickwork, London, UK, November 1983; pp. 27–29. [Google Scholar]
- White, D. Unified plastic analysis for infilled frames. Comput.-Aided Des. 1986, 18, 108. [Google Scholar] [CrossRef]
- Saneinejad, A.; Hobbs, B. Inelastic Design of Infilled Frames. J. Struct. Eng. 1995, 121, 634–650. [Google Scholar] [CrossRef] [Green Version]
- Roca, P. Assessment of masonry shear-walls by simple equilibrium models. Constr. Build. Mater. 2006, 20, 229–238. [Google Scholar] [CrossRef]
- Roca, P.; Lobato, M.; Viviescas, Á.; Villalba, V. Limit analysis of shear walls by simple equilibrium models. In Proceedings of the 8th International Masonry Conference, Dresden, Germany, 4–7 July 2010. [Google Scholar]
- Roca, P.; Viviescas, Á.; Lobato, M.; Díaz, C.; Serra, I. Capacity of shear walls by simple equilibrium models. Int. J. Archit. Herit. 2011, 5, 412–435. [Google Scholar] [CrossRef]
- Rodrigues, H.; Varum, H.; Costa, A. Simplified macro-model for infill masonry panels. J. Earthq. Eng. 2010, 14, 390–416. [Google Scholar] [CrossRef]
- Nolph, S.M.; Elgawady, M.A. In-Plane Shear Performance of Partially Grouted Masonry Shear Walls. Ph.D. Thesis, Washington State University, Pullman, WA, USA, 2010. [Google Scholar]
- Adukadukam, A.; Sengupta, A.K. Equivalent Strut Method for the Modelling of Masonry Infill Walls in the Nonlinear Static Analysis of Buildings. J. Inst. Eng. (India) Ser. A 2013, 94, 99–108. [Google Scholar] [CrossRef]
- Mojsilović, N.; Kostić, N.; Schwartz, J. Modelling of the behaviour of seismically strengthened masonry walls subjected to cyclic in-plane shear. Eng. Struct. 2013, 56, 1117–1129. [Google Scholar] [CrossRef]
- Beyer, K.; Mangalathu, S. Review of strength models for masonry spandrels. Bull. Earthq. Eng. 2013, 11, 521–542. [Google Scholar] [CrossRef]
- Applied Technology Council; Partnership for Response. Evaluation of Earthquake Damaged Concrete and Masonry Wall Buildings: Basic Procedures Manual; FEMA: Washington, DC, USA, 1998.
- Milani, G.; Lourenço, P.B.; Tralli, A. Homogenised limit analysis of masonry walls, Part I: Failure surfaces. Comput. Struct. 2006, 84, 166–180. [Google Scholar] [CrossRef] [Green Version]
- Lourenço, P. Computational Strategy for Masonry Structures. 1996. Available online: https://www.researchgate.net/publication/27344834_Computational_Strategy_for_Masonry_Structures (accessed on 5 January 2021).
- Peng, B.; Wang, D.; Zong, G.; Zhang, Y. Homogenization strategy for brick masonry walls under in-plane loading. Constr. Build. Mater. 2018, 163, 656–667. [Google Scholar] [CrossRef]
- Raijmakers, T.M.J.; Vermeltfoort, A.T. Deformation Controlled Tests in Masonry Shear Walls; TNO-Bouw: Delft, The Netherlands, 1992. [Google Scholar]
- Rezaiee-Pajand, M.; Rezaiee-Pajand, A.; Karimipour, A.; Mohebbi Najm Abad, J. A Particle Swarm optimization algorithm to suggest formulas for the behaviour of the recycled materials reinforced concrete beams. Int. J. Optim. Civ. Eng. 2020, 10, 451–479. [Google Scholar]
- Shahmansouri, A.A.; Akbarzadeh Bengar, H.; Ghanbari, S. Compressive strength prediction of eco-efficient GGBS-based geopolymer concrete using GEP method. J. Build. Eng. 2020, 31. [Google Scholar] [CrossRef]
- Moradi, M.J.; Roshani, M.M.; Shabani, A.; Kioumarsi, M. Prediction of the load-bearing behavior of spsw with rectangular opening by RBF network. Appl. Sci. 2020, 10. [Google Scholar] [CrossRef] [Green Version]
- Rezaiee-Pajand, M.; Karimipour, A.; Abad, J.M.N. Crack Spacing Prediction of Fibre-Reinforced Concrete Beams with Lap-Spliced Bars by Machine Learning Models. Iran. J. Sci. Technol. -Trans. Civ. Eng. 2020. [Google Scholar] [CrossRef]
- Bradley, J.B. Neural networks: A comprehensive foundation. Inf. Process. Manag. 1995, 31, 786. [Google Scholar] [CrossRef]
- Werbos, P.J. An Overview of Neural Networks for Control. IEEE Control Syst. 1991, 11, 40–41. [Google Scholar] [CrossRef]
- Rumelhart, D.E.; Widrow, B.; Lehr, M.A. The Basic Ideas in Neural Networks. Commun. ACM 1994, 37, 87–92. [Google Scholar] [CrossRef]
- Daneshvar, K.; Moradi, M.J.; Amooie, M.; Chen, S.; Mahdavi, G.; Hariri-Ardebili, M.A. Response of low-percentage FRC slabs under impact loading: Experimental, numerical, and soft computing methods. Structures 2020, 27, 975–988. [Google Scholar] [CrossRef]
- Moradi, M.J.; Hariri-Ardebili, M.A. Developing a library of shear walls database and the neural network based predictive meta-model. Appl. Sci. 2019, 9. [Google Scholar] [CrossRef] [Green Version]
- Nitze, I.; Schulthess, U.; Asche, H. Comparison of machine learning algorithms random forest, artificial neuronal network and support vector machine to maximum likelihood for supervised crop type classification. In Proceedings of the 4th Conference on GEographic Object-Based Image Analysis—GEOBIA 2012, Rio de Janeiro, Brazil, 7–9 May 2012; pp. 35–40. [Google Scholar]
- Korotcov, A.; Tkachenko, V.; Russo, D.P.; Ekins, S. Comparison of Deep Learning with Multiple Machine Learning Methods and Metrics Using Diverse Drug Discovery Data Sets. Mol. Pharm. 2017, 14, 4462–4475. [Google Scholar] [CrossRef] [PubMed]
- Naderpour, H.; Mirrashid, M. An innovative approach for compressive strength estimation of mortars having calcium inosilicate minerals. J. Build. Eng. 2018, 19, 205–215. [Google Scholar] [CrossRef]
- Abiodun, O.I.; Jantan, A.; Omolara, A.E.; Dada, K.V.; Mohamed, N.A.E.; Arshad, H. State-of-the-art in artificial neural network applications: A survey. Heliyon 2018, 4. [Google Scholar] [CrossRef] [PubMed] [Green Version]
- Shahmansouri, A.A.; Yazdani, M.; Ghanbari, S.; Akbarzadeh Bengar, H.; Jafari, A.; Farrokh Ghatte, H. Artificial neural network model to predict the compressive strength of eco-friendly geopolymer concrete incorporating silica fume and natural zeolite. J. Clean. Prod. 2021, 279. [Google Scholar] [CrossRef]
- Roshani, G.H.; Feghhi, S.A.H.; Mahmoudi-Aznaveh, A.; Nazemi, E.; Adineh-Vand, A. Precise volume fraction prediction in oil-water-gas multiphase flows by means of gamma-ray attenuation and artificial neural networks using one detector. Meas. J. Int. Meas. Confed. 2014, 51, 34–41. [Google Scholar] [CrossRef]
- Hagan, M.T.; Menhaj, M.B. Training feedforward networkswith theMarquardt algorithm. IEEE Trans. Neural Netw. 1994, 5, 989–993. [Google Scholar] [CrossRef] [PubMed]
- Hariri-Ardebili, M.A. MCS-based response surface metamodels and optimal design of experiments for gravity dams. Struct. Infrastruct. Eng. 2018, 14, 1641–1663. [Google Scholar] [CrossRef]
- Garson, D.G. Interpreting neural network connection weights. Artif. Intell. Expert 1991, 6, 47–51. [Google Scholar]
- Goh, A.T.C. Back-propagation neural networks for modeling complex systems. Artif. Intell. Eng. 1995, 9, 143–151. [Google Scholar] [CrossRef]
- Leung, C.K.; Ng, M.Y.; Luk, H.C. Empirical Approach for Determining Ultimate FRP Strain in FRP-Strengthened Concrete Beams. J. Compos. Constr. 2006, 10, 125–138. [Google Scholar] [CrossRef]
- Rai, D.C.; Goel, S.C. Seismic Strengthening of Rocking-Critical Masonry Piers. J. Struct. Eng. 2007, 133, 1445–1452. [Google Scholar] [CrossRef]
- Knox, C. Assessment of Perforated Unreinforced Masonry Walls Responding in Plane. Ph.D. Thesis, The University of Auckland, Auckland, New Zealand, 2012. [Google Scholar]


| Specimen | Exp. P | Num. P. | Exp. K | Num. K. | Exp. Δ | Num. Δ | |||
|---|---|---|---|---|---|---|---|---|---|
| JD [49] | 52.68 | 56.18 | 1.06 | 67.04 | 84.63 | 1.26 | 2.59 | 2.71 | 1.04 |
| J2G [49] | 37.13 | 38.22 | 1.03 | 35.77 | 35.79 | 1.00 | 7.6 | 5.94 | 0.78 |
| W2 [48] | 414.8 | 400.2 | 0.96 | 204.4 | 232.0 | 1.13 | 9.9 | 8.6 | 0.86 |
| W4 [48] | 208.0 | 202.7 | 0.97 | 86.0 | 71.0 | 0.82 | 7.0 | 5.4 | 0.76 |
| Dimension (mm) | L/W | fcm (MPa) | ftm (MPa) | G (MPa) | |||
|---|---|---|---|---|---|---|---|
| 1000 × 990 × 1000 | ~1 | 10 | 0.5 | 0.6 | 5500 | 2200 | 0.1 fcm |
| Parameter | Symbol | Min | Max | Increment Step |
|---|---|---|---|---|
| Opening height to wall height ratio | h/H | 0.1 | 7 | 0.1 |
| Opening width to wall width ratio | l/L | 0.1 | 7 | 0.1 |
| Load bearing capacity ratio | PO/P | 0.14 | 0.98 | 0.1 |
| Stiffness ratio | KO/K | 0.08 | 0.96 | 0.1 |
| l/L | h/H | Opening Area/Wall Area | h/l | v/vf | k/kf |
|---|---|---|---|---|---|
| 0.1 | 0.1 | 0.01 | 1 | 0.980666 | 0.96871 |
| 0.2 | 0.2 | 0.04 | 1 | 0.806663 | 0.858486 |
| 0.3 | 0.3 | 0.09 | 1 | 0.606038 | 0.696498 |
| 0.4 | 0.4 | 0.16 | 1 | 0.445122 | 0.514551 |
| 0.5 | 0.5 | 0.25 | 1 | 0.312017 | 0.33711 |
| 0.6 | 0.6 | 0.36 | 1 | 0.23022 | 0.188257 |
| 0.7 | 0.7 | 0.49 | 1 | 0.145598 | 0.08563 |
| 0.1 | 0.2 | 0.02 | 2 | 0.925045 | 0.93214 |
| 0.1 | 0.3 | 0.03 | 3 | 0.852023 | 0.887458 |
| 0.1 | 0.4 | 0.04 | 4 | 0.775431 | 0.838527 |
| 0.1 | 0.5 | 0.05 | 5 | 0.716984 | 0.788952 |
| 0.1 | 0.6 | 0.06 | 6 | 0.654372 | 0.741823 |
| 0.1 | 0.7 | 0.07 | 7 | 0.603807 | 0.699845 |
| 0.2 | 0.3 | 0.06 | 1.5 | 0.725312 | 0.796807 |
| 0.2 | 0.4 | 0.08 | 2 | 0.653183 | 0.736415 |
| 0.2 | 0.5 | 0.1 | 2.5 | 0.598899 | 0.680144 |
| 0.2 | 0.6 | 0.12 | 3 | 0.549524 | 0.630312 |
| 0.2 | 0.7 | 0.14 | 3.5 | 0.499554 | 0.588076 |
| 0.3 | 0.4 | 0.12 | 1.3 | 0.545062 | 0.627865 |
| 0.3 | 0.5 | 0.15 | 1.6 | 0.496877 | 0.567216 |
| 0.3 | 0.6 | 0.18 | 2 | 0.439024 | 0.515452 |
| 0.3 | 0.7 | 0.21 | 2.3 | 0.42326 | 0.472573 |
| 0.4 | 0.5 | 0.2 | 1.25 | 0.392772 | 0.451198 |
| 0.4 | 0.6 | 0.24 | 1.5 | 0.36392 | 0.399176 |
| 0.4 | 0.7 | 0.28 | 1.75 | 0.339233 | 0.357584 |
| 0.5 | 0.6 | 0.3 | 1.2 | 0.290155 | 0.287535 |
| 0.5 | 0.7 | 0.35 | 1.4 | 0.269482 | 0.250064 |
| 0.6 | 0.7 | 0.42 | 1.16 | 0.206276 | 0.157353 |
| 0.2 | 0.1 | 0.02 | 0.5 | 0.893962 | 0.917203 |
| 0.3 | 0.1 | 0.03 | 0.33 | 0.762493 | 0.848056 |
| 0.3 | 0.2 | 0.06 | 0.66 | 0.681588 | 0.770925 |
| 0.4 | 0.1 | 0.04 | 0.25 | 0.625818 | 0.765388 |
| 0.4 | 0.2 | 0.08 | 0.5 | 0.558745 | 0.673191 |
| 0.4 | 0.3 | 0.12 | 0.75 | 0.500892 | 0.588849 |
| 0.5 | 0.1 | 0.05 | 0.2 | 0.496877 | 0.673191 |
| 0.5 | 0.2 | 0.1 | 0.4 | 0.450773 | 0.569148 |
| 0.5 | 0.3 | 0.15 | 0.6 | 0.406008 | 0.477723 |
| 0.5 | 0.4 | 0.2 | 0.8 | 0.345033 | 0.400335 |
| 0.6 | 0.1 | 0.06 | 0.16 | 0.402736 | 0.575328 |
| 0.6 | 0.2 | 0.12 | 0.33 | 0.352023 | 0.462271 |
| 0.6 | 0.3 | 0.18 | 0.5 | 0.308745 | 0.366984 |
| 0.6 | 0.4 | 0.24 | 0.66 | 0.270821 | 0.290497 |
| 0.6 | 0.5 | 0.3 | 0.83 | 0.241077 | 0.23178 |
| 0.7 | 0.1 | 0.07 | 0.14 | 0.314247 | 0.472959 |
| 0.7 | 0.2 | 0.14 | 0.28 | 0.271565 | 0.35385 |
| 0.7 | 0.3 | 0.21 | 0.43 | 0.231261 | 0.259722 |
| 0.7 | 0.4 | 0.28 | 0.57 | 0.199584 | 0.190317 |
| 0.7 | 0.5 | 0.35 | 0.71 | 0.17445 | 0.141386 |
| 0.7 | 0.6 | 0.42 | 0.86 | 0.162701 | 0.108164 |
| Target Response | MSE | RMSE | MAE | MAPE | NSE | R2 |
|---|---|---|---|---|---|---|
| Load bearing ratio | 1.58 × 10⁻⁵ | 0.004 | 0.003 | 0.007 | 0.999 | 0.999 |
| Initial stiffness ratio | 6.05 × 10⁻⁶ | 0.002 | 0.001 | 0.005 | 0.999 | 0.999 |
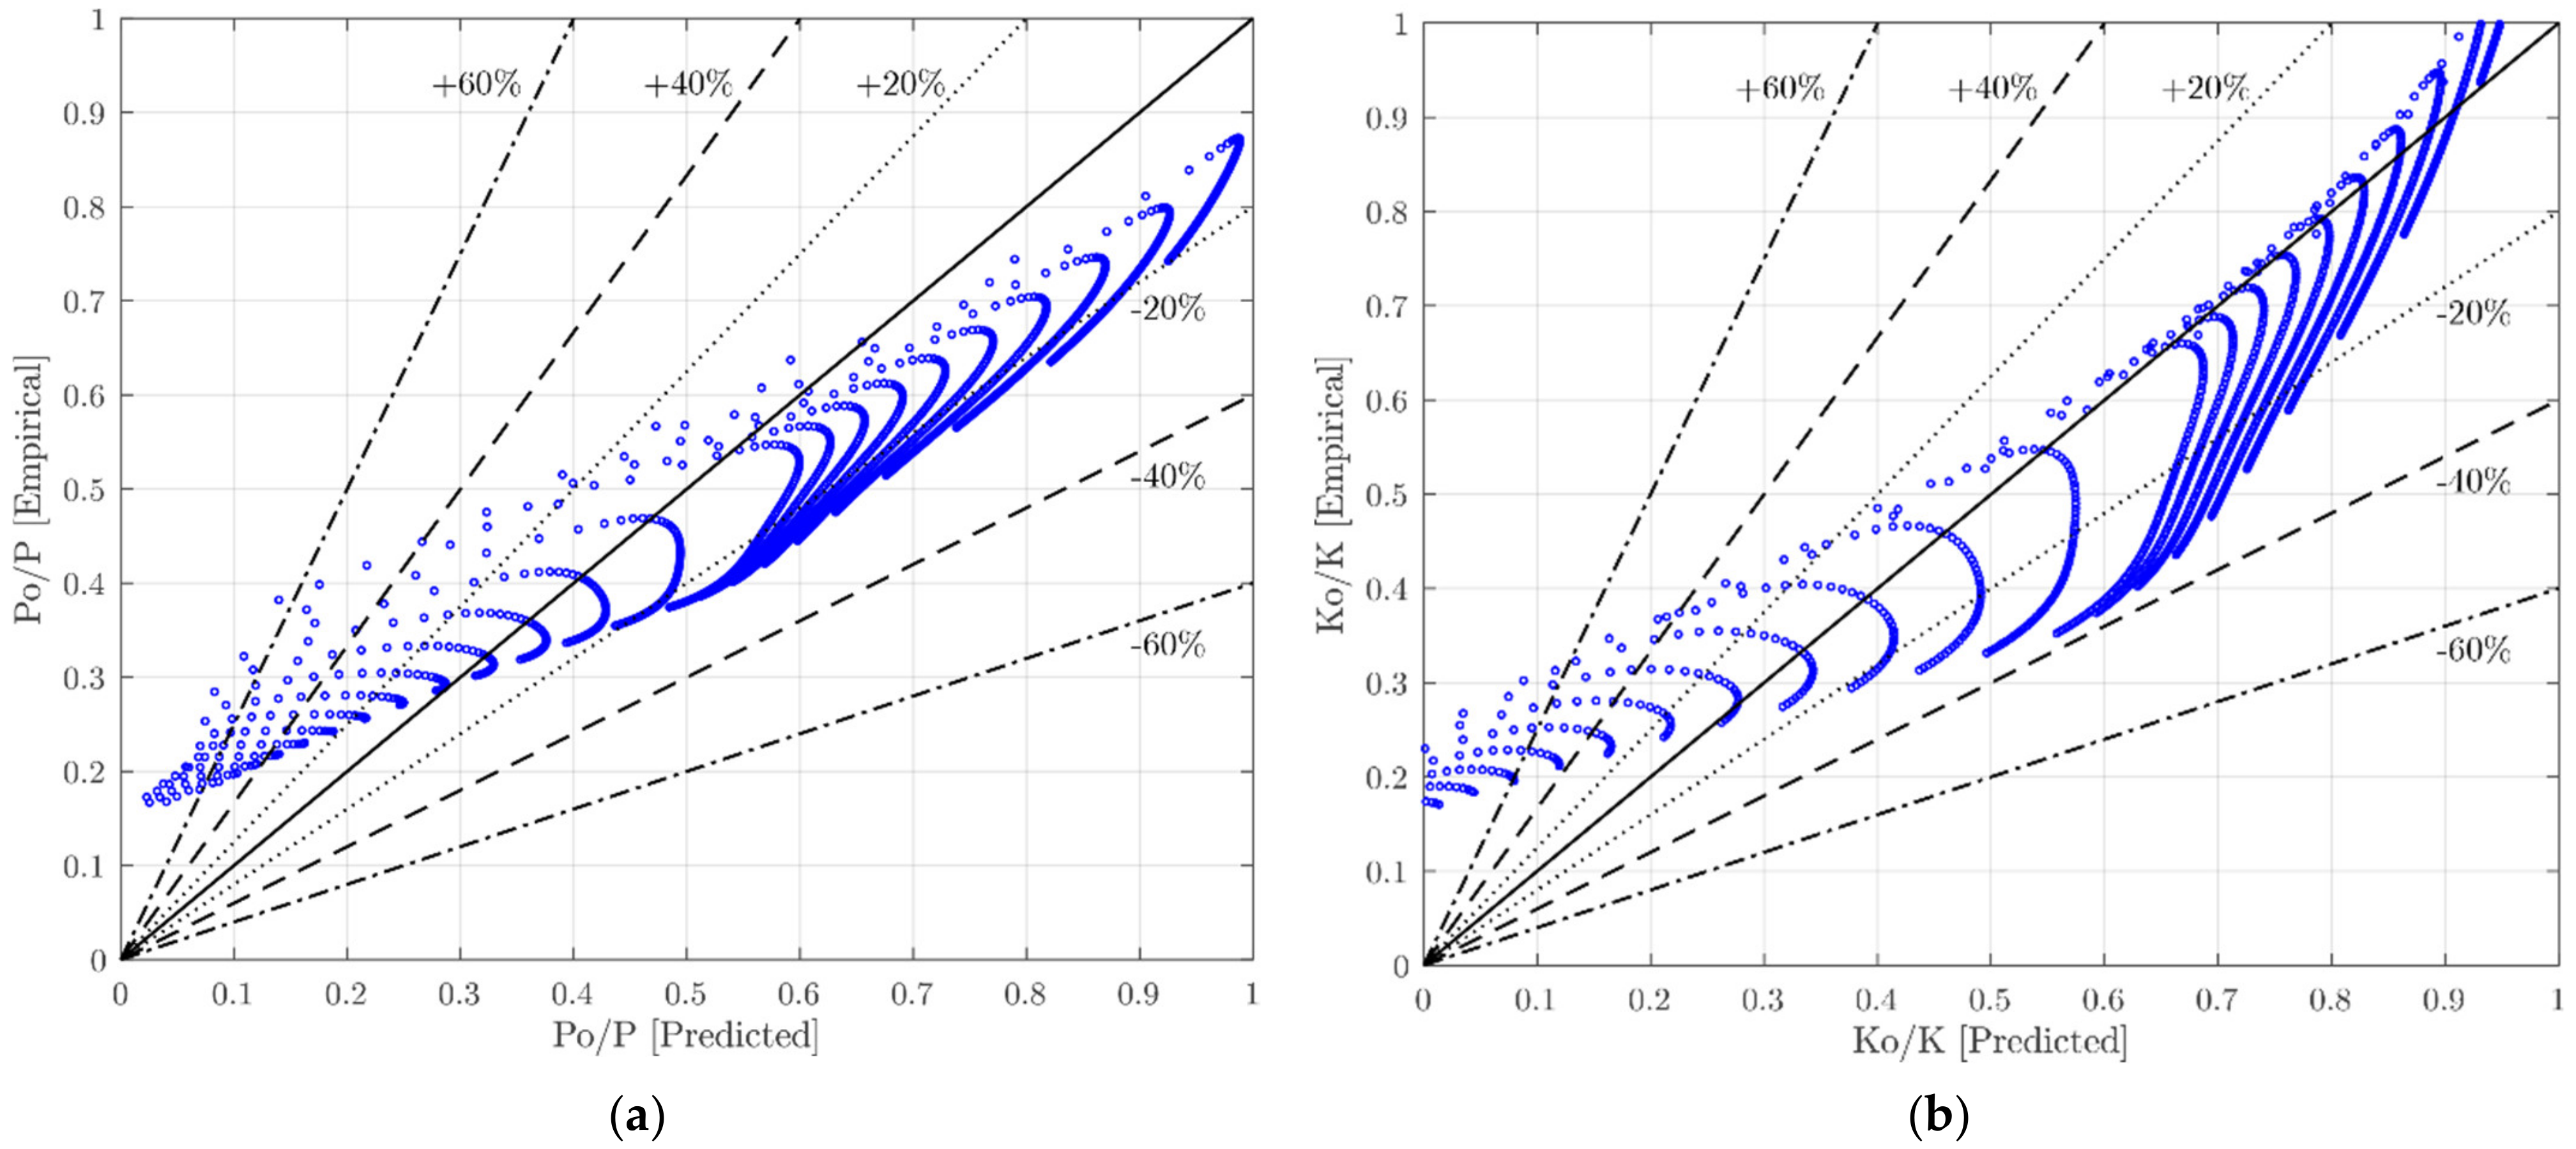
| Response | MSE | R Coefficient | Number of Data in Error Range and Percentage to Total Data | ||
|---|---|---|---|---|---|
| ±20% | ±40% | ±60% | |||
| PO/P | 0.016 | 0.954 | 667 (51%) | 1209 (92.4%) | 1273 (97.3%) |
| KO/K | 0.015 | 0.892 | 807 (61.7%) | 1209 (92.4%) | 1255 (95.9%) |
Publisher’s Note: MDPI stays neutral with regard to jurisdictional claims in published maps and institutional affiliations. |
© 2021 by the authors. Licensee MDPI, Basel, Switzerland. This article is an open access article distributed under the terms and conditions of the Creative Commons Attribution (CC BY) license (http://creativecommons.org/licenses/by/4.0/).
Share and Cite
Khaleghi, M.; Salimi, J.; Farhangi, V.; Moradi, M.J.; Karakouzian, M. Application of Artificial Neural Network to Predict Load Bearing Capacity and Stiffness of Perforated Masonry Walls. CivilEng 2021, 2, 48-67. https://doi.org/10.3390/civileng2010004
Khaleghi M, Salimi J, Farhangi V, Moradi MJ, Karakouzian M. Application of Artificial Neural Network to Predict Load Bearing Capacity and Stiffness of Perforated Masonry Walls. CivilEng. 2021; 2(1):48-67. https://doi.org/10.3390/civileng2010004
Chicago/Turabian StyleKhaleghi, Mohsen, Javid Salimi, Visar Farhangi, Mohammad Javad Moradi, and Moses Karakouzian. 2021. "Application of Artificial Neural Network to Predict Load Bearing Capacity and Stiffness of Perforated Masonry Walls" CivilEng 2, no. 1: 48-67. https://doi.org/10.3390/civileng2010004