
Reality Capture of Buildings Using 3D Laser Scanners


School of the Built Environment, Oxford Brookes University, Oxford OX3 0BP, UK
*
Author to whom correspondence should be addressed.
CivilEng 2021, 2(1), 214-235; https://doi.org/10.3390/civileng2010012
Submission received: 18 January 2021
/
Revised: 20 February 2021
/
Accepted: 24 February 2021
/
Published: 3 March 2021
(This article belongs to the Special Issue Advances in Civil Engineering)
Abstract
:The urgent need to improve performance in the construction industry has led to the adoption of many innovative technologies. 3D laser scanners are amongst the leading technologies being used to capture and process assets or construction project data for use in various applications. Due to its nascent nature, many questions are still unanswered about 3D laser scanning, which in turn contribute to the slow adaptation of the technology. Some of these include the role of 3D laser scanners in capturing and processing raw construction project data. How accurate are the 3D laser scanner or point cloud data? How does laser scanning fit with other wider emerging technologies such as building information modeling (BIM)? This study adopts a proof-of-concept approach, which in addition to answering the aforementioned questions, illustrates the application of the technology in practice. The study finds that the quality of the data, commonly referred to as point cloud data, is still a major issue as it depends on the distance between the target object and 3D laser scanner’s station. Additionally, the quality of the data is still very dependent on data file sizes and the computational power of the processing machine. Lastly, the connection between laser scanning and BIM approaches is still weak as what can be done with a point cloud data model in a BIM environment is still very limited. The aforementioned findings reinforce existing views on the use of 3D laser scanners in capturing and processing construction project data.
1. Introduction
The construction industry is in a state of constant change, as it evolves from weak productivity driven by poor management and outdated methods, to adopting new building technologies [1,2]. In the architecture, engineering, and construction (AEC) domain, 3D models are increasingly being used to improve project management. The 3D models contain vital data associated with building projects crucial for building information modeling (BIM) processes, far better than traditional construction approaches. BIM workflows provide the opportunity to organize project data, such as building geometry, construction typology, and material properties that can be used in making informed decisions [3,4,5]. While BIM facilitates the collaboration of supply chain members, the disparate backgrounds and the fact that they work on different aspects also present challenges related to data quality. Firstly, the various actors produce and capture different data at different stages of the project life cycle, making it difficult to be able to obtain a complete model reflecting the project at any given time. Secondly, the different actors may decide to withhold models from others for various reasons, such as professional secrets or because they may not be involved in the later stages of the project. Thus, in obtaining an accurate model that reflects the “as-is condition” or “as-built” condition in a project being delivered using BIM, compared with traditional methods is hardly possible. This was also noted by Rahimian et al. [6], highlighting the need for an improved collaborative decision-making system in AEC that can provide the “right information to right people at right time” (p. 102).
In recent years, major technological advances allowed for detailed three-dimensional (3D) models to represent the “as-is condition” of buildings [7,8]. Collecting the best and most accurate data about real-world conditions, often known as the “as-built” or “as-is condition”, is what is known as reality capture. 3D laser scanning is a reality capture technique. There are many reasons for real capturing of project data, which include: progress monitoring during construction project phases, facility operations for maintenance work [4,9], sustainability, and waste management [10,11]. The captured data using 3D laser scanners is often called the “point cloud”.
While BIM’s capability to support information creation, coordination, exchange, and application through the course of a building’s lifecycle has been firmly established in the literature [12], the need for capturing 3D models or “point cloud data” for existing buildings and civil infrastructure is becoming increasingly important and crucial for the development of the industry [13,14]. That said, digitalizing substantial amounts of geometric information, which may be outdated or even non-existent, can be overwhelming. Thus, appropriate survey techniques are required for capturing, managing, and visualizing building information are needed [5]. There is also a need for a framework to lead an automated simulation update of construction projects that can assist built environment professionals in their decision making [4].
Traditionally, as-built documentation using conventional surveying methods, such as a total station or a measuring tape, are labor-intensive, costly, and error-prone. In addition, only a portion of site elements can be monitored for practicality as traditional instruments can only provide spot measurements [15]. However, during the last decade, several new survey systems have been developed in the AEC industry to reflect different lifecycles of a project [16]. While each of these techniques has its own advantages and limitations, it is important to understand the process from survey to 3D modeling, focusing on single precision data, overall accuracy, costs, acquisition, and processing times [13,17,18,19,20] and, more importantly, application-oriented data acquisition as the need for capturing 3D point cloud data for existing buildings keeps increasing [11].
This paper first discusses the recent literature then goes on to explain the methodology used for both the development of a systematic review of 3D point cloud data, laser scanning, and the survey process in Section 3. It then goes on to discuss the acquisition and processing of 3D point cloud data and BIM integration. The paper finally concludes with research findings and recommended future work in Section 4.
2. Related Studies
As one of the most widely used 3D imaging techniques, laser scanning is utilized for a wide range of processes, including surveying, manufacturing inspection, quality control of building construction, and restoration of heritage buildings. Laser scanning devices are now integrated within numerous built environment applications [21], and are a consolidated technology for the collection, documentation, and analysis of three-dimensional data on the as-built status of buildings and infrastructure [22]. Laser scanning, also known as high-definition surveying (HDS) or reality capture, is a means of using a laser to map an area with high accuracy. On a construction site, it is used to capture detailed data, providing accurate information for all stages of the project. The acquired data provide construction professionals with what is known as a “point cloud”, which is a database connecting points in a 3D coordinate system. Point cloud systems keep an extremely accurate digital record of an object or space as it pertains to a project [23], and are composed of raw information that is processed to extract useful information for the applications they are intended to serve [22]. 3D point cloud data from 3D laser scanners are able to capture the surface geometries of target objects in an accurate and efficient manner, and provide accurate and fast records of the 3D geometries of construction-related objects [11].
Laser scanning has been extensively applied in conjugation with BIM to cover several aspects of construction, such as monitoring [5,24], cost estimation and quality assessment [25], and 3D visualization and spatial analysis [26] in an effort to increase accuracy and reduce errors and rework. However, to date, very little of the literature provides a complete framework for the acquisition of point cloud data and how they are applied in BIM in relation to different users. For instance, in [5], a framework for the acquisition of point cloud data has been investigated, however, the presented framework was limited to the conversion of the point cloud to a BIM without really highlighting the use of the BIM in relation to the different possible users. In addition, the literature has shown that the demand for 3D models in the AEC industry is constantly increasing [27], leading to the development of various technologies that are able to capture or measure existing buildings or structures within the built environment, and then present them in 3D for modeling purposes [27]. However, there is still a need for an automated update of 3D virtual models reflecting the state of the construction, which was highlighted by Rahimian et al. [4], identifying the need for a platform that can support continuous system updates to enable effective comparisons between as-built and as-planned BIM.
Although laser scanners have been proven to provide high performance reality capture in an outdoor environment [27,28], there is still a clear knowledge gap between the theory of laser scanning and its application for construction mapping due to technical limitations on portability and site constraints, and the cost of high-performance 3D laser scanners. Although increasing productivity in the construction industry could add up to USD 1.6 trillion in value [29], many construction professionals are still hesitant to adopt these technologies. This is mostly due to limited knowledge, and a lack of a comprehensive framework that could assist built environment professionals during various lifecycles of a project in how to properly acquire and process point cloud data to fulfil the needs of the intended construction applications. Collecting insufficient data could render a model useless for its intended use while collecting too much data will take a longer time and more effort and result in redundant data. Hence, it is important to determine the required point cloud data quality for each specific application to facilitate the acquisition of point cloud data. This has been stated in a Wang and Kim review of 197 scientific articles, in which they identified application-oriented data acquisition as one of the research gaps, “research is still lacking to identify the required point cloud data quality for each specific application” [11] (p. 314). Their review also highlighted that less than 9% of the current literature on the applications of point cloud data focus on building renovations and heritage buildings despite the need for point cloud data of existing buildings for the purposes of building renovation, retrofit, and refurbishment [30].
Notwithstanding the numerous advantages of laser scanning, such as a shorter survey duration that results in the acquisition of over a million points per second, and improved accuracy that captures complex shape geometries [5,7,31], some limitations are still evident [32]. These include the cost of equipment, the need for professional operators, integration with BIM systems, and the conversion of point cloud data into geometric forms that may be used to create the labeled BIM elements [5,33]. This paper attempts to investigate the theoretical and practical challenges of using laser scanners. It provides a brief literature review on the use of 3D laser scanners, followed by a systematic review to identify the current research gaps and a field study for the surveying, acquisition, and processing of 3D point clouds for both exterior and interior spaces. Both the results of the systematic review and the case study were used to propose a framework that reviews various 3D laser scanners for data acquisition and different software platforms for 3D point cloud data processing to explore their interoperability (integration) with BIM systems in relation to various users.
Despite the multiple applications of laser scanning alongside BIM in the current research, most studies focused on the process after the point cloud data exportation, with little attention being given to the acquisition of the data themselves. In [34,35,36], the authors divide the process of creating as-built BIM using laser scanning into three steps: data acquisition; data processing; and BIM integration. However, in most cases, the first two steps are simply briefly discussed, with the focus on BIM; similarly, in [37], the authors present a methodology for the automatic extraction of BIM components from point cloud data, with the methodology starting after the point cloud data have been acquired [5]. Finally, in [37,38], the authors propose methodologies that fuse laser scanning, infrared thermography and BIM for energy analysis, respectively. The focus of both articles falls on the processes of the acquisition of the point cloud, although Lagüela et al. [38] identify the need for three scan station positions, referring to important aspects for the registration of the acquired scans [5]. Additionally, a few studies investigated the relationship between the point cloud data quality and the identification of building elements from point cloud data [11,39].
Based on the resulting literature review, this paper focuses on point cloud data acquisition and processing using a historic building as a case study to contribute to the current gap in the literature in this area. It also attempts to propose an initial framework that can be further developed to assist users in data acquisition and processing.
Based on the systematic review, a significant number of research papers about point clouds from 3D laser scanners have been published in the past decade. However, most of the earlier publications have been about point cloud applications in the industrial and manufacturing sector. It has only happened recently that point cloud applications have gained momentum in the construction industry. Therefore, the literature search was mainly focused on the last five years, corresponding to the period where much interest in the automation of construction processes has been focused. An attempt to summarize the evolution of research in 3D point cloud and 3D laser scanning through a systematic review from academic papers published from 2015 to 2020 is undertaken.
3. Materials and Methods
This paper has been developed based on a 3-step methodology: systematic review; field survey, and BIM integration framework. A systematic review of the literature is adopted in order to sift related studies and identify knowledge gaps regarding the applications of 3D laser scanners in the built environment. The systematic literature review was then supported by a field survey based on a case study. The field survey was conducted for the external and internal envelope of the building, using a 3D laser scanner. The acquired scanning stations were processed in a sequence of steps that resulted in the formulation of a point cloud model of the scanned case study. The point cloud model was inspected to assess the reliability of the resulting model, using related software tools. A framework integrating the point cloud model with the BIM system was then developed from the knowledge and data acquired from the preceding stages. The framework integrated the resulting point cloud model with the BIM system by first investigating possible integration methods into BIM software and, second, demonstrating possible applications based on the resulting point cloud model in relation to various users. A Trimble TX8 laser scanner was used for the point cloud data acquisition. The details of the methods are discussed in the following sections.
3.1. Systematic Review
The systematic review aims to provide a thorough analysis of the applications of 3D point cloud data in the construction industry. Furthermore, it attempts to summarize the evolution of research in 3D point clouds and 3D laser scanning from academic papers published from 2015 to 2020. Following the review of different applications, discussions are provided regarding how to properly acquire and process point cloud data to fulfil the needs of construction applications.
The papers were obtained from selected peer-reviewed academic journals and databases. These include Science Direct, Emerald, Ebsco, and Google Scholar. The search terms used for the literature search related to the acquisition and processing of point clouds were “3D Laser Scanning” + “3D Point Cloud”. The “3D Laser Scanning” + “3D Point Cloud” and “Scan to BIM” search terms yielded results for Science Direct, Ebsco, and Google Scholar and nothing for Emerald. A second attempt was undertaken whereby the term “abstract” was affixed to the terms “3D Laser Scanning” + “3D Point Cloud” and “Scan to BIM” to form “3D Laser Scanning” + “3D Point Cloud” + “abstract” and “Scan to BIM” + “abstract” which yielded results from Emerald. To facilitate understanding, the search results are summarized in Table 1 and Table 2, for Science Direct, Ebsco, Emerald, and Google Scholar.
Based on Table 1, a total of 15 research papers published from 2015 until January 2020 were identified. These results are from a combination of “3D Laser Scanning” + “3D Point Cloud” and then “Scan to BIM” in the Science Direct search engine. A total of 88 research papers published from 2015 until January 2020 were identified. These results are from a combination of “3D Laser Scanning” + “3D Point Cloud” and then “Scan to BIM” in the Ebsco search engine. Additionally, a total of 10 research papers were identified published from 2015 until January 2020. These results were from a combination of “3D Laser Scanning” + “3D Point Cloud” + “abstract” and then “Scan to BIM” + “abstract” in the Emerald search engine.
Based on Table 2, a total of 16 research papers published from 2015 until January 2020 were identified. These results are from a combination of “3D Laser Scanning” + “3D Point Cloud” and then “Scan to BIM” in the Google Scholar search engine.
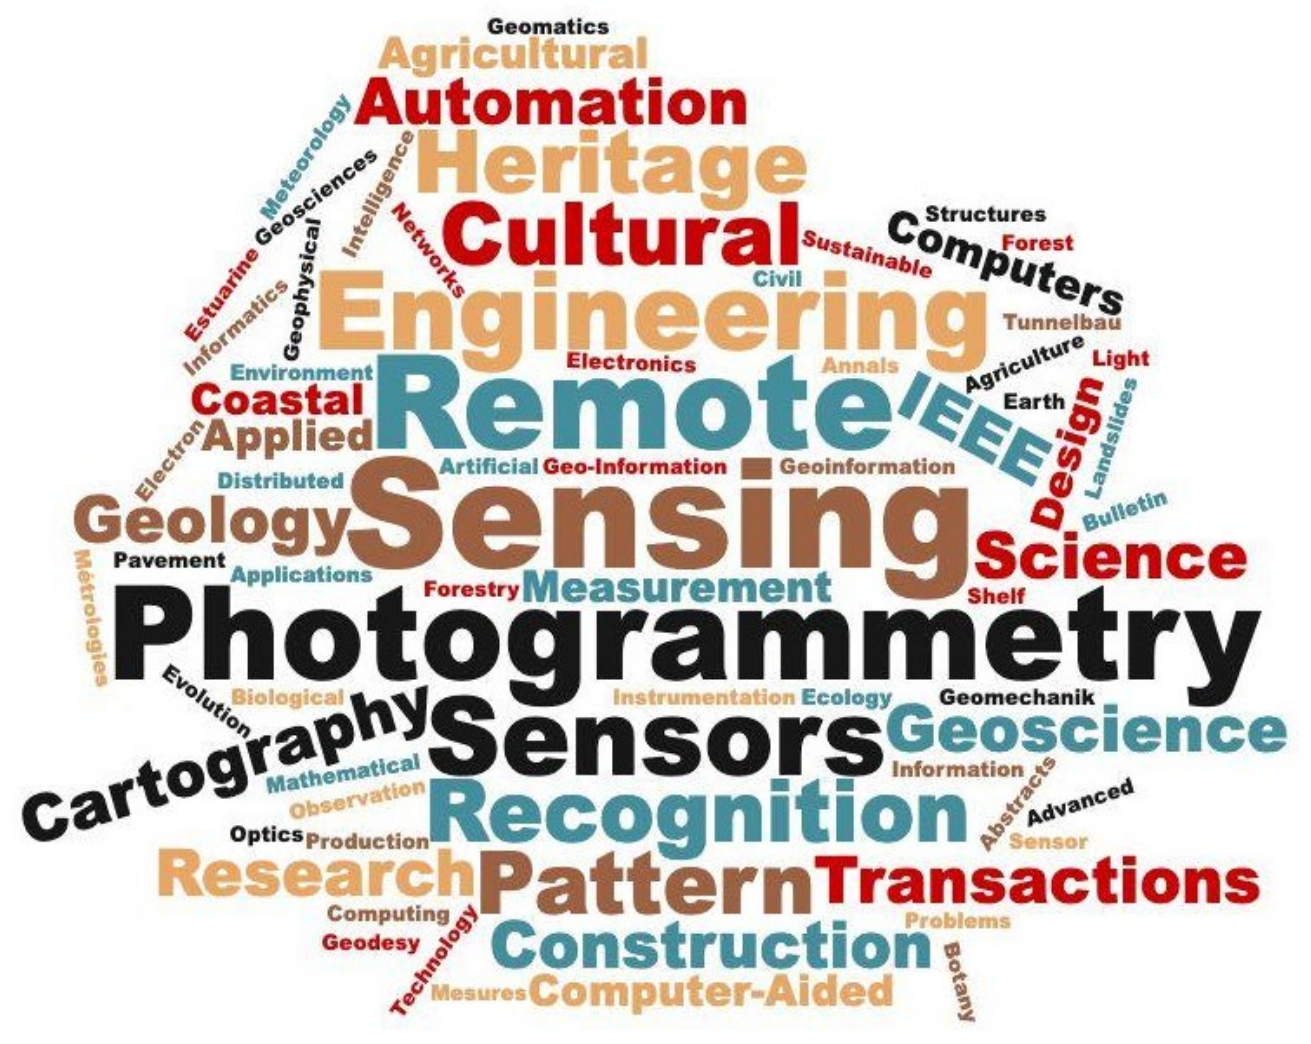
Given that the aim of the systematic review was to understand the evolution of research in 3D point clouds and 3D laser scanning, it is imperative to investigate trends in various disciplines and areas of applications. To gain insights into the application of 3D laser scanning in the different domains, a word cloud was generated from all the articles obtained using “3D Laser Scanning” + “3D Pont Cloud”. The result is shown in Figure 1.
Based on Figure 1, the result shows that the application of laser scanning in “construction” as a discipline is very limited. This can be seen at the bottom of the point cloud above. For example, the European Journal of Remote Sensing and the American Journal of Engineering Research discuss the density and the size of point cloud data in the natural environment with a focus on forests and vegetation. Furthermore, IEEE Access explores point cloud data, their intensity, and use in tunnel inspections. Moreover, Applied Mechanics and Materials and Revista de la Facultad de Ingeniería U.C.V focus on the methods of processing point cloud data using software such as Geomagic and Cyclone for diagnostics and registration. Nonferrous Metals Science and Engineering also focused on point cloud data processing, while Computer Science discussed the display speed of point cloud data for visualization purposes. Metal Mine proposed a method to automatically extract the boundary features of a surface from the point cloud data. Finally, Automation in Construction, Pattern Recognition, and Construction Management and Economics overlap with the results from Science Direct.
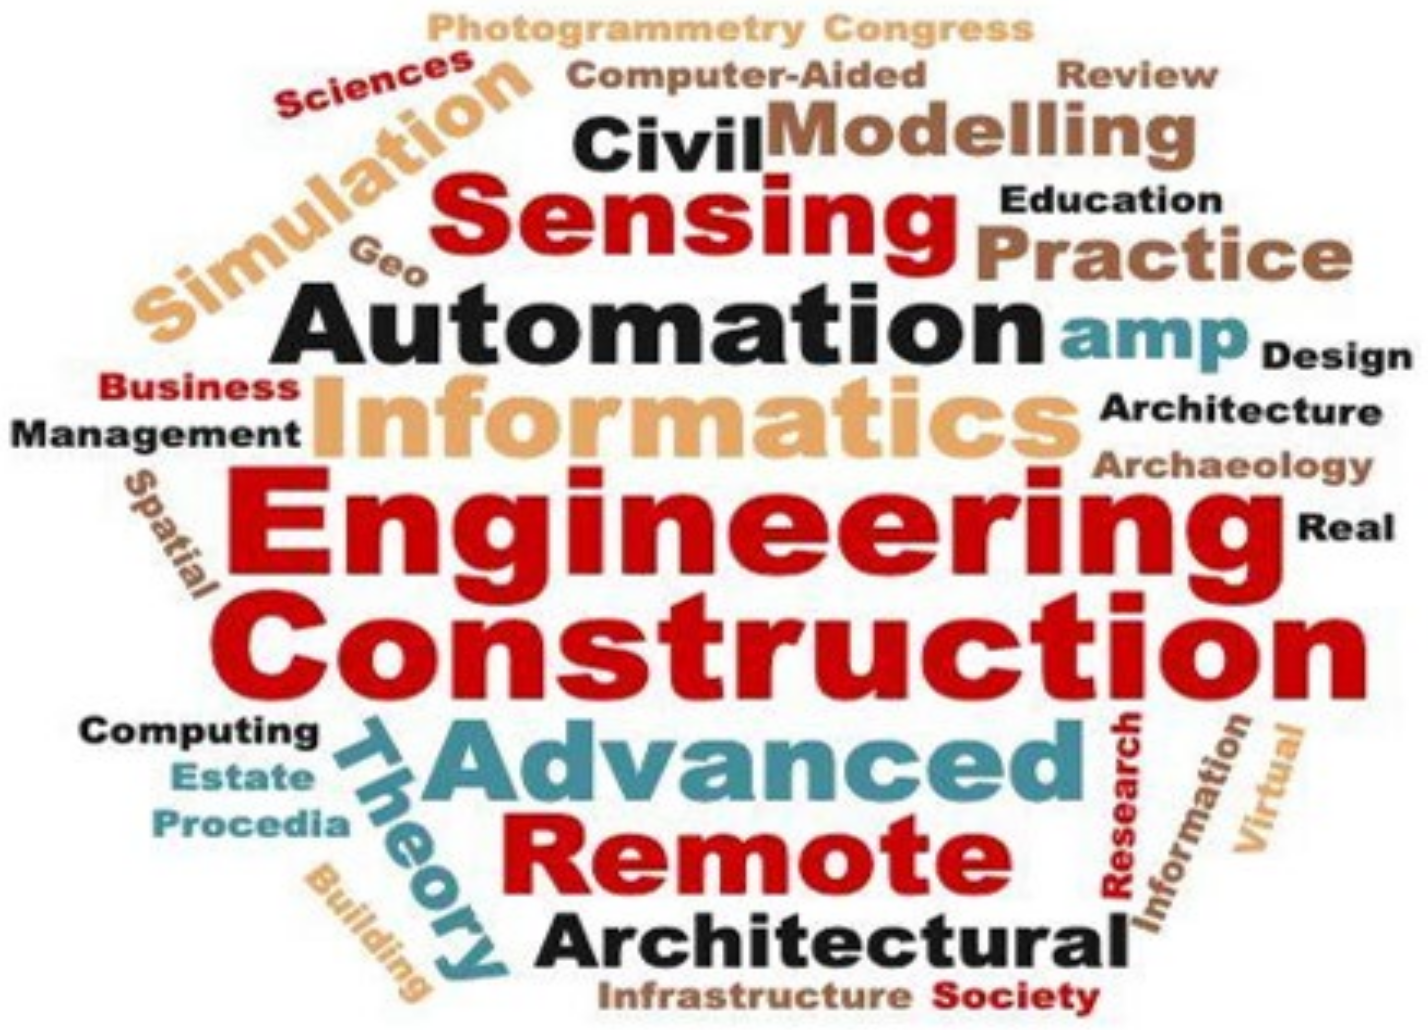
The word cloud in Figure 1 shows that the literature focuses on the technical side of 3D point clouds and 3D laser scanners as the main journals are on remote sensing, photogrammetry, and sensors, while published papers in the construction field are limited. To gain insights into the application of 3D laser scanning, a word cloud was generated from all the articles obtained using “Scan to BIM”, as shown in Figure 2.
It can be inferred from Figure 2 that 3D laser scanning applications are quite common in construction practice as a process. In addition to the findings that emerged from the systematic review presented and discussed in Table 1 and Table 2 and Figure 1 and Figure 2, a detailed examination of the articles also revealed some interesting results. These include automated processing of point cloud data based on material and color, which identifies topologies (building elements) based on texture, intensity value, and RGB color space that aims to identify the spatial relationships between building elements and their surface properties [11]. Additionally, Xiong et al.’s work attempts to automatically identify walls, floors, ceilings, and any significant rectangular openings (e.g., doorways and windows) [23]. All this can lead to imprecise quality assurance and progress estimates, which was mentioned by Chen et al. [26] concerning visibility issues in scan to BIM applications. Additionally, the relationship of point cloud intensity and the processing, and the quality of data was examined [28].
3.2. Field Survey: Point Cloud Model Development
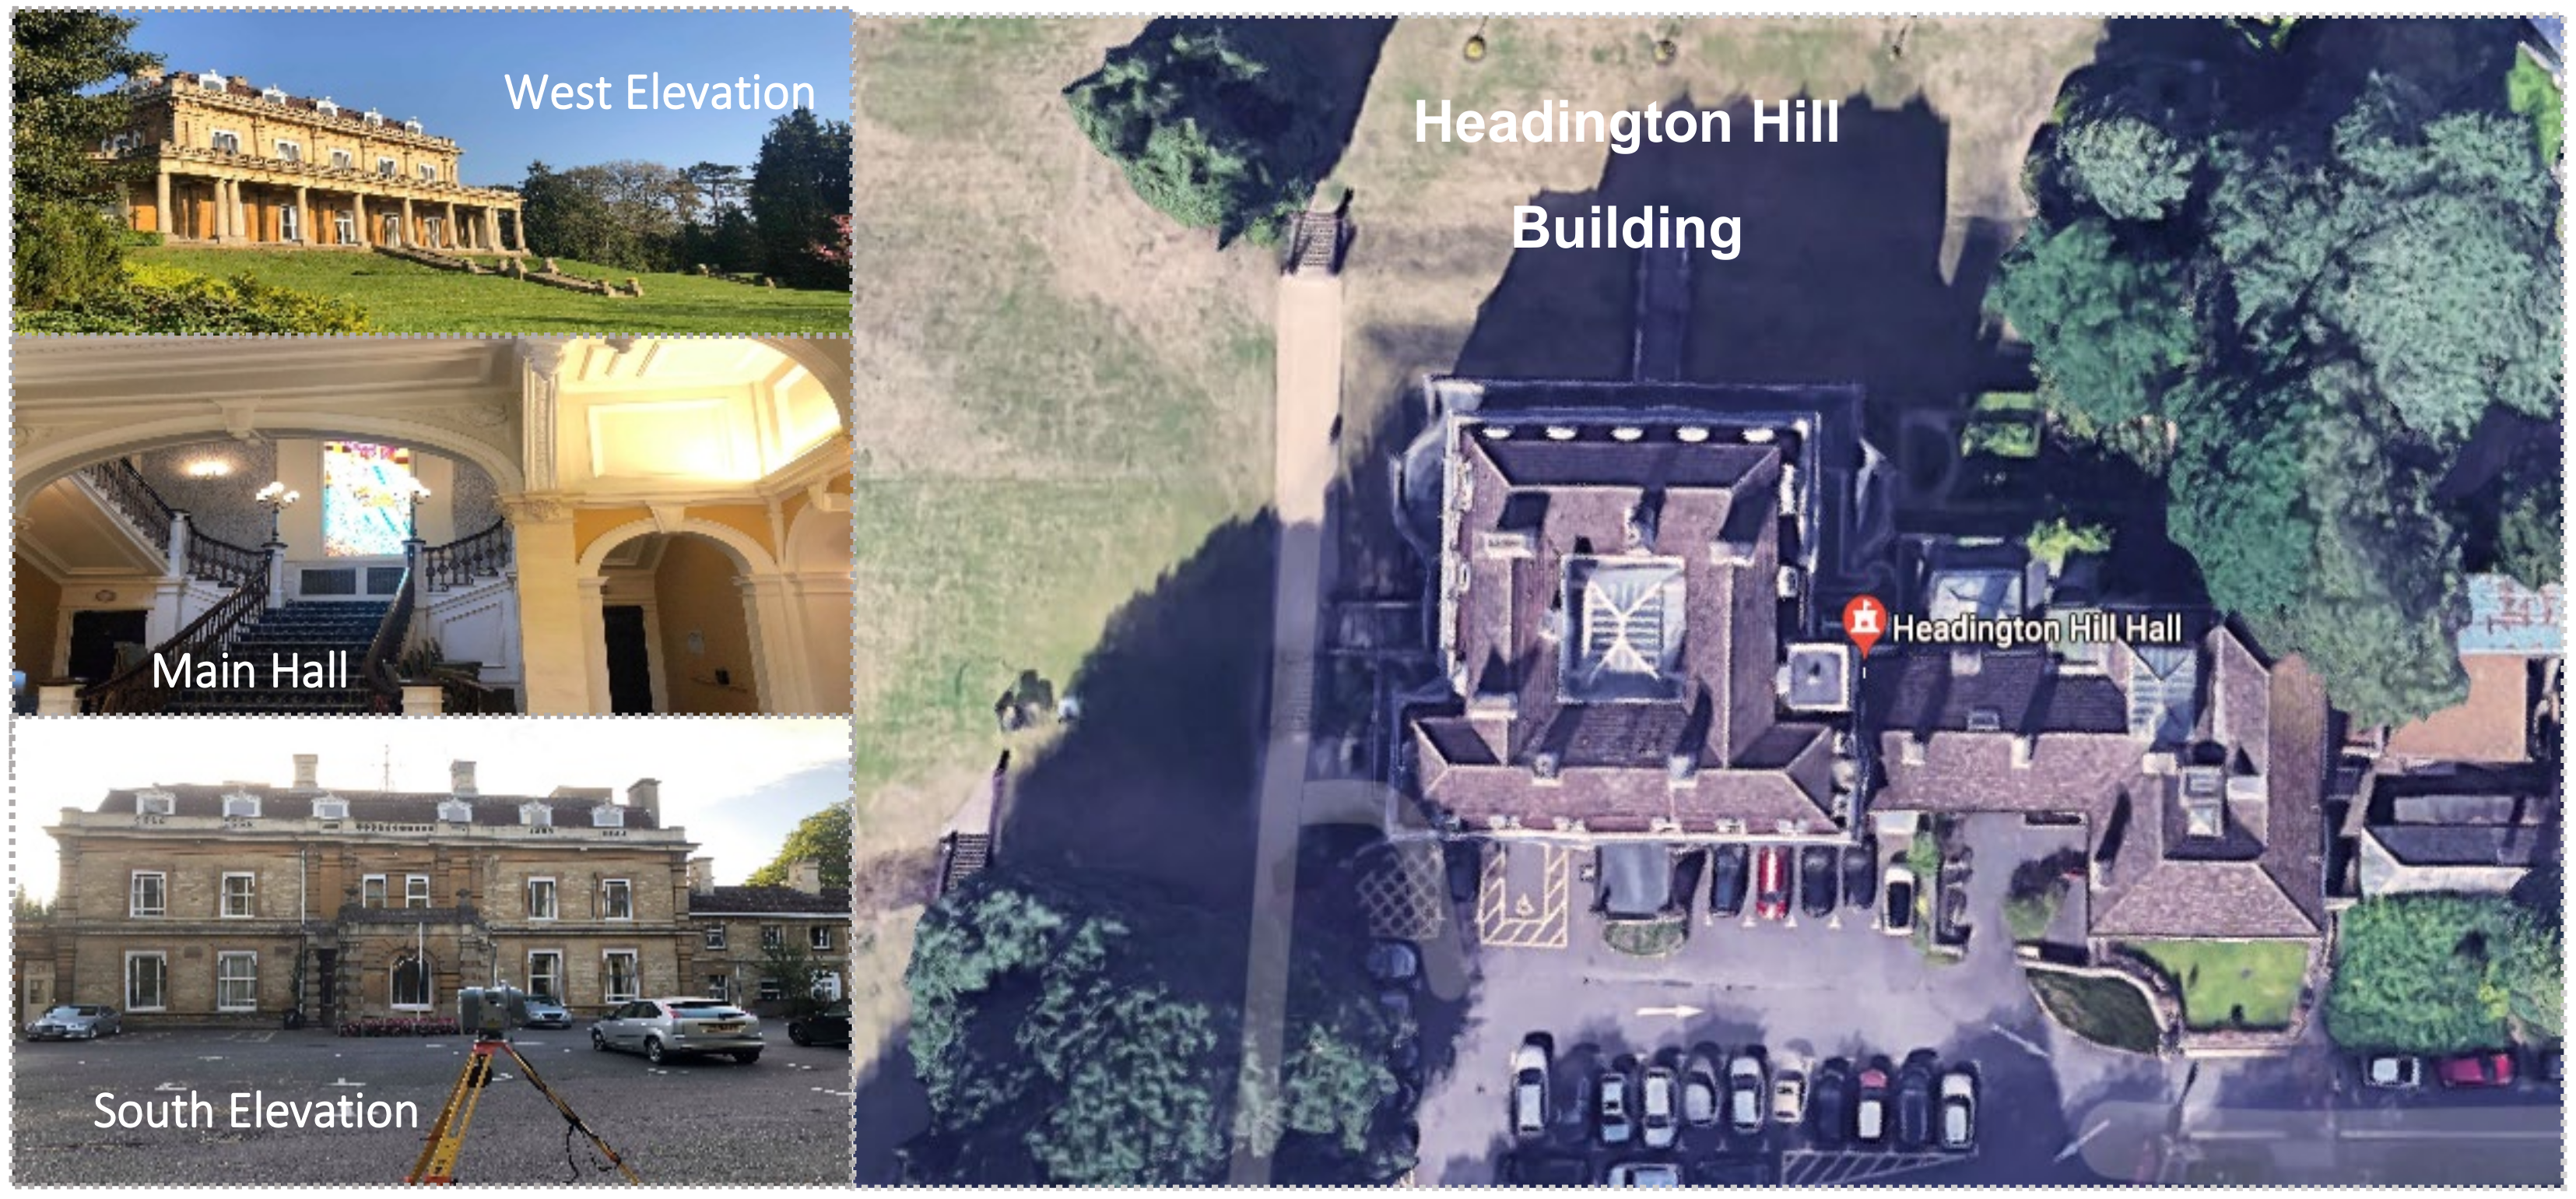
The following field survey is the core of the “proof-of-concept” approach used for this study and was imperative to describe the case study building and the technologies used in data acquisition and analysis. The Headington Hill Building, a historic mansion built in 1824, and is located on the Oxford Brookes University Campus in Oxford, UK. The main reason for selecting the building lay in the historical value of the asset and the rich detail level on the external and internal envelope of the building. The uniqueness and the appropriate scale of the building allowed the collection of sufficient data from the scans to examine the feasibility and accuracy of the 3D laser scanning device. The aerial view is presented in Figure 3.
The main surveying equipment used was a 3D laser scanner, Trimble TX8. The key technical specifications of the Trimble TX8 are listed in Table 3.
The Trimble TX8 provides high-resolution scans with a performance range of 1 million points/second, with an integrated HDR camera that colorizes the scans. The device provides a 360° × 317° view range, capturing high-resolution scans up to 120 m from the station point. The applications of the Trimble TX8 in the built environment include urban studies, documentation of historic buildings, quantity surveying, construction, quality control, and building maintenance purposes.
Data from the Trimble TX8 were processed though Trimble Realworks software. It provides a complete solution to efficiently register, analyze, model, and create deliverables using data from virtually any source. Revit, one of the leading pieces of BIM authoring software used for the 3D design of projects, was also used in the project and can also be used for other applications such as visualization, generation of schedules, and quantities.
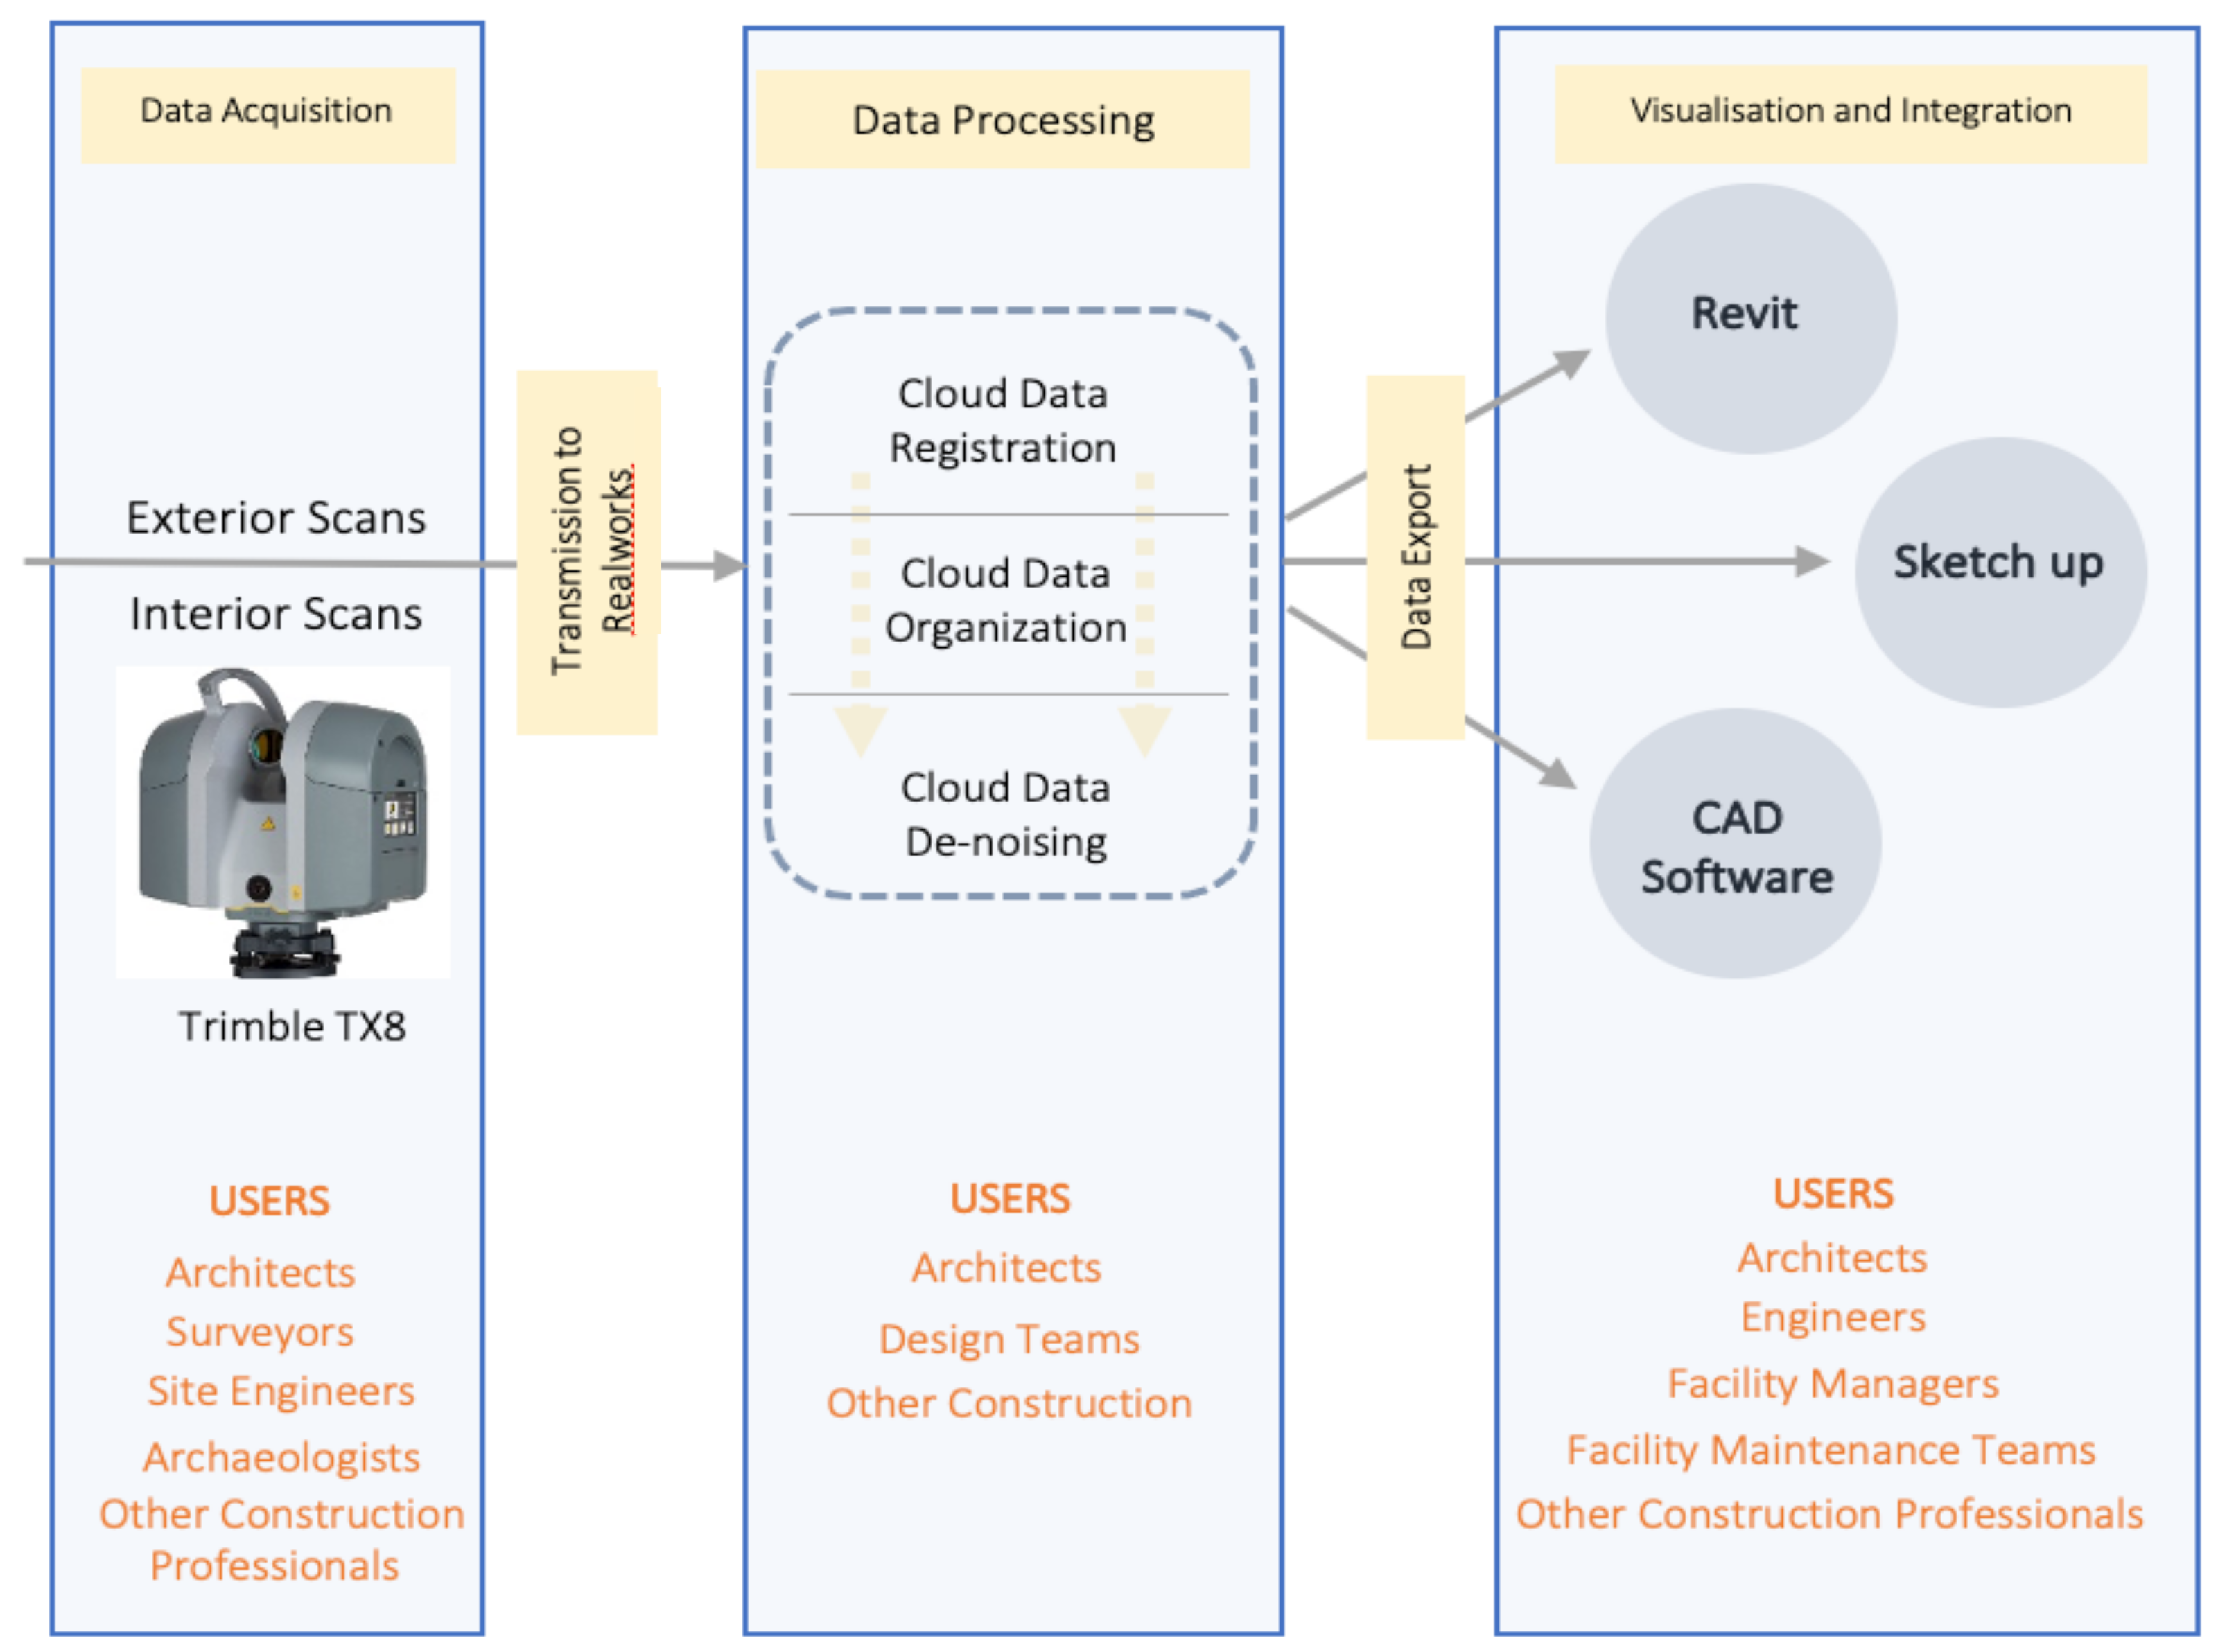
Having examined the case study building to accomplish this “proof-of-concept” method, the following framework will be examined, see Figure 4.
The first step was to capture the building data using the Trimble TX8. This involves exterior and interior scans with different characteristics in terms of station point distance, number of cloud points, level of detail, and level of accuracy. The scanning strategy was based on the positioning of the scanning device to capture the external envelope of the building and formulate a coherent 3D model through capturing the external elevations of the building from various stations with different angles, distances, and heights. The interior scanning strategy was based on scanning the internal spaces of the building in separation, then merging the scanned spaces into a single model that represents the internal envelope of the building. Interior scans are classified by floor level and involve a number of scans that shape the 3D model of the floor. Common spaces with double floor heights were scanned from various points and floor levels to formulate a unified cloud model that illustrates the spaces without the duplication of cloud points.
3.2.1. Data Acquisition
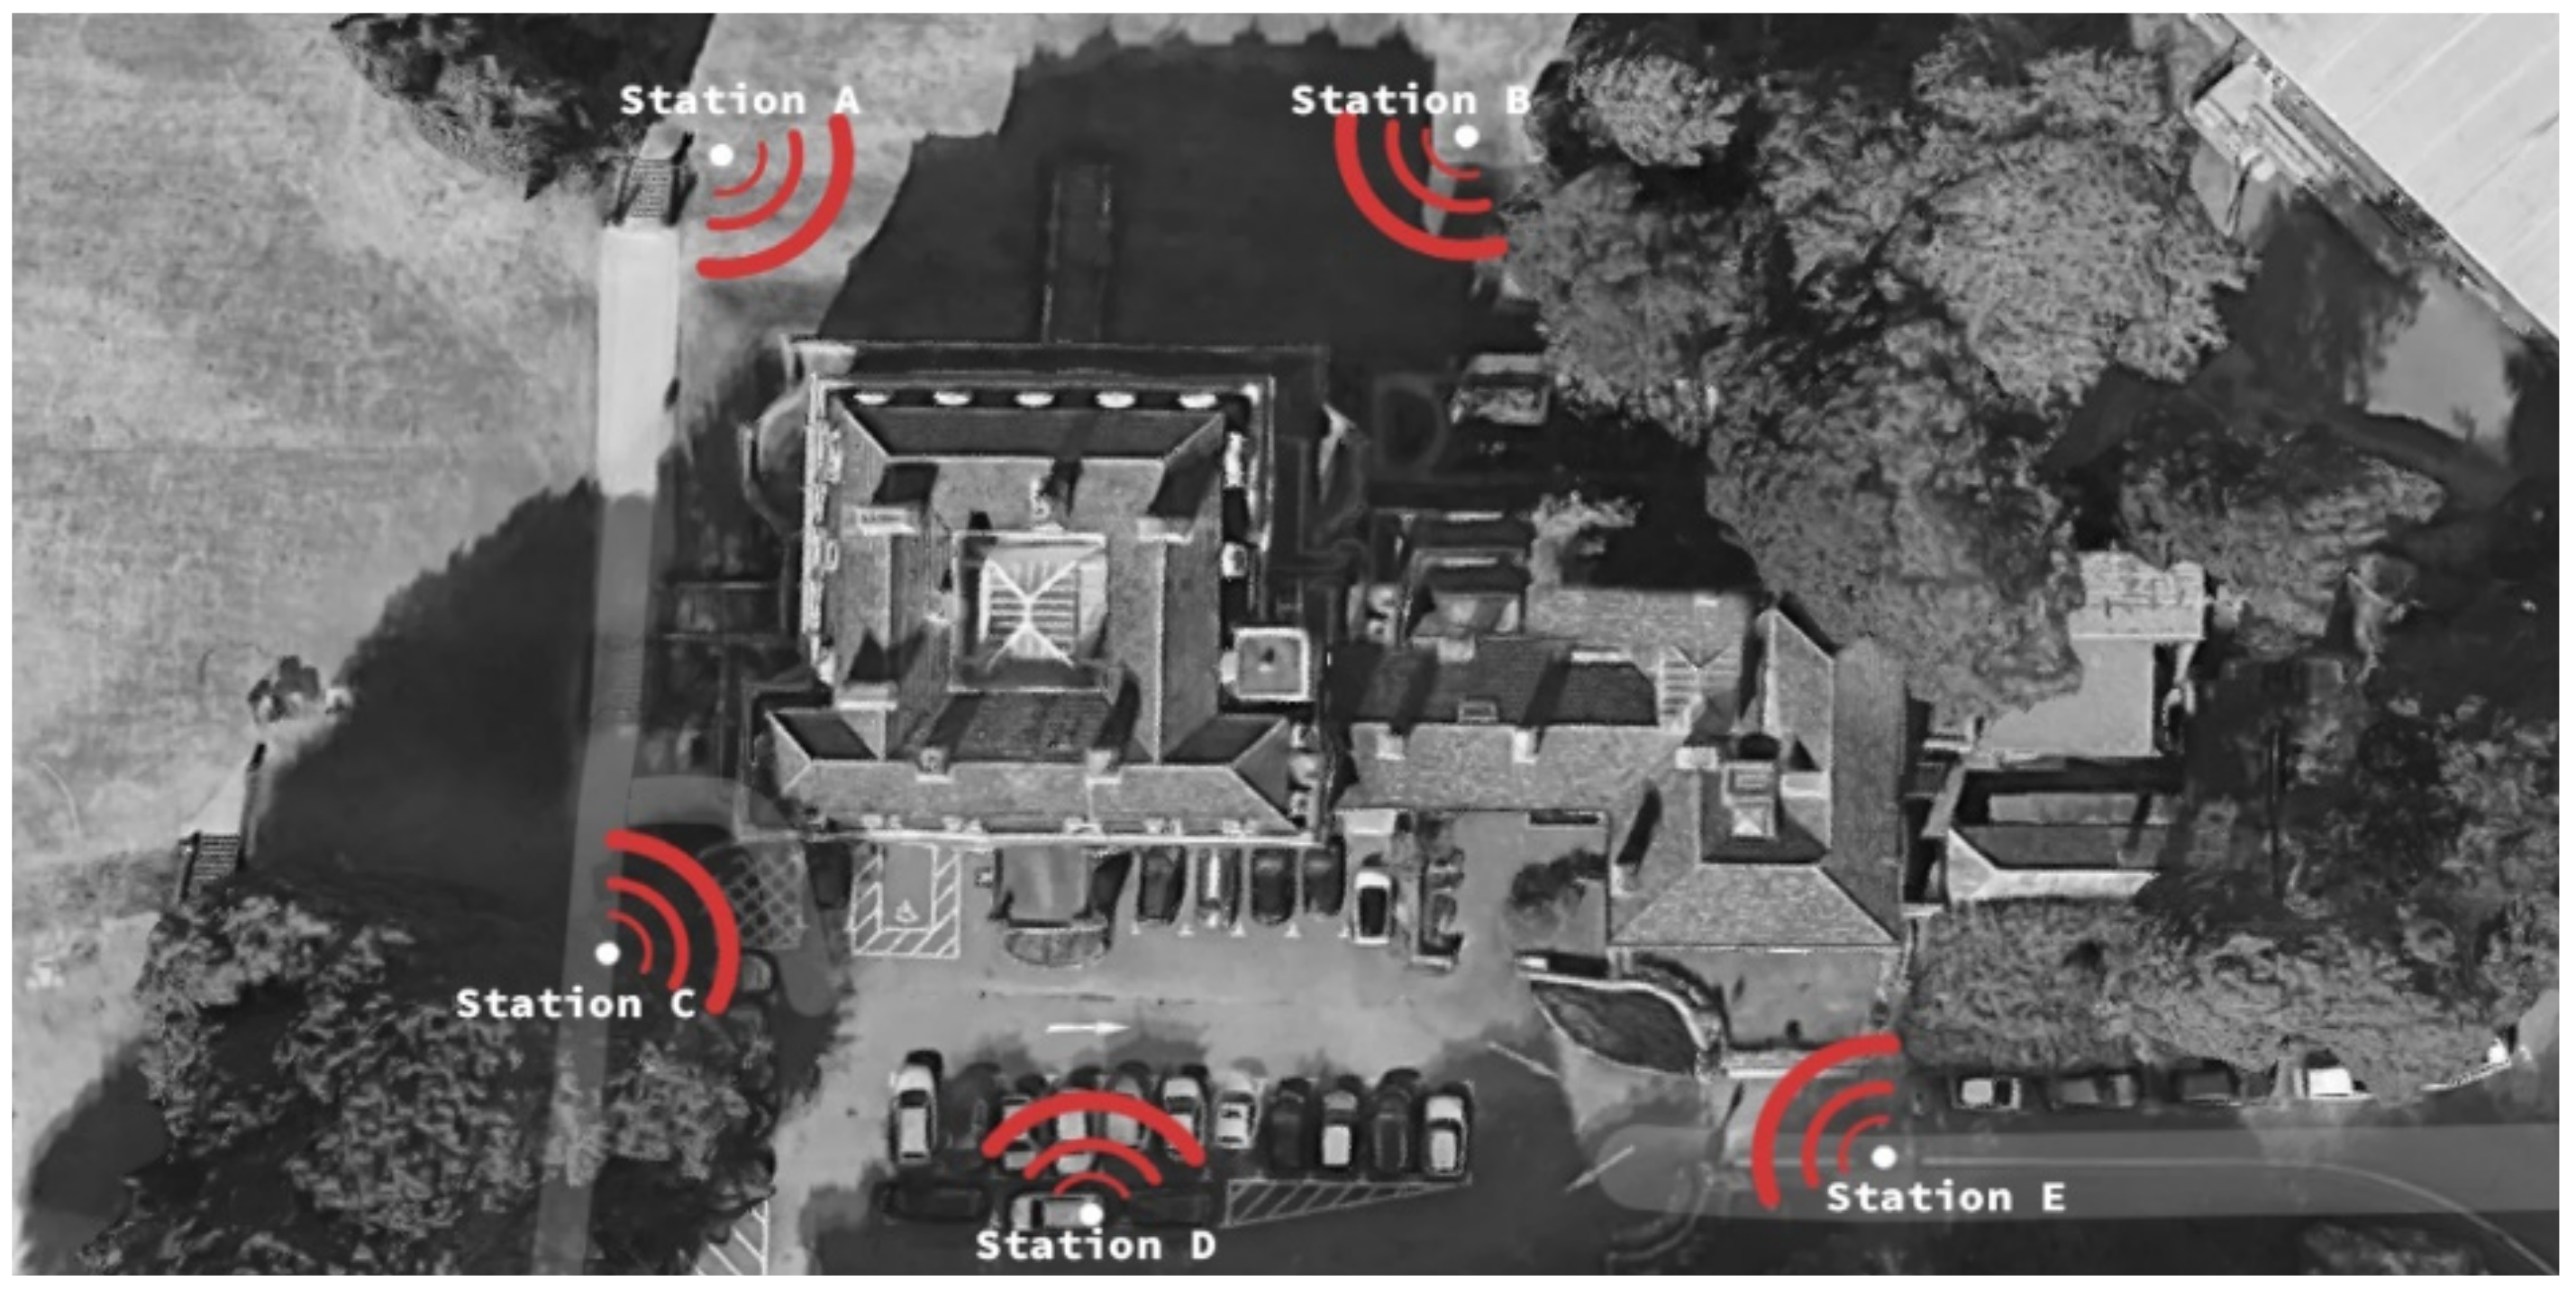
The surveying was conducted in two phases, one each for the exterior envelope and interior spaces of the building. Phase 1 was conducted through five station points surrounding the exterior elevations to shape a comprehensive field of view and enable the device to identify and integrate the external surfaces. Figure 5 shows station points locations on site. Station A and station B cover the western elevation, while stations D, C, E cover the eastern elevation. Station A, C together cover the southern elevation and station E covers the apparent part of the northern elevation. The station points were placed at different distances from the nearest building surface. Station A was 15.5 m away from the nearest surface, while station C was 6.5 m away from the nearest surface. Station D recorded the farthest distance of 22.5 m. The variation in point distances relates to the desired angle, field of view of the scans, and the existing site situation, limits, and obstacles.
Noticeably, the distance between the station points and the nearest building surface affected the cloud point number of each scan. The cloud points acquired from the station A scan were at a distance of 1.5 m, while cloud points of station C and E were 11 m and 34 m, respectively. Table 4 demonstrates the distances of the stations along with the acquired cloud points from each station.
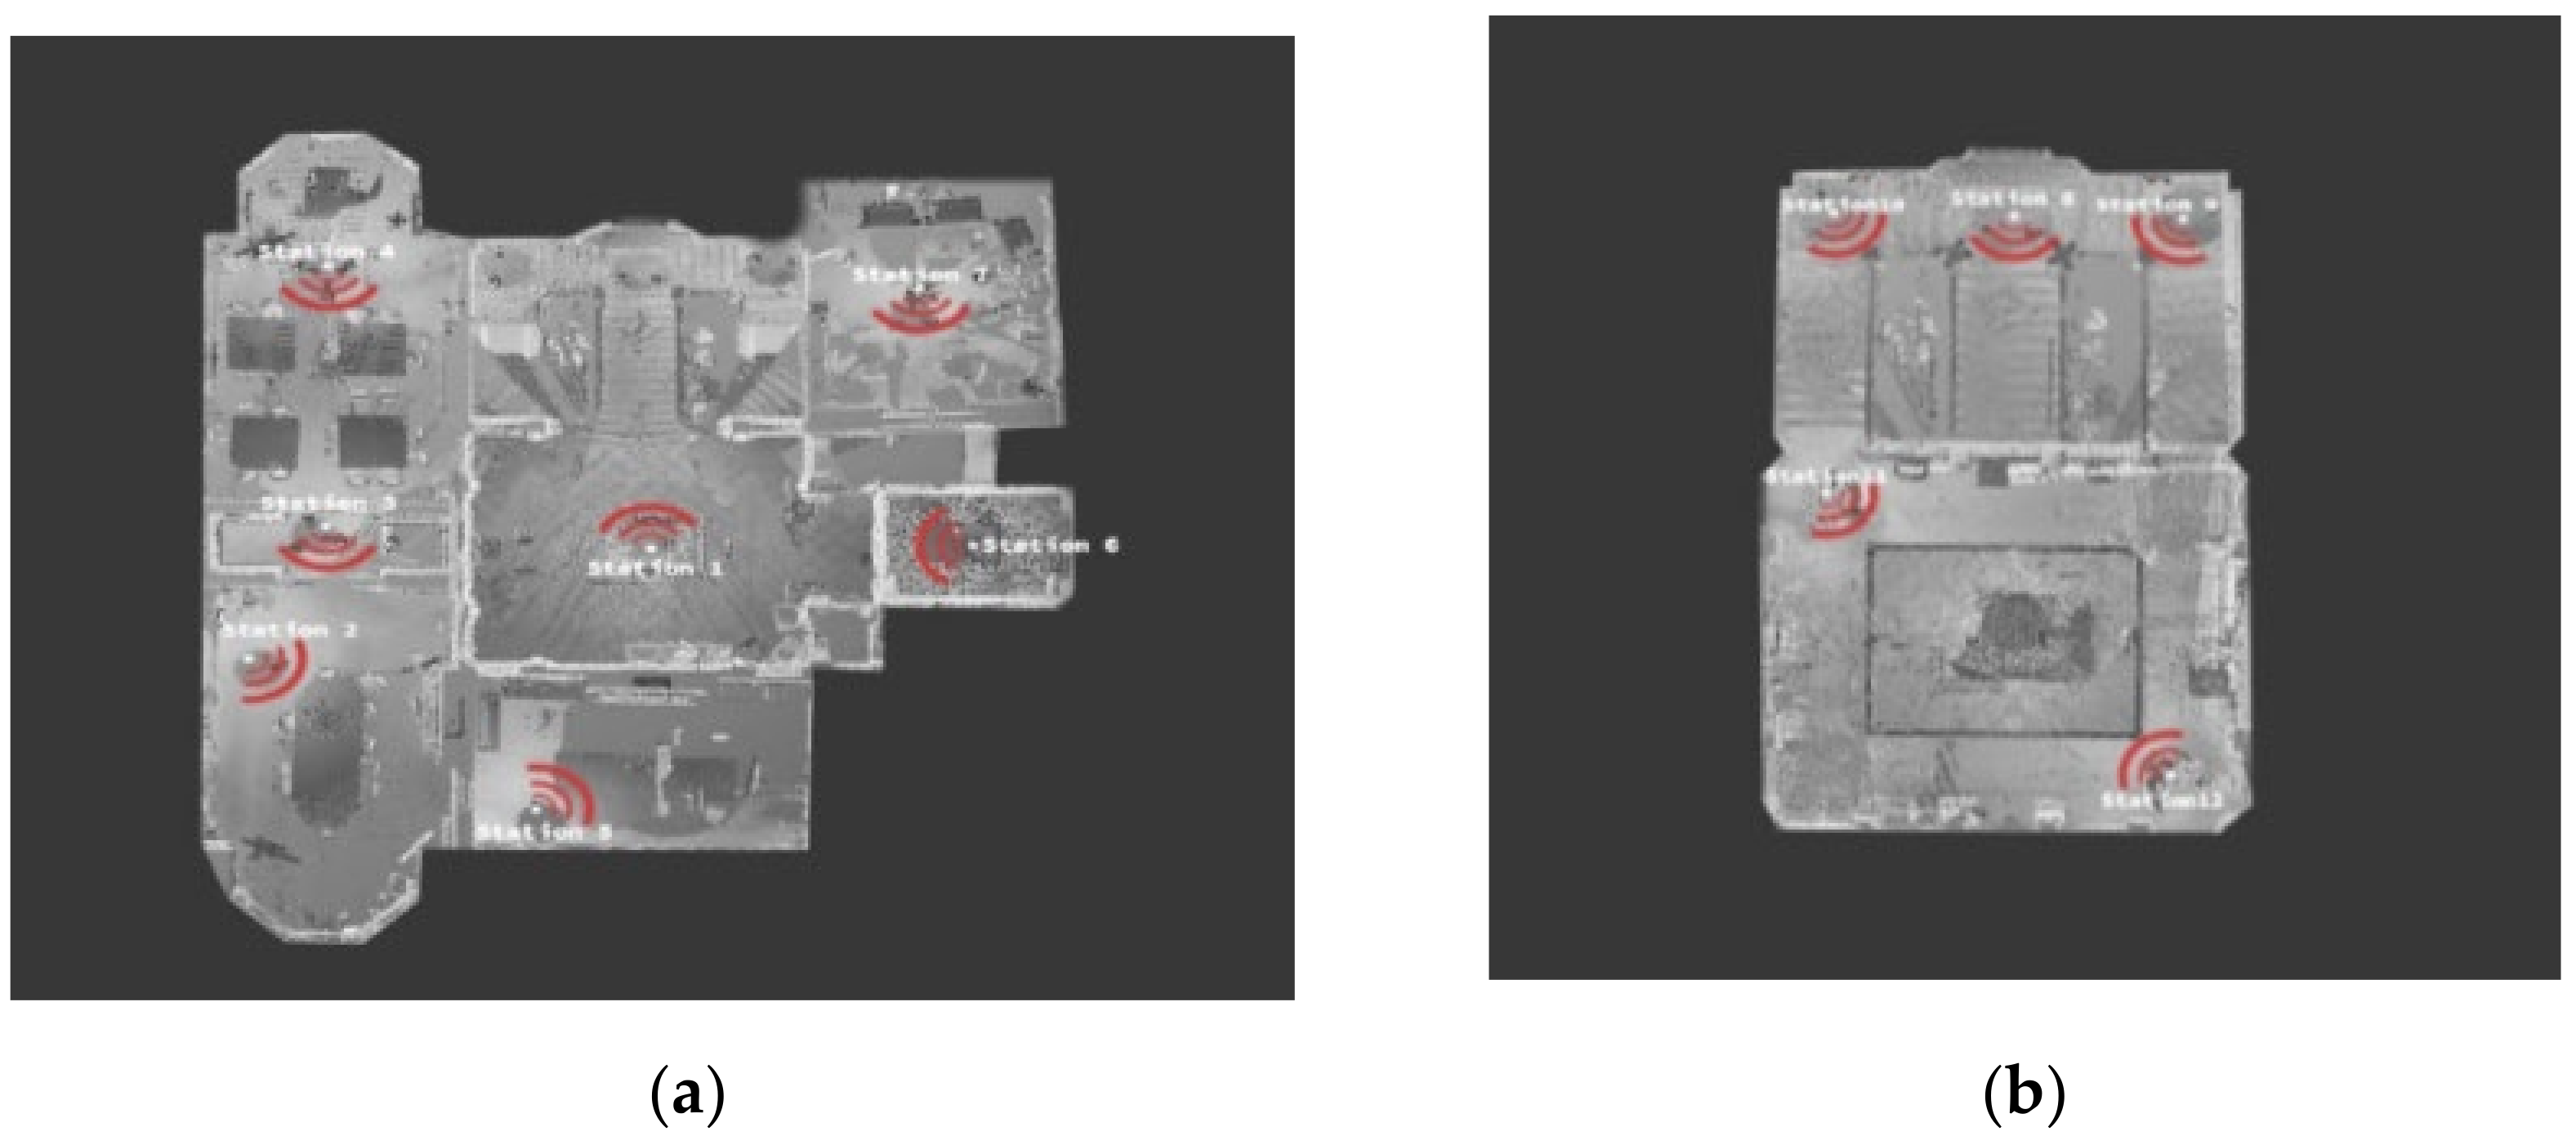
Phase 2 was conducted in two sub-stages, stage one focused on the ground floor of the building where 7 station points were utilized to obtain cloud data for the main hall, common areas, and rooms. Stage two focused on the first floor where 5 station points were placed to scan the main hall ceiling, major staircase, and upper floor common areas to integrate these scans with the ground floor cloud data. Figure 6 shows the distribution of the station points on the ground and first floor levels of the building. It is of note that scans were only conducted on accessible areas of the building.
Although the distance variations between the surfaces and station points in exterior scanning affected the cloud point density, this effect was less apparent in interior scanning because of the similarity of distances from the nearest internal surface, making the point cloud much denser and more complex than the external scans, see Table 5.
3.2.2. Exporting Scanning Data: Trimble TX8 to Trimble Realworks
This step involves exporting the captured data from a USB flash in the TX8 to point cloud processing software, which, in the case of this study, is Trimble Realworks.
3.2.3. Point Cloud Processing
The scanned stations acquired through the survey were processed in software compatible with the Trimble TX8 scanner, namely, Trimble Realworks software. Data processing was conducted in three stages: stage 1 was related to cloud data registration, while stage 2 involved filtering registered data and stage 3 was concerned with investigating the resulting cloud model. Each stage will be discussed in more detail in the ensuing sections.
Point Cloud Registration
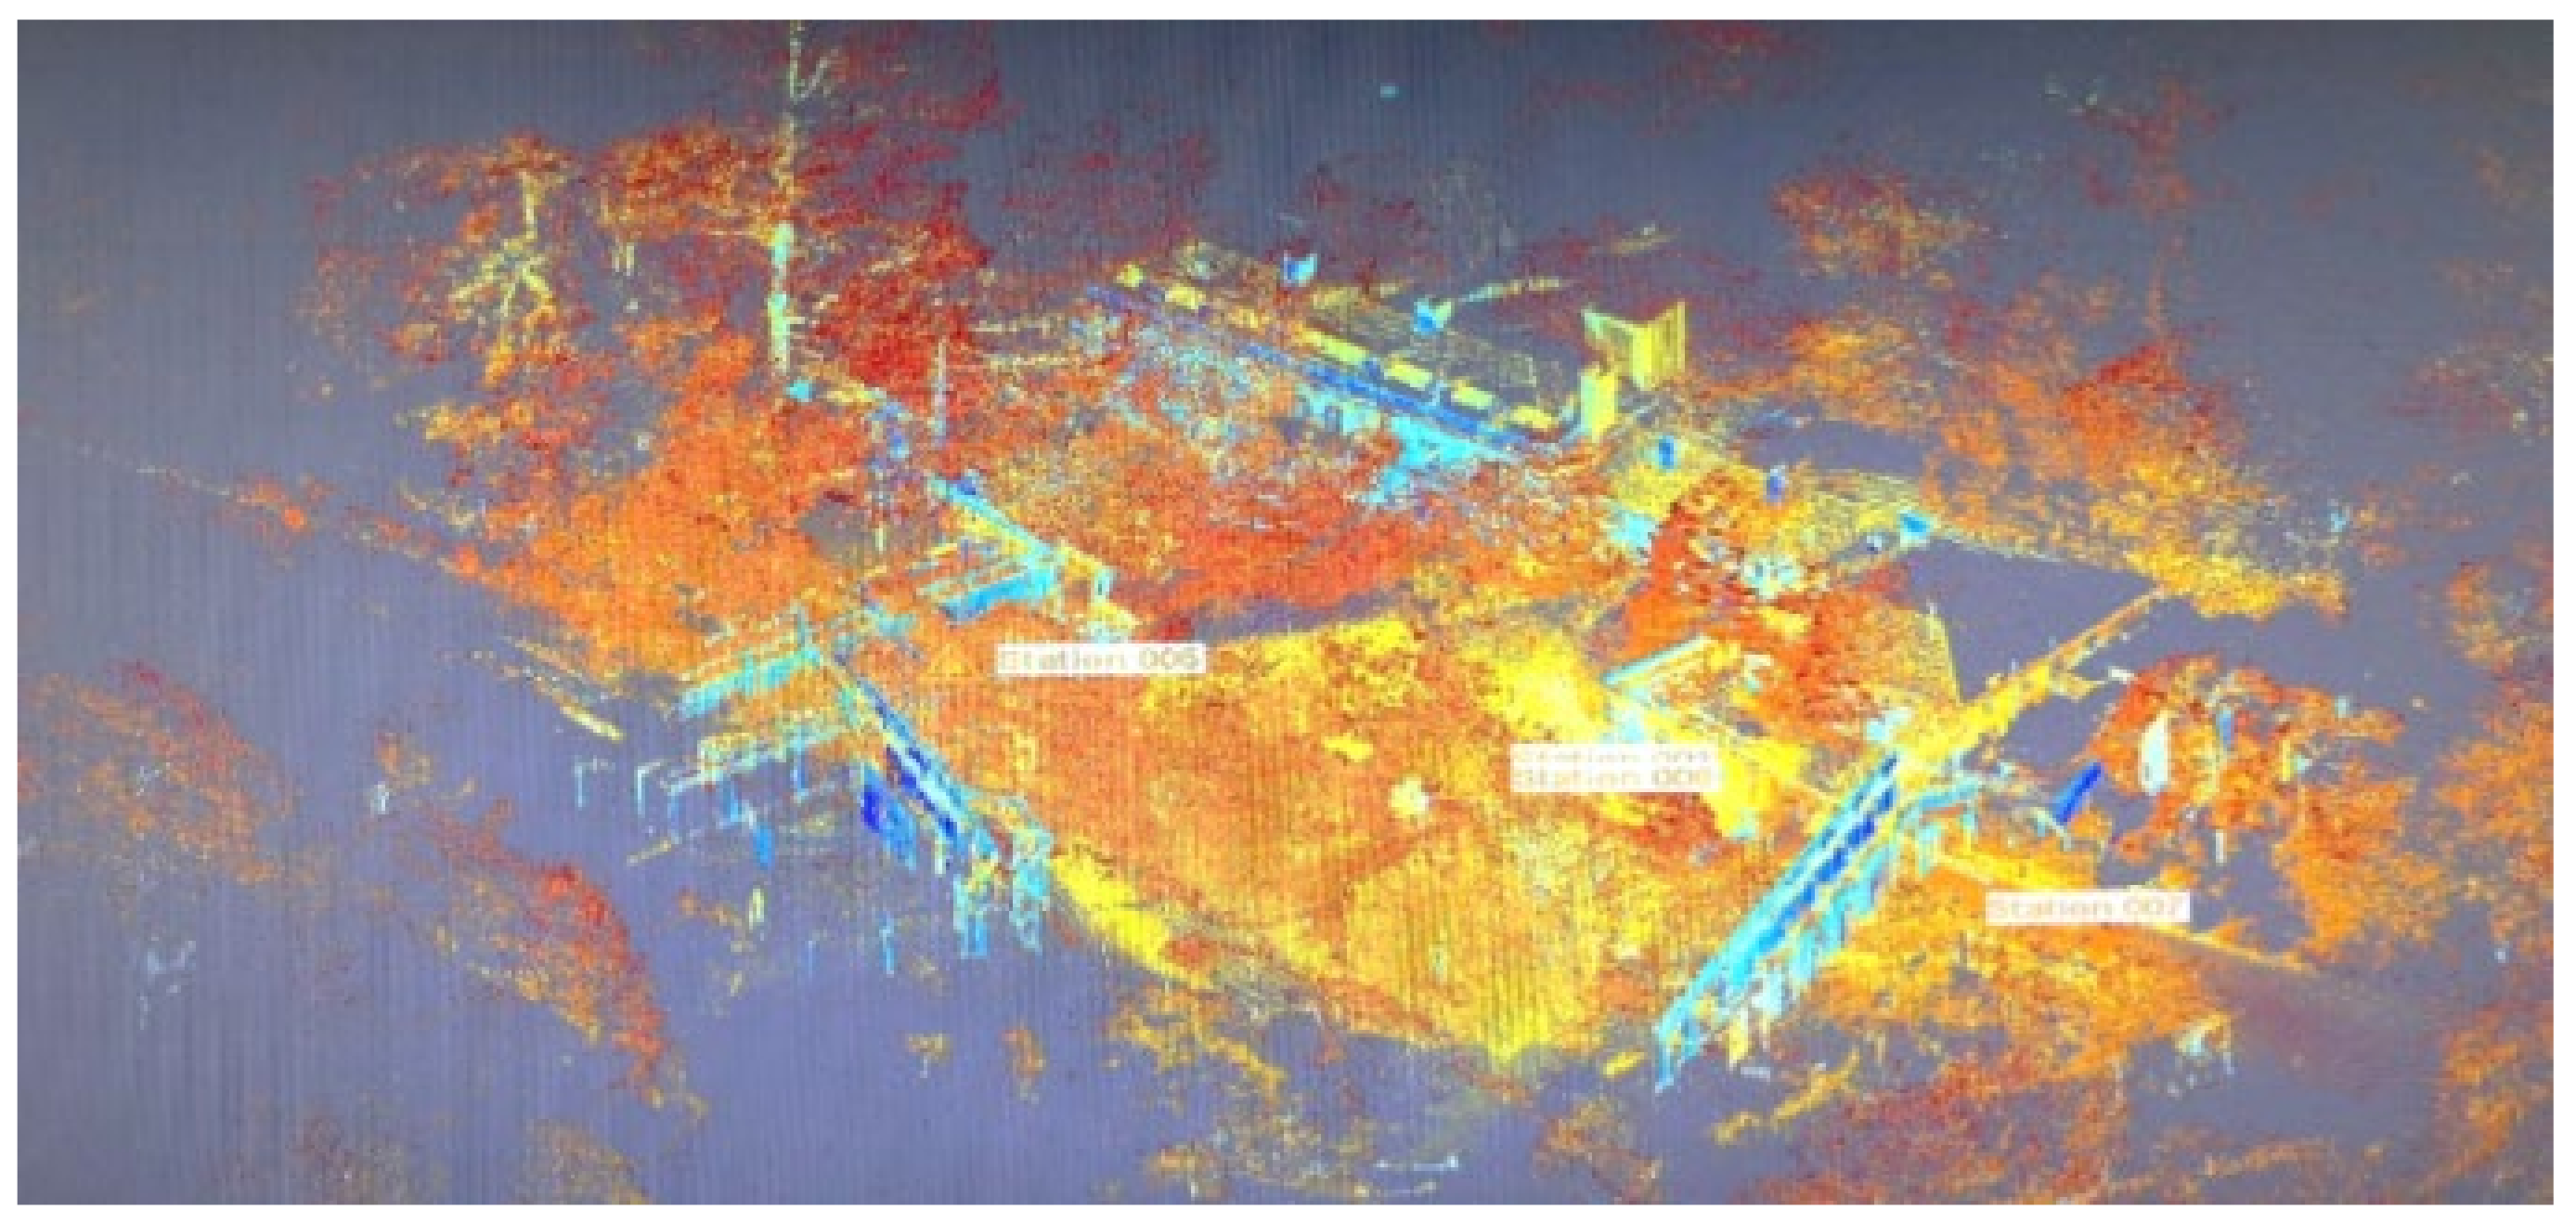
The first step in processing cloud data is registering the cloud stations acquired throughout the surveying process. The registration process was conducted through two phases, phase 1 refers to external scans, while phase 2 focuses on internal scan registration. Station registration is based on two methods, either cloud-based registration (clouds registered according to surface matching or proximities) or target-based registration (clouds registered according to a selected reference plane, sphere, or object). Cloud-based registration was utilized in registering the cloud points, the registration was conducted through two stages. Stage 1 concerned an automatic registration of cloud points based on surface matching by which cloud points were identified and registered. Automatic cloud registration specifies properties of each cloud station, such as point density, station height, matching errors, cloud point number, and cloud stations clashes. Figure 7 illustrates the results of automatic cloud point registration.
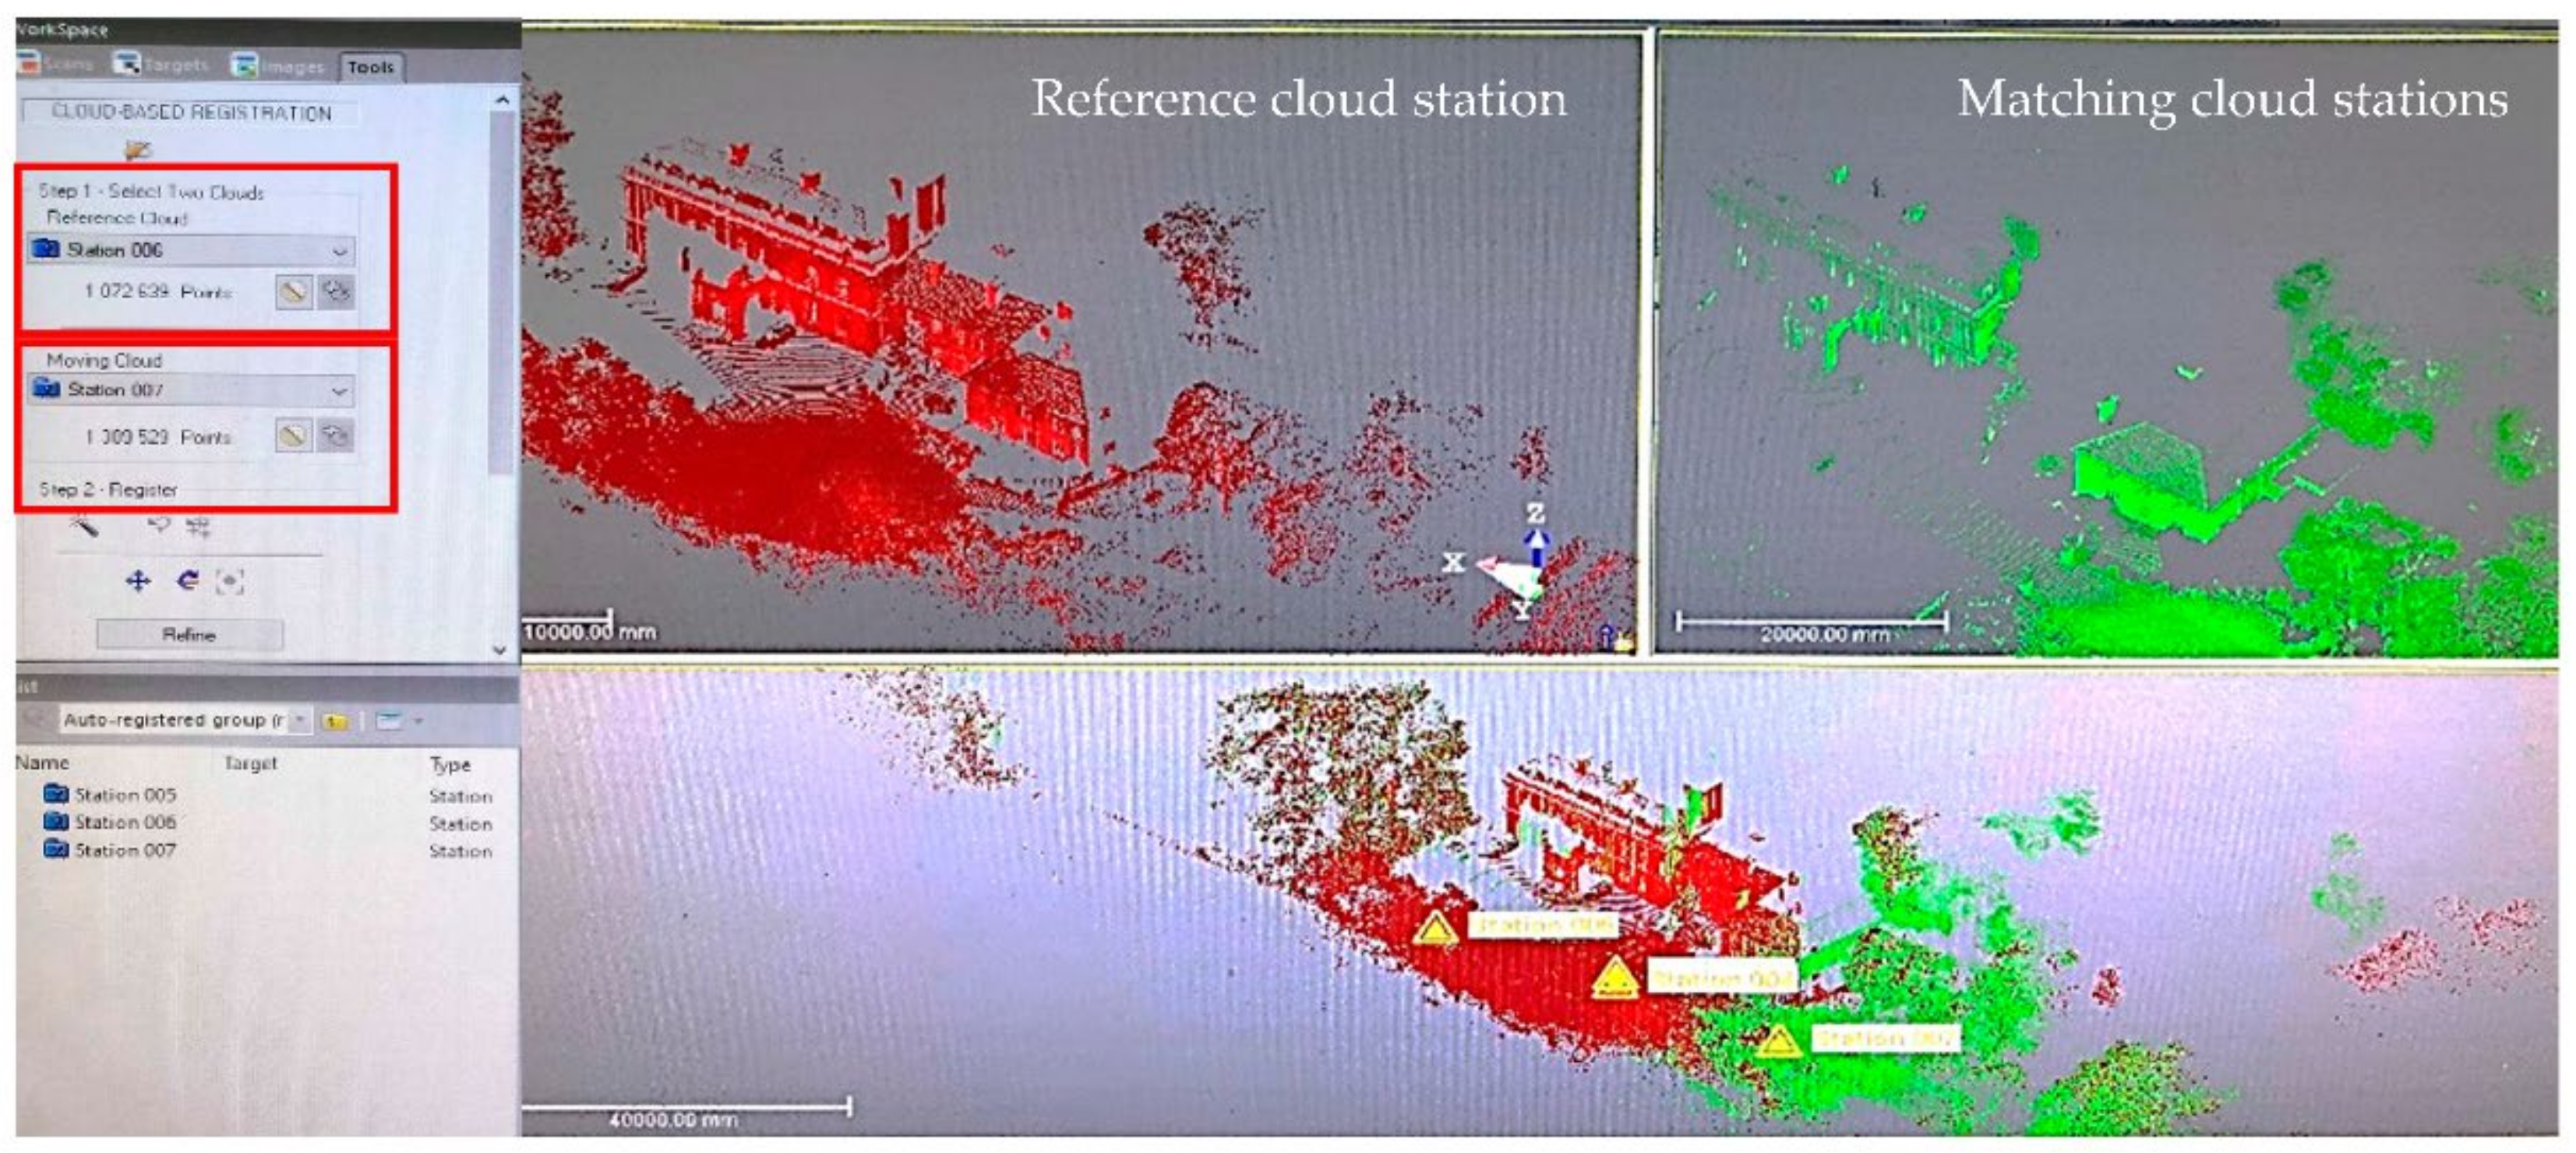
Automatic cloud registration (stage 1) defines and registers cloud station points, surfaces, and volumes, therefore, these cloud stations appear as distinguished clouds merged according to proximities of station surfaces. The resulting cloud stations necessitate another stage of registration (stage 2) to organize, assemble, and establish an integrated cloud model. Stage 2 focuses on manual cloud registration. In this stage, registered cloud stations were adjusted and organized to achieve full surface matching. Manual cloud registration methods are based on selecting a reference cloud station and a moving cloud station where the latter can be moved, rotated, and adjusted to match shared surfaces of the reference cloud station. Manual registration provides a surface matching test between the two stations, where a matching test result with acceptable low error (usually <10 mm) can be merged in a single registered station. Figure 8 shows the manual registration process.
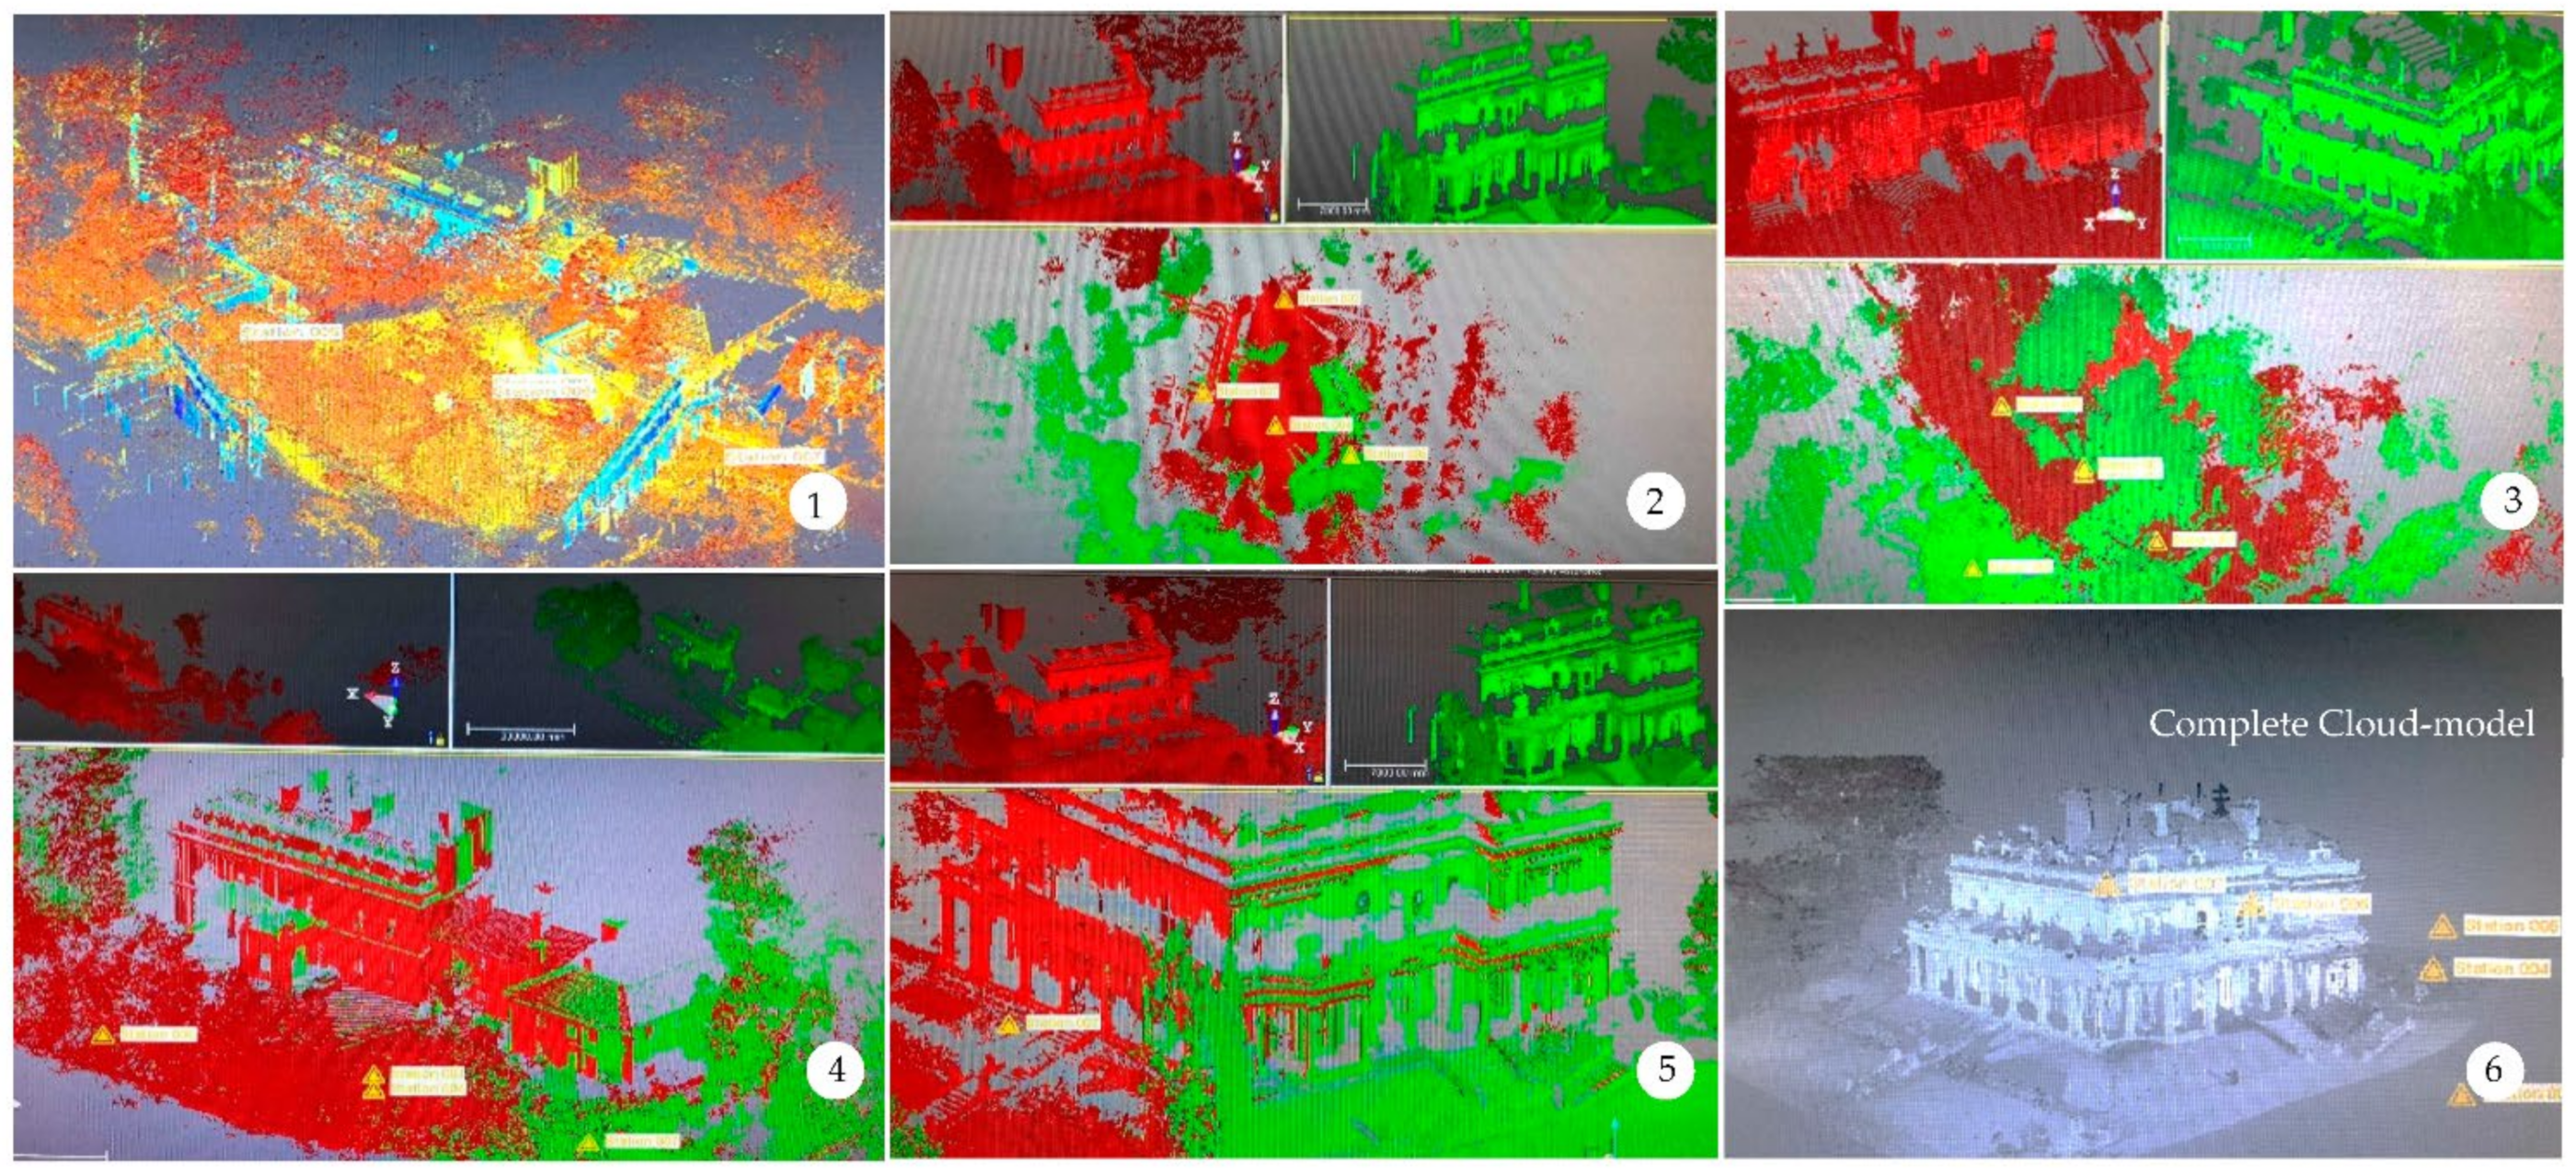
The manually registered station can be later merged with other stations through the same process of manual registration. In this case, the manually registered station represents the reference cloud station and the remaining cloud stations represent moving stations. Figure 9 illustrates point cloud registration stages, including the automatic cloud registration (stage 1) and manual cloud registration (stage 2).
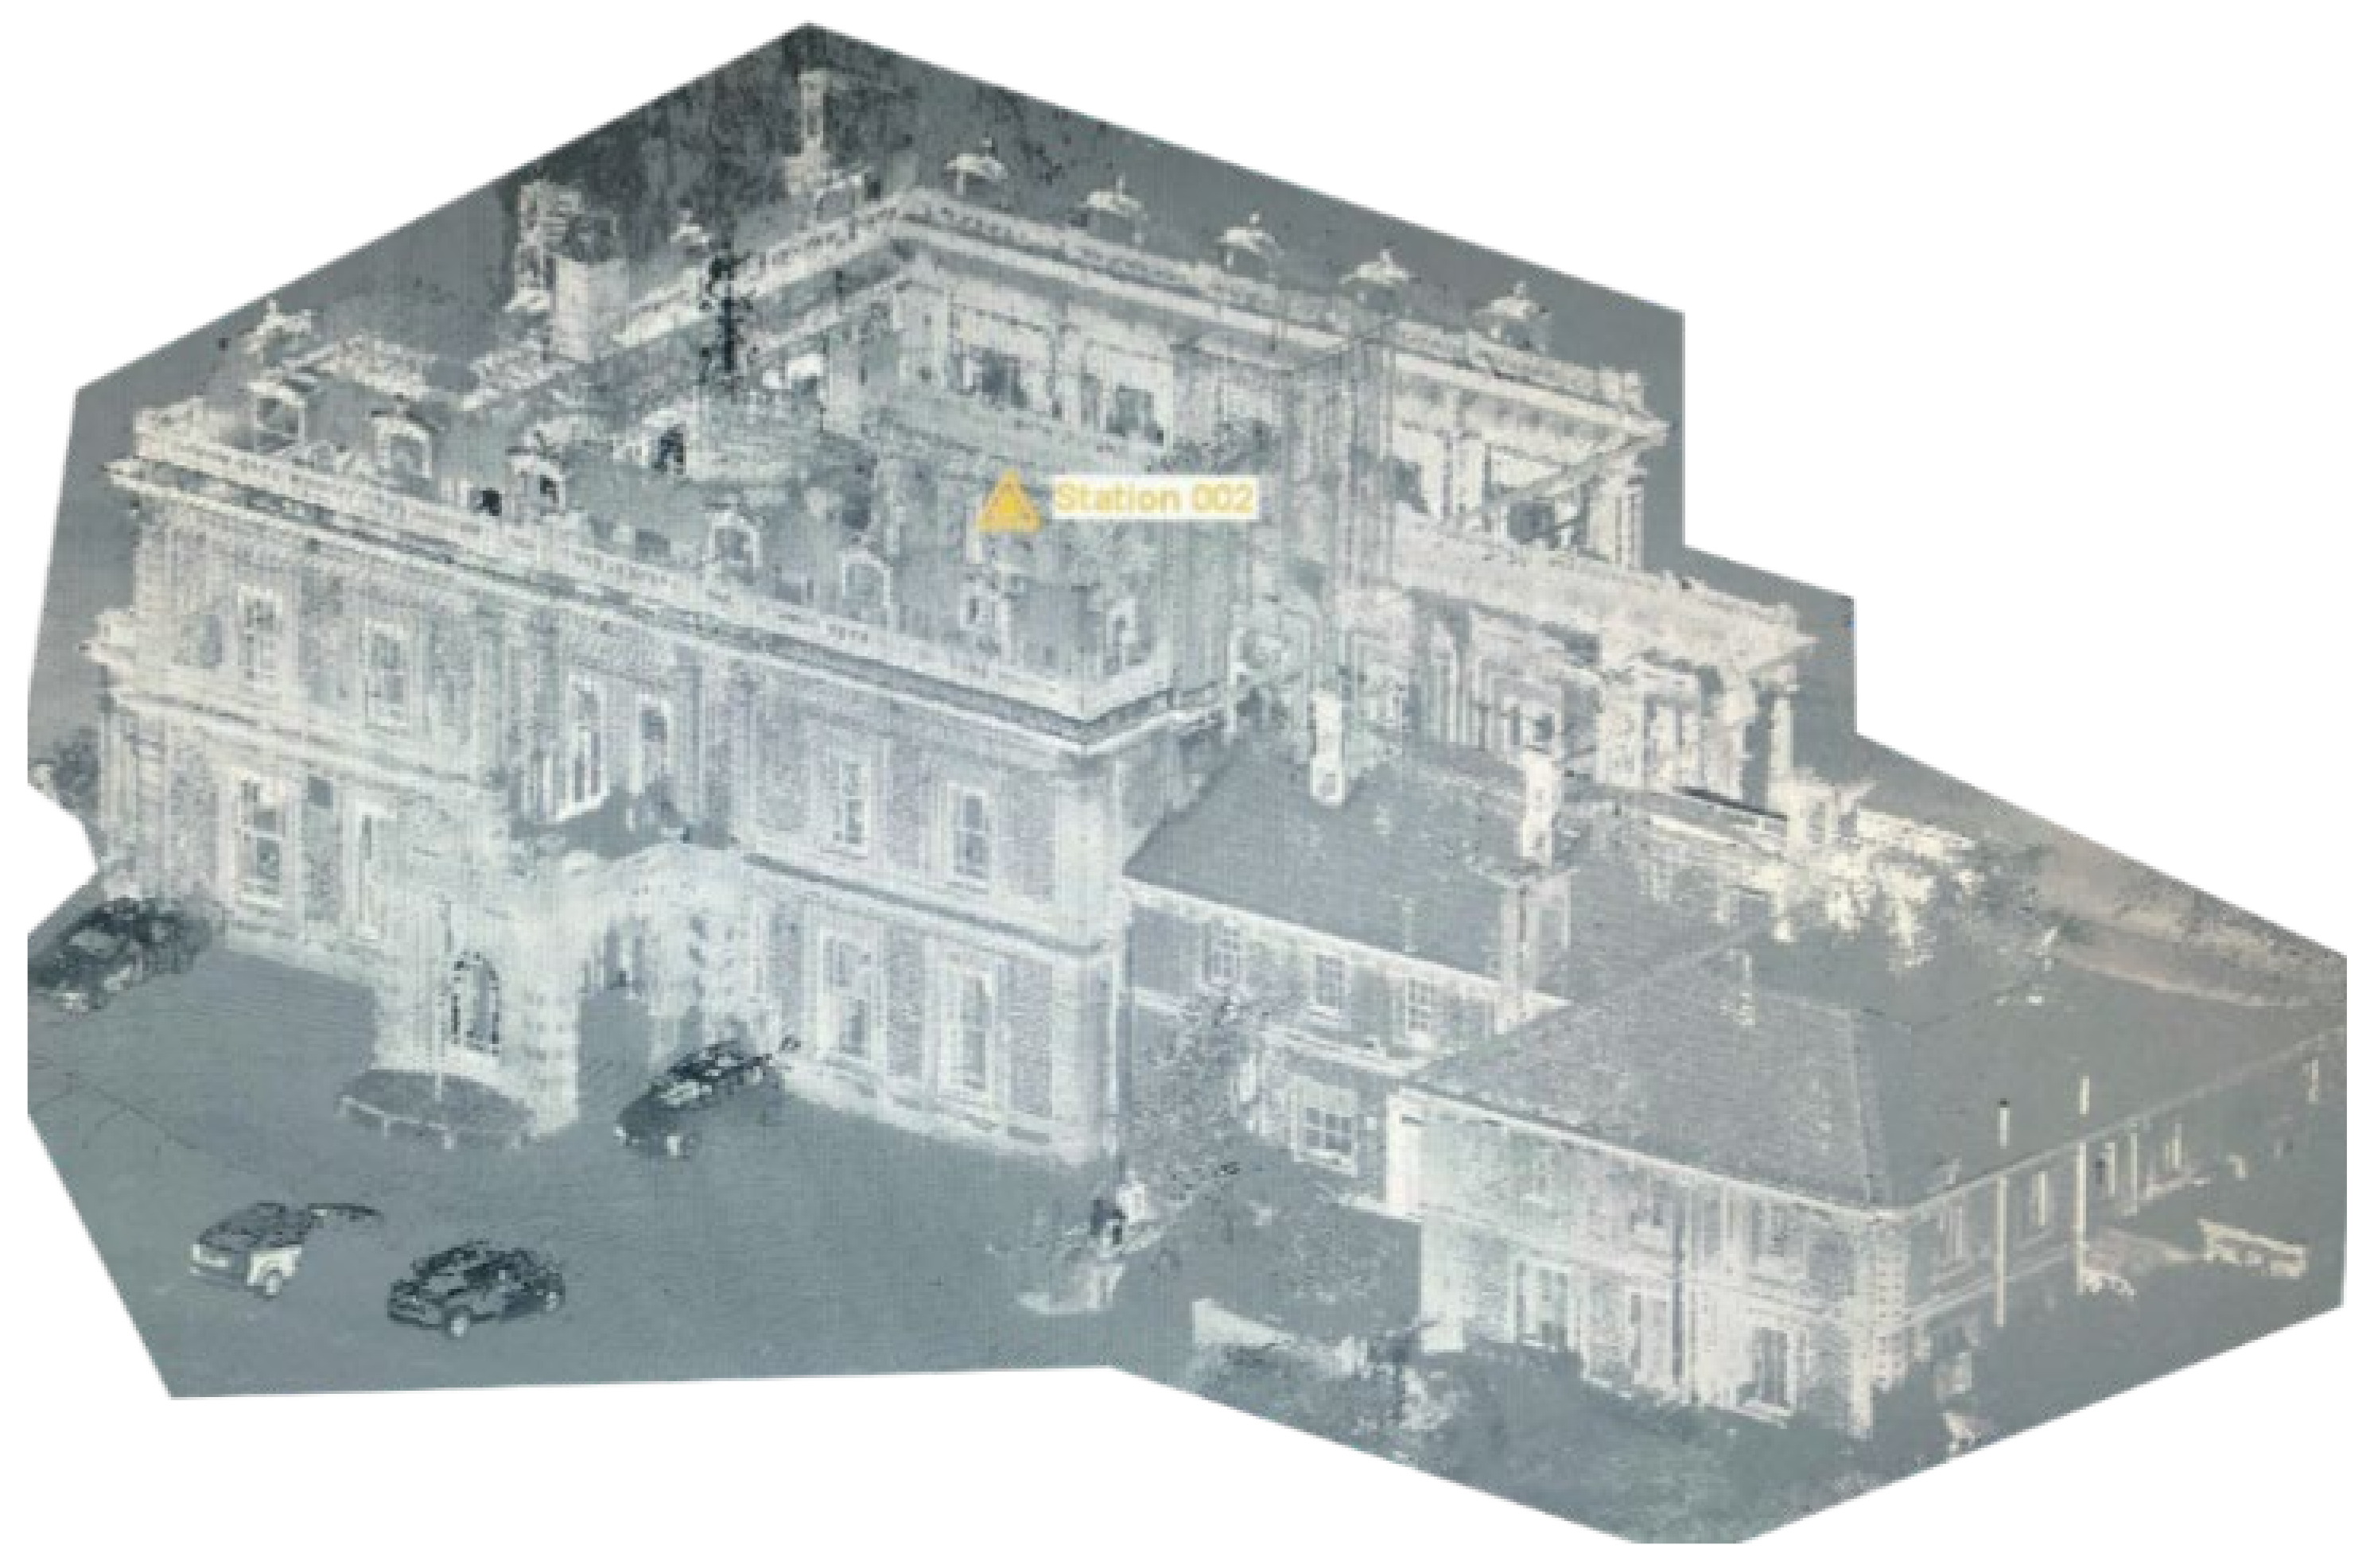
Manual cloud registration was conducted on all the cloud stations and, as a result, a coherent model with complete matching stations and low error level (less <10 mm) was created. The resulting cloud model represents a collection of separated station scans for the Headington Hill Building, as illustrated in Figure 10.
Point Cloud De-Noising
3D laser scanners capture and scan all physical objects that appear in the field of view during the scanning process. For instance, the Trimble TX8 captures all existing objects on site, such as moving objects, plants and trees, neighboring buildings, and the surrounding environment.
All these objects add massive numbers of points to the cloud, complicating the cloud model and point cloud production due to the extensive point numbers resulting from unwanted objects. Some objects create barriers and visual obstacles to the model, and therefore require visual treatment to produce a clear, understandable cloud model. De-noising refers to the process of excluding undesirable physical objects captured during the scanning process. In this paper, the purpose of point cloud de-noising was to:
- Reduce cloud points through eliminating undesirable objects, neighboring buildings, and unrelated visual context to ease and reduce time required to process scanned clouds.
- Extract visual barriers overlaying building elevations, interior spaces, and surfaces to obtain a clear, functional field of view.
- Decrease cloud model complexity and focus on cloud model components.
The de-noising process was conducted through two methods provided by Trimble Realworks software:
- Regional de-noising: enables eliminating large areas such as surrounding environment and neighboring buildings.
- Segmental de-noising: enables eliminating single objects, undesirable existing elements on site, and visual barriers.
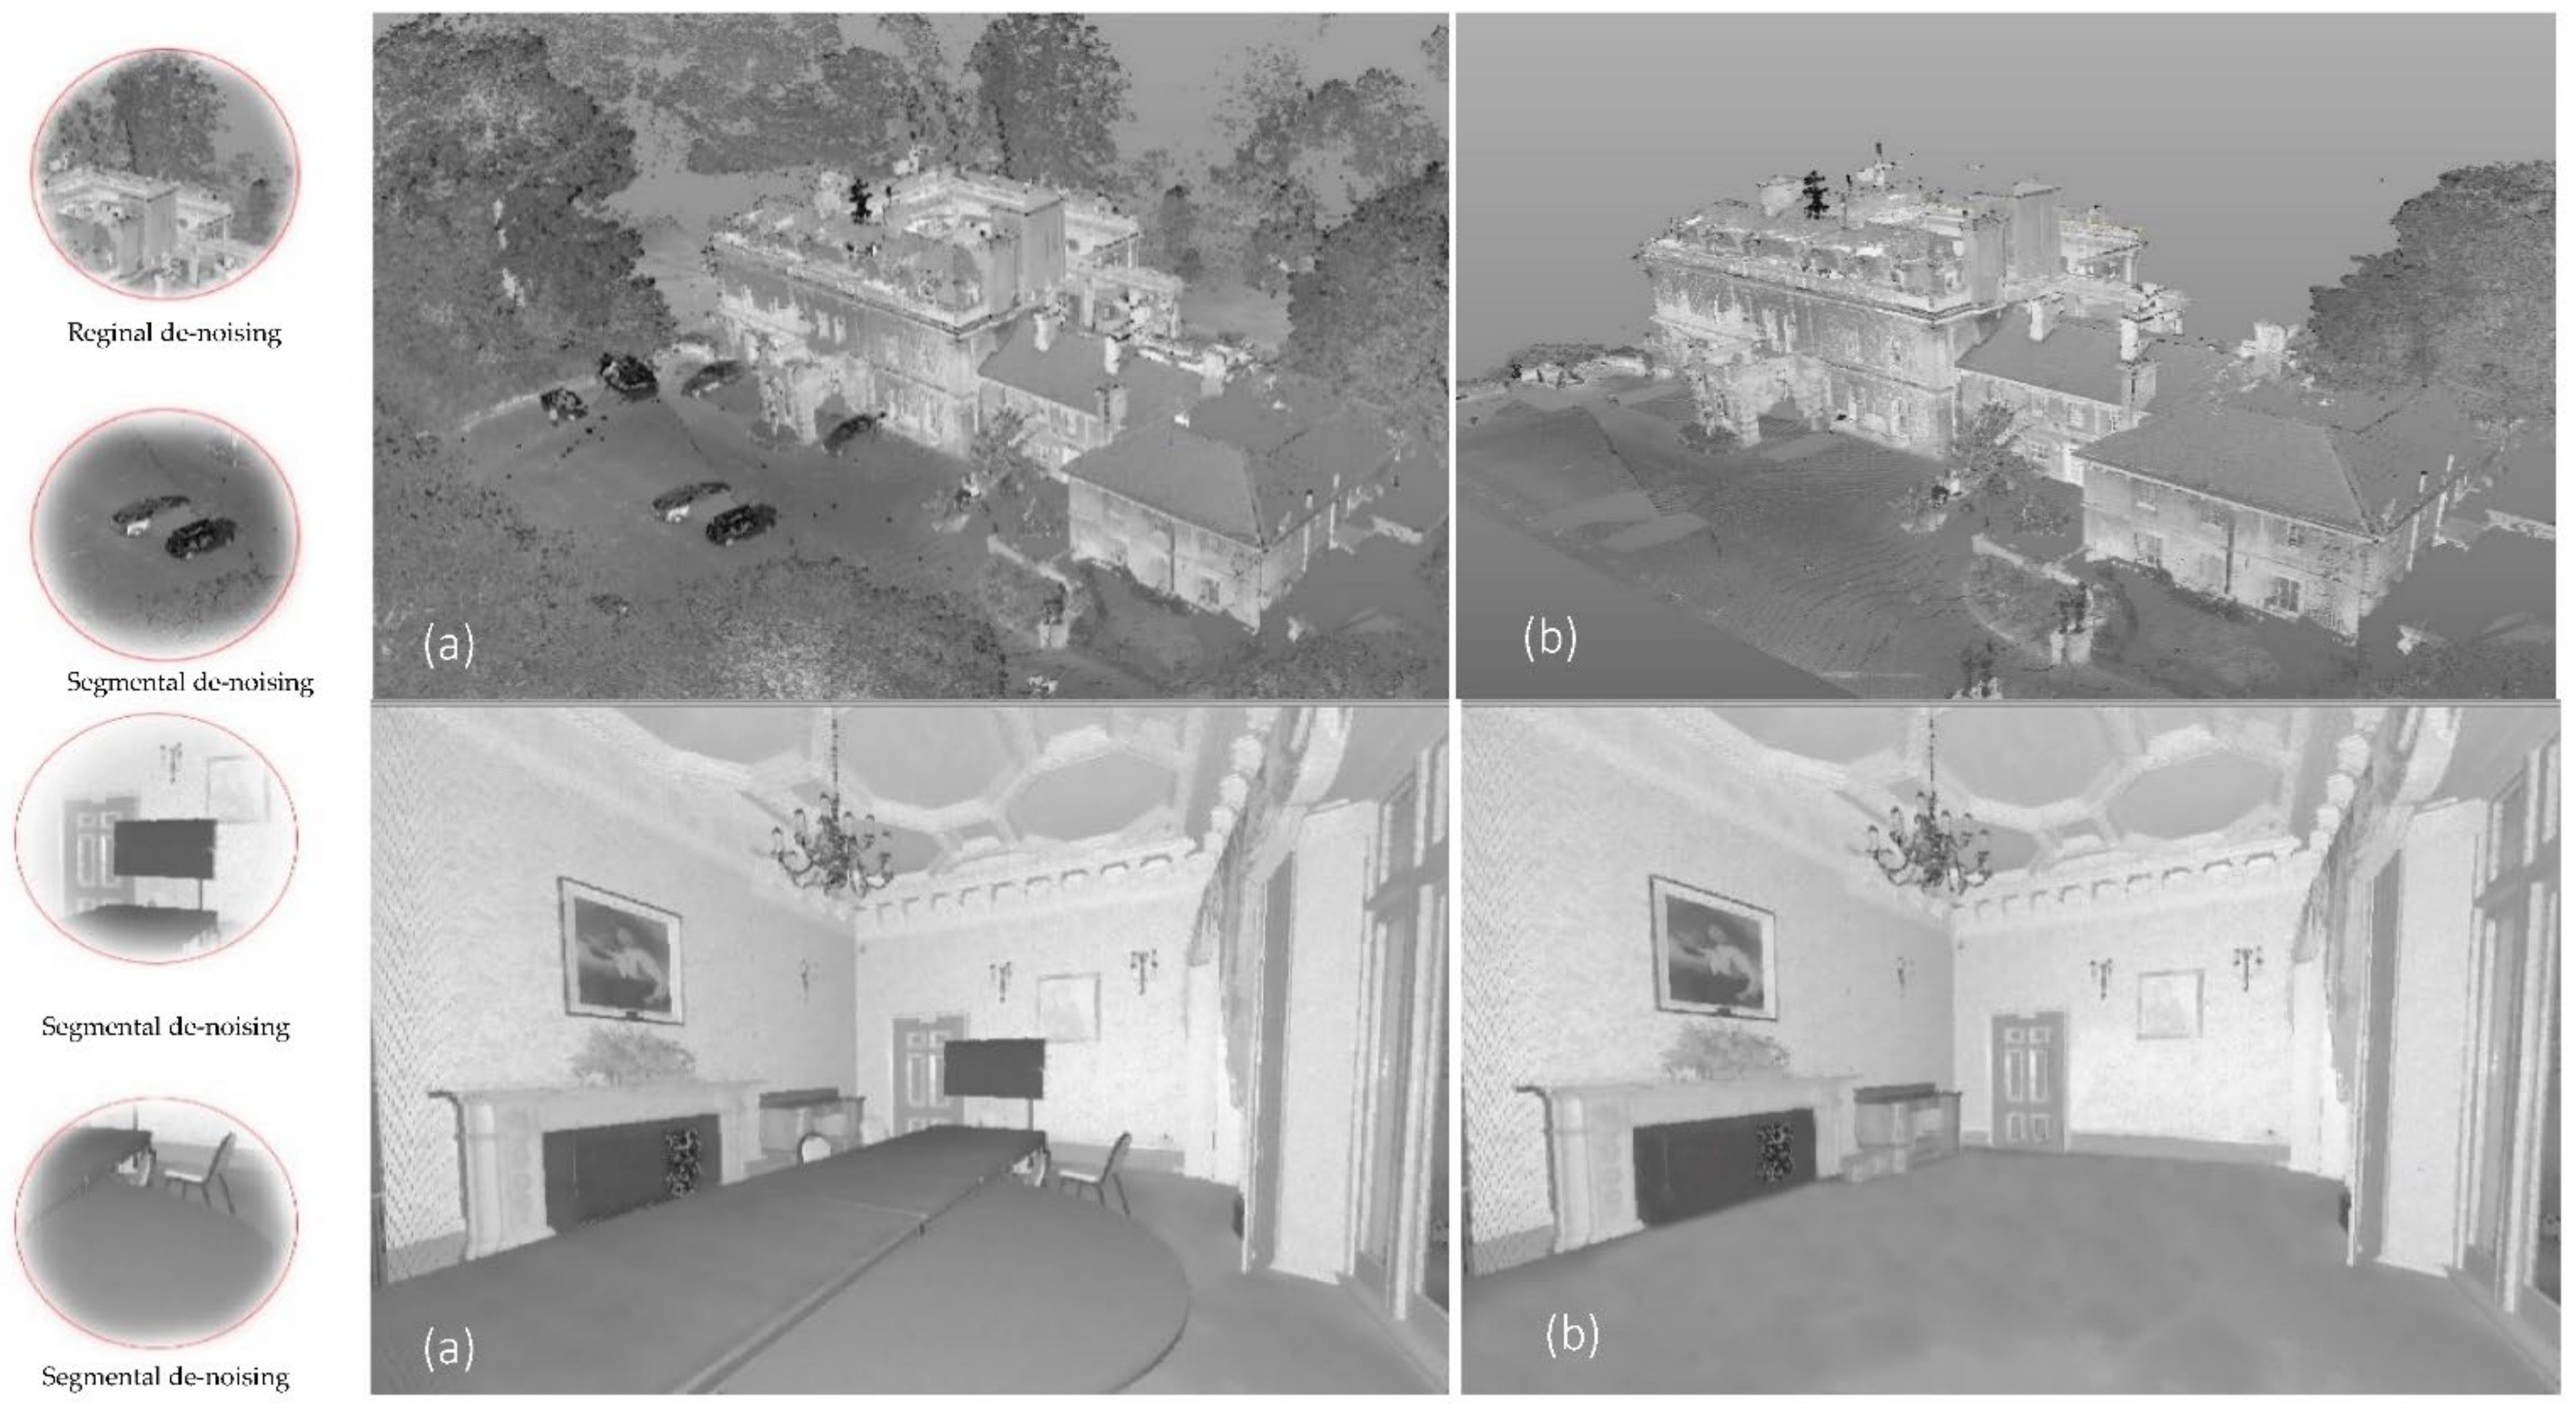
Figure 11 presents the exterior and interior cloud model of the Headington Hill Building prior to de-noising the cloud model and after implementing de-noising methods.
Point cloud de-noising decreases complexity and the volume of the cloud model through eliminating undesirable physical objects. Exterior cloud de-noising in the case study showed higher point reduction due to the massive number of points acquired from various elements on the site, while interior cloud de-noising showed lower point reduction due to the contextual limits of interior scans. Table 6 lists cloud points prior to and after cloud de-noising as well as redacted points from each cloud model.
Point Cloud Investigation
After registering and de-noising cloud stations, the acquired cloud model was investigated by a set of tools provided in Trimble Realworks software. The aim of the investigation was to test the reliability and accuracy of the resulting cloud model. Point cloud investigation was conducted for two main principles in 3D laser scanning, the first principle is related to the tools and options for measuring cloud models as well as accuracy of the measurement. The second principle is related to the penetrability of laser beams through building elements.
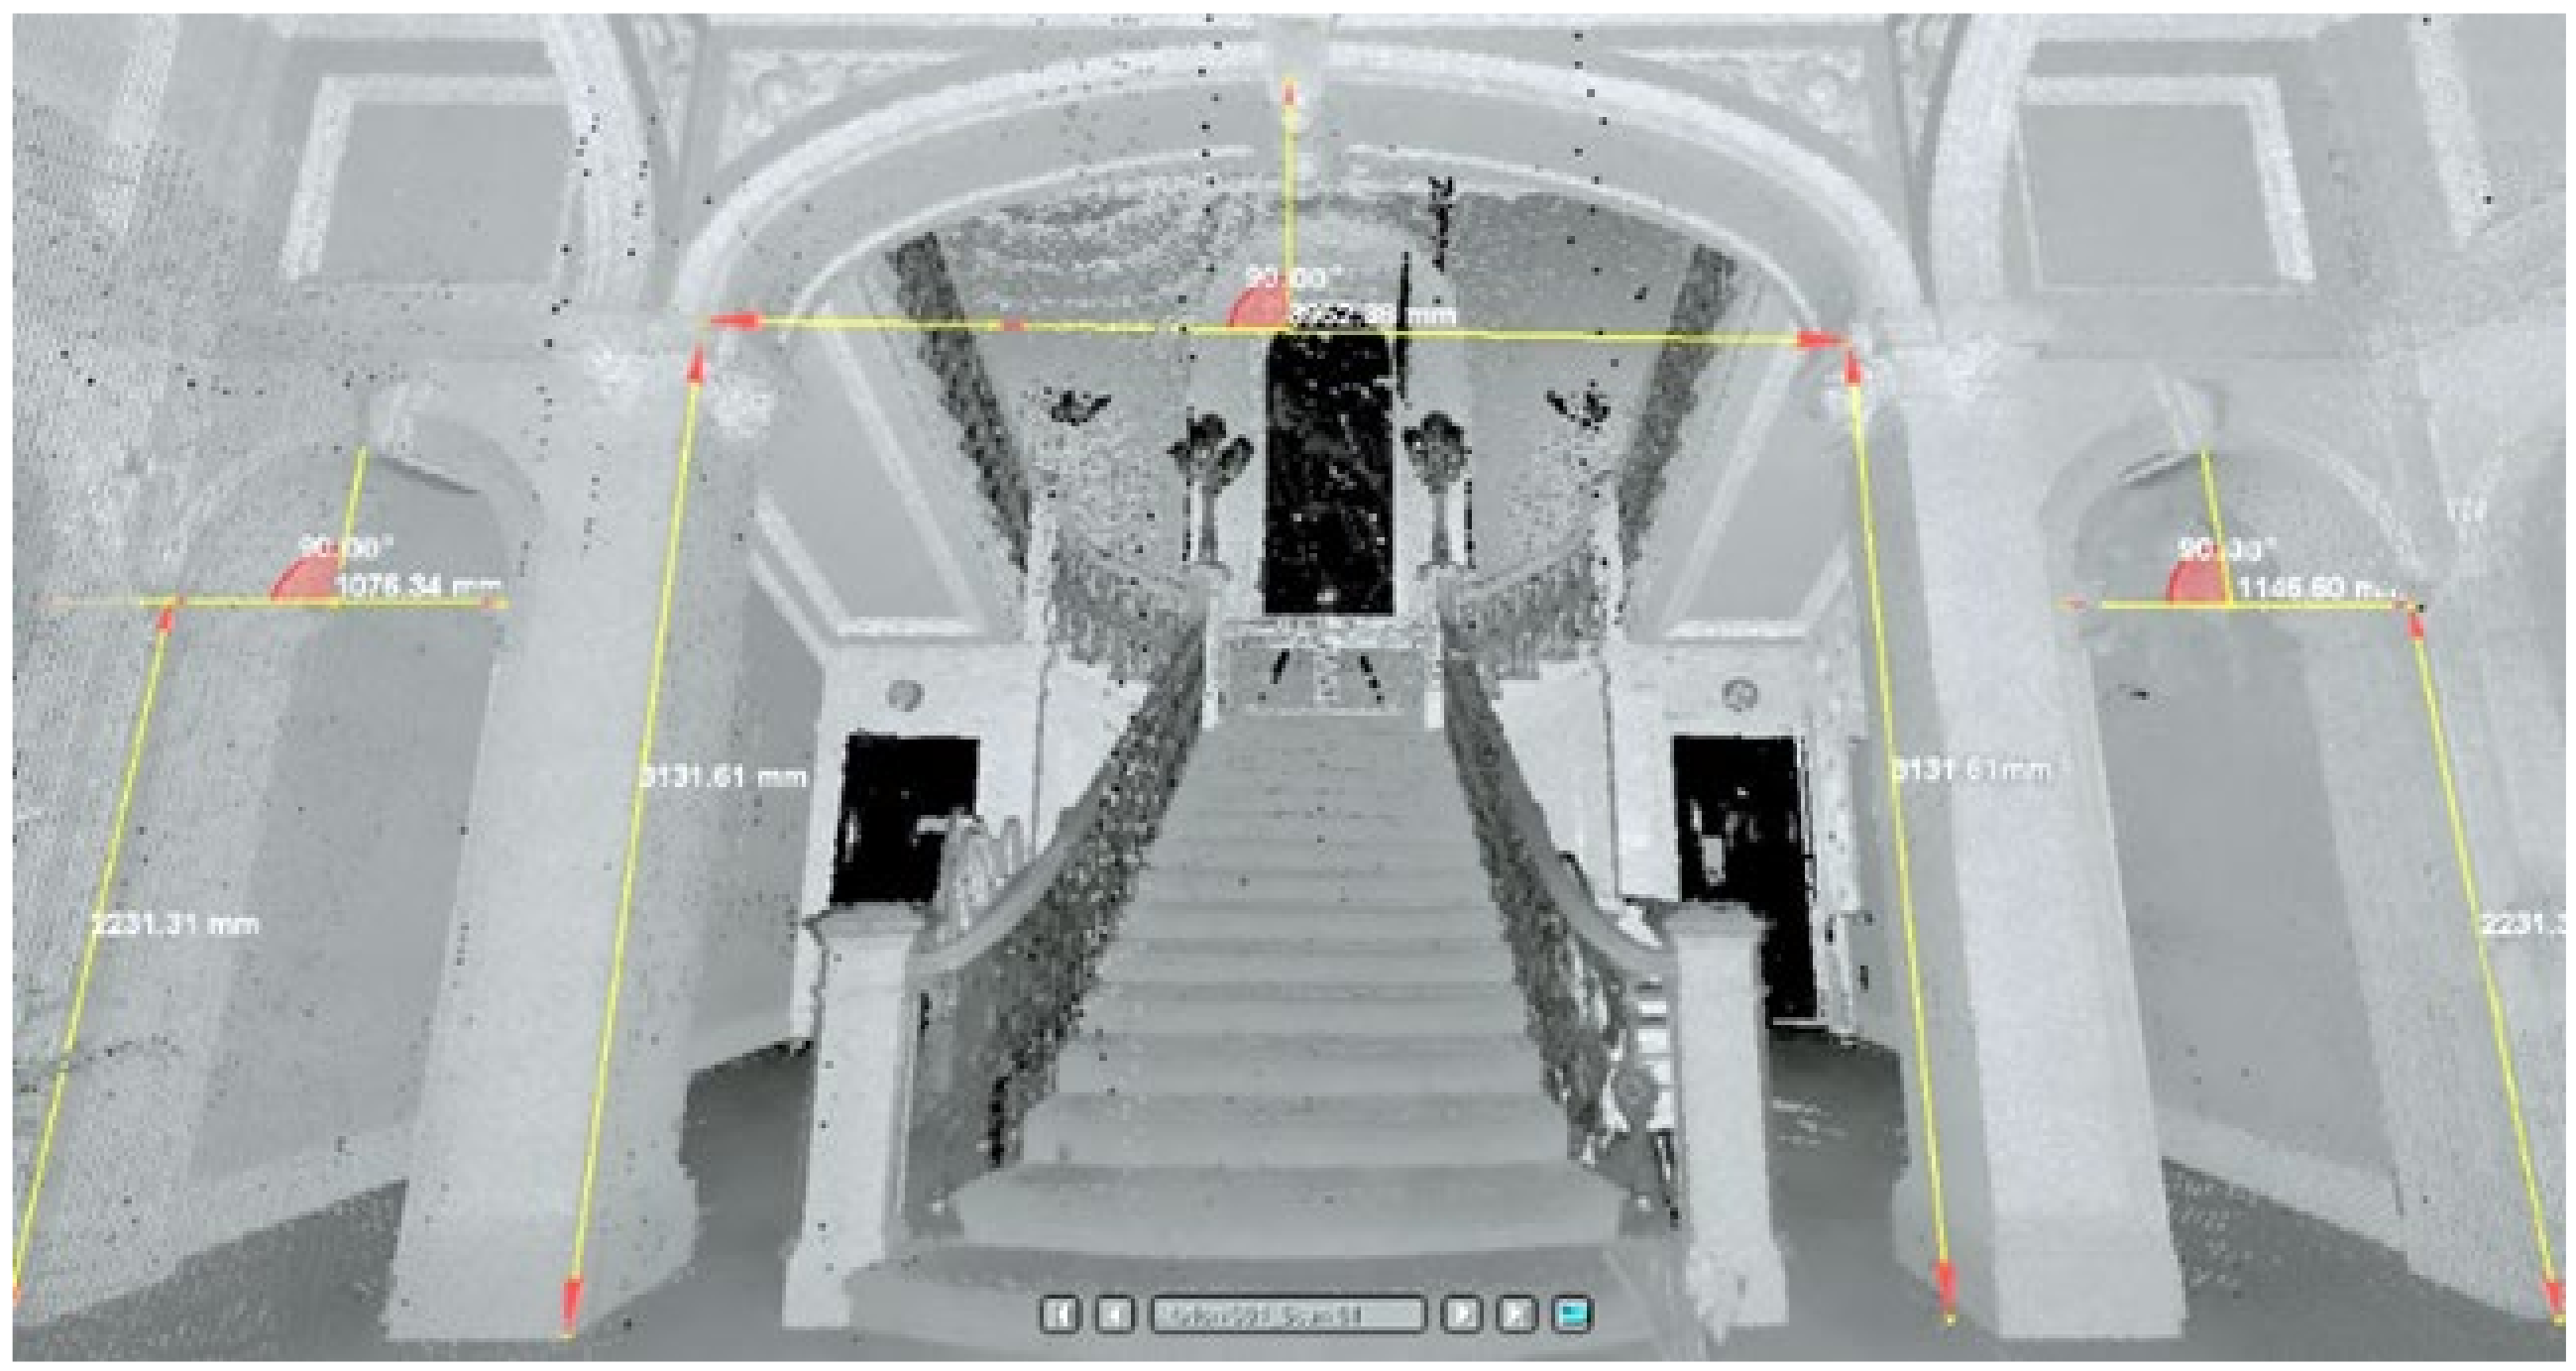
Realworks software provides various measurement tools, including basic measurement means, such as horizontal and vertical measurements, as well as advanced tools, such as angular, plane, and geometry measurements. Points in the cloud formed reference points for measurements, where, in a distance from 5–10 mm a point was tangible as a reference of measurement. Selected reference points were connected with another tangible point to generate the readings. The main hall elements were measured (Figure 12) and, noticeably, areas with a low intensity of points showed errors in measurement of 10–20 mm, while areas with a high intensity of points showed accurate readings. The reason for various measurement readings lay in the intensity of scanned points on different surfaces, where areas with a larger number of points showed more accurate readings.
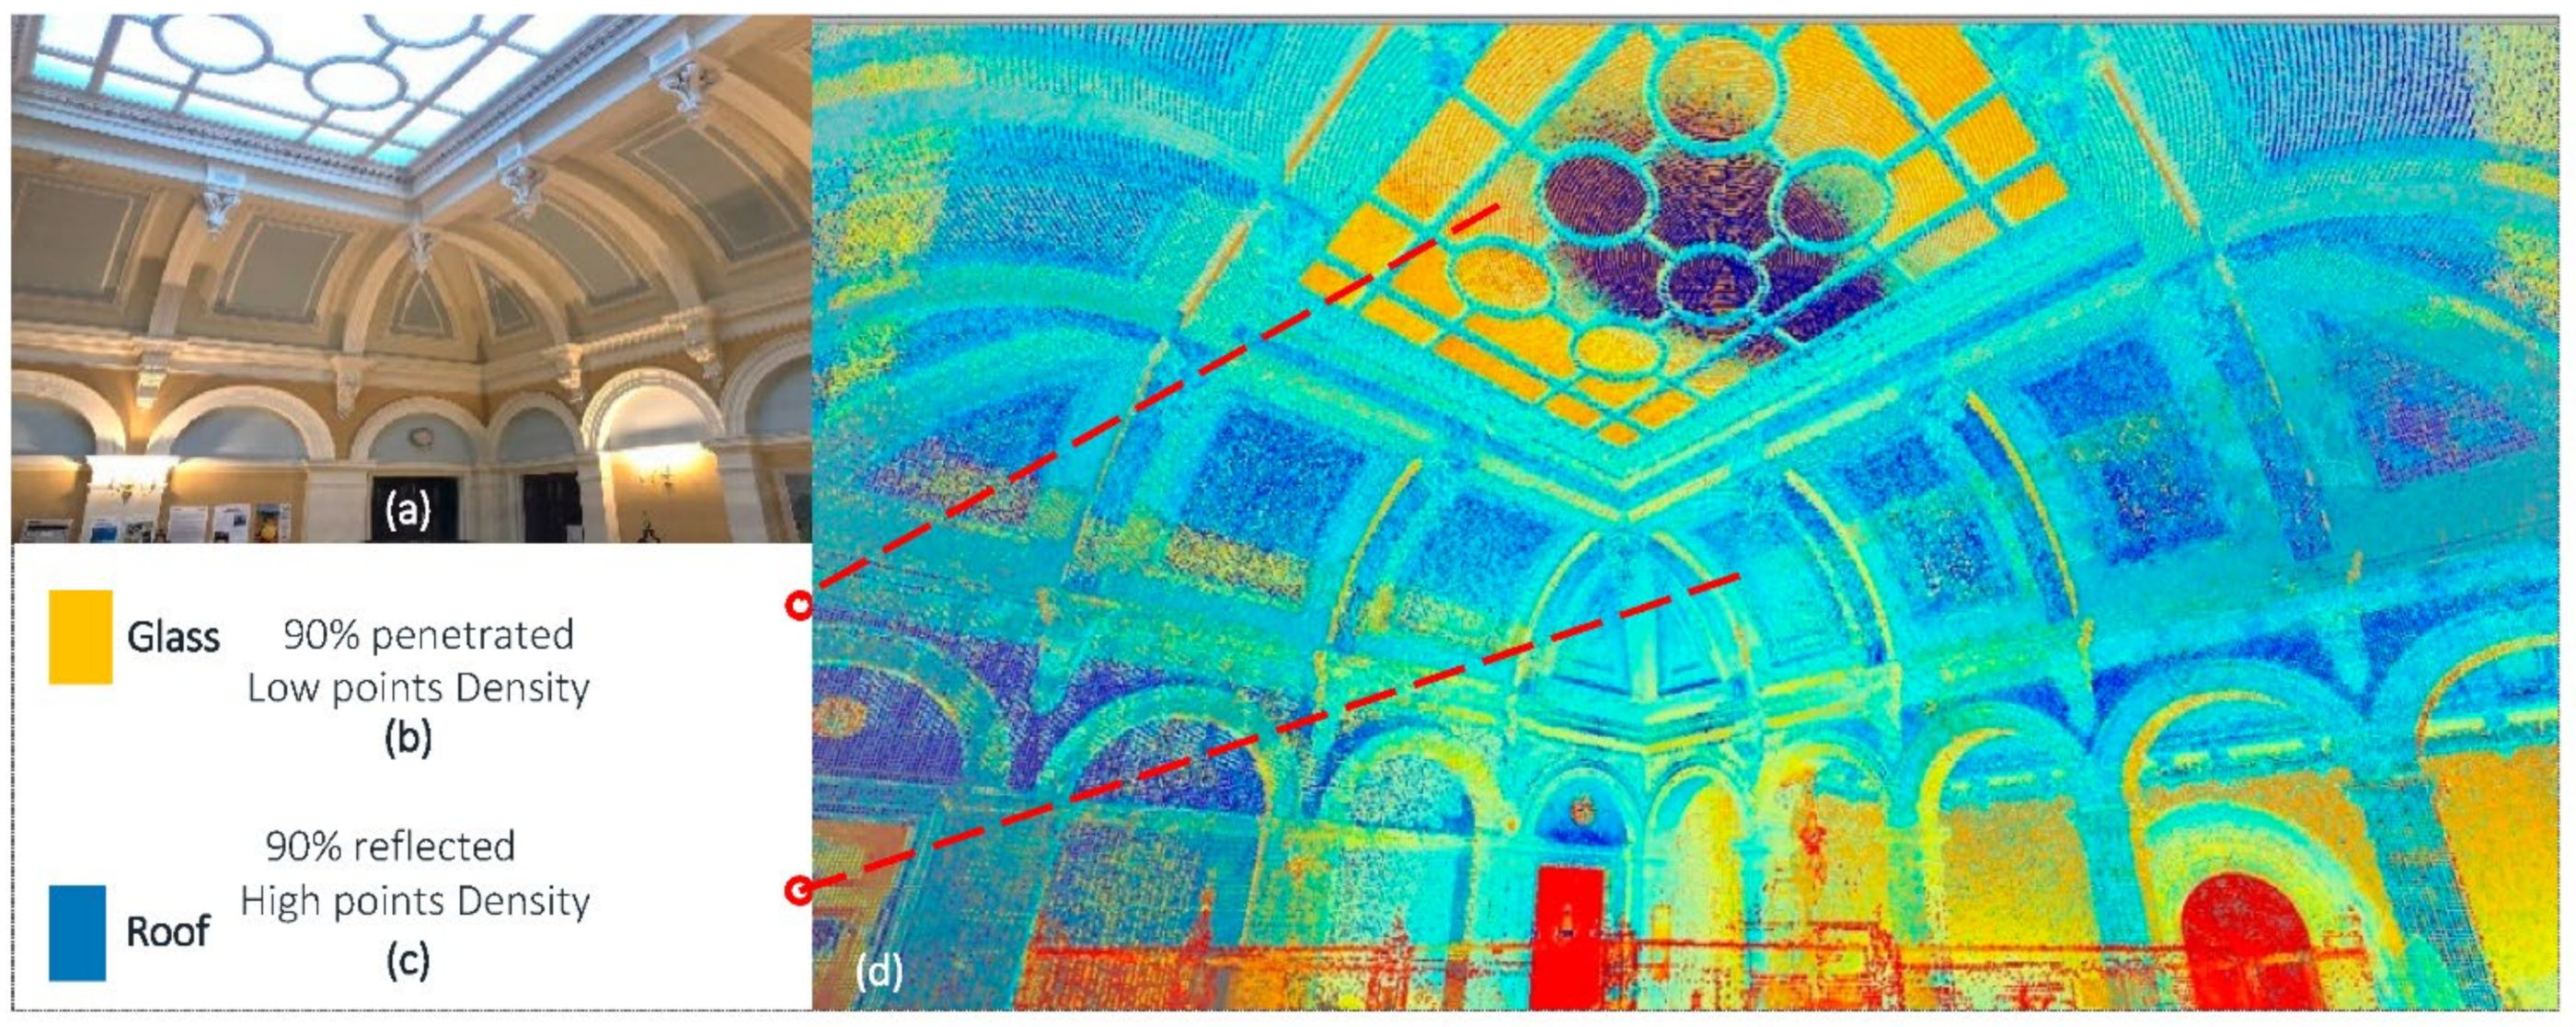
Another aspect of the investigation was testing penetrability of the Trimble TX8 laser beams through various surfaces. The Trimble TX8 generates laser beams with diameters of 6 mm, 10 mm, or 34 mm based on the distance from the nearest surface. Laser beam penetration through building elements such as walls, ceilings, and structural elements was limited due to the material specifications of these elements. The building façade included large stones blocks with a thickness of up to 600 mm that form the external façade of the building. The nature and specifications of the external walls as well as internal walls, ceilings, and structural elements obstructed laser beam penetration. Figure 13 illustrates the penetrability of laser beams through different surfaces, (b) represents laser penetration in the glass roof of the main hall where, noticeably, laser beams penetrate through low point intensity areas, as shown in the point test, and (c) represents laser penetration through the roof structure of the main hall, and the point test shows limited penetration and a high reflection of laser beams. As a result, the penetrability test has indicated that opaque materials with high point intensity reflect laser beams, while transparent materials with low point intensity are penetrated by the beams. The point cloud investigation has indicated a relationship between scanned point intensity, the accuracy of measurement readings, and the penetrability of laser beams. Surfaces with higher point intensity showed accurate readings and high reflectivity for laser beams, while surfaces with lower point intensity showed minor errors in readings and higher penetrability for laser beams. These findings contribute to the recent few studies on 3D point cloud data utilization for material classification by examining the spatial relationships between building elements and surface properties, such as material and color.
3.3. Cloud Model Integration with BIM
The point cloud process generated a unified and integrated cloud model which was the result of linking and merging several point clouds. The resulting cloud model was integrated with the BIM system through investigating possible exportation methods to the associated BIM software. Trimble Realworks software provides two main methods of integrating cloud models with the BIM system. The methods are listed below:
- Built-in plugin: a plugin provided by Trimble Realworks that enables direct exportation of the cloud model to SketchUp software.
- Cloud export: a method that enables exporting the cloud model to other file formats which are compatible with various BIM software types.
Table 7 lists commonly used file formats in CAD software, as well as the availability of these formats in the cloud exportation method of Trimble Realworks. The table also presents compatible software for these formats, and all other file formats that can allow interoperability between the software involved in the 3D printing process are presented in Table 8.
Notably, Trimble Realworks lacks the ability to export cloud models in the IFC file format, which is commonly utilized in exchanging BIM. The absence of the IFC file format requires third-party software, in this case Autodesk Revit, to generate IFC file formats for the cloud models and then integrate the model with related BIM software such as Costx and Autodesk Navisworks that are essential for implementing BIM strategies.
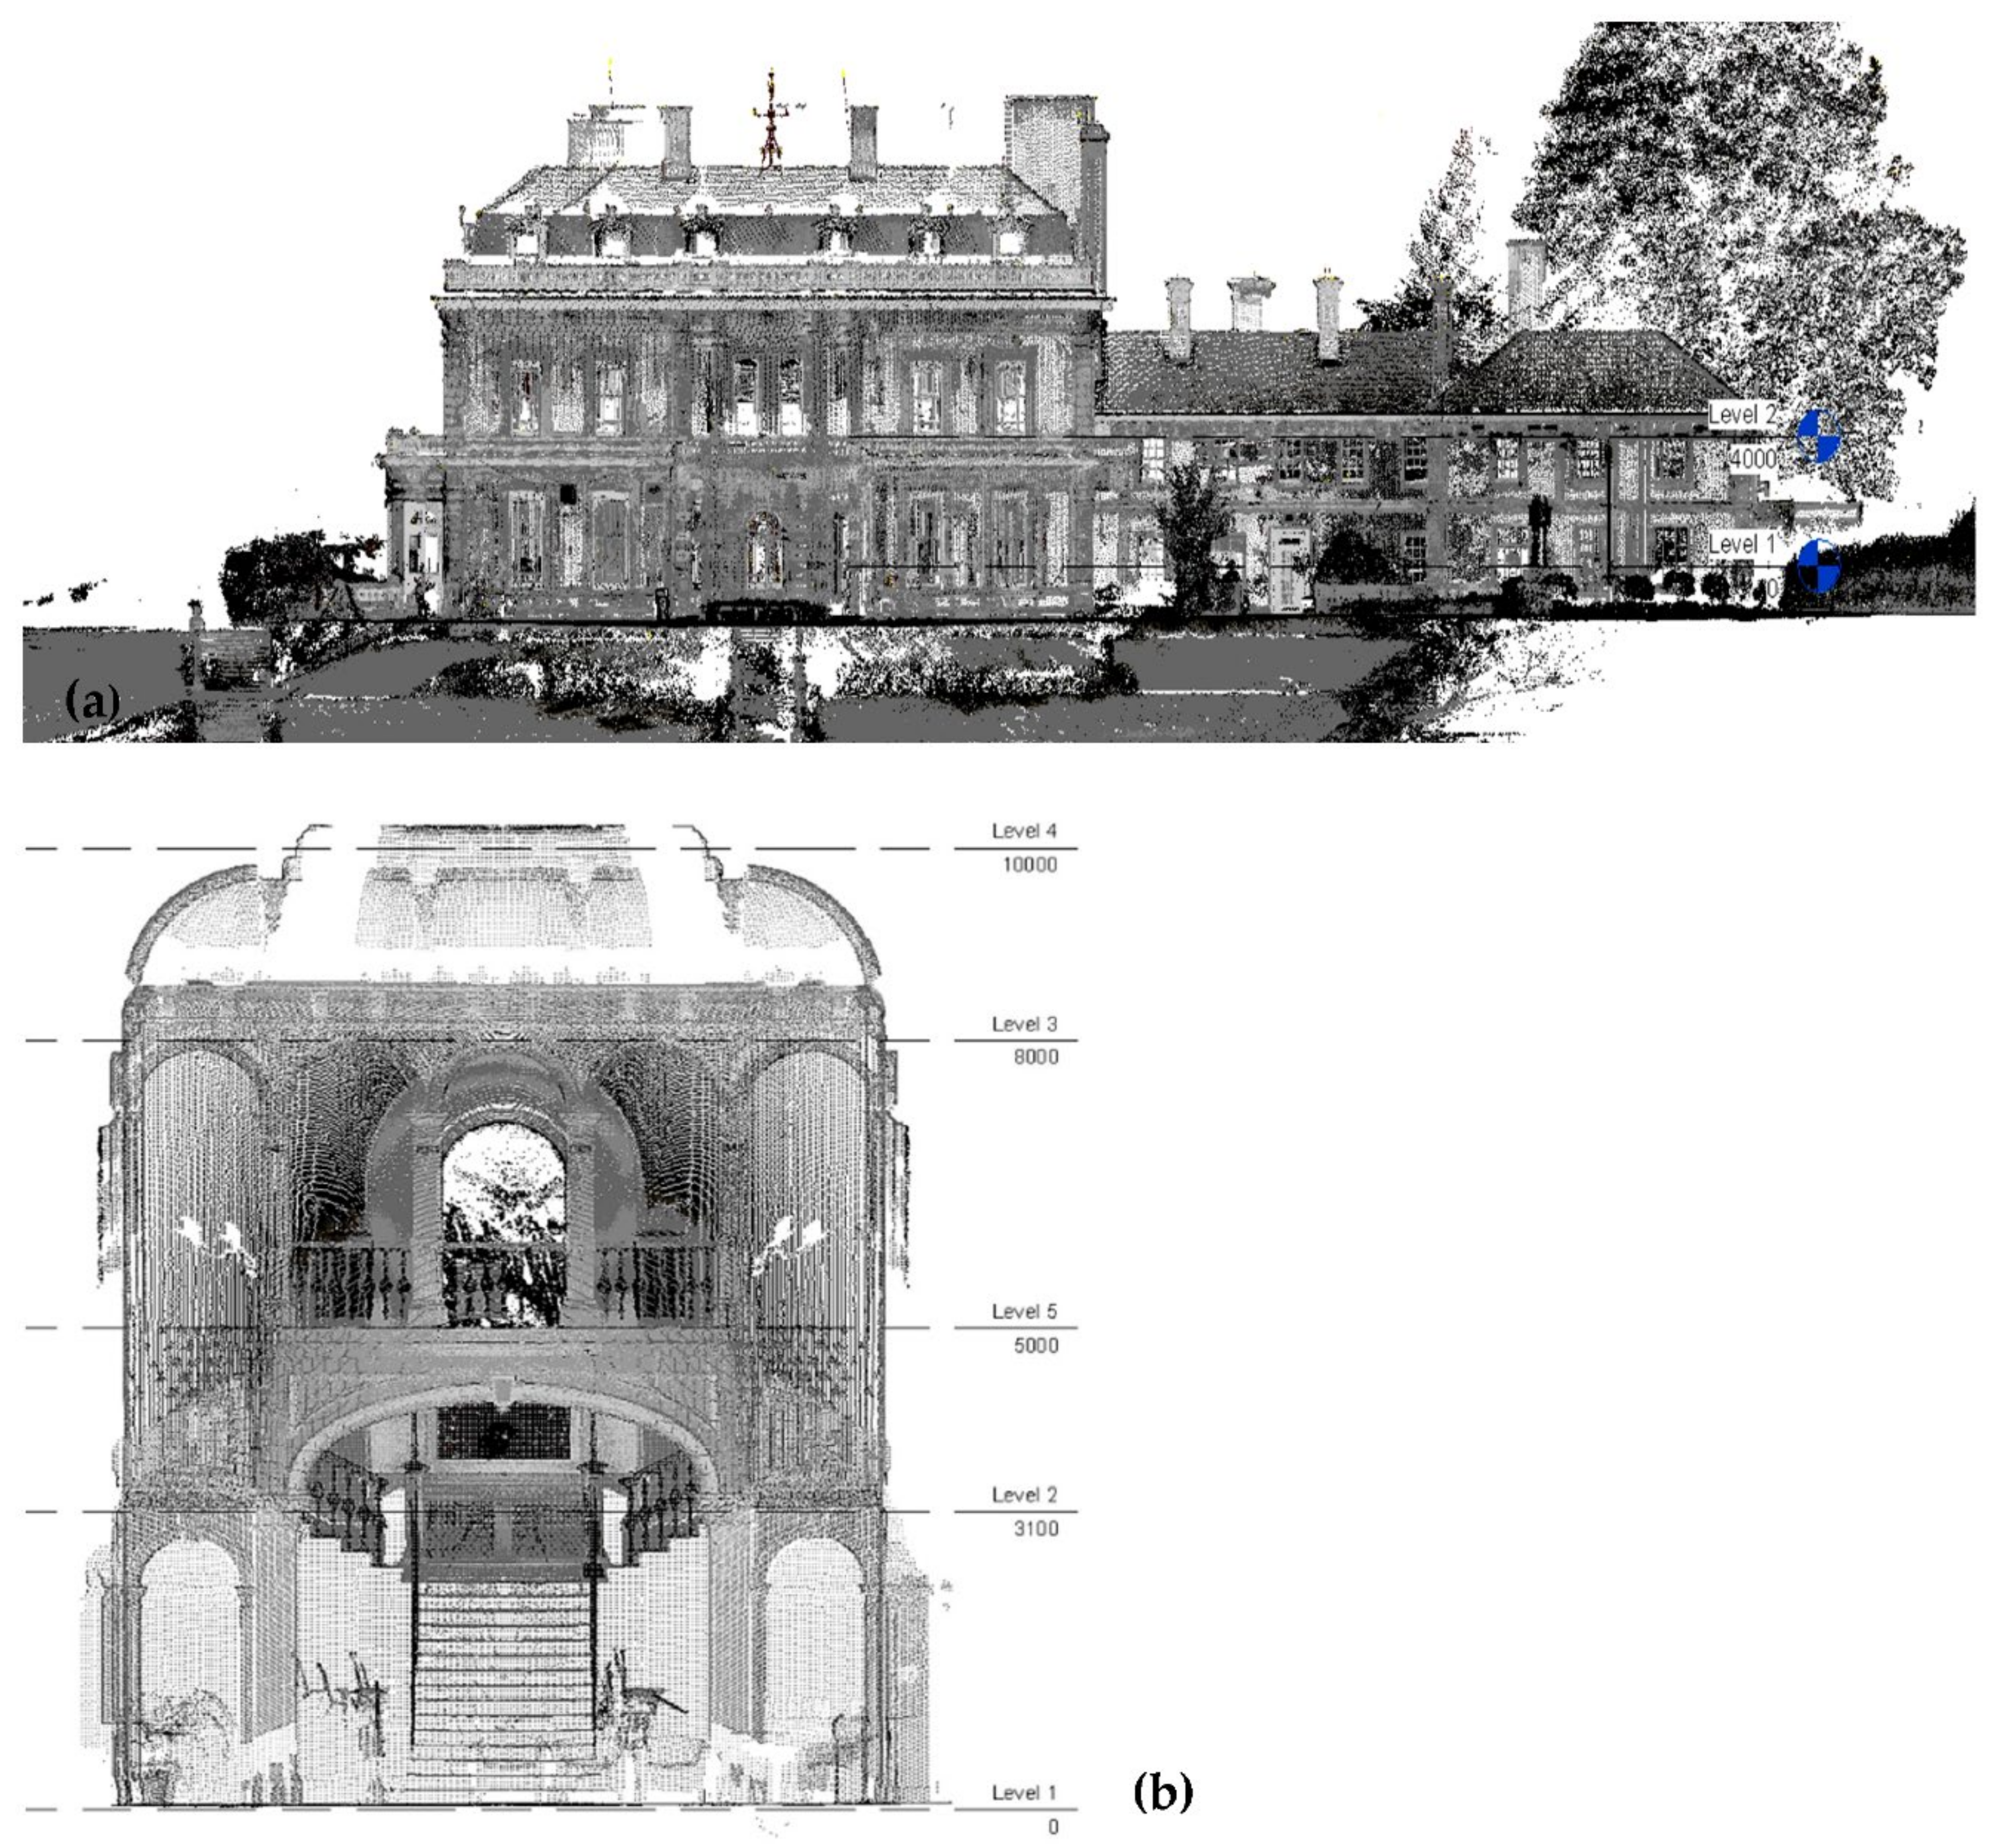
The cloud model was exported in DWG file format then imported into Autodesk Revit software that is commonly used for BIM applications. In Autodesk Revit, the cloud model was recognized as a 3D asset formed by millions of points, and these points were visible but intangible Autodesk Revit-generated horizontal and vertical sections of the model, as well as building elevations. These helped in understanding the building configuration of the case study, as well as documenting the resulting data as building drawings. Figure 14 illustrates the eastern elevation, and also a cross-section of the main hall of the Headingtion Hill Building.
Generating drawings from the cloud model was the first step in attaining cloud model integration with BIM applications. The resulting drawings can be utilized in documenting the historical building. Furthermore, the drawings were measurable, accurate, and exportable to other BIM software programs. Autodesk Revit was utilized as third-party software in this study, where Autodesk Revit enabled the exportation of the point cloud model in the IFC file format. The IFC file format integrates with other BIM software such as Autodesk Navisworks for scheduling and planning maintenance activities in the case of the Headington Hill Building. Furthermore, Autodesk Navisworks assists in simulating and recognizing possible renovation and rehabilitation practices when required. Additionally, the IFC file integrates with iTOW CostX software, which assists in cost planning and cost estimations of the operational and maintenance activities of the building. Such data can be used in rehabilitating historical buildings and renovating external and internal envelopes. Additionally, the resulting cloud model can substantially assist facility managers in planning and operating the performance of the building through linking the IFC model with an online database of BIM, such as BIM360, which is specifically used to enhance collaboration among facility managers, as well as monitoring the performance of the building and managing on-site practices. Figure 15 demonstrates the integration of the cloud model with possible BIM system applications.
4. Findings and Discussion
This study has yielded three main findings. Firstly, despite the multiple applications of laser scanning alongside BIM in the existing research, most studies focus on the process after the point cloud data exportation, with little attention being given to the acquisition of the data themselves. Therefore, it becomes imperative to further examine the data acquisition phase. Additionally, to ensure the direct communication or exchange of data in the scanning workflow, software and hardware requirements, and their interoperability within the BIM system, have been examined and are presented in Table 8.
Secondly, processing point cloud data requires a sequence of interconnected stages before exporting the cloud model to the BIM system software. These stages are necessary for defining the acquired scanning stations and forming the cloud model, then filtering the resulting cloud model using the de-noising methods and finally inspecting the model before the exportation to BIM software. Throughout this process, the study has revealed that the intensity of point cloud data before and after the de-noising process varies significantly for the exterior cloud model compared to the interior model. The de-noising process of the case study has shown that for the exterior, the number of cloud points was decreased by 50%, while for the interior, there was a reduction of less than 1%, which reflects the relation between the scanning distance and the physical surface of the building as well as the nature of the exterior scanning that covers the surrounding environment along with the targeted physical building. This contributes to the recent literature on the importance of specifying the required point cloud data so that the acquired data fulfill the required quality and efficiency of the acquisition and processing time.
Lastly, the study has demonstrated a framework for integrating the cloud model with the BIM system, where the exported model can be utilized by a range of professionals for various purposes. The cloud model can be utilized to document the status of the physical building for the benefit of the owners as well as professionals in the field of urban conservation as the case study has a remarkable historic value. The cloud model can mainly be utilized for renovation and rehabilitation practices, where relevant professionals apply different strategies to the resulting model before implementing them on-site. This process significantly enhances design decisions as well as reduces unexpected events. Additionally, facility managers benefit from the cloud model by utilizing the resulting model in managing maintenance practices, monitoring operational practices, and documenting updates and changes that occur in the physical building.
5. Conclusions
This study has examined the applications of 3D laser scanners in construction. A systematic review and a proof-of-concept method were used in this study to shed light on various factors influencing the use of laser scanners and their integration into BIM. It was found that, despite the recent interest in 3D laser scanners, research on their applications are still lacking in the construction field compared to other disciplines. Furthermore, it emerged that most studies have seldom focused on the data processing phase. Additionally, this study has found that issues with the intensity quality of point cloud data vis-à-vis the position of 3D laser stations can be revealed through de-noising. Additionally, the study revealed issues around the penetrability of laser beams through various surface materials. This is a crucial issue for the automated detection of various building elements that could be used for automated progress monitoring and the detection of discrepancies in construction. Lastly, the study demonstrated a framework for integrating the cloud model of the scanning stations with the BIM system, where such an approach can substantially enhance the management of building facilities, especially in the case of historic buildings. These findings reveal the need for further exploratory research to be conducted in the field of 3D laser scanning applications integrated with the BIM system within the built environment.
Author Contributions
Data curation, Z.O.S.; Investigation, A.A. and Z.O.S.; Methodology, A.A. and H.A.; Project administration, H.A.; Software, Z.O.S.; Supervision, A.A., H.A. and J.H.M.T.; Visualization, Z.O.S.; Writing-original draft, A.A.; Writing-review & editing, A.A. and H.A. All authors have read and agreed to the published version of the manuscript.
Funding
This research received no external funding.
Institutional Review Board Statement
Not applicable.
Informed Consent Statement
Not applicable.
Data Availability Statement
The data presented in this study are available on request from the corresponding author.
Conflicts of Interest
The authors declare no conflict of interest.
References
- Larsen, J.K.; Shen, G.Q.; Lindhard, S.M.; Brunoe, T.D. Factors affecting schedule delay, cost overrun, and quality level in public construction projects. J. Manag. Eng. 2016, 32, 04015032. [Google Scholar] [CrossRef] [Green Version]
- Omar, H.; Mahdjoubi, L.; Kheder, G. Towards an automated photogrammetry-based approach for monitoring and controlling construction site activities. Comput. Ind. 2018, 98, 172–182. [Google Scholar] [CrossRef]
- Ham, Y.; Golparvar-Fard, M. Mapping actual thermal properties to building elements in gbXML-based BIM for reliable building energy performance modeling. Autom. Constr. 2015, 49, 214–224. [Google Scholar] [CrossRef]
- Rahimian, F.; Seyedzadeh, S.; Oliver, S.; Rodriguez, S.; Dawood, N. On-demand monitoring of construction projects through a game-like hybrid application of BIM and machine learning. Autom. Constr. 2020, 110, 103012. [Google Scholar] [CrossRef]
- Sanhudo, L.; Ramos, N.M.; Martins, J.P.; Almeida, R.M.; Barreira, E.; Simões, M.L.; Cardoso, V. A framework for in-situ geometric data acquisition using laser scanning for BIM modelling. J. Build. Eng. 2020, 28, 101073. [Google Scholar] [CrossRef]
- Rahimian, F.; Chavdarova, V.; Oliver, S.; Chamo, F.; Amobi, L. OpenBIM-Tango integrated virtual showroom for offsite manufactured production of self-build housing. Autom. Constr. 2019, 102, 1–16. [Google Scholar] [CrossRef]
- Lagüela, S.; Díaz-Vilariño, L.; Armesto, J.; Arias, P. Non-destructive approach for the generation and thermal characterization of an as-built BIM. Constr. Build. Mater. 2014, 51, 55–61. [Google Scholar] [CrossRef]
- Sanhudo, L.; Ramos, N.M.; Martins, J.P.; Almeida, R.M.; Barreira, E.; Simões, M.L.; Cardoso, V. Building information modeling for energy retrofitting—A review. Renew. Sustain. Energy Rev. 2018, 89, 249–260. [Google Scholar] [CrossRef]
- Shalabi, F.; Turkan, Y. IFC BIM-based facility management approach to optimize data collection for corrective maintenance. J. Perform. Constr. Facil. 2017, 31, 04016081. [Google Scholar] [CrossRef]
- Jalaei, F.; Zoghi, M.; Khoshand, A. Life cycle environmental impact assessment to manage and optimize construction waste using Building Information Modeling (BIM). Int. J. Constr. Manag. 2019, 1–18. [Google Scholar] [CrossRef]
- Wang, Q.; Kim, M.K. Applications of 3D point cloud data in the construction industry: A fifteen-year review from 2004 to 2018. Adv. Eng. Inform. 2019, 39, 306–319. [Google Scholar] [CrossRef]
- Chan, D.W.; Olawumi, T.O.; Ho, A.M. Perceived benefits of and barriers to Building Information Modelling (BIM) implementation in construction: The case of Hong Kong. J. Build. Eng. 2019, 25, 100764. [Google Scholar] [CrossRef]
- Chen, K.; Lu, W.; Xue, F.; Tang, P.; Li, L.H. Automatic building information model reconstruction in high-density urban areas: Augmenting multi-source data with architectural knowledge. Autom. Constr. 2018, 93, 22–34. [Google Scholar] [CrossRef]
- Pica, D.; Abanda, F.H. Emerging BIM-3D-Laser Scanning Integration in Construction Practice. In Proceedings of the 11th International Conference (CITC-11), Construction in the 21st Century, London, UK, 9–11 September 2019. [Google Scholar]
- Maalek, R.; Lichti, D.D.; Ruwanpura, J.Y. Automatic recognition of common structural elements from point clouds for automated progress monitoring and dimensional quality control in reinforced concrete construction. Remote Sens. 2019, 11, 1102. [Google Scholar] [CrossRef] [Green Version]
- Remondino, F. Heritage recording and 3D modeling with photogrammetry and 3D scanning. Remote Sens. 2011, 3, 1104–1138. [Google Scholar] [CrossRef] [Green Version]
- Campi, M.; di Luggo, A.; Scandurra, S. 3D modeling for the knowledge of architectural heritage and virtual reconstruction of its historical memory. Int. Arch. Photogramm. Remote Sens. Spat. Inf. Sci. 2017, 42, 133. [Google Scholar] [CrossRef]
- Fassi, F.; Fregonese, L.; Ackermann, S.; De Troia, V. Comparison between laser scanning and automated 3d modelling techniques to reconstruct complex and extensive cultural heritage areas. Int. Arch. Photogramm. Remote Sens. Spat. Inf. Sci. 2013, 5, W1. [Google Scholar] [CrossRef] [Green Version]
- Guidi, G.; Russo, M.; Angheleddu, D. 3D survey and virtual reconstruction of archaeological sites. Digit. Appl. Archaeol. Cult. Herit. 2014, 1, 55–69. [Google Scholar]
- Nocerino, E.; Menna, F.; Remondino, F. Accuracy of typical photogrammetric networks in cultural heritage 3D modeling projects. Int. Arch. Photogramm. Remote Sens. Spat. Inf. Sci. 2014, 45, 465–472. [Google Scholar] [CrossRef] [Green Version]
- Pärn, E.A.; Edwards, D.J. Conceptualising the FinDD API plug-in: A study of BIM-FM integration. Autom. Constr. 2017, 80, 11–21. [Google Scholar] [CrossRef]
- Díaz-Vilariño, L.; Frías, E.; Balado, J.; González-Jorge, H. Scan planning and route optimization for control of execution of as-designed BIM. Int. Arch. Photogramm. Remote Sens. Spat. Inf. Sci. 2018, 42, 4. [Google Scholar] [CrossRef] [Green Version]
- Xiong, X.; Adan, A.; Akinci, B.; Huber, D. Automatic creation of semantically rich 3D building models from laser scanner data. Autom. Constr. 2013, 31, 325–337. [Google Scholar] [CrossRef] [Green Version]
- Bosché, F.; Ahmed, M.; Turkan, Y.; Haas, C.T.; Haas, R. The value of integrating Scan-to-BIM and Scan-vs-BIM techniques for construction monitoring using laser scanning and BIM: The case of cylindrical MEP components. Autom. Constr. 2015, 49, 201–213. [Google Scholar] [CrossRef]
- Kim, M.K.; Wang, Q.; Park, J.W.; Cheng, J.C.; Sohn, H.; Chang, C.C. Automated dimensional quality assurance of full-scale precast concrete elements using laser scanning and BIM. Autom. Constr. 2016, 72, 102–114. [Google Scholar] [CrossRef]
- Wu, W.; Chen, C.; Cong, Y.; Dong, Z.; Li, J.; Li, S.; Dai, W.; Yang, B. Low-cost wheeled robot-borne laser scanning system for indoor and outdoor 3d mapping application. Int. Arch. Photogramm. Remote Sens. Spat. Inf. Sci. 2019, 4213, 1155–1159. [Google Scholar] [CrossRef] [Green Version]
- Cheng, L.; Chen, S.; Liu, X.; Xu, H.; Wu, Y.; Li, M.; Chen, Y. Registration of laser scanning point clouds: A review. Sensors 2018, 18, 1641. [Google Scholar] [CrossRef] [Green Version]
- Fryskowska, A.; Stachelek, J. A no-reference method of geometric content quality analysis of 3D models generated from laser scanning point clouds for hBIM. J. Cult. Herit. 2018, 34, 95–108. [Google Scholar] [CrossRef]
- Barbosa, F.; Woetzel, J.; Mischke, J. Reinventing Construction: A Route of Higher Productivity; McKinsey Global Institute: Chicago, IL, USA, 2017. [Google Scholar]
- Aydin, C.C. Designing building façades for the urban rebuilt environment with integration of digital close-range photogrammetry and geographical information systems. Autom. Constr. 2014, 43, 38–48. [Google Scholar] [CrossRef]
- Fröhlich, C.; Mettenleiter, M. Terrestrial laser scanning–new perspectives in 3D surveying. Int. Arch. Photogramm. Remote Sens. Spat. Inf. Sci. 2004, 36, W2. [Google Scholar]
- Bhatla, A.; Choe, S.Y.; Fierro, O.; Leite, F. Evaluation of accuracy of as-built 3D modeling from photos taken by handheld digital cameras. Autom. Constr. 2012, 28, 116–127. [Google Scholar] [CrossRef]
- Göçer, Ö.; Hua, Y.; Göçer, K. A BIM-GIS integrated pre-retrofit model for building data mapping. In Building Simulation; Tsinghua University Press: Beijing, China, 2016; Volume 9, pp. 513–527. [Google Scholar]
- Hichri, N.; Stefani, C.; De Luca, L.; Veron, P.; Hamon, G. From point cloud to BIM: A survey of existing approaches. In Proceedings of the XXIV International CIPA Symposium, Strasbourg, France, 2–6 September 2013. [Google Scholar]
- Tang, P.; Anil, E.B.; Akinci, B.; Huber, D. Efficient and effective quality assessment of as-is building information models and 3D laser-scanned data. In Proceedings of the International Workshop on Computing in Civil Engineering, Miami, FL, USA, 19–22 June 2011; pp. 486–493. [Google Scholar]
- Tang, P.; Huber, D.; Akinci, B.; Lipman, R.; Lytle, A. Automatic reconstruction of as-built building information models from laser-scanned point clouds: A review of related techniques. Autom. Constr. 2010, 19, 829–843. [Google Scholar] [CrossRef]
- Wang, C.; Cho, Y.K.; Kim, C. Automatic BIM component extraction from point clouds of existing buildings for sustainability applications. Autom. Constr. 2015, 56, 1–13. [Google Scholar] [CrossRef]
- Lagüela, S.; Díaz-Vilariño, L.; Martínez, J.; Armesto, J. Automatic thermographic and RGB texture of as-built BIM for energy rehabilitation purposes. Autom. Constr. 2013, 31, 230–240. [Google Scholar] [CrossRef]
- Rebolj, D.; Pučko, Z.; Babič, N.Č.; Bizjak, M.; Mongus, D. Point cloud quality requirements for Scan-vs-BIM based automated construction progress monitoring. Autom. Constr. 2017, 84, 323–334. [Google Scholar] [CrossRef]
Figure 1.
Word cloud from the 4 databases obtained using the search terms “3D Laser Scanning” + “3D Point Cloud”.
Figure 1.
Word cloud from the 4 databases obtained using the search terms “3D Laser Scanning” + “3D Point Cloud”.

Figure 2.
Word cloud from the 4 databases obtained using the search term “Scan to BIM”.

Figure 3.
3D model and aerial view of Headington Hill Building.

Figure 4.
Cloud data examination framework.

Figure 5.
External scanning point placement on the Headington Hill Building site.

Figure 6.
Headington Hill Building plan: (a) ground floor plan; (b) first floor main hall plan.

Figure 7.
Automatic point cloud registration.

Figure 8.
Manual registration process.

Figure 9.
Point cloud registration stages: (1) automatic registration; (2, 3, 4, 5, 6) manual registration.
Figure 9.
Point cloud registration stages: (1) automatic registration; (2, 3, 4, 5, 6) manual registration.

Figure 10.
Headington Hill Building exterior cloud model.

Figure 11.
Point cloud de-noising: (a) prior to de-noising; (b) after de-noising.

Figure 12.
Investigation of the main hall elements of the Headington Hill Building.

Figure 13.
(a) Original photograph; (b) main hall glass roof; (c) main hall roof structure; (d) penetrability test.
Figure 13.
(a) Original photograph; (b) main hall glass roof; (c) main hall roof structure; (d) penetrability test.

Figure 14.
(a) Eastern elevation of Headington Hill Building; (b) cross-section of the main hall.

Figure 15.
Cloud model integration with BIM applications.


Table 1.
“3D Laser Scanning” + “Point Clouds” Results.
| Search Engines | Science Direct | Ebsco | Emerald | Google Scholar |
|---|---|---|---|---|
| Journals | Occurrence | |||
| ISPRS Journal of Photogrammetry and Remote Sensing | 2 | 3 | 1 | |
| Automation in Construction | 1 | 1 | ||
| Journal of Cultural Heritage | 1 | 3 | ||
| Measurement | 1 | 1 | ||
| Pattern Recognition | 1 | 2 | 1 | |
| Journal of Building Engineering | 1 | |||
| Advanced Engineering Informatics | 2 | 1 | ||
| Automation in Construction | 4 | 2 | ||
| Procedia Engineering | 1 | |||
| Simulation Modelling Practice and Theory | 1 | |||
| Sensors | 7 | 1 | ||
| International Journal of Distributed Sensor Networks | 1 | |||
| IEEE Transactions on Geoscience & Remote Sensing | 3 | |||
| Journal of Sustainable Forestry | 1 | |||
| Geomechanik and Tunnelbau | 1 | |||
| International Journal of Pattern Recognition & Artificial Intelligence | 1 | |||
| Remote Sensing | 4 | |||
| Journal of Coastal Research | 1 | |||
| Instrumentation, Mesures, Métrologies | 1 | |||
| ISPRS International Journal of Geo-Information | 1 | |||
| Computers & Geosciences | 1 | |||
| International Journal of Remote Sensing | 2 | |||
| International Journal of Agricultural & Biological Engineering | 1 | |||
| Engineering Geology | 2 | |||
| Geomatics & Information Science of Wuhan University | 1 | |||
| International Journal of Pavement Engineering | 1 | |||
| International Journal of Applied Earth Observation & Geoinformation | 1 | |||
| Journal of Computing in Civil Engineering | 1 | |||
| Bulletin of Engineering Geology & the Environment | 1 | |||
| International Journal for Light & Electron Optics | 1 | |||
| Archives of Photogrammetry, Cartography & Remote Sensing | 3 | |||
| Journal of Applied Geodesy | 1 | |||
| International Journal of Production Research | 1 | |||
| Mathematical Problems in Engineering | 1 | |||
| Journal of the Institute of Science & Technology | 1 | |||
| Landslides | 1 | |||
| Annals of Botany | 1 | |||
| Computer-Aided Design & Applications | 1 | |||
| Estuarine Coastal & Shelf Science | 1 | |||
| Ecology & Evolution | 1 | |||
| Agricultural & Forest Meteorology | 1 | |||
| Computers & Electronics in Agriculture | 1 | |||
| Geophysical Research Abstracts | 2 | |||
| International Journal of Building Pathology and Adaptation | 1 | |||
| Journal of Facilities Management | 1 | |||
| International Journal of Intelligent Computing and Cybernetics | 1 | |||
| Built Environment Project and Asset Management | 1 | |||
| Engineering, Construction and Architectural Management | 1 | |||
| Assembly Automation | 1 | |||
| European Journal of Remote Sensing | 1 | |||
| Applied Mechanics and Materials | 1 | |||
| American Journal of Engineering Research | 1 | |||
| IEEE Access | 1 | |||
| Revista de la Facultad de Ingeniería U.C.V | 1 | |||
| Bulletin of Surveying and Mapping | 1 | |||
| Computer Science | 1 | |||
| Journal of Shandong University of Technology | 1 | |||
| Metal Mine | 1 | |||
| Nonferrous Metals Science and Engineering | 1 | |||
| Journal of Wuhan University of Technology | 1 | |||
| Construction Management and Economics | 1 | |||
Table 2.
“Scan to Building Information Modeling (BIM)” Results.
| ‘Scan to BIM’ | ||||
|---|---|---|---|---|
| Search Engines | Science Direct | Ebsco | Emerald | Google Scholar |
| Journals | Occurrences | |||
| Journal of Building Engineering | 1 | |||
| Advanced Engineering Informatics | 1 | 6 | 1 | |
| Automation in Construction | 4 | 11 | 1 | |
| Procedia Engineering | 1 | |||
| Simulation Modelling Practice and Theory | 1 | |||
| Remote Sensing | 3 | 2 | ||
| Simulation Modelling Practice & Theory | 1 | |||
| Computer-Aided Civil & Infrastructure Engineering | 1 | |||
| Journal of Computing in Civil Engineering | 2 | |||
| Journal of Facilities Management | 1 | |||
| Built Environment Project and Asset Management | 1 | |||
| Structural Survey | 1 | |||
| The International Archives of the Photogrammetry, Remote Sensing and Spatial Information Sciences | 4 | |||
| Architectural Engineering and Design Management | 1 | |||
| Architecture and Civil Engineering | 1 | |||
| Virtual Archaeology Review | 1 | |||
| Geo Business | 1 | |||
| European Real Estate Society | 1 | |||
| Construction Research Congress | 1 | |||
Table 3.
The Technical Specifications of Trimble TX8 Laser Scanner.
| Scan Parameter | Trimble TX8 Specifications |
|---|---|
| Maximum range (m) | 120 m |
| Minimum range (m) | 0.6 m |
| Field of view (degree) | 360° × 317° |
| Scanning speed | 1 million points/second |
| Scan duration (seconds) | 60 s |
| Scan accuracy (mm) | <2 mm noise or error on most surfaces |
| Laser beam diameter (mm) | 6–34 invisible |
| Data storage | USB flash drive |
Table 4.
List of acquired cloud points of external scans along with station point distances.
| Station | Distance from Nearest Building Surface (Meters) | Cloud Points |
|---|---|---|
| Station A | 15.5 m | 1,035,939 |
| Station B | 20 m | 1,178,415 |
| Station C | 6.5 m | 1,428,007 |
| Station D | 22.5 m | 1,072,529 |
| Station E | 13.6 m | 1,389,529 |
Table 5.
Lists Acquired Cloud Points of Internal Scans along with Station Point Distances.
| Station | Distance from Nearest Building Surface (Meters) | Cloud Points (Millions) |
|---|---|---|
| Station 1 | 3 m | 1,879,252 |
| Station 2 | 4.5 m | 1,864,804 |
| Station 3 | 2.5 m | 1,865,083 |
| Station 4 | 3.5 m | 1,857,055 |
| Station 5 | 4 m | 1,861,777 |
| Station 6 | 2 m | 1,843,463 |
| Station 7 | 3.5 m | 1,873,135 |
| Station 8 | 5 m | 1,875,792 |
| Station 9 | 5 m | 1,878,262 |
| Station 10 | 5 m | 1,835,489 |
| Station 11 | 4.5 m | 1,894,394 |
| Station 12 | 4.5 m | 1,895,844 |
Table 6.
Cloud points prior to and after cloud de-noising.
| Cloud Model | Cloud Points Prior to De-Noising | Cloud Points after De-Noising | Redacted Points |
|---|---|---|---|
| Exterior Model | 8,224,818 | 4,093,981 | 4,130,837 |
| Interior Model | 52,278,405 | 50,127,390 | 2,0151,015 |
Table 7.
Key File Formats in CAD with Exporting Availability of these Formats in Trimble Realworks.
| File Format | Availability | Compatible Software | BIM Applications |
|---|---|---|---|
| DWG | Available | AutoCAD Suite, Revit | Required |
| DXF | Available | AutoCAD Suite, Revit | Upon request |
| IFC | Not available | Revit, Costx, Navisworks | Required |
| SKP | Built-in plugin | SketchUp, 3ds Max, Revit | Upon request |
| OBJ | Available | 3ds Max | Upon request |
| KMZ | Available | Google Earth | Upon request |
| FBX | Available | 3ds Max, AutoCAD Suite | Upon request |
| Not available | Adobe Acrobat, AutoCAD Suite | Upon request | |
| DGN | Available | AutoCAD Suite, Revit | Upon request |
| ACIS | Not available | AutoCAD Suite | Upon request |
Table 8.
Interoperable File Formats between Different 3D Printing-related Software Systems.
| 3D Laser Scanner | Software | File in (Input to Software) | File Out (Output from Software) | ||
|---|---|---|---|---|---|
| Point Cloud based software | 3D laser scanner-dependent software | Trimble TX (Data output format: RWP) | Trimble Realworks | RWP, XYZ, E57, LAS, LAZ, ZFS, RSP, FLS, DP, PTX, PTS | E57, ASC, LAS 1.2, LAS 1.4, LAZ, POD, PTS, PTX, TZF, BSF, KMZ, DWG, DXF, DGN, FBX, OBJ |
| FARO (Data output format: FLS) | FARO Scene | FLS, XYZ, CVS, COR, CPE | PTC, PTX, PST, XYZ, DXF, IGES, VRML, E57 | ||
| Leica (Data output format: PTX and PTS) | Leica Cyclone | XYZ, PTS, PTX, LAS, E57, ZFS, DP | XYZ, PTS, PTX, E57, DXF, PCI/CWF, DBX, gbXML | ||
| 3D laser scanner-independent software | LiDAR360 | LiData, las, laz, asc, neu, xyz, pts, csv, ply | LiData, las, laz, asc, neu, xyz, pts, csv, ply | ||
| PolyWorks | IGES, STEP, DXF, JT, OBJ, PLY, POL, STL, VRML 2.0 | IGES, STL, DXF | |||
| PointCab | dp, e57, asc, fws, lsproj, fls, las, laz, lsdx, lse, dae, 3ds, ifc, stl, mpc, ply, ptg, ptx, rps, pvtp, vtp, xyz, zfs, .zfprj | dwg, dxf, dae, 3ds | |||
| BIM-based tools | Autodesk Recap | ASC, CL3, CLR, E57, FLS, FWS, ISPROJ, LAS, PCG, PTG, PTS, PTX, RDS, TXT, XYB, XYZ, ZFS, ZFPRJ, DXF, DWG | RCS, RCP, PCG, PTS, E57, DXF, DWG | ||
| Autodesk Revit | DWG, RVT, DXF, gbXML, RCP, DWF | DWG, DXF, gbXML, FBX, DGN, ACIS, IFC | |||
| Bentley | POD, OBJ, SHP, DXF, DWG, ESRI, E57, ZFS, LAZ, LAS, FLS, FWS, XYZ, PTS, PTX, PTZ, TXT, LWO, CL3, BIN, RSP, 3DD | POD, PTS, XYZ | |||
| ArchiCAD | DWG, IFC, 3DS, 3DM, SKP, KMZ, STL, PDF, DXF | PDF, DWF, DXF, DWG, DGN | |||
| Web-based visualization and processing | FARO SCENE WebShare | rcp, pod, xyz, e57 | |||
| Leica Pegasus | |||||
| Flyvast | LAS, LAZ, XYZ, PTX, PLY, OBJ | FLY, dxf, shp | |||
| Voxxlr | IFC, Dxf, e57, pts, ply, las, laz |
Publisher’s Note: MDPI stays neutral with regard to jurisdictional claims in published maps and institutional affiliations. |
© 2021 by the authors. Licensee MDPI, Basel, Switzerland. This article is an open access article distributed under the terms and conditions of the Creative Commons Attribution (CC BY) license (http://creativecommons.org/licenses/by/4.0/).
Share and Cite
MDPI and ACS Style
Almukhtar, A.; Saeed, Z.O.; Abanda, H.; Tah, J.H.M. Reality Capture of Buildings Using 3D Laser Scanners. CivilEng 2021, 2, 214-235. https://doi.org/10.3390/civileng2010012
AMA Style
Almukhtar A, Saeed ZO, Abanda H, Tah JHM. Reality Capture of Buildings Using 3D Laser Scanners. CivilEng. 2021; 2(1):214-235. https://doi.org/10.3390/civileng2010012
Chicago/Turabian StyleAlmukhtar, Avar, Zaid O. Saeed, Henry Abanda, and Joseph H. M. Tah. 2021. "Reality Capture of Buildings Using 3D Laser Scanners" CivilEng 2, no. 1: 214-235. https://doi.org/10.3390/civileng2010012