Technical Note

A Comparative Study on the Performances of Flat Plate and Evacuated Tube Collectors Deployable in Domestic Solar Water Heating Systems in Different Climate Areas

by
Adriana Greco
1,
Edison Gundabattini
2,
Darius S. Gnanaraj
3 and
Claudia Masselli
4,*
1
DII, University of Naples Federico II, P. le Tecchio 80, 80125 Napoli, Italy
2
Department of Thermal & Energy Engineering, Vellore Institute of Technology (VIT), Vellore, Tamil Nadu 632014, India
3
Department of Design & Automation, Vellore Institute of Technology (VIT), Vellore, Tamil Nadu 632014, India
4
DIIn, University of Salerno, Via Giovanni Paolo II 132, 84084 Fisciano (SA), Italy
*
Author to whom correspondence should be addressed.
Climate 2020, 8(6), 78; https://doi.org/10.3390/cli8060078
Submission received: 14 May 2020 / Revised: 11 June 2020 / Accepted: 13 June 2020 / Published: 15 June 2020

Abstract

:
Using TRNSYS software, a comparison of the energy performances of flat-plate collectors (FPCs) and evacuated-tube collectors (ETCs) in domestic solar water heating systems located in different climate areas was carried out in order to ascertain solar energy utilization. Investigations were carried out on single FPCs and ETCs and also for strings of four panels connected in series. Tests were conducted using simulations for water as heat transfer fluid with a fixed fluid flow rate and varying the temperature of the collector’s returning fluid. The maximum power peak decreases with the increase in the inlet temperature of the fluid to the collector in the FPC. The maximum outlet temperature of the FPC is higher than the ETC, most of the time. The evacuated-tube collector performs better only in cold climate areas. Simulations suggest that the use of the FPC is strongly discouraged in cold climatic areas due to thermal losses, whereas the ETC works well with reduced dispersion of heat. In warm seasons, on the contrary, the FPC takes advantage of the high environmental temperature which heats the fluid. The maximum yearly outlet temperature and useful power peak predicted in different climatic areas were investigated by varying the temperature of the fluid inlet fed to the two strings of four FPCs and ETCs. In all cases, the outlet temperature is higher in the ETC technology.

1. Introduction

Scientists who assess the health of our planet see indisputable evidence that the Earth has been getting warmer, in some cases rapidly. Most believe that human activities, in particular the burning of fossil fuels and the resulting build-up of greenhouse gases in the atmosphere, due to vapor compression refrigeration and air-conditioning, have influenced this warming trend [1,2,3,4,5]. In the past decade, scientists have documented record-high average annual surface temperatures and have been observing other signs of changes all over the planet—in the distribution of ice, and in the salinity, levels, and temperatures of the oceans [6,7]. A drastic “change of course” is necessary, starting from mutating the concepts of energy sources and the way we conceive cooling and air conditioning [7,8,9,10,11,12,13].
The growing interest in finding alternatives to refrigeration and heating, ventilation, and air conditioning (HVAC) systems based on vapor compression has oriented the scientific community toward developing solutions based on renewable energies [14,15,16]. Renewable energy refers to the provision of energy via renewable resources that are naturally supplied as quickly as they are used. The most common examples are solar, wind, biomass, rain, tides, waves, and geothermal heat-based energies [17,18,19,20]. Among them, solar energy is largely employed for heating and cooling water for domestic and industrial uses, respectively, namely solar heating/cooling systems [21,22,23]. Through photovoltaic panels, solar energy is utilized for generating electric power [24,25].
TRNSYS 16 is an extremely flexible and graphically based software environment used to simulate the behavior of transient systems. While the vast majority of simulations are focused on assessing the performance of thermal and electrical energy systems, TRNSYS can be equally well used to model other dynamic systems, such as traffic flow, or biological processes [26].
The focus of this paper is on water heating, by means of solar energy utilization, for domestic purposes. It is worth mentioning that solar water heating (SWH) is the most common mode of utilizing solar energy because of the technological feasibility and economic attraction of the related systems compared with other kinds of solar energy utilization. Scientific literature contains a large number of studies on solar heating plants, analyzing them from economical, energetic, and applicability points of view [27,28,29,30,31,32]. The key elements of such systems are solar collectors that act as heat exchangers to convert energy coming from the sun, by absorbing solar radiation, using the internal energy of a heat transfer fluid that is usually constituted by water or by ethylene/propylene water-based mixtures (EG-W or PG-W) [33]. Using a pump, the water heated through solar collectors is made to circulate and is stored in a storage tank. Specifically, the flux of water enters the tank with the help of a solar controller, when the difference between the temperature of the water at the bottom of the tank and the heat transfer fluid at the outlet from the collector exceeds a set value, generally 80 °C. When that condition is not met, an auxiliary heater supplies energy to raise the temperature of the water entering the tank.
The most common solar collectors employed in SWH systems are flat-plate collectors (FPCs), evacuated-tube collectors (ETCs), and compound parabolic collectors (CPCs), but the first two are usually installed in systems for domestic applications [34,35,36,37].
The performance of a solar water heating system depends mainly on the type of solar collectors, the climate area in which they are installed, and a combination of the two factors. One type of solar collector is mostly suitable for a particular climate area, rather than another one. The objectives of this research work were to compare the energy performances of FPCs and ETCs using TRNSYS 16 software and to propose the best solar collector for use in domestic SWH systems located in areas having different climatic conditions.

2. Solar Collectors

The type of operation and the performance quality of the entire system depend largely on the collectors. They can be distinguished by different shapes, sizes, technical characteristics, and efficiency, depending on the various types available on the market and the specific application. Process heating in large copper mining operations in Chile demands a high consumption of thermal energy in processes at temperatures below 100 °C. The high solar radiation at various mining operation locations is conducive to integrating solar collectors (FPCs, ETCs) into the process. Financial analysis was done taking a solar process heat system model and simulations were performed using TRNSYS where the slope of the fixed collectors (FPCs and ETCs) was assumed to be equivalent to the location’s latitude. The results obtained were proof that solar heat is a competitive alternative to fossil fuels, reducing CO2 emissions and providing a positive economic performance [21,38].
Analyses of flat-plate SWH systems with natural gas as a backup were done using the dynamic thermal simulation program T*SOL for Barcelona-like climate conditions. Analysis suggests that FPCs and ETCs are the most sustainable alternatives over a natural gas-fired condensing boiler and over an electric water heater. Flat-plate collectors are preferred to evacuated-tube collectors; flat-plate collectors rank better than evacuated-tube collectors [39].
Experimental analysis was done for various solar water heating systems using FPCs and ETCs according to Palestinian environmental conditions. A comparison of the experimental prototype of solar water heating systems with ETCs and FPCs was conducted. The results of the comparative tests under the same weather conditions showed that the daily energy collected by FPCs was 1415 Wh/m2 and for ETCs was 1854 Wh/m2 with efficiencies of 38% and 49%, respectively [27].
In this paper, the performance of flat-plate solar collectors and evacuated-tube collectors was analyzed using transient energy analysis and TRNSYS 16 software.

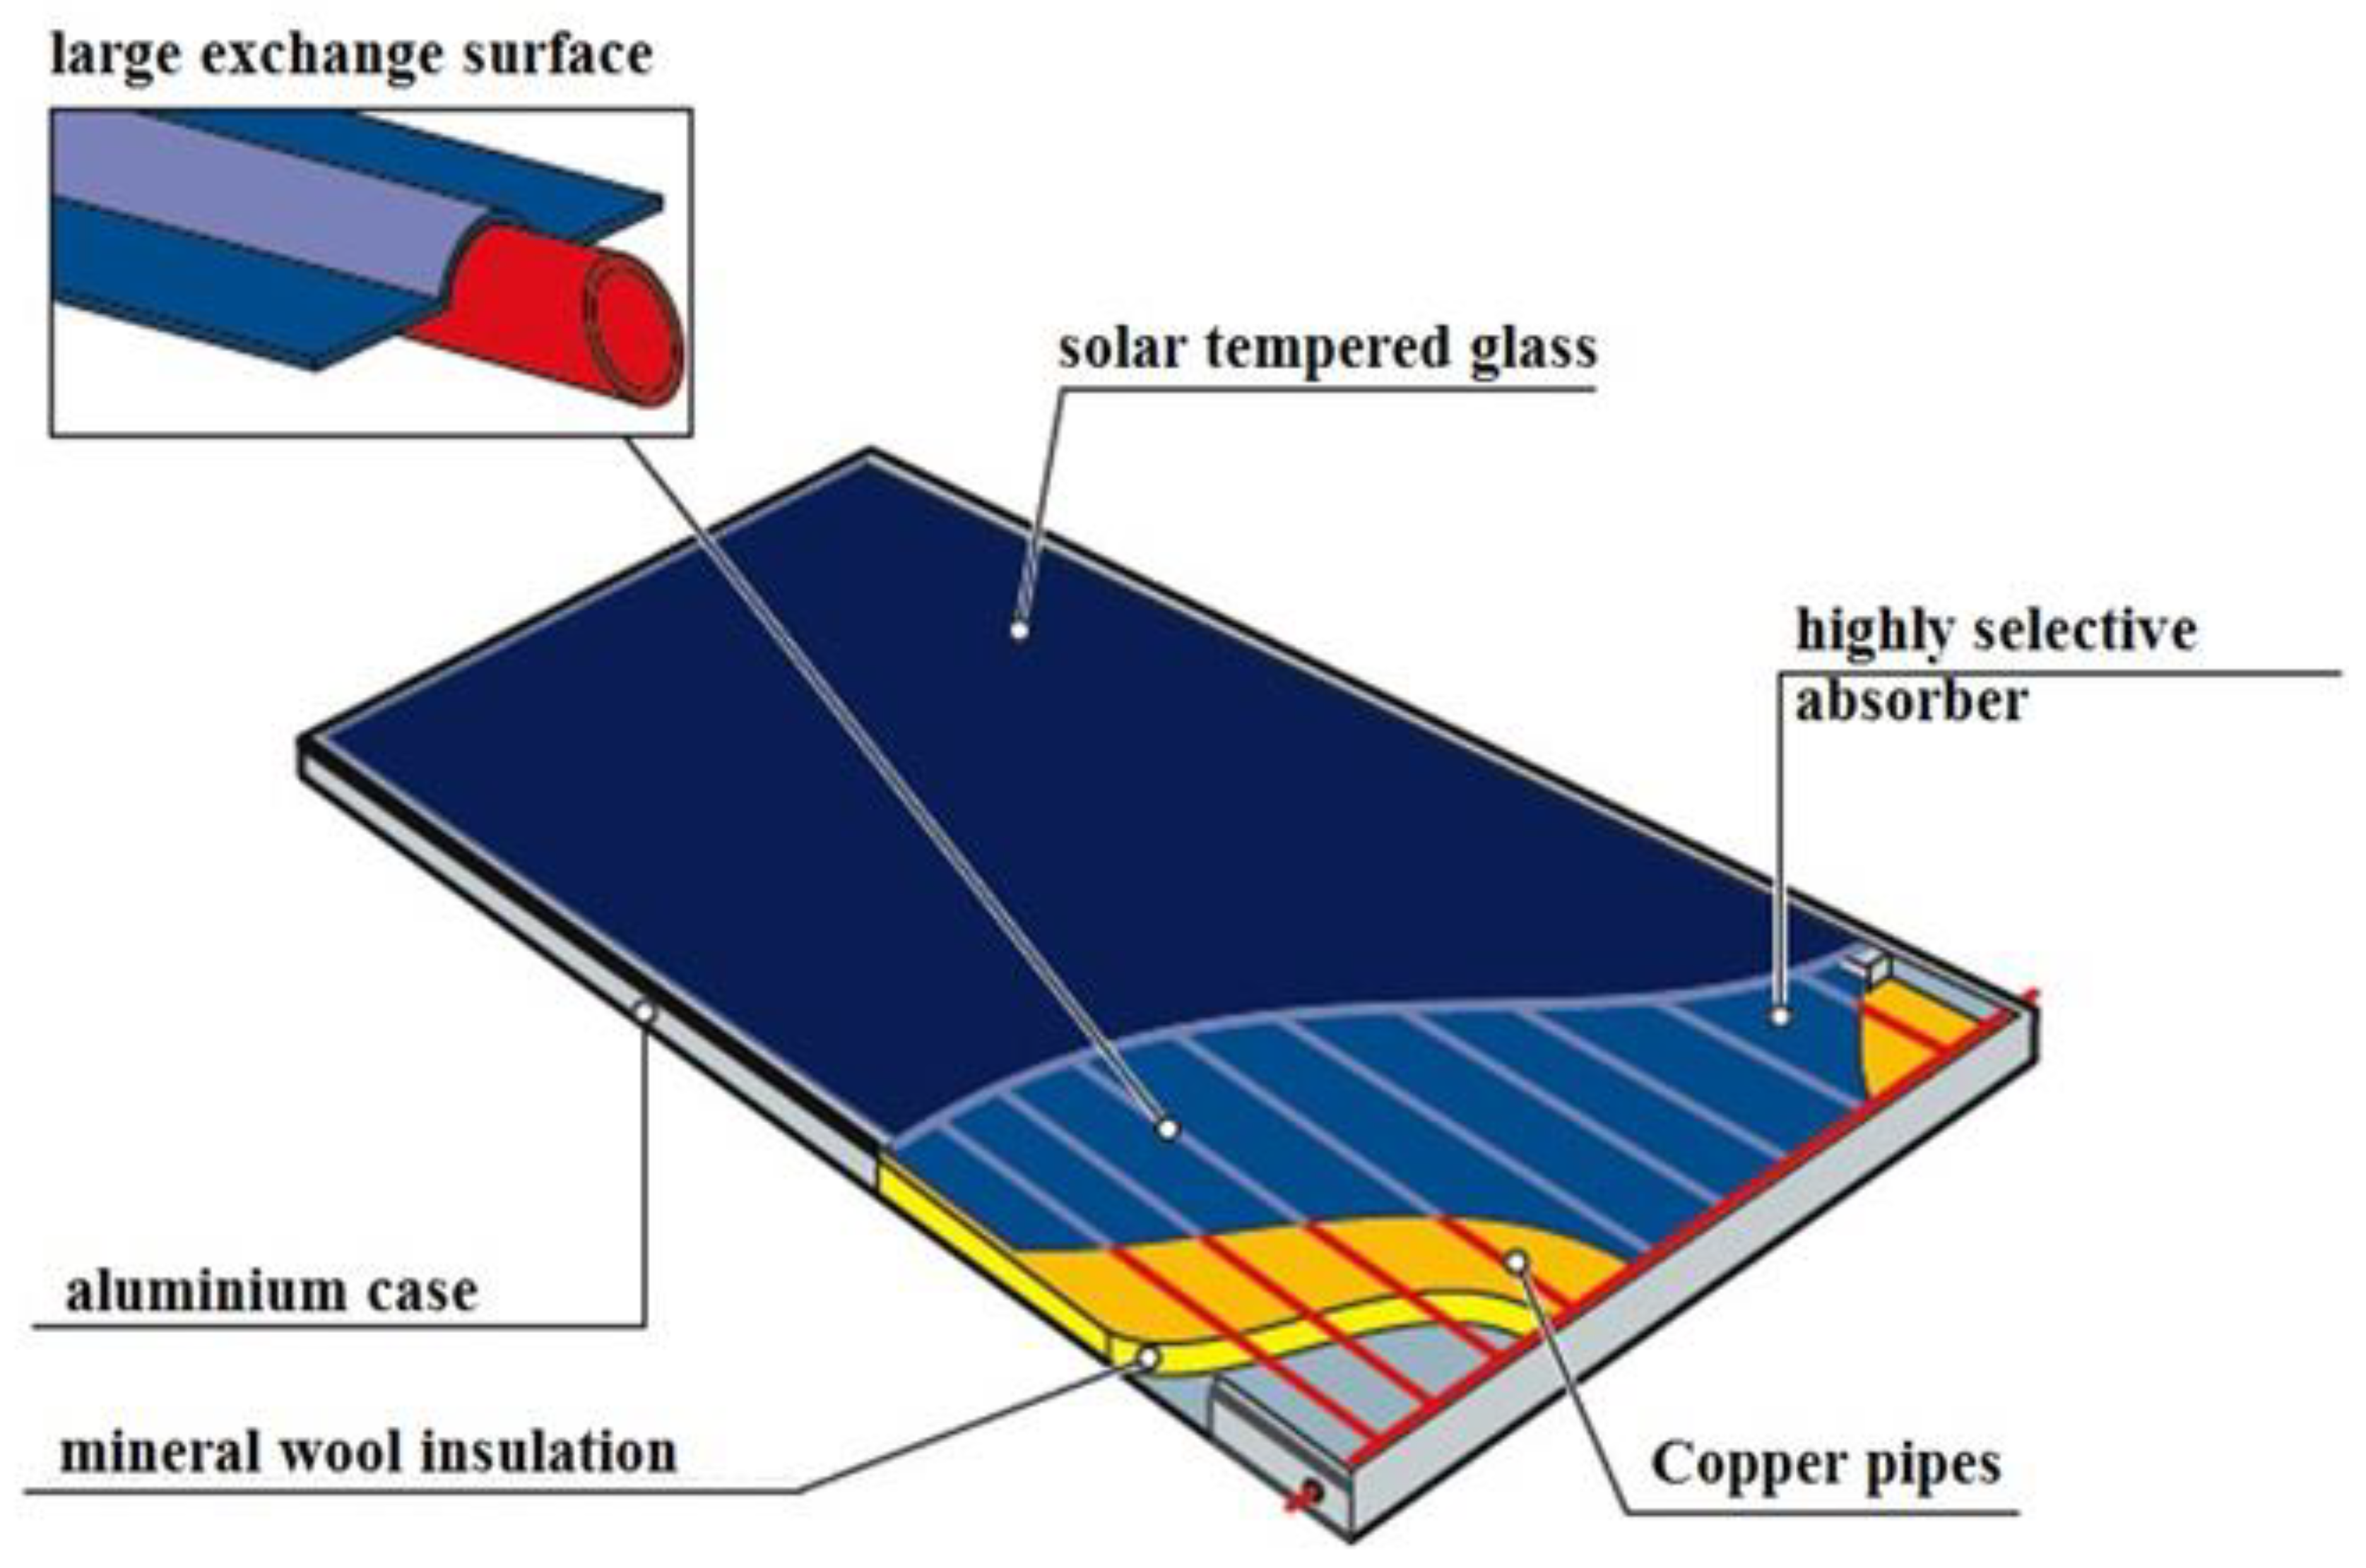
2.1. Flat-Plate Collectors

The flat-plate collector, schematized in Figure 1, is the most diffused type of solar collector. The collector behaves like a black body, absorbing a high percentage (up to 95% for the best systems) of energy from the incident solar radiation, to increase its temperature. To avoid the dispersion of solar radiation, the collector is covered by a material transparent to radiation but opaque to infrared rays, in order to create a greenhouse effect that allows the heat to remain trapped and to increase the temperature of the collector. Indeed, the core of the flat-plate collector is the capturing plate, which absorbs heat by radiation and transmits it to the heat transfer fluid circulating within a bundle of pipes generally arranged in a coil. The surface absorbing solar radiation of the flat-plate solar collector is nearly as large as the collector. The FPC is classified into two types—one is the liquid-type collector, where the liquid is the heat transfer fluid, and the second one is the air-type collector, where air is the heat transfer fluid [40].
Global solar radiations have a direct radiation component and a diffused radiation component. When comparing these two, the direct radiation component has a more effective solar thermal energy intensity value compared to that of the diffused radiation component. Therefore, a higher value of the direct radiation component results in a larger value of useful energy harnessed by the solar collector [41]. In this paper, the plate is made of copper or steel to ensure good thermal conductivity and the surface is treated with dark and opaque material to reduce reflection and increase absorption. This surface must have a high degree of absorption of the short waves of radiation and a low degree of emission of the long waves, mainly infrared, emitted by the plate at its operating temperature. To guarantee a good thermal contact between the capturing surface and the bundle of pipes in which the heat carrier fluid flows and to minimize the thermal resistance between the two structures, they are welded together. The captive plate is interposed between the transparent front cover and an insulated casing. In this way, it limits the heat dispersions linked to the thermal radiation emitted by the plate itself and favors the increase in temperature of the circulating fluid. The insulated case’s aim is to achieve thermal insulation of the bottom and lateral walls of the collector, to minimize losses by conduction. To limit the condensation due to humid air, an aluminum sheet is placed on the insulation plate, while the collector is placed in stainless steel wrap, anodized aluminum, or fiberglass to give compactness and mechanical solidity and to protect the various components from atmospheric agents and dust.
The heat transfer fluid, which flows inside the collector, must be characterized by high density and high specific heat and be non-corrosive. It must be chemically stable for temperatures up to 100 °C, and it should have reduced hardness, a low freezing point, and low viscosity. The most employed fluid that presents such features is water. Most of the time, it is associated with ethylene or propylene glycol to limit hardness and lower the freezing point. Ethylene glycol reduces the risk of freezing in winter and raises the boiling point in summer for high working temperatures, promoting good summer operation. The solar system developed while considering a common installation for the mining industry is composed of a solar collector field and a single-speed pump, using a mixture of water and 33% w/w propylene glycol as a working fluid for FPC and ETC collectors with a specific heat capacity of 3.824 kJ kg−1 K−1.
The transient efficiency of the collector is defined as the ratio between the useful power (transferred to the heat transfer fluid) and the radiant power incident on the collector:
η = Q ˙ u A c   ·   G     ,
Alternatively, the efficiency of the collector can be defined as follows:
η = F R ·   [ ( τ α )   U L ·   ( T i   T a )   G ] ,
where FR is the heat removal factor, defined as the ratio between the useful energy collected and the energy collected with the plate kept at the inlet temperature of the fluid. If the fluid flow rate and the inlet and outlet temperatures of the heat transfer fluid are known, FR can be evaluated through the Bliss relation [40]:
F R = Q u A c   ·   [   ( τ α )   ·   G U L   ·     ( T i   T a )   ]       ,
where UL is the global dispersion coefficient between plate and air, given by the sum of the dispersions upwards, downwards, and sideways. Typical values for FR fall in the 0.8–0.95 range.
Indeed, the efficiency of the flat-plate collector can be plotted as a function of the following:
T m = T i   T a G ,
Starting from T i =   T a , as the inlet temperature to the collector increases, greater are the heat losses with a consequent decrease in efficiency.

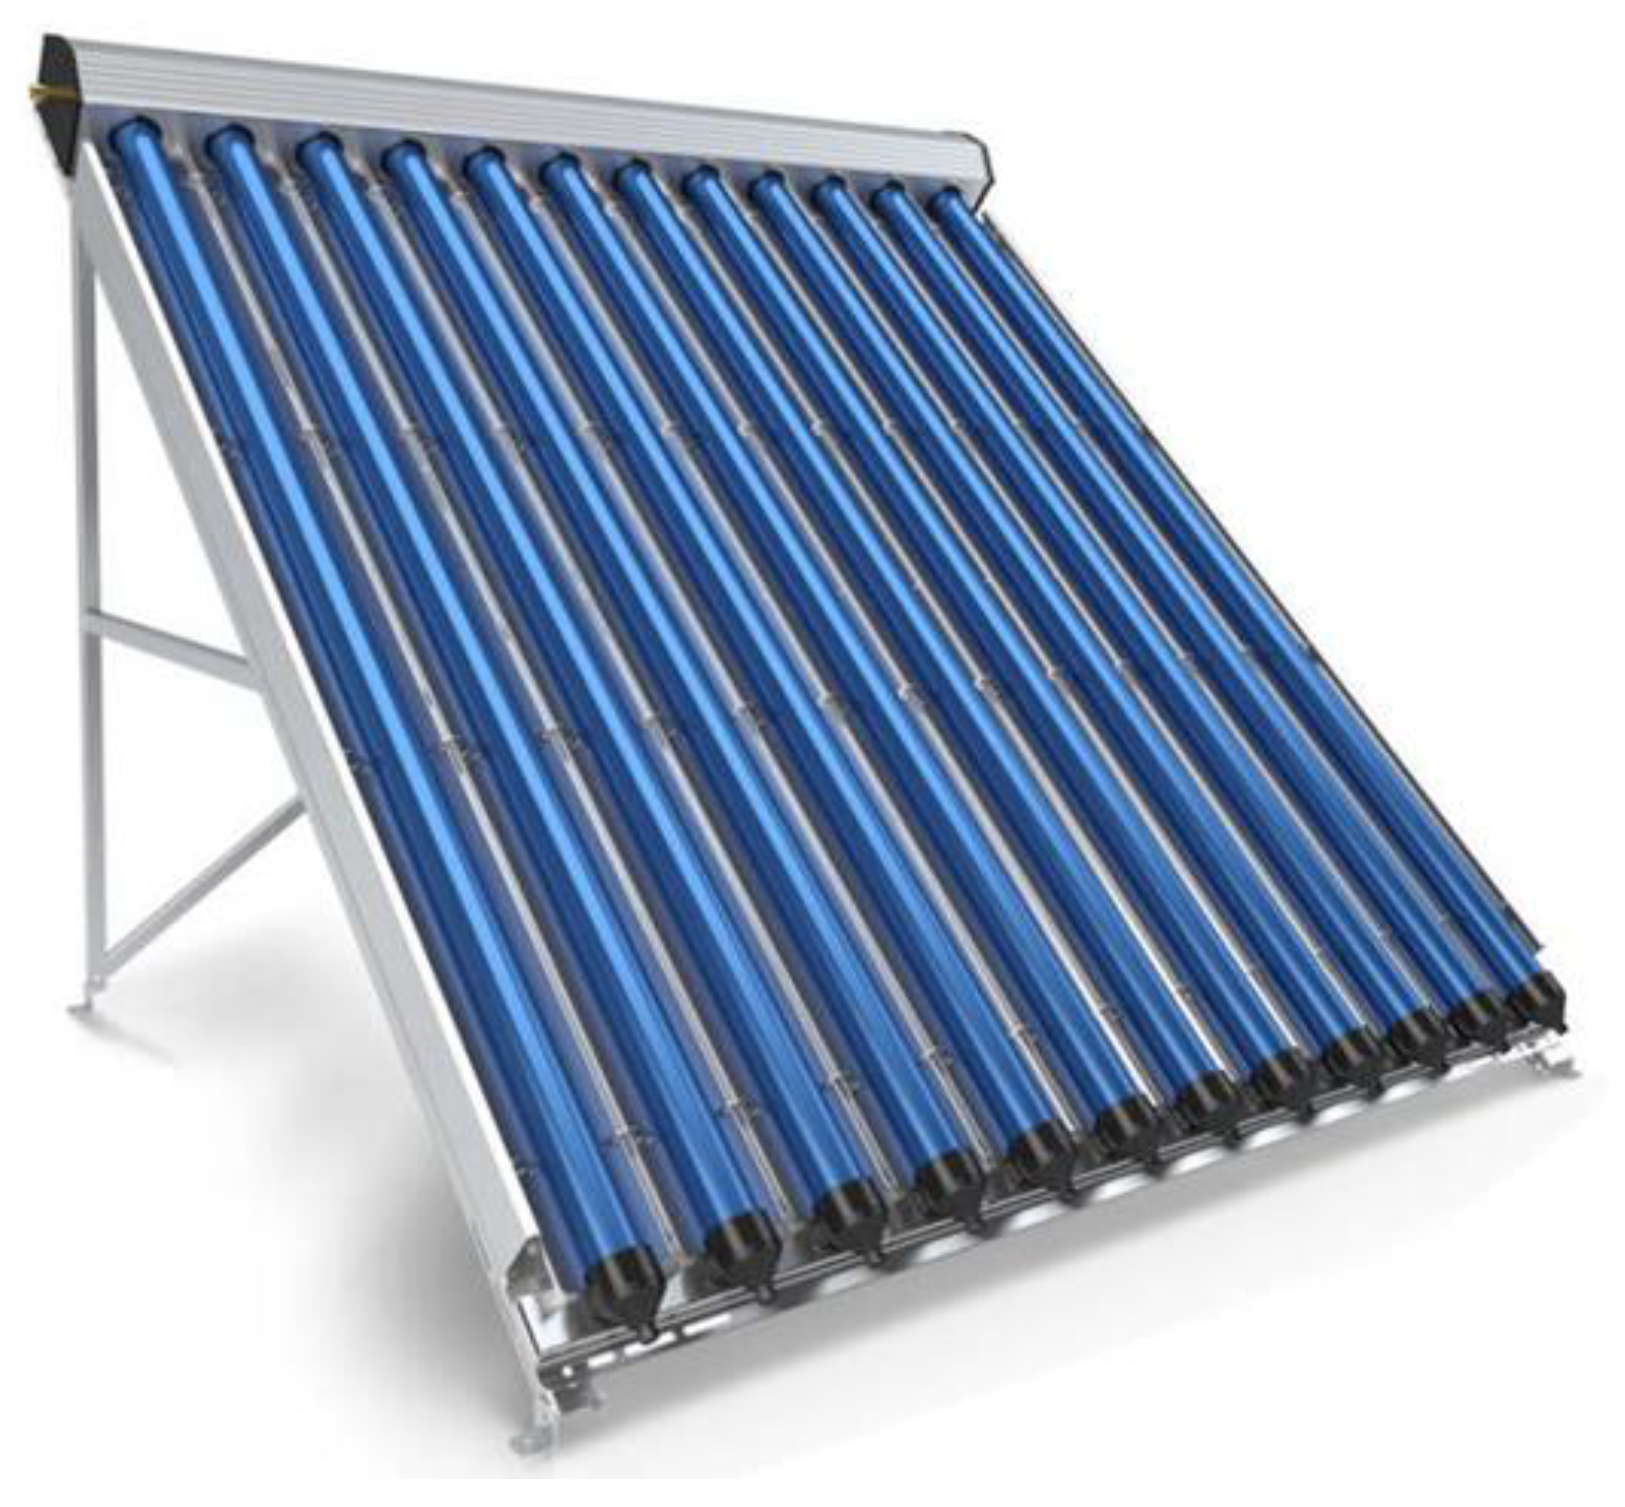
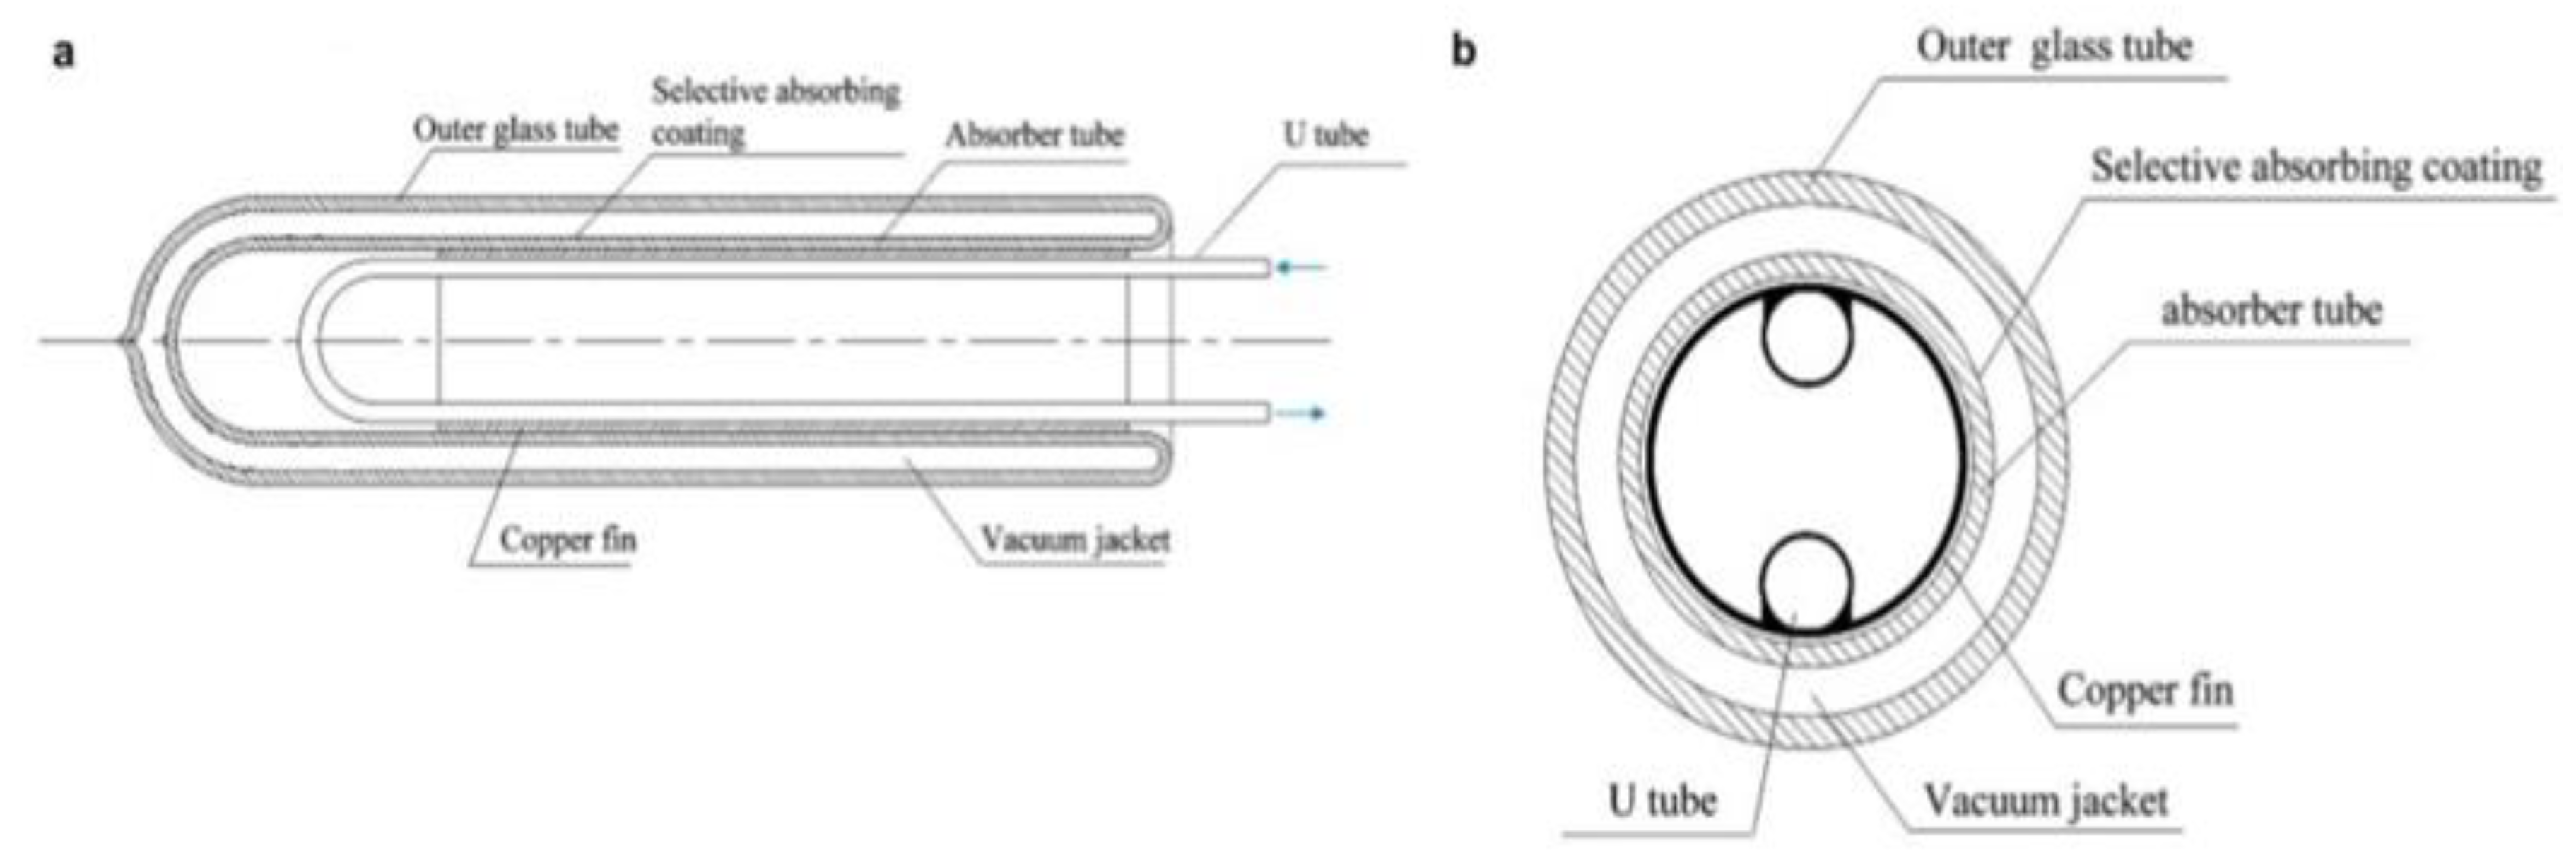
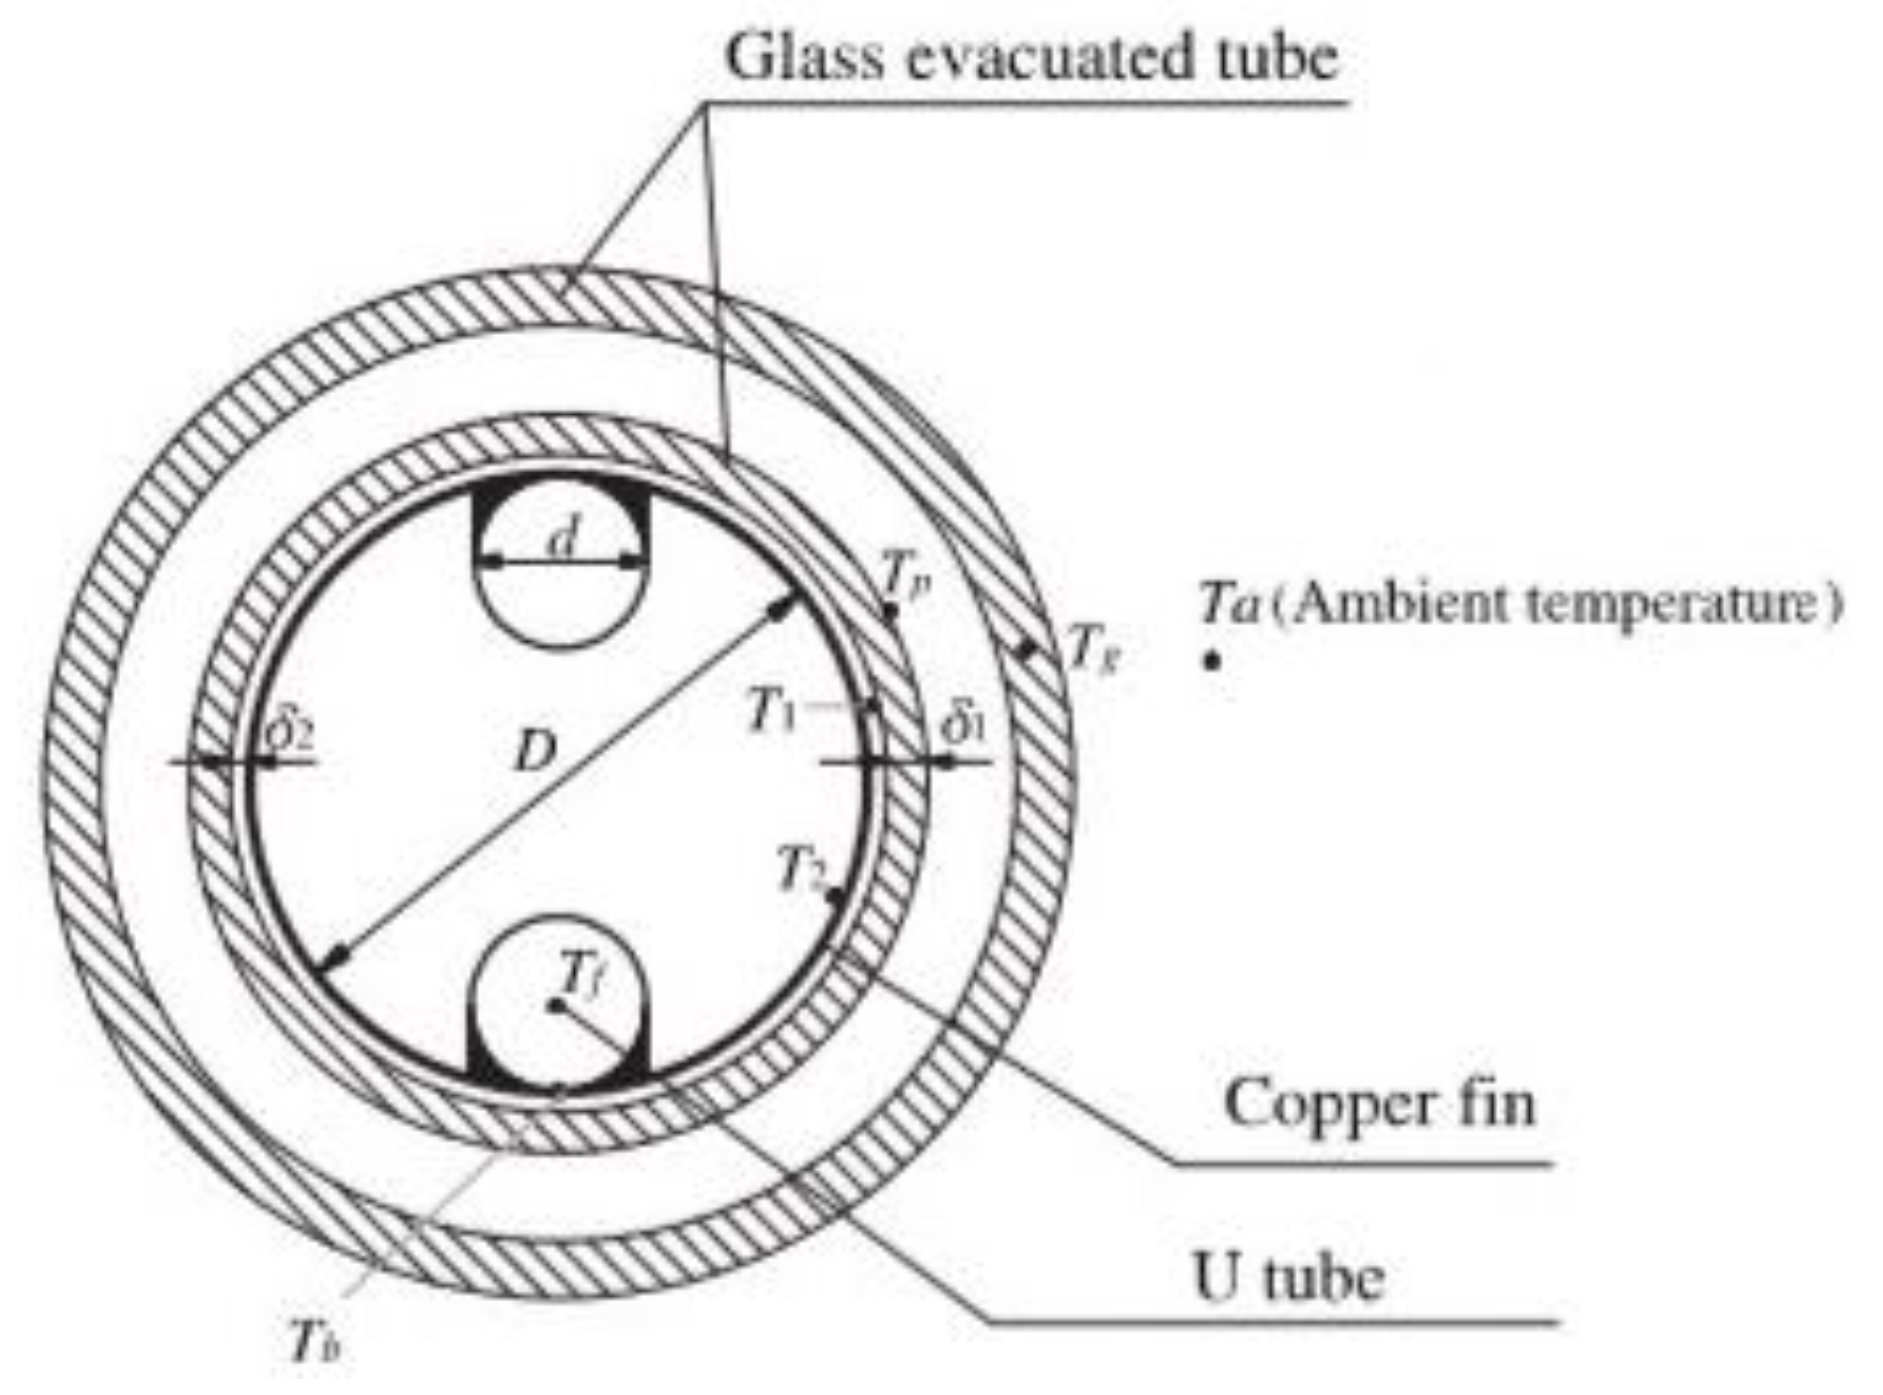
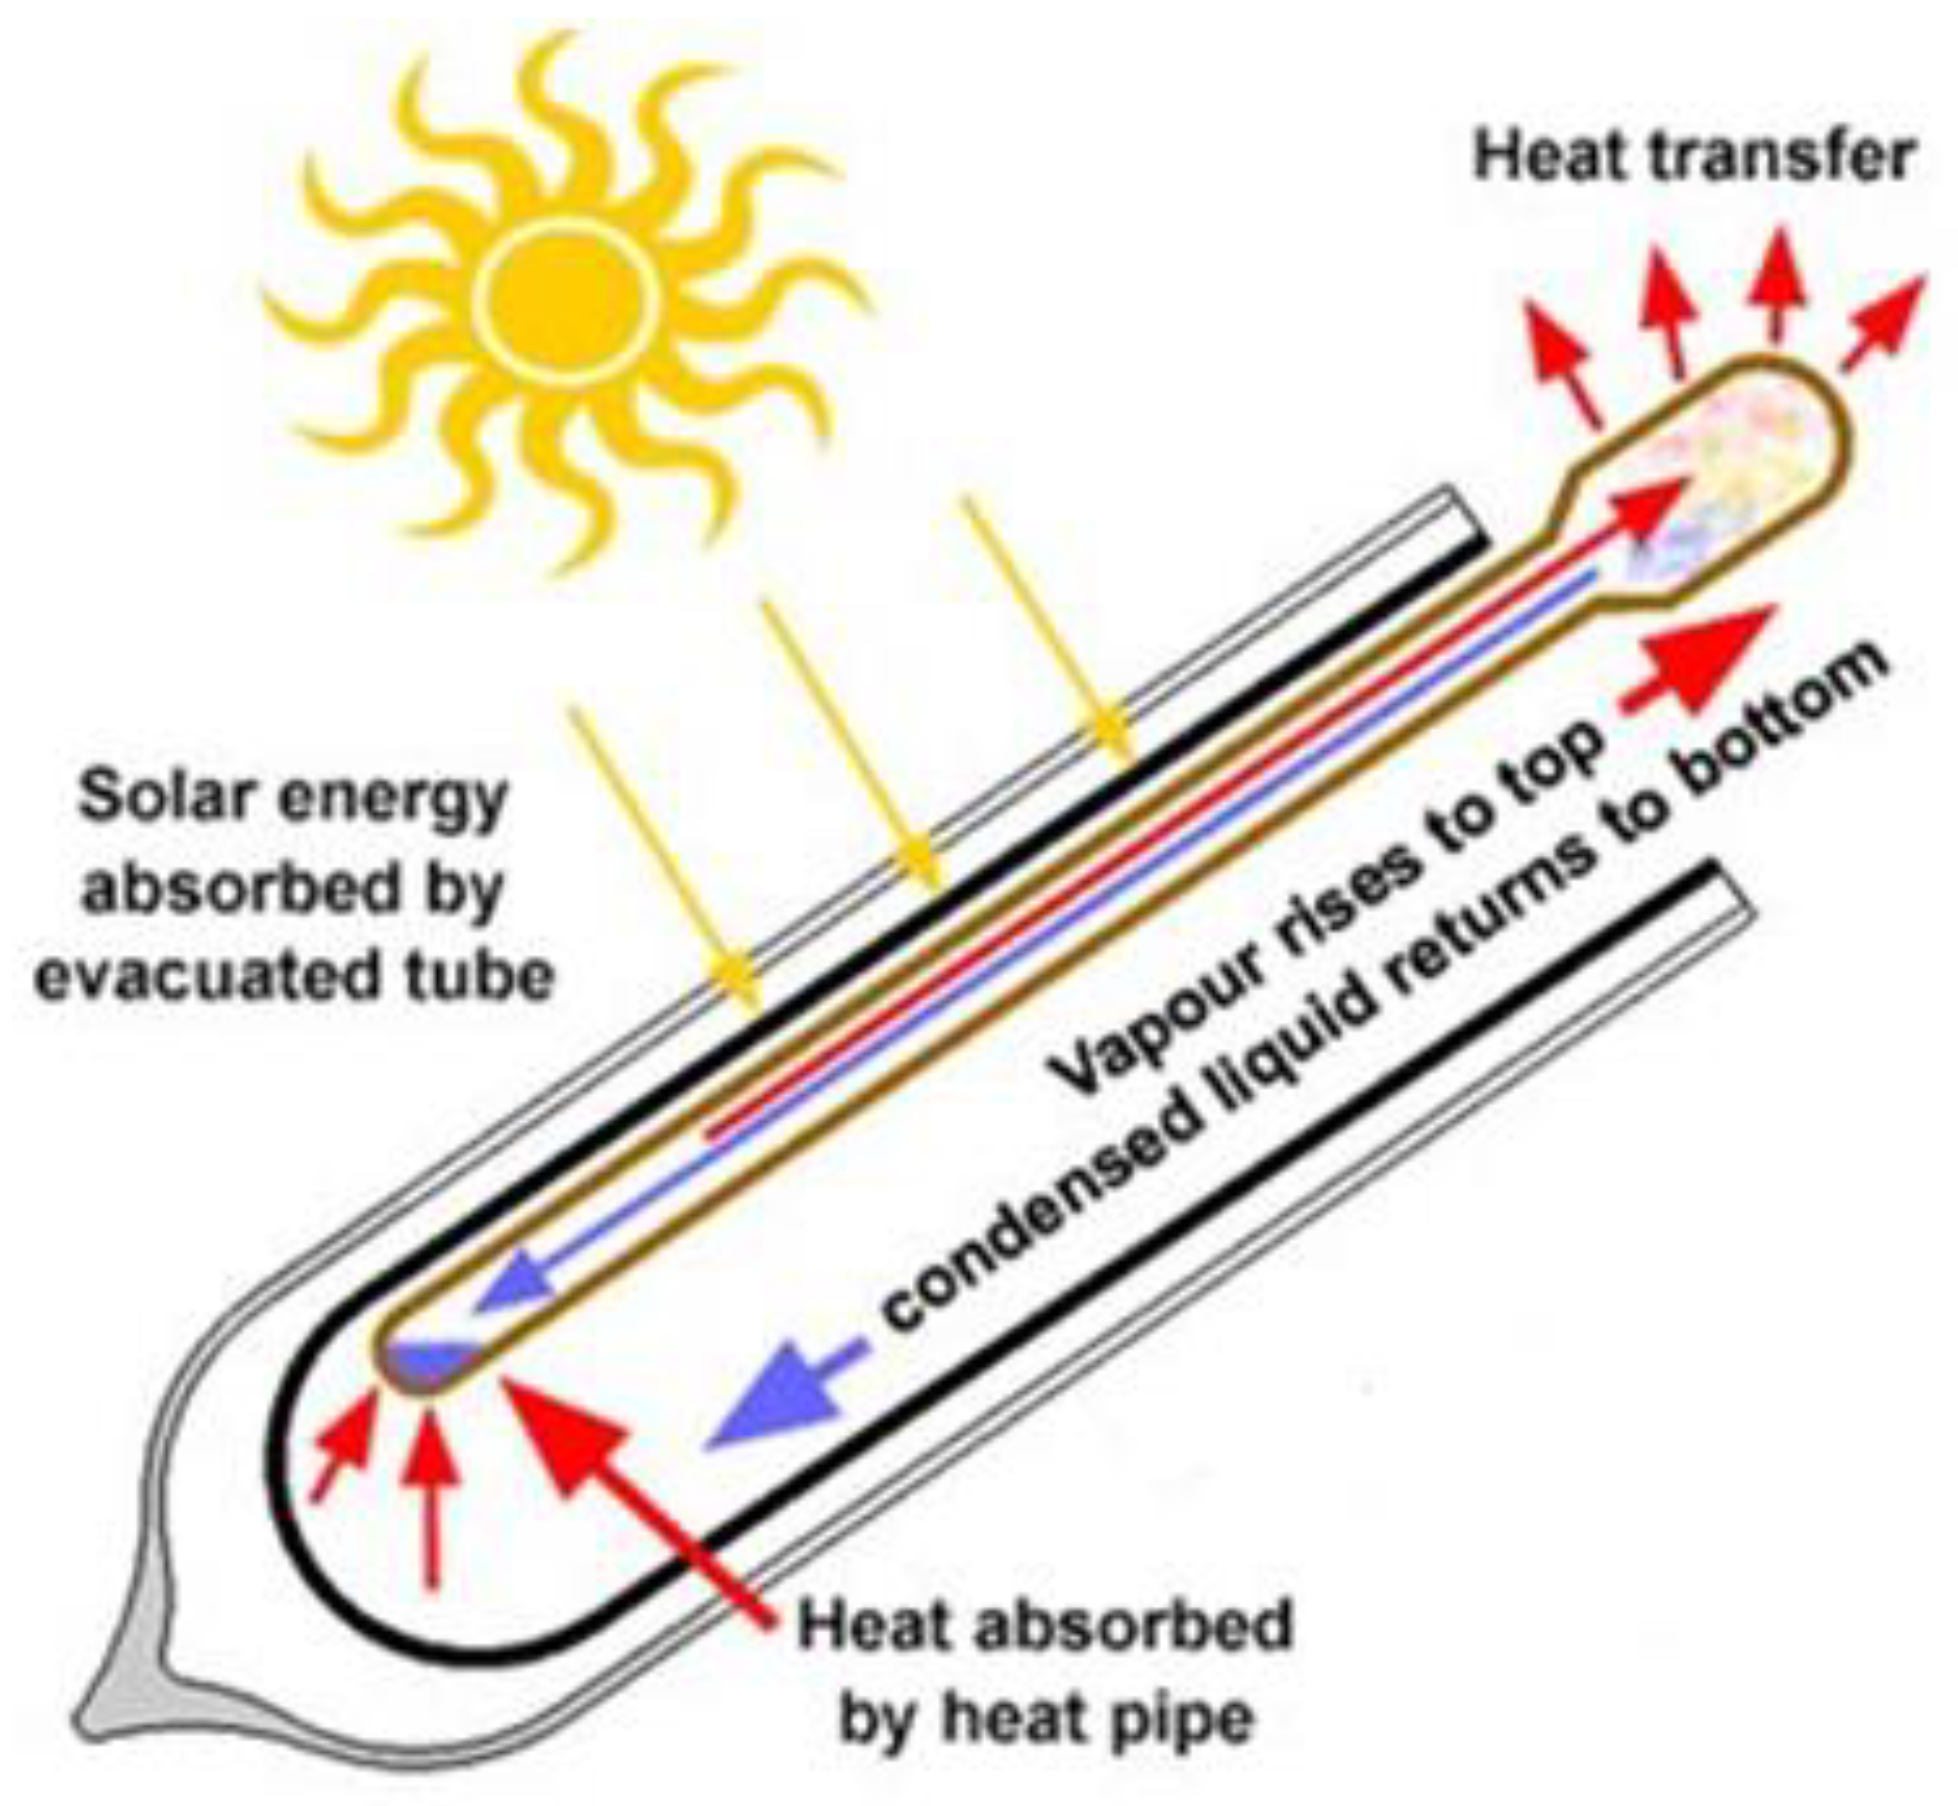
2.2. Evacauted-Tube Collectors

The evacuated-tube collector is one that guarantees a high efficiency ratio while in the low intensity of solar radiation areas. Specifically, its main feature is the absence of an air gap between the glass surface and the capturing surface, which significantly reduces the amount of heat dispersed by convection and ensures a more stable efficiency curve. However, these types of collectors are more complex. As seen in Figure 2, the vacuum collectors are composed of a series of glass tubes arranged parallel to each other.
Each glass tube contains another concentric glass tube and between the two tubes there is a vacuum to act as a thermal insulator and to limit the dispersion of the heat. The most common types of evacuated-tube collectors are U-tube and heat pipe collectors.
The evacuated U-tube solar collectors are composed of two-layered glass evacuated-tubes that are merged together at one side and by an absorbing outside layer deposited on the outer tube. The two-layered tubes are separated by a vacuum to allow the absorbing of solar energy and to reduce the thermal losses, since there is no conductive and convective heat leakage because of the vacuum.
Figure 3 shows the longitudinal and transversal profile of such a configuration.
The outer glass tube has a transmission coefficient of around 0.91; indeed, only 91.0% of solar radiation reaches the selective absorbing coating.
The useful energy transferred to the fluid is the difference between the solar energy absorbed by the selective absorbing coating and the thermal losses due to conduction, convection, and irradiation:
Q u = α G Q L ,
Therefore, UL can be written as follows:
U L = 1 1 h g a + 1 h p g , r   +   h p g , c ,
With reference to Figure 4, UL can be evaluated as follows:
U L ( T p T a ) = h p g , r   ( T p T g ) + h p g , c   ( T p T g ) ,
The heat pipe evacuated solar collector, as shown in Figure 5, operates with a phase-changing heat transfer fluid that evaporates when it is heated by radiation, and then condenses inside the condenser in which it transfers the previously absorbed thermal power to the sanitary water.
The evacuated-tube therefore has, internally, an absorbent surface made by a selectively treated metal slice in which a second evacuated-tube, called the heat pipe, is inserted. The heat pipe receives heat from the capturing plate by conduction. The heat transfer fluid flows inside the heat pipe and evaporates at 25 °C at low pressures; it rises to the head of the collector, where it condenses, and transfers heat to the primary fluid which is heated (sanitary water). Once condensed, the heat transfer fluid flows by gravity returns to the evaporation area.
Heat pipe collectors are proven as efficient collectors; however, the optical efficiency of such collectors is 16% lower than that of flat-plate ones, and 13% lower than that of U-shaped pipe evacuated ones as per the analysis for normal solar radiation incidence. The efficiency of heat pipe collectors is higher than that of flat-plate collectors above the ambient air temperature of 40–55 °C. The efficiency of heat pipe collectors does not go beyond the efficiency of U-tube collectors (in any case, up to temperatures of 80–100 °C higher than the ambient temperature). For a hot water temperature of 40–60 °C, U-tube single-wall solar collectors are more efficient. U-tube solar collectors are more efficient than flat-plate collectors and all types of solar collectors at any temperature. U-tube collectors are more efficient than heat pipe collectors as both of them use identical double-wall glazed tubes [42].

3. Methodology and Operational Conditions of the Investigation

A transient numerical investigation, using TRNSYS 16 software (Thermal Energy System Specialists, Madison, WI 53703 USA), was carried out on the two types of solar collectors, namely the flat-plate collector and the evacuated-tube collector. The analysis was conducted with the following configurations:
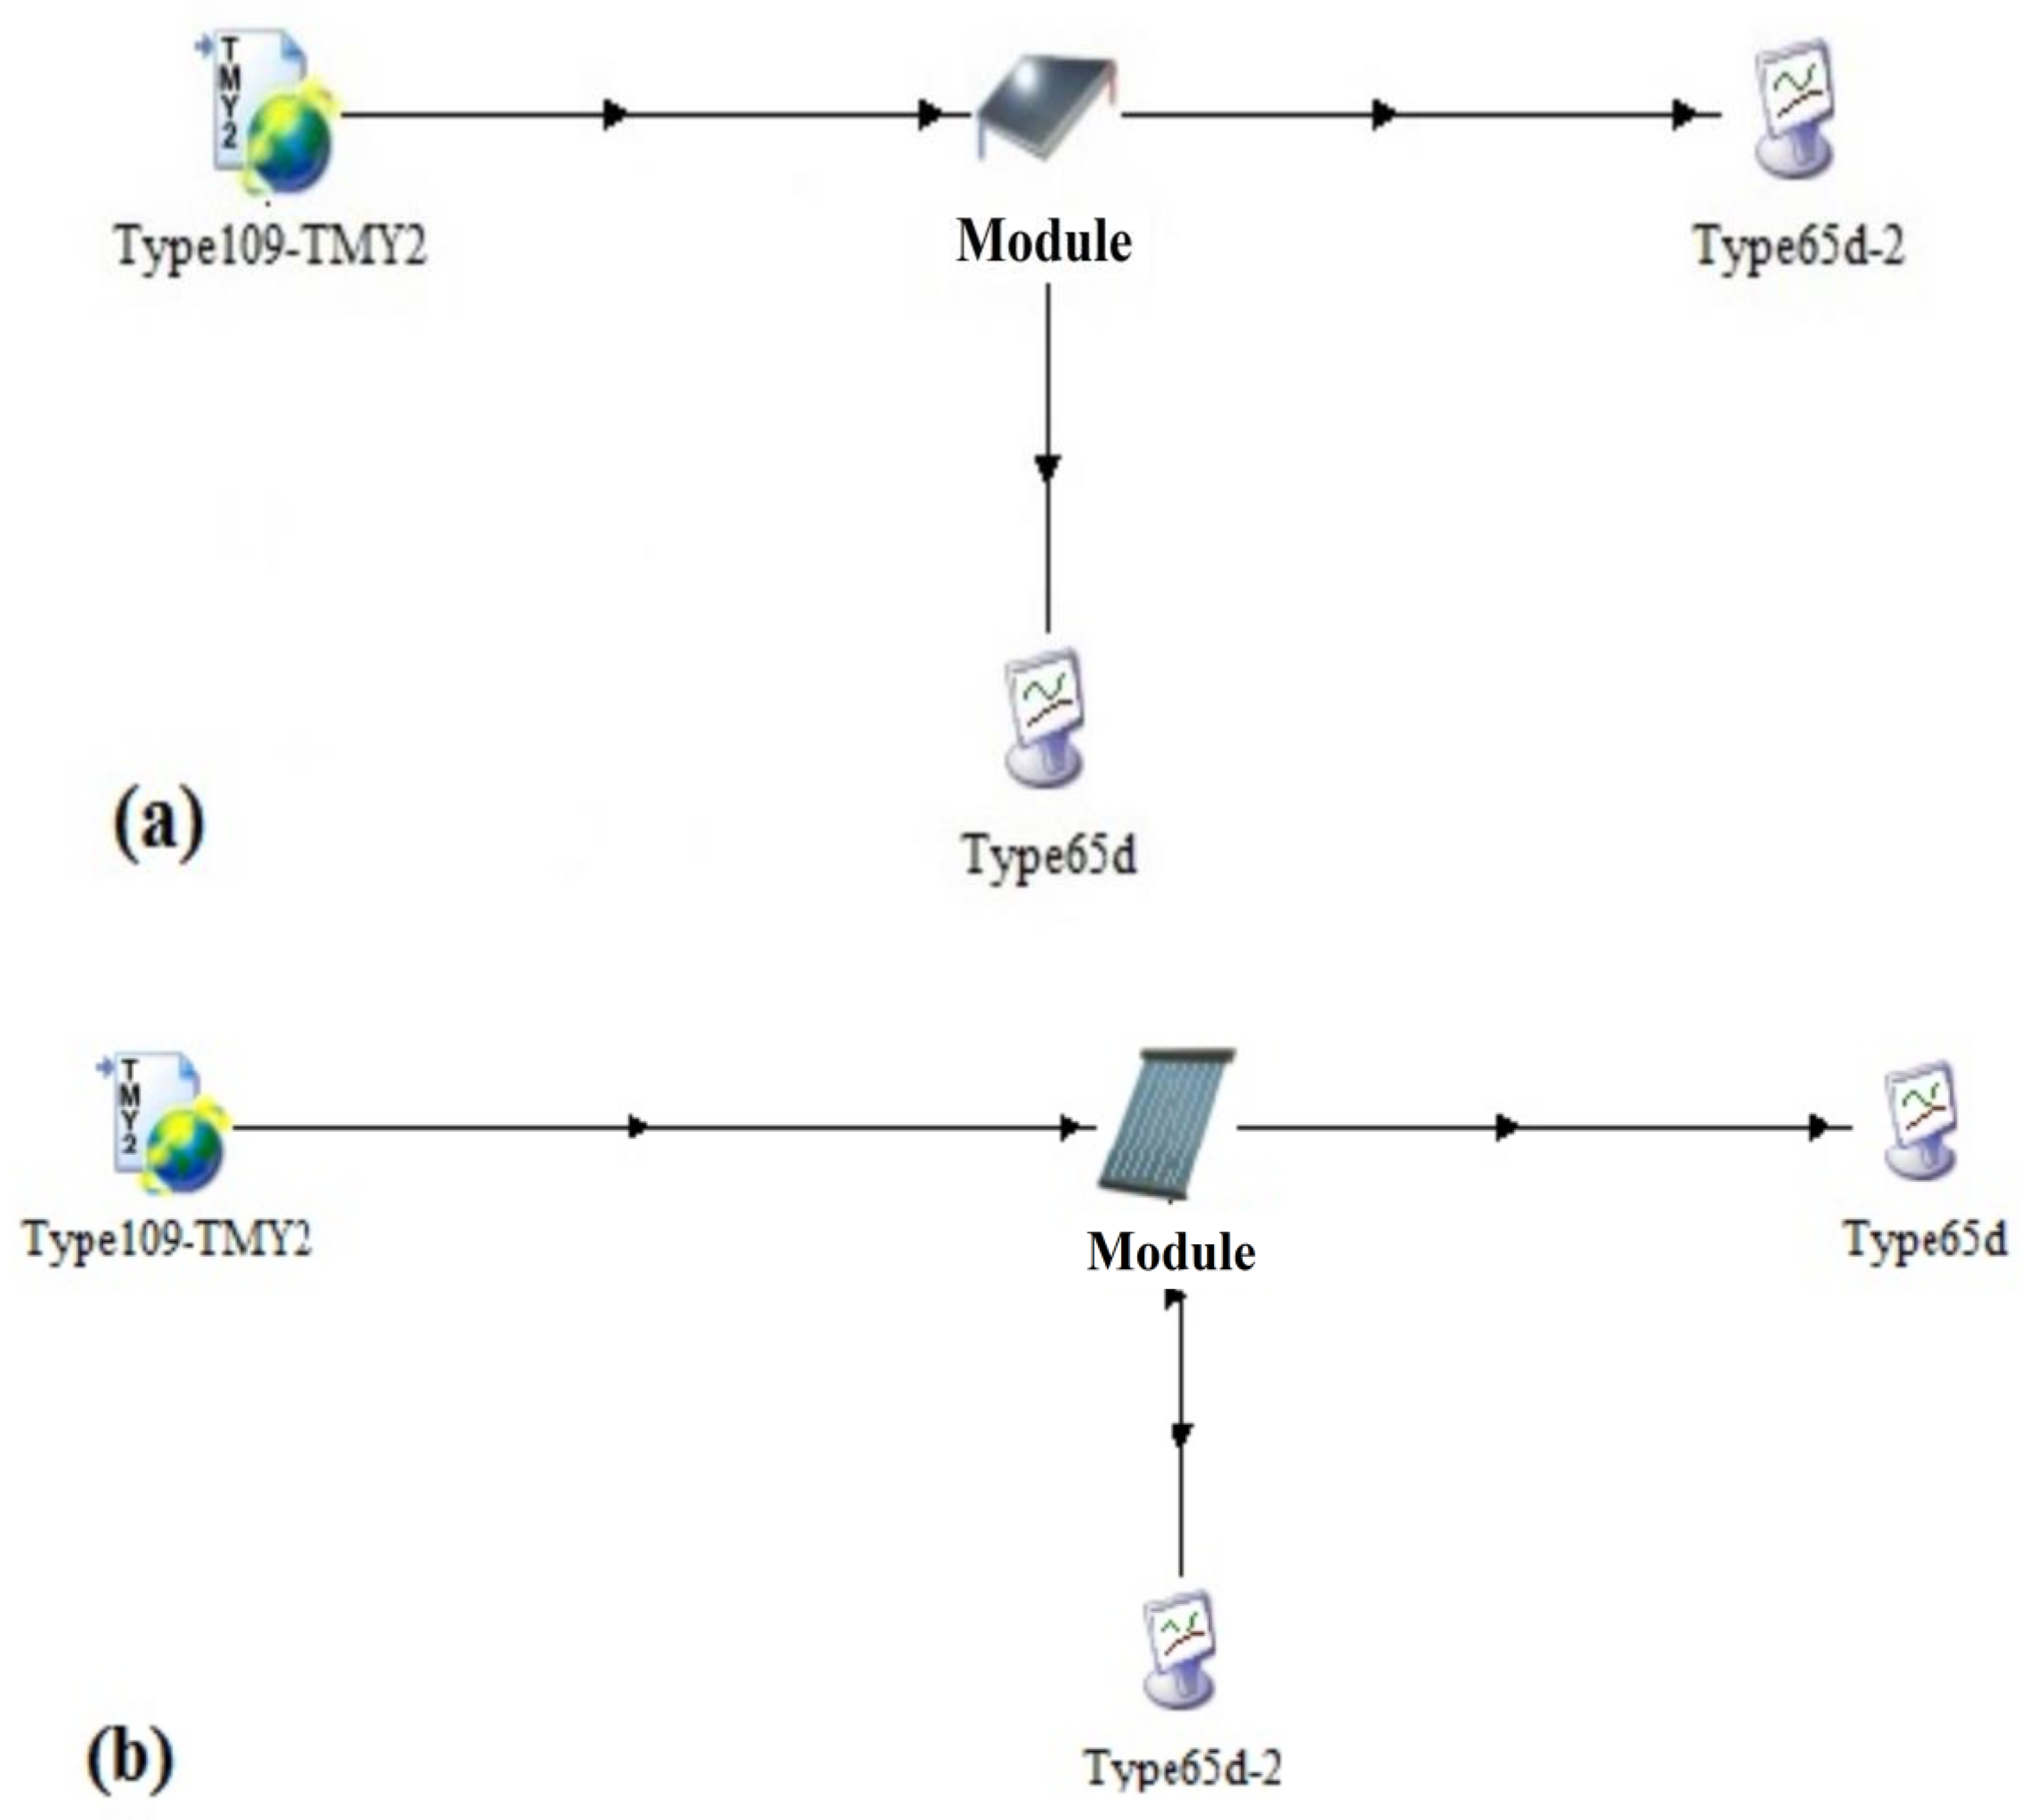
  • single flat-plate collector;
  • single evacuated-tube collector;
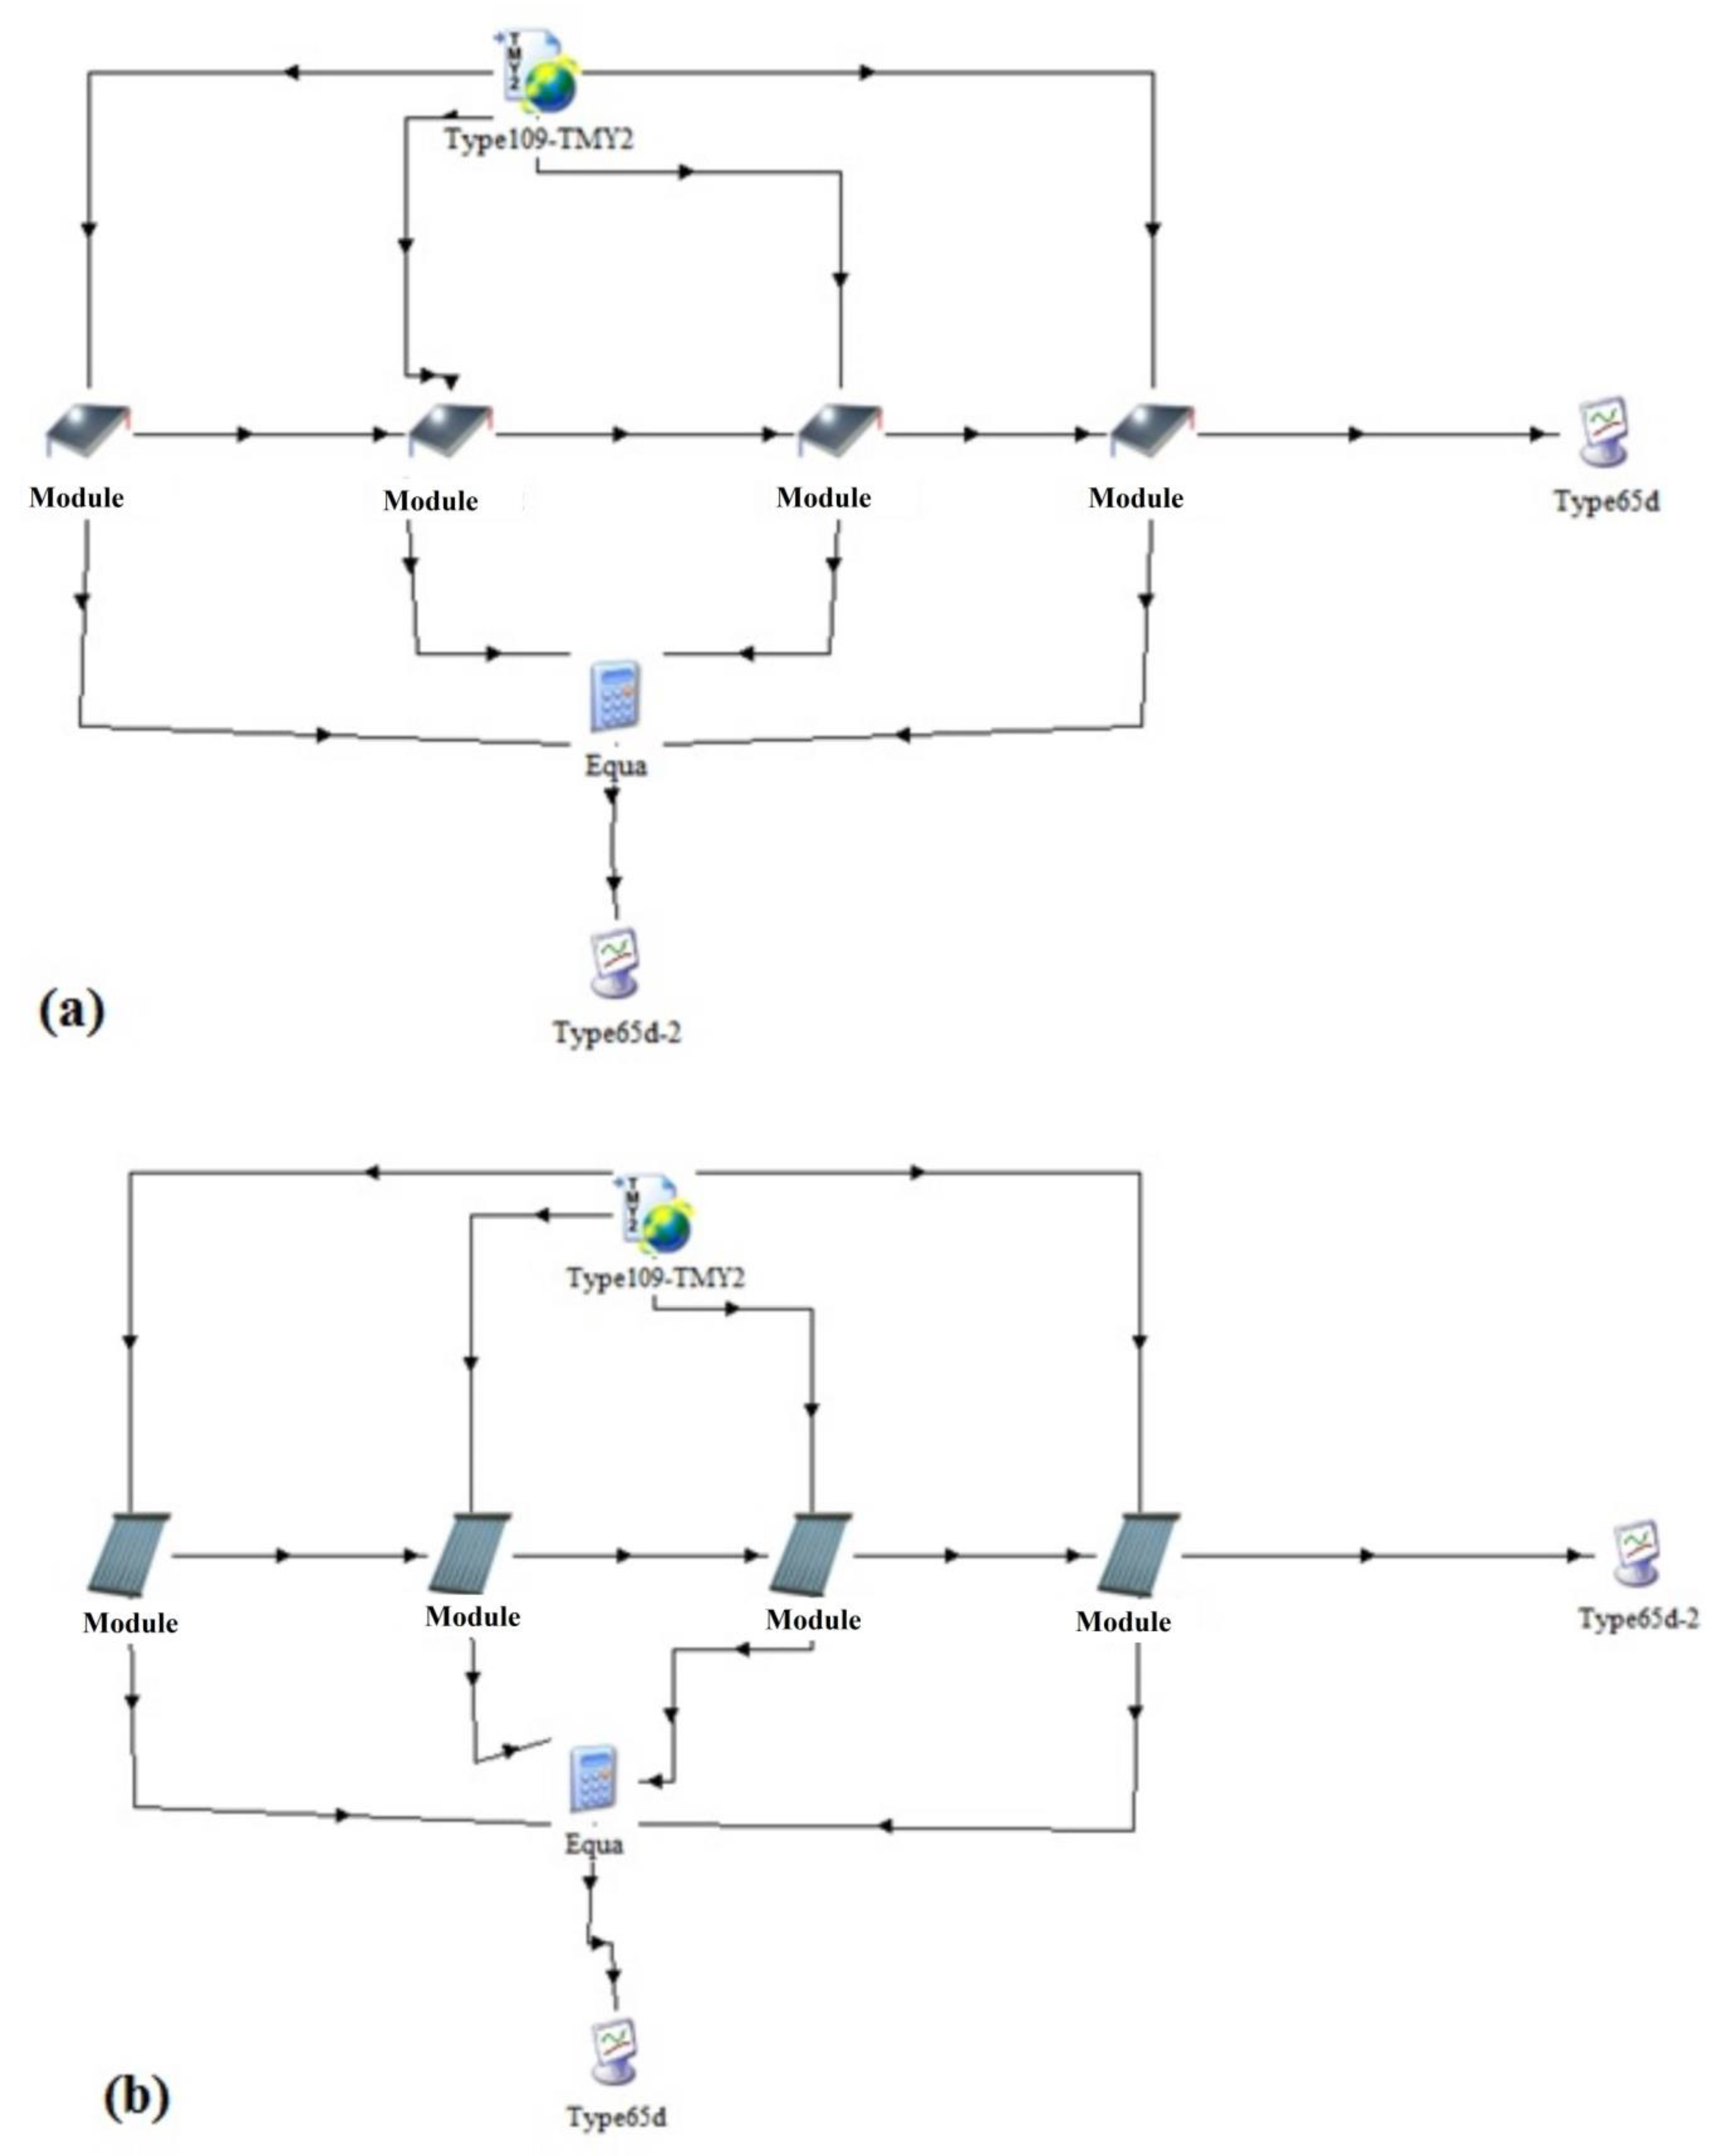
  • string of four flat-plate solar collectors connected in series;
  • string of four evacuated-tube solar collectors connected in series.
In Figure 6, the schematics of the components used in the investigations on single collectors for the flat-plate (Figure 6a) and the evacuated-tube (Figure 6b) collectors are represented. In Figure 7, the schematics of the strings of the series of four flat-plate (Figure 7a) and evacuated-tube (Figure 7b) collectors are shown.
In addition to the collectors, the other components are as follows:
  • Type 109-TMY2, that has the main purpose of reading the meteorological data at regular time intervals from a data file and processing the solar radiation data to obtain the surface radiation on inclined surfaces. The type-109 reads a meteorological data file in the standard TMY2 format. The TMY2 format is used by the National Solar Radiation Database (USA);
  • Type 65d, that is used to plot the quantities of interest in the desired time interval.
The flat-plate collector has total and net areas of 2.65 m2 and 2.36 m2, respectively. The efficiency curve η = η   ( T i T a ) G is derived in polynomial form as follows:
η = a 0 a 1 ( T i T a ) G a 2 ( T i T a ) 2 G ,
where, in the investigated flat-plate collector, the coefficient values are a0 = 0.808, a1 = 12.024 kJ/m2Khr, and a2 = 0.072 kJ/m2K2hr.
The evacuated-tube collector has total and net areas of 2.77 m2 and 2.40 m2, respectively. The efficiency curve η = η   ( T i T a ) G is still derived in polynomial form and the coefficient values are a0 = 0.778, a1 = 3.276 kJ/m2Khr, and a2 = 0 kJ/m2K2hr.
Both the collectors were tested under the following working conditions:
  • water as heat transfer fluid ( c p   = 4.190 kJ/kg K);
  • fluid flow rate m ˙ = 72 kg/hr;
  • fluid return temperature of the collector = [10; 15; 20; 25] °C
  • collector slope (the angle formed by the panel and the horizontal) = 20°;
  • angle of incidence: 1st order IAM factor = 0.05.
Type 109-TMY2 was used to read the meteorological data at regular time intervals from a data file, processing the solar radiation data to obtain the surface radiation on inclined surfaces and the angle of incidence at the following locations.
  • Naples (Italy);
  • Kabul (Afghanistan);
  • Stockholm (Sweden).

4. Results and Discussion

In the present paper, a comparison between flat-plate and evacuated-tube collectors used in solar thermal systems was made by carrying out a numerical investigation using TRNSYS software. For both types of collectors, the equations for calculating the useful thermal power and efficiency were presented. Each type of collector was tested in a single collector project and in a project containing a string composed of a series of four collectors. The simulations were conducted considering the time span of a year, with respect to three climatic areas. Simulations for Naples, Stockholm, and Kabul were performed using TRNSYS software. As an example, a quick comparison of the results between FPCs and ETCs for Naples is given in the following sections.

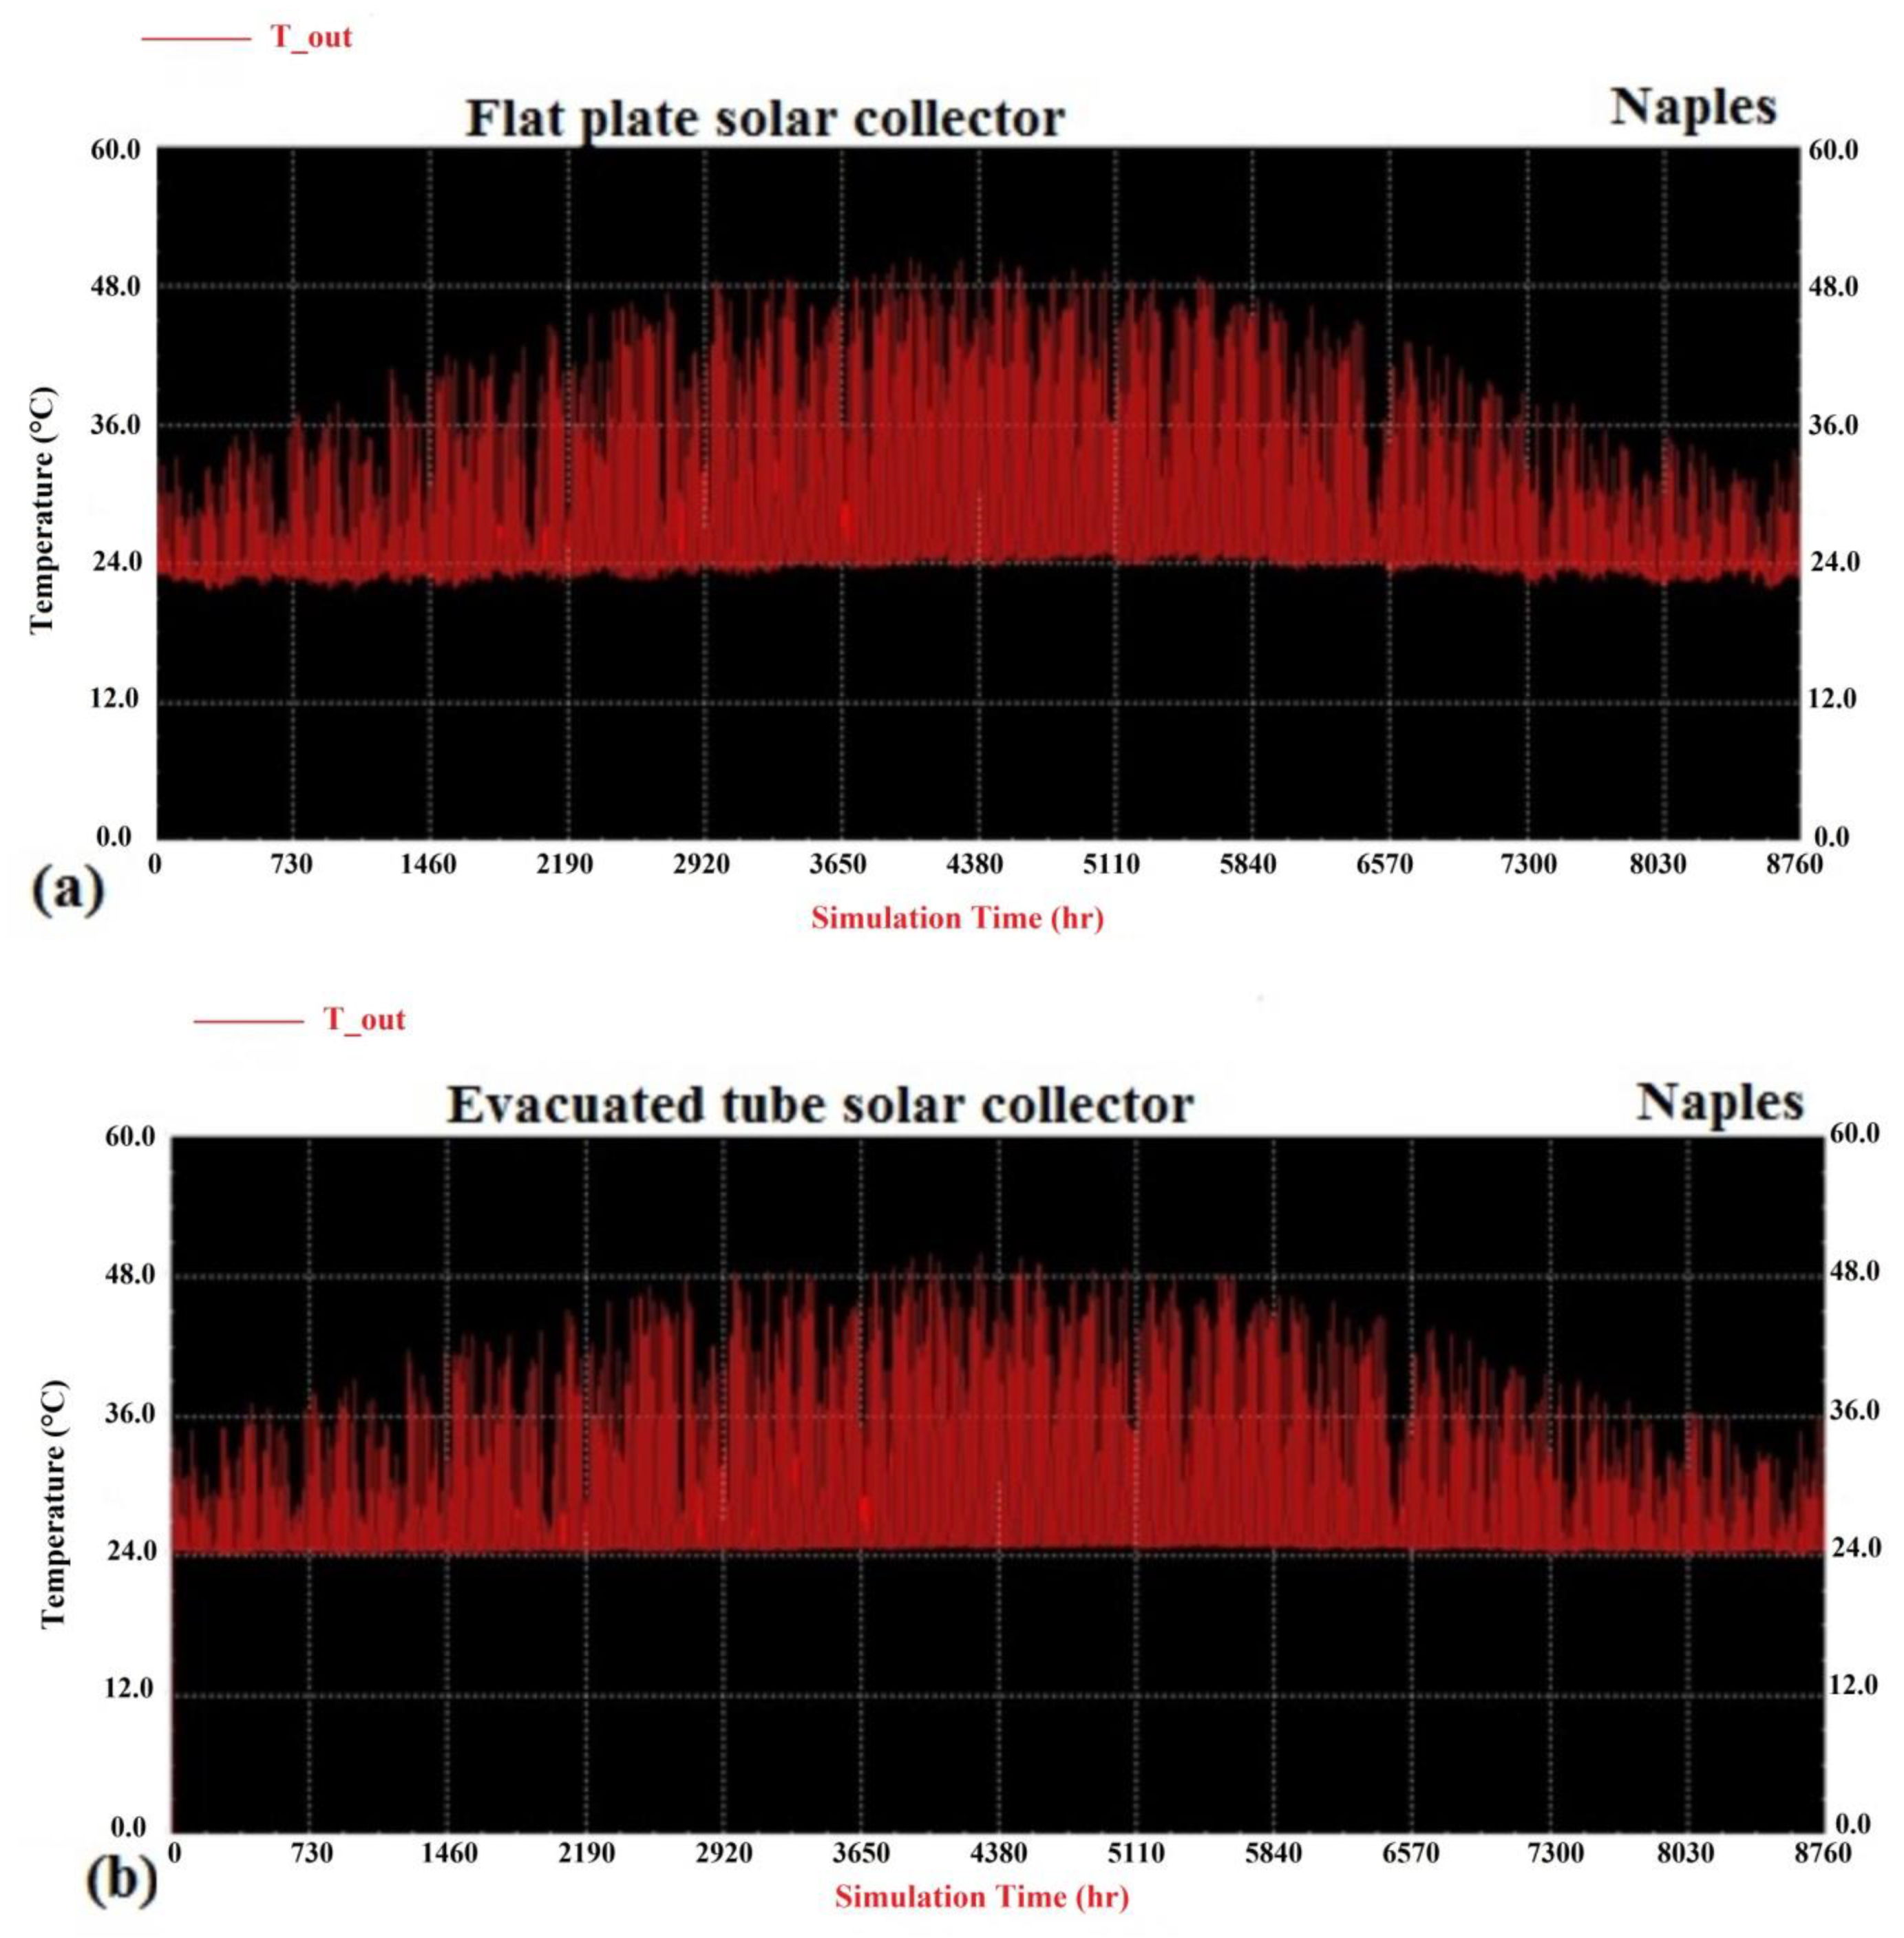
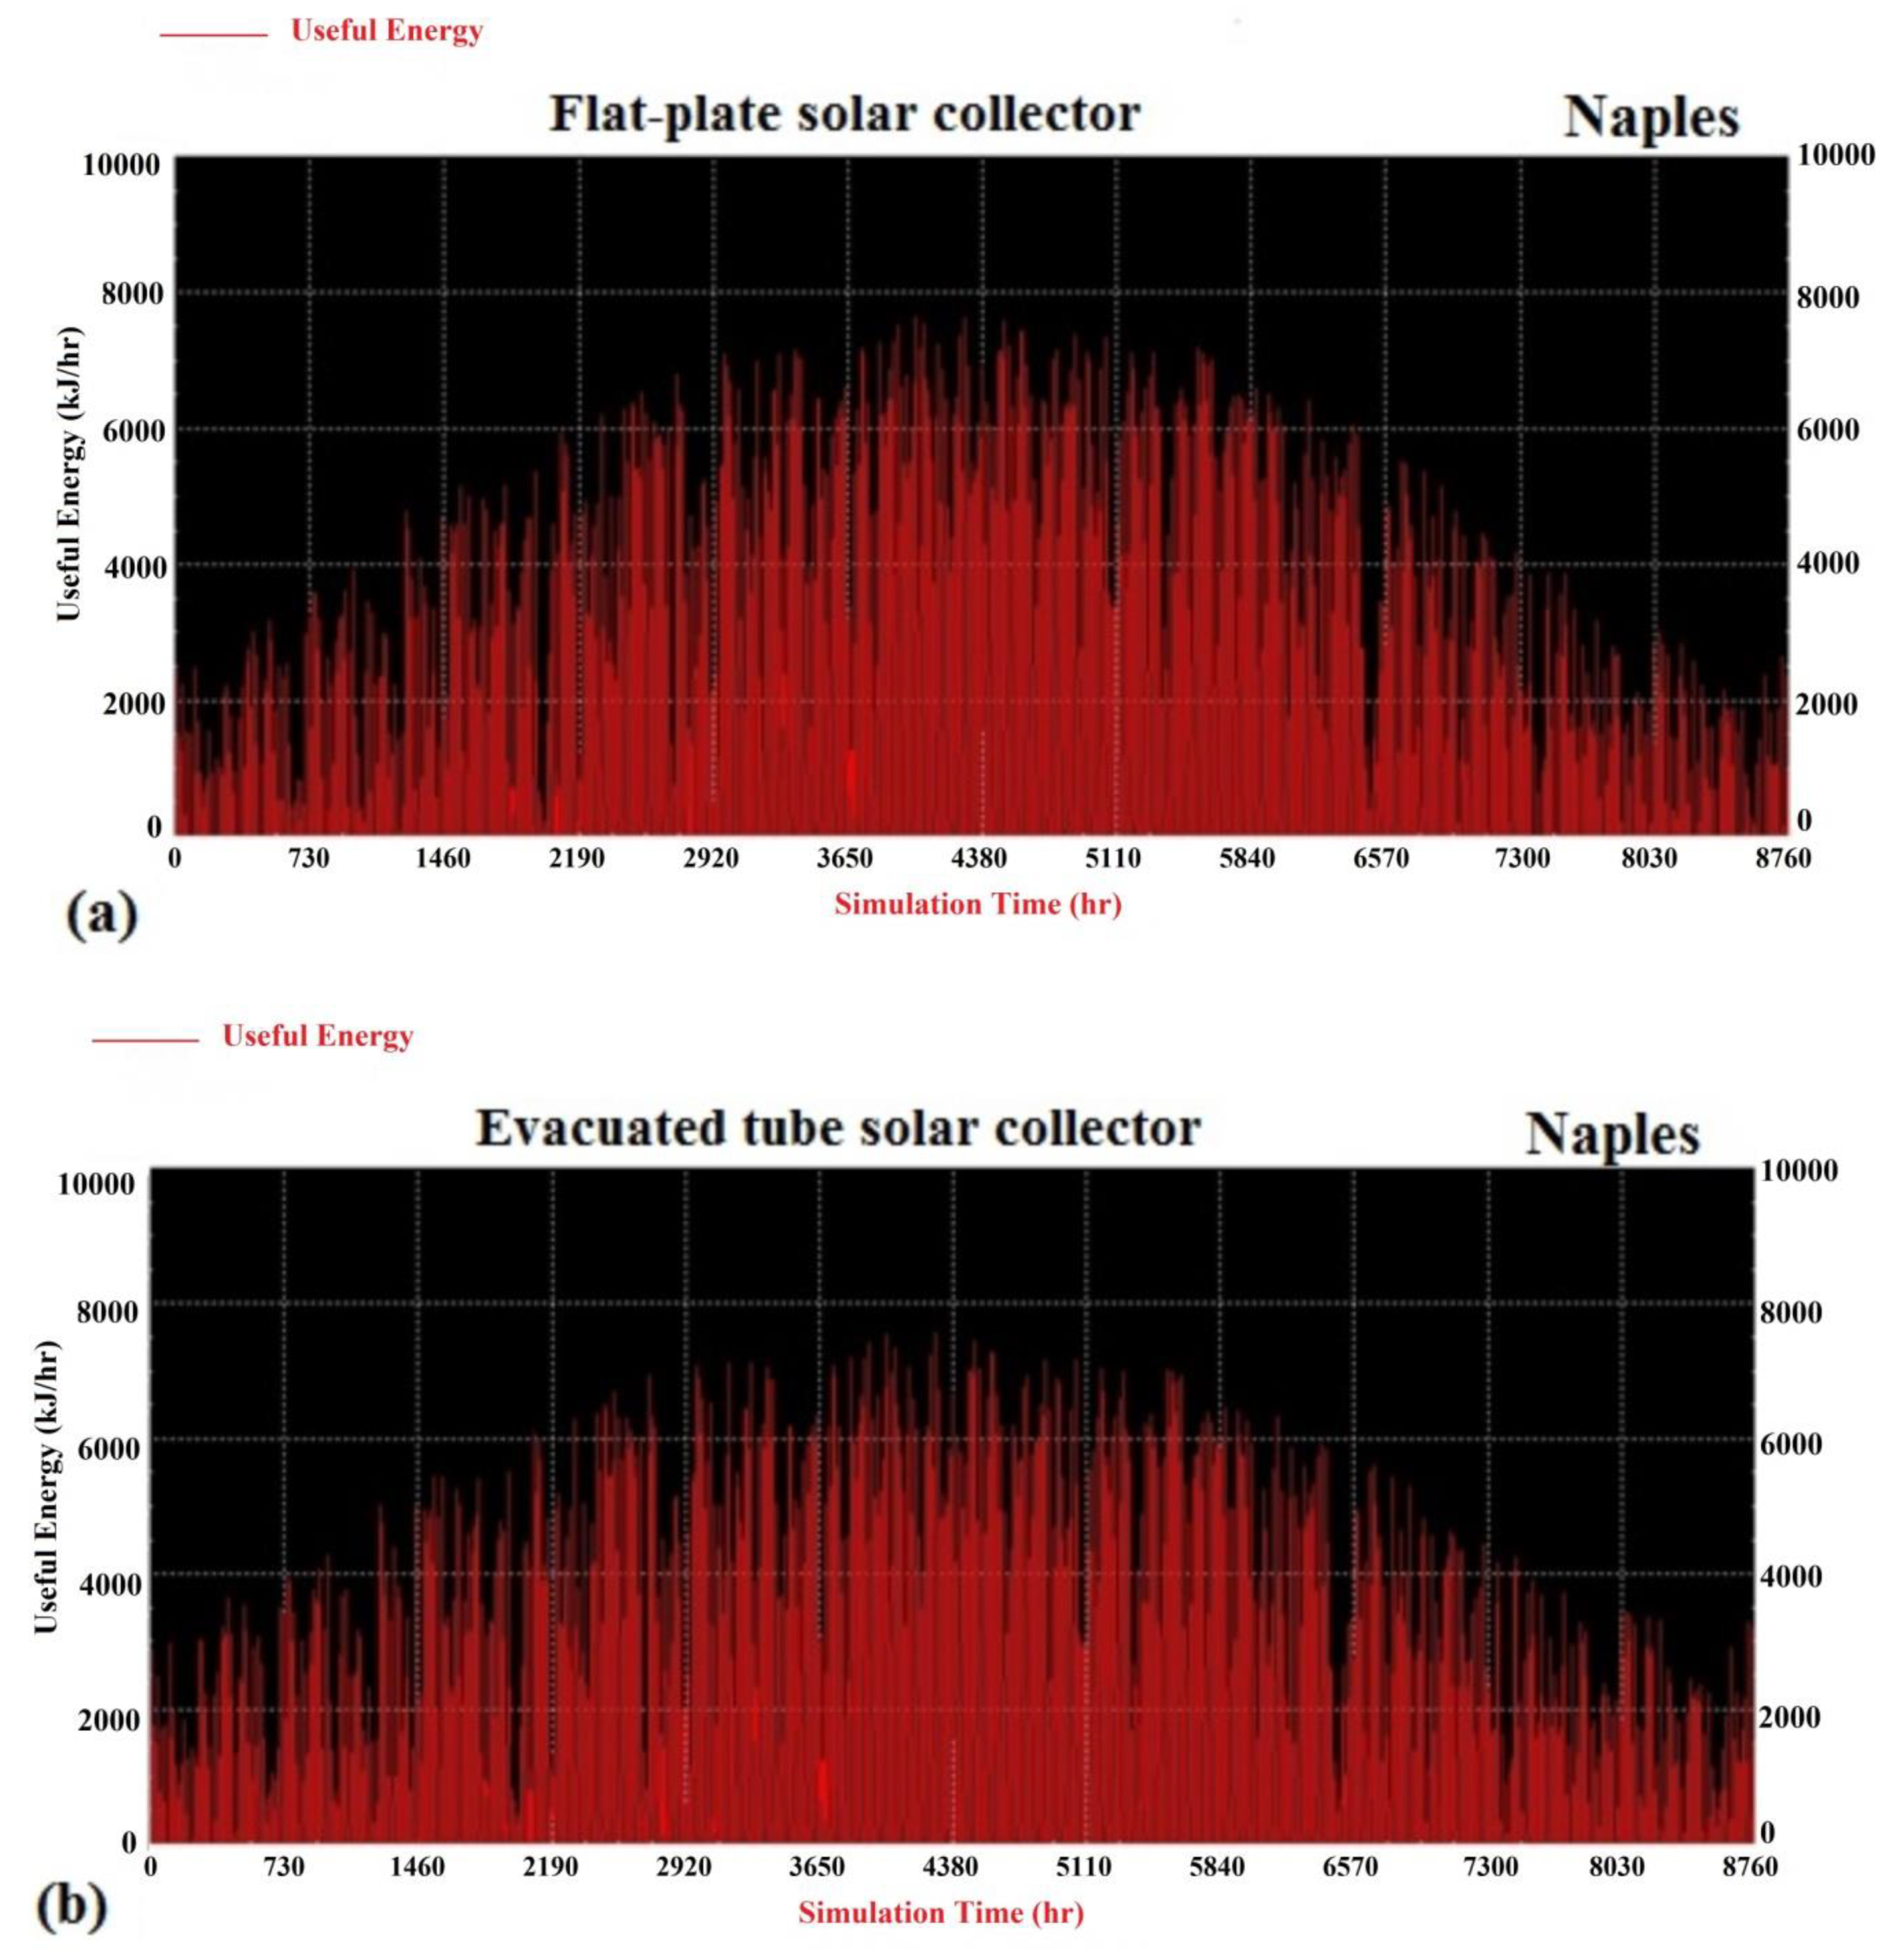
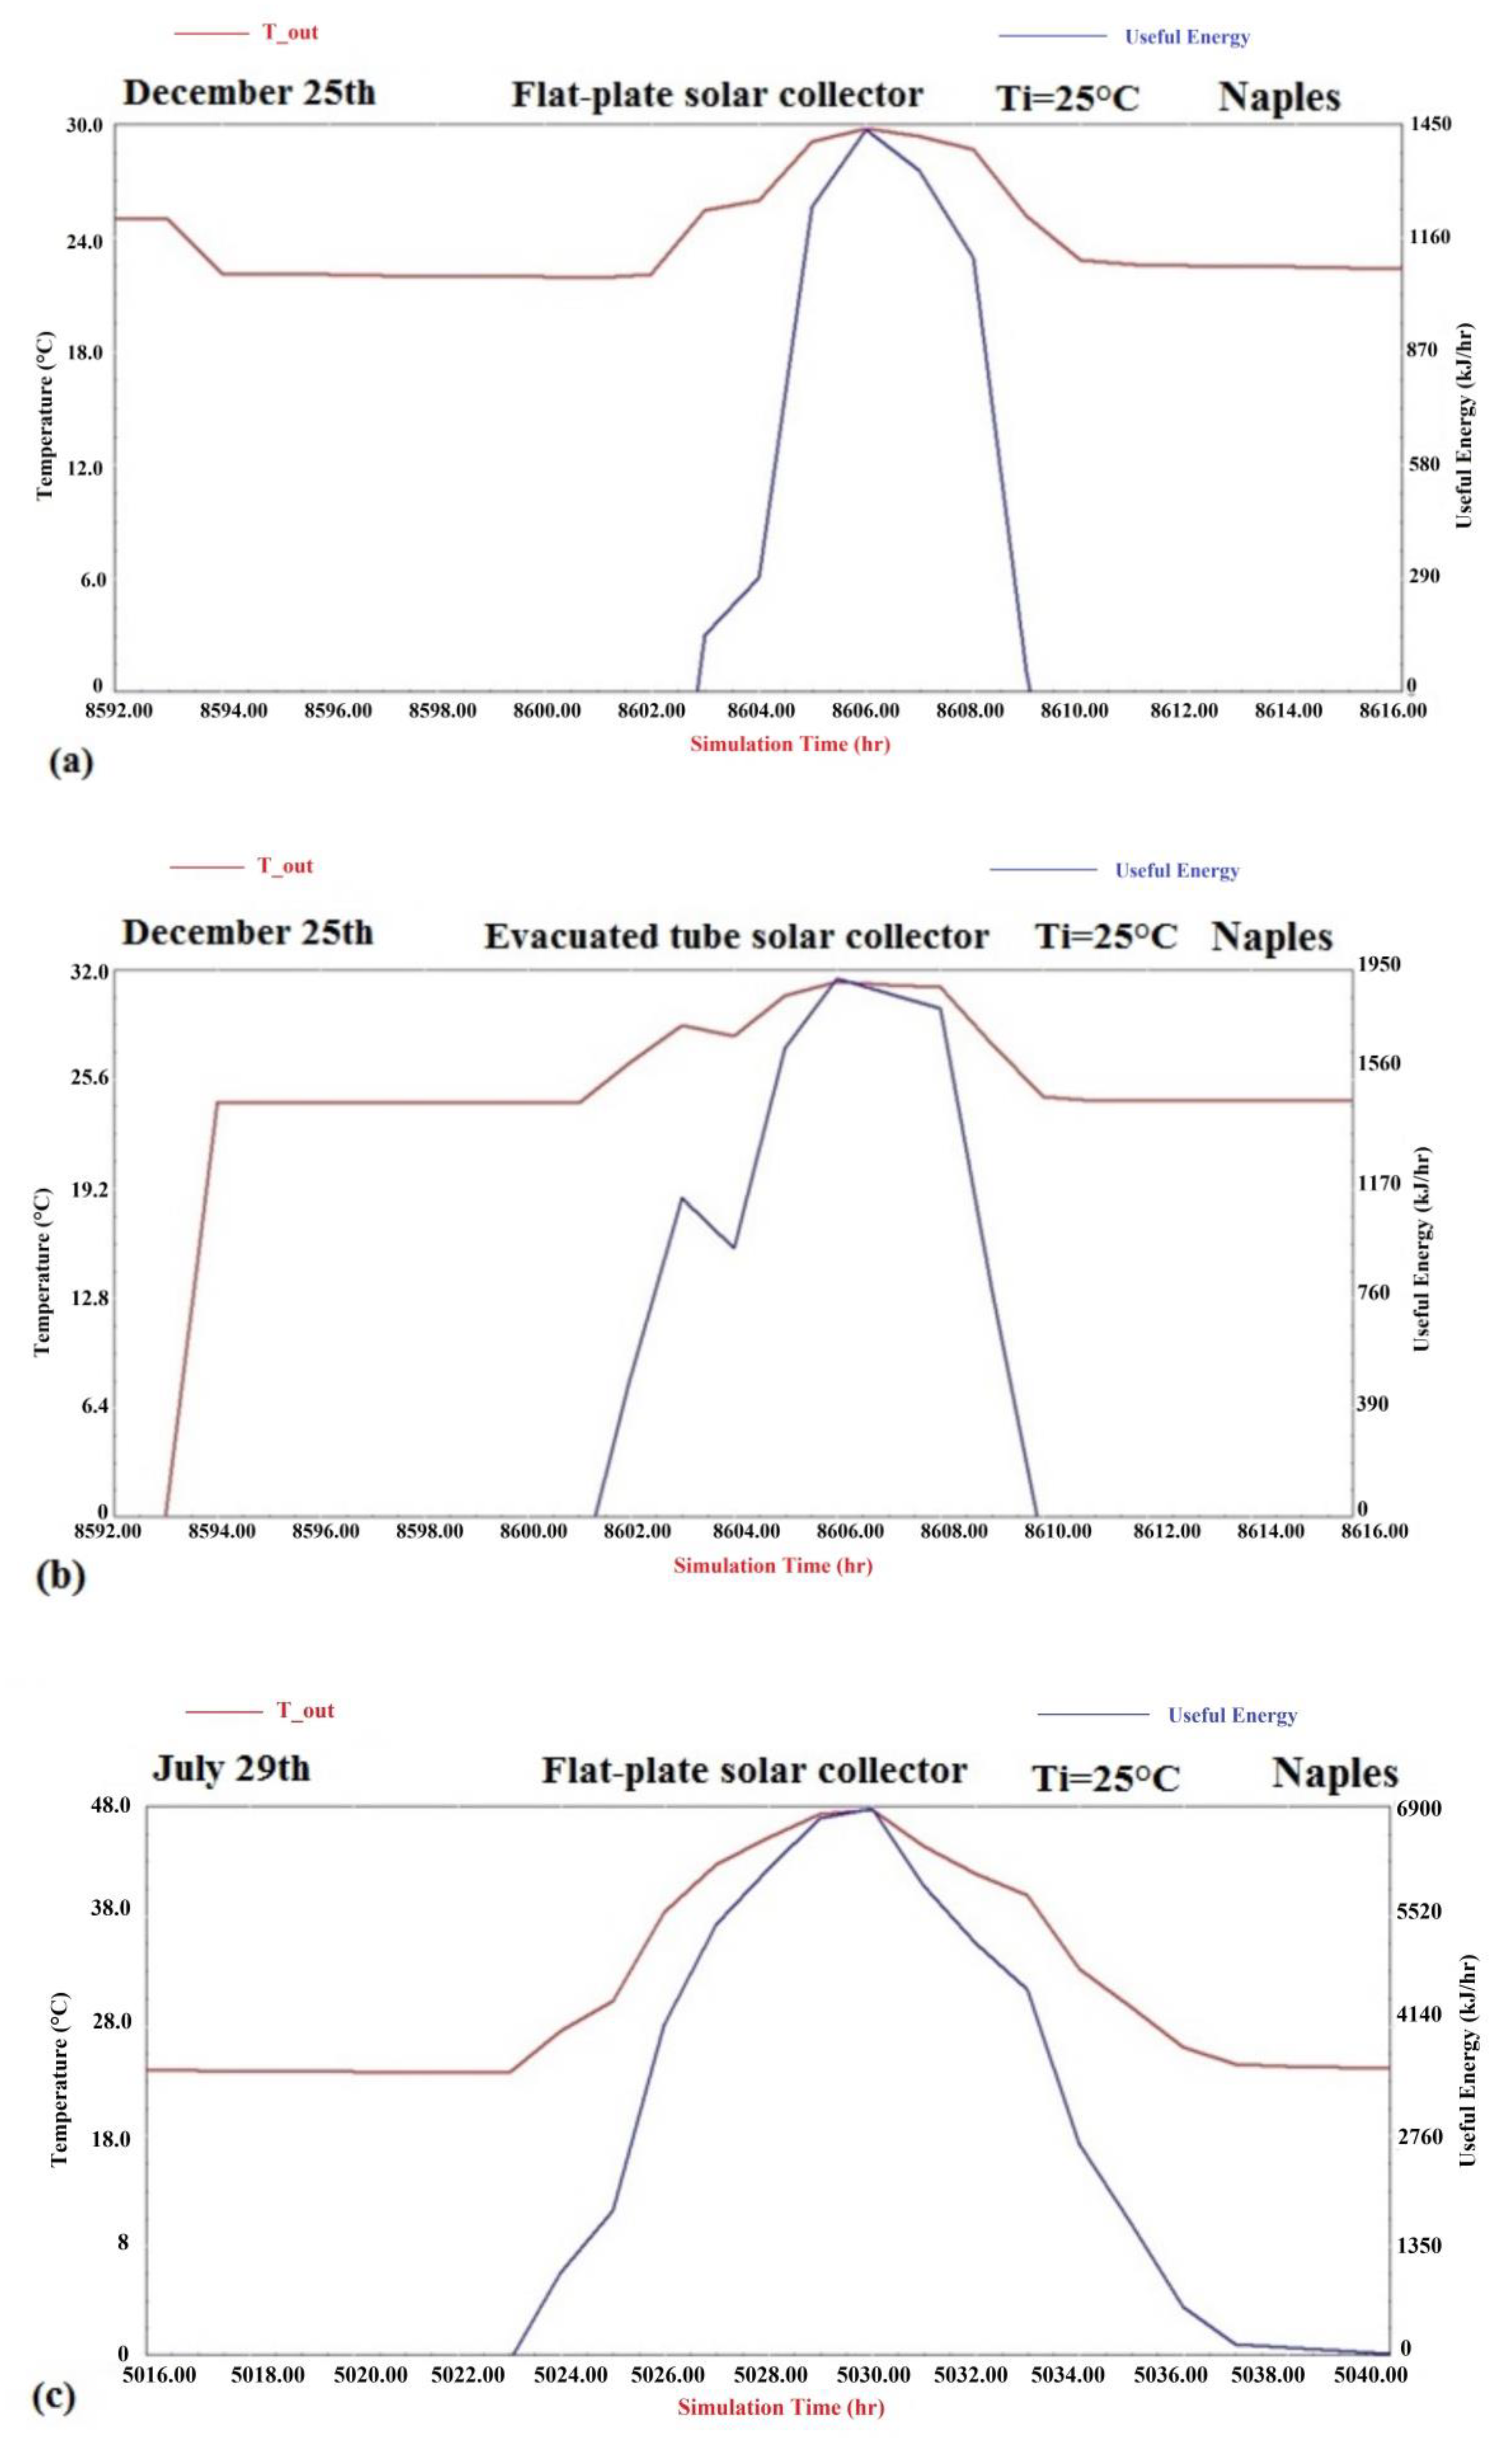
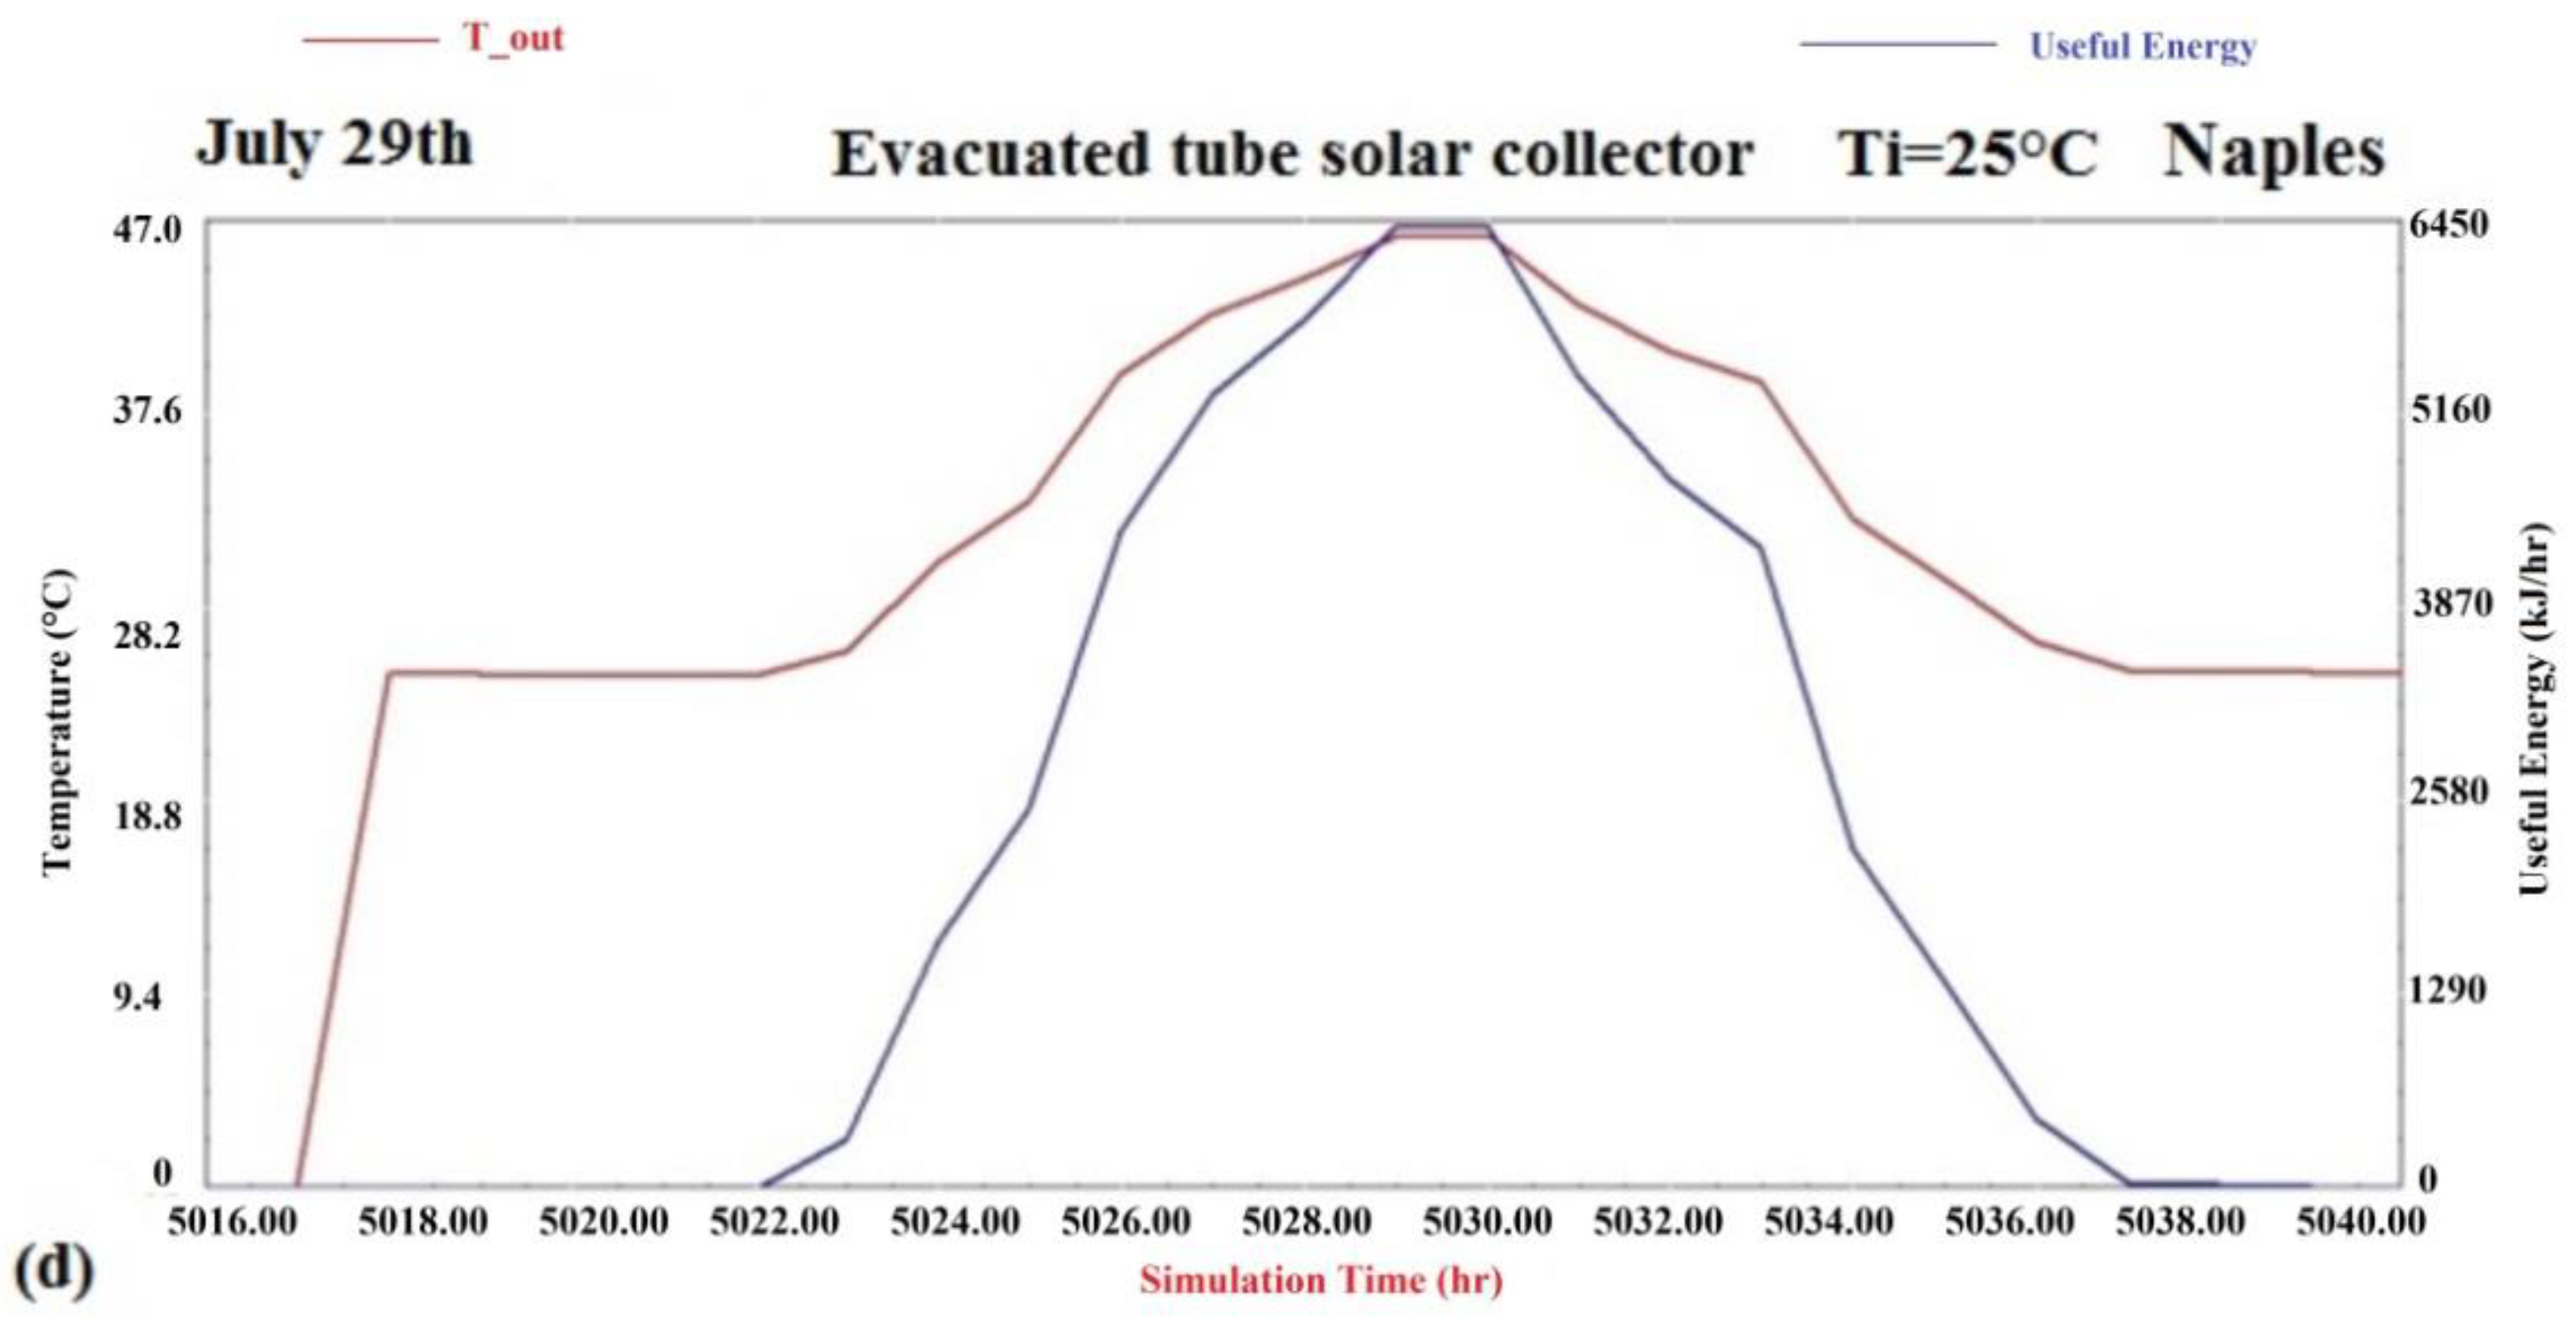
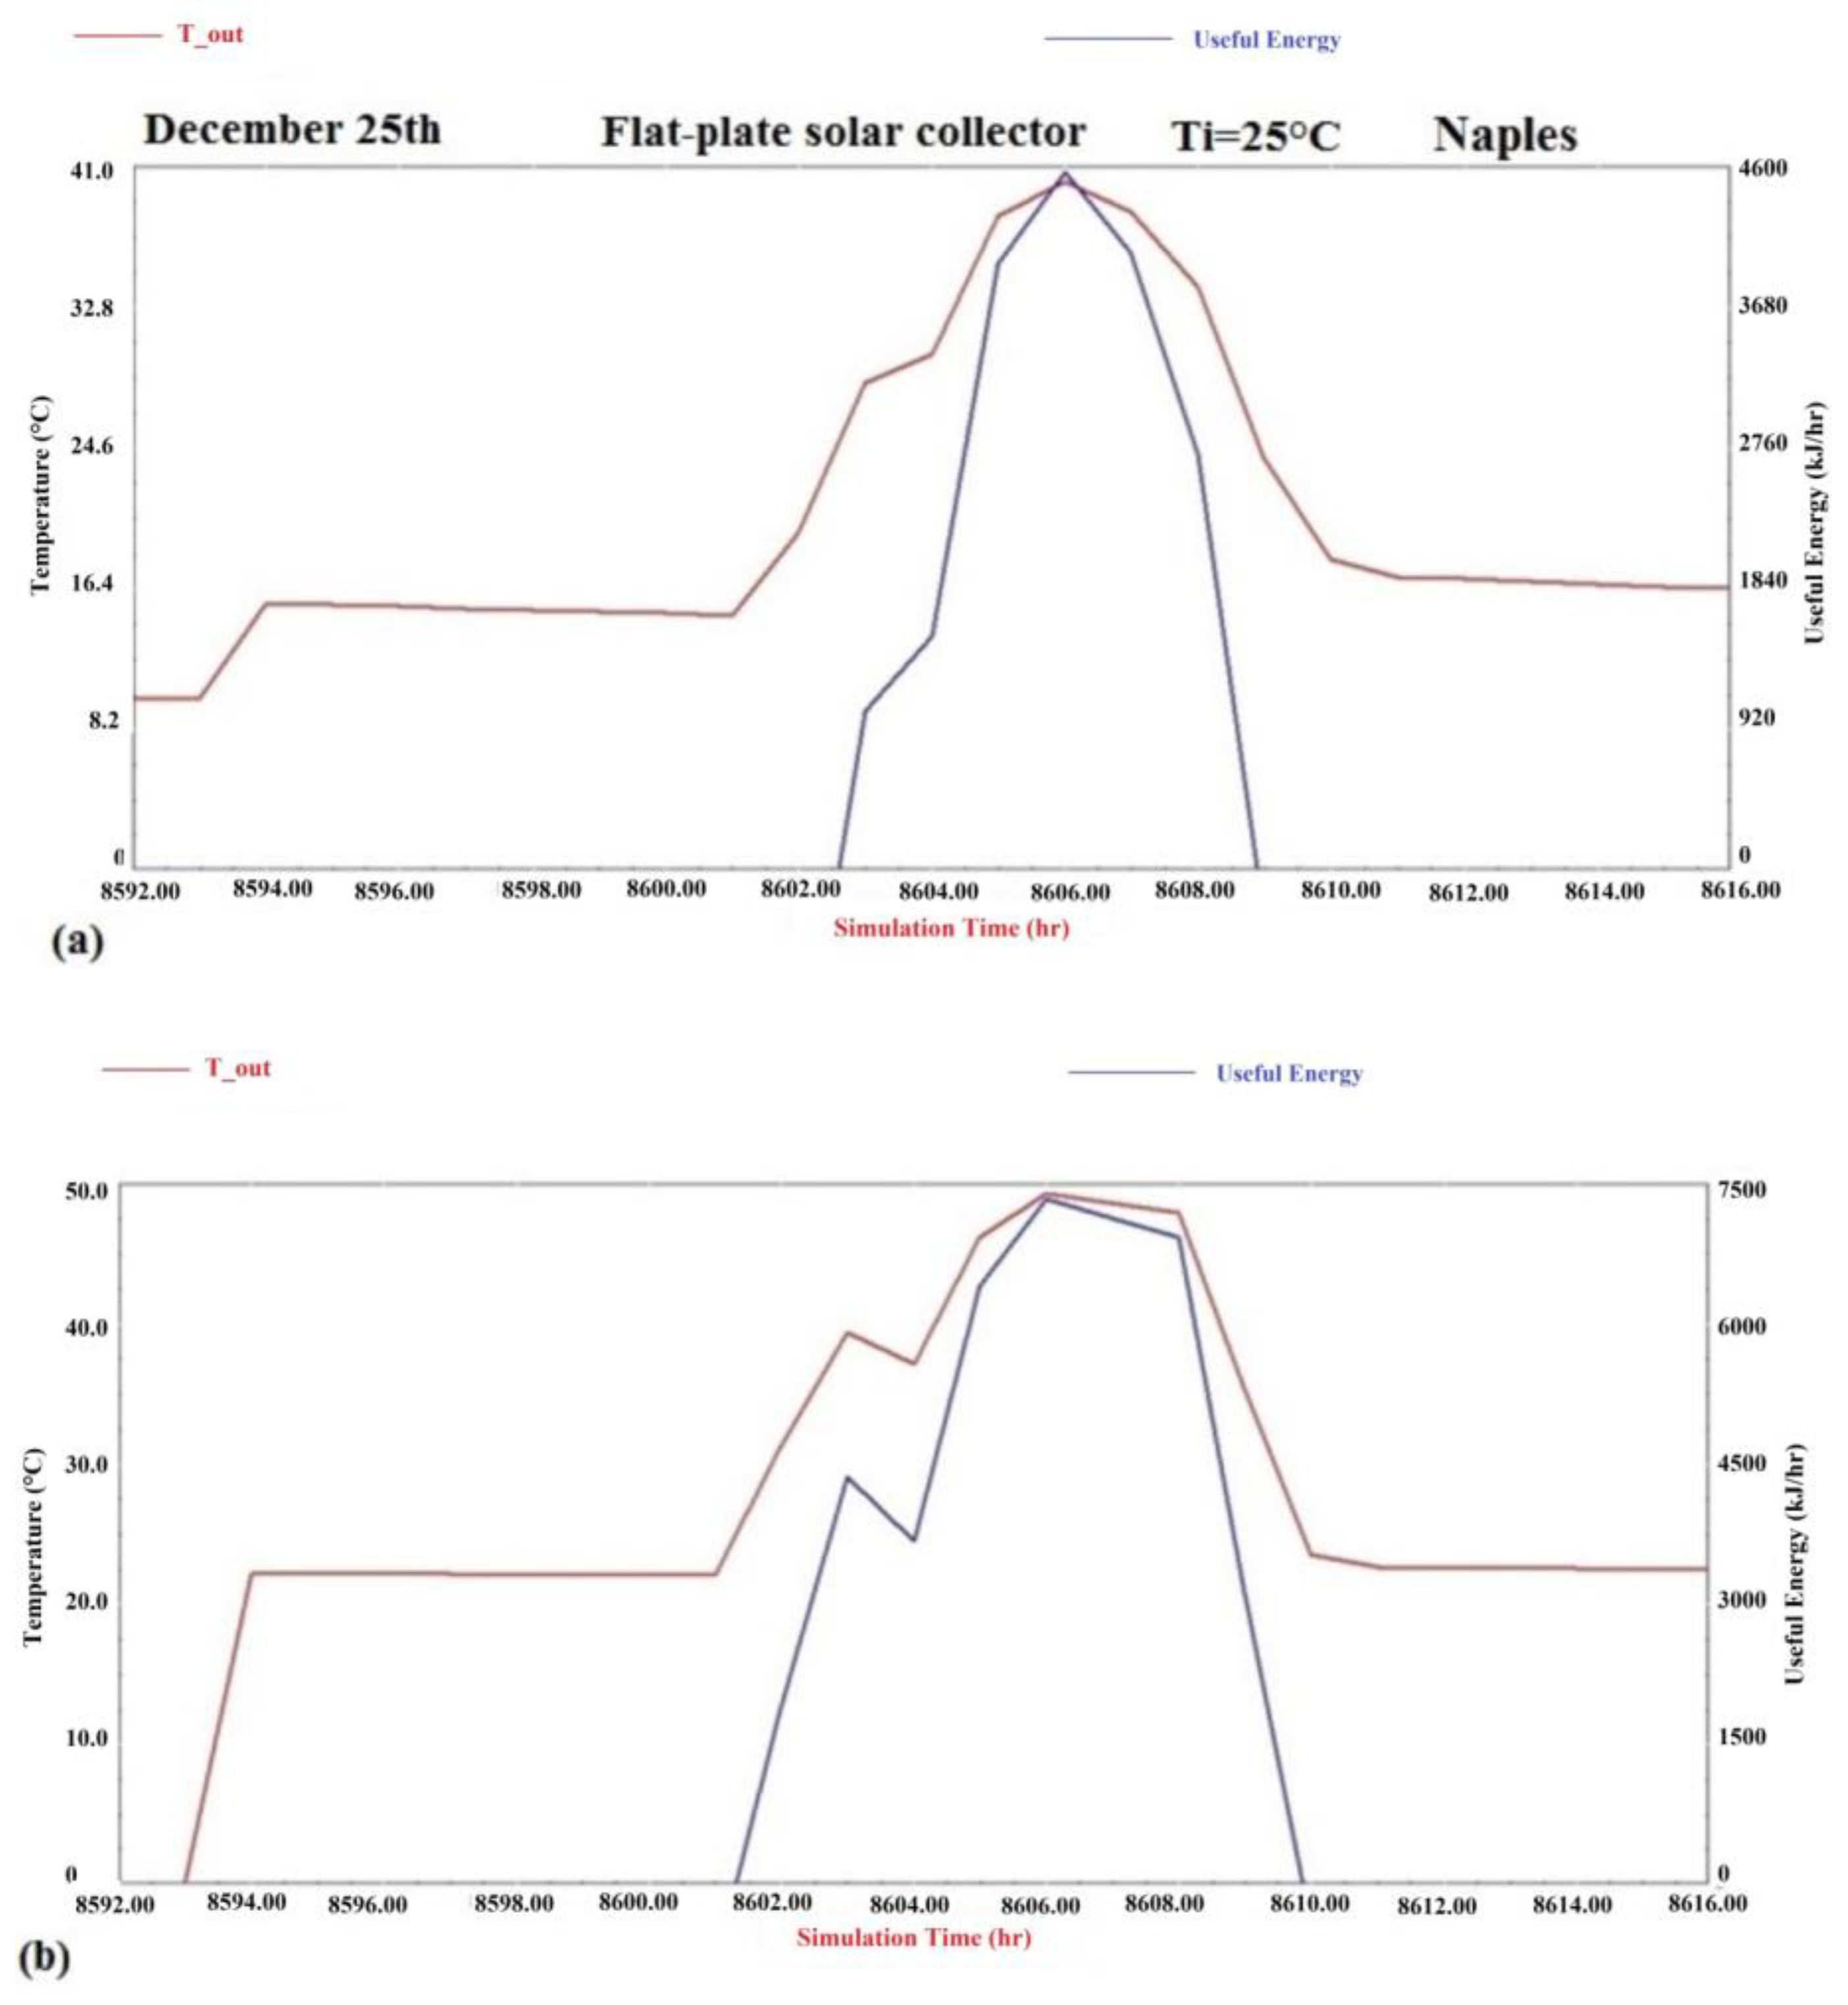
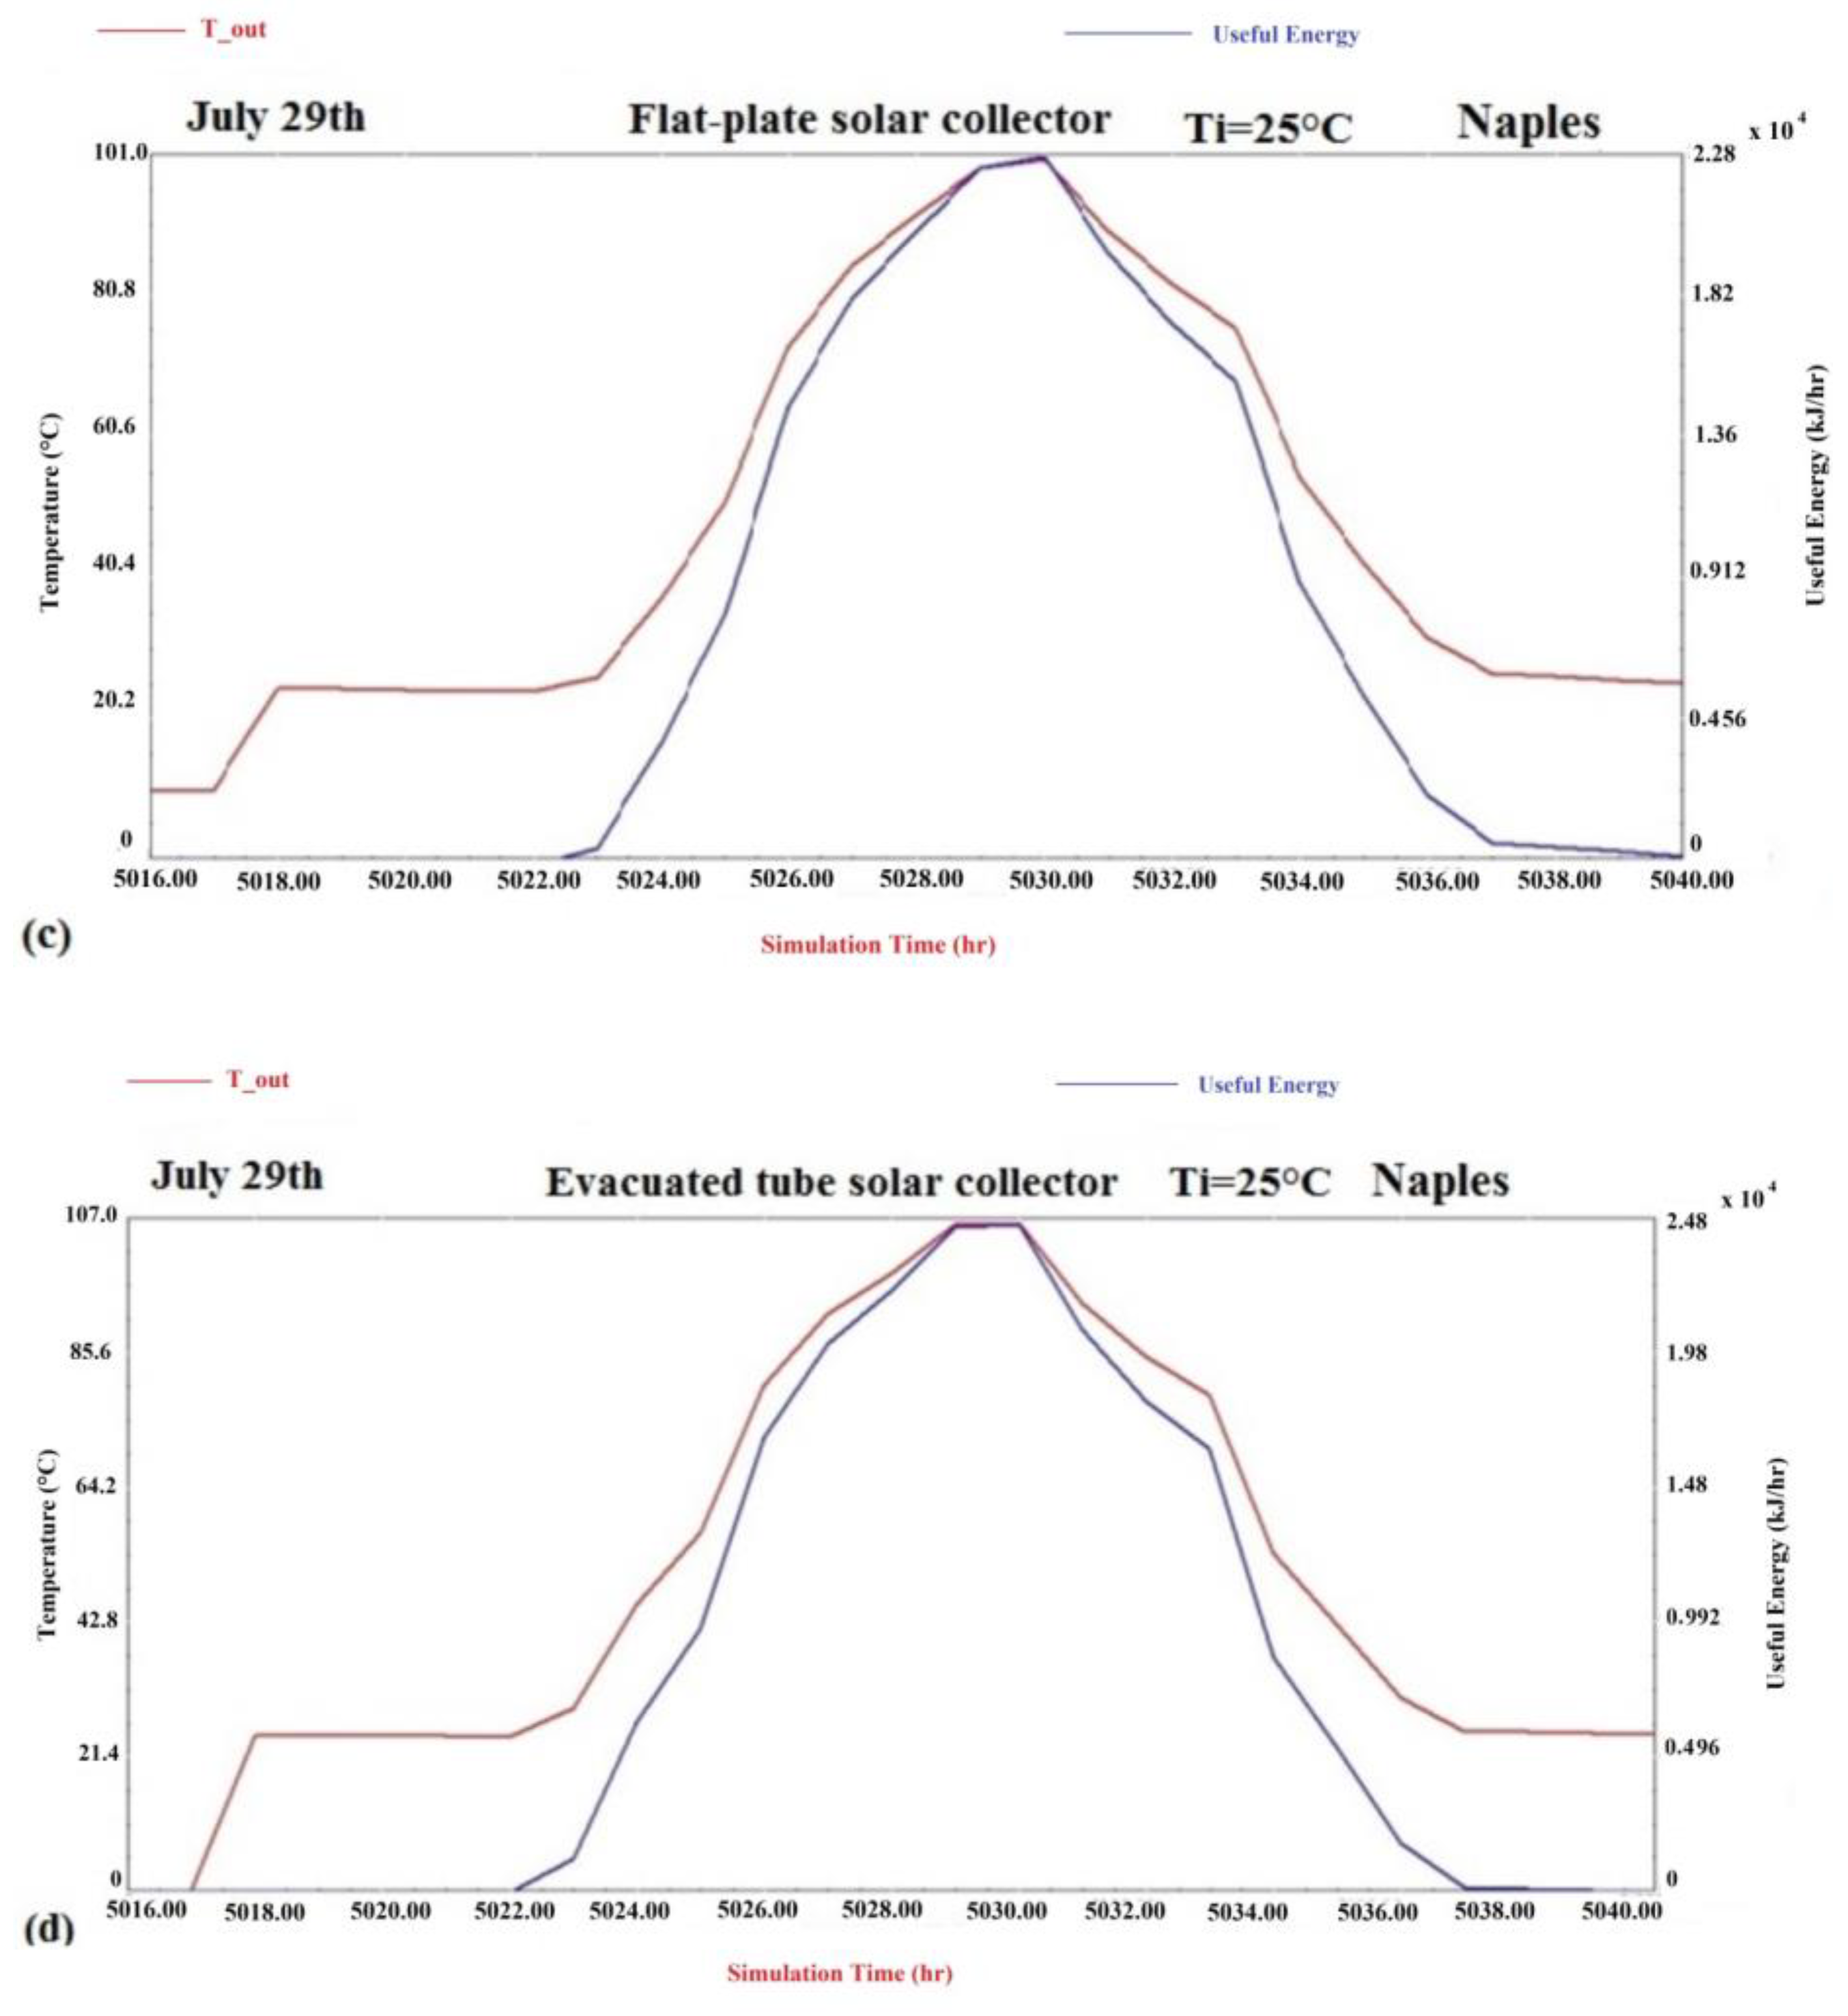
4.1. Results for the Collectors Tested in Single Configuration

The results collected are presented in terms of collector outlet temperature and useful power given by the collectors. The useful power is given by the following equation:
Q ˙ = m ˙   c p   ( T o u t T i ) ,
Figure 8 shows the outlet temperatures for the (a) flat-plate and (b) evacuated-tube collectors placed in Naples during a whole year (8760 h from 1 January to 31 December), when the collector inlet temperature is 25 °C.
In the flat-plate collector, as expected, the highest temperatures are reached in the spring and summer months (in the central area of the graphs), with temperatures reaching 50 °C. In the winter season, when the radiation incident on the panel is lower (due to the inclination of the sun rays), the maximum daily peaks do not exceed 35 °C. Over the whole year, the maximum temperature reached by the working fluid leaving the flat-plate collector simulated in the Naples climatic conditions is about 50 °C, assuming an inlet temperature of 25 °C.
Over the whole year, also for the ETC simulated in the climatic conditions of Naples, the maximum temperature reached is approximately 50 °C, assuming 25 °C as inlet temperature.
In the case of the ETC, the main difference observed with respect to the result obtained using the FPC is that the minimum outlet temperature, even on winter nights, does not fall consistently, since the working fluid does not release heat to the environment if its inlet temperature is kept constant. This is due to the vacuum insulation that keeps the working fluid at its inlet temperature. This allows the ETC to reach slightly higher outlet temperatures in the winter months than the FPC. The latter data are visible in the first two columns and in the last two columns of Figure 8, corresponding to the months of January, February, November, and December. Considering the first column and focusing on Figure 8a, one can observe the FPC during the whole month of January barely reaching 36 °C as maximum outlet temperature. On the other hand, in Figure 8b, the first column shows peaks of temperature slightly above 36 °C.
In Figure 9, the one-year useful power given by (a) flat-plate and (b) evacuated-tube collectors placed in the city of Naples when Tin = 25 °C is plotted.
In the flat-plate collector, the maximum values of useful power are registered in the end of June, corresponding to the outlet temperature reaching the maximum values. The maximum annual peak value is 7542 kJ/hr. The useful power produced by the evacuated-tube collector over an entire year does not differ much from that of the FPC one.
In Figure 10, the daily outlet temperature and useful power registered for 25 December and 29 July, in (a) flat-plate and (b) evacuated-tube collectors placed in the city of Naples when Ti = 25 °C, are plotted. On 25 December, in Naples, the flat-plate collector reports 30 °C as maximum outlet temperature, whereas the registered Qmax is 1450 kJ/hr.
The ETC, in Naples, shows a slightly higher performance, i.e., the maximum output temperature is 32 °C and the useful power is 1950 kJ/hr. On 29 July, the performance of the two collectors reverse—the FPC shows the maximum output temperature (48 °C), which is higher than the maximum temperature (47 °C) reached in the ETC; the maximum produced useful power values are 6900 kJ/hr and 6 450 kJ/hr, respectively, for the FPC and the ETC.
Figure 11 presents a comparison of the maximum yearly outlet temperature and useful peak power values registered in the different climatic areas investigated by varying the temperature of the fluid inlet to the FPC and the ETC. This figure shows that for the FPC the maximum power peak decreases with the increase of the inlet temperature of the fluid. As shown by the red arrows, the maximum outlet temperature of the FPC is most of the time higher than that of the ETC. The evacuated-tube collector performs better only in Stockholm and for a Tin = 25 °C.
As expected, the flat-plate collector is penalized in cold seasons due to thermal losses, while the evacuated-tube collector reduces the dispersion of heat to approximately zero. Therefore, these simulations show that the use of the FPC is strongly discouraged in cold climatic areas. In warm seasons, on the contrary, the flat-plate collector takes advantage of the high environmental temperatures and heats the fluid more.

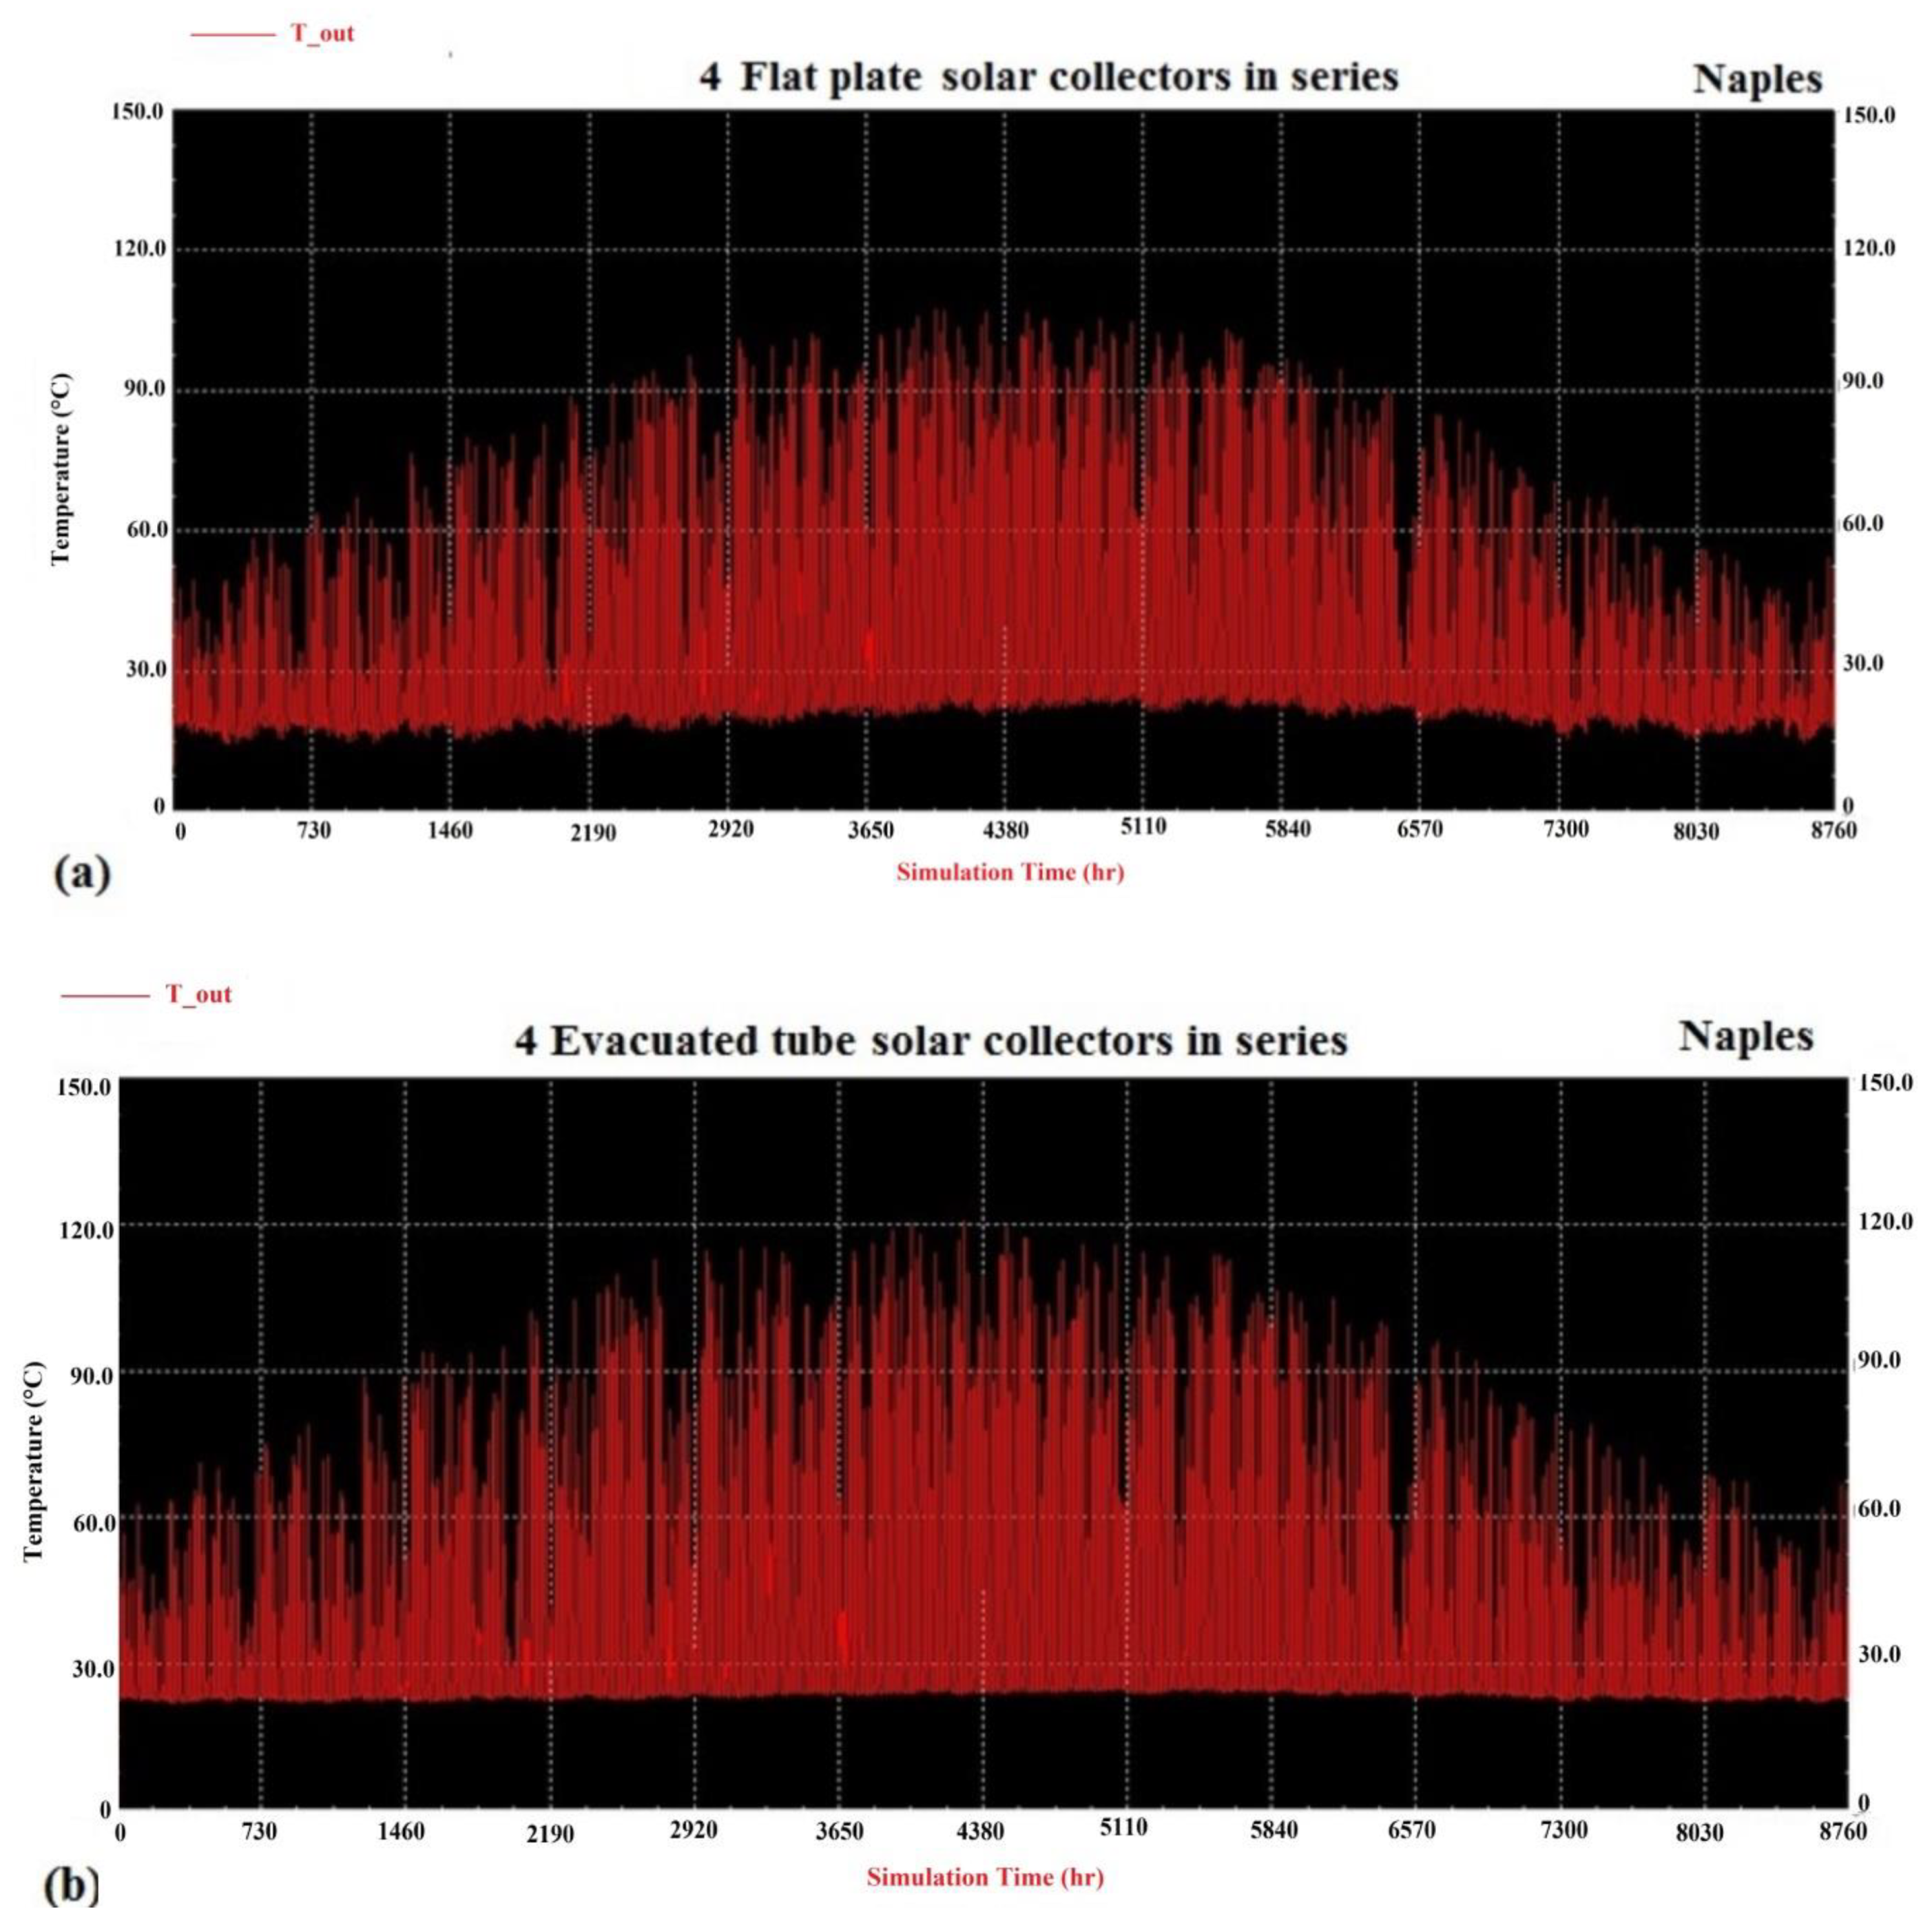
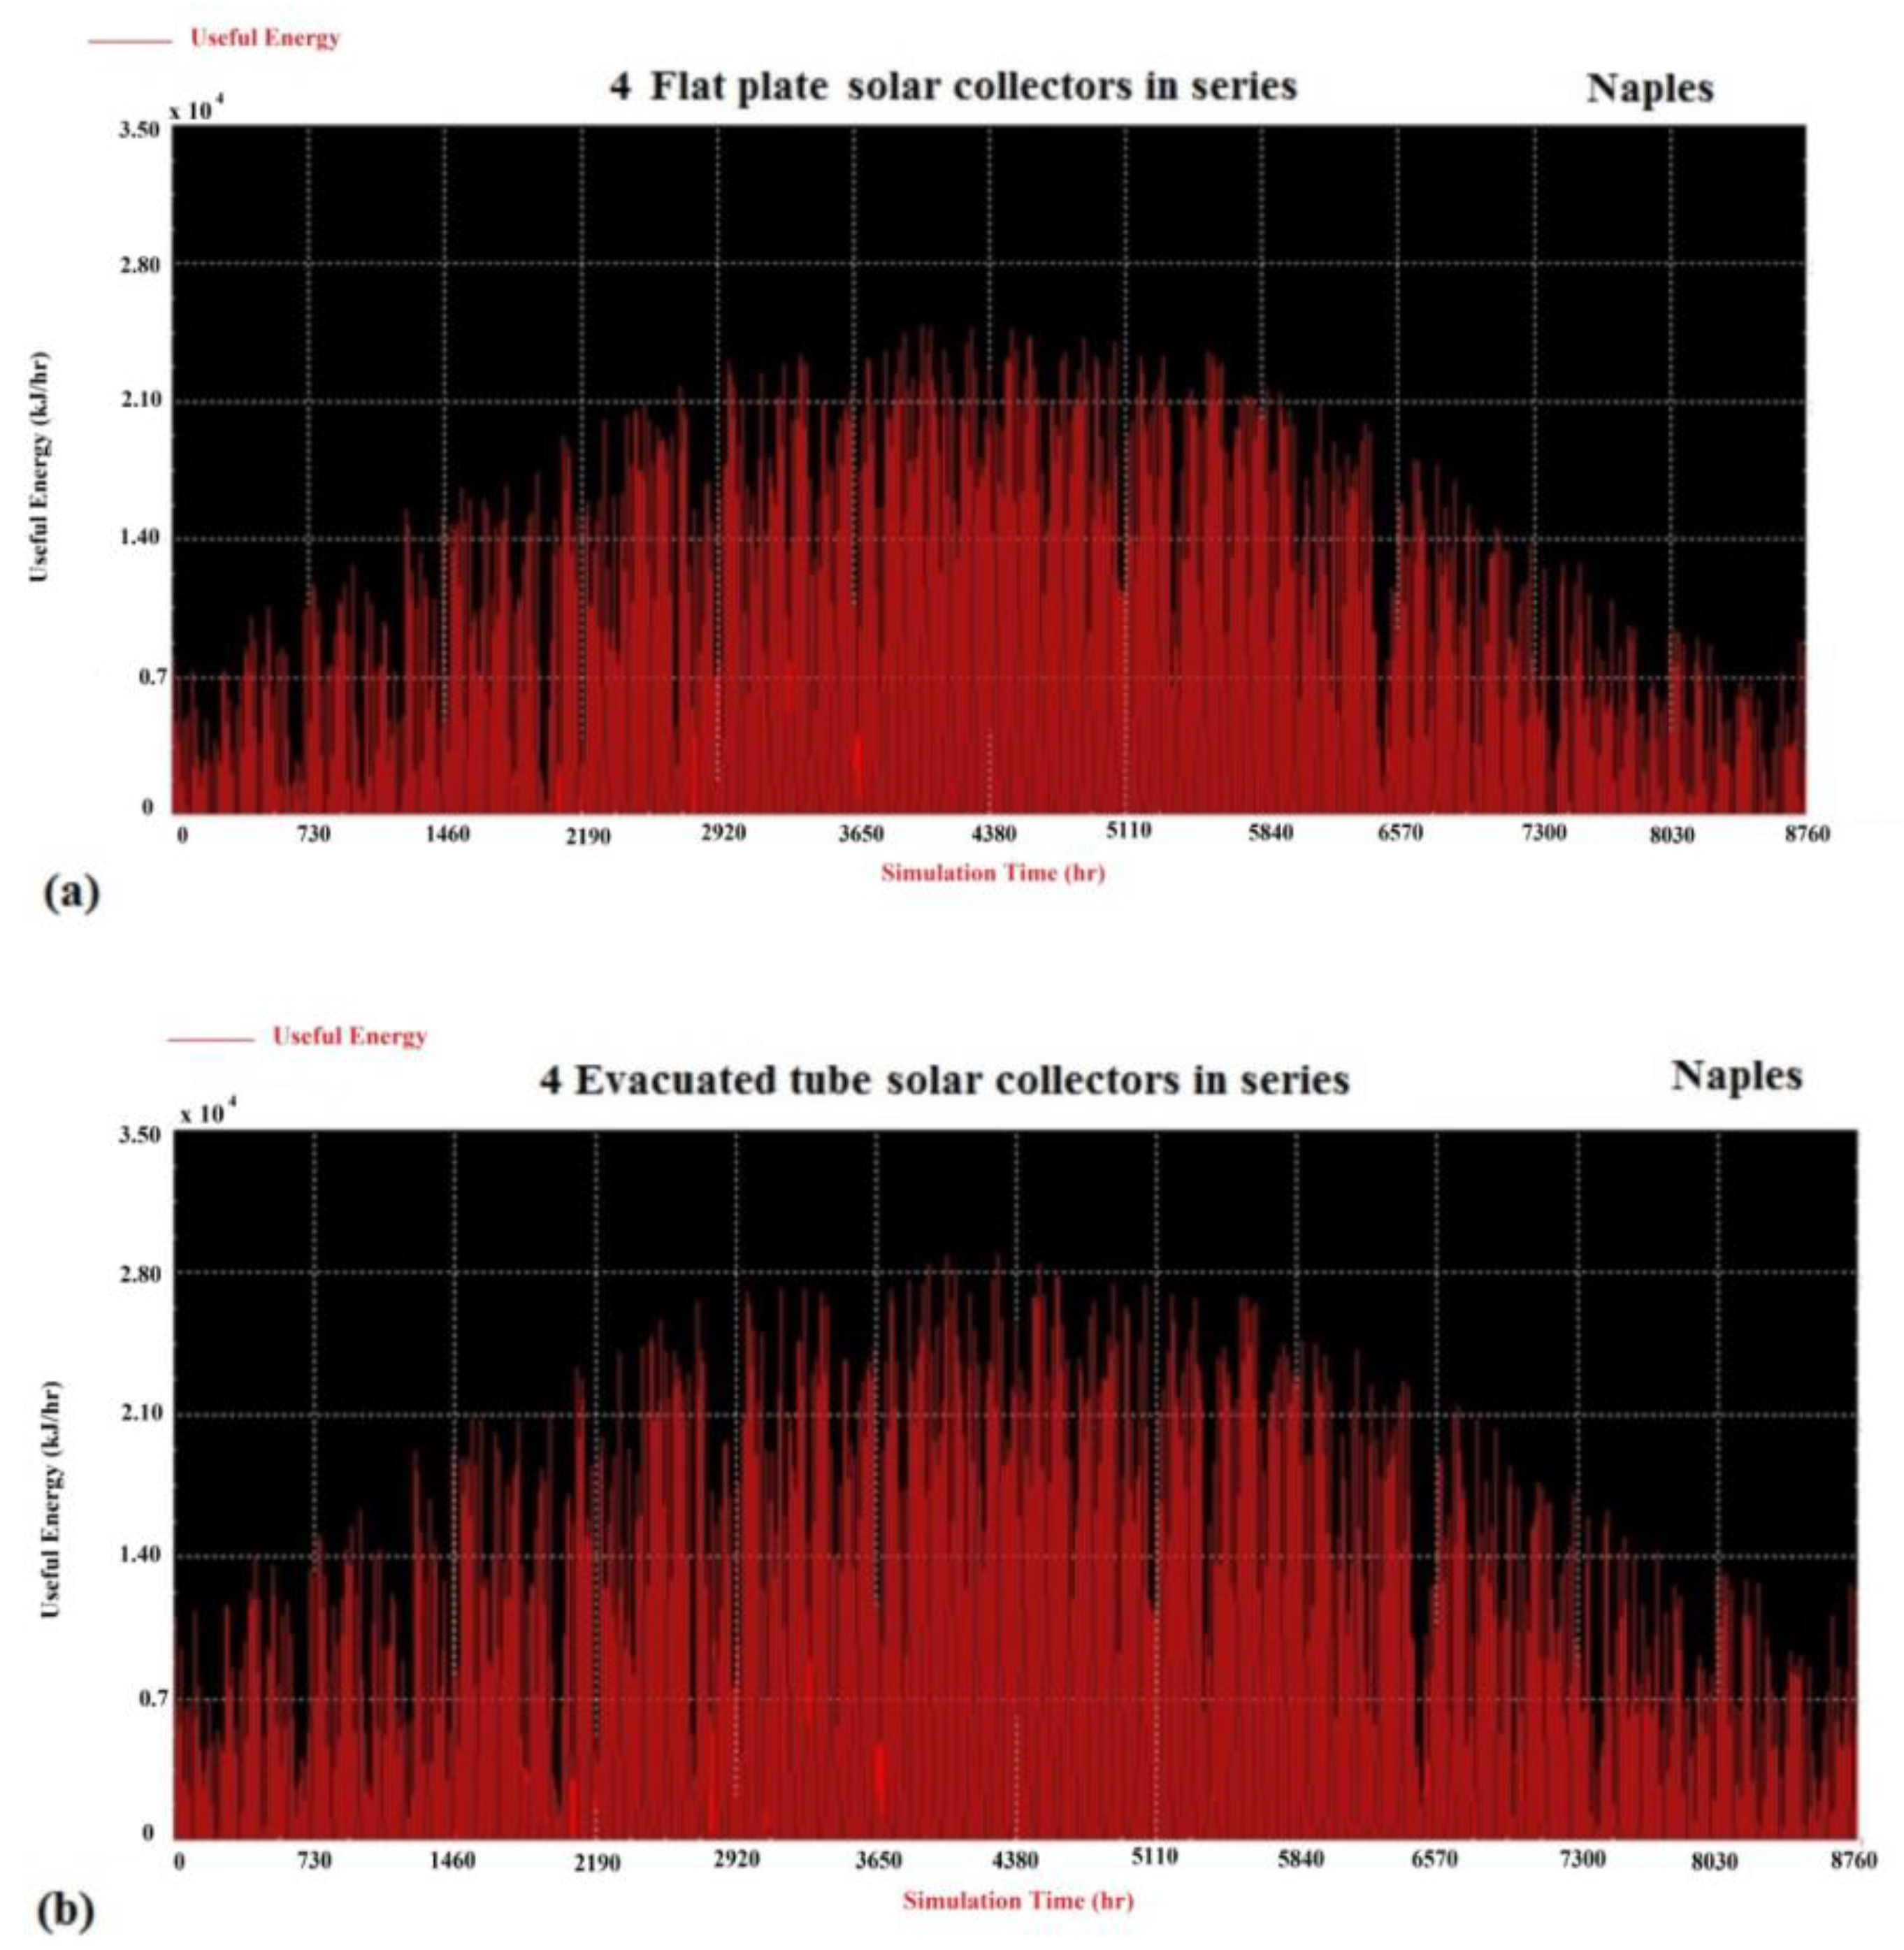
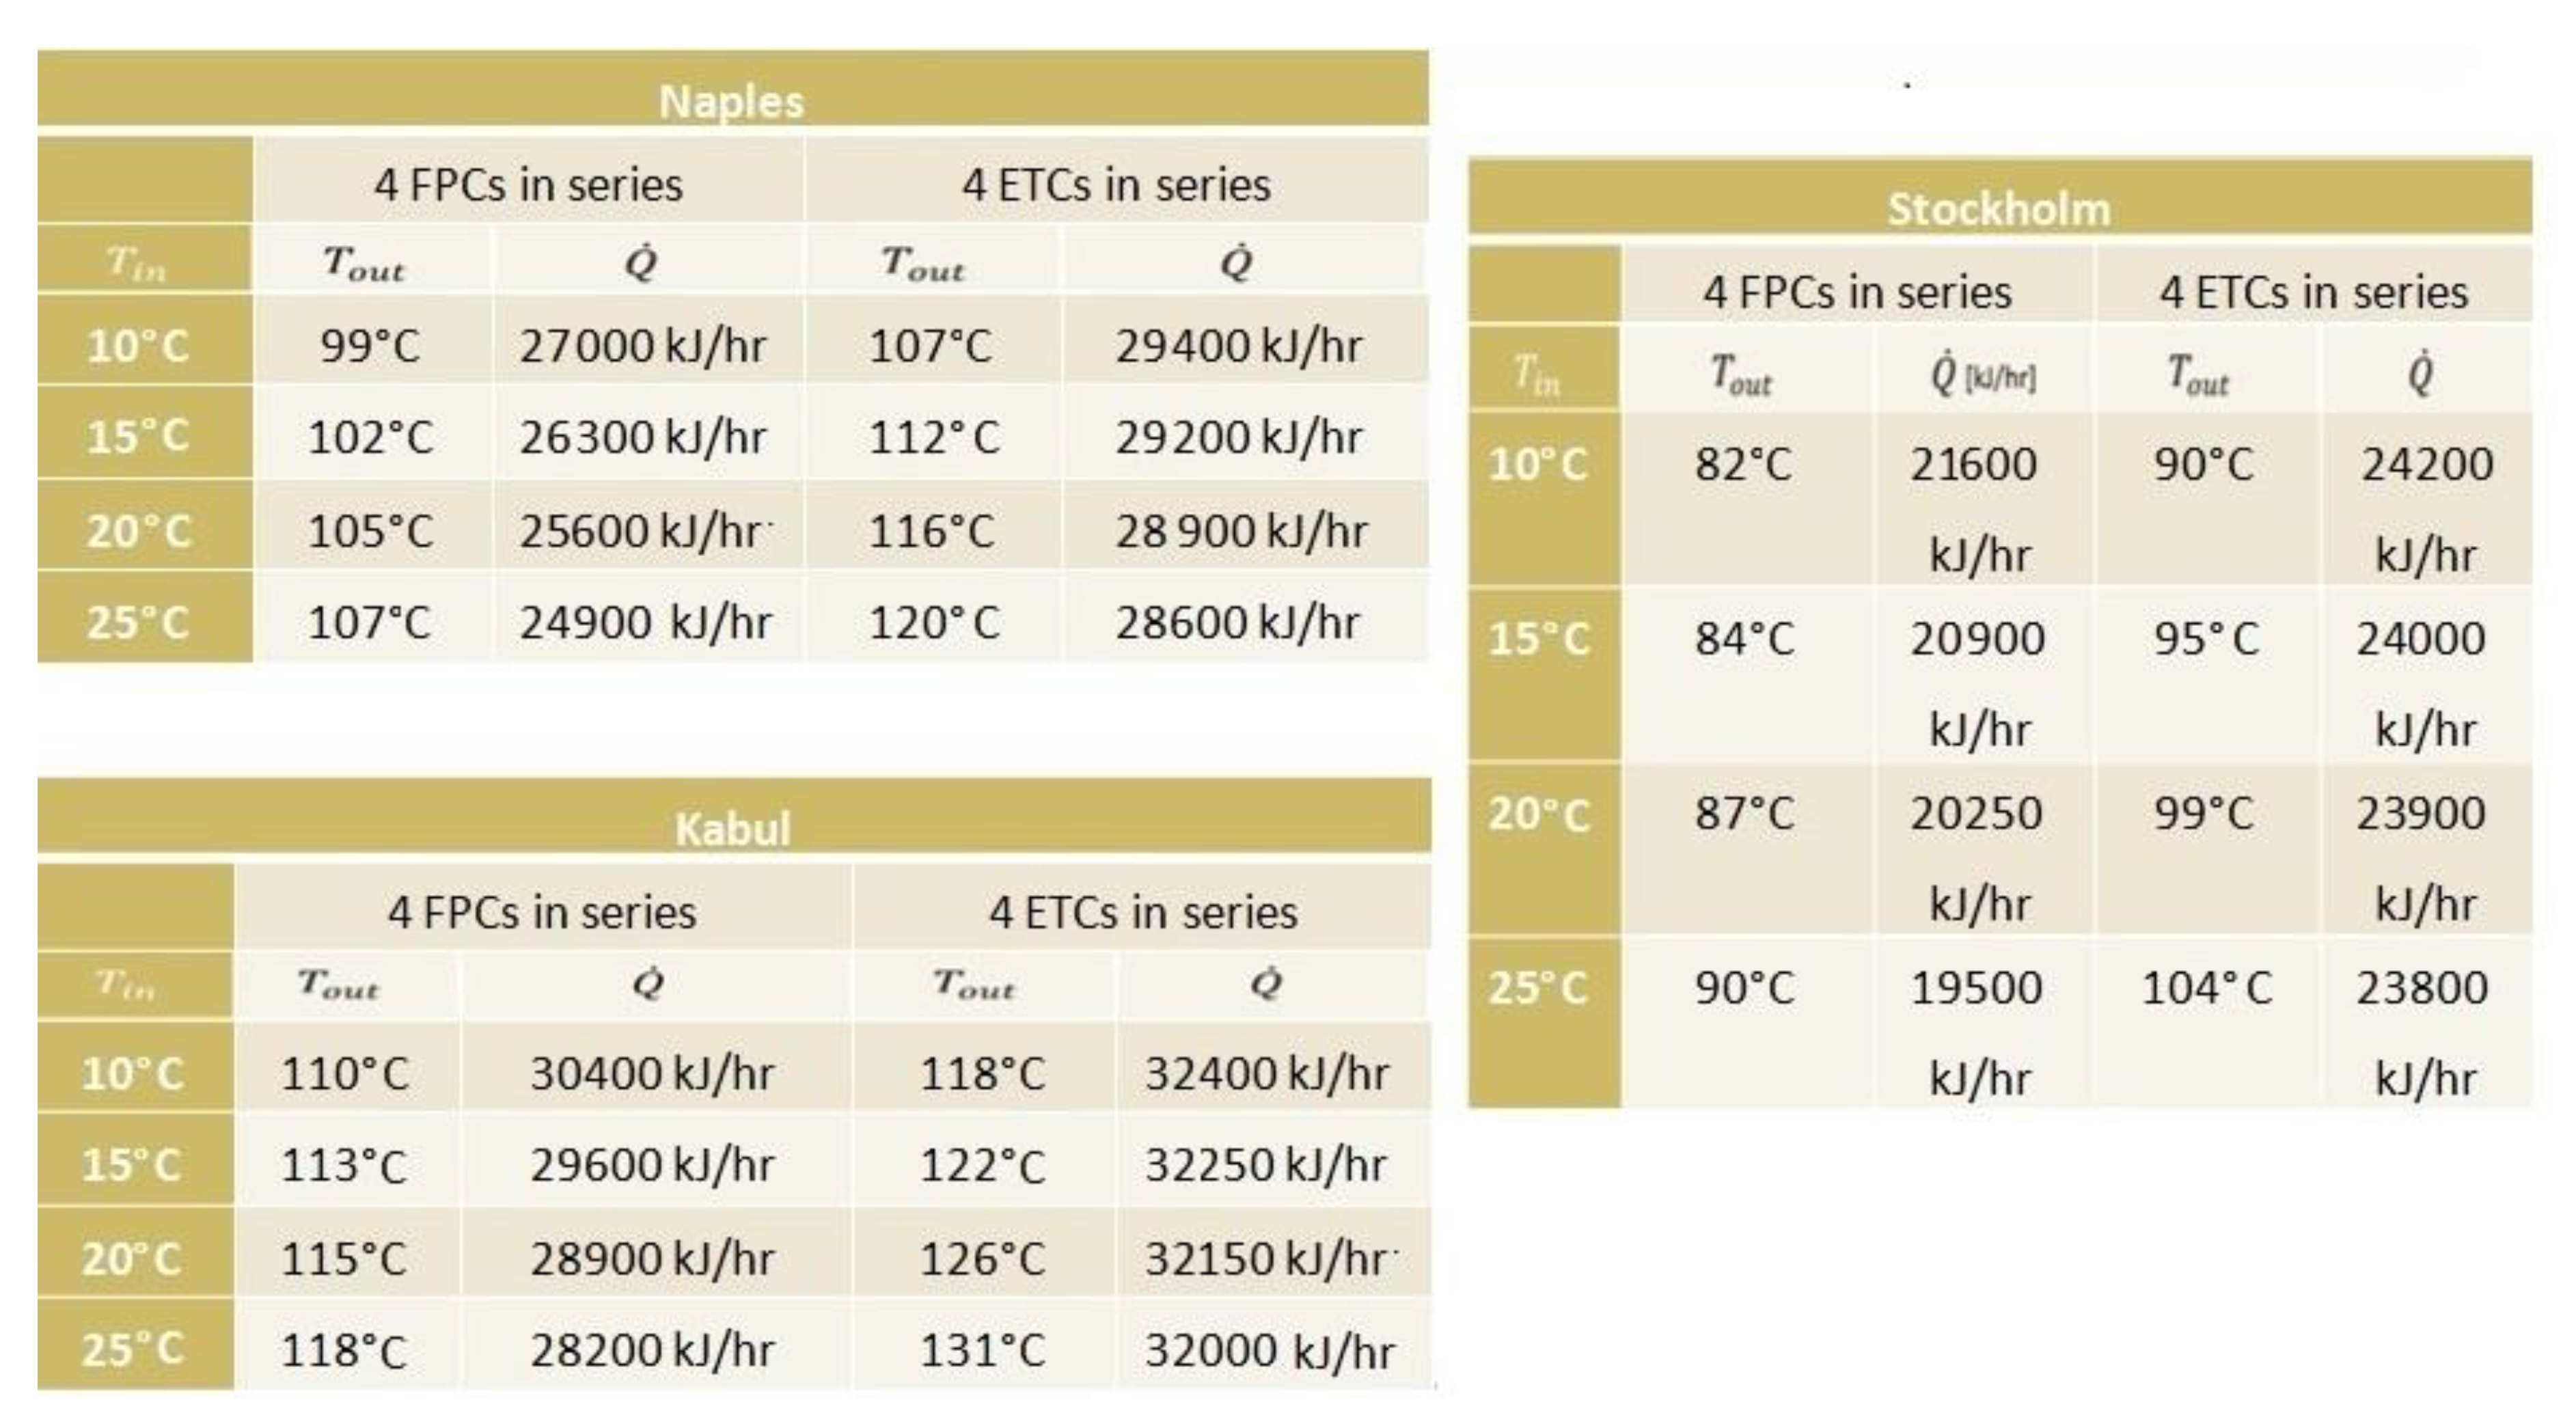
4.2. Results for a String of Four Collectors

The simulations derived from the string of four collectors in series amplify the differences just discussed, highlighting the thermal losses of the flat-plate collector and the optimal performance of the system with four vacuum collectors. In Figure 12, the one-year outlet temperature plots of the string made of four (a) flat-plate and (b) evacuated-tube collectors placed in the city of Naples when Ti = 25 °C are shown.
The annual peak temperature reached in Naples by the series of four FPCs is about 107 °C, whereas a maximum yearly temperature reached by the series of four ETCs is equal to 120 °C. To make a monthly balance, January, one of the worst months for the use of solar energy, was chosen, and we noticed that while the first column of the graph referring to the flat-plate collectors reached just 60 °C, the first column of the graph referring to the evacuated-tube collectors reached 70 °C.
In Figure 13, the one-year useful power given by the string made of four (a) flat-plate and (b) evacuated-tube collectors placed in the city of Naples when Ti = 25,°C is shown. The numerical values of the annual peak of useful power are 24,900 kJ/hr for the flat-plate collectors and 28,600 kJ/hr for the vacuum collectors. The results relating to the series of four collectors show a clear advantage for the vacuum type. These results are similar to the those obtained for the Mediterranean climate. Results for the Mediterranean climate showed that the annual solar yield for the flat-plate collector was 664 kWh/m2year, for the heat pipe evacuated-tube collector it was 885 kWh/m2year for the installed flat-plate area of 4.41 m2, and for the heat pipe evacuated-tube collector area of 1.5 m2 at the annual irradiation on the solar collector plane it was 1456 kWh/m2year [34].
On the other hand, for a system made up of several collectors, the small thermal losses of each flat-plate collector, added together, lower the performance of the entire system more than the case of the ETCs.
In Figure 14, the daily outlet temperature and useful power registered for 25 December and 29 July, in the string of four (a) flat-plate and (b) evacuated-tube collectors placed in the city of Naples when Ti = 25 °C, are plotted.
During the night of 25 December, the outlet temperature set itself around 16 °C despite the inlet temperature being 25 °C in the FPC series. The daily peaks were 41 °C and 4600 kJ/hr. The series of four ETCs, on the other hand, reported an outlet temperature always at least equal to the inlet temperature, demonstrating the negligibility of thermal losses. In winter, as happened for the investigation on the single collector, the ETC technology achieves better results (49 °C and 7200 kJ/hr). During the summer, differently from single-collector projects, the performances are better than the ETC technology even in favorable summer weather conditions. The evacuated-tube collectors reach a maximum temperature of 6 °C higher than the flat-plate collectors and produce a thermal power which is higher than 1600 kJ/hr.
Figure 15 presents a comparison of the maximum yearly outlet temperature and useful peak power values registered in the different climatic areas investigated by varying the temperature of the fluid inlet to the two strings of FPCs and ETCs. In all cases, the outlet temperature is higher in the ETC technology. As the inlet temperature increases, the differences between FPC and ETC in Naples are, respectively, 8 °C, 10 °C, 11 °C, and 13 °C in favor of the ETC. Furthermore, in Kabul and Stockholm, the outlet temperatures show similar differences.
Figure 15 shows the predicted values of maximum outlet temperature and useful power peak. It can be seen that four ETCs deliver more power at 107 °C in Naples, at 118 °C in Kabul, and at 90 °C in Stockholm. Hence, it can be concluded that the ETC is the best selection for climatic conditions prevailing in Naples (Italy), Kabul (Afghanistan), and Stockholm (Sweden).

5. Conclusions

In this work, the performance of FPCs (flat-plate collectors) and ETCs (evacuated-tube collectors) was compared by carrying out a numerical investigation using TRNSYS 16 software. For both types of collectors, the equations for calculating the useful thermal power and efficiency were presented. We arrived at the following conclusions:
  • The performance of the flat-plate collector is low in cold seasons due to thermal losses and its use is discouraged in cold climatic areas. These data emerge more significantly not on the single panel evaluation but on the string of four collectors. Specifically, 15.6% and 13.1% are the maximum and medium increments of the water outlet temperature registered in Stockholm when using a string of four ETCs with respect to a string composed of four FPCs. In warm seasons, on the contrary, the flat-plate collector takes advantage of the high environmental temperatures and heats the fluid more.
  • In cold seasons, due to thermal losses, the evacuated-tube collector reduces the dispersion of heat to approximately zero.
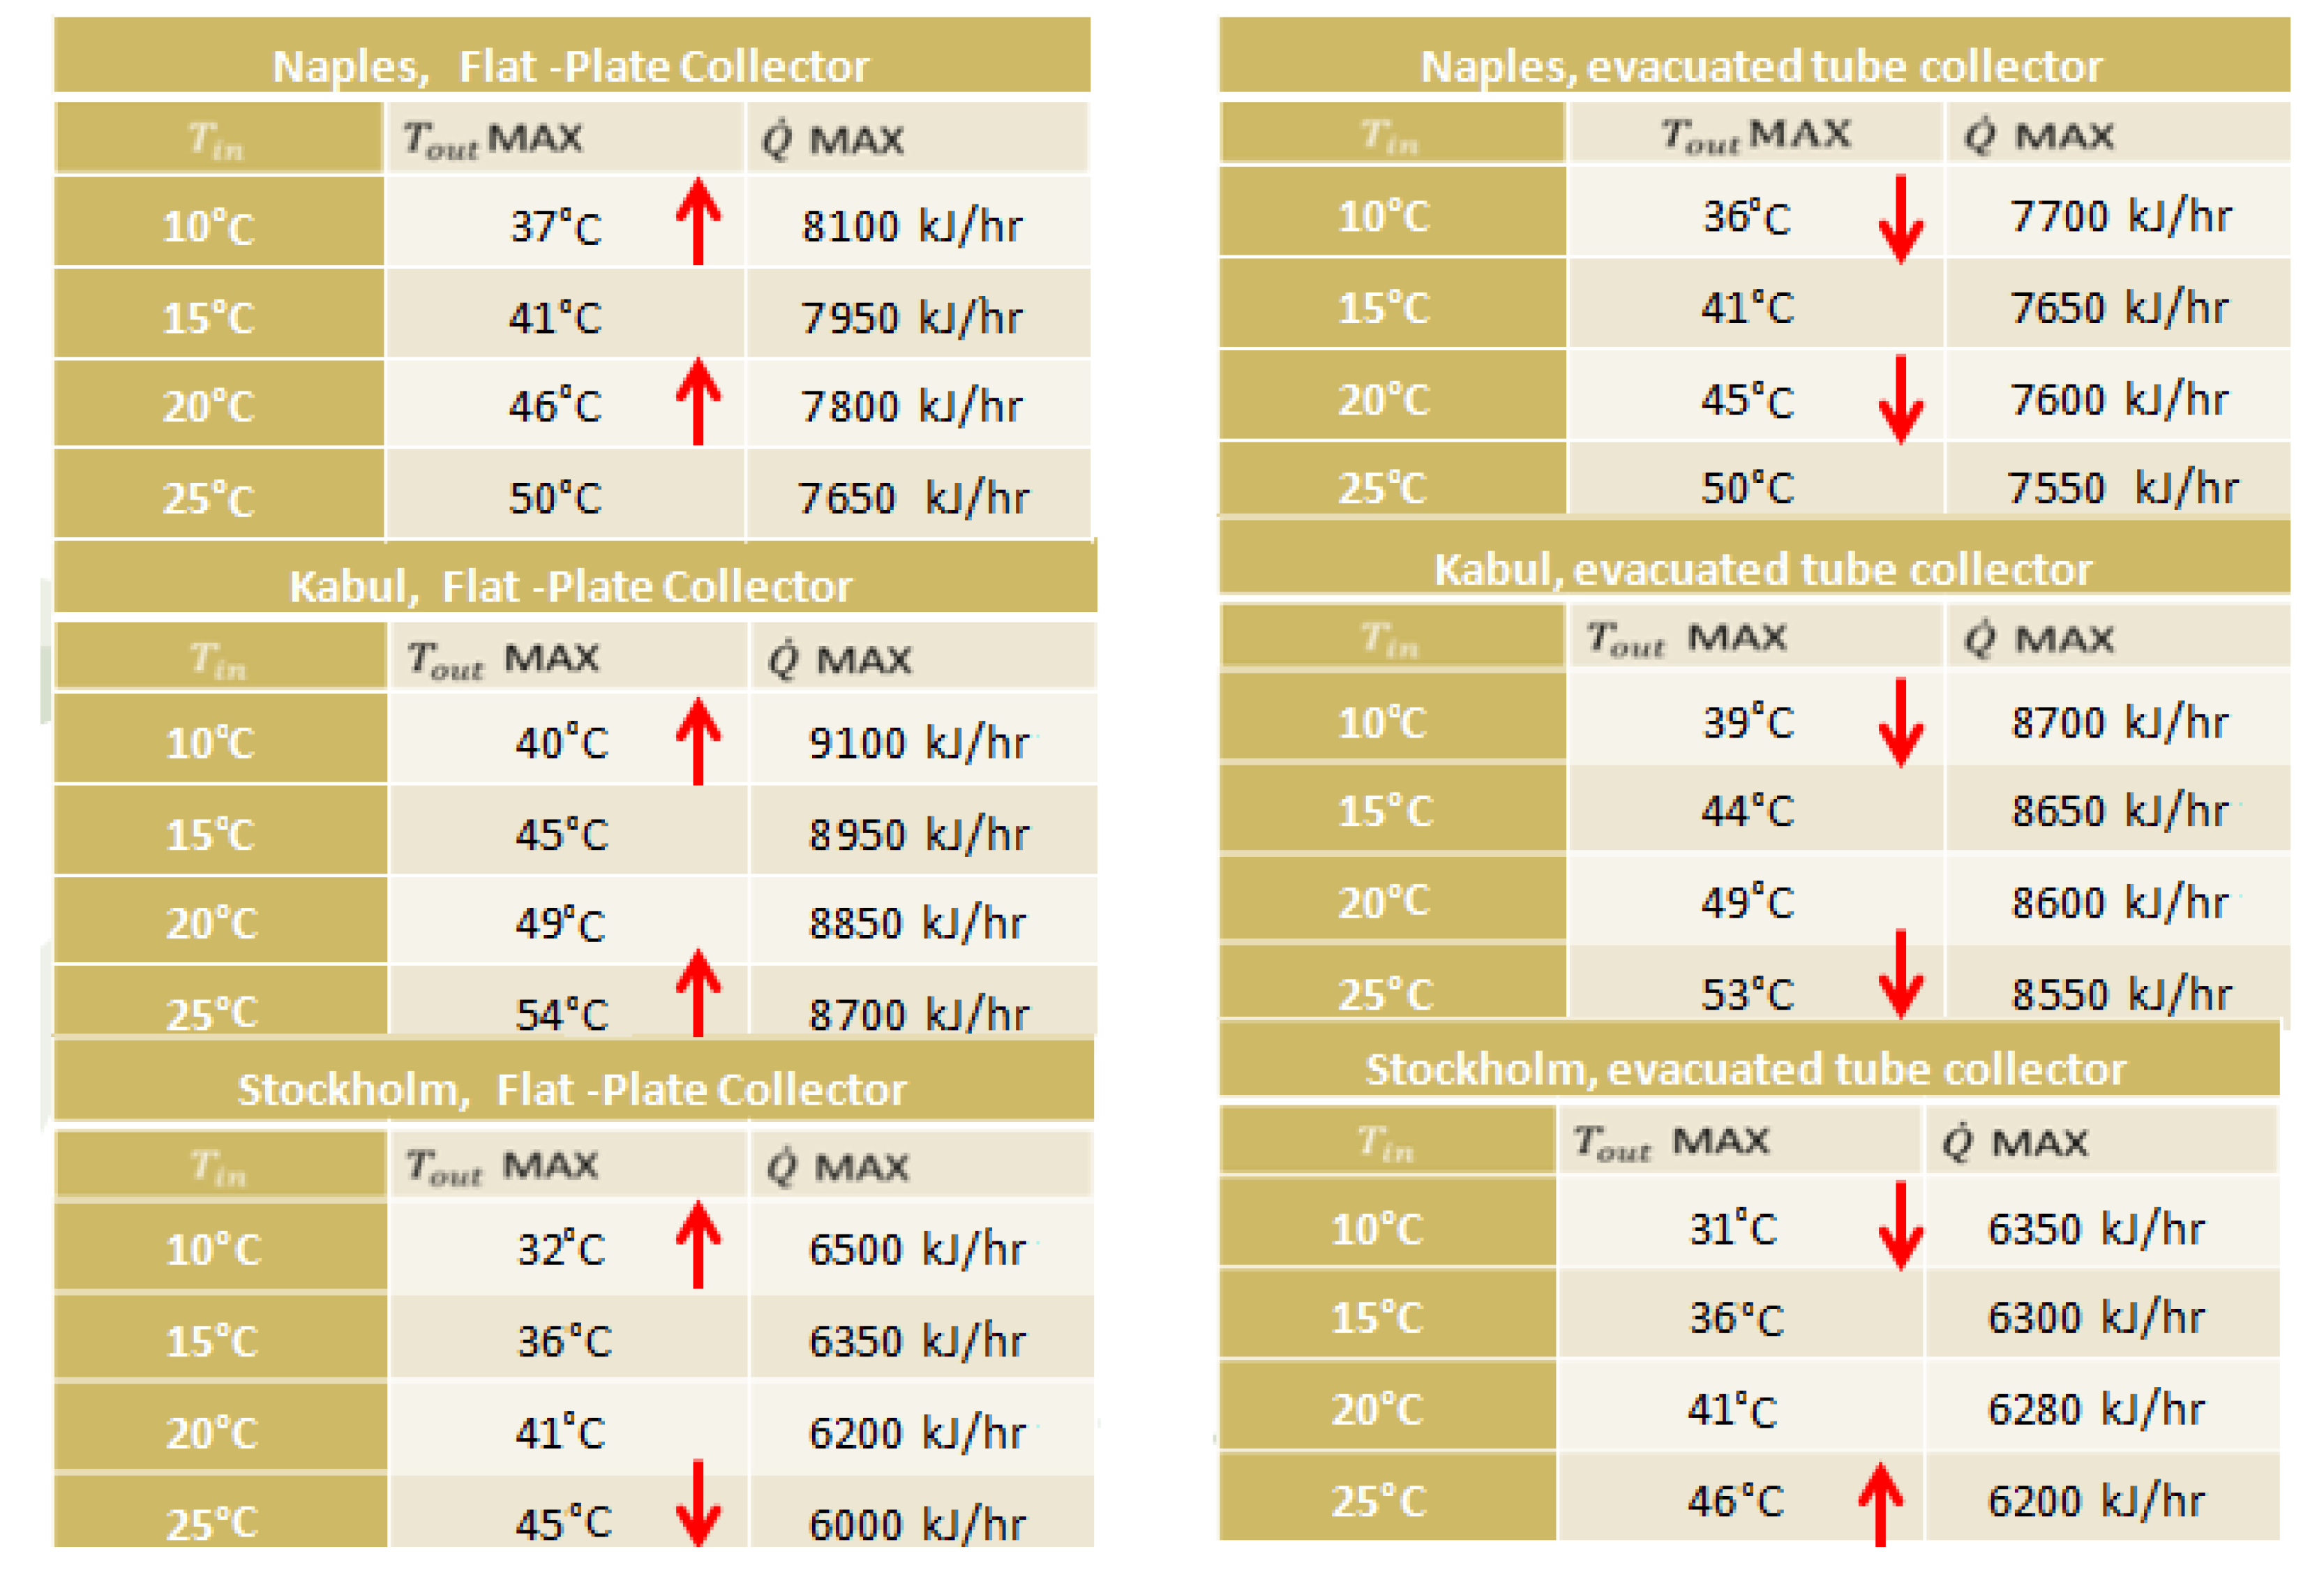
  • The outlet temperature and thermal power achieved by the ETC is higher if compared to the FPC in cold climates. In Stockholm, the thermal power increment achieved by a string of four ETCs with respect to four FPCs is located in the 12–22% range. In Naples and in Kabul, the thermal power increments are slightly reduced but nonetheless satisfying: 8.9–14.9% (Naples) and 6.6–13.5% (Stockholm). Indeed, based on the data collected, one can assert that the ETCs perform better than the FPCs since their outputs are superior all through the year including in winter climates. Hence, the ETC is the best selection for climatic conditions prevailing in Naples (Italy), Kabul (Afghanistan), and Stockholm (Sweden).

Author Contributions

Conceptualization, A.G. and C.M.; methodology, A.G.; software, C.M.; validation, A.G.; formal analysis, A.G. and C.M.; investigation, C.M.; resources, A.G.; data curation, A.G. and C.M.; writing—original draft preparation, C.M.; writing—review and editing, D.S.G. and E.G.; visualization, A.G.; supervision, A.G.; project administration, A.G. All authors have read and agreed to the published version of the manuscript.

Funding

This research received no external funding.

Conflicts of Interest

The authors declare no conflict of interest.

Nomenclature

Roman symbols
Aarea, m2
cspecific heat, J kg−1 K−1
Ffactor
Gincident radiant power flux, W m−2
Hheat exchange coefficient per unit, W m−2 K−1
m ˙ flow rate, kg s−1
Qenergy, kWh
Q ˙ power, W
Ttemperature, °C
Uglobal coefficient, W K−1
Greek symbols
αplate absorption coefficient, -
η efficiency of the collector, -
Τglass transmission coefficient, -
Subscripts
aambient
ccollector
g-aglass-ambient
ifluid inlet at the collector
Lthermal losses
maxat maximum
outoutlet at the collector
pconstant pressure
p-g,cplate-glass conductive
p-g,rplate-glass irradiative
Rheat removal
uuseful

References

  1. Le, T.H.; Chang, Y.; Park, D. Renewable and Nonrenewable Energy Consumption, Economic Growth, and Emissions: International Evidence. Energy J. 2020, 41. [Google Scholar] [CrossRef]
  2. Greco, A.; Mastrullo, R.; Palombo, A. R407C as an alternative to R22 in vapour compression plant: An experimental study. Int. J. Energy Res. 1997, 21, 1087–1098. [Google Scholar] [CrossRef]
  3. Greco, A.; Vanoli, G.P. Experimental two-phase pressure gradients during evaporation of pure and mixed refrigerants in a smooth horizontal tube. Comparison with correlations. Heat Mass Transfer 2006, 42, 709–725. [Google Scholar] [CrossRef]
  4. Greco, A.; Vanoli, G.P. Flow boiling heat transfer with HFC mixtures in a smooth horizontal tube. Part II: Assessment of predictive methods. Exp. Therm. Fluid Sci. 2005, 29, 199–208. [Google Scholar] [CrossRef]
  5. Aprea, C.; Greco, A.; Maiorino, A.; Masselli, C.; Metallo, A. HFO1234yf as a drop-in replacement for R134a in domestic refrigerators: A life cycle climate performance analysis. Int. J. Heat Technol. 2016, 34, S212–S218. [Google Scholar] [CrossRef] [Green Version]
  6. Afridi, M.A.; Kehelwalatenna, S.; Naseem, I.; Tahir, M. Per capita income, trade openness, urbanization, energy consumption, and CO2 emissions: An empirical study on the SAARC Region. Environ. Sci. Pollut. Res. 2019, 26, 29978–29990. [Google Scholar] [CrossRef]
  7. Al-Ghussain, L. Global warming: Review on driving forces and mitigation. Environ. Prog. Sustain. Energy 2019, 38, 13–21. [Google Scholar] [CrossRef] [Green Version]
  8. Aprea, C.; Greco, A.; Maiorino, A.; Masselli, C. Analyzing the energetic performances of AMR regenerator working with different magnetocaloric materials: Investigations and viewpoints. Int. J. Heat Technol. 2017, 35, S383–S390. [Google Scholar] [CrossRef]
  9. Aprea, C.; Greco, A.; Maiorino, A.; Masselli, C. The environmental impact of solid-state materials working in an active caloric refrigerator compared to a vapor compression cooler. Int. J. Heat Technol. 2018, 36, 1155–1162. [Google Scholar] [CrossRef]
  10. Aprea, C.; Greco, A.; Maiorino, A.; Masselli, C. The use of barocaloric effect for energy saving in a domestic refrigerator with ethylene-glycol based nanofluids: A numerical analysis and a comparison with a vapor compression cooler. Energy 2020, 190, 116404. [Google Scholar] [CrossRef]
  11. Aprea, C.; Greco, A.; Maiorino, A.; Masselli, C. The employment of caloric-effect materials for solid-state heat pumping. Int. J. Refrig. 2020, 109, 1–11. [Google Scholar] [CrossRef]
  12. Franzén, I.; Nedar, L.; Andersson, M. Environmental Comparison of Energy Solutions for Heating and Cooling. Sustainability 2019, 11, 7051. [Google Scholar] [CrossRef] [Green Version]
  13. Aprea, C.; Cardillo, G.; Greco, A.; Maiorino, A.; Masselli, C. A rotary permanent magnet magnetic refrigerator based on AMR cycle. Applied Thermal Engineering 2016, 101, 699–703. [Google Scholar] [CrossRef]
  14. Brown, D.R.; Stout, T.B.; Dirks, J.A.; Fernandez, N. The prospects of alternatives to vapor compression technology for space cooling and food refrigeration applications. Energy Eng. 2012, 109, 7–20. [Google Scholar] [CrossRef] [Green Version]
  15. Brown, J.S.; Domanski, P.A. Review of alternative cooling technologies. Appl. Therm. Eng. 2014, 64, 252–262. [Google Scholar] [CrossRef]
  16. Goetzler, W.; Zogg, R.; Young, J.; Johnson, C. Alternatives to vapor-compression HVAC technology. ASHRAE J. 2014, 56, 12. [Google Scholar]
  17. Rosiek, S.; Batlles, F.J. Renewable energy solutions for building cooling, heating and power system installed in an institutional building: Case study in southern Spain. Renew. Sustain. Energy Rev. 2013, 26, 147–168. [Google Scholar] [CrossRef]
  18. Moretti, E.; Bonamente, E.; Buratti, C.; Cotana, F. Development of innovative heating and cooling systems using renewable energy sources for non-residential buildings. Energies 2013, 6, 5114–5129. [Google Scholar] [CrossRef]
  19. D′Agostino, D.; Esposito, F.; Greco, A.; Masselli, C.; Minichiello, F. The Energy Performances of a Ground-to-Air Heat Exchanger: A Comparison Among Köppen Climatic Areas. Energies 2020, 13, 2895. [Google Scholar] [CrossRef]
  20. D′Agostino, D.; Esposito, F.; Greco, A.; Masselli, C.; Minichiello, F. Parametric Analysis on an Earth-to-Air Heat Exchanger Employed in an Air Conditioning System. Energies 2020, 13, 2925. [Google Scholar] [CrossRef]
  21. Kabir, E.; Kumar, P.; Kumar, S.; Adelodun, A.A.; Kim, K. Solar Energy: Potential and Future Prospects. Renew. Energy Sustain. Energy 2018, 82, 894–900. [Google Scholar] [CrossRef]
  22. Ge, T.S.; Wang, R.Z.; Xu, Z.Y.; Pan, Q.W.; Du, S.; Chen, X.M.; Ma, T.; Wu, X.N.; Sun, X.L.; Chen, J.F. Solar heating and cooling: Present and future development. Renew. Energy 2018, 126, 1126–1140. [Google Scholar] [CrossRef]
  23. Quiñones, G.; Felbol, C.; Valenzuela, C.; Cardemil, J.M.; Escobar, R.A. Analyzing the potential for solar thermal energy utilization in the Chilean copper mining industry. Sol. Energy 2020, 197, 292–310. [Google Scholar] [CrossRef]
  24. Fahrenbruch, A.; Bube, R. Fundamentals of Solar Cells: Photovoltaic Solar Energy Conversion; Elsevier Books: Amsterdam, The Netherlands, 2012. [Google Scholar]
  25. Razali, N.F.M.; Fudholi, A.; Ruslan, M.H.; Sopian, K. Review of water-nanofluid based photovoltaic/thermal (PV/T) systems. Int. J. Electr. Comput. Eng. 2019, 9, 134. [Google Scholar] [CrossRef]
  26. What Is TRNSYS. Available online: http://www.trnsys.com/ (accessed on 13 May 2020).
  27. Ibrik, I.; Abusafa, A.; Mansour, L. Experimental Analysis of Different Solar Water Heating Systems according to Palestinian Environmental Conditions. Int. J. Eng. Res. Technol. 2019, 12, 1901–1906. [Google Scholar]
  28. Ucar, A.; Inalli, M. Thermal and economical analysis of a central solar heating system with underground seasonal storage in Turkey. Renew. Energy 2005, 30, 1005–1019. [Google Scholar] [CrossRef]
  29. Ucar, A.; Inalli, M. Thermal and economic comparisons of solar heating systems with seasonal storage used in building heating. Renew. Energy 2008, 33, 2532–2539. [Google Scholar] [CrossRef]
  30. Tian, Z.; Zhang, S.; Deng, J.; Fan, J.; Huang, J.; Kong, W.; Furbo, S. Large-scale solar district heating plants in Danish smart thermal grid: Developments and recent trends. Energy Convers. Manag. 2019, 189, 67–80. [Google Scholar] [CrossRef]
  31. Lan, B.; Tian, Z.; Niu, J.; Wang, W.; Lu, S. Applicability analysis of solar heating system in China based on a reliability-based optimization method for auxiliary heater capacity. Sustain. Cities Soc. 2020, 53, 101930. [Google Scholar] [CrossRef]
  32. Li, Z.; Xu, Y. Applicability Analysis of Solar District Heating in North Rural Areas. In IOP Conference Series: Earth and Environmental Science; IOP Publishing: Bristol, UK, 2019; Volume 238, p. 012084. [Google Scholar]
  33. Anthony, M.D.; Lee, B.W. Inhibited Ethylene and Propylene Glycols for Corrosion and Freeze Protection in Water-Based HVAC Systems. ASHRAE Trans. 1997, 103, 446. [Google Scholar]
  34. Maraj, A.; Londo, A.; Firat, C.; Gebremedhin, A. Comparison of the energy performance between flat plate and heat pipe evacuated tube collectors for solar water heating system under Mediterranean climate conditions. J. Sustain. Dev. Energy Water Environ. Syst. 2019, 7, 87–100. [Google Scholar] [CrossRef] [Green Version]
  35. Miloştean, D.; Flori, M. An overview on the flat-plate solar collectors and their thermal efficiency. Ann. Fac. Eng. Hunedoara 2017, 15, 123–128. [Google Scholar]
  36. Zambolin, E.; Del Col, D. Experimental analysis of thermal performance of flat plate and evacuated tube solar collectors in stationary standard and daily conditions. Sol. Energy 2010, 84, 1382–1396. [Google Scholar] [CrossRef]
  37. Ayompe, L.M.; Duffy, A.; Mc Keever, M.; Conlon, M.; McCormack, S.J. Comparative field performance study of flat plate and heat pipe evacuated tube collectors (ETCs) for domestic water heating systems in a temperate climate. Energy 2011, 36, 3370–3378. [Google Scholar] [CrossRef] [Green Version]
  38. Mehmood, A.; Waqas, A.; Said, Z.; Rahman, S.M.A.; Akram, M. Performance evaluation of solar water heating system with heat pipe evacuated tubes provided with natural gas backup. Energy Rep. 2019, 5, 1432–1444. [Google Scholar] [CrossRef]
  39. del Mar Casanovas-Rubio, M.; Armengou, J. Decision-making tool for the optimal selection of a domestic water-heating system considering economic, environmental and social criteria: Application to Barcelona (Spain). Renew. Sustain. Energy Rev. 2018, 91, 741–753. [Google Scholar] [CrossRef]
  40. Klevinskis, A.; Bucinskas, V. Analysis of a flat-plate solar collector. Moksl. Liet. Ateitis Sci. Future Lith. 2011, 3, 39–43. [Google Scholar] [CrossRef]
  41. Frid, S.E.; Lisitskaya, N.V. State-of-the-Art Solar Collectors: Typical Parameters and Trends. Appl. Sol. Energy 2018, 54, 279–286. [Google Scholar] [CrossRef]
  42. Bliss, R.W., Jr. The derivations of several “plate-efficiency factors” useful in the design of flat-plate solar heat collectors. Sol. Energy 1959, 3, 55–64. [Google Scholar] [CrossRef]
Figure 1. Schematic of a flat-plate collector.
Climate 08 00078 g001
Figure 2. Schematic of an evacuated-tube collector.
Climate 08 00078 g002
Figure 3. (a) Longitudinal and (b) transversal sections of the tube.
Climate 08 00078 g003
Figure 4. Heat transfer scheme for transversal section of the evacuated U-tube collector.
Climate 08 00078 g004
Figure 5. Evacuated heat pipe solar collector.
Climate 08 00078 g005
Figure 6. Schematics of the components used in the investigations on single collectors for flat-plate (a) and evacuated-tube (b) collectors.
Climate 08 00078 g006
Figure 7. Schematics of the strings of the series of four flat-plate (a) and evacuated-tube (b) collectors.
Climate 08 00078 g007
Figure 8. One-year outlet temperature from (a) flat-plate and (b) evacuated-tube collectors placed in the city of Naples when Ti = 25 °C.
Climate 08 00078 g008
Figure 9. One-year useful power given by (a) flat-plate and (b) evacuated-tube collectors placed in the city of Naples when Ti = 25 °C.
Climate 08 00078 g009
Figure 10. Daily outlet temperature and useful power registered for 25 December and 29 July, in (a) flat-plate and (b) evacuated-tube collectors placed in the city of Naples when Ti = 25 °C on 25 December; (c) flat-plate and (d) evacuated-tube collectors placed in the city of Naples when Ti = 25 °C on 29 July.
Climate 08 00078 g010aClimate 08 00078 g010b
Figure 11. Yearly maximum outlet temperature and useful power peak predicted, in the different climatic areas investigated by varying the temperature of the fluid inlet to the FPC and the ETC.
Climate 08 00078 g011
Figure 12. One-year outlet temperature of the string made of 4 (a) flat-plate and (b) evacuated-tube collectors placed in the city of Naples when Ti = 25 °C.
Climate 08 00078 g012
Figure 13. One-year useful power given by the string made of 4 (a) flat-plate and (b) evacuated-tube collectors placed in the city of Naples when Ti = 25 °C.
Climate 08 00078 g013
Figure 14. Daily outlet temperature and useful power registered for 25 December and 29 July, for the string of 4 (a) flat-plate and (b) evacuated-tube collectors placed in the city of Naples when Ti = 25 °C on 25 December; (c) flat-plate and (d) evacuated-tube collectors placed in the city of Naples when Ti = 25 °C on 29 July.
Climate 08 00078 g014aClimate 08 00078 g014b
Figure 15. Yearly maximum outlet temperature and useful power peak predicted, in the different climatic areas investigated by varying the temperature of the fluid inlet to the string of 4 FPCs and 4 ETCs.
Climate 08 00078 g015

