A Practical Review of the Laser-Heated Diamond Anvil Cell for University Laboratories and Synchrotron Applications


1
Diamond Light Source Ltd., Harwell Science and Innovation Campus, Didcot OX11 0DE, UK
2
ESRF—European Synchrotron Radiation Facility, 38000 Grenoble, France
*
Author to whom correspondence should be addressed.
†
Current address: Sorbonne Université, Muséum National d’Histoire Naturelle, UMR CNRS 7590, Institut de Minéralogie, de Physique des Matériaux, et de Cosmochimie (IMPMC), 75005 Paris, France.
Crystals 2020, 10(6), 459; https://doi.org/10.3390/cryst10060459
Submission received: 24 April 2020
/
Revised: 12 May 2020
/
Accepted: 13 May 2020
/
Published: 1 June 2020
(This article belongs to the Special Issue Pressure-Induced Phase Transformations)
Abstract
:In the past couple of decades, the laser-heated diamond anvil cell (combined with in situ techniques) has become an extensively used tool for studying pressure-temperature-induced evolution of various physical (and chemical) properties of materials. In this review, the general challenges associated with the use of the laser-heated diamond anvil cells are discussed together with the recent progress in the use of this tool combined with synchrotron X-ray diffraction and absorption spectroscopy.
1. Introduction
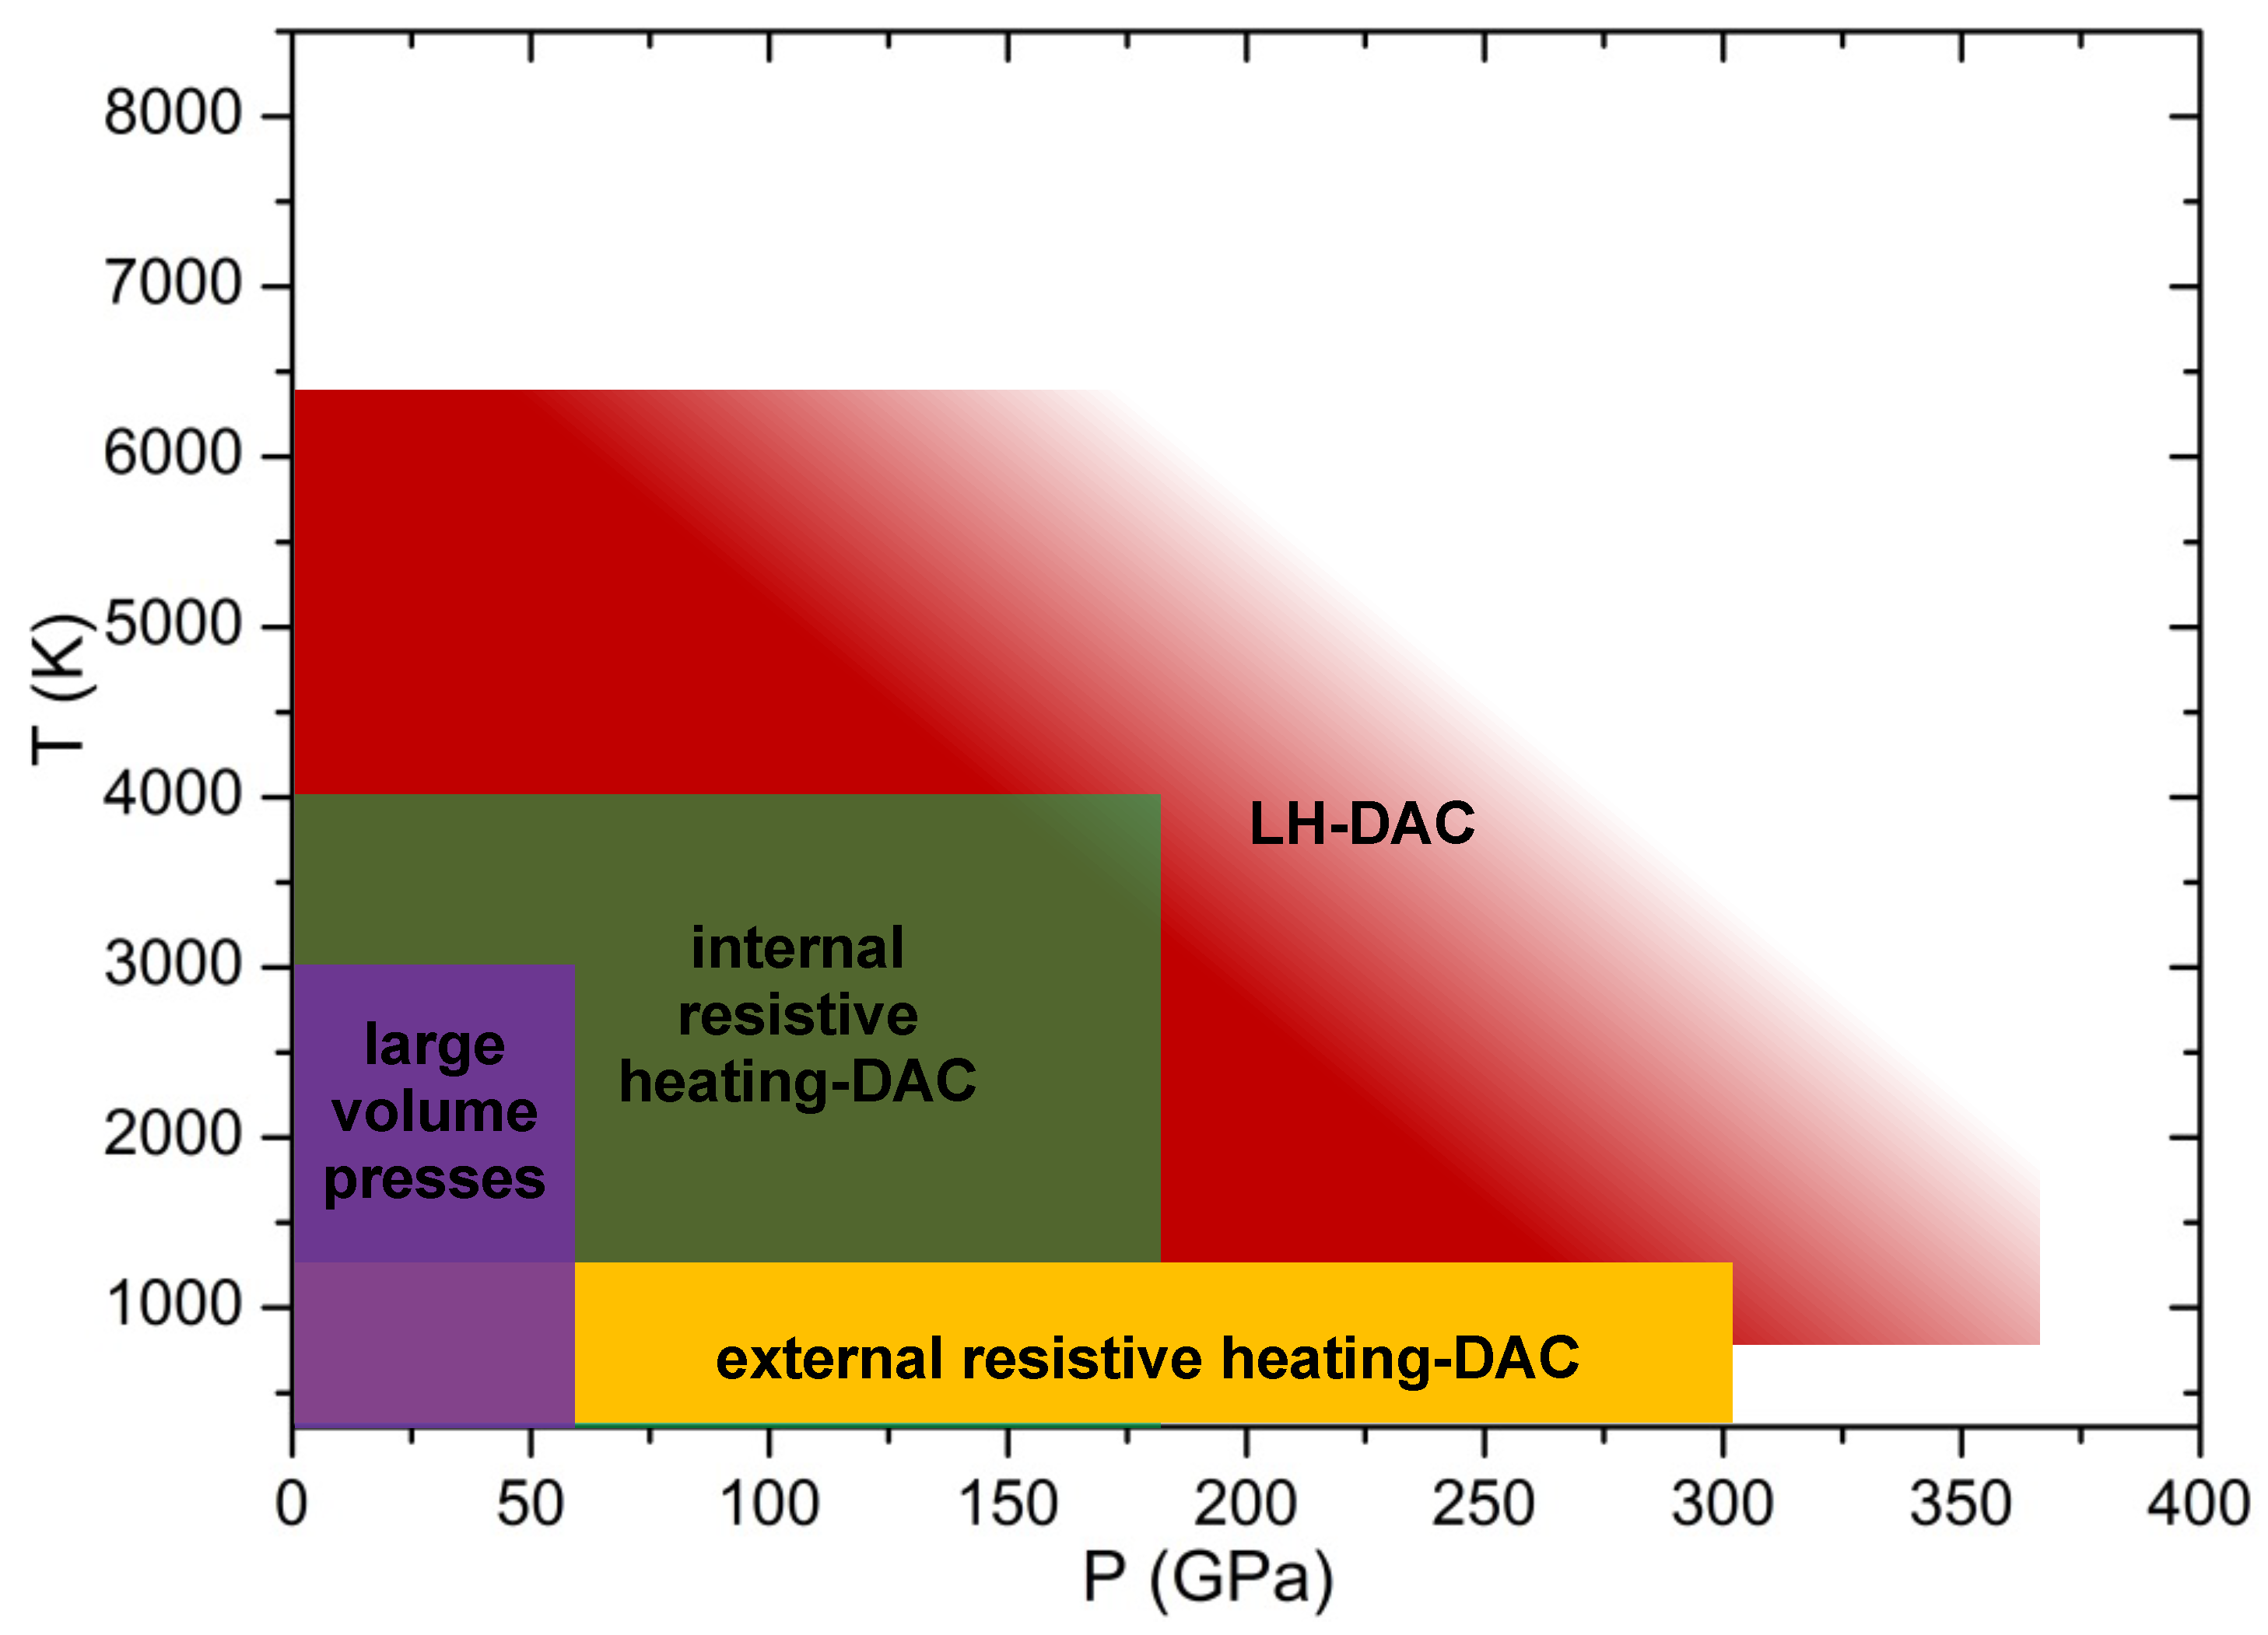
Since the pioneering work of Ming and Basset in the early 1970s, Reference [1] the laser-heated diamond anvil cell (LH-DAC) has become a powerful and routinely used tool for studying materials under extreme conditions of pressures (P) and temperatures (T) [2,3,4,5,6,7]. Up to now, it represents the only static technique allowing continuous access to a P-T domain ranging from ambient condition up to 300 GPa and 6000 K, respectively (see Figure 1) [8].
This technique takes advantage from the mechanical (being the hardest material found in nature) and optical properties of diamonds. In particular, thanks to diamond’s transparency in a wide range of wavelengths of the electromagnetic spectrum, it is possible to use the DAC together with: visible light (for sample visualization and spectroscopic methods), infrared light (IR; as heat source) and X and -rays (as probe for atomic, phononic, electronic and magnetic structure). Thanks to technological advancements, the range of in situ techniques now available to be used with LH-DAC has largely increased in recent years. In particular, LH-DAC Raman scattering, References [9,10,11,12,13] Nuclear Magnetic Resonance (NMR) [14] and Brillouin scattering [11,15,16] techniques are now available to be used within university laboratories. Several techniques are also available to be used combined with LH-DAC at third generation synchrotrons (both as permanent installation or using portable systems): X-ray diffraction (XRD), References [17,18,19,20,21,22,23] X-ray absorption (XAS), References [24,25,26,27,28,29,30] inelastic X-ray spectroscopy (IXS), References [31,32] X-ray fluorescence (XRF), Reference [33] Mssbauer spectroscopy (SMS) [34,35,36], X-ray transmission spectroscopy (XTM) [37] and nuclear forward and inelastic scattering (NFS and NIS) [35,38].
These techniques enable investigating in situ a wide variety of physical phenomena induced by the extreme P-T conditions: such as long and short order structural modifications, phase transitions, chemical reactions and thermal and electronic excitations. The use of fast synchrotron-based techniques, enables performing time-resolved analysis of the P-T-induced evolution of the sample, providing important insight on the actual dynamics of the observed transformations. Furthermore, thanks to technological advancements, it is now possible to combine multiple investigation techniques with LH-DAC. Therefore, several information can be obtained from the sample at the same time, providing a better picture of the observed evolution [11,12,36,39,40,41].
For these reasons, the LH-DAC is extensively used in various scientific fields, ranging from solid-state physics to geological science, engineering and chemistry.
Thanks to its versatility, the LH-DAC technique has started attracting scientists from different experiences and scientific backgrounds, not necessarily expert of this technique. The aim of this review is therefore to provide a general knowledge of the LH-DAC technique and, to discuss the various challenges associated with its use (such as: sample preparation, pressure and temperature metrology, etc.) in both university laboratories and synchrotron radiation facilities. As different groups are adopting different solutions (often conflicting with each other), in this review the state-of-the-art is presented in the most objective way as possible, in order to provide the reader with all the information needed to make his (her) own mind.
Finally, the last part of the review gives an overview of the advancements obtained combining LH-DAC with synchrotron-based XRD and XAS techniques. Although several references are provided in this final part, they represent only a selection (as it would be impossible to cite the plethora of works done using these techniques), therefore the reader is advised to independently look for more works to read for further information.
2. Experimental Methods
In this section, we will focus our attention on the general challenges encountered while performing experiments using LH-DAC. First of all, we will provide insights on DAC and samples preparation. We will then give an overview of the lasers and on the system geometries generally adopted to perform these experiments. Finally, we will provide details on the P and T metrologies associated with LH-DAC.
2.1. DAC and Sample Preparation
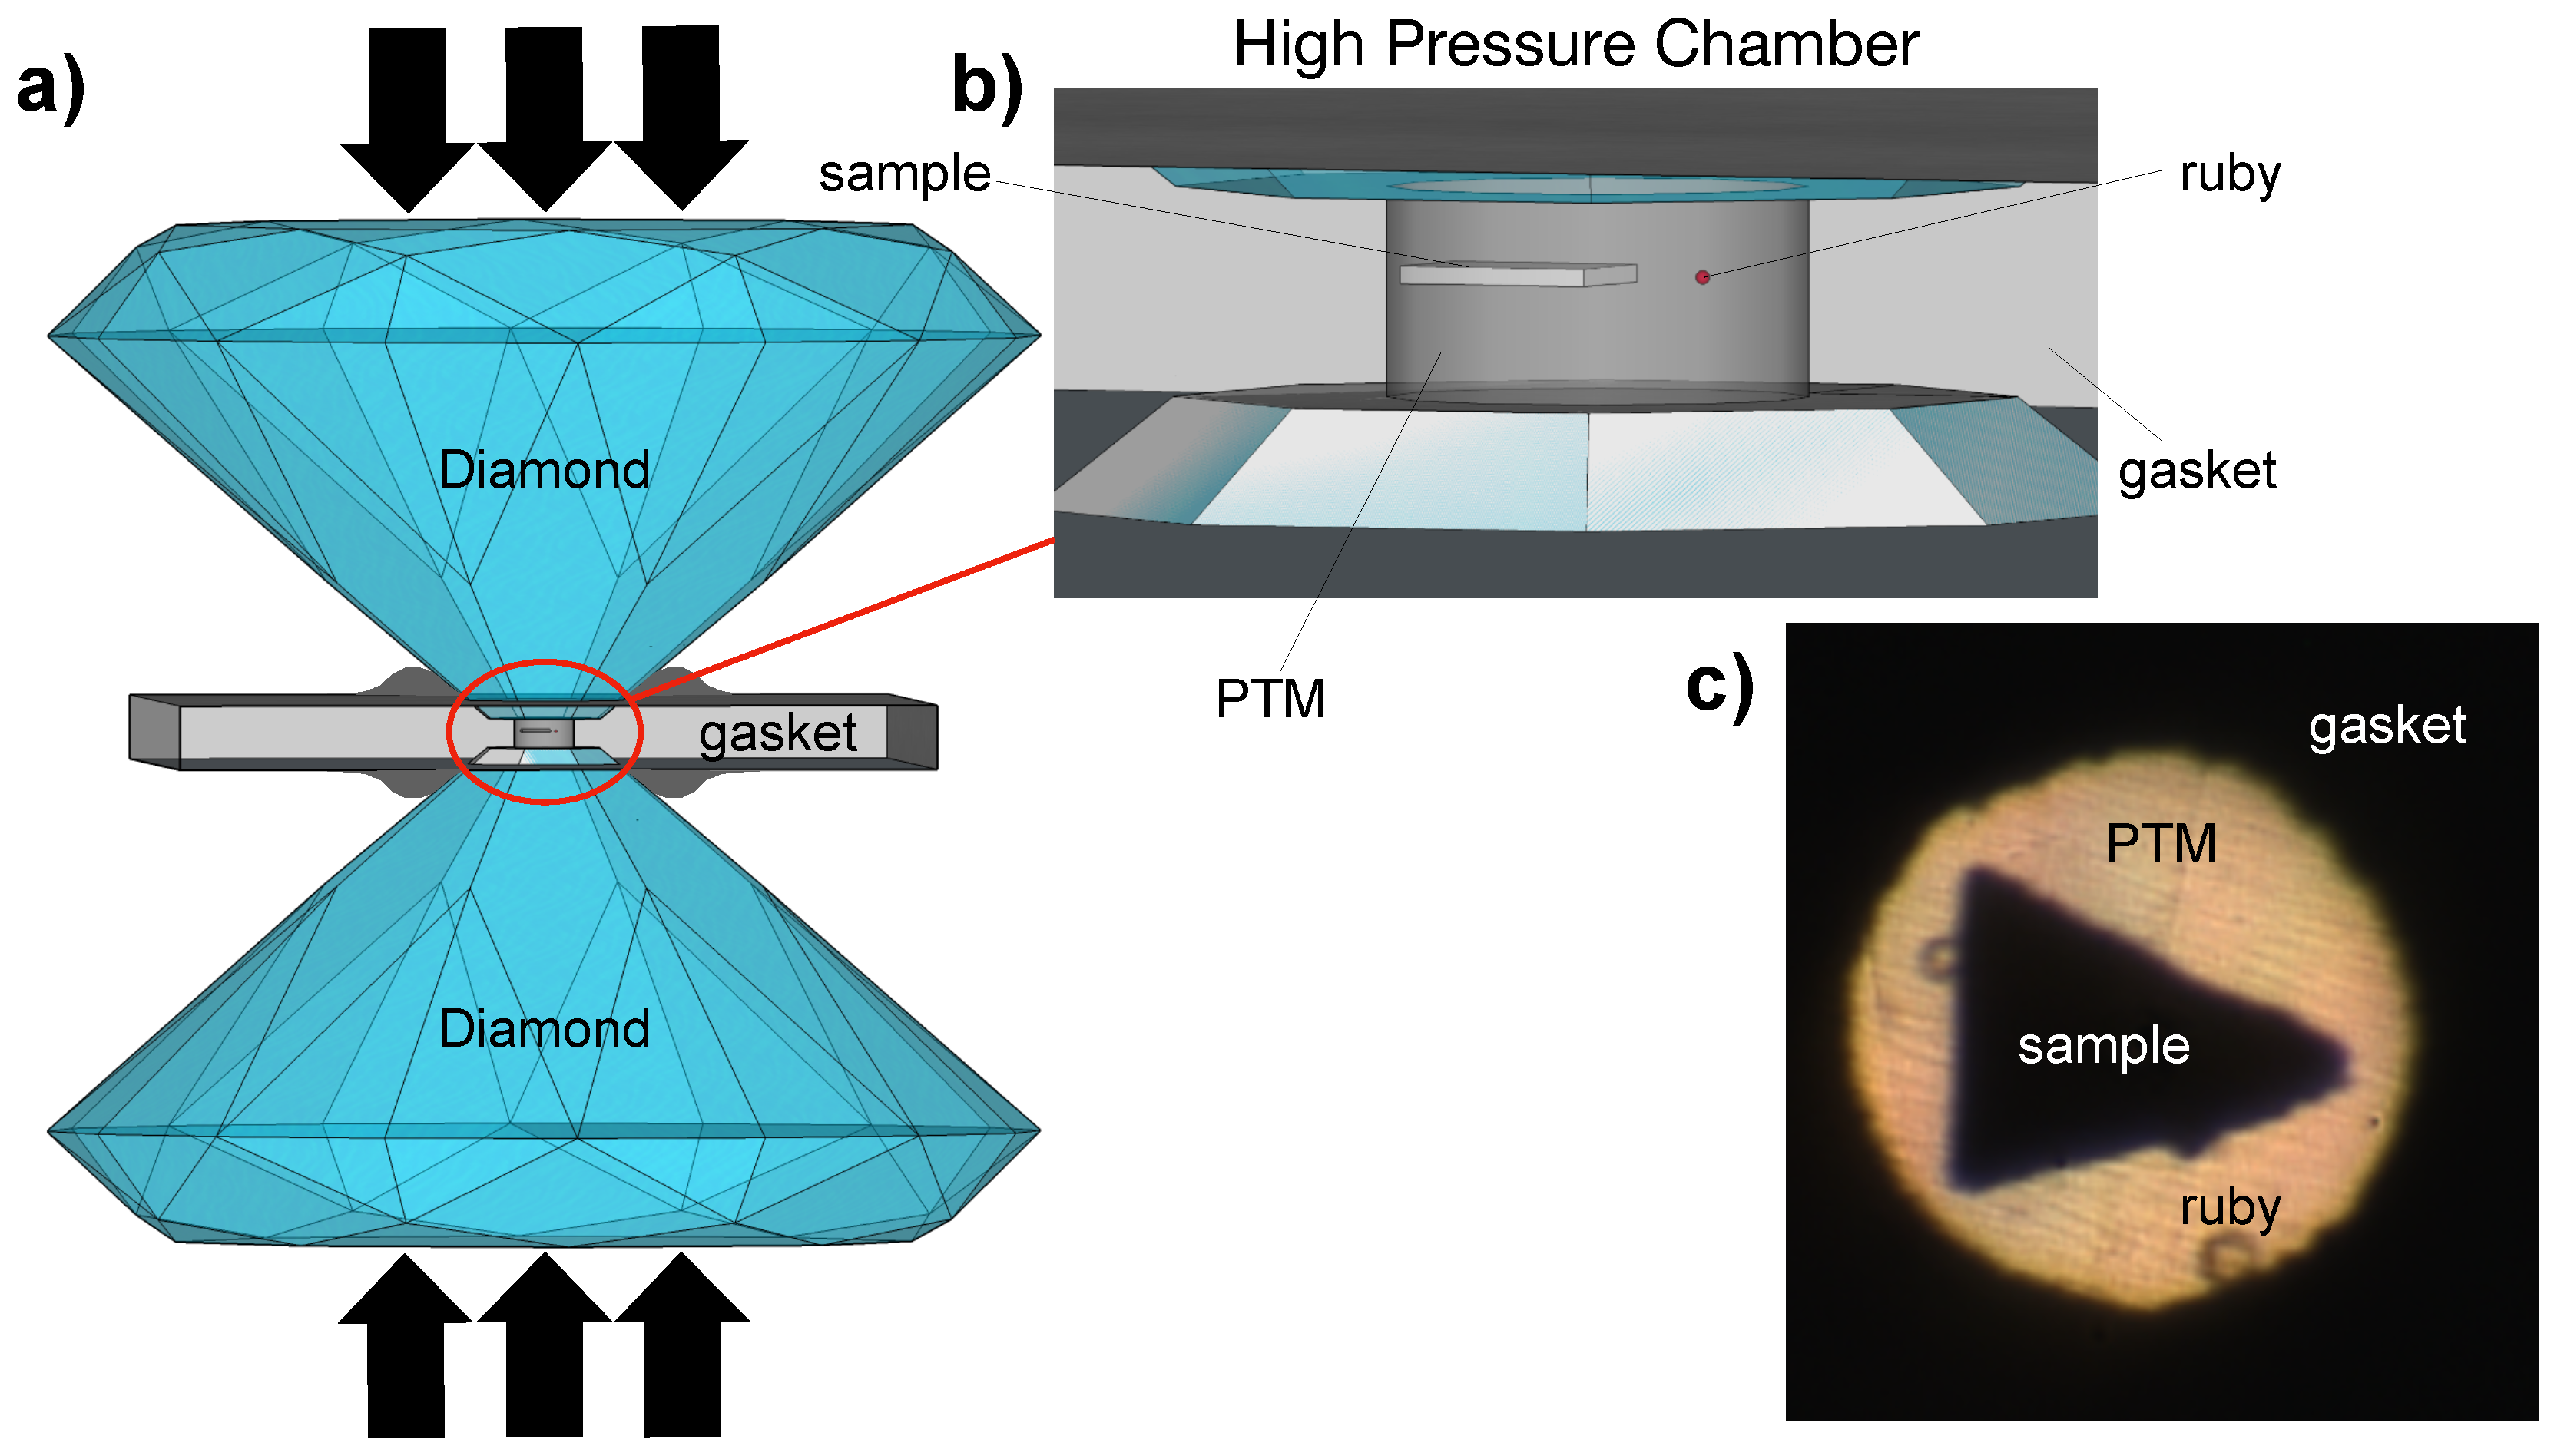
A generalized design and working concept of the DAC is represented in Figure 2. A metallic gasket (generally made of Re, W or Stainless Steel; Be gaskets are also used when lateral optical access is needed [60]) is placed between two gem-quality diamond anvils. The space between the two culets of the anvils and the gasket’s hole forms the cell high-pressure chamber, where the sample is loaded. The pressure on the sample is obtained by squeezing the two anvils toward each other. This is generally obtained using screws [61,62,63] or by inflating a metallic membrane [64]. As the pressure is defined by the force applied per surface area, the smaller the culet size of the diamonds, the higher the pressure that can be reached during the experiment for the same applied force.
Different DAC designs and diamond anvil types are used for different experiments. The choice, is mainly dictated by the experimental geometry needed by the adopted technique and the P-T range intended to reach. In particular, when performing LH-DAC experiments, the opening angle of the cell is generally maximized. Such a precaution eases the simultaneous access to the sample chamber of different optical paths (e.g., visible and IR lasers, X-rays, sample visualization, etc.), enabling several characterizations to be performed at the same time.
The geometry and nature of the diamonds also play an important role in DAC experiments. In particular, beveled diamonds are generally used to increase the pressure range accessible by a nominal culet size of the diamonds [65]. This is due to the increase in the deformation path the diamond can undergo before breaking while “cupping” under pressure [66]. Following a similar concept design, toroidal anvils have recently granted the access to the multi-megabar domain for static DAC experiments [67,68].
Despite the relatively high transparency of diamonds to light and X-rays, the radiation absorption of a pair of diamond anvils must be taken into account, as it may create a significant impediment to radiation transmission. For experiments requiring a wide cell opening and thinner diamond anvils (e.g., XAS or Pair Distribution Function (PDF) experiments), diamond and seat with an Boehler-Almax design are often chosen for their geometry [63]. Perforated diamonds can also be used to reduce the Compton scattering from the diamond [49,69,70] (although the presence of the perforation impedes the use of these anvils for laser-heating).
Finally, the crystalline nature of the diamonds also plays an important role for certain experimental techniques. In fact, the gem-quality diamonds generally used in standard DAC experiments are made from single crystals cut along certain crystallographic planes. Therefore, when these diamonds interact with an X-ray source, they produce intense single-crystal diffraction spots. For most synchrotron techniques combined with DAC, the presence of this spots does not cause any particular problem (aside from possible detector saturation). However, when using XAS techniques, these Bragg peaks cause the presence of “glitches” in the spectra, hindering the quality of the collected data and compromising any possible analysis [71]. Recently, new nano-polycrystalline diamonds (NPD) have been developed and become a major breakthrough for XAS techniques coupled with DAC [71,72]. In fact, the continuous and broad diffraction produced by these diamonds results into a monotonic and smooth background that does not affect the XAS spectrum. Furthermore, the NPD maintain a high degree of optical transparency in the visible and IR region of the electromagnetic spectrum and are harder than standard diamonds [72]. A pressure transmitting medium (PTM) is generally loaded together with the sample in the high-pressure chamber of the DAC. The combined action of PTM and pre-indented gasket is to transform the uniaxial compression exercised by the diamonds compression to a quasi-hydrostatic one, homogenizing the stresses and the strain acting upon the sample under compression. PTM are generally chosen among materials with low shear strength (fluids or soft solids) and are loaded in the high-pressure chamber of the DAC to completely embed the sample.
Generally, for measurements performed at ambient T, aiming to characterize the mechanical properties or the compression curve of a material, it is important to reproduce the most hydrostatic conditions as possible. For this purpose, gases represent the ideal pressure media [73]. Among the available gases, He is considered to be the best PTM, as it presents the highest freezing pressure (11.6 GPa at 300 K) [74] and, even in its solid phase, it releases stress through re-crystallization [75].
The choice of the right PTM becomes particularly critical for LH-DAC experiments. This is mainly due to three reasons: (i) the extremely high thermal conductivity of the diamonds causes an important heat loss (it is practically impossible heating the sample up if it touches the diamonds); (ii) increased probability of T-induced chemical reactions between the PTM and the sample or caused by the carbon diffusion due to the Soret effect [76]; (iii) sample confinement (especially for melting curve and liquid characterization experiments).
Pressure media with high melting points and low thermal conductivity (such as KCl, NaCl, MgO, LiF, etc.) are generally used to insulate the sample from the diamond anvils. In particular, it is important to choose a PTM whose insulating conditions will not be affected by the P-T conditions reached during the experiment (no big re-crystallization and no extensive melting) [77].
Undesired chemical reactions present one of the most frequent issues encountered in LH-DAC experiments and have been often the cause of data misinterpretation [29,78,79]. It is, therefore, vital to choose PTM that remains inert under such extreme P-T conditions. It is also important to reduce any possible water content in the PTM that can cause oxidation at high T. This is generally done by keeping the PTM in an oven (or vacuum oven) before and after the actual loading (once loaded in the cell) [6,72].
A good sample confinement is ideal to obtain good LH-DAC data [80]. In fact, it has been shown to be the perfect recipe to achieve high thermal and chemical insulation of the sample. Furthermore, it reduces the risk of diffusion of the molten samples, facilitating experiments aimed to characterize melting temperatures and liquid structures at extreme P-T conditions [59,78,81,82]. For this reason, several groups are now dedicating lots of time optimizing the sample loading technique and geometry, taking advantage from the new advances in technology. PTM and samples can now be cut into specific shapes using FIB (Focused Ion Beam) [59,82] or femto-laser cutting techniques [29,83,84] and, the obtained parts can be loaded in the DAC using special robotic micro-manipulators [85]. Special protective layers (coating the diamond’s culets and/or the gasket inner walls) have also been used to reduce any chemical reactions between the DAC high-pressure chamber and the sample (PTM) [78,86,87].
PTM can also be especially chosen for the possible chemical reactions they can have with the sample. Typical examples are experiments performed to create new metal-gases compounds e.g., FeH,88] FeN [89,90] or to study the incorporation of noble gases in solids such as Kr in (MgFe)O [91]. During these experiments, the sample is loaded in the DAC with an excess of the gas it will be intercalated with. Once the sample is heated for several minutes at a certain P, a portion of the gas (also acting as PTM) will react with the sample, forming the new compound.
2.2. Laser-Heating System: Concept Design and Associated Issues
Generally, as discussed in Refs. [18,26], the design of a laser-heating system for DAC experiments is defined by three main components: (i) the laser-beam delivery optics (to heat the sample), (ii) the sample imaging and T measurement optics and (iii) the coupling of the setup with the desired experimental analysis technique. As the aim of this review is to talk about the challenges associated with the use of the LH-DAC and therefore common to all the possible experimental analysis techniques, we will first focus our attention on the first two components. The final component will be discussed in the last paragraphs applied to the specific cases of synchrotron XRD and XAS techniques.
2.2.1. Lasers
To achieve temperatures of the order of thousands of Kelvins, high power (50–200 W) lasers need to be focused on the sample surface. Two different types of laser systems are generally used combined with the DAC. Nominally: (i) near-IR lasers such as Nd:YAG (Nd doped yttrium aluminum garnet), Nd:YLF (Nd yttrium lithium fluoride) or orthovanadate crystals and (ii) CO lasers. The choice between the two different types of lasers depends on the nature of the sample needing characterization.
In particular, near-IR lasers (wavelength = 1.064 m) are generally used to heat metallic and semiconducting materials [18,92,93], where the laser absorption of the material is defined by the interaction between the photons of the laser and the mainly free (or bounded) electrons of the metal (semiconductor). The excited electrons move from the conduction band to higher energy states and, the collisions between those excited electrons and the lattice phonons creates the thermal energy [7,94]. When used in combination with DAC to produce extreme T, these lasers need to be tightly focused, as they are generally weakly absorbed by the materials. The obtained focused beam has a minimal penetration depth into the material, leading to radial and axial temperature gradients of the order of hundreds of kelvins per m [95,96,97]. The axial thermal gradient is generally minimized by heating the sample from both sides (double-sided heating) [5,92,98,99], but it can also be minimized by using multimode lasers [7]. The radial thermal gradient can be minimized by slightly defocusing the lasers (towards the sample position: to avoid drilling the diamond base) or, by using special optics converting the standard Gaussian profile of the laser (TEM) into a flat-top one [100]. In this way, it is possible to obtain a relatively large and uniform hotspot on the sample surface.
The CO lasers (wavelength = 10.6 m) are specially used to heat optical transparent minerals, organic materials and oxides [3,7]. In fact, the phononic frequencies of those materials are of the same order of the one emitted by the CO lasers. The emitted light is therefore directly absorbed by the lattice and the resulting vibration develops thermal energy. Due to the nature of the CO laser emission, special optics, in particular, special transmissive (e.g., ZnSe lenses) and reflective (e.g., Cu total reflectors) collimators must be used to focus and reflect the laser, respectively [3,15]. Furthermore, the penetration depth of the CO laser into the material is large (often larger than the sample itself). Therefore, axial thermal gradients are basically nonexistent and only one laser is needed to heat the sample.
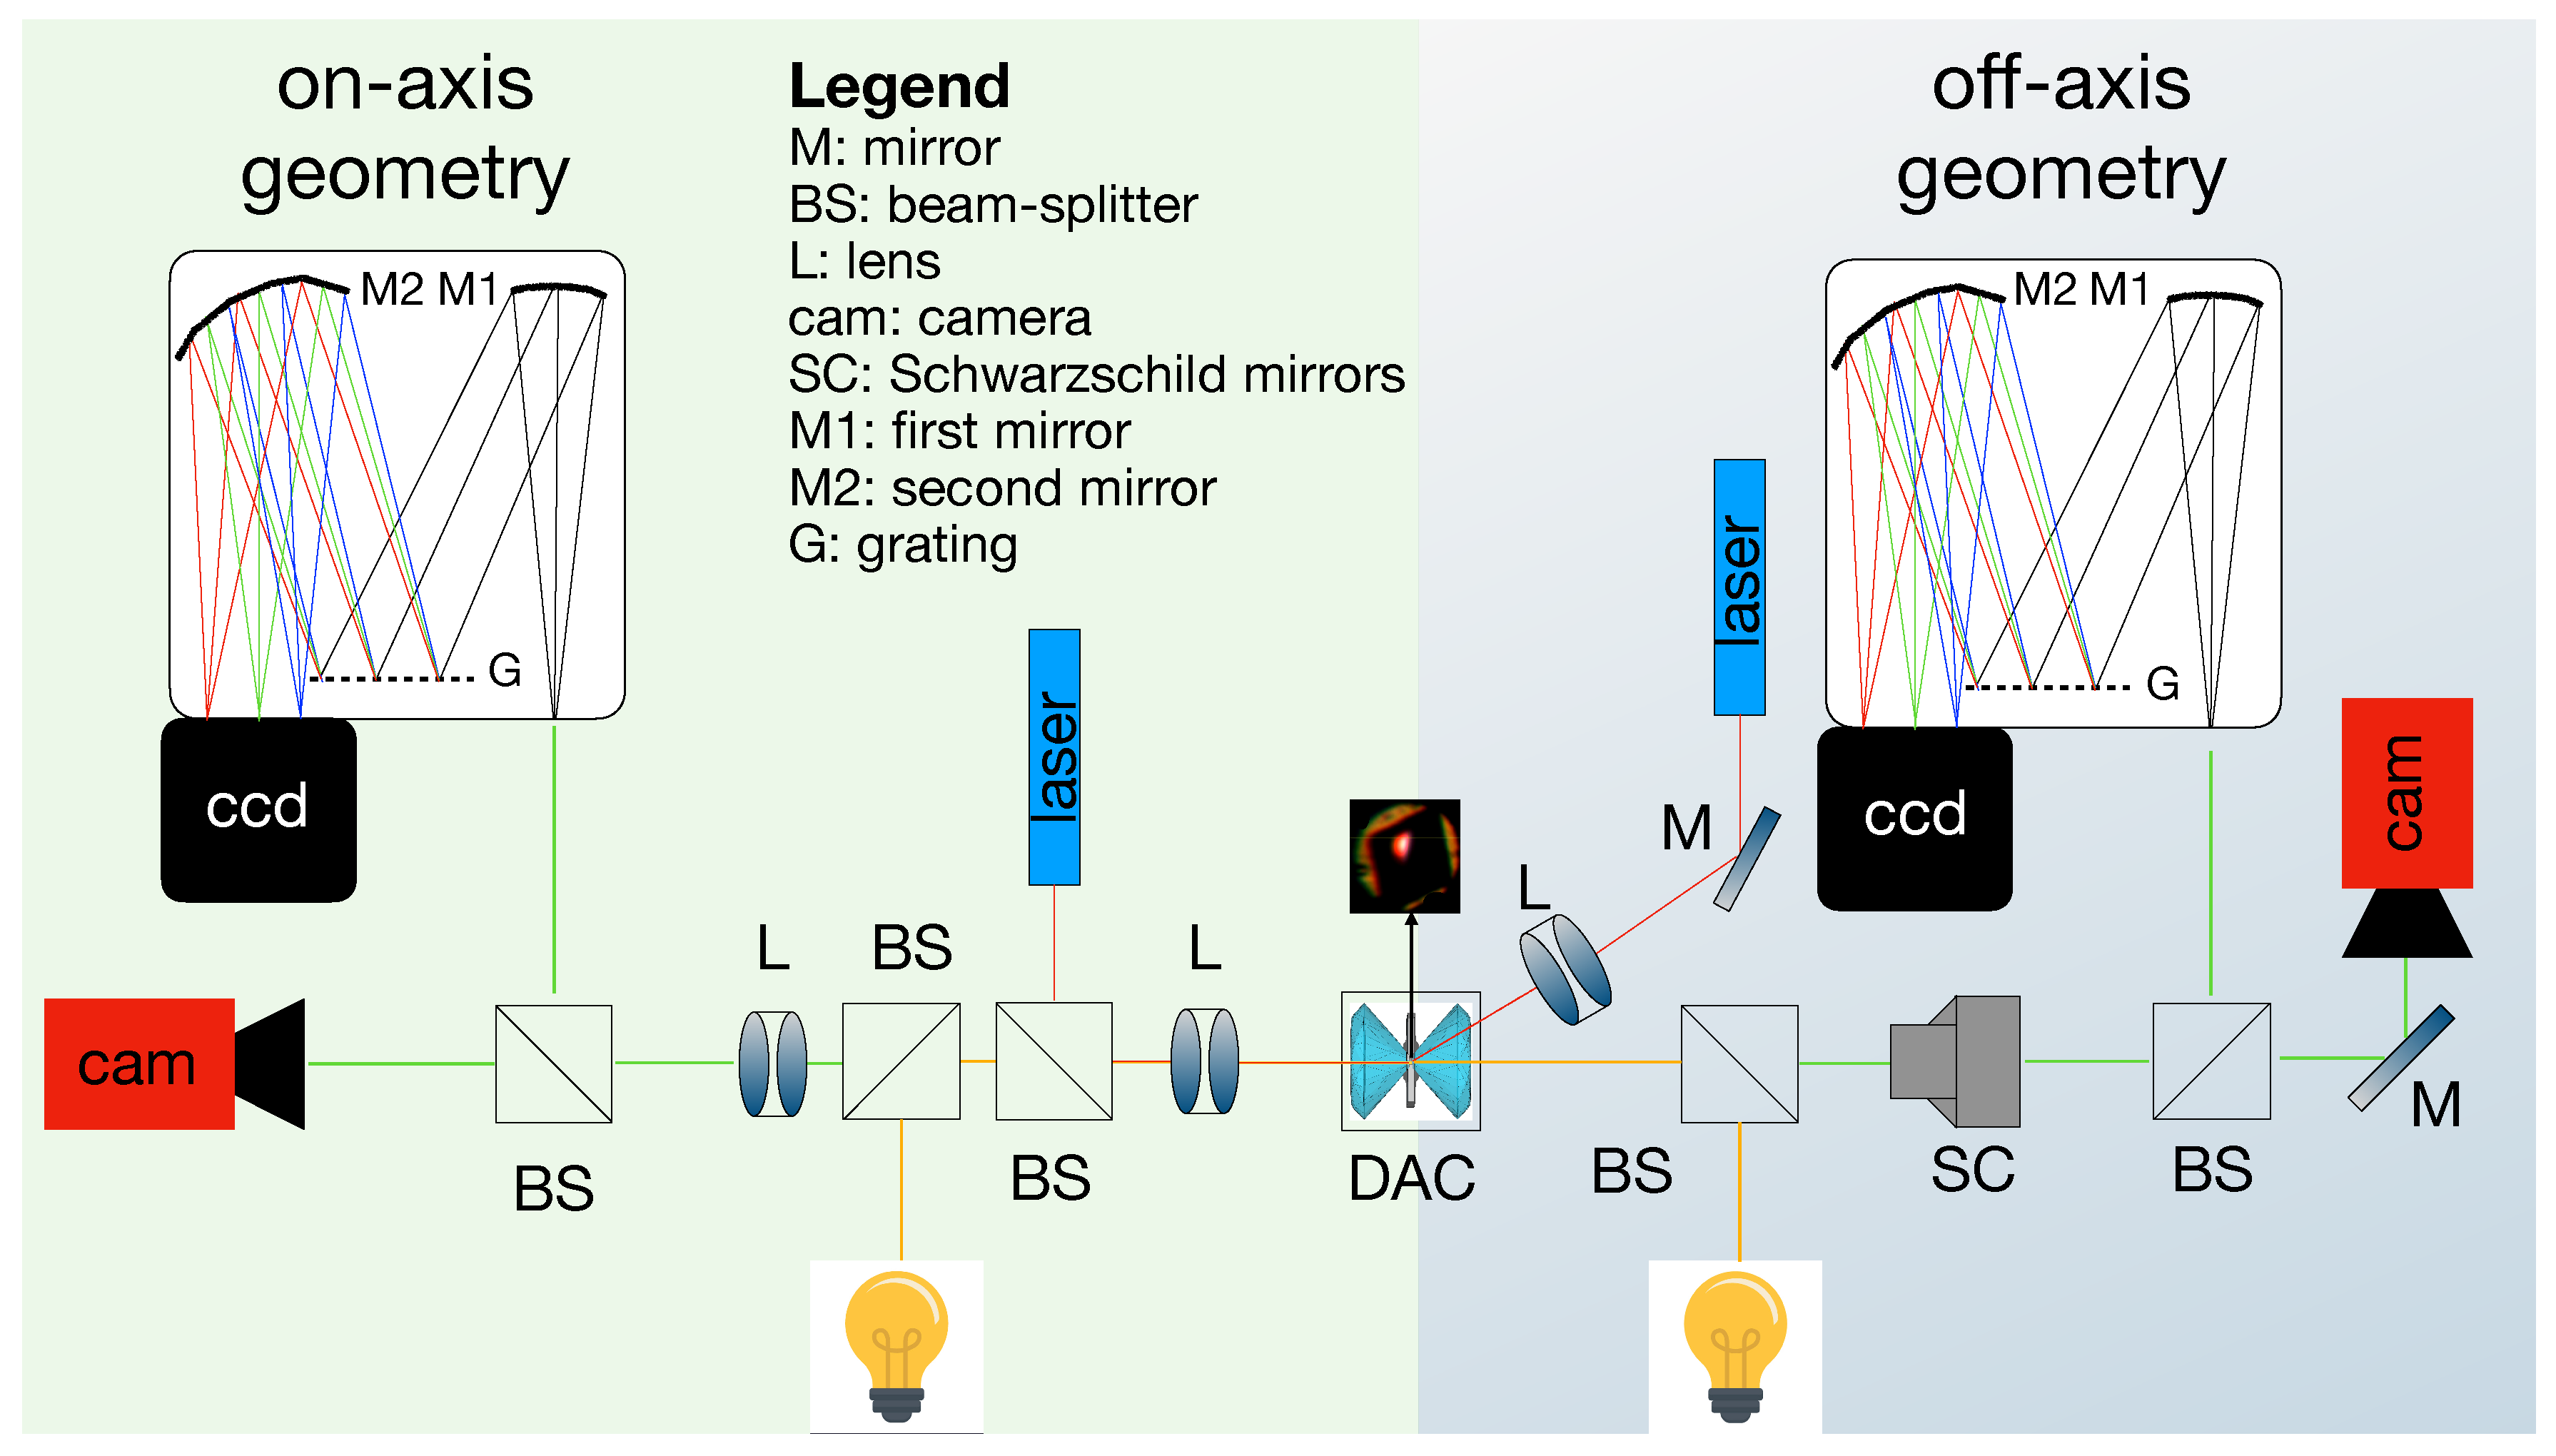
Focusing and positioning of the lasers on the sample surface can be achieved either via independent optics (off-axis geometry) or by sharing a common lens with the imaging part of the system (on-axis) geometry (see Figure 3). Both geometries are equally used by different groups around the world and both bring their advantages and disadvantages.
The on-axis geometry is generally used in both university laboratories and synchrotron facilities [12,101,102,103,104] for the simplified geometry (making the system more compact) and user-friendliness. In fact, in this geometry, once the laser beams are aligned with the sample image, they do not need further alignments. However, by using the same lenses for both imaging collection and laser delivery, the lenses undergo a thermal expansion that compromises the reliability of the temperature measurements (see temperature measurement section of this review). Therefore, some groups use a cooling system for the lenses to keep this thermal expansion to the minimum [105,106]. In this case, a large and uniform hotspot on the sample surface can be obtained only adding additional optics to the laser path, such as beam-expanders and -shapers [19].
Compared to the on-axis, the off-axis geometry is more flexible, as the lasers can be moved independently from the imaging optics. However, the increased complexity of the system (now requiring additional optical and mechanical components), might result in a laser alignment more complicated to non-expert users. Despite these technical difficulties, the off-axis geometry is used by several groups and beamlines [17,18,24,26] as it allows reflective optics or iris-equipped refractive optics to be used to collect the temperature with minimal aberration effects (vide infra) [29,107].
During LH experiments, the lasers can be used in two different operational modes: continuous (CW) and pulsed (PL). Historically, the CW was the first to be used for LH-DAC experiments and it is still used by several groups [17,18,26]. However, keeping the laser for several seconds on the sample, promotes mobilization and diffusion of carbon from the anvils into the sample chamber [76,108]. Such a diffusion can lead to undesired chemical reactions with the sample [6,109]. The PL mode is thought to minimize the risk of chemical reactions by reducing the heating time [95,110,111]. For this reason, several experiments have been reported using this mode (also referred as “flash heating” [111]) However, a recent work by Aprilis et al. [40] performed a comparison between the CW and PL modes, finding the same carbon diffusion in both cases. Confirming that, the best way to reduce chemical reactions, remains a perfect sample confinement in an inert and dry PTM.
2.2.2. Sample Imaging and T Measurement
The coupling of the imaging and the T reading setup is an extremely important component of every LH system. In fact, the same optics are used to visualize the sample and to collect the thermally radiated signal from the sample surfaces. Furthermore, as the typical dimension of the sample used in LH-DAC can vary from few to hundreds of microns, it is important to use optics allowing high image quality and magnification.
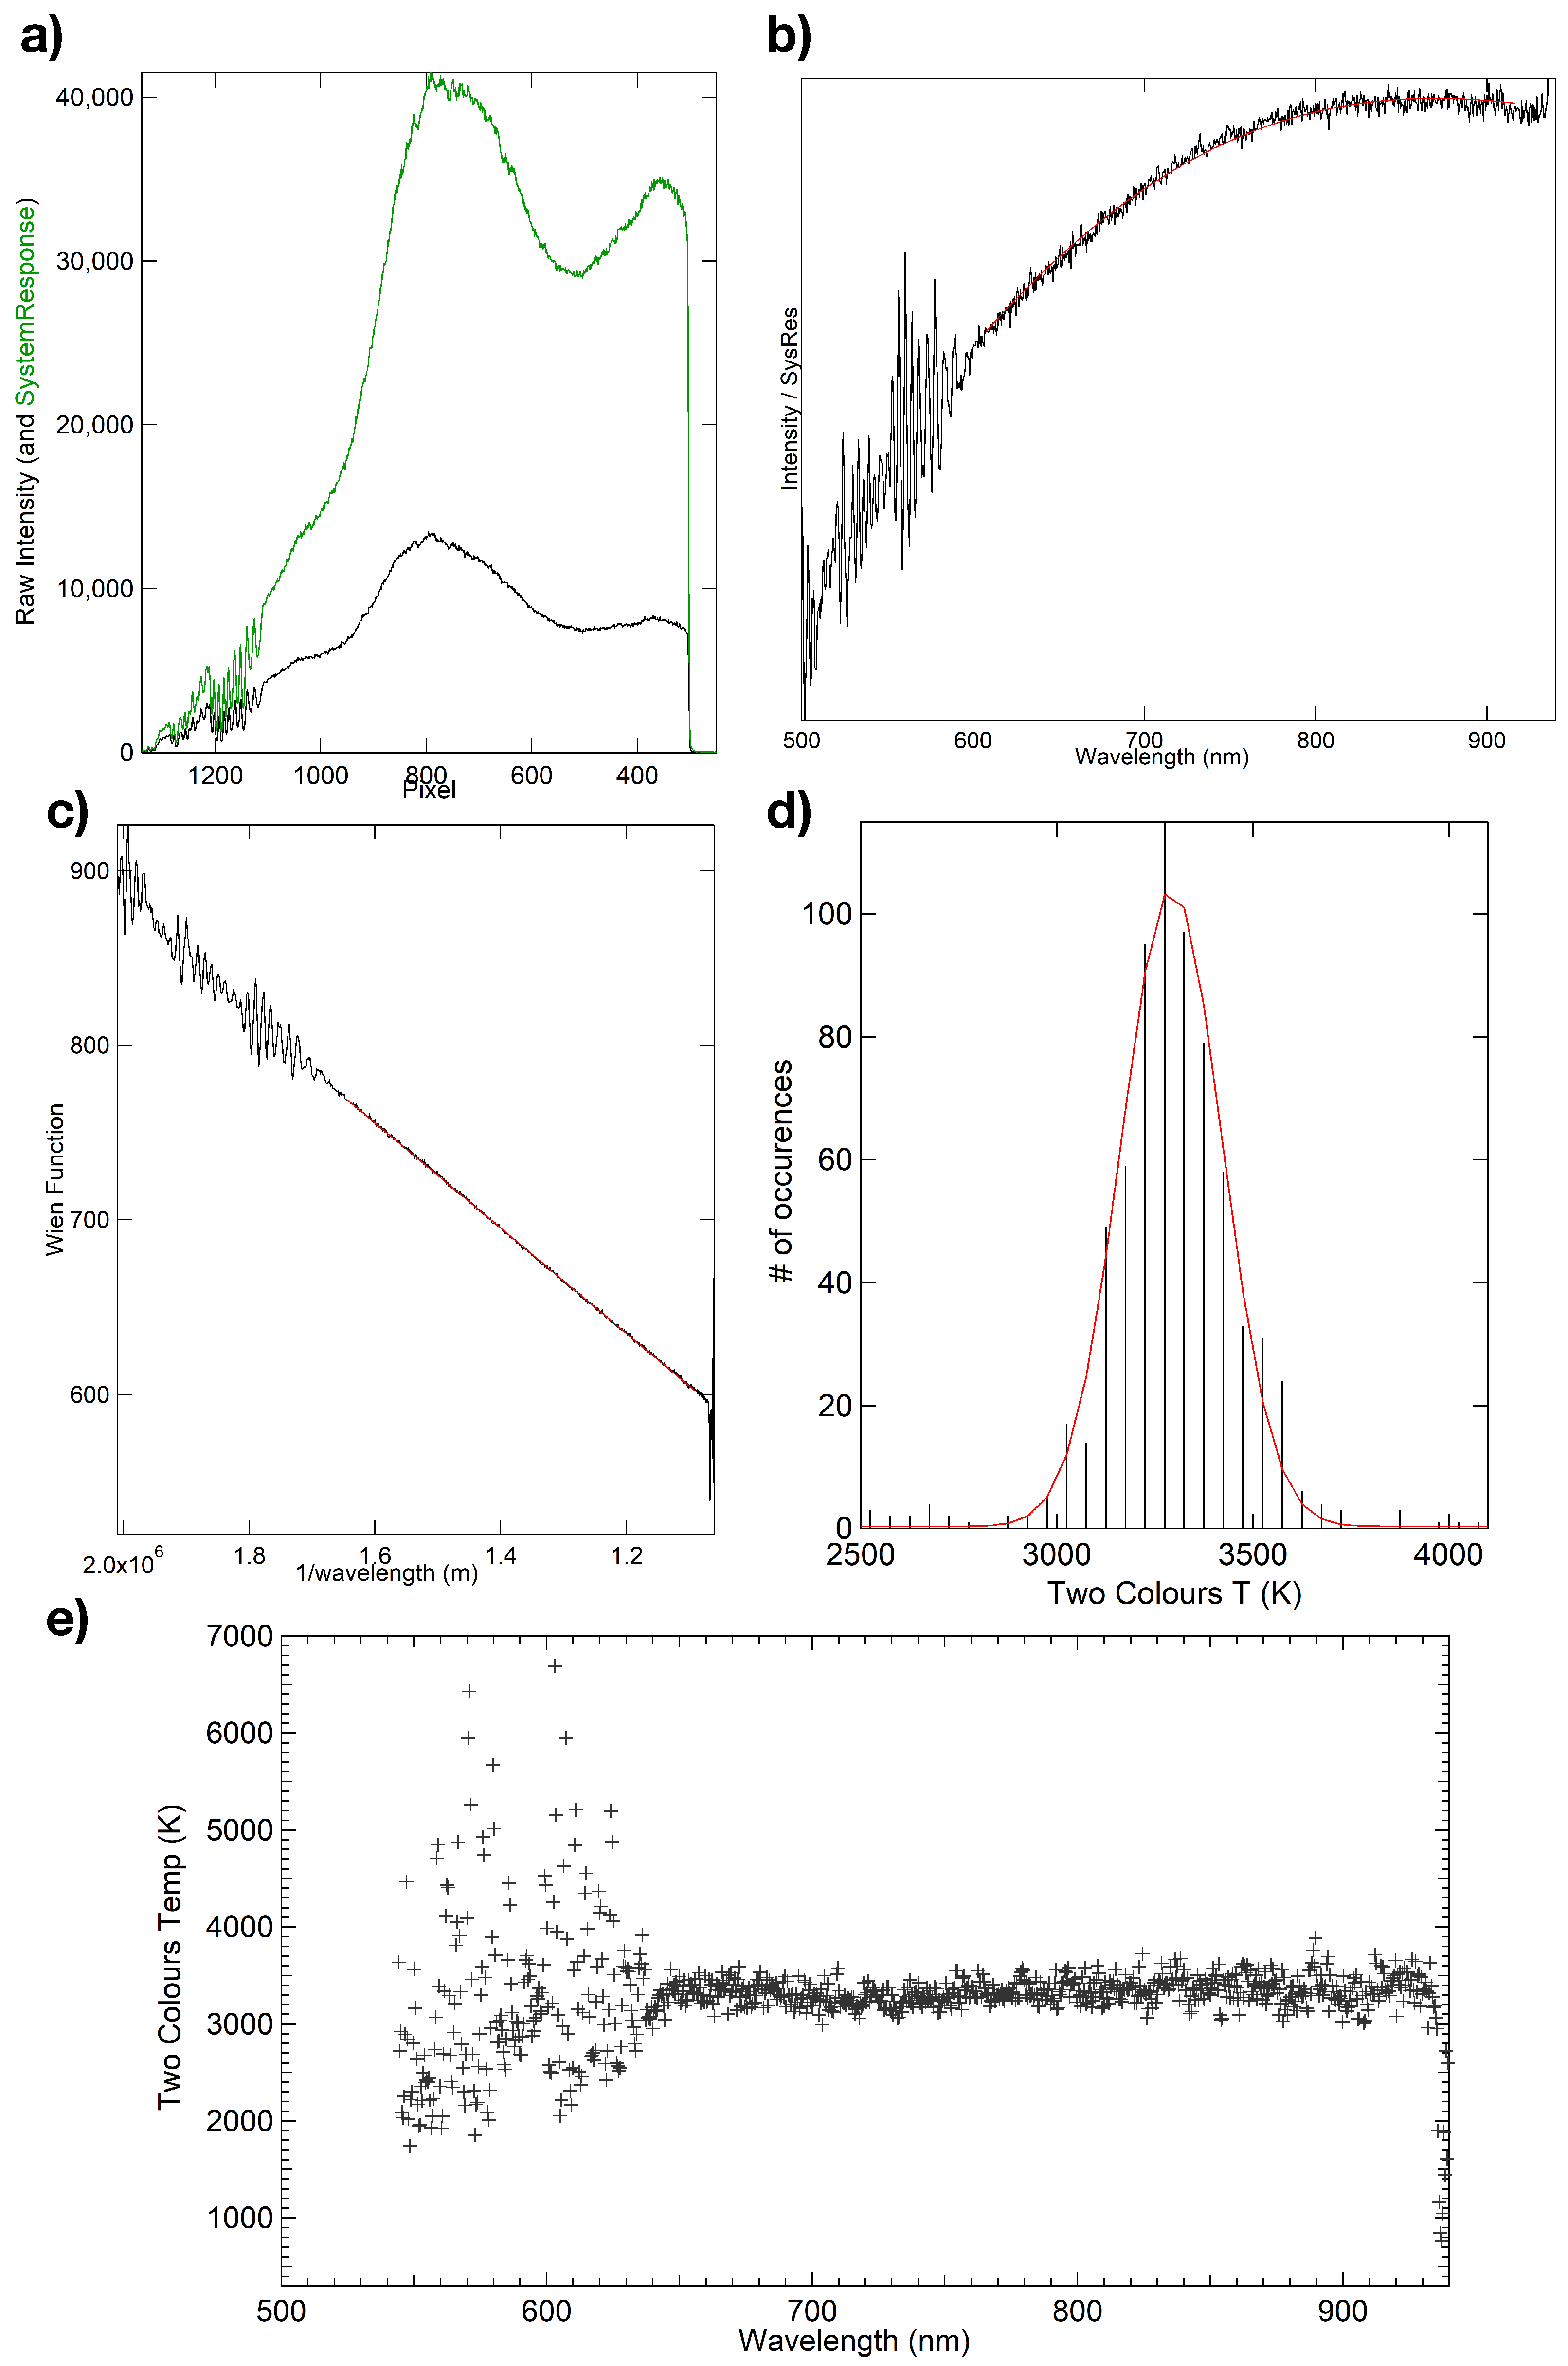
The most common way used to create a magnified image of the sample for LH-DAC experiments is by using a pair of refractive lenses. This solution has been adopted by several groups around the world owing its affordability, easy and compact design and image quality [18,20,21,23,26,41,100]. In this setup, the first lens is used to collect the signal from the sample inside the DAC, whereas the second one is used to focus the signal simultaneously into a CCD camera and into a spectrometer. The camera is used to visualize the actual sample, whereas the spectrometer is used to collect the radiated thermal signal from the laser-heated portion of the sample surface. Typically, the spectrometers used for LH-DAC experiments belong to the Czerny-Turner family. Therefore, the signal focused on the spectrometer slits (placed at the spectrometer working distance), is collimated by the spectrometer first concave mirror, energy-dispersed by the spectrometer grating (typical value of 150/300 lines per mm) and focused on a CCD by a second concave mirror (see Figure 3). The intensities collected on the spectrometer CCD are energy-dispersed and once integrated, reproduce the black body radiation coming from the sample. Therefore, a Planck fit of the obtained signal provides the T at the sample surface. In these experiments the black body radiation is collected in a wavelength range between 400 nm and 1000 nm, therefore the measurable temperatures start from a minimum of 1100 K. Typically, band-pass or notch filters are also added before the spectrometer to avoid any parasitic signal from the laser that might saturate the CCD of the spectrometer, whereas neutral density filters are used to attenuate the thermal emitted light for the highest temperatures (>3500 K). Temperature measurements between 500 K and 1700 K can be performed using an InGaAs OMA camera with sensitivity for near-IR (900 nm–1800 nm) [112]. However, resistively heated DAC are generally preferred to LH-DAC for working at this temperature range, as they provide a more stable and homogeneous heating during the experiment [48,49,50,51,113,114,115,116,117,118].
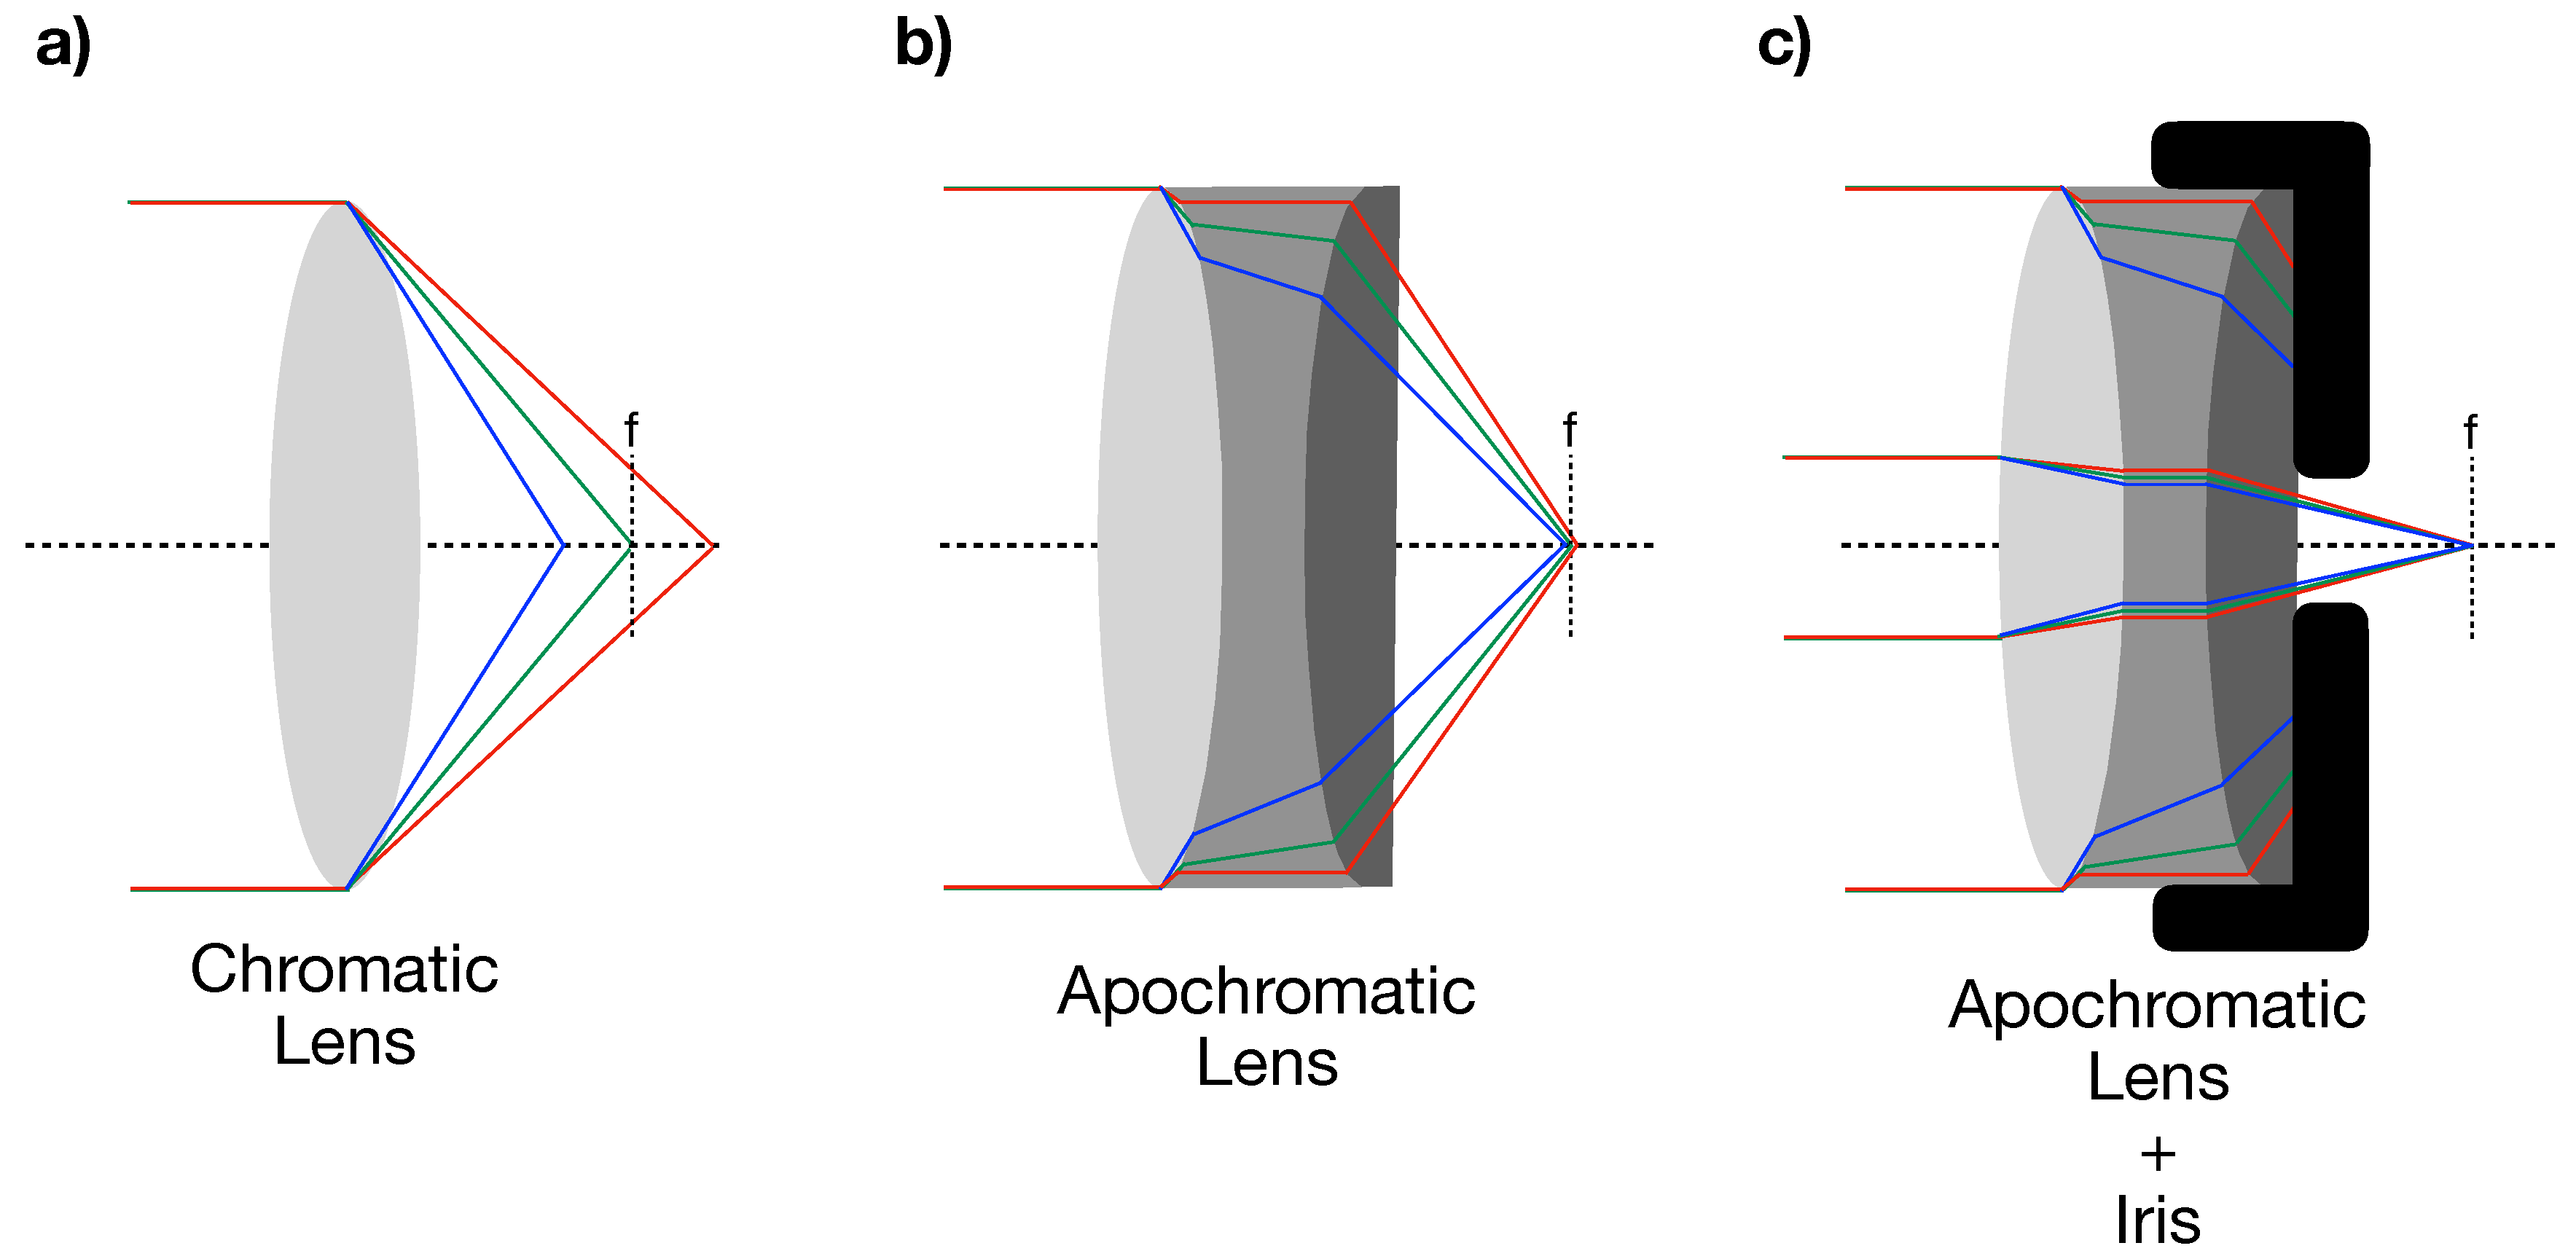
As the focal distance of refractive lenses depends on their wavelength-dependent refractive index, different wavelengths of the collected light are focused at different distances (see Figure 4a) [119]. In particular, wavelengths in the green region of the electromagnetic spectrum are focused at the nominal focal distance of the lens, whereas wavelengths in the blue and in the red regions are focused at distances shorter and longer than the nominal one, respectively. Therefore, when the light is collected (and energy-dispersed) by the spectrometer, this chromatic dispersion (known as aberration) introduces random chromatic displacements, where intensities belonging to different wavelengths will end on the wrong region of the CCD of the spectrometer. This results in erroneous T readings, with errors of several hundreds of kelvins. In order to reduce these aberration effects, special apochromatic lenses are generally used (see Figure 4b) [18,120]. As an alternative to the refractive lenses, reflective objectives with a Schwarzschild design can be used [17,77]. Those objectives are made of two spherical mirrors and are therefore purely achromatic in nature. Such a solution leads to an aberration free signal at the cost of a worse image quality.
To simplify the experimental setup, some groups use additional optical fibers to collect the signal radiated from the sample surfaces and bring it to the entrance of the spectrometer [37,94,104]. Such a solution makes the system more compact and reduces the time spent to perfectly align the spectrometer with the rest of the system (especially when using portable systems). However, the possible aberration effects that can be introduced using the optical fiber are still unclear.
For several years, a long standing debate was carried on in the scientific community about the effects that chromatic aberration could have on the reliability of the temperature measurements. In particular, it has often been argued how the use of reflective or refractive lenses might (or might not) be the cause (or at least one of the causes) for the discrepancies observed in the results obtained by different groups while studying materials under such extreme conditions [5,6,29,121,122,123,124]. However, a recent study by Giampaoli et al. [107] has empirically shown how the two optical systems can provide similar results if some precautions are put in place. In particular, it is important to reduce the numerical aperture of the refractive lenses using an iris in front of the collecting lens. In this way, the signal collected by the spectrometer is mainly composed by rays that are paraxial to the lens (see Figure 4c), therefore less affected by aberration [24,119]. Such a precaution worsens the image quality (as the number of photons reaching the CCD is notably reduced) but increases the depth of field, improving the reliability of the temperature measurement.
Finally, the sample illumination is generally achieved using ultra-bright white LEDs. The white light can be brought to the optical path by either mounting the LEDs on pneumatic mount (resulting in sample imaged using transmitted light only) or by sending the LED-generated light into beamsplitters mounted (directly or on pneumatic mounts) on the main optical path.
2.3. LH-DAC Metrology
Despite all the available geometries and designs (more or less complicated), the LH-DAC is simply a tool used to produce extreme P and T conditions. If the actual values of these conditions are not known or are erroneously known, any result experimentally observed becomes unreproducible. An accurate P and T metrology is therefore extremely important and will be discussed in detail in the following paragraphs.
2.3.1. Temperature Measurement
Accurate T measurements are extremely important when performing LH-DAC experiments. In particular, they are doubly important as their values also affects the P measurements. In fact, when laser-heating a nearly isochoric environment, such as the sample chamber of a DAC, the induced thermal expansion of the sample, causes the development of a thermal pressure. Therefore, the resulting P applied on the sample is T-dependent.
As introduced in the previous paragraph, temperature measurement in LH-DAC is generally performed via spectral radiometry, i.e., by fitting the radiated thermal signal I(,,T) from the sample surface with the Planck’s law:
Here h, K, c and T are the Planck constant, the Boltzmann constant, the speed of light and the temperature corresponding to the collected radiation, respectively; is the wavelength of the measured signal. is the emissivity, it is a function of P, T and and it is generally not known. However, for the wavelength range used in LH-DAC experiments (400–1000 nm), the emissivity variation with wavelength can be considered negligible and the gray-body approximation (< 1) is assumed. The emissivity is therefore used as fitting parameter together with the T. Such an assumption is not always valid due to several aspects such as: aberration effects and changes in emissivity due to phase transitions. A critical evaluation of the temperature measurement is therefore extremely important.
Different groups around the world use different methods to identify the reliability of the temperature measurement. One of the most common one is to fit the I(,,T) with a Wien function [83,105,125,126]. In fact, for T where exp(hc/ KT) >> 1, the Planck function can be approximated with the Wien law:
This equation can be linearized:
Equation (3) can therefore be used to check the reliability of the T measurement, as any deviation from the linear behavior can be easily detected. The error introduced by using the Wien function (instead of the Planck one) is of the order of 1 % for T < 5000 K. [127]
The use of Equation (3) also allows a more accurate determination of the error in the T measurement to be performed. In fact, thanks to the linearity of Equation (3), only two wavelengths are needed to measure the T. Therefore, if wavelength dependence can be neglected, temperatures calculated from the ratio of a pairs of intensities separated by a fixed spectral difference should give the same result [119,125]. If we define = , the equation to obtain the temperature from two wavelengths (two-colors pyrometry) can be written as:
If Equation (4) is applied to each collected wavelength at constant (sliding two-colors pyrometry), it is possible to obtain the wavelength-dependent temperature distribution of the collected radiation. The must be chosen to be small enough to allow the observation of possible wavelength-dependent variation in the T, but large enough so that the corresponding intensity difference is detectable (see Figure 2 in [125]). Regular data show substantial noise, but the gray-body radiation must yield a constant temperature across the wavelength range investigated. However, several factors such as: wavelength dependence of the emissivity, temperature gradients and aberration effects (from lenses and diamonds), will introduce a distinct wavelength dependence in the temperature versus wavelength plot [125]. For these reasons, some groups use as the actual error in the T measurement, the full width at half maximum (FWHM) of the histogram obtained from the sliding-two-colors pyrometry, instead of the error obtained from the fit with the Planck (or Wien) law [18,29,30,81,82,126,128]. An example of a complete set of spectral radiometry measurements is reported in Figure 5.
Regardless of the adopted method, in order to obtain a reliable T measurement during a LH-DAC experiment, the spectrometer needs to be calibrated. In fact, in addition to the standard wavelengths calibration with a NIST (National Institute of Standards and Technology) lamp (e.g., Ne or Ar), it is necessary to find the optical response of the LH system S(). This is generally done by collecting the radiated intensity from a calibrated tungsten (W) lamp at a specific temperature I(,T). The W lamp is placed at the sample position and the signal is collected with the spectrometer via the LH optical system (this procedure must be repeated for each adopted configuration i.e., with or without filters or iris). The collected intensity can be then written as:
The system response can be obtained by dividing the measured intensity by the ideal Planck intensity at the nominal temperature . Therefore, during a LH experiment, the Planck function is obtained by normalizing the collected radiated intensity to the obtained system response S().
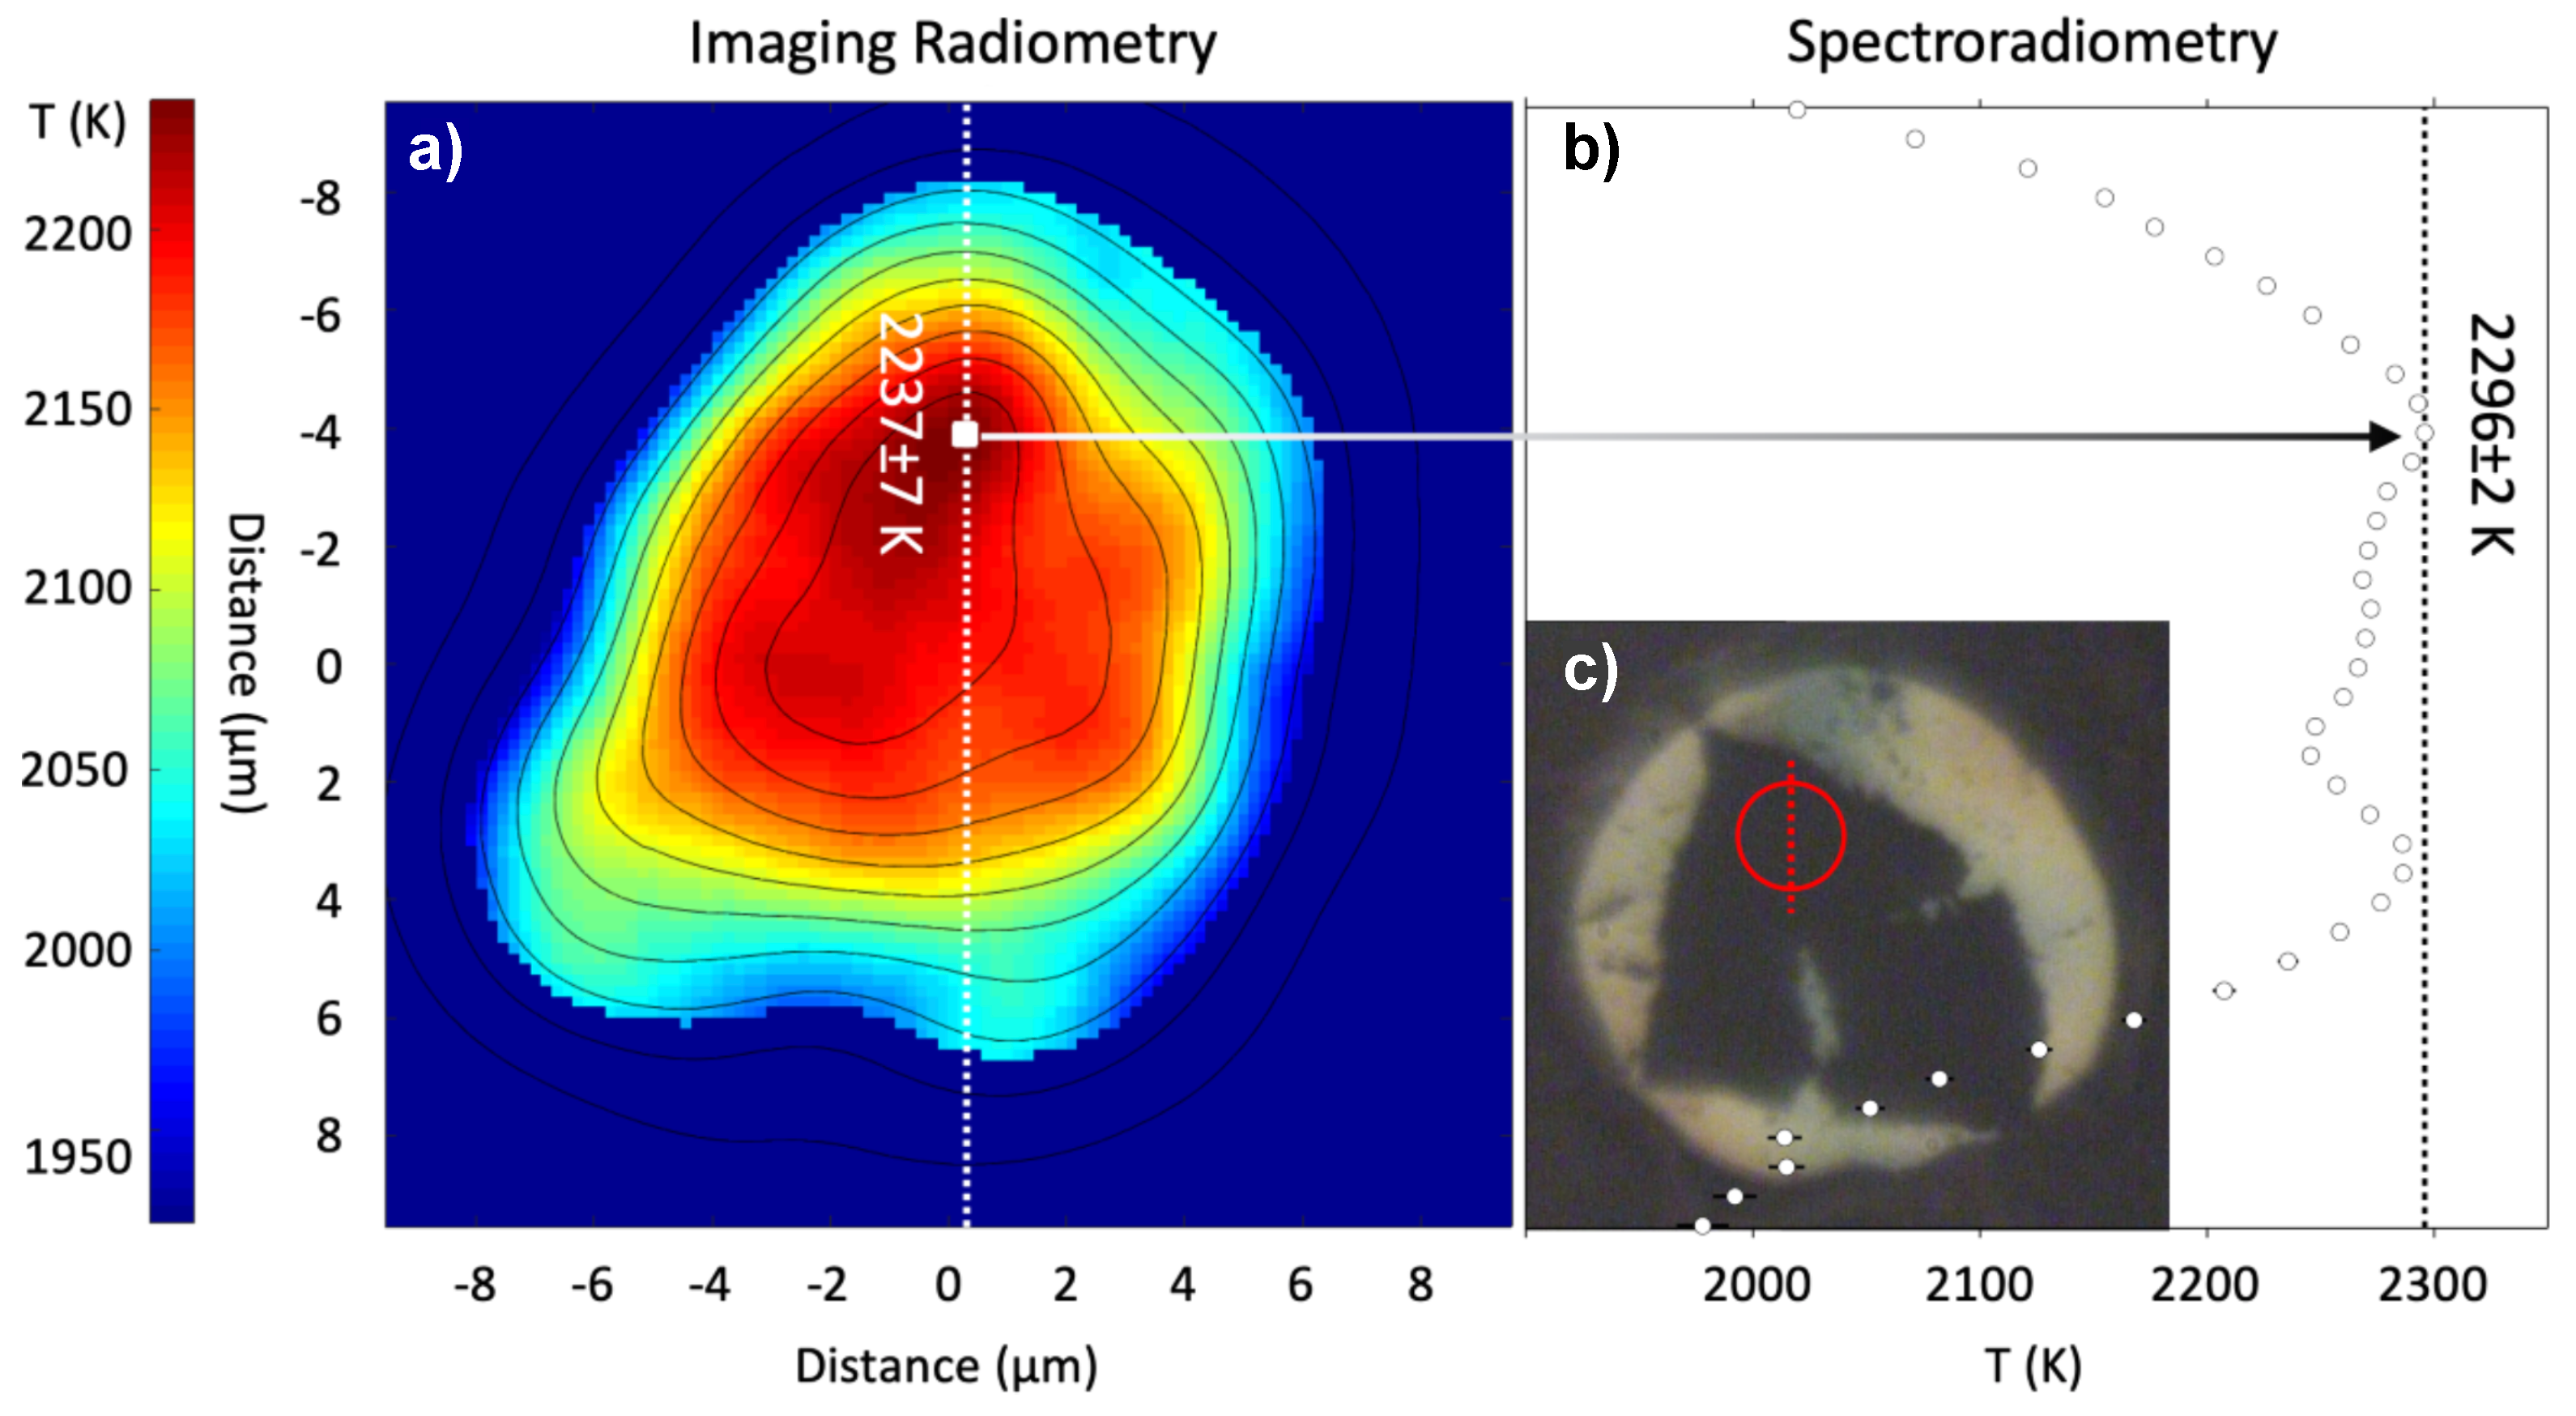
Due to the presence of large thermal gradients and changes in the insulation conditions, in-homogeneous distributions of the T on the sample surfaces are often observed during LH-DAC experiments [129,130]. The actual determination of both the peak temperature and the temperature field can then become very useful. For this purpose, new methods providing a 2D temperature maps of the heated sample in LH-DAC have been developed and are used by different groups for providing information about the dynamic changes occurring during these experiments [131]. Among them, the peak-scaling method [130,132,133,134], adopts a pseudo-Planck curve obtained using a spectrometer with a wide entrance slit and averaging the light collected on the entire region of interest (ROI) of the spectrometer CCD. The peak temperature obtained from correcting the obtained pseudo-Planck curve is used to scale the monochromatic image of the sample collected at the same time on a CCD camera. This results in a temperature map. This relatively simple method is insensitive to small optical misalignments, but depends on the model adopted to correct the pseudo-Planck curve [133]. An alternative is represented by the multispectral imaging radiometry (MIR) [95,135,136]. Developed by Campbell in 2008, MIR does not require the use of a spectrometer. In fact, the original sample image is decomposed in four near-monochromatic images (therefore also referred to as four colors pyrometry) using a combination of beamsplitters, mirrors and narrow band-pass filters. The decomposed images, each at a different wavelength, are independently focused and are simultaneously acquired on a single CCD camera. The images are then spatially correlated to provide four intensity-wavelength data at each pixel that can be fitted to provide maps of both temperature and emissivity (see Figure 6). Like for the spectral radiometry case, the system needs to be calibrated with a known radiation source, following the same procedure described above. Compared to the peak-scaling method, MIR has the advantage that the temperature of each pixel is determined directly, without recourse to any model dependent parameters. Furthermore, as each image is focused independently, any chromatic aberration is largely reduced.
2.3.2. Pressure Measurements
The P measurement in a DAC is one of the major contribution of uncertainty in high-pressure experiments. In fact, differently from other static apparatus (such as piston-cylinder or multi-anvil devices), it is impossible to find a direct correspondence between the applied force and the resulting P. This is due to non-reproducible loss in the given load caused by internal frictions, diamonds and gasket deformation [66,127,137,138]. Therefore, internal standard materials (pressure gauges), whose changes in physical properties have been calibrated as a function of P, are generally loaded (together with the sample) in the high-pressure chamber of the DAC.
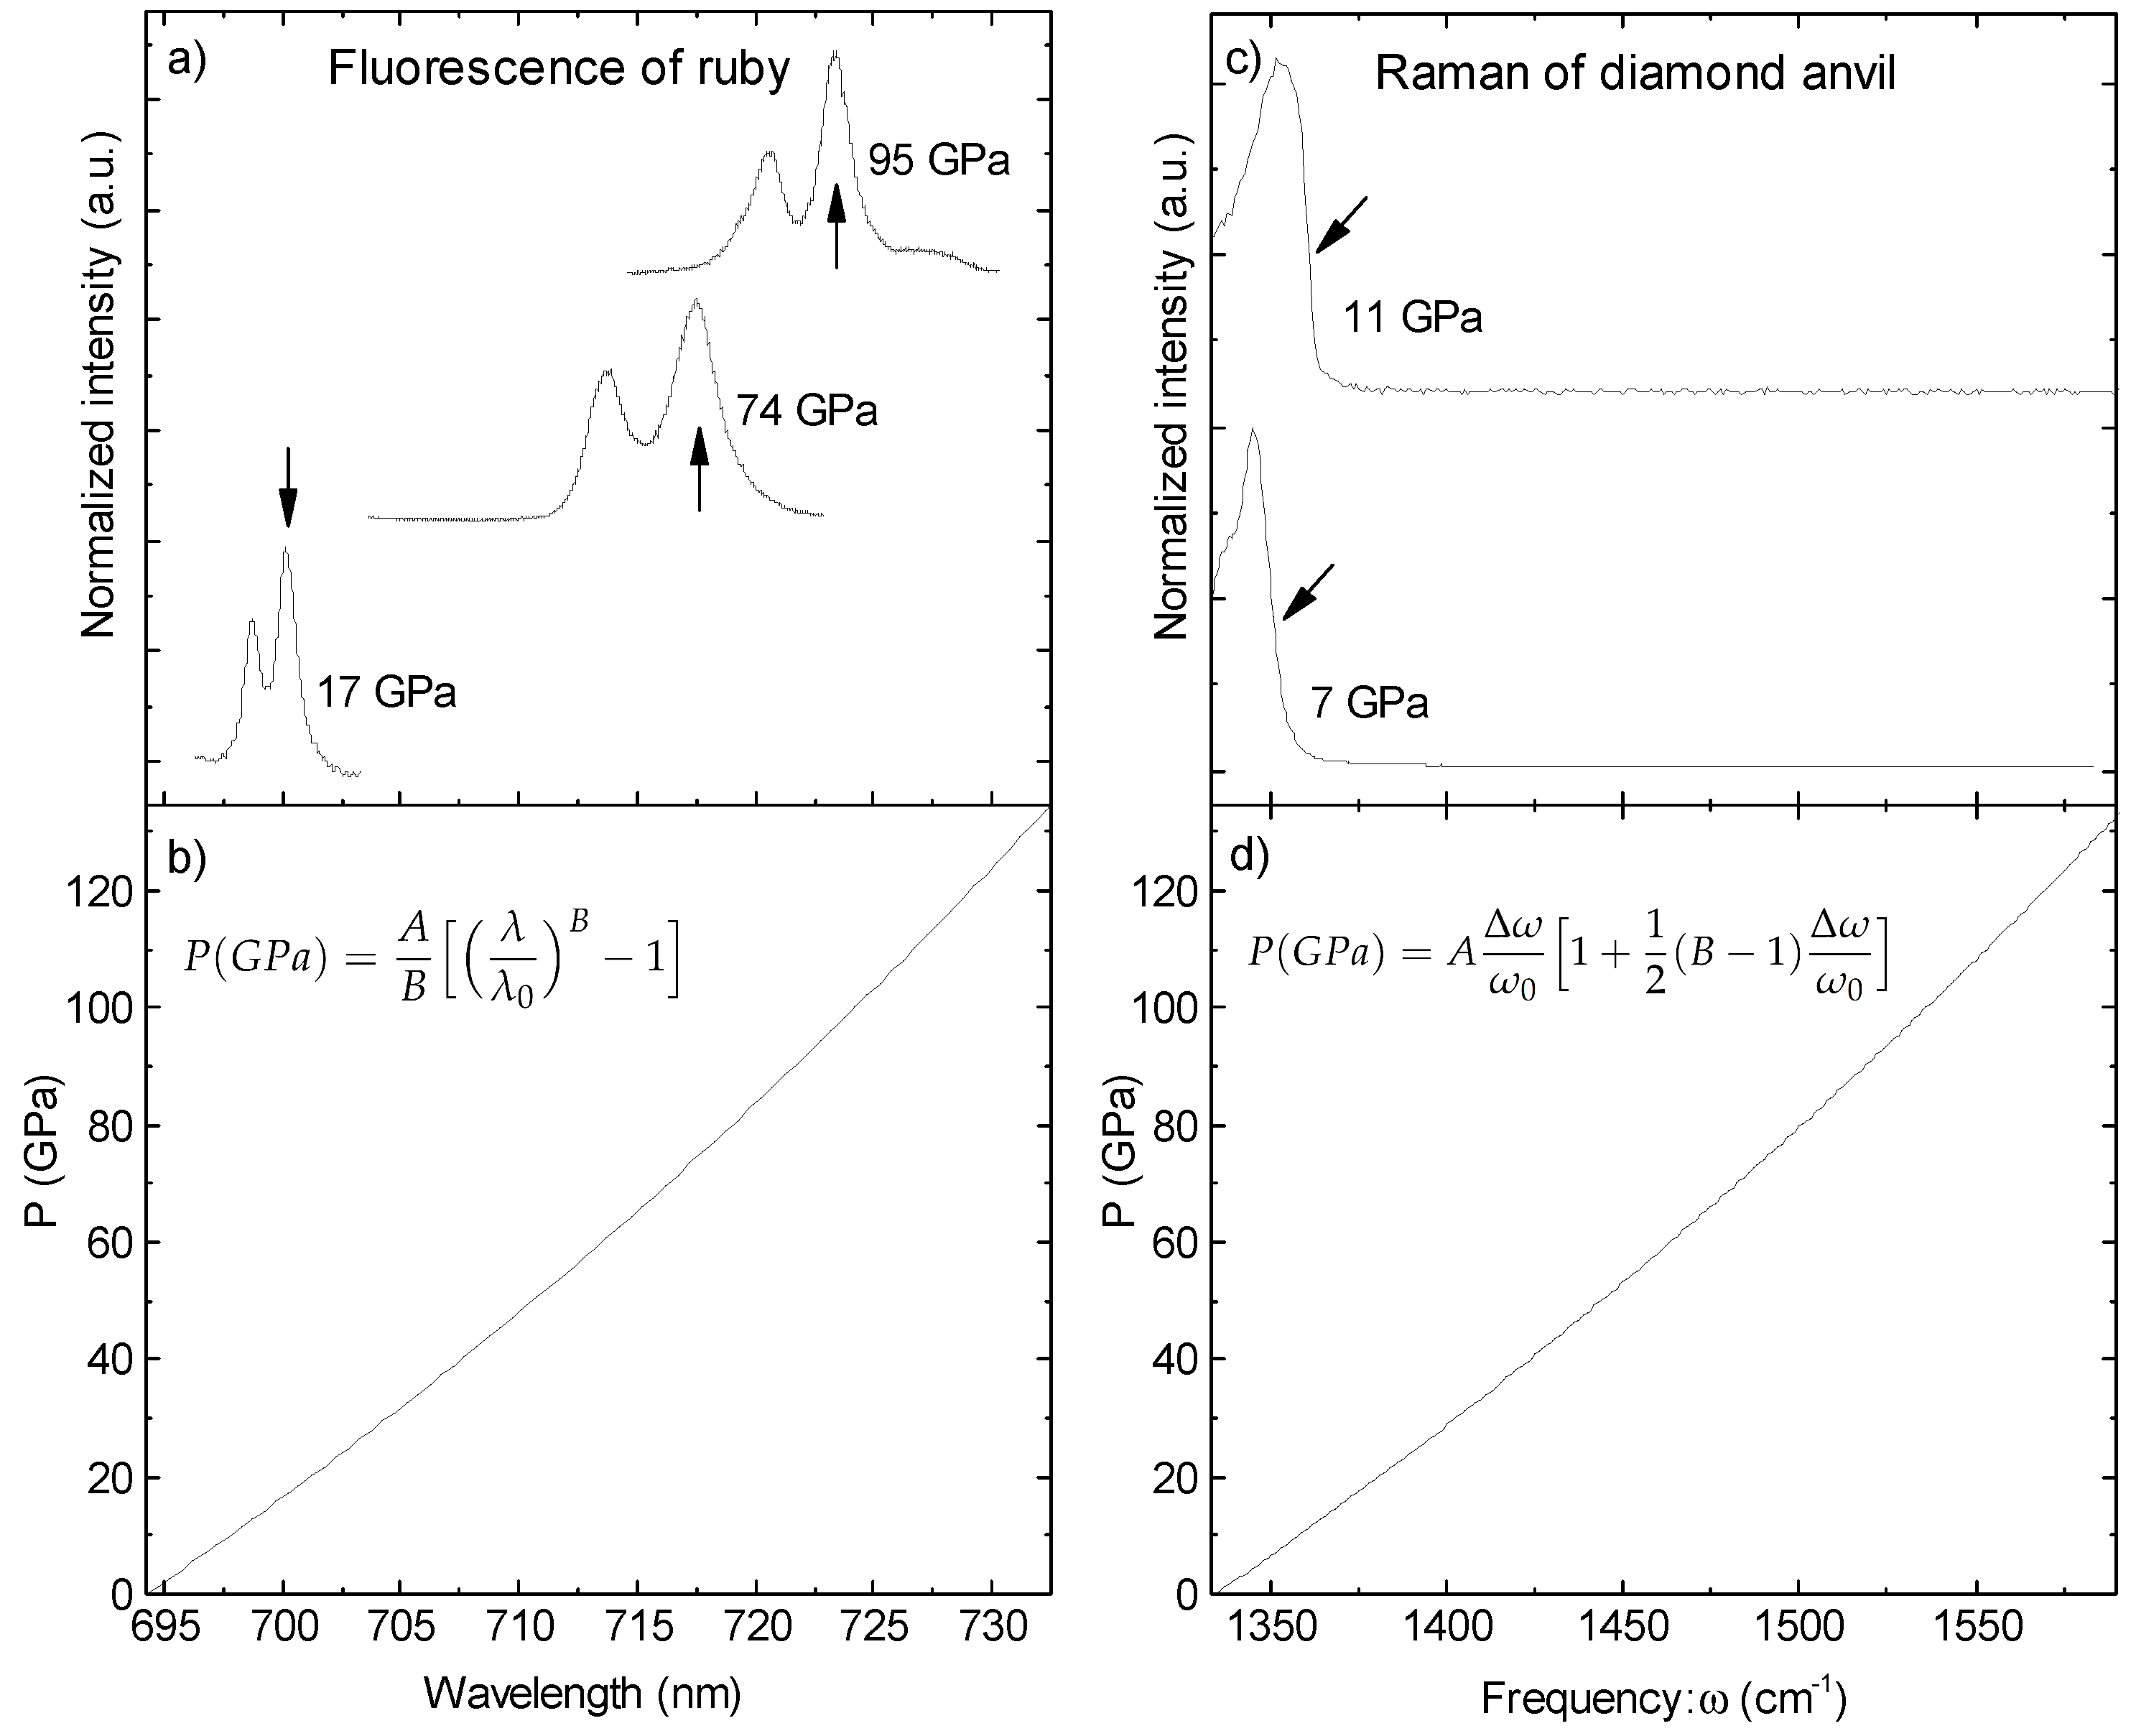
The most widely used method (in both synchrotrons and university laboratories) to determine the pressure inside a DAC is by measuring the pressure-induced shifts in the fluorescence signal (see Figure 7a), obtained using visible lasers on optical pressure gauges such as ruby (Cr:AlO) or Sm doped YAlO. Such materials are secondary standards, since they are calibrated using reduced shockwave, ultrasonic and static data obtained from a series of metals [139,140,141,142,143,144,145]. If the standards are used for measuring P outside the calibrated region, the uncertanties can be quite large. For this reason, over the years new calibrations have been performed so that the advances in the DAC technologies and the P metrology can move with a similar pace (refer to Ref. [146] for a more detailed review).
The Raman signal obtained from the center of the diamond culet is also used for P measurement. In fact, under high-pressure, the obtained spectra reflect the stress gradient of the anvil and they are therefore characterized by steep edges at high and low frequencies [144,147,148,149]. The calibration was performed on the high frequency edge of the plateau, where the strong first-order Raman peak shifts to higher frequency with increasing pressure (see Figure 7c).
Compared to the other luminescence methods (Ruby and Sm:YAlO), the measured Raman shift is less sensitive to pressure-modification for P < 100 GPa but can still be used for pressures higher than 200 GPa (when the ruby signal is broader and weaker) [149]. In addition, it has been calibrated up to 400 GPa [147], therefore it can still be used for measuring pressure while using toroidal-DACs [67,68].
Unfortunately, NPD do not present any Raman signal, therefore the ruby fluorescence (or Sm:YAlO) remains the only method for measuring P in DAC experiments coupled with XAS [71,72].
Due to the temperature effects on the fluorescence signal and to the geometry of the loaded DAC, P in the LH-DAC can be measured with spectrometric methods only before and after the actual heating. Such a constraint removes the possibility of directly measure the thermal pressure experienced by the sample. However, as the resulting thermal pressure is intrinsically linked to the PTM used, this value can be estimated empirically from reported XRD data of the used PTM at extreme P-T conditions. An example of this is presented in Lord et al. [105], where they find for KCl the empirical relation , where is the thermal pressure at the melting temperature of the sample and is the pressure measured on the ruby at room temperature after heating. If T = 300 K and T is the melting temperature, the thermal pressure can be evaluated as:
The value of the pressure is then given by [105].
When performing DAC experiments combined with XRD, it is possible to evaluate the P-T-induced evolution of the lattice parameters of a standard material whose equation of state (EoS) P(V,T) is known. Therefore, if the material is placed close to the sample (few m apart) in the high-pressure chamber of a DAC, it is possible to measure the pressure on the sample by assuming the two materials are experiencing the same stress.
At ambient temperature, P(V,300 K) EoS reduced from shockwave measurements [150,151] and ultrasonic measurements [152,153] are generally used to calibrate the X-ray gauges [146]. The accuracy of these EoS are cross-checked by compressing several standards in the DAC and comparing the corresponding pressure obtained from the volumes measured by XRD [140,143].
During LH-DAC experiments, the adopted PTM is also used as X-ray gauge. Such a trick, used for reducing the amount of elements contained in the high-pressure chamber, has also the advantage of collecting P and sample information from the same region of the DAC (minimizing any radial P gradient). According to Ref. [154], the general thermal EoS can be expressed as:
where P(V, 300 K) represents the ambient temperature part of the total EoS and P is the thermal pressure essentially created by the thermal motion of the atoms in the lattice. This contribution is generally obtained from thermodynamic models or ab initio simulations [50,155,156] and it is provided with the thermal EoS.
Considering Equation (7), the accuracy of the measured P can be determined from:
where V and T are respectively the uncertainties of the measured V and T. From thermodynamic relations the last equation can be expressed as:
where K is the isothermal bulk modulus and represents the volumetric thermal expansion coefficient.
During an actual LH-DAC experiment, the insulating PTM (also used as pressure gauge) is placed between the heated sample and the diamond. As the diamond thermal conductivity is extremely high, the PTM is under a big temperature gradient between the temperature of the sample () and the one of the diamond (, generally considered at ambient temperature). Given that the temperature gradient is not linear along the heating axis, according to Campbell et al. [157] the temperature to be used in Equation (7) for the PTM can be approximated as follows:
3. LH-DAC at Synchrotron Radiation Facilities
The last few decades have seen a rise in the LH-DAC systems combined with in situ synchrotron techniques. In fact, the extremely high flux and collimation of the synchrotron radiation, combined with the use of fast detectors with a low signal/noise [109,158,159], opens the possibility to perform time-resolved characterizations of samples contained in the micrometric high-pressure chambers of the DAC. Therefore, it allows an in-depth analysis of the actual transition rate (kinetics) of the transformations undergone by the sample to be performed [39]. Furthermore, it can also be used for mapping eventual thermal and pressure gradients developed on the sample at this extreme conditions. Several LH-systems are now available to be used at synchrotron radiation facilities as permanent installations [17,18,19,20,21,22,23,26,94] (or portable systems [24,36,101,112,160]). However, there are several factors that need to be taken into account when combining a LH-DAC system with a beamline setup.
First of all, as discussed in the previous paragraphs, major thermal gradients can develop during a LH-DAC experiment, with typical regions at homogeneous T with a diameter of 10–40 m. It is, therefore, important to use well collimated and clean X-rays beam, with dimensions smaller than the region of the sample at homogeneous T. Furthermore, as the size of the sample contained in the DAC is relatively small, in order to maximize the signal it is important to use high flux X-rays. This is why LH-DAC systems are generally mounted on undulator beamlines [17,19,20,22,23,26,94] (with the only exception of Refs. [18,21]). In fact, undulator sources produce a high flux beam with an extremely low divergence. The beam is generally focused further down to a diameter of a few m by using a pairs of Kirkpatrick–Baez (KB) mirrors or compound refractive lenses (CRL) [161,162].
The alignment of the X-ray beam with the hotspot and the T measurement must be precise within a m or less, otherwise the obtained information will be collected from different regions of the sample at different T conditions. A possible solution to this problem was proposed by Boehler et al. [24] and it is now used by several groups [17,18,20,26,94]. The idea is to place a polished mirror, with a pinhole drilled on it, at the entrance of the spectrometer. A high sensitivity camera focused on the mirror will then see the superposition of the sample image with the drilled pinhole. Therefore, the pinhole will effectively act as the spectrometer pupil (the spectrometer CCD will need to be adjusted to the new focal position) and as reference for the temperature measurement. The high sensitivity camera can be used to observe the X-ray-induced fluorescence of the PTM (or the gasket material). The fluorescence maximum intensity is observed at the X-rays position and can be aligned with the spectrometer pupil (by moving the sample image). Finally, if also the laser-induced hotspot is aligned with the spectrometer pupil, all the information will be collected from the same region of the sample. While laser-heating the sample, a large amount of the heat is transferred to the DAC body (through the diamonds) and the surrounding optics. This leads to a progressive misalignment of the image with the spectrometer pupil. For this reason, the DAC is placed in a water-cooled holder, and the relative alignment of the X-rays, T measurement and hotspot must be regularly checked.
Finally, as the combination of LH-DAC with any synchrotron-based technique is done by adding the LH system to the X-ray path, it is important to consider the impact that the new optics and components will have on the collected signal from the X-rays. As each technique shows specific challenges and (as usual) different groups use different solutions, we will talk about this more in detail for XRD and XAS in the next paragraphs.
3.1. LH-DAC and XRD
Historically, XRD was the first synchrotron technique to be ever combined with LH-DAC. Since the pioneering work of Shen et al. [92], this technique evolved into a productive and routinely used experimental method at synchrotron beamlines, leading to numerous major scientific advances across the disciplines of chemistry, material science, physics and geoscience [163,164,165,166].
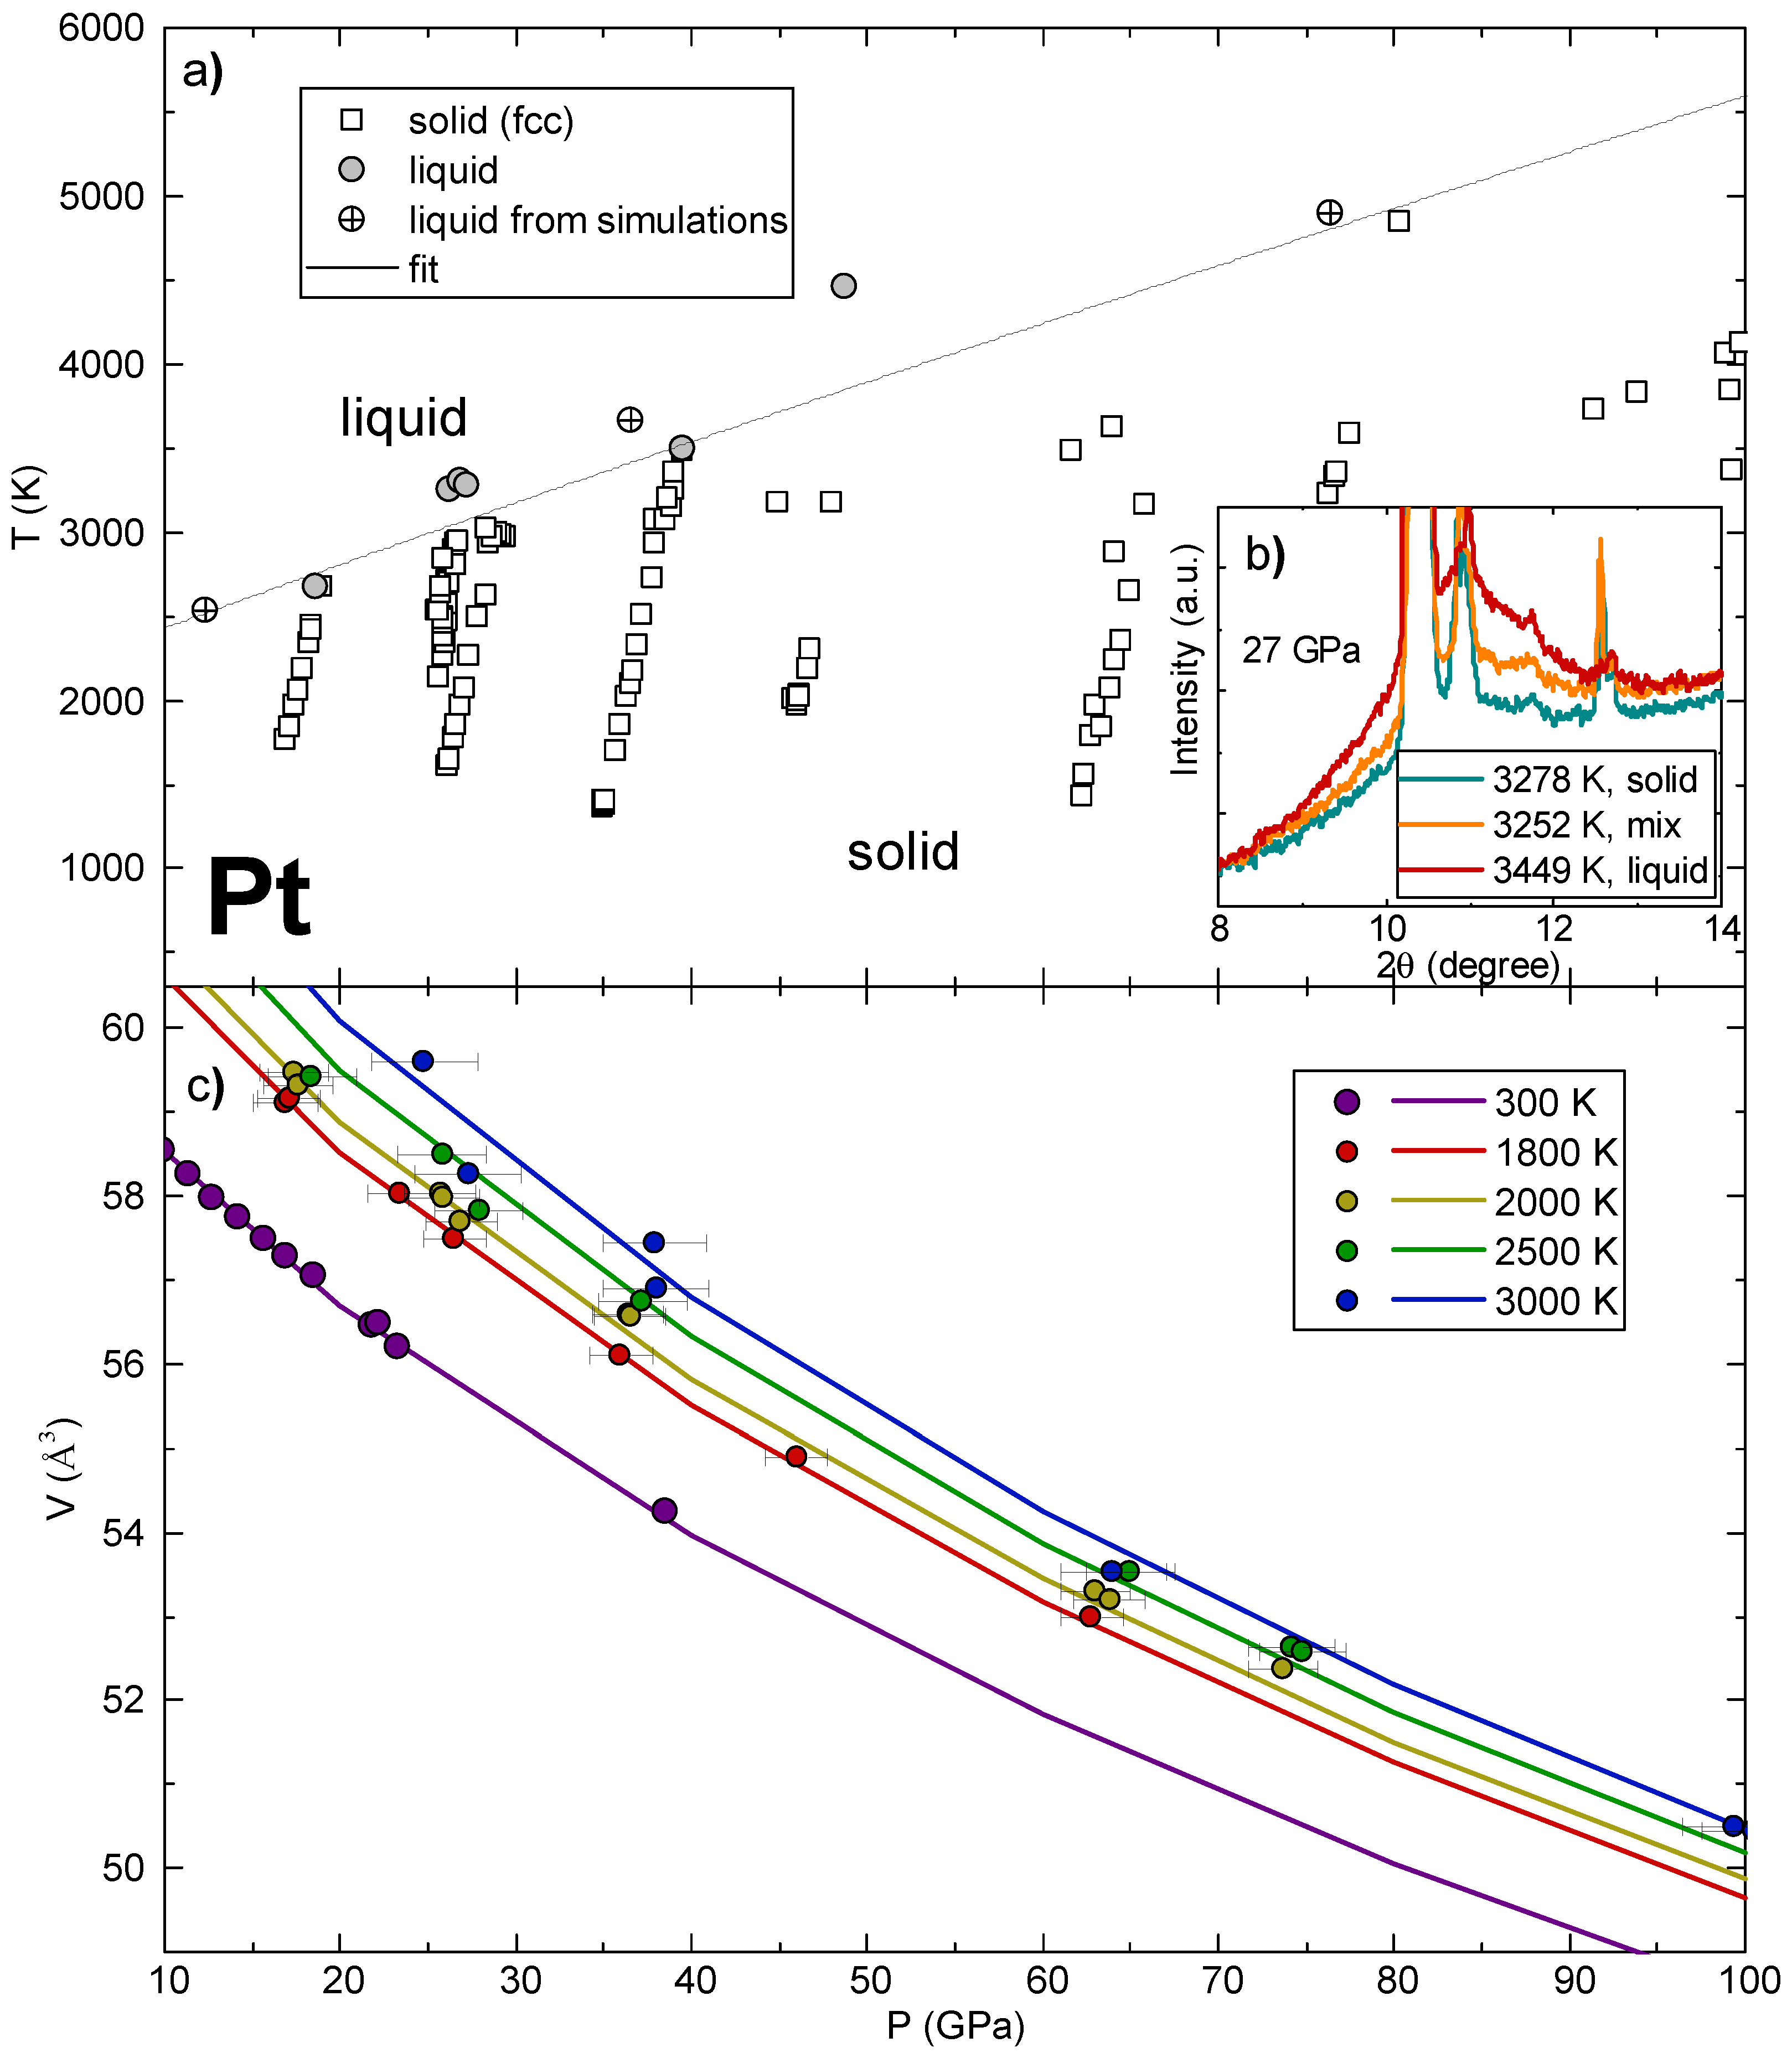
In fact, the nature of the XRD (combined with LH) technique, allows the characterization of the structural, textural and chemical evolution of the sample (and the PTM) to be performed in situ as a function of P and T. Furthermore, thanks to the use of fast detectors with an improved signal/noise, it is now possible to probe (in situ) intermediate phases, revealing important crystallographic information. In recent years this technique has been successfully used to (first) synthesize and (successively) characterize new materials, both for geological interest or in the rush for finding new ultra-hard materials [88,89,167,168]. The use of LH-DAC with XRD (and the help of computational methods such as ab initio simulation or thermodynamic modeling) allows detailed characterizations of phase diagrams and thermal equations of state (EoS) of materials at extreme P-T conditions (see Figure 8 for an example) [81,169,170,171,172,173].
Special experimental set-ups, allowing single-crystal XRD experiments using LH-DAC, are opening the possibility of characterizing the chemical compositions of complex multiphase and/or multigrain samples and the unambiguous solution of structures as well as the determination of P-T-induced structural distortions [104,137,174].
The XRD signals obtained from liquid (and amorphous) and crystalline samples are very different (see Figure 8b). In particular, while the latter is characterized by the presence of Bragg peaks, the first (and second) is characterized by a diffuse scattering. Such a difference in the two signals, has made this technique particularly attractive for both experiments aimed to characterize the melting curve of elements under extreme conditions of P and T and [47,59,81,82,84,128,131,175], for those aimed to characterize their liquid structures [176,177,178,179].
For these reasons, several XRD beamlines worldwide are now equipped with permanent (or portable) LH-systems for DACs [17,18,20,21,22,23,24,36]. However, when combining LH-DAC with a synchrotron beamline, the interaction of the X-rays with the LH collecting optics can hinder the collected XRD data. In particular, the scattering from the collecting optics, creates additional contributions (such as shadows and diffraction signal) to the signal from the high-pressure chamber of the DAC. In order to avoid this situation, some beamlines only perform T measurements from the upstream side. In this way, the diffraction from the optical components is blocked by the DAC body, but it is not possible to measure the axial thermal gradients. Other beamlines use X-ray transparent mirrors (generally made of glassy carbon). This allows the T to be measured from both sides simultaneously, adding a minor diffuse contribution to the XRD signal from the amorphous mirrors. The temperature can also be measured simultaneously from both sides using a perforated mirror (few mm holes) at each side of the cell. In this way, the micrometric direct X-ray beam passes through both mirrors without causing any scattering (or losing any flux).
3.2. LH-DAC and XAS
XAS is an element selective technique, suitable for probing the local environment around a given element in a molecule or compound. When an X-ray photon impinges on the sample, a photoelectron is generated, which propagates as a wave inside the sample and then scatters against the first neighbors. For photoelectrons generated with a kinetic energy of a few tenths of eV, the interference between the outgoing and the incoming wave modulates the oscillations in the EXAFS (Extended X-ray Absorption Fine Structure) region of the spectrum. This part of the signal is thus sensitive to the local structure around the absorbing atom. However, the XANES (X-ray Absorption Near Edge Structure) part of the signal corresponds to photoelectrons generated with a lower kinetic energy and a longer mean free path. Therefore, this signal reflects the multiple scattering of the photoelectron with the atoms of the sample. As the probability of absorption in the near edge region is strongly influenced by the electronic density of states just above the Fermi level, the XANES part of the absorption signal contains information on the electronic structure.
These characteristics make XAS a very informative technique, able to provide (in situ) both structural and chemical information of the sample at high P and T. The technique can be used to probe local, electronic and magnetic structure at high P and T, obtaining information about phase diagrams, compressibility for solids and liquids and chemical partitioning with implications for fundamental and planetary science.
Due to technical challenges, the coupling between LH-DAC and XAS has been finalized only recently [26]. One of the fundamental aspects that was considered during the development, was the need for fast acquisition time (as previously discussed). For this reason, the system was built on an energy-dispersive beamline [180], where the high flux “pink beam” from the beamline undulators is both focused and energy-dispersed by a polychromator, allowing the acquisition of a complete XAS spectrum to be performed in a few ms using a fast position sensitive detector, without beam stability problems. This system was built in the off-axis geometry, where the lenses face the diamonds, the lasers and the X-rays reach the sample with two different directions. More details on the system’s geometry are provided in Kantor et al. [26].
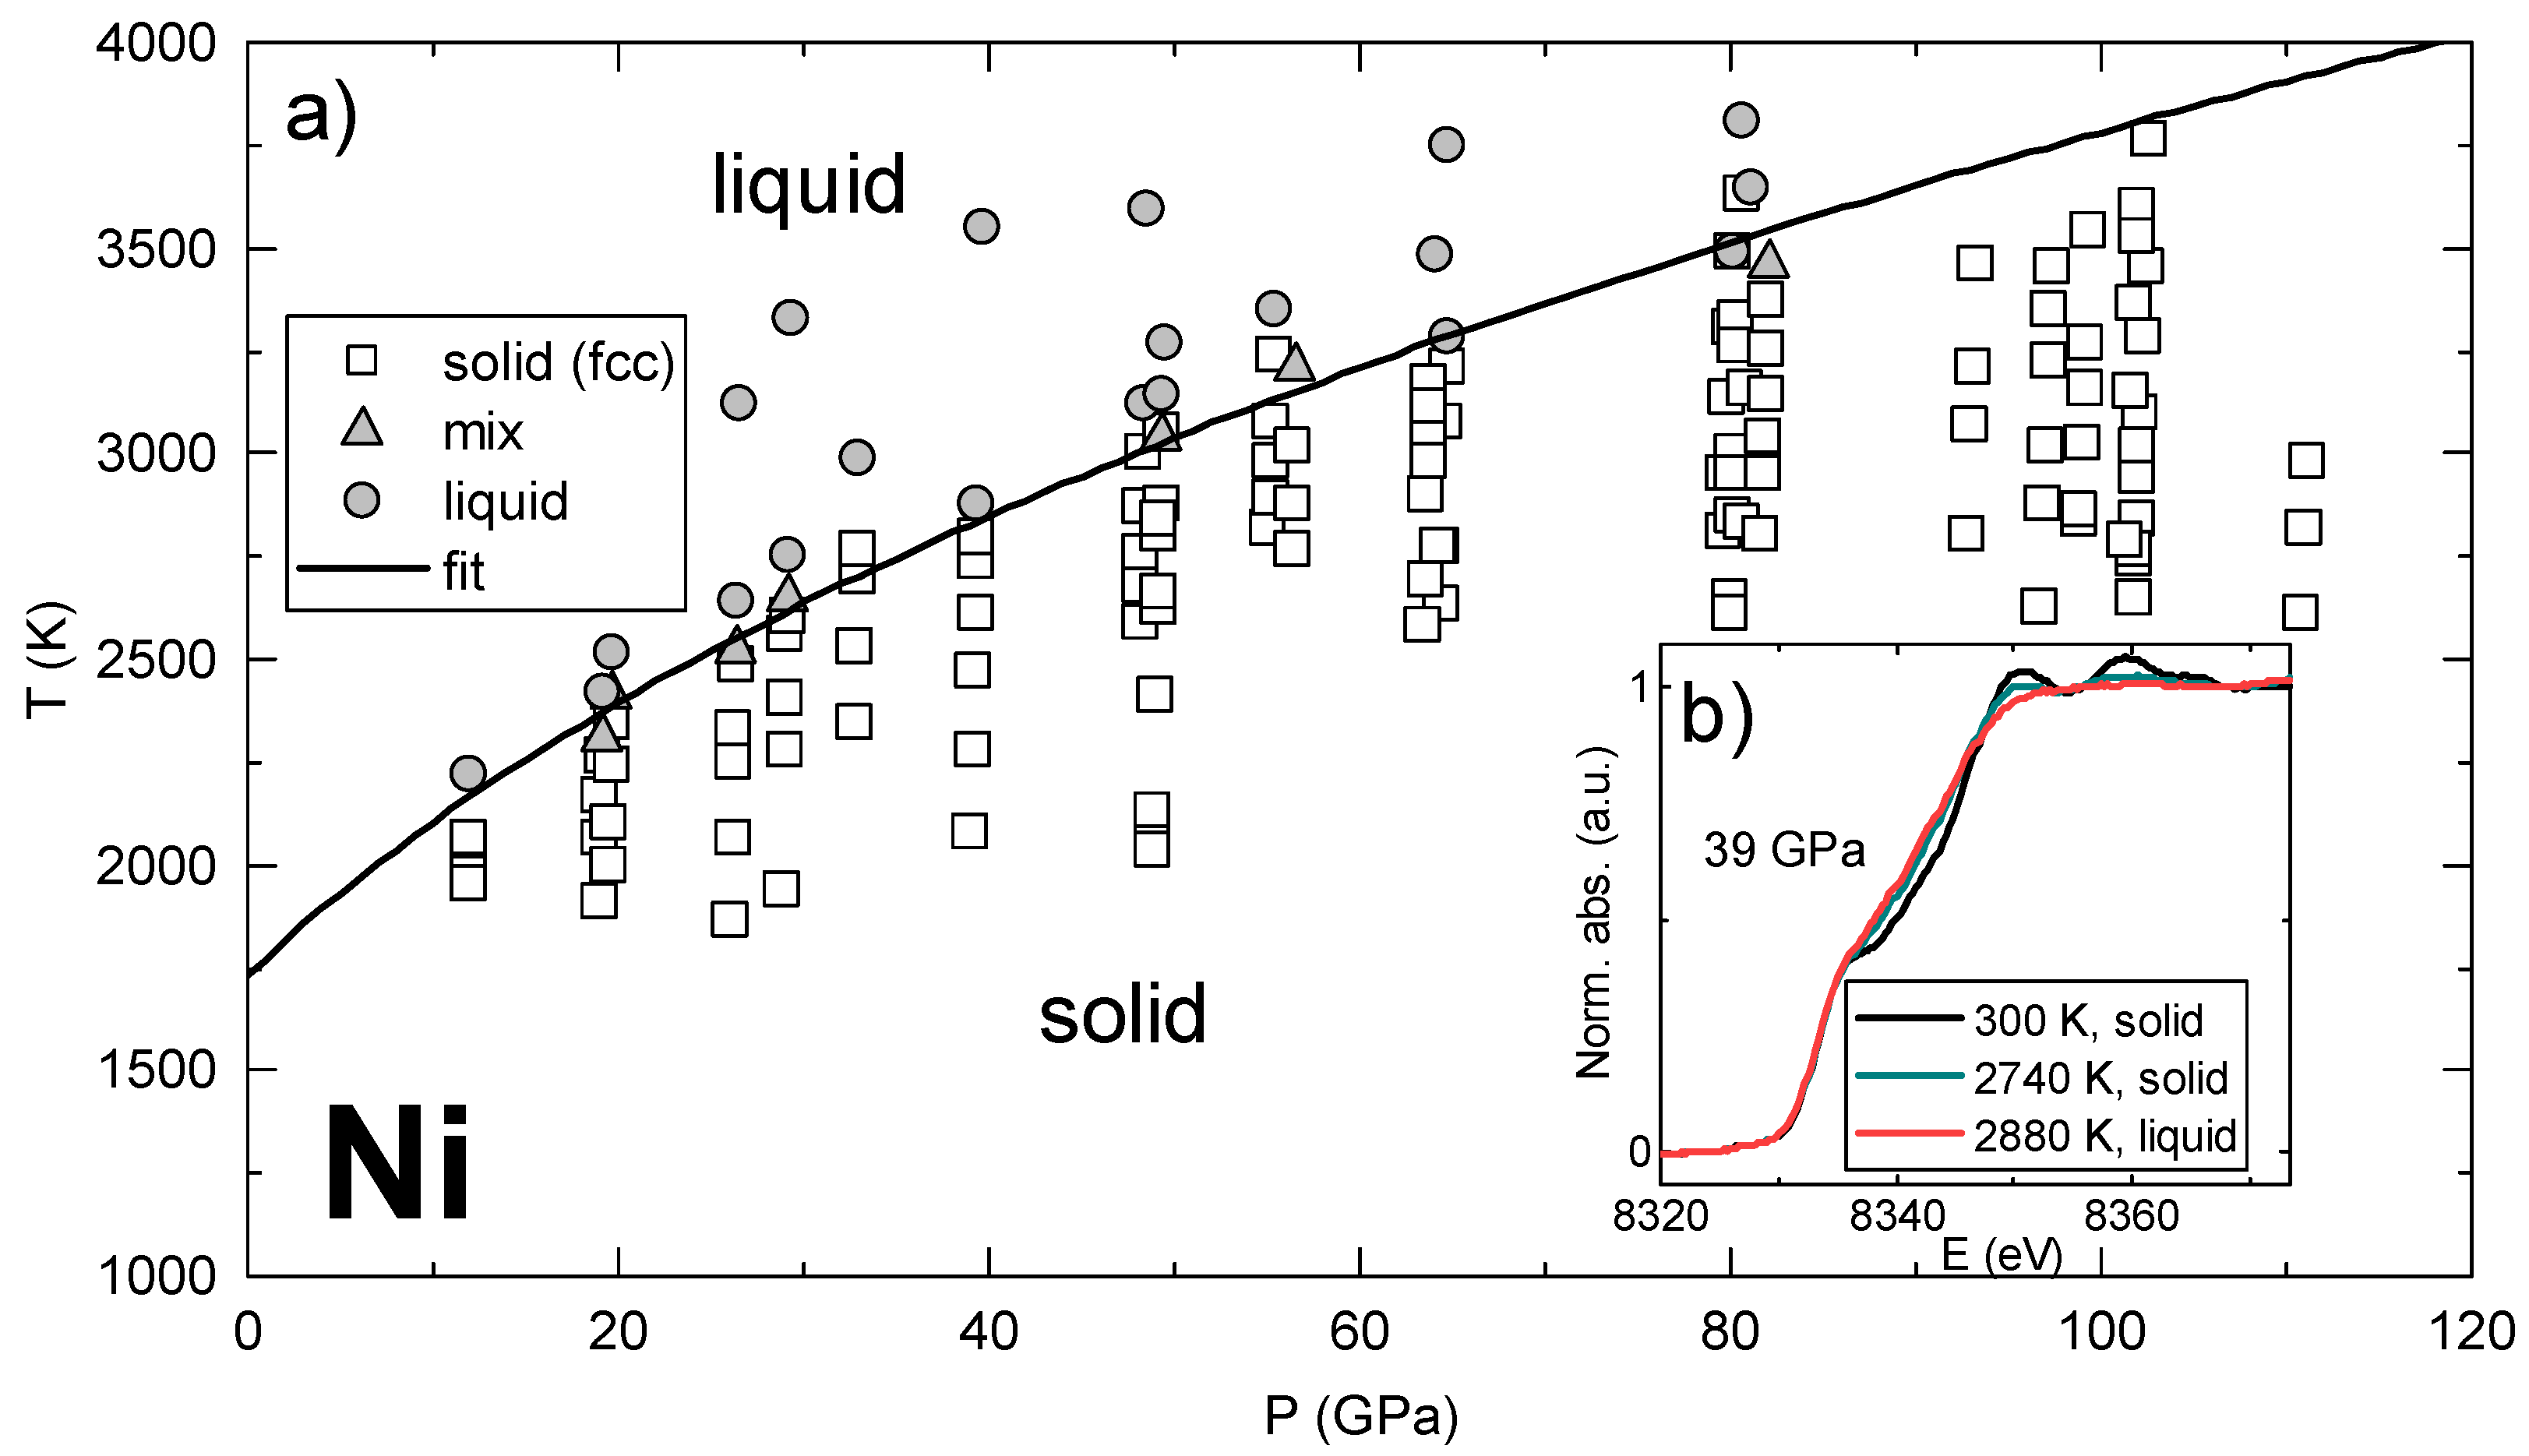
Pioneering high P and high T experiments were performed with portable systems and consisted of the detection of melting of iron [24] and study of the chemistry of mantle minerals [160]. The past years, have seen a rise in LH-DAC experiments coupled with XAS. In particular, since the first pioneering work by Boehler et al. [24], a lot of efforts have been dedicated to the XANES determination of phase diagrams and in particular the melting curves of late 3d transition metals such as Fe [29,124], Ni [28], Co [181], and late 3d transition metal-bearing binary systems such as Fe-C, Fe-O, Fe-S and Fe-Si [182] as well as Fe-Ni [183]. The example of Ni melting curve detected with XANES is represented in Figure 9, where solid and liquid spectra are represented. In Boccato et al. [182] it has also been proposed to use XANES to track the variation of light elements due to the non-congruent melting.
The potential in the EXAFS determination of the compressibility of liquid nickel and cobalt has also been proven [25,30], therefore preparing the ground for the study of the high P-T behavior of more complex liquids. Furthermore, XAS can be exploited to study the chemical behavior of geochemically interesting systems at high pressure and temperature [91,184,185,186,187] and to study the disorder in laser annealed systems under high pressure [188]. The sensitivity of XAS to the chemical properties also allowed the comparison between PL and CW heating [40].
Finally, Kantor et al. [93] showed that by exploiting the fast integration time of the FReLoN detector (at maximum performance down to ∼250 s—full frame rate of 4230 frames/s), it is possible to use LH and XAS to characterize in situ the kinetics of reactions happening at high T.
Author Contributions
Both authors contributed equally to this work. All authors have read and agreed to the published version of the manuscript.
Acknowledgments
We want to thank C.M. Beavers and D. Errandonea for their precious comments on the manuscript. O.T. Lord for the help with Figure 6 and N.C. Siersch for the Raman data. We also want to thank our three anonymous reviewers for their constructive remarks and comments that have improved the quality of this work.
Conflicts of Interest
The authors declare no conflict of interest.
Abbreviations
The following abbreviations are used in this manuscript:
| CRL | Compounds Refractive Lenses |
| CW | Continuous Wave, laser in continuous mode |
| DAC | Diamond Anvil Cell |
| EoS | Equation of State |
| ESRF | European Synchrotron Radiation Facility |
| FIB | Focused Ion Beam |
| FWHM | Full Width Half Maximum |
| EXAFS | Extended X-ray Absorption Fine Structure |
| IR | Infrared |
| KB | Kirkpatrick–Baez mirrors |
| LH-DAC | Laser-Heated Diamond Anvil Cell |
| NIST | National Institute of Standards and Technology |
| NPD | Nano-Polycrystalline Diamond |
| P | Pressure |
| Pair Distribution Function | |
| PL | Pulsed Laser |
| PTM | Pressure Transmitting Medium |
| T | Temperature |
| XANES | X-ray Absorption Near Edge Structure |
| XAS | X-ray Absorption Spectroscopy |
| XRD | X-ray Diffraction |
References
- Ming, L.; Bassett, W. Laser heating in the diamond anvil press up to 2000 C sustained and 3000 C pulsed at pressures up to 260 kilobars. Rev. Sci. Instrum. 1974, 45, 1115. [Google Scholar] [CrossRef]
- Saxena, S.; Dubrovinsky, L.; Haggkvist, P.; Cerenius, Y.; Shen, G.; Mao, H. Synchrotron X-ray study of iron at high pressure and temperature. Science 1995, 269, 1703. [Google Scholar] [CrossRef] [PubMed]
- Zerr, A.; Diegeler, A.; Boehler, R. Solidus of Earth’s Deep Mantle. Science 1998, 281, 243. [Google Scholar] [CrossRef] [PubMed]
- Goncharov, A.; Beck, P.; Struzhkin, V.; Hemley, R.; Crowhurst, J. Laser-heating diamond anvil cell studies of simple molecular systems at high pressures and ttemperature. J. Phys. Chem. Solids 2008, 69, 2217. [Google Scholar] [CrossRef]
- Boehler, R. High-pressure experiments and the phase diagram of lover mantle and core materials. Rev. Geophys. 2000, 38, 221–245. [Google Scholar] [CrossRef]
- Anzellini, S.; Dewaele, A.; Mezouar, M.; Loubeyre, P.; Morard, G. Melting of iron at Earth’s inner core boundary based on fast X-ray diffraction. Science 2013, 340, 464–466. [Google Scholar] [CrossRef]
- Salamat, A.; Fischer, R.; Briggs, R.; McMahon, M.; Petitgirard, S. In situ synchrotron X-ray diffraction in the laser-heated diamond anvil cell: Melting phenomena and synthesis of new materials. Coord. Chem. Rev. 2014, 277–278, 15–30. [Google Scholar] [CrossRef]
- Tateno, S.; Hirose, K.; Ohishi, Y.; Tatsumi, Y. The structure of iron in Earth’s Inner core. Science 2010, 330, 359. [Google Scholar] [CrossRef]
- Zhou, Q.; Ma, Y.; Cui, Q.; Cui, T.; Zhang, J.; Xie, Y.; Yang, K.; Zou, G. Raman scattering system for a laser heated diamond anvil cell. Rev. Sci. Instrum. 2004, 75, 2432. [Google Scholar] [CrossRef]
- Goncharov, A.; Crowhurst, J. Pulsed laser Raman spectroscopy in the laser-heated diamond anvil cell. Rev. Sci. Instrum. 2005, 76, 063905. [Google Scholar] [CrossRef] [Green Version]
- Zhang, J.; Bass, J.; Zhou, G. Single-crystal Brillouin spectroscopy with CO2 laser heating and variable q. Rev. Sci. Instrum. 2015, 86, 063905. [Google Scholar] [CrossRef] [PubMed]
- Zinin, P.; Prakapenka, V.; Burgess, K.; Odake, S.; Chigarev, N.; Sharma, S. Combined laser ultrasonic, laser heating and Raman scattering in diamond anvil cell system. Rev. Sci. Instrum. 2016, 87, 123908. [Google Scholar] [CrossRef] [PubMed]
- Lin, J.; Santoro, M.; Struzhkin, V.; Mao, H.; Hemley, R. In situ high pressure-temperature Raman spectroscopy technique with laser-heated diamond anvil cells. Rev. Sci. Instrum. 2004, 75, 3302. [Google Scholar] [CrossRef]
- Meier, T.; Dwivedi, A.; Khandarkhaeva, S.; Fedotenko, T.; Dobroviskaia, N.; Dubrovinsky, L. Table-top nuclear magnetic resonance system for high-pressure studies with in situ laser-heating. Rev. Sci. Instrum. 2019, 90, 123901. [Google Scholar] [CrossRef] [PubMed]
- Kurnosov, A.; Marquardt, H.; Dubrovinsky, L.; Potapkin, V. A waveguide-based flexible CO2-laser heating system for diamond-anvil cell applications. C. R. Geosci. 2019, 351, 280–285. [Google Scholar] [CrossRef]
- Li, F.; Cui, Q.; He, Z.; Cui, T.; Gao, C.; Zhou, Q.; Zhou, G. Brillouin scattering spectroscopy for a laser heated diamond anvil cell. Appl. Phys. Lett. 2006, 88, 203507. [Google Scholar] [CrossRef]
- Petitgirard, S.; Salamat, A.; Beck, P.; Weck, G.; Bouvier, P. Strategies for in situ laser heating in the diamond anvil cell at an X-ray diffraction beamline. J. Synchrotron Radiat. 2014, 21, 89–96. [Google Scholar] [CrossRef] [Green Version]
- Anzellini, S.; Kleppe, A.; Daisenberger, D.; Wharmby, M.; Giampaoli, R.; Boccato, S.; Baron, M.; Miozzi, F.; Keeble, D.; Ross, A.; et al. Laser-heating system for high-pressure X-ray diffraction at the extreme condition beamline I15 at Diamond Light Source. J. Synchrotron Radiat. 2018, 25, 1860–1868. [Google Scholar] [CrossRef]
- Prakapenka, V.; Kubo, A.; Kuznetsov, A.; Laskin, A.; Shkurikhin, O.; Dera, P.; Rivers, M.; Sutton, S. Advanced flat top laser heating system for high pressure research at GSECARS: Application to the melting behaviour of germanium. High Press. Res. 2008, 28, 225. [Google Scholar] [CrossRef]
- Meng, Y.; Hrubiak, R.; Rod, E.; Boehler, R.; Shen, G. New development in laser-heated diamond anvil cell with in situ synchrotron X-ray diffraction at high pressure collaborative access team. Rev. Sci. Instrum. 2015, 86, 072201. [Google Scholar] [CrossRef] [Green Version]
- Stan, C.; Beavers, C.; Kunz, M.; Tamura, N. X-ray diffraction under extreme conditions at the advanced light source. Quantum Beam Sci. 2018, 2, 4. [Google Scholar] [CrossRef] [Green Version]
- Liermann, H.; Konopkova, Z.; Morgenroth, W.; Glazyrin, K.; Bednarcik, J.; McBride, E.; Petitgirard, S.; Delitz, J.; Wendt, M.; Bican, Y.; et al. The extreme condition beamline P02.2 and the Extreme Conditions Science Infrastructure at PETRA III. J. Synchrotron Radiat. 2015, 22, 908. [Google Scholar] [CrossRef] [PubMed] [Green Version]
- Watanuki, T.; Shimomura, O. Construction of laser-heated diamond anvil cell system for in situ X-ray diffraction study at Spring-8. Rev. Sci. Instrum. 2001, 72, 1289. [Google Scholar] [CrossRef]
- Boehler, R.; Musshoff, H.G.; Ditz, R.; Aquilanti, G.; Trapananti, A.; Boehler, R.; Musshoff, H.G.; Ditz, R.; Aquilanti, G.; Trapananti, A. Portable laser-heating stand for synchrotron applications. Rev. Sci. Instrum. 2009, 80, 045103. [Google Scholar] [CrossRef] [PubMed] [Green Version]
- Torchio, R.; Boccato, S.; Cerantola, V.; Morard, G.; Irifune, T.; Kantor, I. Probing the local, electronic and magnetic structure of matter under extreme conditions of temperature and pressure. High Press. Res. 2016, 36, 293–302. [Google Scholar] [CrossRef]
- Kantor, I.; Marini, C.; Mathon, O.; Pascarelli, S. A laser heating facility for energy-dispersive X-ray absorption spectroscopy. Rev. Sci. Instrum. 2018, 89, 1–13. [Google Scholar] [CrossRef]
- Boccato, S.; Sanson, A.; Kantor, I.; Mathon, O.; Dyadkin, V.; Chernyshov, D.; Carnera, A.; Pascarelli, S. Thermal and magnetic anomalies of α -iron: An exploration by extended X-ray absorption fine structure spectroscopy and synchrotron X-ray diffraction. J. Phys. Condens. Matter 2016, 28, 355401. [Google Scholar] [CrossRef]
- Boccato, S.; Torchio, R.; Kantor, I.; Morard, G.; Anzellini, S.; Giampaoli, R.; Briggs, R.; Smareglia, A.; Irifune, T.; Pascarelli, S. The Melting Curve of Nickel Up to 100 GPa Explored by XAS. J. Geophys. Res. Solid Earth 2017, 122, 1–10. [Google Scholar] [CrossRef] [Green Version]
- Morard, G.; Boccato, S.; Rosa, A.; Anzellini, S.; Miozzi, F.; Henry, L.; Garbarino, G.; Mezouar, M.; Harmand, M.; Guyot, F.; et al. Solving Controversies on the Iron Phase Diagram Under High Pressure. Geophys. Res. Lett. 2018, 45, 11074–11082. [Google Scholar] [CrossRef] [Green Version]
- Boccato, S.; Torchio, R.; D’Angelo, P.; Trapananti, A.; Kantor, I.; Recoules, V.; Anzellini, S.; Morard, G.; Irifune, T.; Pascarelli, S. Compression of liquid Ni and Co under extreme conditions explored by X-ray absorption spectroscopy. Phys. Rev. B 2019, 100, 180101. [Google Scholar] [CrossRef]
- Sakamaki, T.; Ohtani, E.; Fukui, H.; Kamada, S.; Takahashi, S.; Sakairi, T.; Takahata, A.; Sakai, T.; Tsusui, S.; Ishikawa, D.; et al. Constraints on Earth’s inner core composition inferred from measurements of the sound velocity of hcp-iron in extreme conditions. Sci. Adv. 2016, 2, e1500802. [Google Scholar] [CrossRef] [PubMed] [Green Version]
- Kawaguchi, S.I.; Nakajima, Y.; Hirose, K.; Komabayashi, T.; Ozawa, H.; Tateno, S.; Kuwayama, Y.; Tsutsui, S.; Baron, A.Q.R. Sound velocity of liquid Fe-Ni-S at high pressure. J. Geophys. Res. Solid Earth 2017, 122, 3624–3634. [Google Scholar] [CrossRef] [Green Version]
- Andrault, D.; Petitgirard, S.; Nigro, G.L.; Devidal, J.; Veronesi, G.; Garbarino, G.; Mezouar, M. Solid-liquid iron partitioning in Earth’s deep mantle. Nature 2012, 487, 354. [Google Scholar] [CrossRef] [PubMed]
- Potapkin, V.; McCammon, C.; Glazyrin, K.; Kantor, A.; Kupenko, I.; Prescher, C.; Sinmyo, R.; Smirnov, G.; Chumakov, A.; Ruffer, R.; et al. Effect of iron oxidation state on the electrical conductivity of the Earth’s lowe mantle. Nat. Commun. 2013, 4, 1427. [Google Scholar] [CrossRef] [Green Version]
- McCammon, C.; Dubrovinsky, L.; Narygina, O.; Kantor, I.; Wu, X.; Glazyrin, K.; Sergueev, I.; Chumakov, A. Low-spin Fe2+ in silicate perovskite and a possible layer at the base of the lower mantle. Phys. Earth Planet. Inter. 2010, 180, 215. [Google Scholar] [CrossRef] [Green Version]
- Kupenko, I.; Dubrovinsky, L.; Dubrovinskaia, N.; McCammon, C.; Glazyrin, K.; Bykova, E.; Ballaran, T.B.; Sinmyo, R.; Chumakov, A.; Potapkin, V.; et al. Portable double-sided laser-heating system for Mössbaur spectroscopy and X-ray diffraction experiments at synchrotron facilities with diamond anvil cells. Rev. Sci. Instrum. 2012, 83, 124501. [Google Scholar] [CrossRef]
- Fedotenko, T.; Dubrovinsky, L.; Aprilis, G.; Koemets, E.; Snigirev, A.; Snigireva, I.; Barannikiov, A.; Ershov, P.; Cova, F.; Dubrovinskaia, N. Laser heating setup for diamond anvil cells for in situ synchrotron and in house high and ultra-high pressure studies. Rev. Sci. Instrum. 2019, 90, 104501. [Google Scholar] [CrossRef]
- Fukui, H.; Sakai, T.; Sakamaki, T.; Kamada, S.; Takahashi, S.; Ohtani, E.; Baron, A. A compact system for generating extreme pressures and temperatures: An application of laser-heated diamond anvil cell to inelastic X-ray scattering. Rev. Sci. Instrum. 2013, 84, 113902. [Google Scholar] [CrossRef]
- Petitgirard, S.; Borchet, M.; Andrault, D.; Appel, K.; Mezouar, M.; Liermann, H. An in situ approach to study trace element partitioning in the laser heated diamond anvil cell. Rev. Sci. Instrum. 2012, 83, 013904. [Google Scholar] [CrossRef] [Green Version]
- Aprilis, G.; Kantor, I.; Kupenko, I.; Cerantola, V.; Pakhomova, A.; Collings, I.E.; Torchio, R.; Fedotenko, T.; Chariton, S.; Bykov, M.; et al. Comparative study of the influence of pulsed and continuous wave laser heating on the mobilization of carbon and its chemical reaction with iron in a diamond anvil cell. J. Appl. Phys. 2019, 125, 095901. [Google Scholar] [CrossRef] [Green Version]
- Murakami, M.; Asahara, Y.; Ohishi, Y.; Hirao, N.; Hirose, K. Development of in situ Brillouin spectroscopy at high pressure and high temperature with synchrotron radiation and infrared laser heating system: Application to the Earth’s deep interior. Phys. Earth Planet. Inter. 2009, 174, 282. [Google Scholar] [CrossRef]
- Funamori, N.; Yamamoto, S.; Yagi, T.; Kikegawa, T. Exploratory studies of silicate melt structure at high pressures and temperatures by in situ X-ray diffraction. J. Geophys. Res. Solid Earth 2004, 109, B03203. [Google Scholar] [CrossRef]
- Yamada, A.; Wang, Y.; Inoue, T.; Yang, W.; Park, C.; Yu, T.; Shen, G. High-pressure X-ray diffraction studies on the structure of liquid silicate using a Paris–Edinburgh type large volume press. Rev. Sci. Instrum. 2011, 82, 015103. [Google Scholar] [CrossRef] [PubMed]
- Sanloup, C.; Drewitt, J.; Crepisson, C.; Kono, Y.; Park, C.; McCammon, C.; Hennet, L.; Brassamin, S.; Bytchkov, A. Structure and density of molten fayalite at high pressure. Geochim. Cosmochim. Acta 2013, 118, 118. [Google Scholar] [CrossRef]
- Wang, Y.; Sakamaki, T.; Skinner, L.; Jing, Z.; Yu, T.; Kono, Y.; Park, C.; Shen, G.; Rivers, M.; Sutton, S. Atomistic insight into viscosity and density of silicate melts under pressure. Nat. Commun. 2014, 5, 3241. [Google Scholar] [CrossRef] [PubMed] [Green Version]
- Kono, Y.; Park, C.; Kenney-Benson, C.; Shen, G.; Wang, Y. Toward comprehensive studies of liquids at high pressures and high temperatures: Combined structure, elastic wave velocity, and viscosity measurements in the Paris–Edinburgh cell. Phys. Earth Planet. Inter. 2014, 228, 269. [Google Scholar] [CrossRef]
- Stinton, G.; MacLeod, S.; Cynn, H.; Errandonea, D.; Evans, W.; Proctor, J.; Meng, Y.; McMahon, M. Equation of state and high-pressure/high-temperature phase diagram of magnesium. Phys. Rev. B 2014, 90, 134105. [Google Scholar] [CrossRef] [Green Version]
- Errandonea, D.; MacLeod, S.; Ruiz-Fuertes, J.; Burakovsky, L.; McMahon, M.; Wilson, C.; Ibanez, J.; Daisenberger, D.; Popescu, C. High-pressure/high-temperature phase diagram of zinc. J. Phys. Condens. Matter 2018, 30, 295402. [Google Scholar] [CrossRef]
- Louvel, M.; Drewitt, J.; Ross, A.; Thwaites, R.; Heinen, B.; Keeble, D.; Beavers, C.; Walter, M.; Anzellini, S. The HXD95: A modified Bassett-type hydrothermal diamond-anvil cell for in situ XRD experiments up to 5 GPa and 1300 K. J. Synchrotron Radiat. 2020, 27, 529. [Google Scholar] [CrossRef] [Green Version]
- Anzellini, S.; Errandonea, D.; Cazorla, C.; MacLeod, S.; Monteseguro, V.; Boccato, S.; Bandiello, E.; Anichtchenko, D.; Popescu, C.; Beavers, C. Thermal equation of state of ruthenium characterized by resistively heated diamond anvil cell. Sci. Rep. 2020, 10, 7092. [Google Scholar] [CrossRef] [Green Version]
- Ozawa, H.; Tateno, S.; Xie, L.; Nakajima, Y.; Sakamoto, N.; Kawaguchi, S.; Yoneda, A.; Hirao, N. Boron-doped diamond as a new heating element for internal-resistive heated diamond-anvil cell. High Press. Res. 2018, 38, 120. [Google Scholar] [CrossRef]
- Sinmyo, R.; Hirose, K.; Ohishi, Y. Melting curve of iron to 290 GPa determined in a resistance-heated diamond-anvil cell. Earth Planet. Sci. Lett. 2019, 510, 45. [Google Scholar] [CrossRef]
- Dubrovinsky, L.; Dubrovinskaia, N.; Narygina, O.; Kantor, I.; Kuznetzov, A.; Prakapenka, V.; Vitos, L.; Johansson, B.; Mikhaylushkin, A.; Simak, S.; et al. Body-Centered Cubic Iron-Nickel Alloy in Earth’s Core. Science 2007, 316, 1880. [Google Scholar] [CrossRef] [PubMed]
- Boehler, R.; Nicol, M.; Johnson, M. Internally-Heated Diamond-Anvil Cell: Phase Diagram and P-V-T of Iron; Terra Scientific Publishing Company (TERRAPUB): Tokyo, Japan; American Geophysical Union: Washington, DC, USA, 1987; p. 173. [Google Scholar]
- Antonangeli, D.; Komabayashi, T.; Occelli, F.; Borissenko, E.; Walters, A.; Fiquet, G.; Fei, Y. Simultaneous sound velocity and density measurements of hcp iron up to 93 GPa and 1100 K: An experimental test of the Birch’s law at high temperature. Earth Planet. Sci. Lett. 2012, 331–332, 210. [Google Scholar] [CrossRef]
- Zha, C.; Bassett, W. Internal resistive heating in diamond anvil cell for in situ X-ray diffraction and Raman scattering. Rev. Sci. Instrum. 2003, 74, 1255. [Google Scholar] [CrossRef]
- Jenei, Z.; Cynn, H.; Visbeck, K.; Evans, W. High-temperature experiments using a resistively heated high-pressure membrane diamond anvil cell. Rev. Sci. Instrum. 2013, 84, 095114. [Google Scholar] [CrossRef] [PubMed]
- Komabayashi, T.; Hirose, K.; Ohishi, Y. In situ X-ray diffraction measurements of the fcc–hcp phase transition boundary of an Fe–Ni alloy in an internally heated diamond anvil cell. Phys. Chem. Miner. 2012, 39, 329. [Google Scholar] [CrossRef]
- Hrubiak, R.; Meng, Y.; Shen, G. Microstructures define melting of molybdenum at high pressure. Nat. Commun. 2016, 8, 14562. [Google Scholar] [CrossRef] [PubMed] [Green Version]
- Lin, J.; Sturhahn, W.; Zhao, J.; Shen, G.; Mao, H.; Hemley, R. Nuclear resonant inelastic X-ray scattering and synchrotron Mossbauer spectroscopy with laser-heated diamond anvil cells. In Advances in High-Pressure Technology for Geophysical Applications; Elsevier: Amsterdam, The Netherlands, 2005; p. 397. [Google Scholar]
- Kantor, I.; Prakapenka, V.; Kantor, A.; Dera, P.; Kurnosov, A.; Sinogeikin, S.; Dubrovinskaia, N.; Dubrovinsky, L. BX90: A new diamond anvil cell design for X-ray diffraction and optical measurements. Rev. Sci. Instrum. 2012, 83, 125102. [Google Scholar] [CrossRef]
- Merrill, L.; Bassett, W.A. Miniature diamond anvil pressure cell for single crystal X-ray diffraction studies. Rev. Sci. Instrum. 1974, 45, 290. [Google Scholar] [CrossRef]
- Boehler, R. New diamond cell for single-crystal X-ray diffraction. Rev. Sci. Instrum. 2006, 77, 115103. [Google Scholar] [CrossRef]
- Letoullec, R.; Pinceaux, J.; Loubeyre, P. The membrane diamond anvil cell: A new device for generating continuous pressure and temperature variations. High Press. Res. 1988, 1, 77. [Google Scholar] [CrossRef]
- Mao, H. High-Pressure Physics: Sustained Static Generation of 1.36 to 1.72 Megabars. Science 1978, 200, 1145. [Google Scholar] [CrossRef]
- Hemley, R.; Mao, H.; Shen, G.; Badro, J.; Gillet, P.; Hanfland, M.; Hausermann, D. X-ray Imaging of Stress and Strain of Diamond, Iron, and Tungsten at Megabar Pressures. Science 1997, 276, 1242. [Google Scholar] [CrossRef] [Green Version]
- Dewaele, A.; Loubeyre, P.; Occelli, F.; Marie, O.; Mezouar, M. Toroidal diamond anvil cell for detailed measurements under extreme static pressures. Nat. Commun. 2018, 9, 1–9. [Google Scholar] [CrossRef]
- Jenei, Z.; O’Bannon, E.; Weir, S.; Cynn, H.; Lipp, M.; Evans, W. Single crystal toroidal diamond anvils for high pressure experiments beyond 5 megabar. Nat. Commun. 2018, 9, 1–6. [Google Scholar] [CrossRef]
- Soignard, E.; Benmore, C.; Yarger, J. A perforated diamond anvil cell for high-energy X-ray diffraction of liquids and amorphous solids at high pressure. Rev. Sci. Instrum. 2010, 81, 035110. [Google Scholar] [CrossRef]
- Chapman, K.W.; Chupas, P.J.; Halder, G.J.; Hriljac, J.A.; Kurtz, C.; Greve, B.K.; Ruschman, C.J.; Wilkinson, A.P. Optimizing high-pressure pair distribution function measurements in diamond anvil cells. J. Appl. Crystallogr. 2010, 43, 297. [Google Scholar] [CrossRef]
- Ishimatsu, N.; Matsumoto, K.; Maruyama, H.; Kawamura, N.; Mizumaki, M.; Sumiya, H.; Irifune, T. Glitch-free X-ray absorption spectrum under high pressure obtained using nano-polycrystalline diamond anvils. J. Synchrotron Radiat. 2012, 19, 768–772. [Google Scholar] [CrossRef]
- Rosa, A.D.; Mathon, O.; Torchio, R.; Jacobs, J.; Pasternak, S.; Irifune, T.; Pascarelli, S. Nano-polycrystalline diamond anvils: Key devices for XAS at extreme conditions: Their use, scientific impact, present status and future needs. High Press. Res. 2019, 40, 65–81. [Google Scholar] [CrossRef]
- Klotz, S.; Chervin, J.C.; Munsch, P.; Le Marchand, G. Hydrostatic limits of 11 pressure. J. Phys. D Appl. Phys. 2009, 42, 075413. [Google Scholar] [CrossRef]
- Besson, J.; Pinceaux, J. Melting of Helium at Room Temperature and High Pressure REPORTS Melting of Helium at Room Temperature and High Pressure. Science 1979, 206, 1073. [Google Scholar] [CrossRef] [PubMed]
- Mao, H.K.; Hemley, R.J.; Wu, Y.; Jephcoat, A.P.; Finger, L.W.; Zha, C.S.; Bassett, W.A. High-Pressure Phase Diagram and Equation of State of Solid Helium from Single-Crystal X-ray Diffraction to 23.3 GPa. Phys. Rev. Lett. 1988, 60, 2649. [Google Scholar] [CrossRef] [PubMed]
- Sinmyo, R.; Hirose, K. The Soret diffusion in laser-heated diamond-anvil cell. Phys. Earth Planet. Inter. 2010, 180, 172–178. [Google Scholar] [CrossRef]
- Mezouar, M.; Giampaoli, R.; Garbarino, G.; Kantor, I.; Dewaele, A.; Weck, G.; Boccato, S.; Svitlyk, V.; Rosa, A.; Torchio, R.; et al. Methodology for in situ synchrotron X-ray studies in the laser-heated diamond anvil cell. High Press. Res. 2017, 37, 170–180. [Google Scholar] [CrossRef]
- Dewaele, A.; Mezouar, M.; Guignot, N.; Loubeyre, P. High melting points of tantalum in a laser-heated diamond anvil cell. Phys. Rev. Lett. 2010, 104, 29–31. [Google Scholar] [CrossRef] [Green Version]
- Karandikar, A.; Boehler, R. Flash melting of tantalum in a diamond cell to 85 GPa. Phys. Rev. B 2016, 93, 1–6. [Google Scholar] [CrossRef] [Green Version]
- Hrubiak, R.; Sinogeikin, S.; Rod, E.; Shen, G. The laser micro-machining system for diamond anvil cell experiments and general precision machining applications at the High Pressure Collaborative Access Team. Rev. Sci. Instrum. 2015, 86, 072202. [Google Scholar] [CrossRef]
- Anzellini, S.; Monteseguro, V.; Bandiello, E.; Dewaele, A.; Burakovsky, L.; Errandonea, D. In situ characterization of the high pressure- high temperature meltig curve of platinum. Sci. Rep. 2019, 9, 13034. [Google Scholar] [CrossRef] [Green Version]
- Weck, G.; Recoules, V.; Queyroux, J.; Datch, F.; Bouchet, J.; Ninet, S.; Garbarino, G.; Mezouar, M.; Loubeyre, P. Determination of the melting curve of gold up to 110 GPa. Phys. Rev. B 2020, 101, 014106. [Google Scholar] [CrossRef] [Green Version]
- Drewitt, J.; Walter, M.; Zhang, H.; MacMahon, S.; Edwards, D.; Heinen, B.; Lord, O.; Anzellini, S.; Kleppe, A. The fate of carbonate in oceanic crust subducted into Earth’s lower mantle. Earth Planet. Sci. Lett. 2019, 511, 213. [Google Scholar] [CrossRef]
- Baron, M.; Lord, O.; Myhill, R.; Thompson, A.; Wang, W.; Tronnes, R.; Walter, M. Experimental constraints on melting temperatures in the MgO–SiO2 system at lower mantle pressures. Earth Planet. Sci. Lett. 2017, 472, 186. [Google Scholar] [CrossRef] [Green Version]
- Dubrovinsky, L.; Dubrovinskaia, N.; Prakapenka, V.; Abakumov, A. Article Open Access Published: 23 October 2012 Implementation of micro-ball nanodiamond anvils for high-pressure studies above 6 Mbar. Nat. Commun. 2012, 3, 1163. [Google Scholar] [CrossRef] [PubMed]
- Zha, H.; Krasnicki, S.; Meng, Y.; Yan, C.; Lai, J.; Liang, Q.; Mao, H.; Hemley, R. Composite chemical vapor deposition diamond anvils for high-pressure/high-temperature experiments. High Press. Res. 2009, 29, 317. [Google Scholar] [CrossRef]
- Pepin, C.; Dewaele, A.; Geneste, G.; Loubeyre, P. New Iron Hydrides under High Pressure. Phys. Rev. Lett. 2014, 113, 265504. [Google Scholar] [CrossRef]
- Pepin, C.; Geneste, G.; Dewaele, A.; Mezouar, M.; Loubeyre, P. Synthesis of FeH5: A layered structure with atomic hydrogen slabs. Science 2017, 357, 382. [Google Scholar] [CrossRef] [Green Version]
- Laniel, D.; Dewaele, A.; Anzellini, S.; Guignot, N. Study of the iron nitride FeN into the megabar regime. J. Alloys Compd. 2018, 733, 53. [Google Scholar] [CrossRef]
- Breton, H.; Komabayashi, T.; Thompson, S.; Potts, N.; McGuire, C.; Suehiro, S.; Anzellini, S.; Ohishi, Y. Static compression of Fe4N to 77 GPa and its implications for nitrogen storage in the deep Earth. Am. Mineral. 2019, 104, 1781. [Google Scholar] [CrossRef]
- Rosa, A.; Bouhifd, M.; Morard, G.; Briggs, R.; Garbarino, G.; Irifune, T.; Mathon, O.; Pascarelli, S. Krypton storage capacity of the Earth’s lower mantle. Earth Planet. Sci. Lett. 2020, 532, 116032. [Google Scholar] [CrossRef]
- Shen, G.; Prakapenka, V.B.; Rivers, M.L.; Sutton, S.R. Structure of liquid iron at pressures up to 58 GPa. Phys. Rev. Lett. 2004, 92, 185701. [Google Scholar] [CrossRef]
- Kantor, I.; Labiche, J.C.; Collet, E.; Siron, L.; Thevenin, J.J.; Ponchut, C.; Borrel, J.; Mairs, T.; Marini, C.; Strohm, C.; et al. A new detector for sub-millisecond EXAFS spectroscopy at the European Synchrotron Radiation Facility. J. Synchrotron Radiat. 2014, 21, 1240–1246. [Google Scholar] [CrossRef] [PubMed] [Green Version]
- Smith, D.; Smith, J.; Childs, C.; Rod, E.; Hrubiak, R.; Shen, G.; Salamat, A. A CO2 laser heating system fo in situ high pressure-temperature experiments at HPCAT. Rev. Sci. Instrum. 2018, 89, 083901. [Google Scholar] [CrossRef] [PubMed]
- Du, Z.; Amulele, G.; Benedetti, L.; Lee, K. Mapping temperatures and temperatures gradients during flash heating in a diamond anvil cell. Rev. Sci. Instrum. 2013, 84, 075111. [Google Scholar] [CrossRef]
- Geballe, Z.M.; Jeanloz, R. Origin of temperature plateaus in laser-heated diamond anvil cell experiments. J. Appl. Phys. 2012, 111, 123518. [Google Scholar] [CrossRef]
- Geballe, Z.; Collins, G.; Jeanloz, R. Modulation calorimetry in diamond anvil cells. I. Heat flow models. J. Appl. Phys. 2017, 121, 145902. [Google Scholar] [CrossRef] [Green Version]
- Boehler, R. Melting of the FeFeO and the FeFeS systems at high pressure: Constraints on core temperatures. Earth Planet. Sci. Lett. 1992, 111, 217–227. [Google Scholar] [CrossRef]
- Errandonea, D. Phase behavior of metals at very high P-T conditions: A review of recent experimental studies. J. Phys. Chem. Solids 2006, 67, 2018. [Google Scholar] [CrossRef]
- Shen, G.; Rivers, M.; Wang, Y.; Sutton, S. Laser heated diamond anvil cell system at the Advanced Photon Source for in situ X-ray measurements at high pressure and temperature. Rev. Sci. Instrum. 2001, 72, 1273. [Google Scholar] [CrossRef]
- Spiekermann, G.; Kupenko, I.; Petitgirard, S.; Harder, M.; Nyrow, A.; Weis, C.; Albers, C.; Biedermann, N.; Libon, L.; Sahle, C.; et al. A portable on-axis laser-heating system for near-90 X-ray spectroscopy: Application to ferropericlase and iron silicide. J. Synchrotron Radiat. 2019, 27, 414. [Google Scholar] [CrossRef] [Green Version]
- Hasegawa, A.; Yagi, T.; Ohta, K. Combination of pulsed light heating thermoreflectance and laser-heated diamond anvil cell for in-situ high pressure-temperature thermal diffusivity measurements. Rev. Sci. Instrum. 2019, 90, 074901. [Google Scholar] [CrossRef] [Green Version]
- Hirao, N.; Kawaguchi, S.; Hirose, K.; Shimuzu, K.; Ohtani, E.; Ohishi, Y. New developments in high-pressure X-ray diffraction beamline for diamond anvil cell at Spring-8. Matter Radiat. Extrem. 2020, 5, 018403. [Google Scholar] [CrossRef] [Green Version]
- Bykova, E.; Aprilis, G.; Bykov, M.; Glazyrin, K.; Wendt, M.; Wenz, S.; Liermann, H.; Roeh, J.; Ehnes, A.; Dubrovinskaia, N.; et al. Single-crystal diffractometer coupled with double-sided laser heating system at the Extreme Conditions Beamline P02.2 at PETRAIII. Rev. Sci. Instrum. 2019, 90, 073907. [Google Scholar] [CrossRef] [PubMed]
- Lord, O.; Wood, I.; Dobson, D.; Vocadlo, L.; Wang, W.; Thomson, A.; Wann, E.; Morard, G.; Mezouar, M.; Walter, M. The melting curve of Ni to 1 Mbar. Earth Planet. Sci. Lett. 2014, 408, 226–236. [Google Scholar] [CrossRef] [Green Version]
- Lord, O.T.; Wann, E.T.H.; Hunt, S.A.; Walker, A.M.; Santangeli, J.; Walter, M.J.; Dobson, D.P.; Wood, I.G.; Vocadlo, L.; Morard, G.; et al. The NiSi melting curve to 70 GPa. Phys. Earth Planet. Inter. 2014, 233, 13–23. [Google Scholar] [CrossRef] [Green Version]
- Giampaoli, R.; Kantor, I.; Mezouar, M.; Boccato, S.; Rosa, A.D.; Torchio, R.; Garbarino, G.; Mathon, O.; Pascarelli, S. Measurement of temperature in the laser heated diamond anvil cell: Comparison between reflective and refractive optics. High Press. Res. 2018, 38, 250–269. [Google Scholar] [CrossRef]
- Prakapenka, V.; Shen, G.; Dubrovinsky, L. Carbon transport in diamond anvil cell. High Temp. High Press. 2003, 35/36, 237. [Google Scholar] [CrossRef]
- Dewaele, A.; Mezouar, M.; Guignot, N.; Loubeyre, P. Melting of lead under high pressure studied using second-scale time-resolved X-ray diffraction. Phys. Rev. B Condens. Matter Mater. Phys. 2007, 76, 1–5. [Google Scholar] [CrossRef]
- Goncharov, A.; Prakapenka, V.; Struzhkin, V.; Kantor, I.; Rivers, M.; Dalton, D. X-ray diffraction in the pulsed laser heated diamond anvil cell. Rev. Sci. Instrum. 2010, 81, 113902. [Google Scholar] [CrossRef]
- Yang, L.; Karandikar, A.; Boehler, R. Flash heating in the diamond cell: Melting curve of rhenium. Rev. Sci. Instrum. 2012, 83, 063905. [Google Scholar] [CrossRef]
- Shen, G.; Wang, L.; Ferry, R.; Mao, H.; Hemley, R. A portable laser heating microscope for high pressure research. J. Phys. Conf. Ser. 2010, 215, 012191. [Google Scholar] [CrossRef]
- Errandonea, D. The melting curve of ten metals up to 12 GPa and 1600 K. J. Appl. Phys. 2010, 108, 033517. [Google Scholar] [CrossRef]
- Anzellini, S.; Errandonea, D.; MacLeod, S.; Botella, P.; Daisenberger, D.; DeAth, J.; Gonzalez-Platas, J.; Ibanez, J.; McMahon, M.; Munro, K.; et al. Phase diagram of calcium at high pressure and high temperature. Phys. Rev. Mater. 2018, 2, 083608. [Google Scholar] [CrossRef]
- Sanloup, C.; de Grouchy, C. X-ray Diffraction Structure Measurements; Elsevier: Amsterdam, The Netherlands, 2018; Chapter 5; p. 137. [Google Scholar]
- Rosa, A.; Merkulova, M.; Garbarino, G.; Svitlyk, V.; Jacobs, J.; Sahle, C.; Mathon, O.; Munoz, M.; Merkel, S. Amorphous boron composite gaskets for in situ high-pressure and high-temperature studies. High Press. Res. 2016, 36, 564. [Google Scholar] [CrossRef]
- Mijiti, Y.; Trapananti, A.; Minicucci, M.; Ciambezi, M.; Coquet, J.; Nataf, L.; Baudelet, F.; Cicco, A.D. Development of a high temperature diamond anvil cell for x ray absorption experiments under extreme conditions. Radiat. Phys. Chem. 2018, 108106. [Google Scholar] [CrossRef]
- Zhang, F.; Wu, Y.; Lou, H.; Zeng, Z.; Prakapenka, V.; Greenberg, E.; Ren, Y.; Yan, J.; Okasinski, J.; Liu, X.; et al. Polymorphism in a high-entropy alloy. Nat. Commun. 2017, 8, 15687. [Google Scholar] [CrossRef] [Green Version]
- Walter, M.J.; Koga, K.T. The effects of chromatic dispersion on temperature measurement in the laser-heated diamond anvil cell. Phys. Earth Planet. Inter. 2004, 143–144, 541–558. [Google Scholar] [CrossRef]
- Aprilis, G.; Strohm, C.; Kupenko, I.; Linhardt, S.; Laskin, A.; Vasiukov, D.; Cerantola, V.; Koemets, E.; McCammon, C.; Kurnosov, A.; et al. Portable double-sided pulsed laser heating system for time-resolved geoscience and materials science applications. Rev. Sci. Instrum. 2017, 88, 084501. [Google Scholar] [CrossRef] [Green Version]
- Jeanloz, R.; Kavner, A. Melting criteria and imaging spectroradiometry in laser-heated diamond-cell experiments. Philos. Trans. R. Soc. A 1996, 354, 1279. [Google Scholar]
- Williams, Q.; Knittle, E.; Jeanloz, R. The high-pressure melting curve of iron: A technical discussion. J. Geophys. Res. 1991, 96, 2171. [Google Scholar] [CrossRef]
- Jackson, J.M.; Sturhahn, W.; Lerche, M.; Zhao, J.; Toellner, T.S.; Alp, E.E.; Sinogeikin, S.V.; Bass, J.D.; Murphy, C.A.; Wicks, J.K. Melting of compressed iron by monitoring atomic dynamics. Earth Planet. Sci. Lett. 2013, 362, 143–150. [Google Scholar] [CrossRef]
- Aquilanti, G.; Trapananti, A.; Karandikar, A.; Kantor, I.; Marini, C.; Mathon, O.; Pascarelli, S.; Boehler, R. Melting of iron determined by X-ray absorption spectroscopy to 100 GPa. Proc. Natl. Acad. Sci. USA 2015, 112, 12042–12045. [Google Scholar] [CrossRef] [PubMed] [Green Version]
- Benedetti, L.; Loubeyre, P. Temperature gradients, wavelength-dependent emissivity, and accuracy of high and very-high temperatures measured in the laser-heated diamond cell. High Press. Res. 2004, 24, 423–445. [Google Scholar] [CrossRef]
- Queyroux, J.; Ninet, S.; Weck, G.; Garbarino, G.; Plisson, T.; Mezouar, M.; Datchi, F. Melting curve and chemical stability of ammonia at high pressure: Combined X-ray diffraction and Raman study. Phys. Rev. B 2019, 99, 134107. [Google Scholar] [CrossRef]
- Anzellini, S. Phase Diagram of Iron under Extreme Conditions Measured with Time-Resolved Methods. Ph.D. Thesis, Université Pierre et Marie Curie, Paris, France, 2014. [Google Scholar]
- Parisiades, P.; Cova, F.; Garbarino, G. Melting curve of elemental zirconium. Phys. Rev. B 2019, 100, 054102. [Google Scholar] [CrossRef] [Green Version]
- Lord, O.; Wang, W. Mirrors: A Matlab(R) GUI for temperature measurment by multispectral imaging radiometry. Rev. Sci. Instrum. 2018, 89, 104903. [Google Scholar] [CrossRef] [Green Version]
- Kavner, A.; Panero, W.R. Temperature gradients and evaluation of thermoelastic properties in the synchrotron-based laser-heated diamond cell. Phys. Earth Planet. Inter. 2004, 143–144, 527–539. [Google Scholar] [CrossRef]
- Briggs, R.; Daisenberger, D.; Lord, O.T.; Salamat, A.; Bailey, E.; Walter, M.J.; McMillan, P.F. High-pressure melting behavior of tin up to 105 GPa. Phys. Rev. B 2017, 95, 054102. [Google Scholar] [CrossRef] [Green Version]
- Kavner, A.; Nugent, C. Precise measurements of radial temperature gradients in the laser-heated diamond anvil cell. Rev. Sci. Instrum. 2008, 79, 024902. [Google Scholar] [CrossRef]
- Rainey, E.; Kavner, A. Peak scaling method to measure temperatures in the laser-heated diamond anvil cell and application to the thermal conductivity of MgO. J. Geophys. Res. Solid Earth 2014, 119, 8154. [Google Scholar] [CrossRef]
- Kunz, M.; Yan, J.; Cornell, E.; Domning, E.; Yen, C.; Doran, A.; Beavers, C.; Treger, A.; Williams, Q.; MacDowell, A. Implementation and application of the peak scaling method for temperature measurement in the laser heated diamond anvil cell. Rev. Sci. Instrum. 2018, 89, 083903. [Google Scholar] [CrossRef] [Green Version]
- Campbell, A. Measurement of temperature distributions across laser heated samples by multispectral imaging radiometry. Rev. Sci. Instrum. 2008, 79, 015108. [Google Scholar] [CrossRef] [PubMed] [Green Version]
- Walter, M.; Thompson, A.; Wang, W.; Lord, O.; Ross, J.; McMahon, S.C.; Baron, M.A.; Melekhova, E.; Kleppe, A.; Kohn, S. The stability of hydrous silicates in Earth’s lower mantle: Experimental constraints from the systems MgO–SiO2–H2O and MgO–Al2O3–SiO2–H2O. Chem. Geol. 2015, 418, 16. [Google Scholar] [CrossRef] [Green Version]
- Ballaran, T.; Kurnosov, A.; Trots, D. Single-crystal X-ray diffraction at extreme conditions: A review. High Press. Res. 2013, 33, 453. [Google Scholar] [CrossRef]
- Merkel, S.; Hemley, R.; Mao, H. Finite-element modeling of diamond deformation at multimegabar pressures. Appl. Phys. Lett. 1999, 74, 656. [Google Scholar] [CrossRef]
- Liu, L.; Bi, Y.; Xu, J.A. Ruby fluorescence pressure scale: Revisited. Chin. Phys. B 2013, 22, 056201. [Google Scholar] [CrossRef]
- Dewaele, A.; Loubeyre, P.; Mezouar, M. Equations of state of six metals above 94 GPa. Phys. Rev. B 2004, 094112, 1–8. [Google Scholar]
- Chijioke, A.D.; Nellis, W.J.; Soldatov, A.; Silvera, I.F. The ruby pressure standard to 150GPa. J. Appl. Phys. 2005, 98, 114905. [Google Scholar] [CrossRef] [Green Version]
- Silvera, I.F.; Chijioke, A.D.; Nellis, W.J.; Soldatov, A.; Tempere, J. Calibration of the ruby pressure scale to 150 GPa. Phys. Status Solidi 2007, 244, 460–467. [Google Scholar] [CrossRef]
- Dorogokupets, P.I.; Oganov, A.R. Ruby, metals, and MgO as alternative pressure scales: A semiempirical description of shock-wave, ultrasonic, X-ray, and thermochemical data at high temperatures and pressures. Phys. Rev. B 2007, 75, 024115. [Google Scholar] [CrossRef]
- Datchi, F.; Dewaele, A.; Loubeyre, P.; Letoullec, R.; Le Godec, Y.; Canny, B. Optical pressure sensors for high-pressure-high-temperature studies in a diamond anvil cell. High Press. Res. 2007, 27, 447. [Google Scholar] [CrossRef]
- Dewaele, A.; Torrent, M.; Loubeyre, P.; Mezouar, M. Compression curves of transition metals in the Mbar range: Experiments and projector augmented-wave calculations. Phys. Rev. B Condens. Matter Mater. Phys. 2008, 78, 1–13. [Google Scholar] [CrossRef]
- Syassen, K. Ruby under pressure. High Press. Res. 2008, 28, 75. [Google Scholar] [CrossRef]
- Akahama, Y.; Kawamura, H. Pressure calibration of diamond anvil Raman gauge to 410 GPa. J. Phys. Conf. Ser. 2010, 215, 012195. [Google Scholar] [CrossRef]
- Dubrovinskaia, N.; Dubrovinsky, L.; Caracas, R.; Hanfland, M. Diamond as a high pressure gauge up to 2.7 Mbar. Appl. Phys. Lett. 2010, 97, 251903. [Google Scholar] [CrossRef]
- Mao, H.K.; Chen, X.J.; Ding, Y.; Li, B.; Wang, L. Solids, liquids, and gases under high pressure. Rev. Mod. Phys. 2018, 90, 015007. [Google Scholar] [CrossRef] [Green Version]
- Holmes, N.C.; Moriarty, J.A.; Gathers, G.R.; Nellis, W.J. The equation of state of platinum to 660 GPa (6.6 Mbar). J. Appl. Phys. 1989, 66, 2962–2967. [Google Scholar] [CrossRef]
- Hixson, R.S.; Fritz, J.N. Shock compression of tungsten and molybdenum. J. Appl. Phys. 1992, 71, 1721. [Google Scholar] [CrossRef]
- Bassett, W.; Reichmann, H.J.; Angel, R.; Spetzler, H.; Smyth, J. New diamond anvil cells for gigahertz ultrasonic interferometry and X-ray diffraction. Am. Mineral. 2000, 85, 283. [Google Scholar] [CrossRef]
- Li, B.; Kung, J. Pressure calibration to 20GPa by simultaneous use of ultrasonic and X-ray techniques. J. Appl. Phys. 2005, 98, 013521. [Google Scholar] [CrossRef] [Green Version]
- Anderson, O.L. Equations of State of Solids for Geophysics and Ceramic Science; Oxford University Press: Oxford, UK, 1995. [Google Scholar]
- Jacobs, M.; Schmid-Fetzer, R.; van den Berg, A. Phase diagrams, thermodynamic properties and sound velocities derived from a multiple Einstein method using vibrational densities of states: An application to MgO–SiO2. Phys Chem Miner. 2016, 44, 43. [Google Scholar] [CrossRef]
- Belmonte, D. First Principles Thermodynamics of Minerals at HP–HT Conditions: MgO as a Prototypical Material. Minerals 2017, 7, 183. [Google Scholar] [CrossRef] [Green Version]
- Campbell, A.J.; Danielson, L.; Righter, K.; Seagle, C.T.; Wang, Y.; Prakapenka, V.B. High pressure effects on the iron-iron oxide and nickel-nickel oxide oxygen fugacity buffers. Earth Planet. Sci. Lett. 2009, 286, 556–564. [Google Scholar] [CrossRef] [Green Version]
- Labiche, J.C.; Mathon, O.; Pascarelli, S.; Newton, M.; Ferre, G.G.; Curfs, C.; Vaughan, G.; Homs, A. Invited article: The fast readout low noise camera as a versatile X-ray detector for time resolved dispersive extended X-ray absorption fine structure and diffraction studies of dynamic problems in materials science, chemistry, and catalysis. Rev. Sci. Instrum. 2007, 78, 091301. [Google Scholar] [CrossRef] [PubMed]
- Toyokawa, H.; Furukawa, Y.; Hirono, T.; Ikeda, H.; Kajiwara, K.; Kawase, M.; Ohata, T.; Sato, G.; Sato, M.; Takahashi, T.; et al. Si and CdTe pixel detector developments at SPring-8. Nucl. Instrum. Methods Phys. Res. Sect. A Accel. Spectrometers Detect. Assoc. Equip. 2011, 636, S218. [Google Scholar] [CrossRef]
- Dubrovinsky, L.; Glazyrin, K.; McCammon, C.; Narygina, O.; Greenberg, E.; Übelhack, S.; Chumakov, A.I.; Pascarelli, S.; Prakapenka, V.; Bock, J.; et al. Portable laser-heating system for diamond anvil cells. J. Synchrotron Radiat. 2009, 16, 737–741. [Google Scholar] [CrossRef]
- Kirkpatrick, P.; Baez, A. Formation of Optical Images by X-rays. J. Opt. Soc. Am. 1948, 38, 766. [Google Scholar] [CrossRef] [Green Version]
- Drakopoulos, M.; Snigirev, A.; Snigireva, I.; Schilling, J. X-ray high-resolution diffraction using refractive lenses. Appl. Phys. Lett. 2005, 86, 014102. [Google Scholar] [CrossRef] [Green Version]
- Shim, S.; Duffy, T.; Jeanloz, R.; Shen, G. Stability and crystal structure of MgSiO3 perovskite to the core-mantle boundary. Geophys. Res. Lett. 2004, 31, L10603. [Google Scholar] [CrossRef]
- Lavina, B.; Dera, P.; Kim, E.; Meng, Y.; Downs, R.; Weck, P.; Sutton, S.; Zhao, Y. Discovery of the recoverable high-pressure iron oxide Fe4O5. Proc. Natl. Acad. Sci. USA 2011, 108, 17281. [Google Scholar] [CrossRef] [Green Version]
- Zhang, L.; Meng, Y.; Yang, W.; Wang, L.; Mao, W.; Zeng, Q.S.; Jeong, J.; Wagner, A.; Mkhoyan, K.; Liu, W.; et al. Disproportionation of (Mg,Fe)SiO3 perovskite in Earth’s deep lower mantle. Science 2014, 344, 877. [Google Scholar] [CrossRef]
- Mao, W.; Meng, Y.; Shen, G.; Prakapenka, V.; Campbell, A.; Heinz, D.; Shu, J.; Caracas, R.; Cohen, R.; Fei, Y.; et al. Iron-rich silicates in the Earth’s D” layer. Proc. Natl. Acad. Sci. USA 2005, 102, 9751. [Google Scholar] [CrossRef] [PubMed] [Green Version]
- McMillan, P. New nitrides: From high pressure–high temperature synthesis to layered nanomaterials and energy applications. Phylosophical Trans. R. Soc. A 2019, 377, 20180244. [Google Scholar] [CrossRef] [PubMed] [Green Version]
- Laniel, D.; Weck, G.; Gaiffe, G.; Garbarino, G.; Loubeyre, P. High-Pressure Synthesized Lithium Pentazolate Compound Metastable under Ambient Conditions. J. Phys. Chem. Lett. 2018, 9, 1600. [Google Scholar] [CrossRef] [PubMed]
- Fischer, R.; Campbell, A.; Caracas, R.; Reaman, D.M.; Heinz, D.; Dera, P.; Prakapenka, V.B. Equations of state in the Fe-FeSi system at high pressures and temperatures. J. Geophys. Res. Solid Earth 2014, 119, 2810. [Google Scholar] [CrossRef]
- McGuire, C.; Santamaria-Perez, D.; Makhluf, A.; Kavner, A. Isothermal equation of state and phase stability of Fe5Si3 up to 96 GPa and 3000 K. J. Geophys. Res. Solid Earth 2017, 122, 4328. [Google Scholar] [CrossRef]
- Miozzi, F.; Morard, G.; Antonangeli, D.; Clark, A.N.; Mezouar, M.; Dorn, C.; Rozel, A.; Fiquet, G. Equation of State of SiC at Extreme Conditions: New Insight Into the Interior of Carbon-Rich Exoplanets. J. Geophys. Res. Planets 2018, 123, 2295–2309. [Google Scholar] [CrossRef]
- Lazicki, A.; Dewaele, A.; Loubeyre, P.; Mezouar, M. High-pressure–temperature phase diagram and the equation of state of beryllium. Phys. Rev. B 2012, 86, 174118. [Google Scholar] [CrossRef] [Green Version]
- Komabayashi, T.; Fei, Y. Internally consistent thermodynamic database for iron to the Earth’s core conditions. J. Geophys. Res. Solid Earth 2010, 115, B03202. [Google Scholar] [CrossRef] [Green Version]
- Dubrovinsky, L.; Ballaran, T.B.; Glazyrin, K.; Kurnosov, A.; Frost, D.; Merlini, M.; Hanfland, M.; Prakapenka, V.; Schouwink, P.; Pippinger, T.; et al. Single-crystal X-ray diffraction at megabar pressures and temperatures of thousands of degree. High Press. Res. 2010, 30, 620. [Google Scholar] [CrossRef]
- Errandonea, D.; MacLeod, S.G.; Burakovsky, L.; Santamaria-Perez, D.; Proctor, J.E.; Cynn, H.; Mezouar, M. Melting curve and phase diagram of vanadium under high-pressure and high-temperature conditions. Phys. Rev. B 2019, 100, 094111. [Google Scholar] [CrossRef] [Green Version]
- Morard, G.; Garbarino, G.; Antonangeli, D.; Andrault, D.; Guignot, N.; Siebert, J.; Roberge, M.; Boulard, E.; Lincot, A.; Denoeud, A.; et al. Density measurements and structural properties of liquid and amorphous metals under high pressure. High Press. Res. 2014, 34, 9. [Google Scholar] [CrossRef]
- Andrault, D.; Morard, G.; Garbarino, G.; Mezouar, M.; Bouhifd, M.; Kawamoto, T. Melting behavior of SiO2 up to 120 GPa. Phys. Chem. Miner. 2020, 47, 10. [Google Scholar] [CrossRef]
- Sanloup, C.; Drewitt, J.; Konopkova, Z.; Dalladay-Simpson, P.; Morton, D.; Rai, N.; Westrenen, W.V.; Morgenroth, W. Structural change in molten basalt at deep mantle conditions. Nature 2013, 503, 104. [Google Scholar] [CrossRef] [PubMed]
- Drewitt, J.; Jahn, S.; Sanloup, C.; de Grouchy, C.; Garbarino, G.; Hennet, L. Development of chemical and topological structure in aluminosilicate liquids and glasses at high pressure. J. Phys. Condens. Matter 2015, 27, 105103. [Google Scholar] [CrossRef]
- Pascarelli, S.; Mathon, O.; Mairs, T.; Kantor, I.; Agostini, G.; Strohm, C.; Pasternak, S.; Perrin, F.; Berruyer, G.; Chappelet, P.; et al. The Time-resolved and Extreme-conditions XAS (TEXAS) facility at the European Synchrotron Radiation Facility: The energy-dispersive X-ray absorption spectroscopy beamline ID24. J. Synchrotron Radiat. 2016, 23, 353–368. [Google Scholar] [CrossRef]
- Boccato, S. Local Structure of Liquid 3d Metals under Extreme Conditions of Pressure and Temperature. Ph.D. Thesis, Université Grenoble Alpes, Grenoble, France, 2017. [Google Scholar]
- Boccato, S.; Torchio, R.; Anzellini, S.; Boulard, E.; Irifune, T.; Harmand, M.; Kantor, I.; Miozzi, F.; Parisiades, P.; Rosa, A.D.; et al. Melting properties by X-ray absorption spectroscopy: Common signatures in binary Fe-C, Fe-O, Fe-S and Fe-Si systems. Sci. Rep. 2020. under revision. [Google Scholar]
- Torchio, R.; Boccato, S.; Miozzi, F.; Rosa, A.D.; Ishimatsu, N.; Kantor, I.; Briggs, R.; Irifune, T.; Morard, G. Melting curve and phase relations of Fe-Ni alloys at high pressure and high temperature: Implications for the Earth’s core composition. Geophys. Res. Lett. 2020. under revision. [Google Scholar]
- Dewaele, A.; Worth, N.; Pickard, C.J.; Needs, R.J.; Pascarelli, S.; Mathon, O.; Mezouar, M.; Irifune, T. Synthesis and stability of xenon oxides Xe2O5 and Xe3O2 under pressure. Nat. Chem. 2016, 8, 784–790. [Google Scholar] [CrossRef]
- Andrault, D.; Muñoz, M.; Pesce, G.; Cerantola, V.; Chumakov, A.; Kantor, I.; Pascarelli, S.; Rüffer, R.; Hennet, L. Large oxygen excess in the primitive mantle could be the source of the Great Oxygenation Event. Geochem. Perspect. Lett. 2018, 6, 5–10. [Google Scholar] [CrossRef]
- Boulard, E.; Harmand, M.; Guyot, F.; Lelong, G.; Morard, G.; Cabaret, D.; Boccato, S.; Rosa, A.D.; Briggs, R.; Pascarelli, S.; et al. Ferrous Iron Under Oxygen - Rich Conditions in the Deep Mantle Geophysical Research Letters. Geophys. Res. Lett. 2019, 46, 1348–1356. [Google Scholar] [CrossRef] [Green Version]
- Cerantola, V.; Wilke, M.; Kantor, I.; Ismailova, L.; Kupenko, I.; McCammon, C.; Pascarelli, S.; Dubrovinsky, L.S. Experimental investigation of FeCO3 (siderite) stability in Earth’s lower mantle using XANES spectroscopy. Am. Mineral. 2019, 104, 1083–1091. [Google Scholar] [CrossRef]
- Sneed, D.; Kearney, J.S.; Smith, D.; Smith, J.S.; Park, C.; Salamat, A. Probing disorder in high-pressure cubic tin (IV) oxide: A combined X-ray diffraction and absorption study. J. Synchrotron Radiat. 2019, 26, 1245. [Google Scholar] [CrossRef] [PubMed] [Green Version]
Figure 1.
Comparison between the different P and T domains reachable using different static techniques. Large volume presses [42,43,44,45,46], including the Paris-Edinburgh cell, equipped with resistive heaters are a well-established static method to create high P-T environments. They allow large samples to be used (improving the signal/noise) but they are limited in the P-T range reachable. During external resistive heating in DAC, References [47,48,49,50] the entire DAC body is heated by Joule effect, providing a nice and uniform heating. However, such a configuration causes big thermal dispersion and mechanical instability, limiting the P-T range reachable with this technique. Internal resistive heating in DAC [51,52,53,54,55,56,57,58] provides advantages similar to the latter method, extending the reachable P-T range (as the heating is localized only to the high-pressure chamber of the DAC). Although the P-T limits of the internally heated DAC are constantly expanding, the laser-heating in DAC remains the only static technique allowing P-T in excess of 300 GPa and 6000 K [8,59].

Figure 2.
(a) Concept design of the DAC principle. A pre-indented metal gasket is squeezed between two diamond anvils along the direction indicated by the black arrows. (b) Zoom of the resulting high-pressure chamber containing the sample, the PTM and a pressure gauge (ruby). (c) Real image obtained from the top view of the high-pressure chamber of a loaded DAC.

Figure 3.
Concept design of a LH system showing both the on-axis geometry with lenses and the off-axis geometry, here combined with the Schwarzschild mirrors. Different color legends are used for different optical paths: red for the lasers, yellow for the illumination and green for the imaging part and temperature measurement. An actual image of a heated sample is also presented above the DAC.

Figure 4.
Comparison between the wavelength-dependent focusing obtained with (a) chromatic, (b) apochromatic and (c) apochromatic combined with iris lenses. The use of apochromatic lenses massively reduces the chromatic aberration observed with standard chromatic lenses. However, the remaining aberration caused by the lenses geometry can only be minimized by reducing the numerical aperture, and therefore, by collecting the signal only using the part of the lens closer to the optical axis (less affected by aberration).

Figure 5.
Example of a spectral radiometry temperature measurement obtained around 3300 K. In particular: (a) shows the calibrated system response (green) and the raw measurement (black); (b) shows the obtained Planck and (c) Wien functions and (d) the histogram of the obtained (e) two-colors signal. In the graphs, the red lines indicate the region used for the fit.

Figure 6.
Comparison between 1-D spectroradiometry and 2-D imaging radiometry for temperature measurement on a sample of FeS (pyrite) at 54 GPa in the LH-DAC. (a) Imaging radiometry temperature map generated from a four-color system and processed using the MIRRORS software [129]. Contours indicate light intensity in 10% intervals relative to the brightest pixel. (b) Corresponding spectroradiometric temperature cross-section collected within 1 sec of the temperature map at the same nominal location (the white dotted line in (a)). Note the similarity in shape and peak temperature, denoted by the white square in (a) and the black dotted line in (b). (c) A photomicrograph of the sample before heating, with the 25-micron diameter heated spot indicated by the red circle. The red dotted line indicates the location of the spectroradiometric measurement presented in (b).

Figure 7.
Left panel: (a) Ruby fluorescence signals at different pressures. The arrows indicate the position of the more intense peak, where the calibration is taken. (b) Pressure vs. wavelength relation according to the most recent calibration by Liu et al. [139]. The relation is obtained through the equation here represented, where is taken as indicated in panel (a) and = 694.24 nm. According to the calibration A = 1904 GPa and B = 9.827 [139]. Right panel: (c) Raman spectra of diamond anvils at different pressures. The arrows indicate where the calibration is taken. (d) Pressure vs. frequency relation according to the most recent calibration by Akahama and Kawamura [147]. The relation is obtained following the equation represented, where , is the wavelength taken at the edge of the signal as indicated by the arrows in panel (c) and = 1334 cm. In the chosen calibration A = 547 GPa and B = 3.75 [147].

Figure 8.
Example results of a study on Pt performed using LH-DAC combined with XRD [81]. (a) High P-high T phase diagram of Pt. (b) Example of a solid/liquid transition (characterized by the appearance of a diffuse signal in the diffraction pattern) observed in Pt at around 3300 K and 27 GPa. (c) Thermal equation of state of Pt determined along four isotherms.

Figure 9.
(a) Example results of a study on Ni performed using LH-DAC combined with XAS [28]. In the inset (b), the three XANES collected at 39 GPa show: solid nickel at ambient temperature, hot solid at 2740 K and a liquid at 2880 K.
Figure 9.
(a) Example results of a study on Ni performed using LH-DAC combined with XAS [28]. In the inset (b), the three XANES collected at 39 GPa show: solid nickel at ambient temperature, hot solid at 2740 K and a liquid at 2880 K.

© 2020 by the authors. Licensee MDPI, Basel, Switzerland. This article is an open access article distributed under the terms and conditions of the Creative Commons Attribution (CC BY) license (http://creativecommons.org/licenses/by/4.0/).
Share and Cite
MDPI and ACS Style
Anzellini, S.; Boccato, S. A Practical Review of the Laser-Heated Diamond Anvil Cell for University Laboratories and Synchrotron Applications. Crystals 2020, 10, 459. https://doi.org/10.3390/cryst10060459
AMA Style
Anzellini S, Boccato S. A Practical Review of the Laser-Heated Diamond Anvil Cell for University Laboratories and Synchrotron Applications. Crystals. 2020; 10(6):459. https://doi.org/10.3390/cryst10060459
Chicago/Turabian StyleAnzellini, Simone, and Silvia Boccato. 2020. "A Practical Review of the Laser-Heated Diamond Anvil Cell for University Laboratories and Synchrotron Applications" Crystals 10, no. 6: 459. https://doi.org/10.3390/cryst10060459
Note that from the first issue of 2016, this journal uses article numbers instead of page numbers. See further details here.