Article

Synthesis and Characterization of Polystyrene/CuO-Fe2O3 Nanocomposites from Natural Materials as Hydrophobic Photocatalytic Coatings

Department of Physics, Universitas Negeri Padang, Padang 25131, Indonesia
*
Author to whom correspondence should be addressed.
Crystals 2021, 11(1), 31; https://doi.org/10.3390/cryst11010031
Submission received: 2 December 2020 / Revised: 16 December 2020 / Accepted: 16 December 2020 / Published: 30 December 2020

Abstract

:
This study reports on the synthesis, characterization of polystyrene(PS)/CuO-Fe2O3 nanocomposites, and their application as hydrophobic coatings. CuO and Fe2O3 materials were synthesized from natural materials by the milling method. Meanwhile, the PS/CuO-Fe2O3 nanocomposites were synthesized by the sol-gel method. Furthermore, the hydrophobic coating on the glass substrate was made by the spin-coating. To obtain highest value of contact angle, the composition of both CuO and Fe2O3 in nanocomposite as well as calcination temperatures were varied. Sample characterization was conducted using X-ray diffraction (XRD), scanning electron microscopy (SEM), and ultraviolet visible (Uv-Vis) spectrophotometry analysis. The Sessile drop method was used to determine the contact angle of the layer. The results showed that PS/CuO-Fe2O3 nanocomposite was successfully obtained with a crystal size between 40–52 nm and grain size of 92 nm. In addition to the basic material of composites, hematite and tenorite, the presence of copper ferrite phase was also identified. The CuO-Fe2O3 composition and its large calcination temperature also plays an effective role in the magnitude of the contact angle. The highest value of contact angle obtained was 125.46° at 3:1 composition and calcination temperature of 200 °C. We found that the PS/CuO-Fe2O3 composite was hydrophobic, but the photocatalyst activity was very small at 0.24%.

Graphical Abstract

1. Introduction

CuO-Fe2O3 nanocomposite receives considerable attention because it is applied as a catalyst, gas sensor, anode for batteries, and anti-corrosive hydrophobic coating [1,2,3]. This composite combines the potential characteristics of CuO components and Fe2O3. Copper oxide (CuO), which is one of the p-type semiconductors, has excellent optical, electrical, physical, and magnetic properties [4]. Meanwhile, Fe2O3 is one of the n-type semiconductors which has the most stable phase among the oxides of iron, corrosion resistance, high efficiency, non-toxic nature, inexpensive, and environmentally friendly [5,6]. The combination of CuO and Fe2O3 into a nanocomposite causes the physical properties of CuO-Fe2O3 to be better than CuO and Fe2O3 alone [7,8].
In the past decade, various methods have been proposed to produce CuO-Fe2O3 nanocomposite in various sizes and shapes. They include electrochemical reactions, phase separation, spin-coating, sol-gel, particle-filling coprecipitation, and milling. Among these processes, the milling and spin-coating methods are easy and inexpensive [9]. However, there has also been no report on the preparation of CuO-Fe2O3 composites using natural materials. The use of natural materials increases the added value of the functional materials and also has the advantage of inheriting the actual chemical composition and structure of the raw materials.
From previous studies, it was reported that CuO-Fe2O3 composite has high photocatalytic activity. The photocatalytic activity obtained in degrading optimum methylene blue with CuO-Fe2O3 was 95.9% [1] and 83% using Fe2O3, CuO, and CuFe2O4 phases [
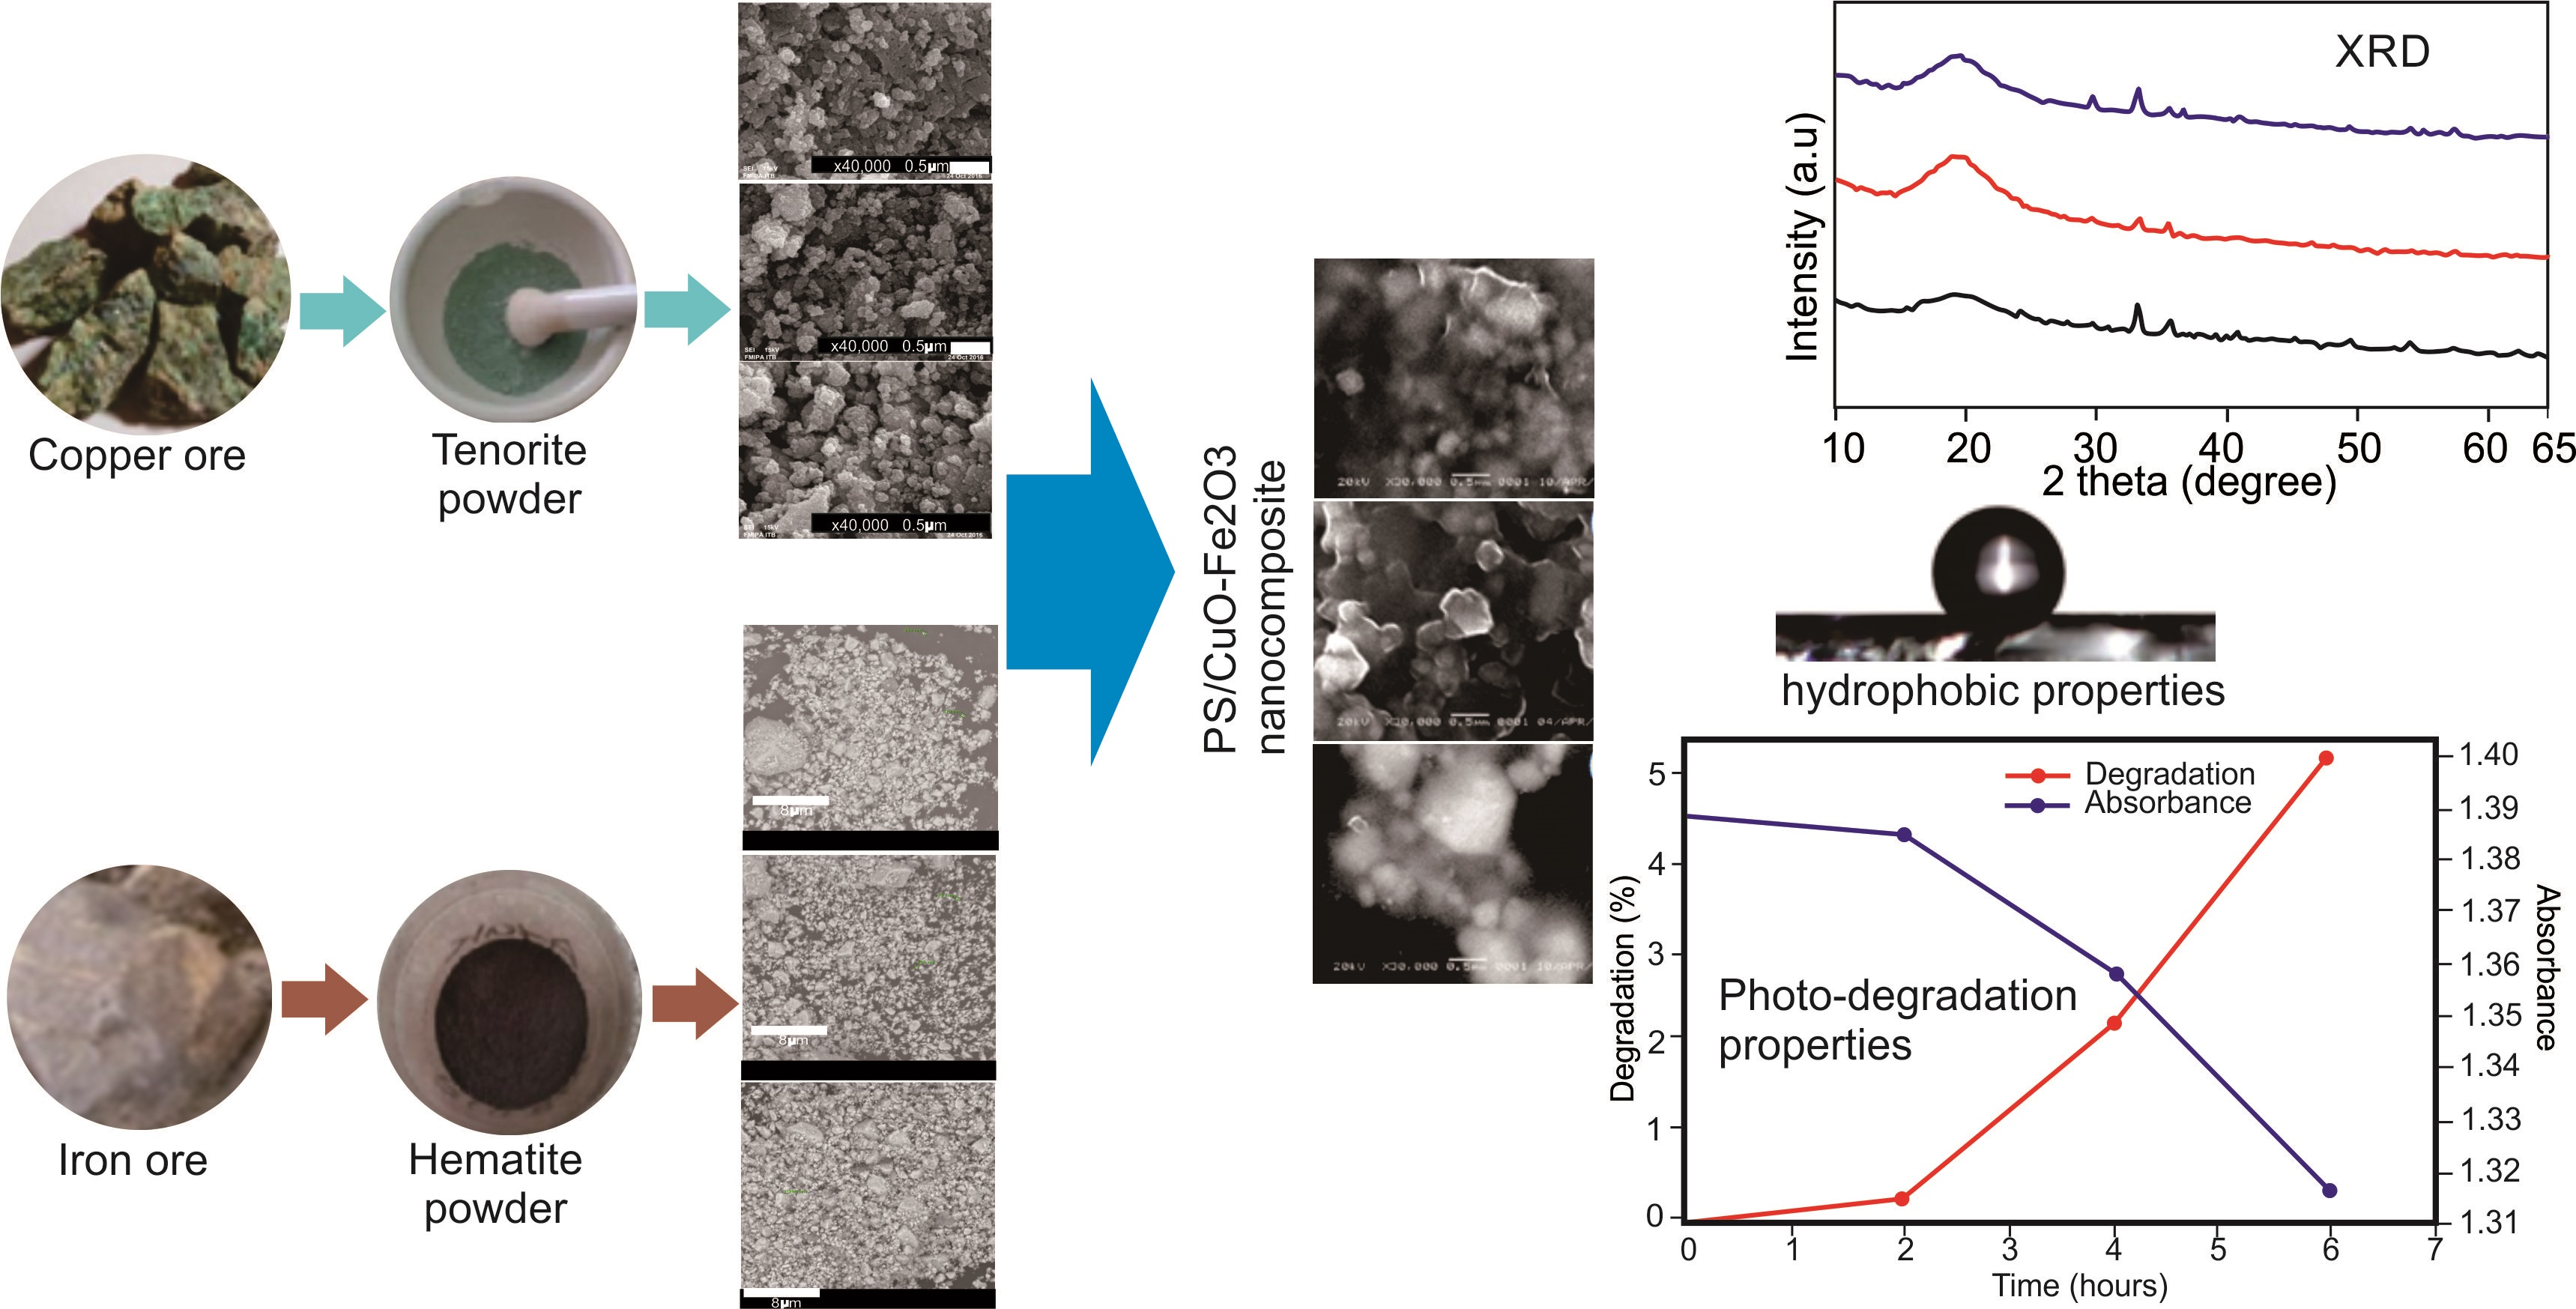
10]. Conversely, the hydrophobic properties decrease with increasing photocatalytic activity. This can be altered by introducing the right dopant. This study reports on the synthesis of PS/CuO-Fe2O3 nanocomposite using a simple and inexpensive method. The effect of calcination temperature on the structural and hydrophobic properties of PS/CuO-Fe2O3 composites was investigated. The spin-coating method was used to coat PS/CuO-Fe2O3 nanocomposites on the surface of the glass preparation.

2. Materials and Methods

2.1. Materials

The materials used in this study were copper rock (92.7% Cu element concentration) and iron powder (87.5% Fe concentration) obtained from community mining in West Sumatra. Other materials include distilled water, alcohol, hydrochloric acid (HCL) 36%, polyethylene glycol (PEG) 400 (PT.Brataco, Bandung, Indonesia), polystyrene, and tetrahydrofuran (Merck Indonesia, Jakarta, Indonesia). These materials were commercially available. Glass slides of 1 cm × 1 cm size were used as a substrate for spin coating.

2.2. Tenorite (CuO) Preparation

The copper rock was initially washed before use, crushed using a mortar, and homogenized with a 150 mesh sieve. The copper powder obtained was milled using High Energy Milling Ellipse 3D Motion (HEM-E3D) method for 20 h. It was then added to 50 mL of 2 M HCl, stirred and heated at a temperature of 90 °C for 1 h. The copper powder obtained was cooled for 1 h, then added with 60 mL of distilled water followed by filtering using Whatman paper grade 41. The gel was dried and crushed using a mortar until smoothness was achieved. Subsequently, it was washed with pure water to remove HCl. The powder obtained was calcined at 650 °C for 3 h at atmospheric pressure to obtain the tenorite (CuO) phase [11]. Furthermore, the heating powder was pulverized using HEM with milling time variations of 0, 10, 20, 30, and 40 h to obtain nanotenorites.

2.3. Hematite (Fe2O3) Preparation

The iron grain was initially washed using water and crushed using steel mortar until it passed through a 200 mesh sieve. The sand obtained was mashed using a ball mill. Milling is carried out with a ball to powder ratio of 10:1 using a tungsten carbide bottle and a tungsten carbide ball with a diameter of 10 mm. The WC (tungsten carbide) vial has an inner diameter of 54.5 mm, an outer diameter of 66.3 mm and a height of 65.4 mm with a capacity of 125 mL. A grinding speed of 150 rpm was kept constant throughout the experiment and the milling balls were 20 g for each milling time. The type of milling ball used is small carbon steel, as many as 40 pieces, weighing 0.2 g per piece; 4 medium-sized milling balls weighing 0.5 g per piece. Meanwhile, there are 2 large milling balls weighing 3.55 g per piece. The powder obtained was withdrawn with a magnet, separating it from other minerals. Subsequently, the withdrawn powder was heated at 900 °C to obtain the hematite phase (Fe2O3). Furthermore, hematite was mashed using HEM with milling time variations of 2, 5, and 10 h to obtain nanometer-sized particles.

2.4. Preparation of PS/CuO-Fe2O3 Nanocomposite

PS/CuO-Fe2O3 nanocomposite was prepared as follows: 15 mL of tetrahydrofuran (THF), 0.1 g of PEG and 2 g of polystyrene were put into a 100 mL beaker. The nanohematite powder (Fe2O3) and nanotenorite (CuO) were added to it with variations of Cu molar ratio to Fe 1:3, 2:2, and 3:1. The mixture was stirred using a magnetic stirrer at a speed of 500 rpm for 60 min, so that all the components were evenly mixed to form a PS/CuO-Fe2O3 nanocomposite gel.

2.5. Hydrophobic Thin Layer Preparation

PS/CuO-Fe2O3 nanocomposite coating using spin-coating method was conducted with a glass substrate that has been washed with alcohol. The entire surface of the substrate was then covered. Furthermore, the substrate was rotated at a spin coating rate of 1000 rpm for 60 s. Samples were heated for 1 h with variations in calcination temperature of 30 °C, 100 °C, 150 °C, 200 °C, and 250 °C for each composition of 1:3, 2:2, and 3:1.

2.6. Characterization

The X-ray powder (XRD) diffraction pattern was recorded with XRD type X’Pert PRO PANalytical PW30/40. The crystallite size was calculated using the Scherrer equation; D = 0.9 λ/β cosθ, D is the crystal size, λ is the wavelength of radiation (λ = 0.154184 nm for CuKα), θ is the Bragg angle, B is FWHM (full width at half maximum) of the selected peak, and K is the material constant, commonly K ≈ 0.9 [12]. SEM type INSPECT-S50 was used to obtain the surface structure and particle size. All measurements were made at room temperature. Water contact angles with the composite coating were taken using a NIKON D5200 camera with the sessile drop method with volume 0.01 mL, a micro syringe at 25 °C, and image-J software (V 1.5, National Institutes of Health, Bethesda, MD 20814, USA).

2.7. Photocatalytic Activity

The PS/CuO-Fe2O3 nanocomposite gel was added to 10 mg/L of methyl orange (MO) and dissolved in 1000 mL of distilled water to show photocatalyst activity. Furthermore, it was dried in the sun with a time variation of 2, 4, and 6 h. The degradation percentage was calculated from the value of absorbance before and after irradiation [13] using a GENESYS 10S Uv-Vis spectrometer.

3. Results

3.1. Tenorite (CuO)

Figure 1 and Figure 2 show the results of XRD and SEM patterns from the preparation of tenorite with milling time variations of 0, 10, 20, 30, and 40 h.
Figure 1 shows that the peak values of the CuO tenorite phase appeared at the diffraction angle 2θ: 35.4° and 38.8°. Variation of milling time caused a decrease in diffraction intensity, therefore, widening the curve at each milling time. The decrease in intensity was due to the finer crystallite size. The size of the tenorite crystallite obtained using the Scherrer equation for 0, 10, 20, 30, and 40 h of milling time were 58.65 nm, 52.35 nm, 30.27 nm, 31.05 nm, and 33.64 nm, respectively.
Figure 2 shows the SEM pattern from tenorite with the milling time variation at 0, 10, 20, 30, and 40 h. The particle sizes of CuO were 128 nm, 88 nm, 68 nm, 87 nm, and 89 nm, respectively. Particle size decreased when the milling time was 10 and 20 h, and further increased when the milling time was 30 and 40 h due to the agglomeration process.

3.2. Nanohematite

Figure 3 shows the results of XRD and SEM patterns from the preparation of hematite with milling time variations of 2, 5, and 10 h.
Figure 3 shows that the peak values of the hematite phase appeared at diffraction angles of 29.35°, 33.21°, and 35.69°. The milling time variation decreased the diffraction intensity and the crystallite size at 5 h milling time was 53.16 nm. However, when it was milled for 10 h, the crystallite size enlarged again, and the crystallite size during the 10 h milling time was 54.71 nm. Based on the pattern from SEM, the particle size produced based on the milling time variation at 2, 5, and 10 h was 375 nm, 293 nm, and 466 nm, respectively.

3.3. PS/CuO-Fe2O3 Nanocomposite

Figure 4 shows the results of XRD and SEM patterns from the preparation of PS/CuO-Fe2O3 nanocomposite with variations in composition time at 3:1, 2:2, and 1:3.
Figure 4 shows that the PS/CuO-Fe2O3 diffraction pattern was detected from an angle of 2θ = 20–70°. The peak values of Fe2O3 were at 2θ = 24.03°, 33.2°, and 54.09°, while those of CuO were at 2θ = 35.6° and 49.49°. Furthermore, the new copper ferrite phase was detected at 2θ = 29.7 °C, 35.62 °C, 36.7 °C, 55.09 °C, 57.32 °C, and 65.59 °C in a tetragonal structure [14,15,16].
The crystallite size changed in each composition variation of the nanocomposite. The average crystallite size for CuO-Fe2O3 in compositions of 3:1, 2:2, and 1:3 was 52.36 nm, 49.14 nm, and 42.76 nm, respectively. Changes in the composition also affected the morphology of the layers and the average crystallite size of the particles. Based on the SEM pattern, it was seen that the distribution of CuO and Fe2O3 in 3:1 composition was more homogeneous than other compositions.
Figure 5 shows the test results of hydrophobic properties from PS/CuO-Fe2O3 composites with variations in calcination temperature of 30 °C, 100 °C, 150 °C, 200 °C, and 250 °C for each composition at 1:3, 2:2, and 3:1.
Figure 5 shows the influence of calcination temperature and composition towards water contact angle on the surface. The highest value of contact angle was 125.46°, obtained at a temperature of 200 °C and a composition of 3:1. The higher the calcination temperature, the more the contact angle increases to the optimum limit and further decreases as heating continues.
Figure 6 shows the morphology of PS/CuO-Fe2O3 nanocomposite layers with calcination temperatures of 30 °C, 100 °C, 150 °C, 200 °C, and 250 °C at 3:1 composition.
Figure 6 shows that, before calcining, the distance between the components of the PS/CuO-Fe2O3 nanocomposite constituent was still far apart and the surface roughness was low. At higher calcination temperatures, the matrix and filler appeared to agglomerate and separate from one another into secondary particles. The matrix and filler were evenly spread on the surface at a calcination temperature of 200 °C. The particle size of PS/CuO-Fe2O3 composites with varying calcination temperature of 30 °C, 100 °C, 150 °C, 200 °C, and 250 °C were 134 nm, 125 nm, 120 nm, 92 nm, and 117 nm, respectively.
Figure 7 shows the effect of calcination temperature and composition of CuO-Fe2O3 nanocomposites towards the contact angle and particle size.
Figure 7 explains that at 200 °C, the average particle size was smaller compared to other temperatures. This caused the surface roughness level to be higher and, therefore, more hydrophobic compared to other temperatures. When the sample was calcined at 250 °C, the granules agglomerated again, because the polymer matrix was heated beyond its melting point. The melting point of polystyrene was at 243 °C. Furthermore, in the calcined sample with a temperature of 250 °C, the incorporation between fillers was seen from the increasing magnitude of the average particle size on CuO-Fe2O3 nanocomposite. The greater the average particle size, the lesser the roughness; therefore, the hydrophobicity value decreases.
Figure 8 shows the FTIR (Fourier-transform infrared spectroscopy) characterization of Ps/CuO-Fe2O3 nanocomposite. The figure shows the absorption peak of the Ps/CuO-Fe2O3 composite in the area of wave number 3687.07 cm−1, 3026.79 cm−1, 2921.81 cm−1, 2162.27 cm−1, 1987.89 cm−1, 1800.34 cm−1, 1451.07 cm−1, 979.79 cm−1, 901.55 cm−1, 756.15 cm−1, and 689.90 cm−1. Wave number 3687.07 cm−1 is absorption peak for O-H vibration. Wave number 3026.79 cm−1 is the absorption for C-H, and wave number 2921.81 cm−1 is the absorption peak for CH2 vibrations. The wave number is 689.90 cm−1 which is the absorption for the Fe-O group and the wave number is 979.79 cm−1 which is the absorption for CuO. Therefore, this proves our hypothesis regarding the reduced photocatalyst activity of CuO-Fe2O3 when PS was added as a matrix.
The photocatalyst activity test of the PS/CuO-Fe2O3 composites are shown in Figure 9. Based on the photocatalyst test on PS/CuO-Fe2O3 nanocomposite, it was discovered that the photocatalyst activity was very small at 0.24%. This result is far from the result of the ability of the CuO-Fe2O3 photocatalyst from a previous research [1] which degraded the MO 88.45% within 120 min. This indicates that the polymer matrix used is one of the hydrophobic agents.

4. Discussion

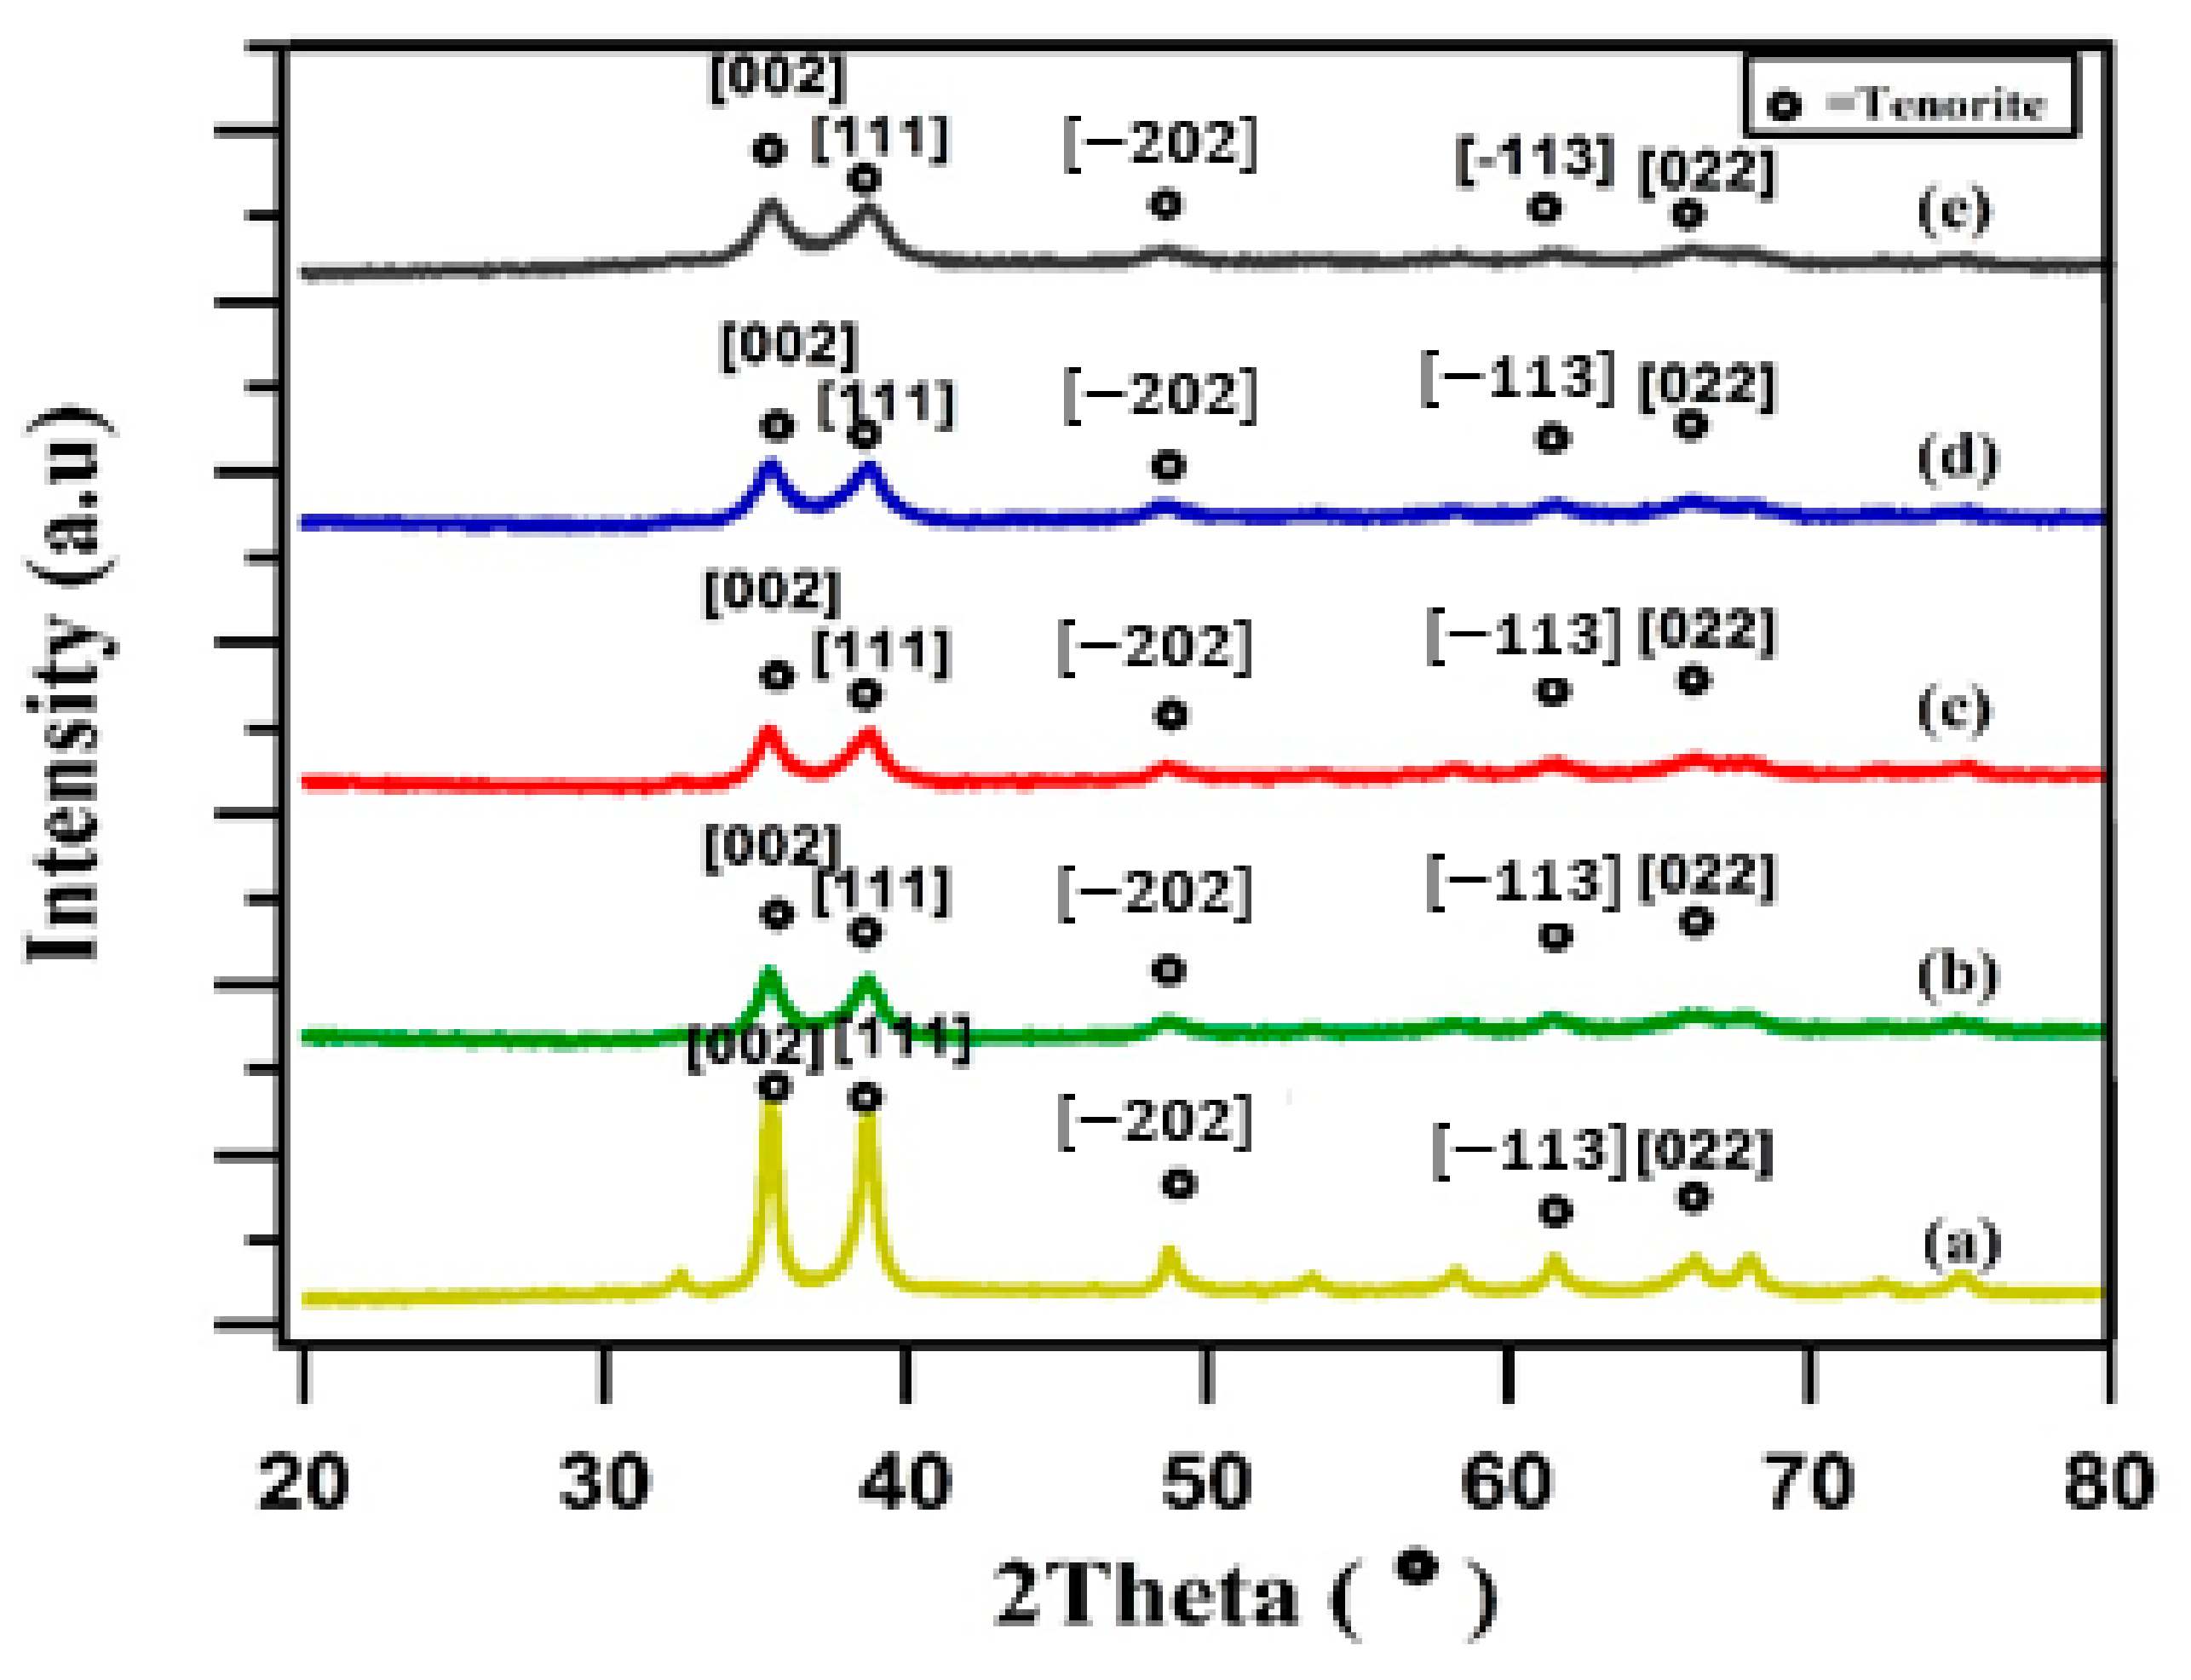
Based on the synthesis of PS/CuO-Fe2O3 nanocomposites, the diffraction pattern showed the basic ingredients of composites. They include hematite, tenorite, and the presence of copper ferrite phase was also identified. The presence of the copper ferrite phase in the PS/CuO-Fe2O3 nanocomposite was also discovered in other studies [12,13]. The formation of this phase was due to the presence of iron oxide and Cu oxide CuFe2O4 with the general formula AB2O4, where A and B are metal ions with valency of +2 and +3 respectively. Copper Ferrite (CuFe2O4) has an inverse spinel structure with 8 Cu2+ ions and 16 Fe3+ ions in one unit cell, with a composite particle size of 92 nm. This is greater than the particle size of CuO-Fe2O3 composites discovered in other studies, which ranged from 27 to 49 nm [1]. The large particle size obtained is due to the synthesis carried out using natural materials which contain the actual chemical composition of the raw material and suboptimal sample purity.
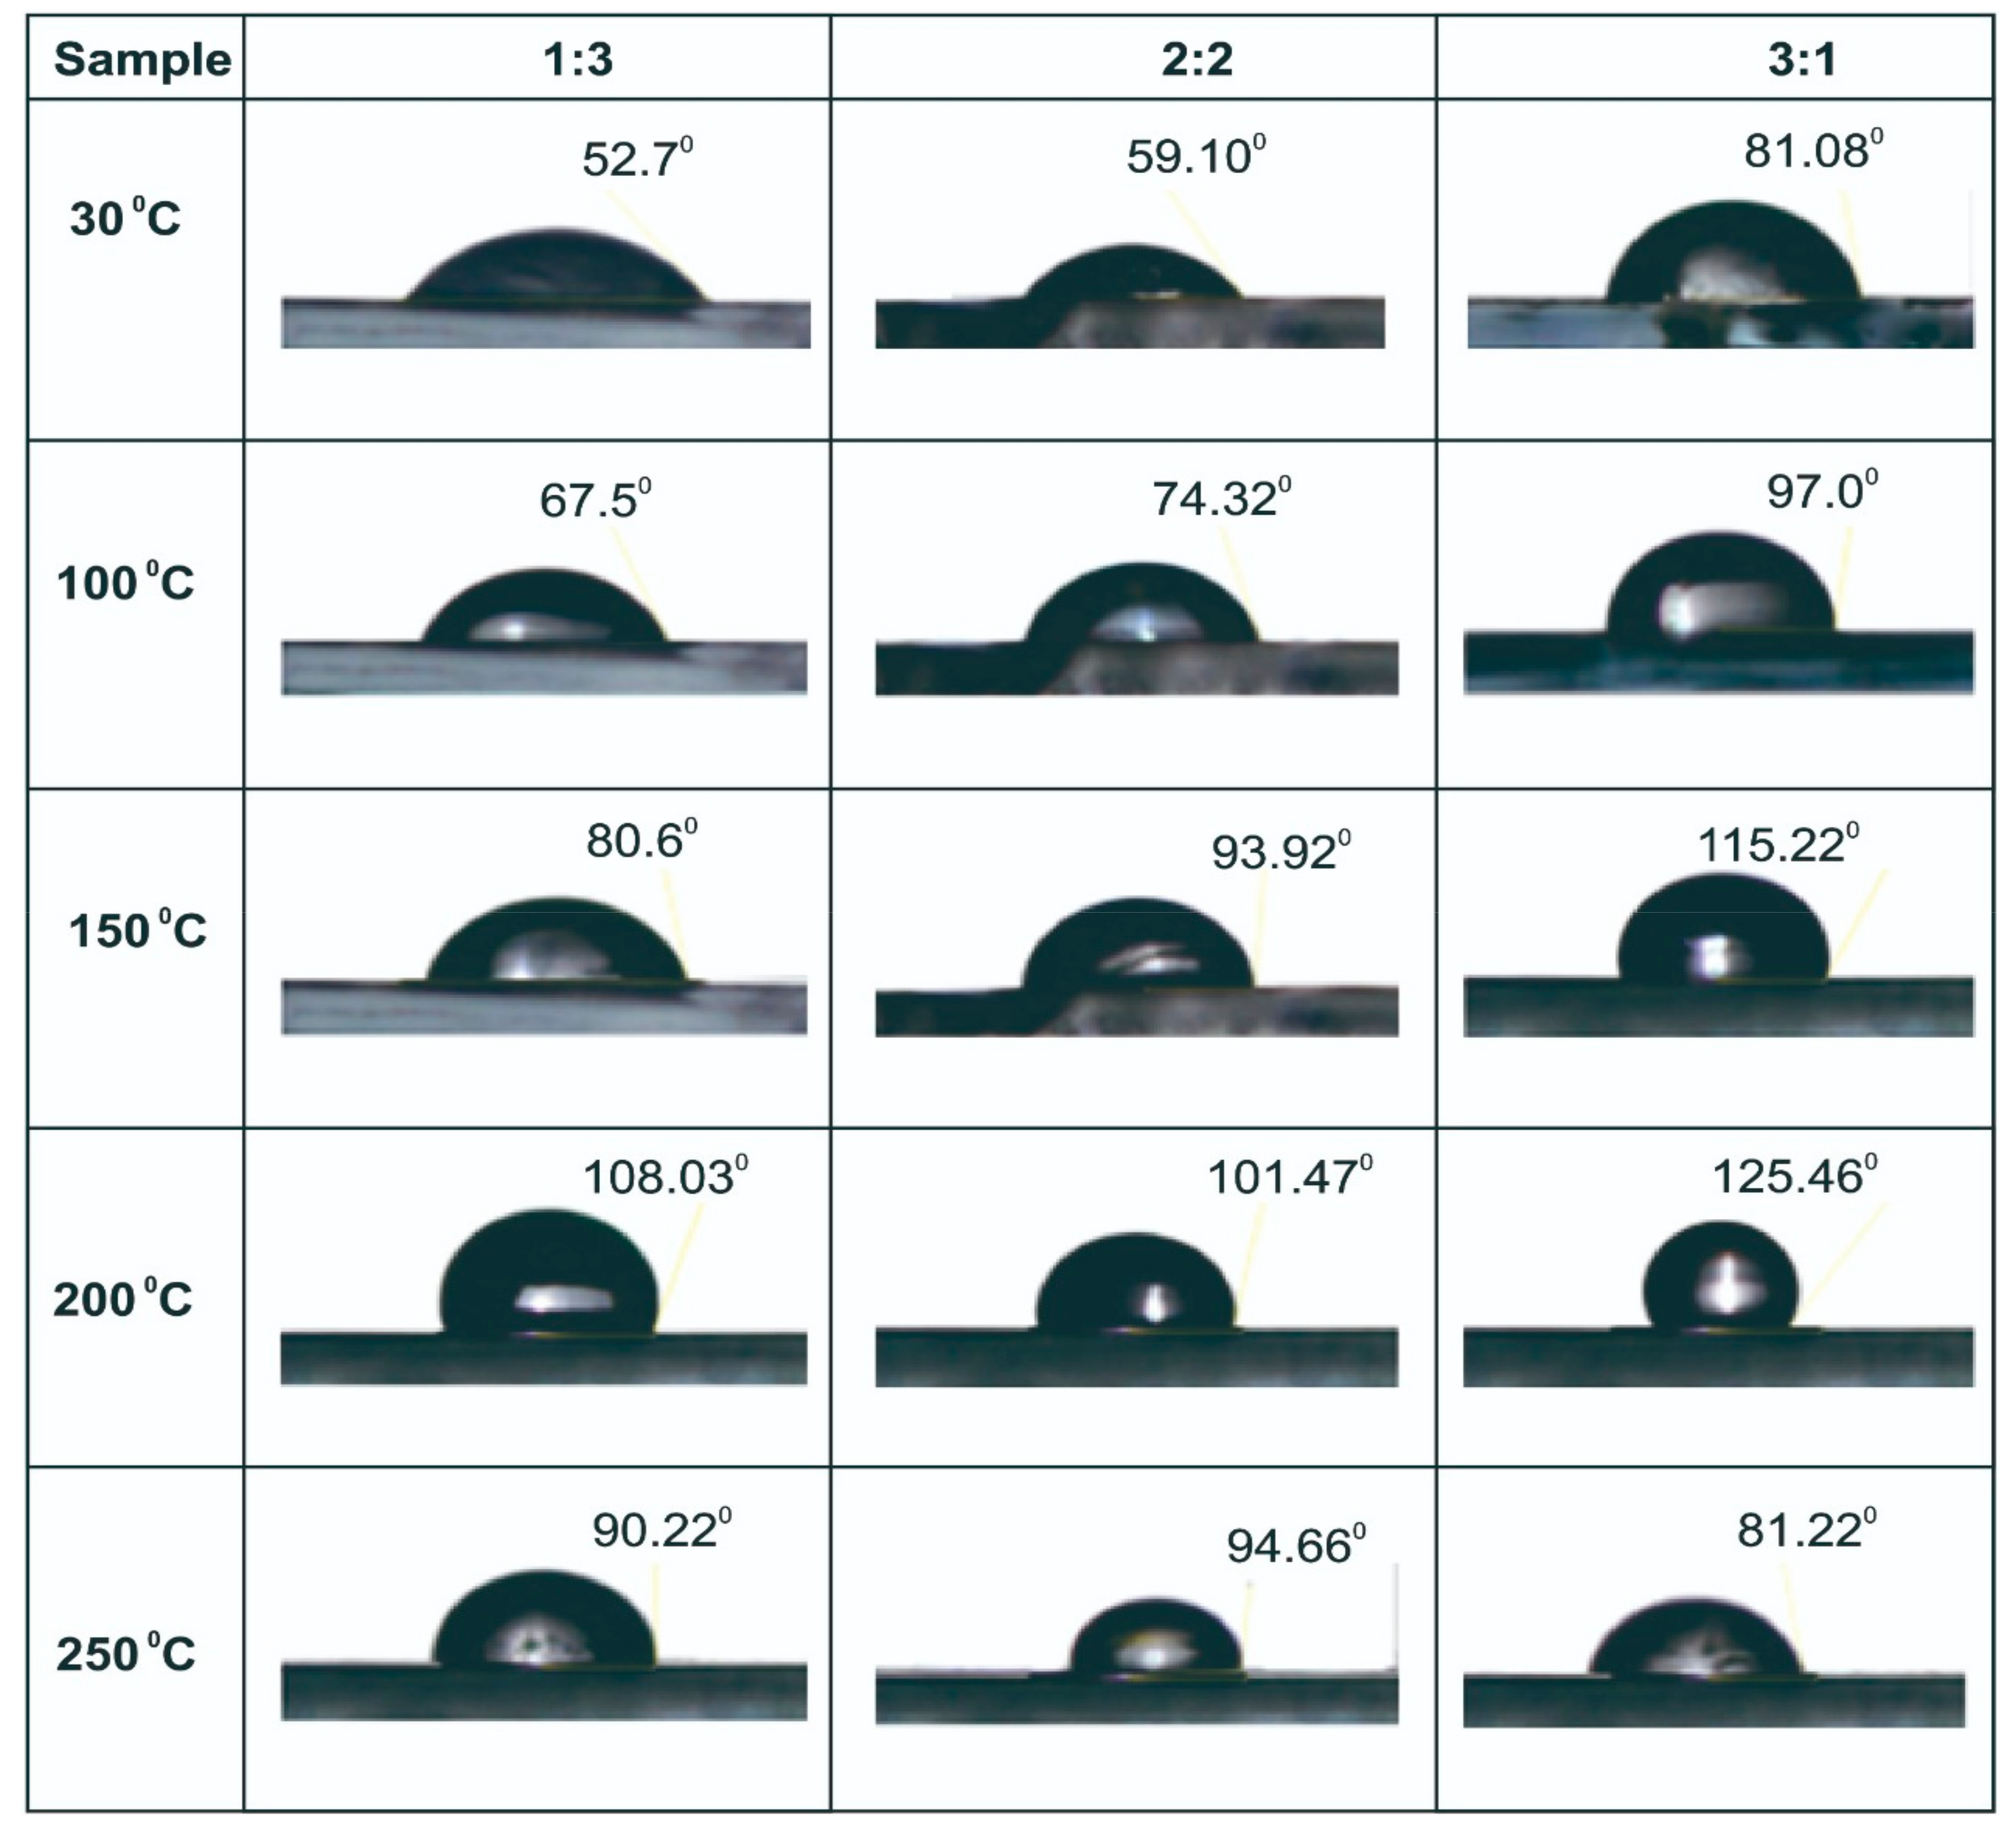
The hydrophobic test showed that there was an effect of calcination temperature and composition towards the water contact angle on the surface of PS/CuO-Fe2O3 nanocomposites. The higher the calcination temperature, the more the contact angle increases to its optimum limit and further decreases as heating continues. The optimum contact angle was detected in the composition of CuO-Fe2O3 at 3:1 and calcination temperature of 200 °C.
The rough surface morphology increased the hydrophobicity of the material. This was explained when water dropped on a rough surface with a nanometer scale, trapping air and preventing water from getting into the rough surface. Therefore, the surface of particles which interacted with water became smaller. This was also in accordance with the Cassie and Baxter model which states that the smaller the surface area of the particles that interacts with water, the greater the contact angle formed [6,17].
The highest value of contact angle obtained by PS/CuO-Fe2O3 nanocomposites at 125.46° was contradictory considering that the composite was a p and n-type semiconductor material with high photocatalyst activity [1]. Materials with high photocatalytic activity are more hydrophilic than hydrophobic, based on their properties. The high contact angle obtained was related to the filler (polystyrene) used in the synthesis of PS/CuO-Fe2O3 nanocomposites. The fillers used were originally polarized, but in order to produce waterproof nanocomposite properties, they were coated with polystyrene which is a matrix with hydrophobic properties [17,18]. Therefore, the coating was able to modify the filler that was originally polarized into a non-polar nanocomposite. The change in angle obtained is related to either polar or non-polar surface of the substrate. On a polar surface, wetness increases (the contact angle reduces). Conversely, on the non-polar surface, wetness reduces (the contact angle increases) [19]. This low wetness was also due to the cohesive force between water molecules being greater than the adhesive force between water and the surface of the nanocomposite layer. Consequently, water droplets were formed on the nanocomposite layer surface. The hydrophobic surface resisted wetness, because the cohesive force was greater than the adhesive force. Therefore, the substrate in this study was initially not hydrophobic (polar), but by increasing calcination temperature to the optimum, the surface properties became hydrophobic (non-polar). Based on the photocatalyst test on PS/CuO-Fe2O3 nanocomposite, it was discovered that the photocatalyst activity was very small at 0.24% (Figure 9).
The photocatalyst mechanism can be described by the following Equations:
CuO Fe 2 O 3 + h υ e + h + e + O 2 O 2 * O 2 * + H + OOH * OOH * O 2 + H 2 O 2 H 2 O 2 + h υ + e 2 OH * h + + H 2 O OH * + H + MO + h + + O 2 * + OH * degradation   products
CuO-Fe2O3, when subjected to a photon energy, causes an electron jump from the valence band to the conduction band. This jump of electrons causes holes that can interact to form radicals. The resulting conduction band electrons (e) react with oxygen molecules to form superoxide radicals O 2 * . Likewise, the holes react with H2O to form OH radicals. The resulting OH radicals cut the bonds from methyl orange (C14H14N3NaO3S) to (NaO3C6SH6N and C8H10N2O2). OH radicals break the bonds (NaO3C6SH6N and C8H10N2O2) to become aliphatic acid. OH radicals break aliphatic acid bonds into CO2 and H2O.
Based on FTIR characterization, it is known that the chemical composition of the surface of the test material consists of vibrations of O-H, Fe-O, Cu-O, and C-H. The presence of C-H groups (hydrocarbon compounds) sourced from polystyrene acts as a hydrophobic agent. The presence of hydrocarbons on the surface of this test material indicates that the surface is nonpolar. When water is dropped on a polar surface, the water cannot bind to the surface, as a result, the water molecules only bond with each other to form a sphere.
The combination of the polystyrene matrix with CuO and Fe2O3 was able to modify the polar properties of the fillers (CuO and Fe2O3) into nonpolar nanocomposites. The chemical content of this sample can be seen from the results of FTIR characterization. The functional group analysis of the Ps/CuO-Fe2O3 nanocomposite samples was carried out to determine the absorption of the wave numbers of the Ps/CuO-Fe2O3 nanocomposite functional groups. FTIR is used as a characterization tool to analyze functional groups. The area of the wave number used in functional group analysis using FTIR is in the range of 600–4000 cm−1. The results of characterization using FTIR on the Ps/CuO-Fe2O3 nano composite sample showed that the peak absorption of the Ps/CuO-Fe2O3 composite was in the area of wave numbers 3687.07 cm−1, 3026.79 cm−1, 2921.81 cm−1, 2162.27 cm−1, 1987.89 cm−1, 1800.34 cm−1, 1451.07 cm−1, 979.79 cm−1, 901.55 cm−1, 756.15 cm−1, 689.90 cm−1, wave number 3687.07 cm−1 absorption peak for O-H vibration, wave number 3026.79 cm−1 which is the FTIR spectrum for C-H, and wave number 2921.81 cm−1 absorption peak for CH2 vibrations [20], wave number 689.90 cm−1 which represents the FTIR spectrum for the Fe-O group [18], and wave number 979.79 cm−1 which represents the FTIR spectrum for CuO.
FTIR characterization illustrates that there are chemical elements of polystyrene compounds, THF, CuO, and Fe2O3 in nanocomposite samples, so that the presence of polystyrene compounds causes the non-polar nature of the sample.
If water is dropped on a surface that contains non-polar components, the polar water cannot unite with the surface, because the attractive force between water molecules is stronger than the taric force between water molecules and molecules on the surface, consequently the hydrogen bonding force between water molecules will happen compared to the London force.
The hydrogen bonding force between water molecules in the form of positive hydrogen atoms will attract the oxygen atoms of other water molecules. Hydrogen bonds cause water molecules to tend to unite (cohesion). The nature of cohesion causes water to have the ability to resist strain (water molecular bonds are not easily broken). The strong cohesion between water molecules at the boundary between water and air seems to form a strong enough “skin” called surface tension; therefore, water will make a curve on the surface of Ps/CuO-Fe2O3 nanocomposite.

5. Conclusions

The PS/CuO-Fe2O3 composites have been obtained successfully from natural materials with a crystal size between 40–52 nm and grain size of 92 nm. Besides the basic ingredients of composites, such as hematite and tenorite, the presence of copper ferrite phase was also identified. The value of CuO-Fe2O3 composition and large calcination temperature plays a very effective role on the contact angle. The optimal contact angle was 125.46° at 3:1 composition and calcination temperature of 200 °C. This composite layer was hydrophobic, but the photocatalyst activity was very small at 0.24%.

Author Contributions

Conceptualization, R.R. (Ratnawulan Ratnawulan) and A.F.; Formal analysis, R.R. (Ratnawulan Ratnawulan) and R.R. (Ramli Ramli); Investigation, A.F.; Methodology, R.R. (Ratnawulan Ratnawulan), A.F. and S.H.A.; Validation, R.R. (Ratnawulan Ratnawulan) and S.H.A.; Writing—review & editing, R.R. (Ratnawulan Ratnawulan). All authors have read and agreed to the published version of the manuscript.

Funding

This research received no external funding.

Institutional Review Board Statement

Not applicable.

Informed Consent Statement

Not applicable.

Data Availability Statement

No new data were created or analyzed in this study. Data sharing is not applicable to this article.

Acknowledgments

The authors are very grateful to Directorate General of Higher Education (DIKTI), Ministry of Research, Technology and Higher Education, Indonesia, for the Research Grant (Hibah PTM 2019), No. 077/SP2H/LT/DRPM/2019.

Conflicts of Interest

The authors declare no conflict of interest.

References

  1. Asl, M.I.; Ghazi, M.M.; Jahangiri, M. Synthesis, characterization and degradation activity of Methyl orange Azo dye using synthesized CuO/a-Fe2O3. Crystal. Adv. Environ. Technol. 2016, 2, 143–151. [Google Scholar]
  2. Atla, S.B.; Huang, Y.H.; Yang, J.; Chen, H.J.; Hsu, C.M.; Lee, W.C.; Chen, C.C.; Kuo, Y.H.; Hsu, D.W.; Chen, C.C. Hydrophobic Calcium Carbonate for Cement Surface. Crystals 2017, 7, 371. [Google Scholar] [CrossRef] [Green Version]
  3. Carraro, G.; Maccato, A.; Peeters, D.; Gasparotto, G. Fe2O3-CuO Nanocomposites Prepared by a Two-step Vapor Phase Strategy and Analyzed by XPS. Surf. Sci. Spectra 2014, 21. [Google Scholar] [CrossRef]
  4. Srivastava, S.; Kumar, M.; Agrawal, A.; Dwivedi, S.K. Synthesis and characterization of copper oxide nanoparticles. IOSR J. Appl. Phys. 2013, 5, 61–65. [Google Scholar] [CrossRef]
  5. Cao, J.L.; Wang, Y.; Yu, X.L.; Wang, S.R.; Wu, S.H.; Yuan, Z.Y. Mesoporous CuO-Fe2O3 composite catalysts for low-temperature carbon monoxide oxidation. Appl. Catal. B Environ. 2008, 79, 26–34. [Google Scholar] [CrossRef]
  6. He, J.; Zhong, J.; Li, J.; Huang, S.; Zeng, J. Fabrication and Improved Photocatalytic Performance of Pd/α-Fe2O3. Synth. React. Inorg. Met. Org. Nano-Met. Chem. 2015, 45, 673–677. [Google Scholar] [CrossRef]
  7. Cheng, Y.; Lu, S.; Xu, W.; Tao, H. Fabrication of Cu-CuO-Fe2O3/Fe anti-sticky and superhydrophobic surfaces on iron substrate with mechanical abrasion resistance and corrosion resistance. New J. Chem. 2017, 41, 5205–5214. [Google Scholar] [CrossRef]
  8. Wang, Y.; Xia, X.; Zhu, J.; Li, Y.; Wang, X.; Hu, X. Catalytic activity of nanometer-sized CuO/Fe2O3 on thermal decomposition of AP and combustion of AP-based propellant. Combust. Sci. Tech. 2011, 183, 154–162. [Google Scholar]
  9. Choudhary, S.; Solanki, A.; Upadhyay, S.; Singh, N.; Satsangi, V.R.; Shrivastav, R.; Dass, S. Nanostructured CuO/SrTiO3 bilayered thin films for photoelectrochemical water splitting. J Solid State Electrochem. 2013, 17, 2531–2538. [Google Scholar] [CrossRef]
  10. Surendra, B.S.; Veerabhdraswamy, M.; Anantharaju, K.S.; Nagaswarupa, H.P.; Prashantha, S.C. Green and chemical-engineered CuFe2O4: Characterization, cyclic voltammetry, photocatalytic and photoluminescent investigation for multifunctional applications. J. Nano Struct. Chem. 2018, 8, 45–59. [Google Scholar] [CrossRef] [Green Version]
  11. Ratnawulan, R.; Fauzi, A.; Hayati, S.A.E. Effect of calcination temperature on phase transformation and crystallite size of copper oxide (CuO) powders. AIP Conf. Proc. 2017, 1868, 060009. [Google Scholar]
  12. Lin, J.; Lin, Y.; Liu, P.; Meziani, M.J.; Allard, L.F.; Sun, Y.P. Hot-fluid annealing for crystalline titanium dioxide nanoparticles in stable suspension. J. Am. Chem. Soc. 2002, 124, 11514–11518. [Google Scholar] [CrossRef] [PubMed]
  13. Parshetti, G.K.; Telke, A.A.; Kalyani, D.C.; Govindwar, S.P. Decolorization and detoxification of sulfonated azo dye Methyl Orange by Kocuria rosea MTCC 1532. J. Hazard. Mater. 2010, 176, 503–509. [Google Scholar] [CrossRef] [PubMed]
  14. Karimi, M.; Hassanzadeh-Tabrizi, S.A.; Saffar-Teluri, A. In situ reverse co-precipitation synthesis and magnetic properties of CuO/CuFe2O4 nanocomposite. J. Sol.-Gel. Sci. Technol. 2017, 83, 124–131. [Google Scholar] [CrossRef]
  15. Pan, L.; Tang, J.; Wang, F. Facile synthesis of nanoscaled α-Fe2O3, CuO and CuO/Fe2O3 hybrid oxides and their electrocatalytic and photocatalytic properties. Cent. Eur. J. Chem. 2013, 11, 763–773. [Google Scholar] [CrossRef] [Green Version]
  16. Litt, G.; Almquist, C.B. An Investigation of CuO/Fe2O3 Catalysts for the Gas-Phase Oxidation of Ethanol. Appl. Catal. B Environ. 2009, 90, 10–17. [Google Scholar] [CrossRef]
  17. Xu, X.; Zhang, Z.; Guo, F.; Yang, J.; Zhu, X.; Zhou, X.; Xue, Q. Fabrication of Bionic Superhydrophobic Manganese Oxide/Polystyrene Nanocomposite Coating. J. Bionic Eng. 2012, 9, 11–17. [Google Scholar] [CrossRef]
  18. Zhang, L.D.; Liu, W.L.; Xu, W.H.; Yao, J.S.; Zhao, L.; Wang, X.Q.; Wu, Y.Z. Synthesis and characterization of superhydrophobic and superparamagnetic film based on maghemite–polystyrene composite nanoparticles. Appl. Surf. Sci. 2012, 259, 719–725. [Google Scholar] [CrossRef]
  19. Pereira, M.M.; Kurnia, K.A.; Sousa, F.L.; Silva, N.J.O.; Lopes-da-Silva, J.A.; Coutinho, A.P.; Freirea, M.G. Contact angles and wettability of ionic liquids on polar and non-polar surfaces. J. Phys. Chem. Chem. Phys. 2015, 47, 31653–31661. [Google Scholar] [CrossRef] [PubMed] [Green Version]
  20. Bermudez, A.Y.L.; Salazar, R. Synthesis and Characterization of the Polystyrene-Asphaltene Graft Copolymer by FT-IR Spectroscopy. Cienc. Tecnol. Y Futuro 2008, 3, 157–167. [Google Scholar]
Figure 1. XRD patterns from the preparation of tenorite with milling time variations of (a) 0, (b) 10, (c) 20, (d) 30, and (e) 40 h.
Crystals 11 00031 g001
Figure 2. SEM patterns (magnification of 40,000) from the preparation of tenorite with milling time variations of (a) 0, (b) 10, (c) 20, (d) 30, and (e) 40 h.
Crystals 11 00031 g002
Figure 3. XRD (upper figure) and SEM patterns (magnification at 10,000) (lower figure) from the preparation of hematite with milling time variations of (a) 2, (b) 5, and (c) 10 h.
Crystals 11 00031 g003aCrystals 11 00031 g003b
Figure 4. XRD (upper figure) and SEM patterns (magnification at 30,000) (lower figure) from the preparation of PS/CuO-Fe2O3 nanocomposite with variations in composition time at (a) 3:1, (b) 2:2, and (c) 1:3.
Crystals 11 00031 g004
Figure 5. Contact angles of CuO-Fe2O3 composites with calcination temperature variations of 30 °C, 100 °C, 150 °C, 200 °C, and 250 °C for each composition at 1:3, 2:2, and 3:1.
Crystals 11 00031 g005
Figure 6. SEM imaging results on the morphology of the nanocomposite layer with calcination temperature of CuO-Fe2O3 (a) 30 °C; (b) 100 °C; (c) 150 °C; (d) 200 °C; (e) 250 °C, at 3:1 composition.
Crystals 11 00031 g006
Figure 7. (a) Effect of calcination temperature and composition of CuO-Fe2O3 nanocomposites on the contact angle (b) Effect of calcination temperature on particle size and surface roughness.
Crystals 11 00031 g007
Figure 8. FTIR characterization of PS/CuO-Fe2O3 nanocomposite samples.
Crystals 11 00031 g008
Figure 9. Photo-degradation of PS/CuO-Fe2O3 nanocomposites.
Crystals 11 00031 g009
Publisher’s Note: MDPI stays neutral with regard to jurisdictional claims in published maps and institutional affiliations.

