Article

Optimization of Progressive Freezing on Synthetic Produced Water by Circular Moving Cylindrical Crystallizer via Response Surface Methodology

by
Wan Nur Athirah Mazli
1,
Shafirah Samsuri
1,2,*,
Nurul Aini Amran
1,2 and
Eduard Hernández Yáñez
3
1
Chemical Engineering Department, Universiti Teknologi PETRONAS, Seri Iskandar 32610, Malaysia
2
HICoE—Centre for Biofuel and Biochemical Research (CBBR), Universiti Teknologi PETRONAS, Seri Iskandar 32610, Malaysia
3
Agri-Food Engineering and Biotechnology Department, Technical University of Catalonia-BarcelonaTech, C/Esteve Terradas, 8, 08860 Castelldefels, Spain
*
Author to whom correspondence should be addressed.
Crystals 2021, 11(2), 103; https://doi.org/10.3390/cryst11020103
Submission received: 16 December 2020 / Revised: 20 January 2021 / Accepted: 21 January 2021 / Published: 25 January 2021

Abstract

:
Treatment and disposal are two main approaches for water cycle management in the oil and gas industry. Freeze concentration has been identified as one of the methods to separate water from wastewater samples. The conventional method used for solution movement in progressive freezing technique is stirring by a stirrer. However, the stirrer requires frequent maintenance as it needs to be cleaned and requires longer cleaning time due to the complex structure of a stirrer. Thus, the new solution movement for progressive freezing is proposed, which is circular moving progressive freezing. This study aims to remove water from the wastewater sample (i.e., produced water). To optimize and investigate the effect of coolant temperature, freezing time and rotation speed, response surface methodology (RSM) was applied to determine the efficiency of the process and central composite design (CCD) was used to design the experiment. From the results, the optimum parameters were determined at the freezing time of 22.79 min, coolant temperature of −14.89 °C and rotation speed of 59 rpm. To evaluate the accuracy of the optimization process, a validation experiment was performed and water removal value of 89.67% was achieved.

Graphical Abstract

1. Introduction

Nowadays, too much wastewater is generated due to increasing industrial activity. In this study, produced water is used as the wastewater sample. This is because the production of produced water increases based on the age of the oil field [1]. Produced water is a type of water produced from the subsurface formation and brought up to the surface during the production of oil and gas [2]. Produced water is known as wastewater for the oil and gas industry. The oil and gas product from an underground reservoir is usually associated with water and brine water, which can be referred to as produced water. The major constituent of produced water is salt, whereas the minor constituents are oil, grease and various organic and inorganic chemicals [3].
The production rate of produced water is expected to increase when the age of the oil field increases and more than 60% of daily produced water comes from oil fields. Naturally, there are many constituents in produced water, such as production chemicals, dissolved gas and dissolved minerals [1]. Other components of produced water include brine, metals, inorganic ions, salt content, oil and grease. The salinity of produced water is quite high, as it contains high concentration of salt. The salt is mainly from sodium and chloride and some are from potassium, magnesium and calcium [4]. Besides, the concentration of ions is different according to the location of the oil field [1].
Progressive freezing is one of the processes where the water is frozen into ice crystals to concentrate the liquid or solution. Water is removed from the solution when ice crystals are formed by freezing. Progressive freezing aims to form pure ice crystals with only water and without any solids retained in the ice crystals [5]. During ice crystal formation, solutes are rejected by the nature of the ice crystal formation [6]. Progressive freezing is introduced for volume reduction because it offers a simpler step for separation. This process forms a single block of ice crystals when it is continuously introduced to the cooled surface [7]. Theoretically, the formation of ice crystals starts with ice nucleation. Ice crystals are progressively produced layer by layer on the cooled surface of the crystallizer until a single block of ice crystals is formed [8]. Progressive freezing can overcome the issues of scaling and corrosion in pipes as the process operates at a lower temperature [9].
One of the management units for wastewater treatment is the volume reduction unit. Progressive freezing is introduced to reduce the volume of water from produced water. Currently, the normal solution movement used in the progressive freezing process is stirring. Stirring can improve the solution movement inside the crystallizer and allow the significant growth of the ice crystal layer [10]. Unfortunately, the ice crystal layer might be destroyed if the stirrer moves at high speed; moreover, the stirrer itself requires frequent maintenance [7]. A new assisted technique for solution movement in progressive freezing like circular moving cylindrical crystallizer has been explored. The solution movement enhances the velocity of the solution, resulting in better efficiency for separation.
For this study, response surface methodology (RSM) was used to determine the optimum parameter conditions, which can generate better results for the whole process. This method requires software that uses statistics. Besides, this method is used because it has been determined as the best tool for the optimization of desired values. Thus, the optimum conditions of freezing time, coolant temperature and rotation speed for the volume reduction of produced water were determined using RSM.

2. Methodology

2.1. Materials

All chemicals were of analytical reagent grade. Sodium chloride (17.020 mg/L), magnesium sulfate (364 mg/L), potassium bicarbonate (1.100 mg/L), calcium chloride (8.048 mg/L) and cooking oil (10.88 mL) were mixed and dissolved in distilled water to form the model solution of produced water. Cooking oil was used as the oil solution and it is commercially available with consistent properties. An aqueous ethylene glycol solution containing 50% ethylene glycol and 50% distilled water was used as a coolant. All chemicals (R&M Chemicals) were purchased from Avantis Laboratory Supply (Ipoh, Perak, Malaysia) and cooking oil was purchased from Tesco, Seri Iskandar, Perak, Malaysia.

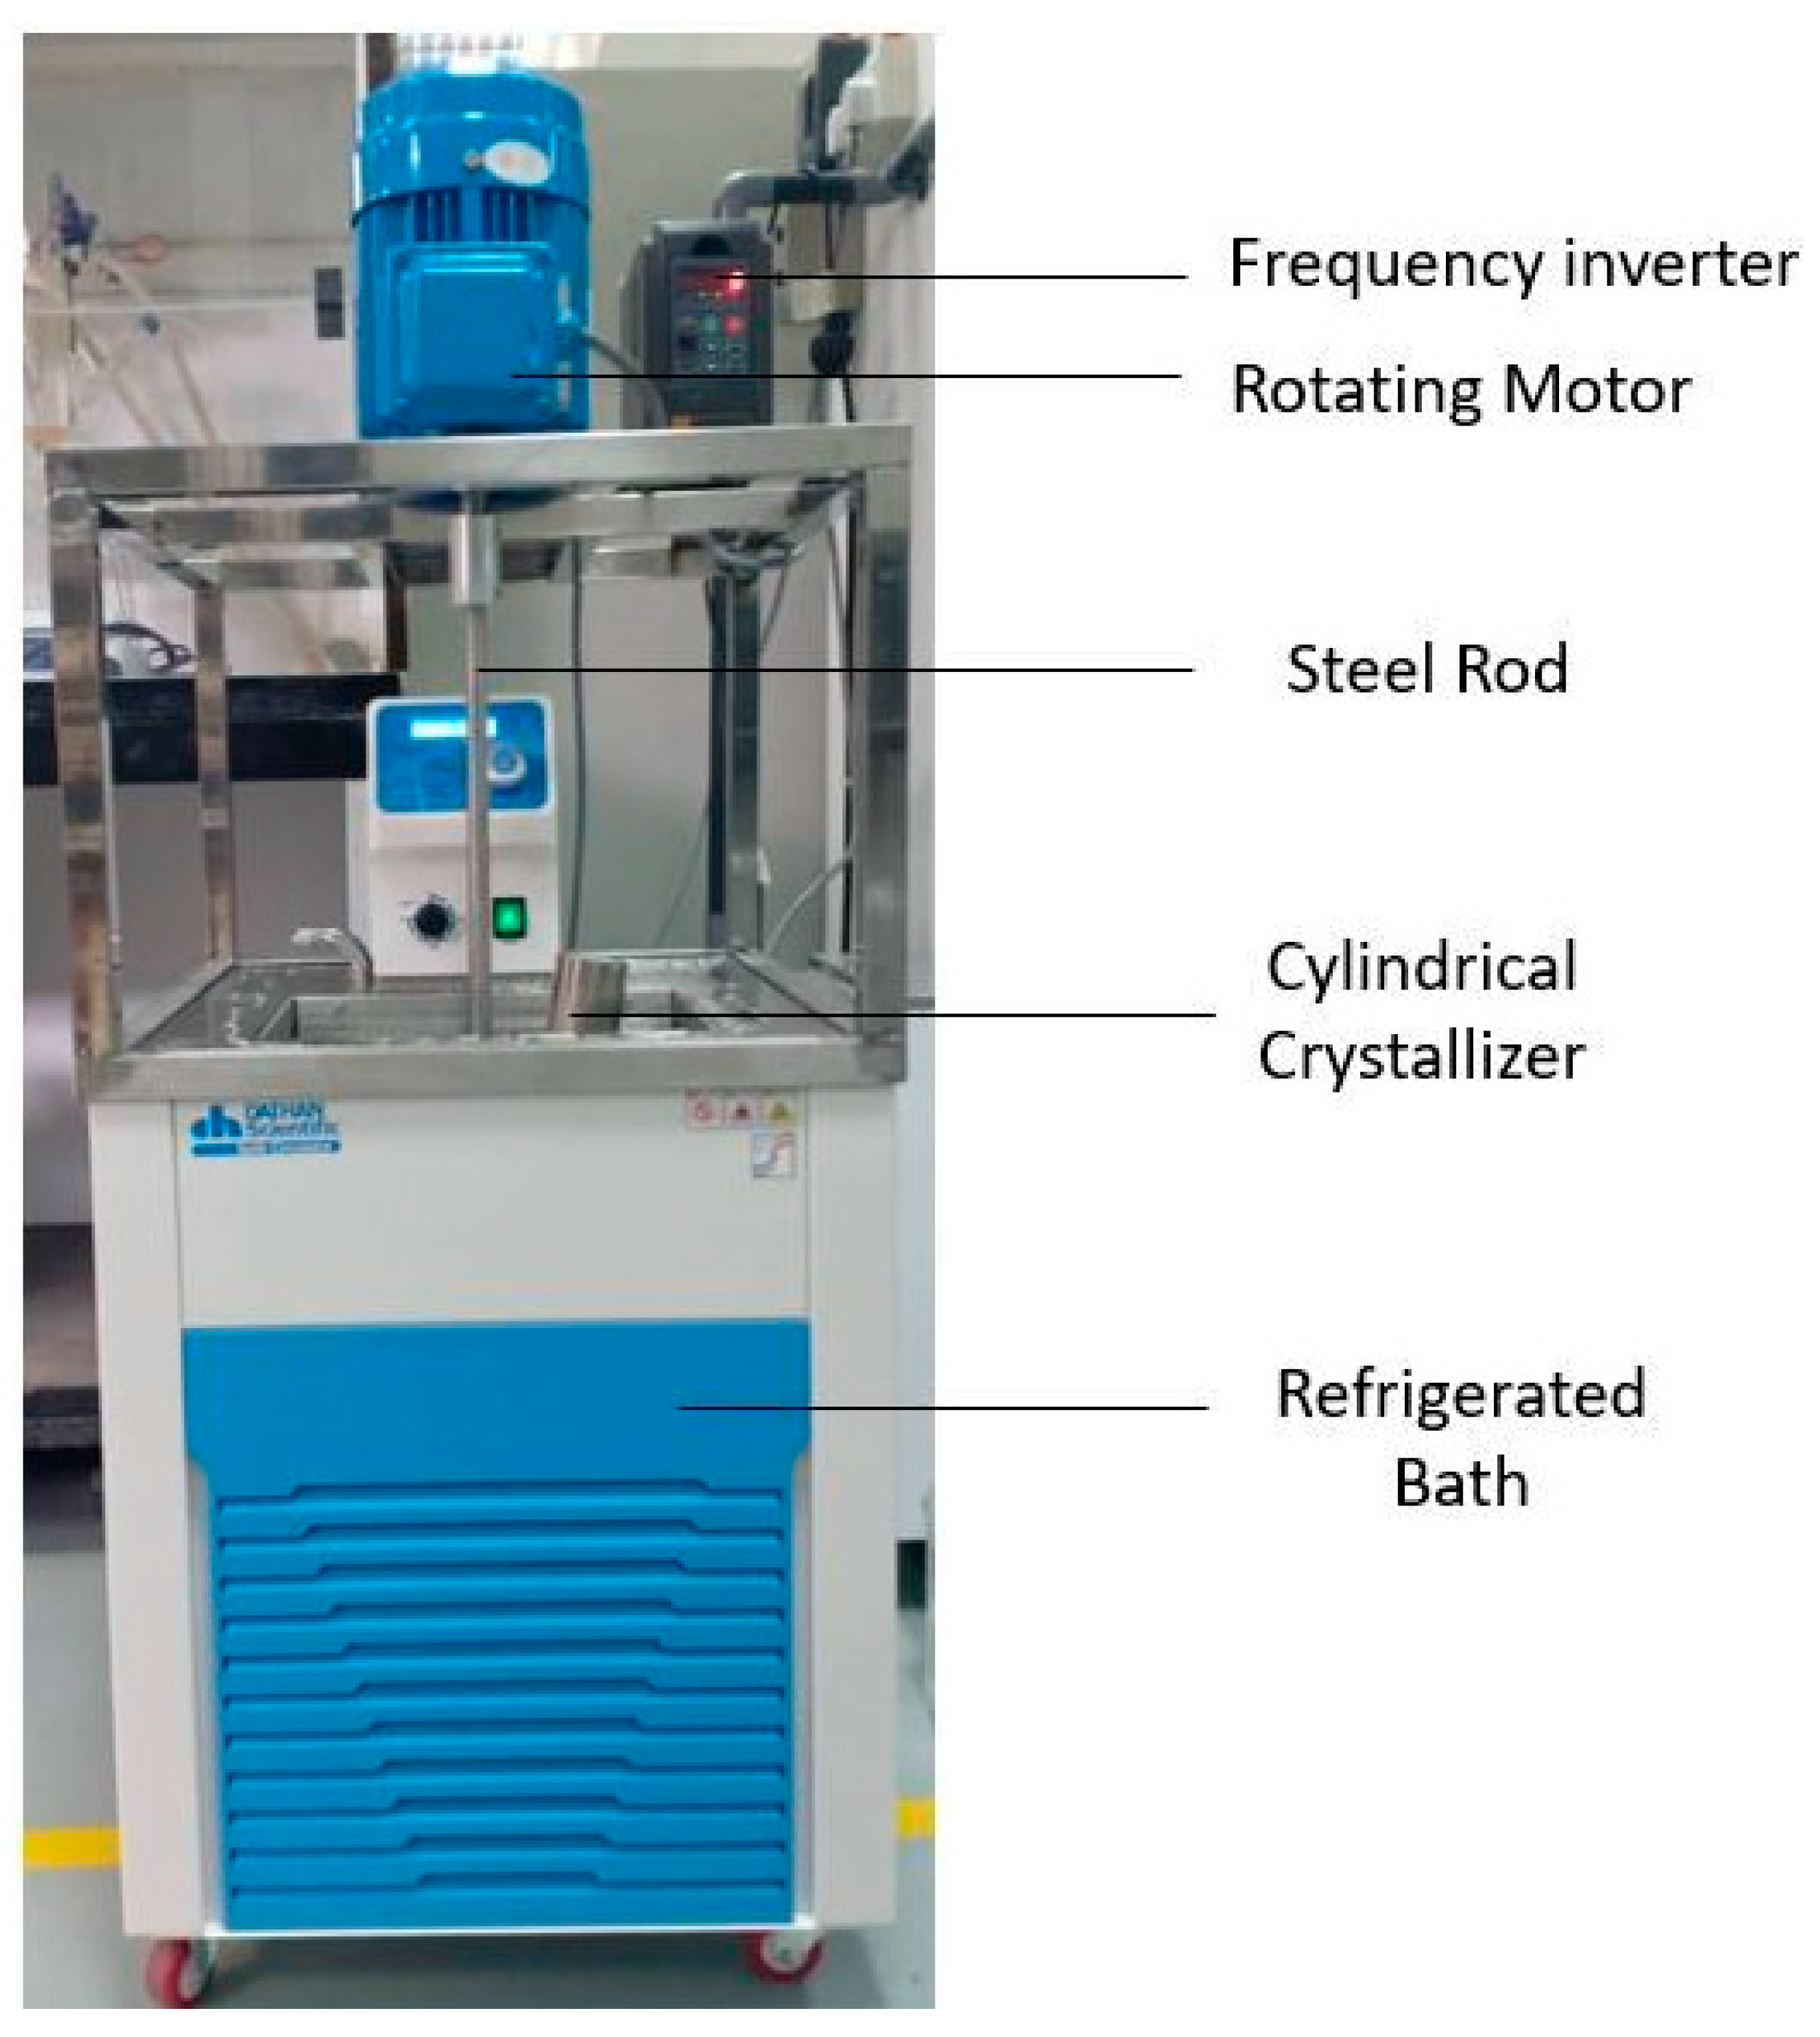
2.2. Design of Crystallizer

A circular moving crystallizer was designed to improve the movement of the solution inside the crystallizer as it will affect the distribution of solute in the solution [11]. A layer of ice crystals will form at the surrounding wall of the crystallizer and grow thicker as the freezing time for the solution to freeze increases. A circular moving cylindrical crystallizer is an alternative to the stirring movement of the solution, as shown in Figure 1. In this case, pure water will form into ice. Thus, the solute needs to distribute well to reduce the amount of solute transferred into ice crystals. A rotating motor (MC-80M2-4, MONTROLI) is used to move the crystallizer with 0.75 kW power. It is connected to a frequency inverter (SB70G0.75D2, SLANVERT).
A steel rod is attached to a rotating motor and the rod is used to hold the crystallizer. Figure 2 shows that the steel rod is connected to the bottom of the rotating motor and immersed in the refrigerated bath. Generally, the crystallizer is built in a cylindrical shape and it is attached to the steel rod. The shape of a crystallizer is designed vertically as the surface of a refrigerated bath is quite small. The cylindrical crystallizer is made of stainless steel with 5 cm width and 20 cm height and it can be shown in Figure 2. The crystallizer can be filled up to 300 mL only due to the small size of the refrigerated bath. Stainless steel is used because it has high resistance towards the corrosion in the solution by certain components. Besides, stainless steel is a recyclable material and known as a tough material [8].
In this study, a refrigerated bath (MaXircu CL-22, DAIHAN Scientific, Gangwon, South Korea) was used to control the coolant temperature. It is controlled by the controller attached at the top of the refrigerated bath. The size of the whole refrigerated bath is 483 × 563 × 850 mm3. The refrigerated bath influences the size of the crystallizer because a bigger surface is needed to rotate. Figure 3 shows the experimental setup for the whole study.

2.3. Experimental Procedures

Synthetic produced water was prepared by mixing different types of salts, cooking oil and distilled water and the mixture was stirred with a magnetic stir bar for 24 h at a constant speed of 600 rpm at 60 °C. The coolant temperature in the refrigerated bath was set to the desired temperature first as it took a longer time to reach the desired temperature. Then, as the coolant temperature reached −8 °C, the solution with temperature 60 °C was added into the crystallizer and immersed in the refrigerated bath. The timer was set at 35 min for freezing and the rotating motor was set at 30 rpm for rotation speed as in Table 2 for the first run. The coolant temperature, freezing time and rotation speed were provided by the STATISTICA software (TIBCO, Palo Alto, CA, USA) according to the range that have been obtained from the screening process.
After 35 min, the rotating motor was stopped and the crystallizer was removed from the refrigerated bath to ease the collection of the product sample. The concentrated solution and ice crystals were collected and separated into different beakers. The experiment was repeated at different coolant temperature, rotation speed and cooling time based on the design of experiment from RSM. For analysis, the mass of the initial solution and ice crystals was measured using a digital weighing scale. All the information was used to calculate the water removal. For chemical analysis, the pH value, chemical oxygen demand (COD), turbidity and oil and grease were measured for the initial solution of synthetic produced water and ice crystals. This value being measured in order to compare the initial solution and the ice crystal at the end of the study and to find out how many percent removal can be done by using progressive freezing technique. All the data were recorded for calculation.

2.4. Experimental Design

This study used STATISTICA to determine the analysis of water removal in the volume reduction of synthetic produced water. Central composite design (CCD) was used to study the interaction of process variables and RSM was used to optimize the process conditions of freezing time (X1), coolant temperature (X2) and rotation speed (X3). The range and coded level of process variables are listed in Table 1. The range for process variable are based on the preliminary experiment for water removal. To optimize the designed system, 17 experimental runs were conducted. The calculation of the predicted response is shown in Equation (1). The experiment for each run is repeated twice for the accuracy result.
Y = β 0 + j = 1 3 β j X j + j = 1 3 β j j X j 2 + i < j β i j X i X j ,
where Y is the predicted response value and β is the regression coefficient (i.e., weighting factor) that fits the experimental factor.

2.5. Water Analysis

In this study, several analysis were conducted to determine the efficiency of the whole process.

2.5.1. Water Removal

It is important to calculate the percentage of water removed from the process. Water is removed from the solution through progressive freezing of produced water solution. W0 is the mass of synthetic produced water and Wi is the mass of ice crystals [12]. Water removal (Wr) can be defined as in Equation (2). The mass of concentrated solution and ice crystals can be determined using a digital weighing scale (A&D Weighing FX-5000i, Toshima City, Tokyo, Japan).
W r   ( % ) = ( W i W 0 ) × 100 % .

2.5.2. Chemical Analysis

The efficiency of the whole process of the study is essential as it can show if the experimental work succeeds and the efficiency can be determined by calculating the percentage removal of COD, oil and grease and turbidity. The percentage removal of COD, oil and grease and turbidity can be calculated using Equation (3) [13,14]. Y0 is the analysis value for the initial solution, whereas Y is the analysis value for the ice crystals. For oil and grease value, n-hexane should be mixed with the sample with the ratio of 1:20 (n-hexane: sample). Then, few drops of mixture solution of n-hexane and sample were placed onto the oil and grease analyzer (InfraCal TOG/TPH Analyzer—HATR-T2, Wilks, Norwalk, CT, USA). For COD analysis, the COD reactor (DRB200 Reactor, HACH, Loveland, CO, USA) was used for the heating process and a spectrophotometer (DR 6000, HACH, Loveland, CO, USA). was used for the reading COD value. Before the heating process, 2 mL of the sample was mixed into COD solution which then the sample was heated for 2 h at 150 °C. The COD value was determined using the spectrophotometer. For turbidity value, the bottle sample was filled up with the sample and it was placed into the turbidity meter (2100Q Portable Turbidimeter HACH, Loveland, CO, USA).
R e   ( % ) = Y 0 Y Y 0 × 100 % .

2.6. Progressive Freezing on Different Concentration

An additional experiment was performed to determine the efficiency of the progressive freezing method by circular moving cylindrical crystallizer on different concentrations of the solution. In this part of the experiment, the concentration was different from the main experiment where the concentration of sodium chloride is 8.51 mg/L, magnesium sulfate is 0.182 mg/L, potassium bicarbonate is 0.550 mg/L, calcium chloride is 4.024 mg/L and cooking oil is 5.44 mL. All chemicals and cooking oil were mixed and dissolved in distilled water to form the new model solution of produced water. The experiment was run at −8 ℃ of coolant temperature, 30 rotation per minute (RPM) of rotation rate and 35 min of freezing time. The other procedures and the experimental setup are same as the main experiment.

3. Results and Discussion

3.1. Ice Formation

An ice crystal layer made of water successfully formed on the inner wall of the crystallizer during freezing. This proved the ability to separate the components of the synthetic produced water through progressive freezing. The thickness of the ice layer varied with different operating conditions. Figure 4 shows the view of the ice crystal layer formed on the inner wall of the crystallizer.

3.2. Model Adequacy Check

Based on the RSM, all designed experiments and the results of water removal for each run are tabulated in Table 2. Equation (4) shows the empirical mathematical model of the predicted water removal (Y1) as a function of X1, X2 and X3 and their interaction using linear and quadratic regression coefficients of main factors and linear-by-linear regression coefficients of interaction. Equation (5) shows the empirical mathematical model of the predicted (%) of COD removal (Y2), Equation (6) shows the predicted (%) of oil and grease removal (Y3) and Equation (7) shows the predicted (%) of turbidity removal (Y4) as a function of X1, X2 and X3.
Y 1 = 5.12698 0.56534 X 1 8.04800 X 2 + 1.45976 X 3 + 0.01820 X 1 2 0.46709 X 2 2 0.01968 X 3 2 0.04587 X 1 X 2 0.01612 X 1 X 3 0.08196 X 2 X 3
Y 2 = 96.6242 + 8.0477 X 1 8.0210 X 2 + 0.7336 X 3 0.1353 X 1 2 0.0241 X 2 2 + 0.0093 X 3 2 + 0.0118 X 1 X 2 0.0271 X 1 X 3 + 0.1012 X 2 X 3
Y 3 = 533.4816 11.5366 X 1 + 48.8536 X 2 1.6483 X 3 + 0.0844 X 1 2 + 1.5631 X 2 2 + 0.0092 X 3 2 0.4989 X 1 X 2 + 0.0251 X 1 X 3 0.0341 X 2 X 3
Y 4 = 213.3829 2.7723 X 1 + 11.8021 X 2 1.0624 X 3 + 0.0437 X 1 2 + 0.5948 X 2 2 + 0.0123 X 3 2 + 0.0066 X 1 X 2 0.0006 X 1 X 3 + 0.0003 X 2 X 3 .
The quadratic effect of the factors can be seen in the coefficients with second-order terms. Besides, it shows the possible curvature and non—linear correlation between factor and output of equation [15]. The positive and negative signs signify the parallel and adverse effects of the factors on the response, respectively [16]. Equations (4), (6) and (7) show a different sign with the individual terms because they specify that the output of the procedure will increase with increasing the factor up to the breakpoint of the factor and the output will decrease back when further increase the factor [15]. In addition, Bevilacqua, Corbo and Sinigaglia indicate that in the CCD design, a polynomial equation is not a theoretical foundation and the coefficients could not have a physical meaning [15].

3.3. Analysis of Variance

Analysis of variance (ANOVA) was used to evaluate the suitability of the generated prediction models. Table 3 shows the ANOVA of the quadratic model for water removal. The F-value represents the ratio of mean square regression to the mean square residual. The calculated F-value must be greater than the tabulated value for 95% confidence level in order to consider that the prediction model is relevant [13,17]. From the results, the F-value for water removal is 3.88, which is higher than the tabulated F-value (F0.05,9,7) of 3.68.
This study is acceptable for the validity of the model generated because the correlation coefficient (R2) produced is 0.83303 which is greater than 0.75. For the good fit of the model, the R2 value must be at least 0.75 [13,14]. It is important to identify the variables that can influence the process significantly. The F-value for (%) of COD removal is 1.2016 while the R2 value is 0.60707. F-value for (%) of oil and grease removal is 1.1755 and the R2 value is 0.60181. F-value for (%) of turbidity removal is 1.4118 and R2 value is 0.64479. All F-values for (%) of COD, oil and grease and turbidity removal are lower than the tabulated F-value (F0.05,9,7) which is 3.68. It is also the same for R2 value which is lower than 0.75. This is because the trend for the other responses is not good enough compared to the response of water removal due to the range and coded level for process variable during the experimental design. Table 4 shows the results of sorted multiple regression that can be used to evaluate the significance of regression coefficients of the model for water removal. The variable with the highest F-value and the lowest p-value is considered the most significant variable. It is shown that the coolant temperature (X2), rotation rate (X3) and quadratic of rotation speed (X32) are statistically significant (p < 0.05) while the others are not statistically significant (p > 0.05)
Regression coefficients of (%) COD and oil and grease removal are not statistically significant (p > 0.05) for all variables. For (%) of turbidity removal, quadratic of coolant temperature (X22) and rotation speed (X32) are statistically significant (p < 0.05) while the other are not statistically significant (p > 0.05).

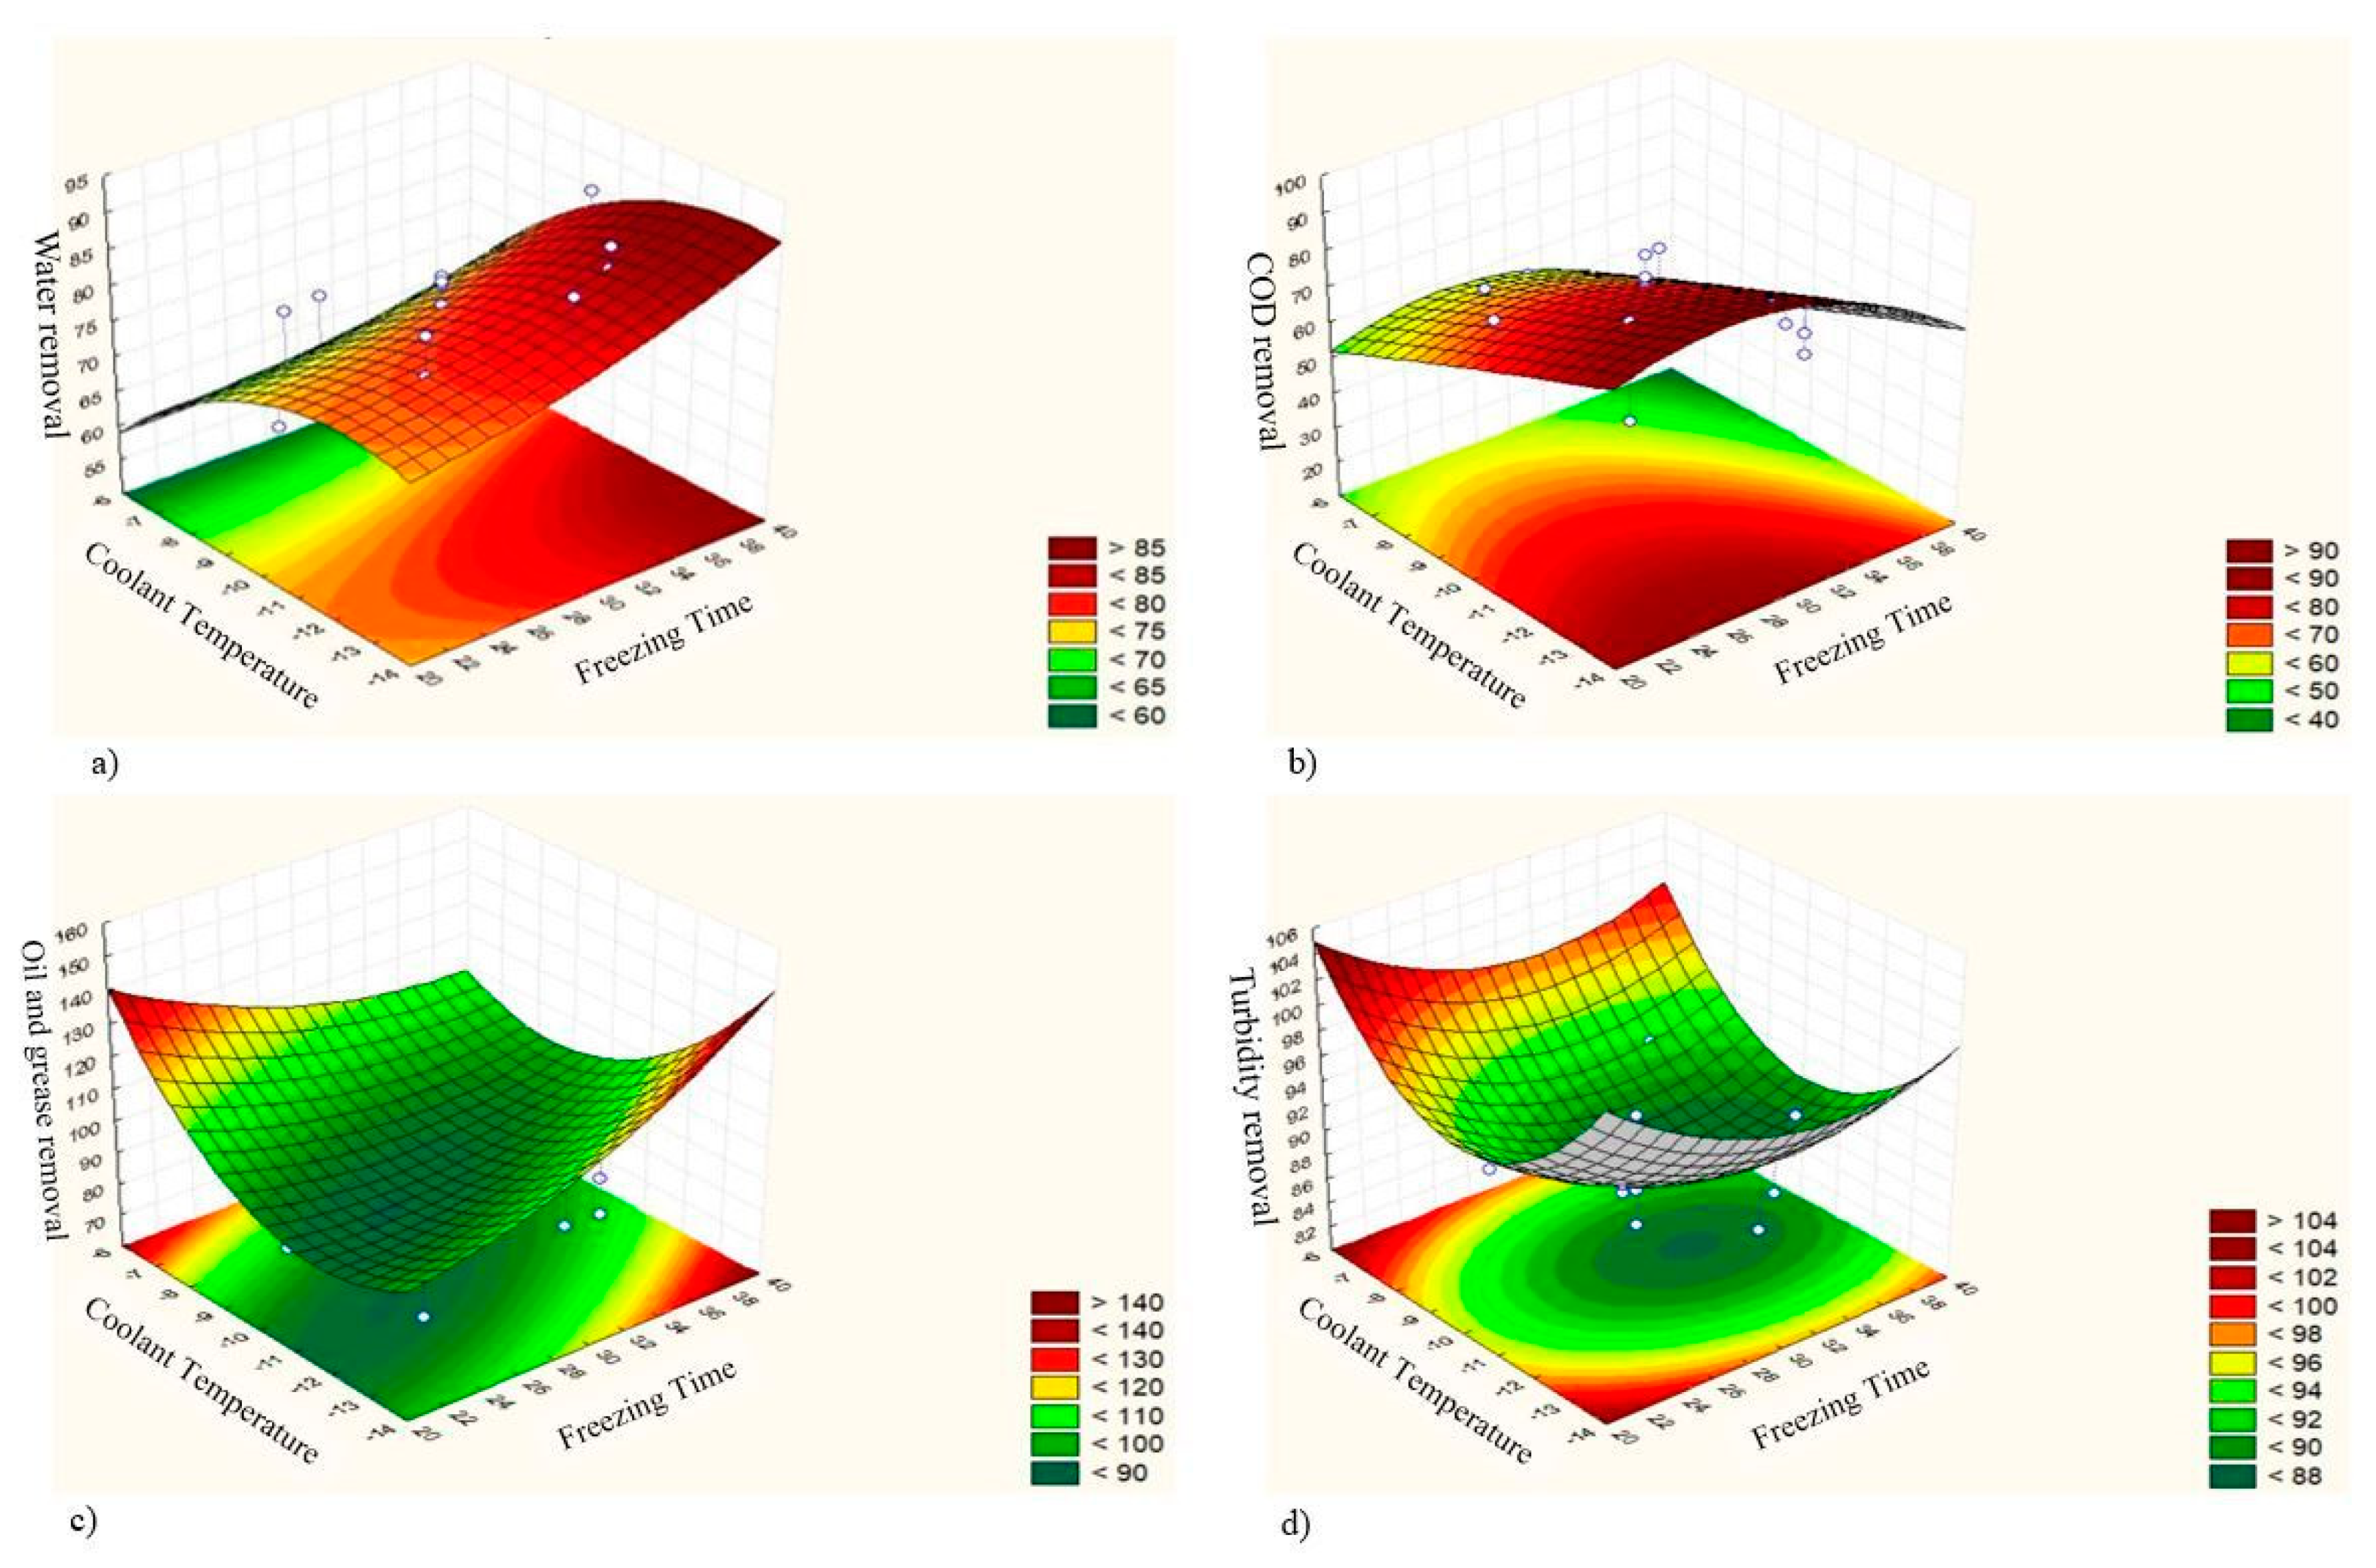
3.4. Response Surface Contour Plot Analysis

Three-dimensional (3D) response surface can demonstrate the effect of all variables on the water removal. Furthermore, it can visualize the significant interaction effects of factors on progressive freezing.
In this experimental work, the effect of freezing time, coolant temperature and rotation speed were studied. Figure 5 shows the 3D surface plots of water removal, COD removal, oil and grease removal and turbidity removal as a function of freezing time and coolant temperature. The freezing time was varied from 20 min to 40 min. Figure 5 shows that the value of water removal and oil and grease removal increased as the freezing time increased while the value for COD removal and turbidity removal decreased. This result can be supported based on the research conducted by Jusoh (2014) and Mohamed Noor (2012), which showed that ice crystals almost filled up the crystallizer at a higher freezing time [18,19]. The efficiency of the system improves when the freezing time is longer [20]. The longer the time taken for the solution to freeze, the thicker the ice layer formed [21].
Based on Figure 5, the water removal, COD removal and turbidity removal increased while the value of oil and grease removal decreased as the coolant temperature decreased from −6 °C to −14 °C. The formation of ice crystals is firmly influenced by the coolant temperature. The ice crystal front growth rate is controlled by the coolant temperature. Lower coolant temperature can enhance the growth rate of ice crystals and heat transfer from a crystallizer into the coolant and also produce lower surface temperature [22].
Figure 6 shows the 3D surface plots of water removal, COD removal, oil and grease removal and turbidity removal as a function of coolant temperature and rotation speed. The trend for water removal, COD removal in Figure 6 increased as the coolant temperature decreased from −6 °C to −14 °C while oil and grease removal decrease. For turbidity, the value of removal increase as the coolant temperature is increasing and decreasing from the middle point. More impurities are trapped in the ice crystals when the temperature difference between the wall of the crystallizer and synthetic produced water solution is higher [22]. Lower surface temperature provides sufficient initial supercooling for ice formation. The inclusion of solute is not allowed by the perfect crystal structure of ice in the ice crystal growth phase but solute inclusion can happen if there is any ice crystal with defects on its structure [23].
Rotation speed is needed for solution movement as it will produce a uniform distribution of the solution [24]. Figure 6, shows that the highest water removal, oil and grease occurred at the highest rotation speed and it is opposite with the COD removal value. For turbidity, the value increased as the rotation speed is increasing and decreasing from the middle point. In this study, the rotation speed was varied between 15 and 75 rpm. When the rotation speed is too high, the ice crystal layer will be destroyed by the movement of the solution inside the crystallizer. Besides, the trend of water removal became the opposite during screening as the value of rotation speed exceeded 75 rpm.
Figure 7 shows the 3D surface plots of water removal, COD removal, oil and grease removal and turbidity removal as a function of freezing time and rotation speed. The trend for Figure 7 shows that water removal increased as the freezing time increased but it contradicts with the trend of value for COD, oil and grease and turbidity removal. Ice crystals start to grow when the nucleation occurs [25]. Freezing time has a significant impact on the rate of concentrated solution formation where it separates water (ice crystal) from the initial solution. Moreover, more time is available to encourage mass transfer due to high thermal conductivity when the freezing time is higher [26].
As the rotation speed increased, the value for COD and oil and grease removal also increases but it is different from the trend for water removal and turbidity removal. The value of water removal starts to increase as the rotation speed increase and it slowly decreases after a certain point, this trend is almost similar to the turbidity removal where the only difference is, it started to decrease as the rotation speed increase and it slowly increases after certain point. This study is consistent with the research conducted by Yahya (2017), where the ice layer formed on the crystallizer wall might be eroded when the rotation speed becomes too high. However, the solution in the crystallizer still needs proper mixing to reduce the amount of solute transferred into the ice crystal layer [11]. Apart from that, higher rotation speed can induce the mass transfer at the interface [23] and the solute will be well distributed. Mass and heat transfer is an essential part of the onset for the phase change, which can be a good opportunity for engineering applications [27].

3.5. Optimum Operating Condition

The optimum operating conditions for freezing time, coolant temperature and rotation speed were based on the regression model. Table 5 shows the predicted value and validation value for optimum conditions. An additional experiment was carried out to validate the optimum condition obtained by RSM. Values for prediction and validation are closed and the error for water removal is lower than 5% which is 1.73%. The error is considered acceptable for the optimization process as in every experiment there will be an experimental error.

3.6. Performance of Progressive Freezing on Different Concentration

77.67% of water removal was achieved at −8 °C of coolant temperature, 30 RPM of rotation rate and 35 min of freezing time. This proves that with any difference in the initial concentration of the sample, the progressive freezing method via circular moving cylindrical crystallizer can be used for the water removal process. Besides, it is also shown that the lower the initial concentration of the sample, the higher percentage of water removal can be achieved as the smaller amount of solutes moves freely in the solution.

4. Conclusions

In this study, the effect of freezing time, coolant temperature and rotation speed on the volume reduction of produced water via progressive freezing was investigated. A new solution movement technique for a crystallizer, which is circular moving, was applied in progressive freezing. The resultant ice crystals and concentrate of the solution were tested for water removal. RSM was used to optimize the water removal. Under optimum conditions of 22.79 min of freezing time, −14.89 °C of coolant temperature and 59 RPM of rotation speed, 89.67% of water removal was achieved. This value has been validating through the additional experiment with the error below 5%.

Author Contributions

W.N.A.M. performed most of the experiments, analyzed the data and drafting the manuscript under supervision of S.S. and N.A.A., S.S. conceived the idea, provided the materials, supervised the work and refining the final manuscript. N.A.A. and E.H.Y. contributed to refining the final manuscript. All authors have read and agreed to the published version of the manuscript.

Funding

This research was funded by PETRONAS via YUTP-FRG, (Cost Centre: 015LC0-079) and The APC was funded by (Cost Centre: 015LC0-079).

Institutional Review Board Statement

Not applicable.

Informed Consent Statement

Not applicable.

Data Availability Statement

Not applicable.

Acknowledgments

The authors would like to acknowledge the financial assistance from PETRONAS via YUTP-FRG (Cost Centre: 015LC0-079) and facilities support from HICoE Centre for Biofuel and Biochemical Research (CBBR) and Chemical Engineering Department.

Conflicts of Interest

The authors declare no conflict of interest.

References

  1. Igunnu, E.T.; Chen, G.Z. Produced water treatment technologies. Int. J. Low-Carbon Technol. 2014, 9, 157–177. [Google Scholar] [CrossRef] [Green Version]
  2. Clark, C.E.; Veil, J.A. Produced Water Volumes and Management Practices in the United States; UNT Libraries Government Documents Department, Argonne National Laboratory: Lemont, IL, USA, 2009. [Google Scholar]
  3. Veil, J.A.; Puder, M.G.; Elcock, D.; Redweik, R.J. A White Paper Describing Produced Water from Production of Crude Oil, Natural Gas, and Coal Bed Methane; UNT Libraries Government Documents Department, Argonne National Laboratory: Lemont, IL, USA, 2004. [Google Scholar]
  4. Al-Ghouti, M.A.; Al-Kaabi, M.A.; Ashfaq, M.Y.; Da’Na, D.A. Produced water characteristics, treatment and reuse: A review. J. Water Process. Eng. 2019, 28, 222–239. [Google Scholar] [CrossRef]
  5. Hernández, E.; Raventós, M.; Auleda, J.; Ibarz, A. Freeze concentration of must in a pilot plant falling film cryoconcentrator. Innov. Food Sci. Emerg. Technol. 2010, 11, 130–136. [Google Scholar] [CrossRef]
  6. Lorain, O.; Thiebaud, P.; Badorc, E.; Aurelle, Y. Potential of freezing in wastewater treatment: Soluble pollutant applications. Water Res. 2001, 35, 541–547. [Google Scholar] [CrossRef]
  7. Samsuri, S.; Amran, N.A.; Yahya, N.; Jusoh, M. Review on Progressive Freeze Concentration Designs. Chem. Eng. Commun. 2016, 203, 345–363. [Google Scholar] [CrossRef]
  8. Samsuri, S.; Amran, N.A.; Jusoh, M. Spiral finned crystallizer for progressive freeze concentration process. Chem. Eng. Res. Des. 2015, 104, 280–286. [Google Scholar] [CrossRef]
  9. Williams, P.M.; Ahmad, M.; Connolly, B.S.; Oatley-Radcliffe, D.L. Technology for freeze concentration in the desalination industry. Desalination 2015, 356, 314–327. [Google Scholar] [CrossRef]
  10. Lewis, A.; Nathoo, J.; Thomsen, K.; Kramer, H.; Witkamp, G.; Reddy, S.; Randall, D.G. Design of a Eutectic Freeze Crystallization process for multicomponent waste water stream. Chem. Eng. Res. Des. 2010, 88, 1290–1296. [Google Scholar] [CrossRef]
  11. Miyawaki, O.; Liu, L.; Shirai, Y.; Sakashita, S.; Kagitani, K. Tubular ice system for scale-up of progressive freeze-concentration. J. Food Eng. 2005, 69, 107–113. [Google Scholar] [CrossRef]
  12. Amran, N.A.; Samsuri, S.; Ngadi, N.; Zakaria, Y.Z.; Jusoh, M. Behaviour of ice crystal growth in a vertical finned cylindrical freeze concentrator. Appl. Mech. Mater. 2014, 695, 451–454. [Google Scholar]
  13. Verma, A.K.; Bhunia, P.; Dash, R.R. Decolorization and COD Reduction Efficiency of Magnesium over Iron based Salt for the Treatment of Textile Wastewater Containing Diazo and Anthraquinone Dyes. Int. J. Chem. Biol. Eng. 2012, 6, 116–123. [Google Scholar]
  14. Tir, M.; Moulai-Mostefa, N. Optimization of oil removal from oily wastewater by electrocoagulation using response surface method. J. Hazard. Mater. 2008, 158, 107–115. [Google Scholar] [CrossRef] [PubMed]
  15. Bevilacqua, A.; Corbo, M.R.; Sinigaglia, M. Design of experiments: A powerful tool in food microbiology. In Current Research, Technology and Education Topics in Applied Microbiology and Microbial Biotechnology; Méndez-Vilas, A., Ed.; Formatex Research Center: Norristown, PA, USA, 2010; pp. 1419–1429. ISBN -13 978-84-614-6195-0. [Google Scholar]
  16. Safiei, N.Z.; Danuri, N.F.N.; Rosly, M.K.; Shaharuddin, S. Optimization of Fractional Freezing Process for Orange Juice Concentration. Mater. Today Proc. 2019, 19, 1591–1598. [Google Scholar] [CrossRef]
  17. Department of Environment, Ministry of Natural Resources and Environment. Environmental Requirements: A Guide for Investors; Ministry of Natural Resources and Environment: Putrajaya, Malaysia, 2010.
  18. Samsuri, S.; Muhammad Muhaimin, M.B. Optimization of Fractional Crystallization on Crude Biodiesel Purification via Response Surface Methodology. Sep. Sci. Technol. 2018, 53, 567–572. [Google Scholar] [CrossRef]
  19. Amran, N.A.; Low, S.N.A.M.K.; Samsuri, S. Optimization of fractional freezing process for bioethanol purification. IOP Conf. Ser. Mater. Sci. Eng. 2020, 736. [Google Scholar] [CrossRef]
  20. Mohamed Noor, N.N.; Yahya, N.; Samsuri, S.; Ariffin, M.A.; Said, M.A.; Jusoh, M. Progressive freeze concentration of dairy wastewater: Effect of flowrate and circulation time. In Proceedings of the 3rd International Conference on Engineering and ICT, Melaka, Malaysia, 4–6 April 2012. [Google Scholar]
  21. El-Dessouky, H.T.; Ettouney, H.M.; Mandani, F. Performance of parallel feed multiple effect evaporation system for seawater desalination. Appl. Therm. Eng. 2000, 20, 1679–1706. [Google Scholar] [CrossRef]
  22. Jusoh, M.; Yunus, R.M.; Hassan, M.A.A. Effect of Flowrate and Coolant Effect of Fowrate and Coolant Temperature on the Efficiency of Progressive Freeze Concentration on Simulated Wastewater. Int. J. Chem. Mol. Nucl. Mater. Metall. Eng. 2008, 2, 308–311. [Google Scholar]
  23. Amran, N.A.; Samsuri, S.; Safiei, N.Z.; Zakaria, Z.Y.; Jusoh, M. Review: Parametric Study on the Performance of Progressive Cryoconcentration System. Chem. Eng. Commun. 2016, 203, 957–975. [Google Scholar] [CrossRef]
  24. Yahya, N.; Ismail, N.; Zakaria, Z.Y.; Ngadi, N.; Abdul Rahman, R.; Jusoh, M. The Effect of Coolant Temperature and Stirrer Speed for Concentration of Sugarcane via Progressive Freeze Concentration Process. Chem. Eng. Trans. 2017, 56, 1147–1152. [Google Scholar]
  25. Schulte, K.; Weigand, B. On the analytical modelling of the initial ice growth in a supercooled liquid droplet. Int. J. Heat Mass Transf. 2018, 127, 1070–1081. [Google Scholar] [CrossRef]
  26. Jusoh, M.; Nor, N.N.M. Progressive Freeze Concentration of Coconut Water: Effect of Circulation Flowrate and Circulation Time. J. Teknol. 2014, 67, 91–96. [Google Scholar] [CrossRef] [Green Version]
  27. Qin, F.; Chen, X.D.; Free, K. Freezing on subcooled surfaces, phenomena, modeling and applications. Int. J. Heat Mass Transf. 2009, 52, 1245–1253. [Google Scholar] [CrossRef]
Figure 1. Circular motion of cylindrical crystallizer in refrigerated bath.
Crystals 11 00103 g001
Figure 2. View of cylindrical crystallizer.
Crystals 11 00103 g002
Figure 3. Experimental setup for progressive freezing via a circular moving cylindrical crystallizer.
Crystals 11 00103 g003
Figure 4. Top view of ice layer form at the inner wall of crystallizer.
Crystals 11 00103 g004
Figure 5. 3D surface plot of (a) water removal (b) chemical oxygen demand (COD) removal (c) oil and grease removal (d) turbidity removal as a function of coolant temperature and freezing time.
Crystals 11 00103 g005
Figure 6. 3D surface plot of (a) water removal (b) COD removal (c) oil and grease removal (d) turbidity removal as a function of rotation speed and coolant temperature.
Crystals 11 00103 g006
Figure 7. 3D surface plot of (a) water removal (b) COD removal (c) oil and grease removal (d) turbidity removal as a function of rotation speed and freezing time.
Crystals 11 00103 g007
Table 1. Range and coded level.
FactorsRange and Levels
−α−10+1
X1 (min)2025303540
X2 (°C)−14−12−10−8−6
X3 (RPM)1530456075
Table 2. Design of experiment and response.
RunManipulated VariableResponse
X1 (min)X2 (°C)X3 Rotation per Minute (RPM)(%)Water Removal(%) COD Removal(%) Oil and Grease Removal(%) Turbidity Removal
135−8307264.6766.6791.95
235−12608556.4788.3192.97
325−123079.3383.7266.3992.06
430−10458365.3865.8586.60
525−86060.6770.9191.0291.79
625−126084.6756.8789.5392.87
730−10458273.1683.9186.09
835−12308862.3077.0492.80
935−86062.6741.8392.2492.61
1025−83068.6756.4790.3791.40
1138.37−104587.6747.7685.5881.17
1230−6.654571.3358.9991.392.27
1330−13.35458986.5792.9588.60
1421.63−104585.6779.4082.4792.49
1530−104582.3360.5772.9083.22
1630−1019.906781.8883.0190.73
1730−1070.17976.0079.7892.31
Table 3. ANOVA for prediction model of water removal response.
SourcesSum of Square of Error (SSE)Degree of Freedom (DF)Mean Squares (MS)F-Value
Regression (SSR)1127.0719125.2303.88
Residual225.911732.273
Total (SST)1352.98216
R20.83303
Table 4. Significance of regression coefficients of the model.
FactorCoefficientStandard ErrorFp
X31.459761.25236.758240.035443
X120.018200.06810.071350.797073
X2X3−0.081960.06701.498580.260488
X1X3−0.016120.02680.362180.566272
X32−0.01960.00766.758240.035443
X1X2−0.045870.20090.052170.825862
X22−0.0467090.42581.203590.308906
X1−0.565344.72090.711900.426702
X2−8.0480010.885123.963970.001763
Table 5. Validation value for optimum conditions of variables.
ResponseX1 (min)X2 (°C)X3 (RPM)(%) Water Removal (Prediction)(%)Water Removal (Validation)
Value22.79−14.895991.2589.67
Publisher’s Note: MDPI stays neutral with regard to jurisdictional claims in published maps and institutional affiliations.

