Article

Potential Therapeutic Effects of New Ruthenium (III) Complex with Quercetin: Characterization, Structure, Gene Regulation, and Antitumor and Anti-Inflammatory Studies (RuIII/Q Novel Complex Is a Potent Immunoprotective Agent)

1
Department of Chemistry, Faculty of Science, Main Campus, Taif University, P.O. Box 11099, Taif 21944, Saudi Arabia
2
Biology Department, Faculty of Science, Main Campus, Taif University, P.O. Box 11099, Taif 21944, Saudi Arabia
*
Authors to whom correspondence should be addressed.
Crystals 2021, 11(4), 367; https://doi.org/10.3390/cryst11040367
Submission received: 8 March 2021 / Revised: 23 March 2021 / Accepted: 25 March 2021 / Published: 31 March 2021
(This article belongs to the Special Issue New Trends in Crystals at Saudi Arabia)

Abstract

:
The aim of this study was to evaluate the antioxidant and anti-inflammatory effects of the new [Ru(Q)(Cl)2(H2O)2] complex (RuIII/Q). A new vital complex containing quercetin flavonoid compound (Q) with ruthenium (III) ions was synthesized. The molar conductivity of the RuIII/Q complex was measured in dimethylsulfoxide (DMSO) with value 12 (Ω−1 mol−1 cm−1, indicating their non-electrolytic nature. Infrared (FTIR) spectroscopic investigation of the RuIII/Q complex indicated that Q is coordinated as a bidentate with Ru metal ions through the oxygen of carbonyl C(4)=O group and oxygen of phenolic C(3)−O group based on the wavenumber shifts at 1654 and 1335 cm−1 respectively. The electronic (UV−Vis) spectra and the magnetic susceptibility value (1.85 B.M.) revealed that the Ru(III) complex has an octahedral geometry. The average diameter of the RuIII/Q nanoparticles was approximately 7–15 nm according to the transmission electron microscopy. The thermogravimetric study (TG/DTG) indicates that the RuIII/Q compound is quite stable until 300 °C. To assess biological activity, 60 male rats were allocated to six groups, namely control, DG (D-galactose), Q, RuIII/Q, DG plus Q, and DG plus RuIII/Q. Antioxidant enzymes (SOD, CAT, GPx, and GRx), markers of lipid peroxidation (such as MDA), expression of genes (namely Nrf2, Cu-ZnSOD, CAT, GPx, cyto c, P53, Bax, BCl2, caspase-3, and caspase-9 in testicular tissue), glutamate, 4-hydroxynonenal (HNE), GSH, HCY, amyloid beta, and GABA levels were evaluated in brain tissues. Cytokines, such as IL-6 and TNF-α, histological and ultrastructural studies were estimated in both the brain and testicular tissues, while the comet assay was performed in the brain tissue. RuIII/Q administration either alone or combined with DG reduced oxidative injury to normal levels and decreased apoptotic activities. Thus, RuIII/Q inhibited injury in both the testis and brain and reduced oxidative stress in male rats. The (RuIII/Q) complex has a potent ameliorative effect against aging neurotoxicity, reproductive toxicity, and antihepatic cancer activity induced by D-galactose (DG).

1. Intoduction

Studies have shown that D-galactose (DG) treatment causes oxidative injury and mitochondrial dysfunction in male mice and rats [1]. Inflammation is caused due to oxidative stress [2]. DG treatment caused oxidative damage in the brain and eventually resulted in neurodegeneration and cognitive dysfunction [3]. Moreover, DG-induced changes accelerated the series of aging in rodents [4].
Aging has a major role in neurological impairments, decreased antioxidant activities, and elevated neuro-inflammation. DG is an artificial aging model, which induces oxidative stress and inflammatory response resulting in memory and synaptic dysfunction [5].
Aging is a major factor involved in the impairment of different physiological functions [6]. Oxidative stress has been considered as the major key in induction of the neurodegenerative diseases and in aging [7].
Tissue-accumulated DG can react with amino groups of proteins to form advance glycation end-products (AGEs). Receptor-bound AGEs are a common thread in aging and neurodegeneration, such as Alzheimer’s disease [8]
Biological inorganic chemistry has growing importance in the field of therapeutics as well as diagnostic medicine. It offers the potential for design and preparation of novel drug complex that can treat diseases that are resistant to the regular therapeutic methods [9]. Metal chelation is an excellent key to elevate the lipophilic characters of the organic moiety. It was reported that the compounds with structures containing at least 2 functional groups (–OH, –COOH, –C=O and –O–) in a favorable structure-function can show metal chelating activity as present in case of Q. The chelating capacities of complexed Q differed slightly from free Q. In the presence of low amounts of metals, the chelating property of Q was lower than that of free Q whereas in case of the presence of higher concentration of the metal with Q, the situation is reversed, this is according to the statistic point of view [10].
The processing conditions strongly affect the flavonoids’ biological activity as Q [11]. Additionally, the therapeutic effectiveness of Q is limited by its unsuitable physicochemical properties, particularly their poor water solubility [12]. So, the inclusion of complexes of some flavonols and quercetin were obtained [13] which represent an extremely active area of research especially in drug photostability [14]. In fact, the ability of metals to form chelating complexes with different drugs is commonly used to improve and enhance their solubility and stability [15].
The antioxidant activities of Q play a vital role in the treatment of a lot of diseases [16]. Due to Q bioavailability, Q may also exhibit strong antioxidant activities after forming a complex or combining to form some novel preparations used for human health care [9]. At the same time, according to the recent research analysis depend on the Web of Science database, the antioxidant property of Q has become a research hotspot [17] and thus confirming its activity against cancer cells.
Regarding coordination, ligands might enhance their bioactivity profiles, while some inactive ligands may acquire more advanced and developed pharmacological properties, they have become an important and vital class of composition and selective binding agents for the nucleic acids [9].
Compounds that selectively can recognize a non-duplex composition and they are involved in the process of controlling of gene expression. They are considered as chemotherapeutic agents for various types of diseases. The mechanism by which metal complex interact with non-duplex composition is like those seen in the duplex DNA and RNA, i.e., intercalation binding [18]. Among these DNA–targeted guest molecules, Ru-based compounds have attracted more attention because of their low toxicity and their effective anticancer activities [19]. Ru chemical properties, like rate of ligand exchange, range of oxidation states and ability to mimic “Fe” binding to certain biological molecules make them very suitable for the medicinal applications and this is the important target today. Particularly, Ru(III) organometallics represents one of the latest trends in the metallodrug research [20]. Oxidative stress is an important state of disturbance of the balance between the generation of the reactive oxygen species and the antioxidant defense mechanisms of the biological systems which act by the direct detoxifying of the reactive intermediate molecules or by repairing the damage that was caused [21]. Reactive oxygen species, also referred as production of the free radicals, that causes imbalance in the cellular oxidant state by damaging the cellular DNA and other cellular components beside disrupting the cellular signaling. Oxidative stress is believed to have an important role in the incidence of a lot of chronic diseases such as chronic inflammation, cardiovascular diseases, diabetes mellitus, neurodegenerative diseases as well as aging [22]. Reactive species affects the efficacy of neurotransmitters and excitatory amino acids which are all present in the brain tissues. Additionally, the brain represents a vital source of oxidative stress, as the metabolism in the brain acts as a “factory” of reactive oxygen species which attacks the neurons, which may lead to oxidative injury and cellular apoptosis [23].
Antioxidants are the compounds that can scavenge the free radicals through the implication of the defense antioxidant enzymes Cu/Zu SOD and GPx, by direct non-enzymatic actions. Quercetin (Q) is a bioflavonoid which is present in many foods and vegetables. In foods, quercetin is present in a form of glycoside (with sugar groups attached) and is being deglycosylase to quercetinaglycone prior to absorption into the small intestine [24]. The Q is an effective compound in preventing the oxidative injury that may be caused by the cellular apoptosis and it is more potent agent as compared to other antioxidant compounds, such as GSH and vitamins like vit “C” and “E” [25]. Additionally, Q protects against the hepatic damage and this might be by reducing the overexpression of the NO synthase induced by different types of stimuli [26]. Q belongs to the flavonoids family, which is present in most of the plants including fruits and vegetables and having antioxidant activities. Quercetin has anti-inflammatory and anticancer activities along with its capturing activities of “OH”, “H2O2”, and “O2−” [27].
Q has the great ability to combat the oxidative stress side effects. The neuroprotective effects of Q are mainly due to potential regulation of the cytokines via nuclear factor (erythroid-derived 2)-like 2 (Nrf2) [28]. Apoptosis represents a potent mechanism which is involved in the induction of DNA damages in sperm. Apoptosis is characterized by alterations in the cellular membranes and causes DNA disintegration. Caspases, which play an important role in the cascade of the cellular apoptosis, were found to be activated in relation with some other apoptotic markers as DNA splitting [29]. Caspases are a family of proteases. They are activated as initiators. Caspase 3 is the most important and potential between caspases since it confirms the cleaving of many cellular proteins and is responsible for DNA disintegration. Many investigations have focused on the effects of antioxidants on human gametes and thus the current study is worthy of investigation [30]. Antioxidants might act to decline the oxidative damage to the cellular components either in vivo or in vitro and many studies exist in these regards to alleviate the oxidative stress effect on DNA damage [31].
Cancer chemoprevention, targeting normal and high-risk populations, includes using drugs or other chemical factors to inhibit, retard or reverse the development of cancer. Q is one of the main flavonoids that we consider that it may inhibit cancer development. This group of antioxidants exhibits a wide range of the biological activities such as antioxidant, antibacterial, antiviral, and anti-carcinogenic actions. Q is known to have potent antioxidant activity and can act by scavenging the free radicals [32]. Q might have a beneficial role in prohibiting the adverse effects induced by H2O2 and lipid peroxides by reducing MDA levels and elevating the antioxidant enzyme capacities in male rats. Q also proved its potent activity in the prevention of DNA degradation that resulted from the oxidative injury. Recently, Q combined with resveratrol have antioxidant action on the spermgenotoxicity by declining the mitochondrial membrane potential [31].
Additionally, the aim of this study is to determine the mechanism of action of a new potent antioxidant complex (RuIII/Q) to delay or alleviate the progression of side effects of oxidative stress, cancer progression and their complications, as well as for its anti-aging potent effects and, further, to explore whether RuIII/Q protected rat brain and testis from DG-induced damage or injury by attenuating the oxidative injury or suppressing inflammation to provide novel insights into the actions of the novel complex RuIII/Q in the protection of the brain and testis. To our knowledge, this is the 1st report presenting anti-aging, antioxidant, anti-inflammatory, anti-genotoxic and anticancer effects of Q chelated with Ru. Therefore, the aim of this study was to assess the effects of the novel RuIII/Q complex against aging and redox imbalance; evaluate its anticancer activities in the liver at the level of inflammation and oxidative injury.

2. Materials and Methods

2.1. Chemicals and Analyses

All chemicals (quercetin and ruthenium(III) chloride hydrate) were purchased from “Sigma-Aldrich” (St. Louis, MO, USA) and then used without purification. The ruthenium(III) complex with Q was synthesized by the following method. Analyses and corresponding models are summarized as follows:
Type of AnalysisModels
Elemental analysesPerkin Elmer CHN 2400
ConductanceJenway 4010 conductivity meter
FTIR spectraBruker FTIR Spectrophotometer
Electronic spectra UV2 Unicam UV/Vis Spectrophotometer
Thermo gravimetric TG/DTG–50H, Shimadzu thermo-gravimetric analyzer
TEMJEOL 100 s microscopy

In Vitro Release Profile of Q and Ru from Ruthenium(III) Complex with Q

The release profile of Q and Ru from the prepared (Ru/Q) complex was studied by using two compartments diffusion cells separated by a cellulose membrane of molecular weight cut-off = 12.000. A total of 4 mg of the ruthenium(III) complex with Q was suspended in the donor compartment in 1 mL slightly basic PBS, whereas the receiver compartment contained PBS, and was left shaking at 37 °C for about 8 h. The amount of both Q and Ru released from the dialysis bag was determined at different intervals by measuring the absorbance values at 390 nm. All the measurements were done in triplicates.

2.2. Synthesisof New RuIII/Q III Complex

A mixture of hot methanolic solution of free Q ligand (1 mmol) and hot methanolic solution (1 mmol) of ruthenium(III) chloride hydrate solution was refluxed for 5 h. The pH was maintained at ~8 with ammonia solution buffer. A precipitate was observed, and the solution was allowed to stand at room temperature. Upon slow evaporation a greenish black solid powder of the Ru(III) complex was obtained, which was filtered, washed with methanol and ether, and dried under vacuum over anhydrous CaCl2. The purity of the complex was checked by TLC.

2.3. Animal Model

Experiments were performed on 60 adult male rats (12 rats in each group) by following guidelines of the ethics committee of Zagazig University for Animal Use “ZU-IACUC” approval number: (ZU-IACUC/1/F/41I2018). Rats weighing 170–180 g were kept under healthy conditions with food and drink ad libitum.

2.4. Experimental Design

We obtained 3-month-old animals weighing 190–200 g from the Faculty of Veterinary Medicine, Zagazig University and divided them into six groups. Group I or control was injected with normal physiological saline (0.9%) as vehicle. Group II was given DG (Sigma–Aldrich, USA) (500 mg/kg) i.p. for about 60 d [33] as studies have reported that chronic administration of DG afforded significant alterations and may mimic aging [33]. Groups III and IV were given Q (20 mg/kg) [34] and RuIII/Q (20 mg/kg), respectively. Group V was given DG (500 mg/kg) and Q (20 mg/kg). Group VI was administrated DG plus (RuIII/Q) as recommended doses. All treatments were i.p. administered.

2.5. Blood Samples

After the end of the experiment, blood samples were taken from rat eye plexus and divided into two parts. The first was added to tubes with EDTA and the second to EDTA free tubes. The tubes were centrifugated at 3075 RCF for approximately 15 min. Plasma and serum were obtained from the first and second tubes, respectively, for biochemical analysis.

2.6. Preparation of Tissue Homogenates for Determination of the Redox State

For determining oxidative injury, 0.25 g brain and testicular tissues were immersed in 50 mM phosphate buffer (pH 7.4). A protease inhibitor was added to protect enzymes from oxidation. To obtain the supernatant, brain and testicular tissue homogenates were centrifuged.

2.7. Determination of Oxidative Stress Biomarker Activities in Either Brain and Testicular Tissues Homogenates

The MDA level was determined according with Ohkawa et al., 1979 [35]. SOD activity was determined according with Marklund and Marklund., 1974 [36]. CAT activity was estimated according with Aebi., 1984 [37]. GRx was determined according with Couri and Abdel-Rahman., 1980 [38].GR activity was expressed as U/g tissue. Glutathione peroxidase (GPx) was assayed according with Hafeman et al., 1974 [39] following guidance steps of the kit that was brought from Biovision (Biovision, Milpitas, CA, USA).

2.8. TNF-A and IL-6 Activities in the Testis Homogenates

Cytokines levels (TNF-α and IL-6) were determined in the testicular tissue homogenates by using specific monoclonal antibody for both TNF-α and IL-6 according to the guidance steps in the kits that were brought from R&D system (R&D system, Minneapolis, MN, USA). Cat Number of TNF-α ELISA kit is:E-EL-R0019, Cat Number of IL-6 ELISA kit is:E-EL-R0015. Their values were expressed as Pg/mL.

2.9. Mitochondrial ROS Assay

The mitochondrial ROS generation was evaluated using the dichlorodihydrofluoresceindiacetate (DCFH-DA) probe. An increase in fluorescence intensity indicates an increase in ROS generation due to exposure to inflammation of hepatotoxicity [40].

2.10. Mitochondria Membrane Potential (MMP, Δψm) Assay

The mitochondria of the hepatic tissues were isolated from all groups. Briefly, the mitochondrial ROS generation was evaluated using rhodamine 123 (Rh123) probe at a final concentration of 10 μM for 30 min at 30 °C. An increase in fluorescence intensity indicates an increase in the collapse of MMP [40].

2.11. Fluorescent Detection of Mitochondrial Membrane Potential

After the animals were sacrificed, hepatic tissues were washed thoroughly and rinsed with ice. They were gently blotted between the folds of a filter paper and weighed in an analytical balance. 10% of homogenate was prepared in 0.05 M phosphate buffer (pH 7) using a polytron homogenizer at 40 °C according to manual instructions. Fluorescent kit was measured and quantified by fluorometer microplate reader (Thermo Fisher Scientific Oy FI-01621, Vantaa, Finland). Mitochondrial membrane potential was expressed as JC-1 fluorescence ratio (J-aggregates: J-monomers).

2.12. Cytochrome C Oxidase Release Assay

Evaluation of cytochrome c release that referred to mitochondrial volume was measured (Rat/Mouse cytochrome c Immunoassay kit, Minneapolis, MN, USA).

2.13. Determination Of Plasma Homocysteine (Hcy) in Brain Homogenates

Tissue homogenates of the brain were pipetted into the wells of microplate over pre-coated antibody specific for Hcy according to the guidance steps of the kit that was brought from Cusabio (cusabio, Wuhan, China). The intensity of the color measured is referred to concentration of Hcy value and expressed by nmol/mL and Pg/g respectively.

2.14. Determination Of Amyloid Beta (Aβ1-42) in Brain Homogenates

Brain tissue homogenates were pipetted into the microplate which precoated with monoclonal antibody specific to Aβ1-42. The kit for test was brought from (Cloud-clone crop, Houston, TX, USA). Its intensity was expressed by Pg/mL and Pg/g respectively.

2.15. Determination of Gamma-Aminobutyric Acid (GABA) in Serum

The immunoassay kit was brought from EIAab (EIAab, Wuhan, China) according to the guidance steps. The optical density of the samples was compared with the standard curve and expressed as ng/mL.

2.16. Determination of Glutamate in the Brain (GSH)

Brain glutamate level was determined by ELISA kit that was obtained from Abnova (Abnova, Taipei, Taiwan). Quantification of samples was achieved by comparing their absorbance with a standard curve prepared with known standards. The value expressed as µg/mL.

2.17. Determination of 4-Hydroxynonenal (HNE) in the Brain

The quantitative determination of rat 4-hydroxynonenal (HNE) concentrations by kit that was brought from cusabio (cusabio, Wuhan, China).The value intensity was expressed by Pg/mL.

2.18. Histological Changes and Transmission Electron Microscopy (TEM) Estimation

Small brain tissues and testis portions were fixed in 10% buffered formalin for further histological process [41]. The ultracomposition processing, a very small portion of the brain and testicular tissues were fixed in 2.5% glutaraldehyde and further processing [42]. Semi-thin sections of the brain and testis tissues were stained with toluidine blue stain and photographed to analysis the images.

2.19. Single Cell Gel Electrophoresis (SCGE) (The Comet Assay)

Small brain portions were placed in an ice-cold (Ca2+, Mg2+, DMSO and EDTA). The viability of the cells was studied by examining the comet images [43], the comet assay methods were by Collins and Dunsinka, 2002.

2.20. Detection of Apoptosis Using Annexin V/PI Staining

Apoptosis in the brain cells was evaluated by using the fluorescein isothiocyanate conjugated with annexin V/PI, Apo Alert kit from ClontechCo (Palo Alto, CA, USA).

2.21. Determination of Cytochrome-c

Monoclonal antibody specific fir cytochrome-c pre-coated on microplate for the quantitative sandwich enzyme immunoassay technique used for determination of rat cytochrome-c according to the guidance step of the kit that was brought also from (R&D systems, Minneapolis, MN, USA). The intensity of the color was measured in proportion to the amount of cytochrome c bound in the initial step. The sample values are then read off the standard curve and was expressed by Pg/g.

2.22. Determination of P53

Rat P53 ELISA kit for the measurement of Rat P53. According to the guidance steps of kit that was brought from RayBiotech (RayBio, Peachtree Corners, GA, USA). The intensity of the color is measured and the value is expressed by Pg/g.

2.23. Determination of Bax and BCl2

Specific anti-Bax and specific BCl2 used for quantitative measurement of Bax and BCl2 in the brain tissues according to the guidance steps of the kit that was brought from cloud-clone crop (Cloud-clone crop, Houston, TX, USA). The value is expressed by Pg/g.

2.24. Determination of Caspase 3 and 9

Employ the immunoassay technique to determine rat caspase 3 and 9 according to the guidance steps of the kits that were brought from cusabio (cusabio, Wuhan, China). The intensity of the color is measured and expressed by Pg/g.

2.25. RNA Isolation and Quantitative Reverse Transcription Polymerase Chain Reaction

Gene expressions of the brain SOD, CAT, and GPx were examined by using “PCR” technique. Total RNA was isolated from the neural tissues using TRIzol reagent, followed by the addition of RNAse-free DNAse. Amplification data were analyzed by using the 2-Ct method, and the observed results were compared to β-actin.

2.26. Real Time-PCR

Total RNA was extracted from brain and testis tissues, and reverse transcribed. Real-time PCR was carried out in a Roche Light Cycler 2.0 with software version 4.0, using the following program: denaturation step (95 °C for 10 min), and 45 cycles of three step amplification (denaturation, 95 °C for 10 s; annealing, 58 °C for 5 s; and extension, 72 °C for 10 s). Subsequently, melting curve (60–90 °C) with a heating rate of 0.1 °C/s) was performed to check the specificity of amplification and the presence of byproducts. All samples were amplified in duplicate, and the glyceraldehyde-3-phosphatase dehydrogenase (GAPDH) gene was used as a reference to normalize data. The primer sequences reported (Table 1).

2.27. Cells Line

Human Hepatic cancer cells (HepG2) were obtained from Cell Culture Department “VACSERA-EGYPT”. Cells were imported from the “American type Culture Collection in the form of a frozen vial.
Origin spices for both: Homo sapiens (human), confirmed as human by immunofluorescence and cytotoxic-antibody test (dye exclusion).

2.28. Cell Culture

Human HepG2 cells were cultured in DMEM culture supplemented with 10% (v/v) FBS, glutamine (2 mmol/L), and penicillin-streptomycin (100 U/mL) under an atmosphere of CO2 (5%), and at 37 °C. All used media and reagents were purchased from (Lonza-Bioproducts, Brussels, Belgium) [44].

2.29. Cell Culture Medium

a. Growth medium
The cells were cultured in RPMI-1640 medium with 2-mMl-glutamine adjusted to contain 1.5 g/L sodium bicarbonate (Gibco/ Invitrogen, Carlsbad, CA, USA) and supplemented with 10% fetal bovine serum (GIBCO-UK, Glasgow, UK).
b. Foetal bovine serum (FBS)
FBS was purchased from GIBO COBRAL® Limited (Glasgow, UK), Scotland as a sterile serum in 500 mL bottle (stored at −20 °C till used). Phosphate buffer saline (PBS) was obtained from Sigma Aldrich-USA containing Na2HPO4 (1.15 g), KHPO4 (0.20 g), KCl (9 g), NaCl (8 g) and double dist. H2O (1000 mL). The pH was adjusted by using HCL or NaOH and sterilized by filtration using Millipore disposable Stericup filter (Millipore, Burlington, MA, USA).

2.30. Treatment of Cancer Cell Lines

Target cell lines were trypsinized as previous cells concentration was determined as 2 × 10⁵/mL, where suspended cell count was performed using haemocytometer. Cell count was optimized according to the equation N X V = NX V.

2.31. Cytotoxic Activity (MTT Assay and IC50 Determination)

MTT assay was performed to detect the effects of DG, Q and RuIII/Q on the proliferation of HepG2 cells and to determine the effective dose of test drug relative to concentration. MTT is a pale-yellow substrate that yields a product of dark blue formazan product through cleaving by living cells. Active mitochondria are required for this process, so freshly dead cells cannot break down significant amounts of MTT. Tetrazolium ring is cleaved by mitochondrial dehydrogenases of viable cells, producing purple formazan crystals that are insoluble in aqueous solutions. Formazan crystals are dissolved in acidified isopropanol. The formed purple solution can be measured using a spectrophotometer. Increase or decrease in cell number causes a change in the amount of formazan produced, that detects the degree in cytotoxicity effect of the tested material. MTT is reduced to insoluble purple MTT formazan crystals, by mitochondrial lactate dehydrogenase enzyme (LDH), and the pyridine nucleotide cofactors, NADH and NADPH as substrates [45].
Briefly, HepG2cells were well seeded in micro-titer plates (5 × 10³ cells/well). Cells were incubated using Q and RuIII/Q 2-fold serially dilution was performed, and treatment was for 24 h. Cytotoxic effect was detected using inverted microscope (Hund–Germany). Untreated cells served as negative control. After the incubation, the detached cells were washed out using phosphate buffered saline (PBS). The cells were then washed with 5 mL of PBS. Then complete media (15 mL) was added to the flask. After 3–4 days the second exchange for media was done. Residual live cells were stained using MTT stain as 0.05 mL/well (0.5 mg/mL) in PBS to all wells. Plates were incubated at 37 °C for 4 h, and DMSO (50 μL) was added to dissolve. The inhibitory concentration or (IC50) values of cell viability was determined using Master plex 2010 software. The percent of viable cells were plotted as a function of concentration to obtain the IC50values. Three independent experiments were performed for all assays. The mean value of the triplicate was calculated for each experiment, then the results were reported as mean (±standard deviation) and were expressed as control percentage, which was 100%.
Inhibition percentage (%) was measured using the following equation:
Inhibition percentage (%) = ODof control − ODof sample × 100%/ODof control, (where OD = optical densities)
The IC50 value is the tested compounds concentration which results in inhibition of 50% of cells or the death of cells which obtained by plotting the inhibition percentage versus the test compounds concentration [46].

2.32. Counting of Cells

Appropriate media (1 mL) used to suspense HepG2 cells. For counting, 10 µL of cell suspension was taken for counting. The number of cells was estimated using hemocytometer (Neubauer, Germany) after dilution of the sample between 2 and 10. The number of cells were counted using an ordinary microscope (Olympus CX31, DeWitt, IA, USA). The following equation used to calculate the number of sells per mL:
NO of cells/mL = average of count cells × dilution factor × 104.

2.33. Flow Cytometric Analysis

Knowledge improvement on the cell cycle has widely contributed to flow cytometry technique [47], which can rapidly and quantitatively measure a wide variety of cellular constituents usually just by considering DNA content into account and was adjusted for investigation of different components of cell (proteins, nucleic acids, lipids), cell organelles (mitochondria, lysosomes) or functions (enzymatic activities, viability) [48]. Electrical impulses are generated by detectors then converted into digital signals. Finally, the digital signals are accumulated in a histogram, or a frequency distribution [49]. FACS Calibur flow cytometer (Becton Dickinson, Sunnyvale, CA, USA) in Mansoura Children Hospital was used. A compact air cooked low power 15 mwatt Argon ion laser beam (488 nm) is equipped with FACS Calibur flow cytometer. The average number of assessed nuclei per specimen 20,000 and the number of nuclei examined were 120 every second.

2.34. Staining Procedure (Direct Staining Method)

Appropriately cells were prepared. Concentration cell suspension was adjusted to 1 × 10⁶ cells/mL and prepared with PBS/BSA buffer (1% bovine serum albumin and phosphate buffered saline). Required test tubes with aliquot 100 µL of cell suspension and a recommended dilution of antibody (10 µL for each sample) were mixed well and then incubated at room temperature for 30 min. PBA/BSA (2 mL) was used to wash cells, centrifugation at 1500 rpm for 5 min and discarded resulting supernatant. Finally, PBS/BSA (0.2 mL) was used to resuspend cells or with 0.2 mL of 0.5% Paraformaldehyde in PBS/BSA if wanted and data resulted was analyzed by flow cytometer [50].

2.35. Annexin V-FITC/PI Staining Assay

Apoptosis, programmed cell death, is an ordinary genetically programmed process that happens during embryonic development, and additionally in support of tissue homeostasis, in aging, and under pathological conditions [51]. The term apoptosis is utilized to explain a phenomenon that a cell actively engages in its own damaging processes and come from the Greek word for “falling off” of leaves from a tree [52]. Distinguishing of early and late apoptotic cells can be detected by staining with Annexin V and propidium iodide (PI) which is a vital dye that ordinarily conjugated with Annexin V. The membranes of damaged and dead cells are permeable to PI, but the viable cells with intact membranes exclude PI. Along these lines, both Annexin V and PI negative are viewed in the viable cells, while Annexin V positive and PI negative are detected in early apoptotic cells, and both Annexin V and PI positive are detected in late apoptotic cells or already dead [53]. Flow cytometry used to detect the quantification of cell death by utilizing the Annexin V-FITC/PI apoptosis detection kit (CAT NO. Ab 14085), (Abcam, Cambridge, UK) according to the instructions of the manufacturer. After the incubation time, the cells were suspended in 200 µL 1 × binding buffer. The HepG2 cells were ready for acquiring on FACS Calibur using Cell Quest Pro analysis software (Becton Dickinson, San Jose, CA, USA). This test does not recognize cells that have died versus those that have undergone apoptotic death because of a necrotic pathway as they will also stain with both Annexin V and PI. However, when apoptosis is estimated over time, cells can often be viewed from Annexin V and PI positive (end-stage apoptosis and death), to Annexin V and PI negative (viable, or no measurable apoptosis), and finally to Annexin V positive and PI negative (early apoptosis with intact membranes). Apoptosis proposes through the presence of cells with these three phenotypes within a mixed cell population [53].

2.36. Analysis of Flow Cytometry of p53 and Bax Expression

The role of these parameters is more essential and effective in the arrest of cell cycle and apoptosis. Antibodies against P53, caspase-3, Bcl-2 and Bax protein and other reagents were purchased from Santa Cruz Biotechnology, INC, Dallas, Texas 75220 U.S.A. Each vial contained 200 μg IgG in 1.0 mL of PBS with <0.1% sodium azide and 0.1 gelatin. Available as fluorescein (FITC) conjugated for flow cytometry. Cells were prepared appropriately. The cell suspension was adjusted to a concentration of (1 × 10⁶ cells/mL) with PBS/BSA buffer (phosphate buffered saline and 1% BSA). Aliquot 100 μL of cell suspension was pipetted into test tubes. Appropriately labeled antibody [Fluorescein (FITC) conjugated antibody] was added at the recommended dilution, mixed well and incubated at room temperature for 30 min. Cells were washed with 2 mL of PBS/BSA, centrifuged at 400· g for 5 min and the resulting supernatant was discarded. Cells were resuspended in 0.2 mL of PBS/BSA or with 0.2 mL of 0.5% Paraformaldehyde in PBS/BSA. Data were acquired by flow cytometry (Becton Dickinson, CA, USA). A total of 20,000 cells were acquired for analysis using Cell Quest software and histogram plot of conjugate fluorescence (x-axis) versus counts (y-axis) had been shown in logarithmic fluorescence intensity.

2.37. Statistical Analysis

Data were expressed as mean values ± SE. Statistical analysis was done using SPSS software version 27 [54] and Open Epi version 2.3.1 [55] Statistical performance was by using two-way analysis of variance (ANOVA). Graphical and tabular presentation was done. Data were summarized as mean and standard deviation. Shapiro-Wilk test was used to determine the distribution characteristics of variables and variance homogeneity. One way ANOVA and post hoc power were used to analyze data. A p-value of ˂0.05 was accepted as statistically significant [56].

2.38. Sample Size Calculation:

We assumed that CAT in testicular tissue homogenates in RuIII/Q group versus Q group are 5.5 ± 0.85 versus 4.8 ± 0.9 (U/g). At power 80% and confidence level 95%, sample size is 60 (12 in every group). This sample was calculated by OPEN EPI software package [55].

3. Results

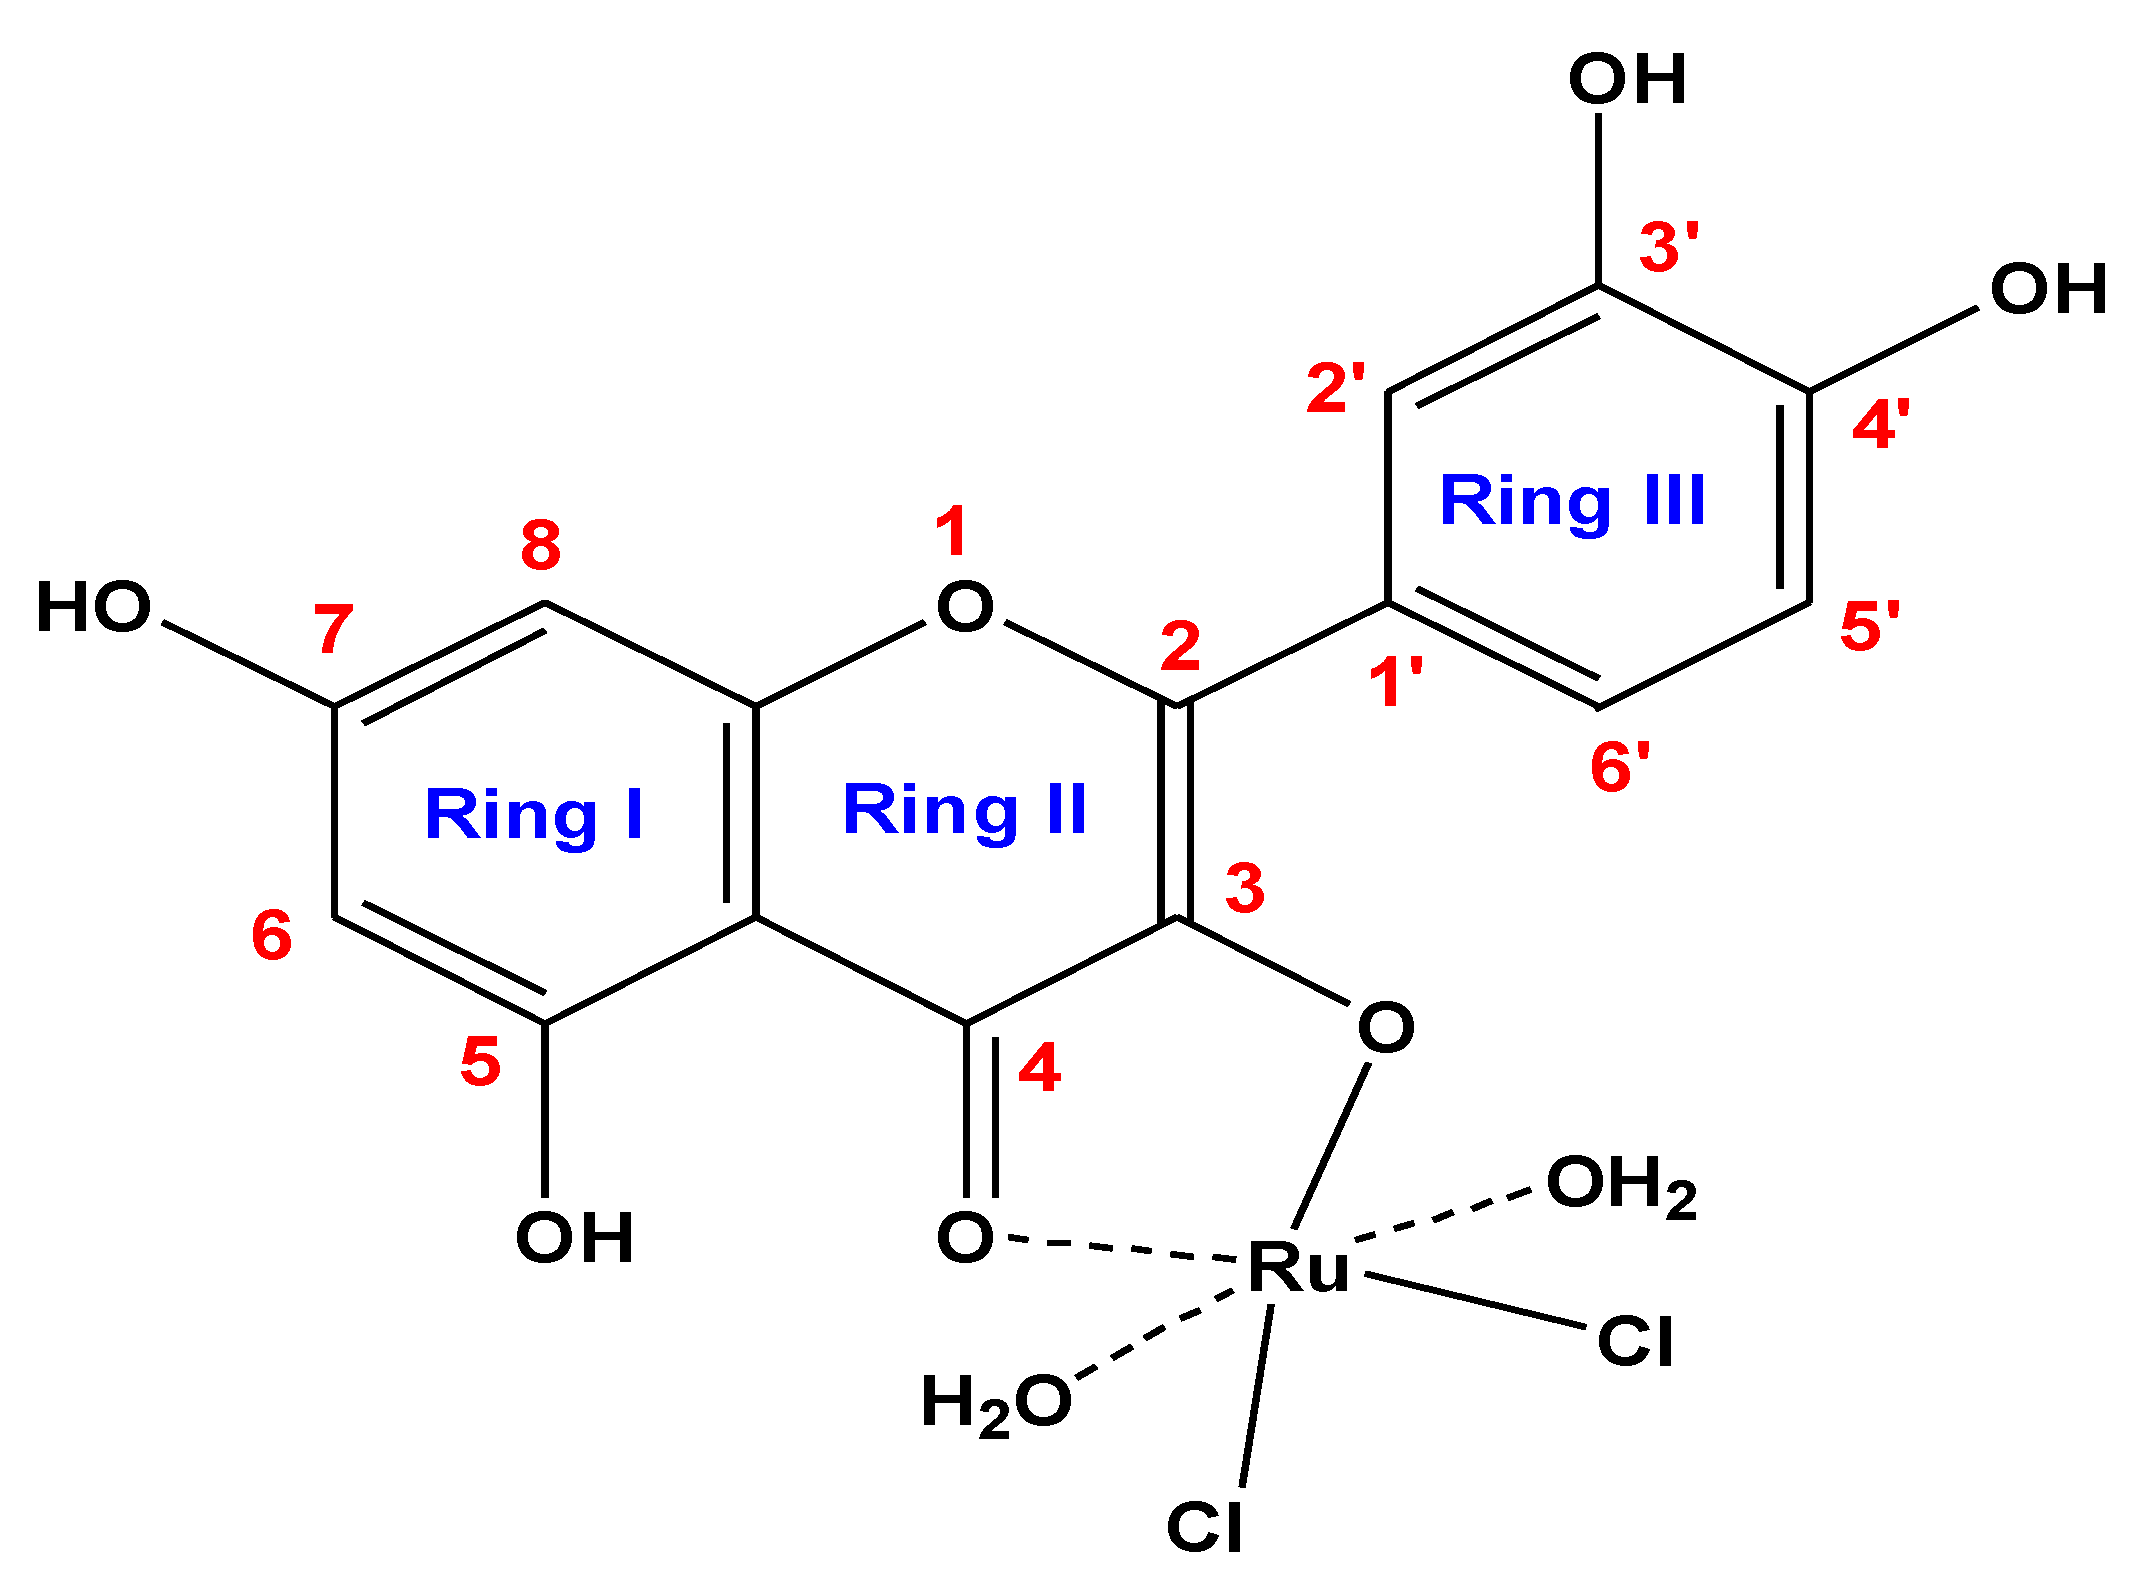
3.1. Chemical Composition Interpretations

The ruthenium(III) quercetin complex is soluble in (DMSO and DMF) and insoluble in methanol, ethanol, and water. Elemental analysis data are consistent with calculated results from the empirical formula of the synthesized complex (Figure 1). Elemental and chemical analysis data are as follows: MF = C15H13Cl2O9Ru; mol. wt. = 509.23 g/mol; calculated (%) C = 35.38, H = 2.57, Cl = 13.92, Ru = 19.85; experimental (%) C = 35.09, H = 2.45, Cl = 13.82, Ru = 19.55. Observed molar conductance (12 (Ω−1 mol−1 cm−1) of the RuIII complex in DMSO for 10−3 M solution at 25 °C is consistent with the non-electrolytic nature of the complex [57].

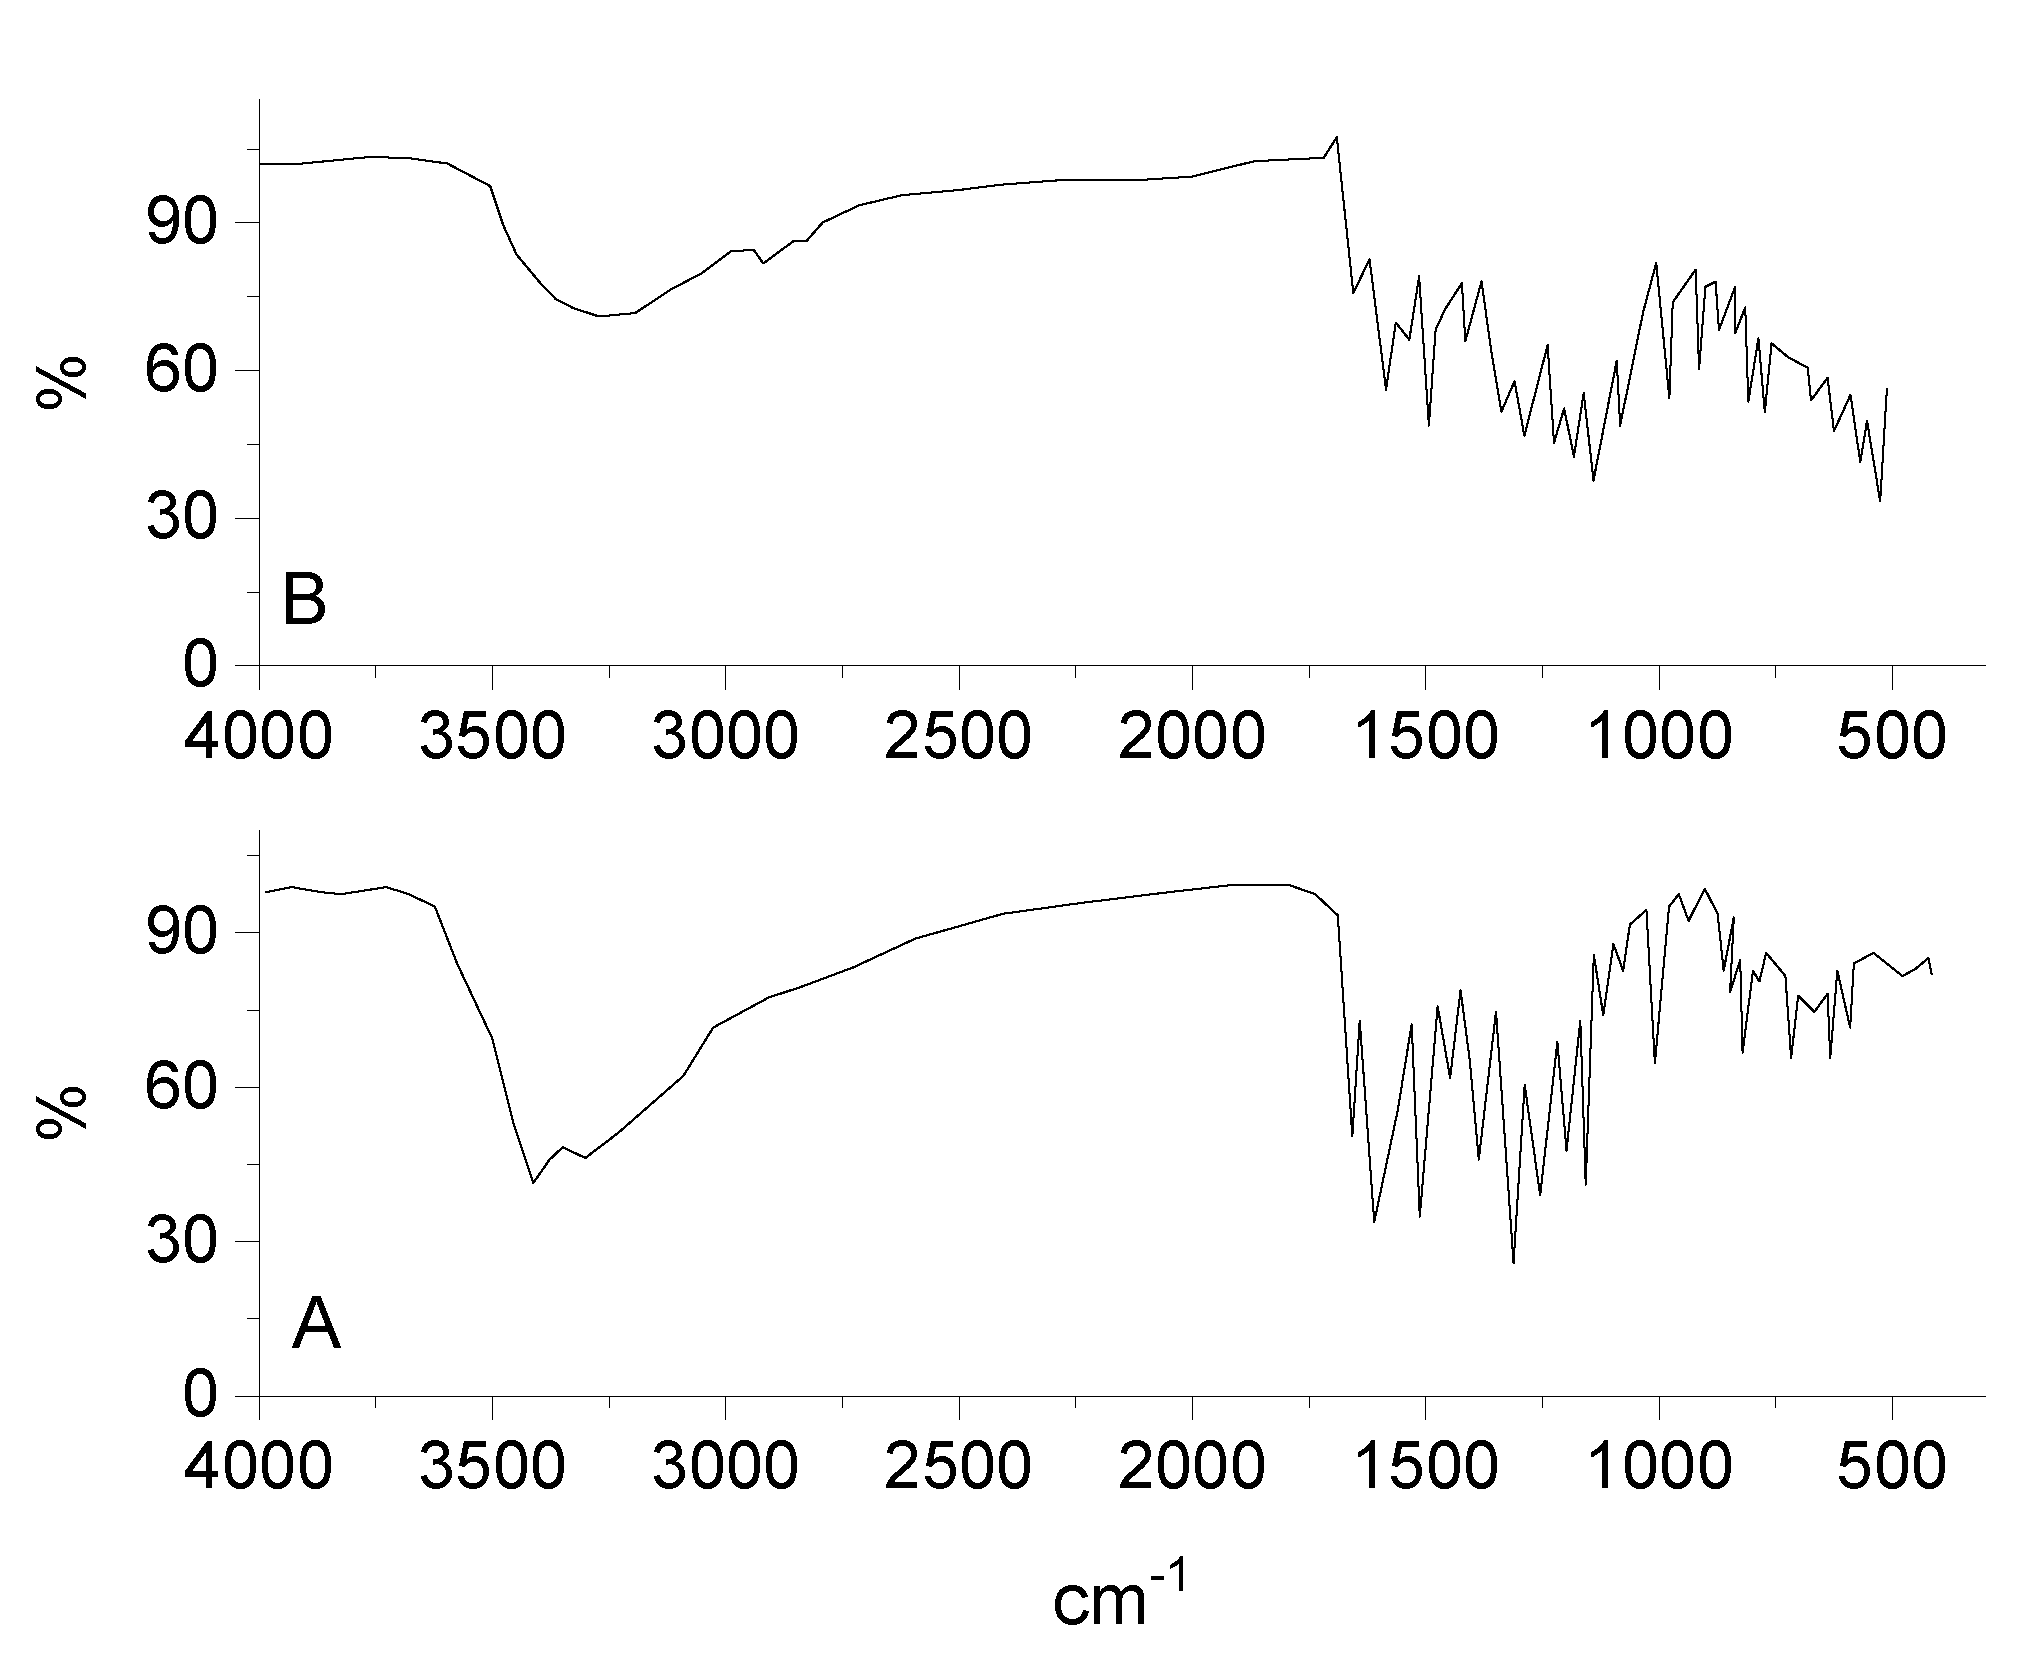
3.2. Infrared Spectra

By comparing the infrared spectra of free Q ligand and synthesized RuIII/Q complex (Figure 2), the ν(C(4)=O) stretching vibration motion of the free Q exhibited at 1661 cm−1, this band is shifted to 1654 cm−1 after chelation [58,59]. This shift confirm the coordination of oxygen carbonyl group (ring II) with ruthenium(III) ion. The characteristic vibration bands at 1608 and 1253 cm−1 attributed to ν(C=C) and ν(C-O-C) frequencies are shifted after complexation. The ν(C-O-H) deformation mode presence at 1386 cm−1 in the free Q ligand is shifted to 1335 cm−1 in the RuIII/Q complex, this is assigned to an increasing the bond order, when the chelation involves with the ortho-phenolic ν(O-H) group on the Q ligand at ring II. The medium to weak intensities bands existed at 643, 582, and 539 cm−1 are assigned to ν(Ru-O) stretching vibration according to the complex formation, while these bands do not display in the spectra of Q free ligand. This data suggesting that coordination proceeds through the ortho phenolic groups (oxygen of C(4)=O carbonyl and oxygen of O(3)-H phenolic) located on ring II of Q ligand [60]. A strong broad band at 3275 cm−1 is assigned to ν(OH) for coordinated water molecules.

3.3. Electronic Spectra

The electronic UV-Vis. spectra of Q free ligand and ruthenium(III) complex solutions were scanned, the spectrum of Q has two absorption bands at 254 and 363 nm, due to n-π* and π-π* electronic transitions of cinnamoyl system (ring III) and benzoyl system (ring I), after complexation the two bands show the bathochromic shift (264 and 389 nm) due to coordination of oxygen’s of C(3)–OH and C(4)=O in Q chelate with ruthenium(III) ion [61]. The effective magnetic moment of Ru(III) complex is existed 1.85 B.M., that confirmed the exhibit of single unpaired electron in a low spin 4d5 configuration for Ru3+ ion in an octahedral environment [62]. This value is lower than the predicted value of 2.10 B.M. This lowering may occur due to the presence of lower symmetry ligand fields, or extensive electron delocalization in species. So, the magnetic moment data prove that Ru(III) complex has been existed at (+3) oxidation state.

3.4. Thermal Analysis

To establish the correct composition for the RuIII/Q complexity under investigation, thermogravimetric (TG) and (DTG) analysis were performed for the solid complex [Ru(Q)(Cl)2(H2O)2] under nitrogen flow, the DTG and TGA data are shown in Figure 3. The thermal degradation of the [Ru(Q)(Cl)2(H2O)2] complex carried out in four steps. These stages of decomposition occur at 315, 421, 509 and 707 °C maximum temperatures, respectively. These stages of degradation are attributed to 80.62% weight loss corresponding to the loss of two coordinated H2O molecules, chlorine gas Cl2, and quercetin moiety. Theoretically, remove of these molecules corresponds to a weight loss of 80.15%. The loss of coordinated H2O molecule at higher temperature range, confirmed that the water molecules exist in the complex with different lattice compositions resulted from their involvement in inter and intra H-bonding with different strengths. The weight found for the residue after decomposition is 19.38% (theoretical, 19.85%) giving an actual total weight loss of 80.62% in agreement with our calculated total weight loss value of 80.15%. The final thermal decomposition product is ruthenium metal.

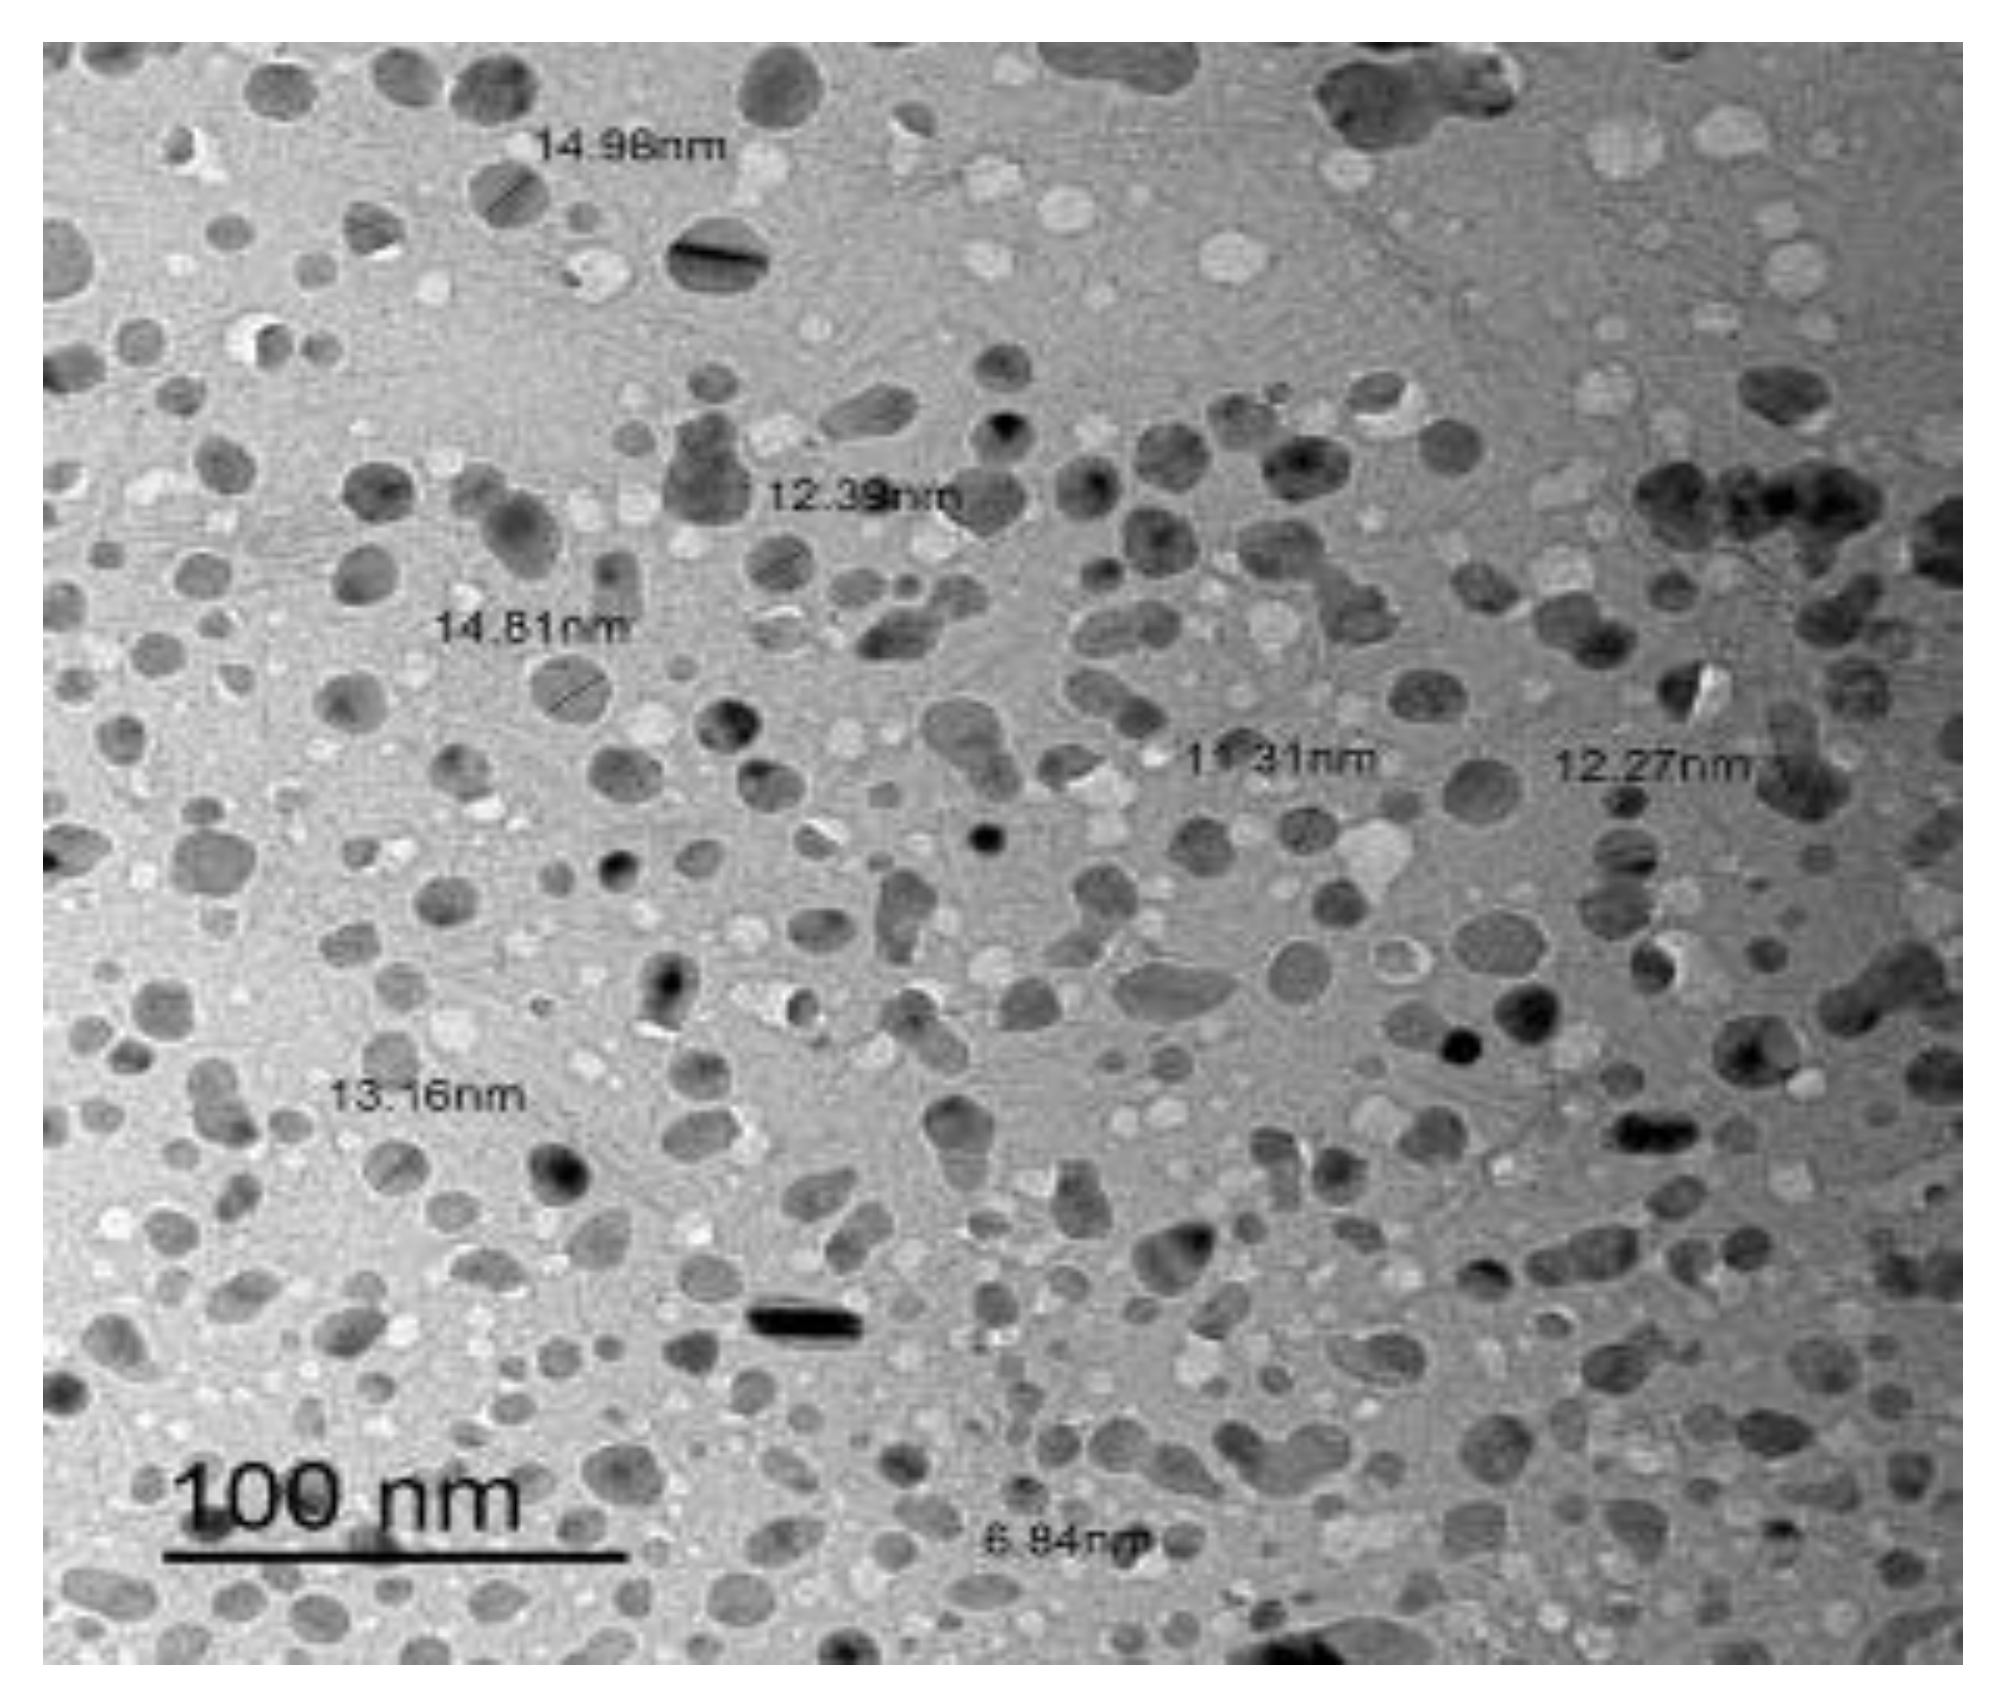
3.5. Transmission Electron Microscopy (TEM) Investigation

The morphology and particle size of RuIII/Q nanoparticles were investigated by transmission electron microscopy (TEM) (Figure 4). The TEM image was scanned in an aqueous medium. The symmetry and similarity of particle shape of the synthesized complex indicate that morphological phases have a homogeneous matrix. The particle size found in the nano-composite form was 7–15 nm.

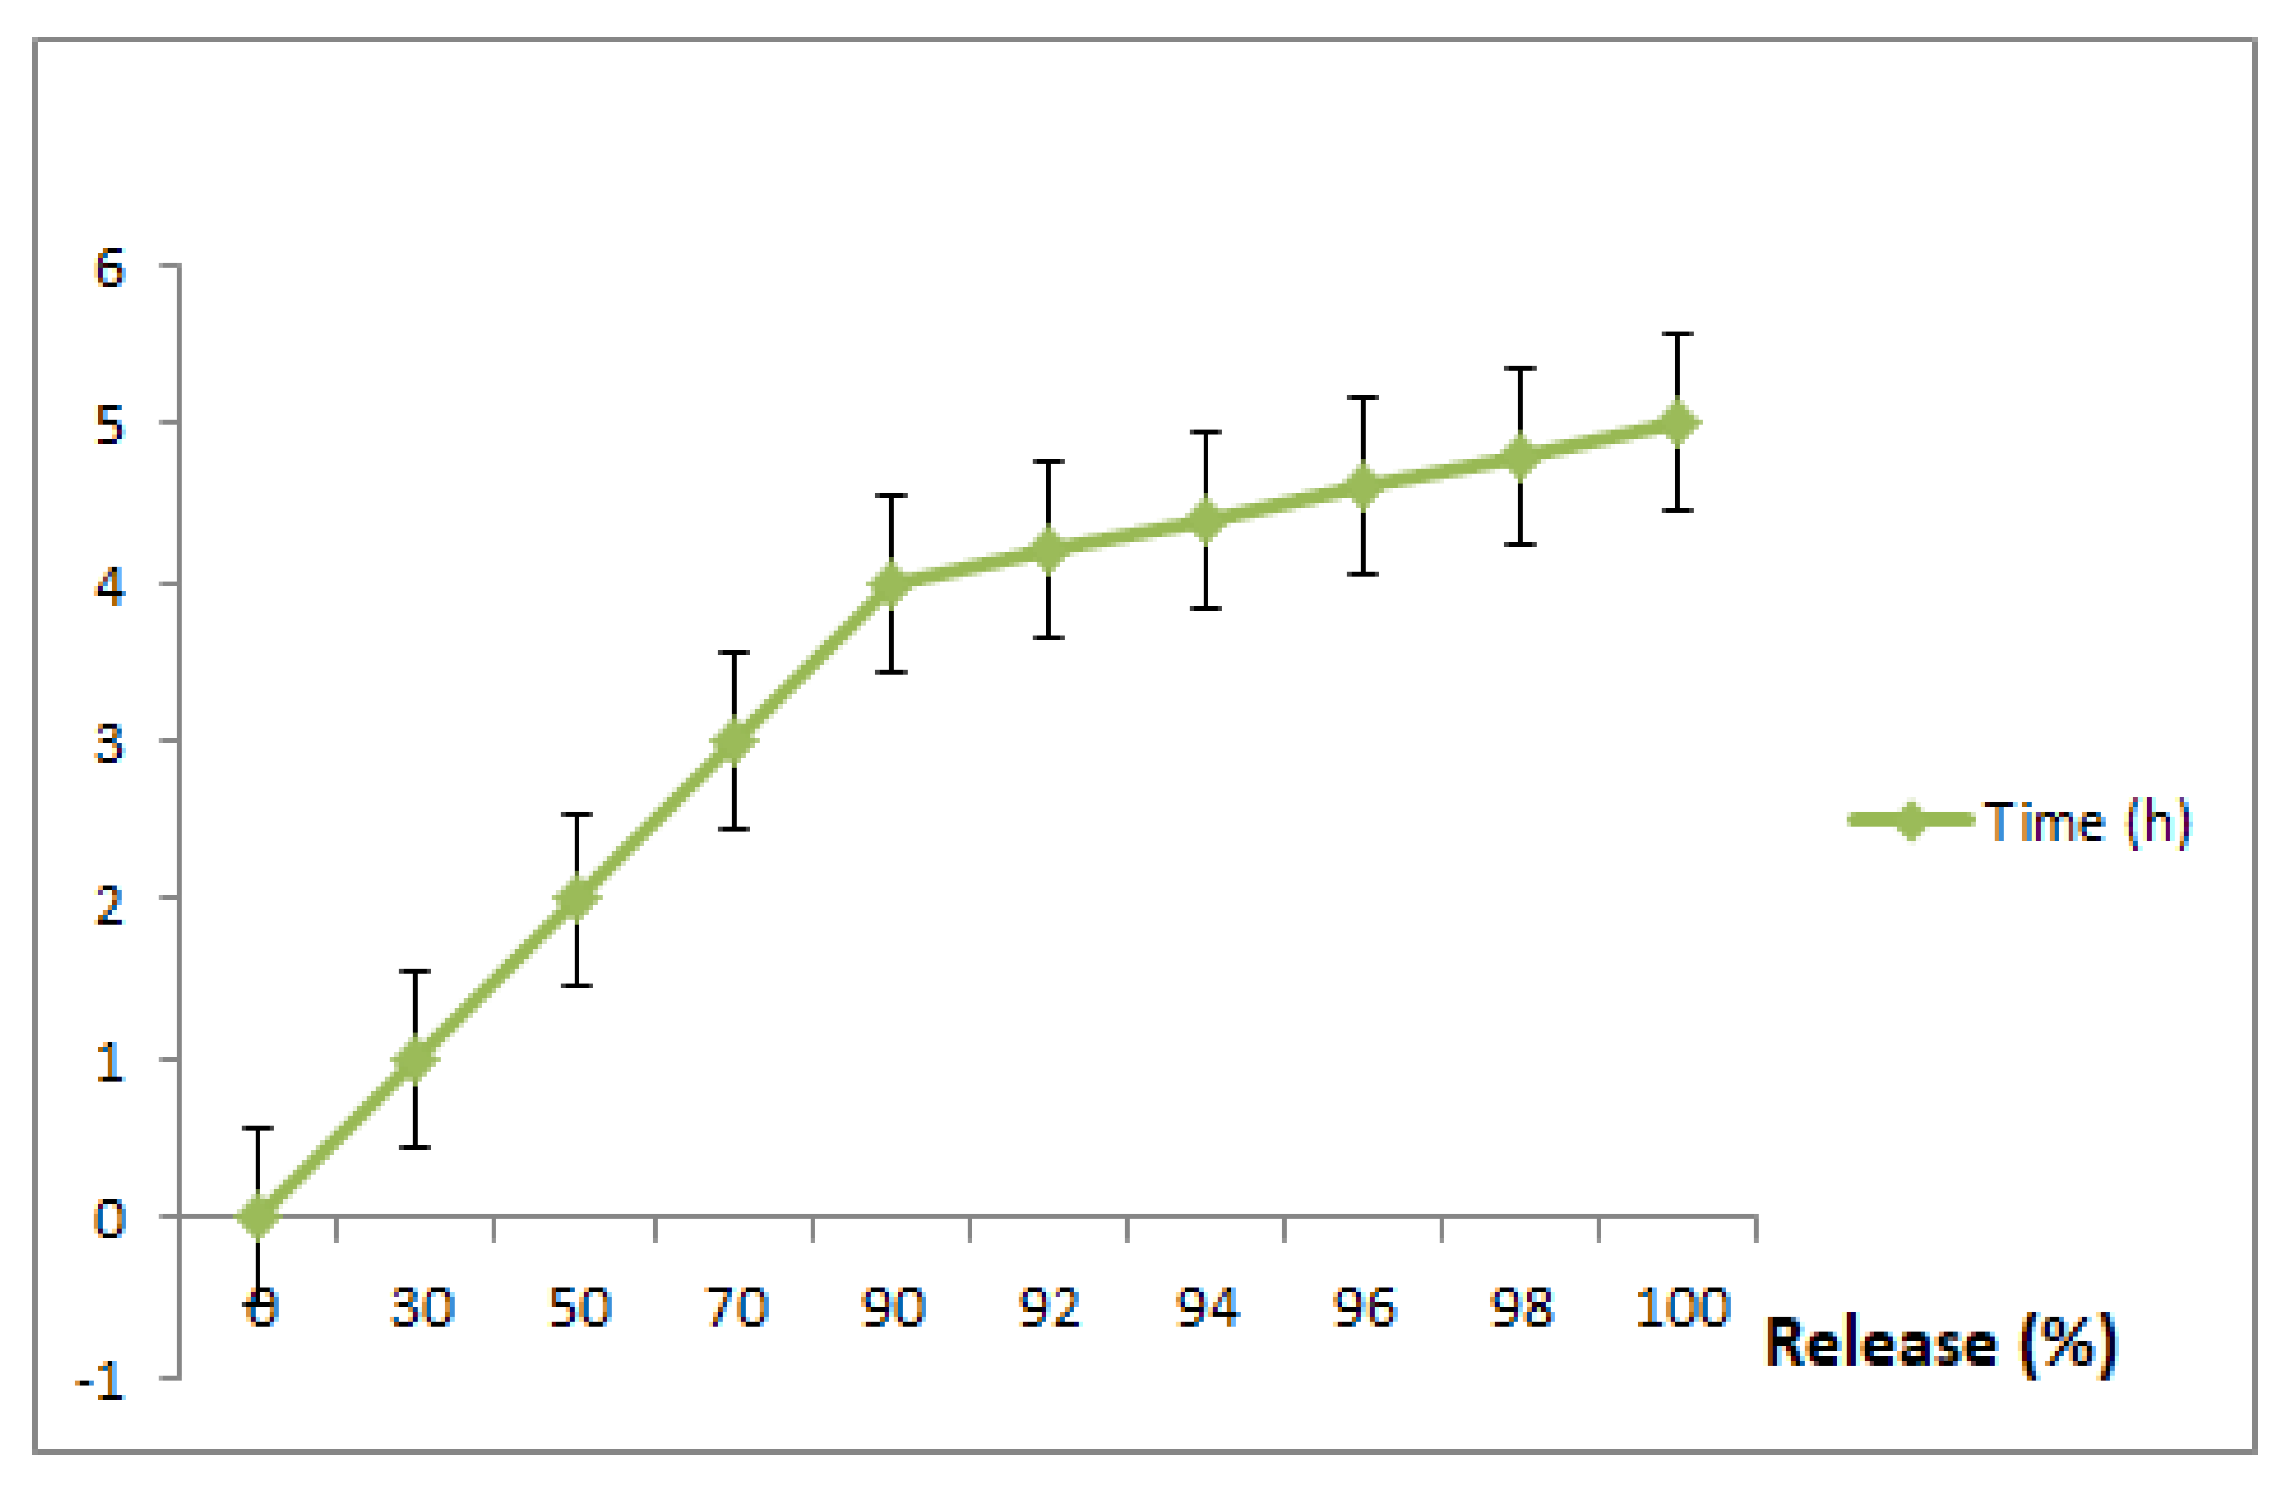
3.6. In Vitro Drug Release

To exploit the use of RuIII/Q for an effective drug delivery system, we carried out this experiment (invitro drug release of Q and Ru from RuIII/Q complex) at different time intervals (1, 2, 3, 4, 5, 6, 7 and 8 h) and the resulting data are shown in Figure 5. The in vitro releasing medium of both Q and Ru were chosen as slightly basic phosphate buffer. The 1st release was fast within the first 2 h, followed by a gradual release till 8 h.

3.7. Biological Interpretations

3.7.1. Determination of Cell Viability Percentage (%) (MTT Assay)

MTT assay was used to investigate the survival of HepG2 cells after treatment with RuIII/Q, Q, and DG. The treatment of HepG2 cells with RuIII/Q, Q, and DG caused a dose-dependent loss of cell viability at 48 h. MTT assay data had been run the assay effect of RuIII/Q on HepG2 cells. RuIII/Q reduced HepG2 cell viability. There was a significant reduction in cell viability when the RuIII/Q concentration reached 40 μg/mL. At this concentration, cell viability was reduced to ~28.86%, indicating that about 71.14% of HepG2 cells were killed at this low concentration of RuIII/Q. When the concentration of RuIII/Q was increased to 640 μg/mL, cell viability reduced to ~15.86%. Q alone induced a slight effect on HepG2 cell viability as compared to RuIII/Q (Table S1 and Figure S4). DG increased viable cell numbers with the increasing concentration as viable cells became ~100% at a concentration of 1280 μg/mL.
Figure 6 shows cell viability with serial dilution of RuIII/Q, Q, and DG. There was a reduction in cell viability with Q concentration also but with weak activity as compared to RuIII/Q. At 640 μg/mL, cell viability was reduced to ~51.29 %. When the concentration of Q was increased to 1280 μg/mL, cell viability reduced to ~50.36%. The graph of cell viability versus DG is displayed in Figure 7. DG did not affect cell viability and when the concentration of DG was increased to 640 and 1280 μg/mL, cell viability increased compared to Q treatment and no treatment (Table 2 and Figure 7).

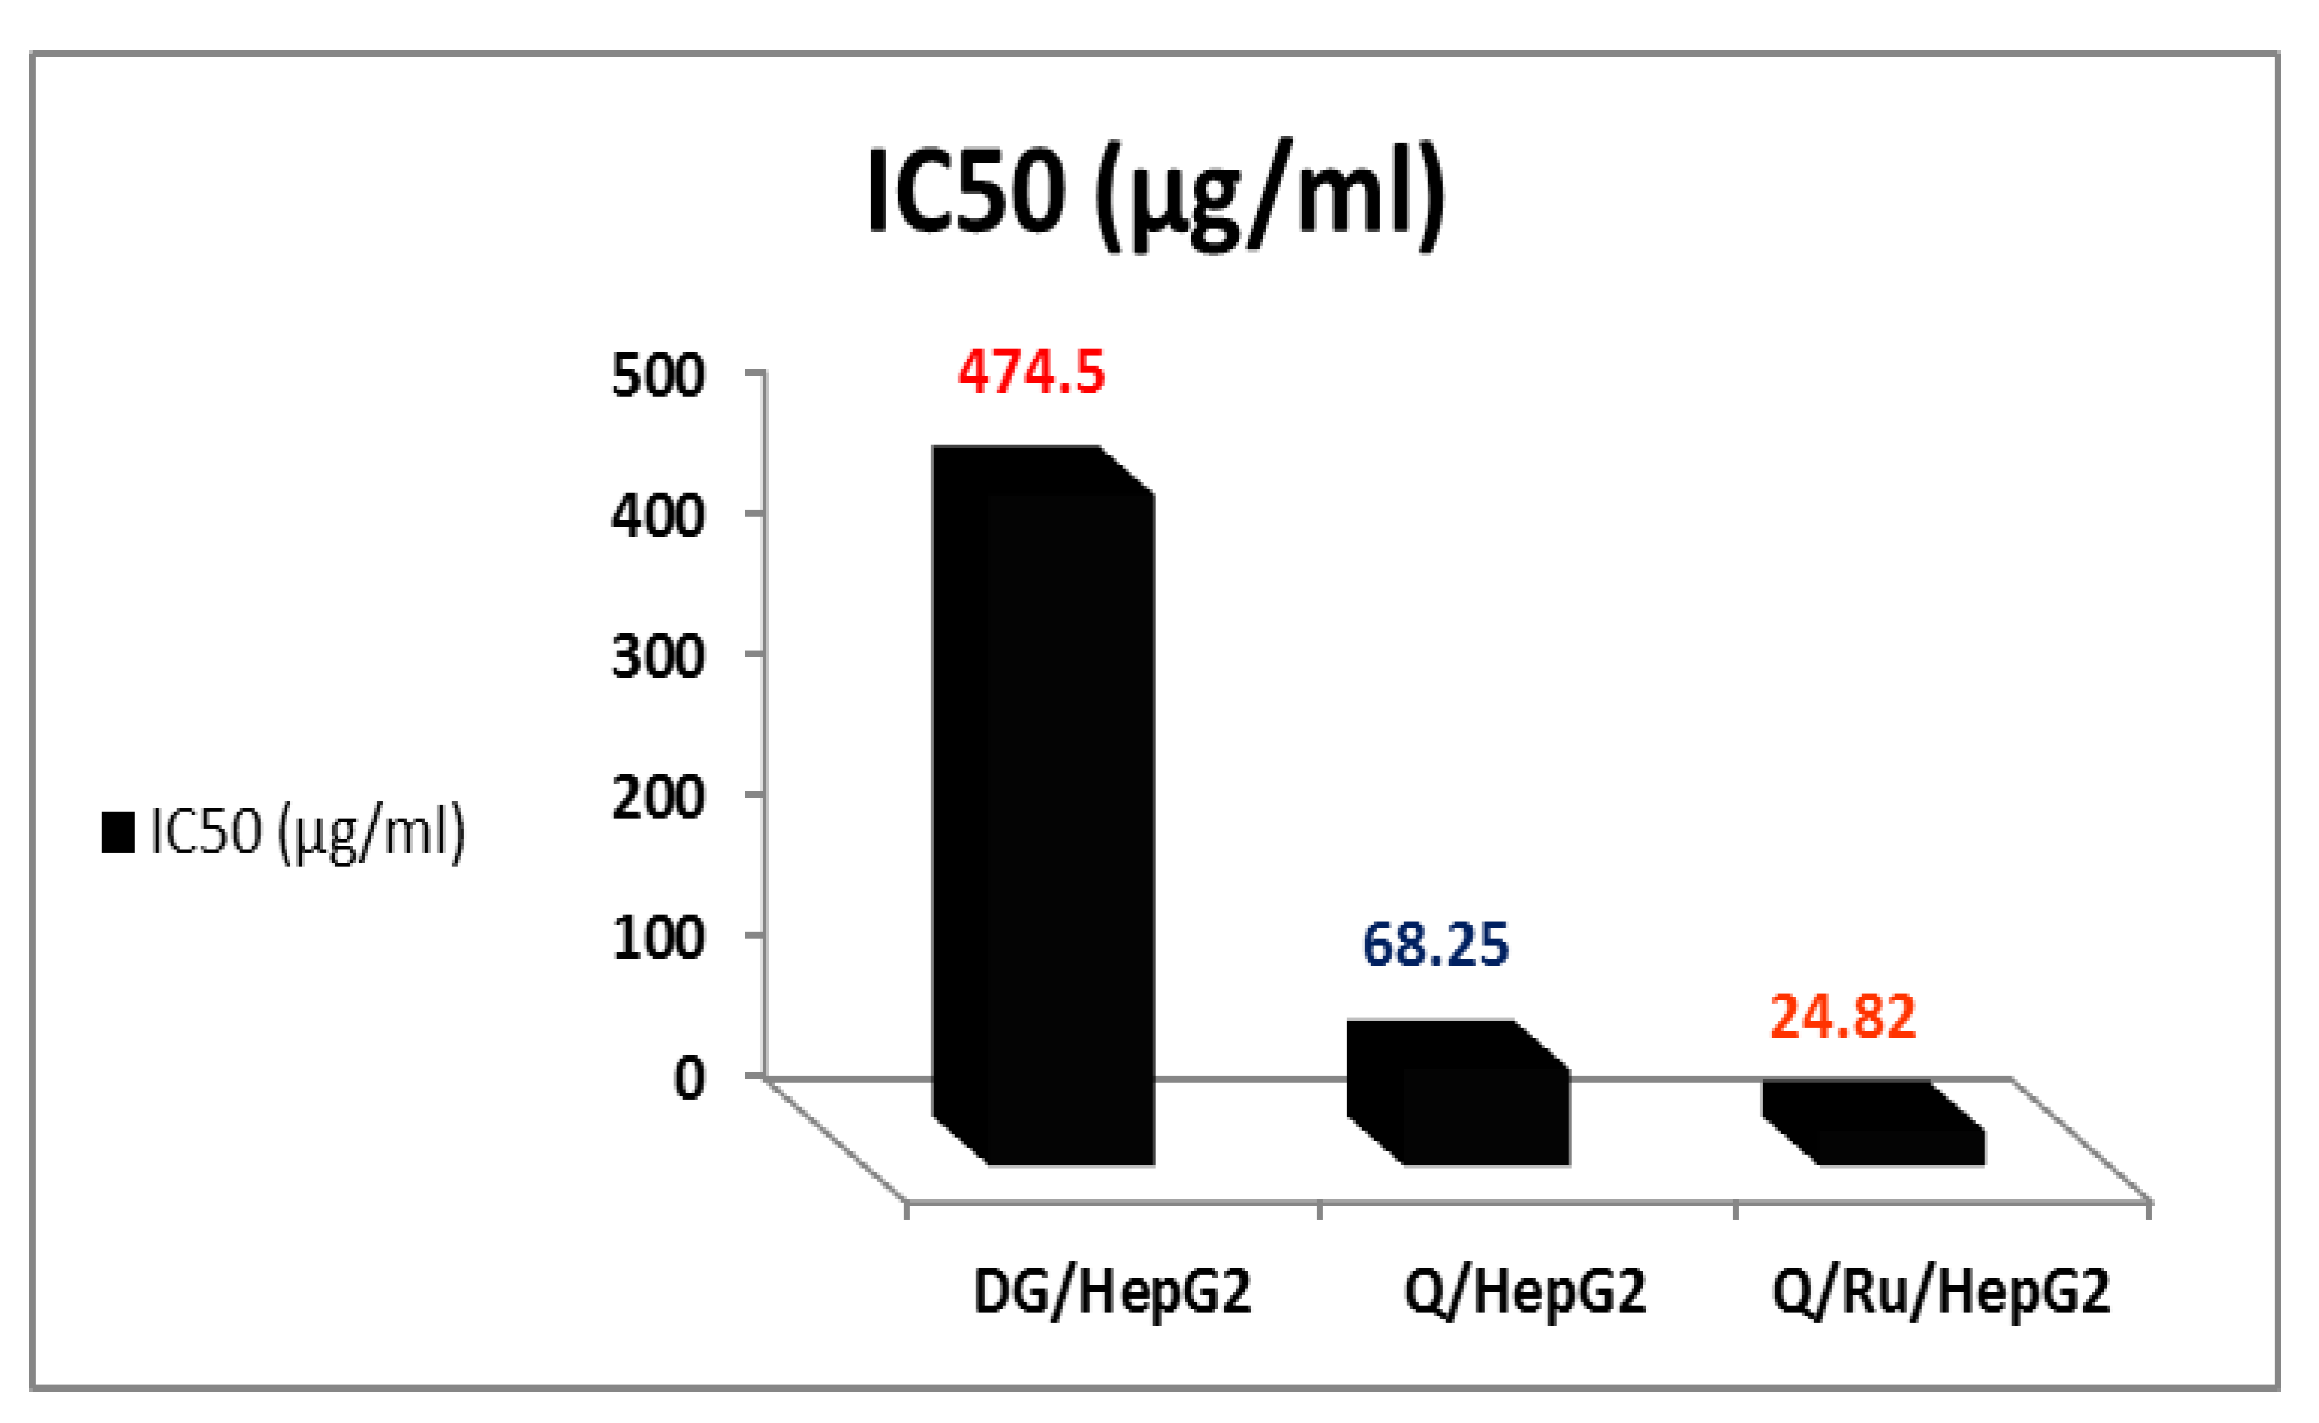
3.7.2. Determination of IC50 Doses

The mean concentration which inhibited 50% of cell growth (IC50) was detected by averaging the individual results from the three repeated experiments (Figure 6). The IC50 doses of RuIII/Q, Q, and DG in HepG2 cells were 24.82, 68.25, and 474.5 µg/mL, respectively. HepG2 cells were significantly less sensitive to the effects of Q than RuIII/Q (IC50~68.25μg/mL). The effective dose of Q that inhibited the growth of cells was (IC50~24.82μg/mL).

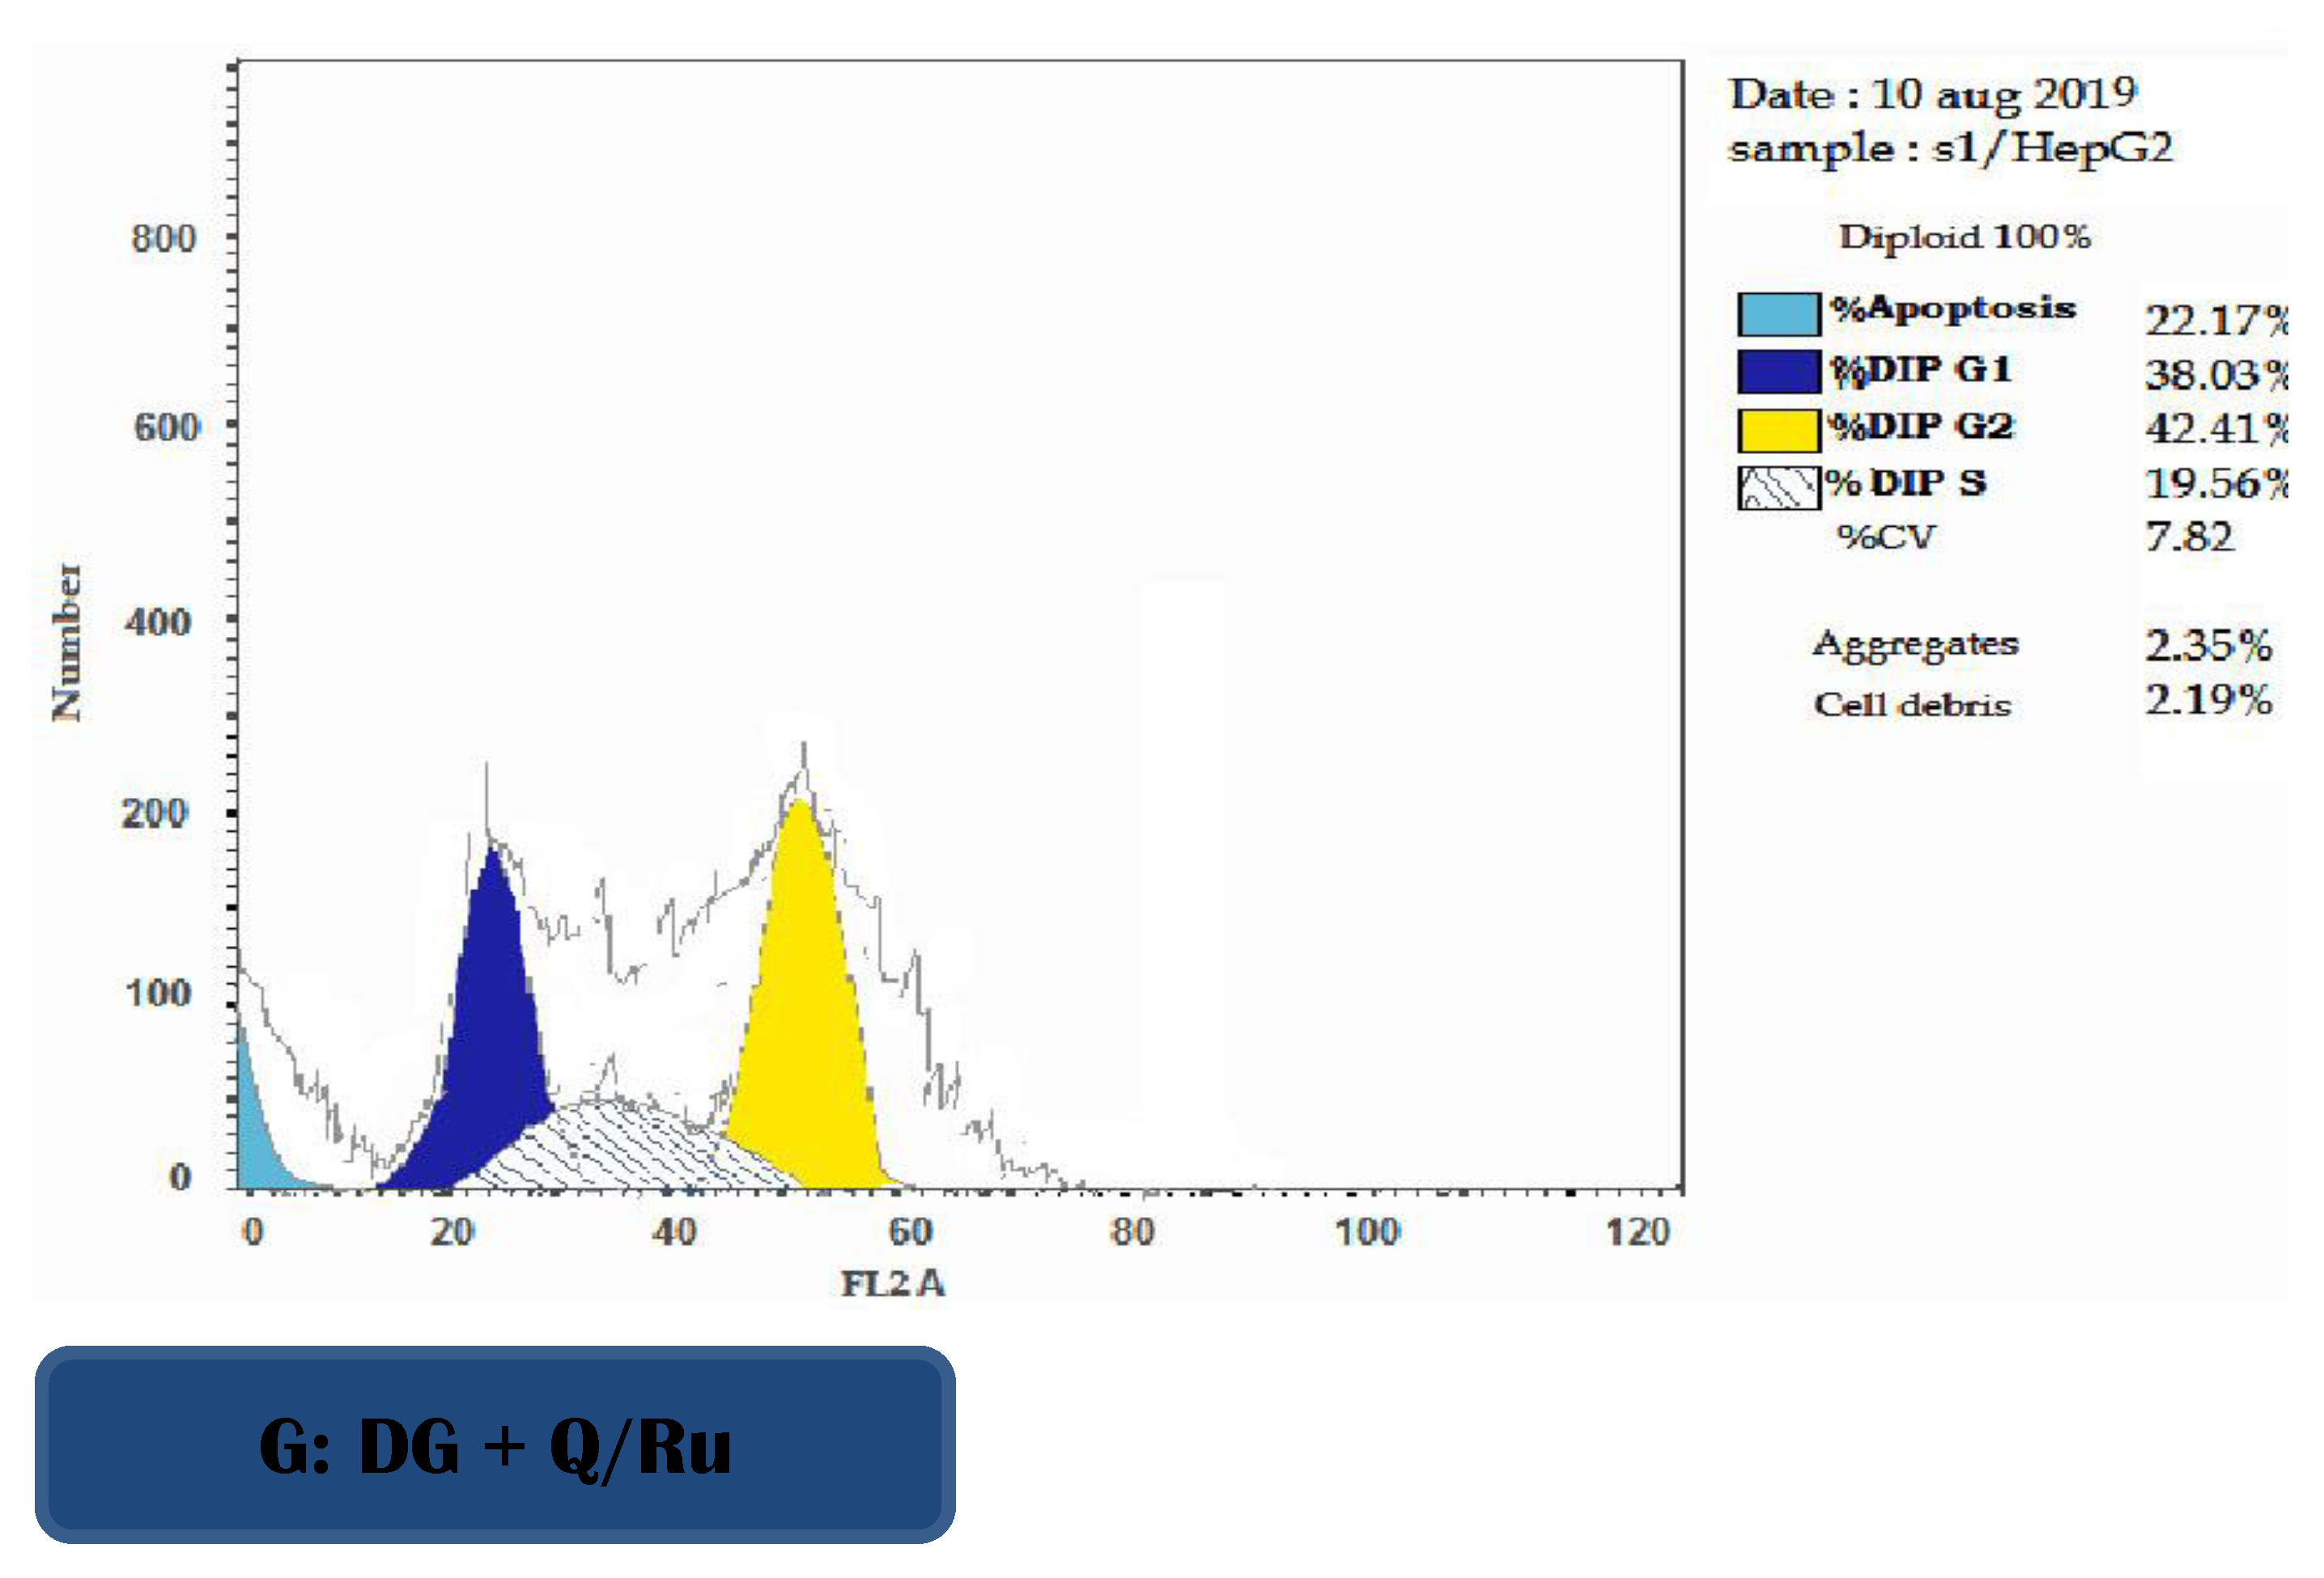
3.7.3. Determination of Apoptosis Using Annexin V/PI in HepG2 Cells

FITC-Annexin V/Pi analysis was performed on HepG2 cells after treatment with RuIII/Q, Q, and DG. Table 2 and Figure 7 showed the percentages of viable, apoptotic, and necrotic cells after treatment of HepG2 cells with IC50 doses at 48 h post-treatment. The results show that RuIII/Q treatment effectively induced apoptosis compared with both Q treatment and control group in HepG2 cells. The percentages of early and late apoptosis induced by DG treatment were increased compared to Q treatment and the control group (untreated cells) (Table 2 and Figure S5).

3.7.4. Cell Cycle Analysis

The effect of RuIII/Q-treated HepG2 cells on cell cycle phase distribution was used to illustrate the inhibition of cell cycle progression. As presented in Figure 7, DG combined with RuIII/Q treatment increased DNA accumulation in the S phase, indicating arrest of tumor cells at this phase. Cell cycle arrest was accompanied with a significant decrease in mean percentage values of treatment with RuIII/Q in G2/M phase compared to the control group, and the apoptotic profile was significantly increased as compared to the control group.

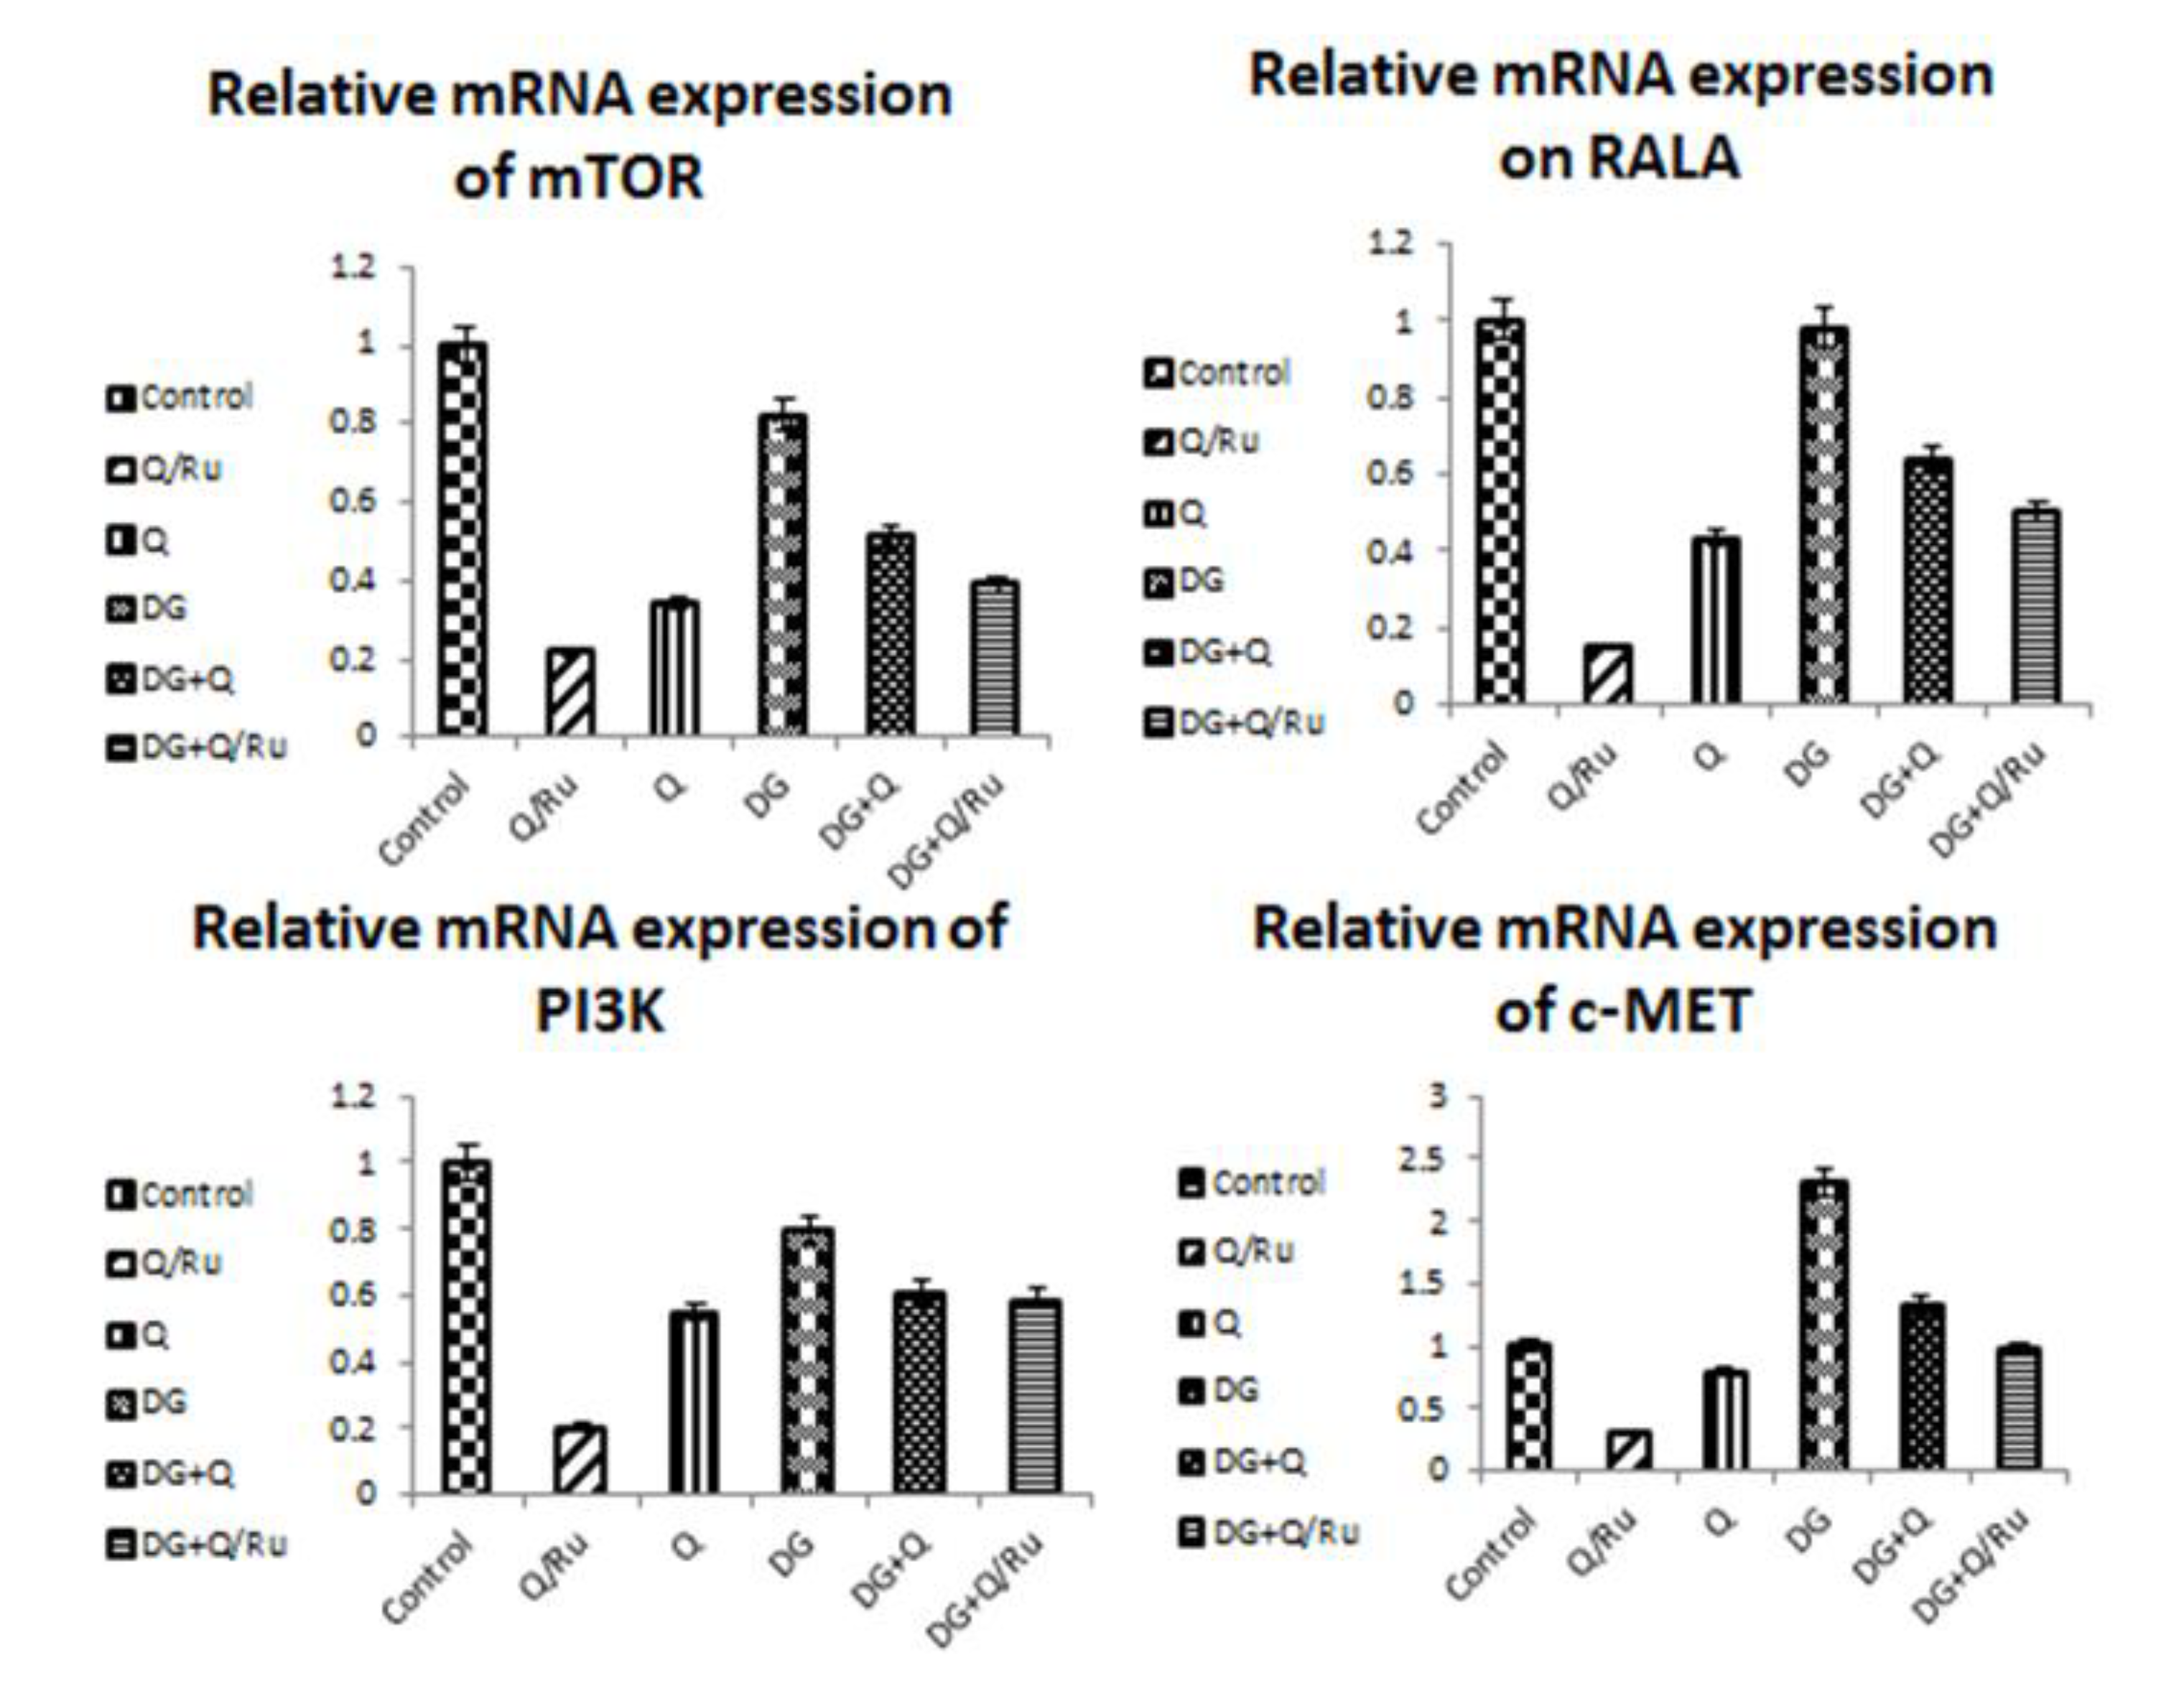
3.7.5. Gene Expression for mTOR, RALA, PI3K and c-Met Expression in HepG2 Cells

Gene expression and statistical analysis were performed to assess the relative expression of these target genes (mTOR, PI3K, RALA, and c-MET signaling pathways genes) after different treatments. The results showed that RuIII/Q treatment alone significantly (p < 0.05) inhibited the expression of the mTOR, PI3K, RALA, and c-MET signaling pathway genes when compared with native Q treatment, DG treatment, and control group in HepG2 cells (Table 3 and Figure 8).

3.7.6. Gene Expression for Apoptotic GenesP53 Expression in HepG2 Cells

P53 is also known as TP53 or tumor protein. It plays an important role in cell cycle control and apoptosis. P53 protein expression after different treatments was detected by flow cytometry. As seen in Figure 9 and Figure 10, P53 is significantly increased after DG + Q treatment when compared with DG + RuIII/Q treatment and control in HepG2 cells. Flow cytometric analysis revealed that P53 is significantly increased after treatment with DG when compared with DG + RuIII/Q in HepG2 cells. Results from qRT-PCR analysis revealed that P53 gene expression is significantly increased after treatment with Q when compared with RuIII/Q, DG, and control treatment in HepG2 cells (Figure 8).

3.7.7. Bax Expression in HepG2 Cells

Bax protein expression after different treatments was detected by flow cytometry. (Figure S6) shows that Bax was significantly increased after DG + RuIII/Q treatment when compared with either DG + Q and control treatment in HepG2 cells. Flow cytometric analysis revealed that Bax is significantly increased after treatment with DG when compared with RuIII/Q treatment in HepG2 cells.
Gene expression for Nrf2, Cu-ZnSOD, CAT and GPx expression in testicular tissues
Gene expression and statistical analysis were performed to assess the relative expression of these genes (Nrf2, Cu-ZnSOD, CAT, and GPx signaling pathway genes) in testicular tissue after different treatments. There was a significant upregulation of Nrf2, Cu-ZnSOD, CAT, and GPx expression in testicular tissue homogenates of combined treated groups with DG and Q and/or RuIII/Q-treated group compared to the DG-treated group. Moreover, a higher significant upregulation was recorded in DG + RuIII/Q compared to the DG + Q-treated group. However, lowest expression levels of these enzymes were expressed in testicular tissue homogenates of the DG-treated group. qRT-PCR results are summarized in (Figure 11).

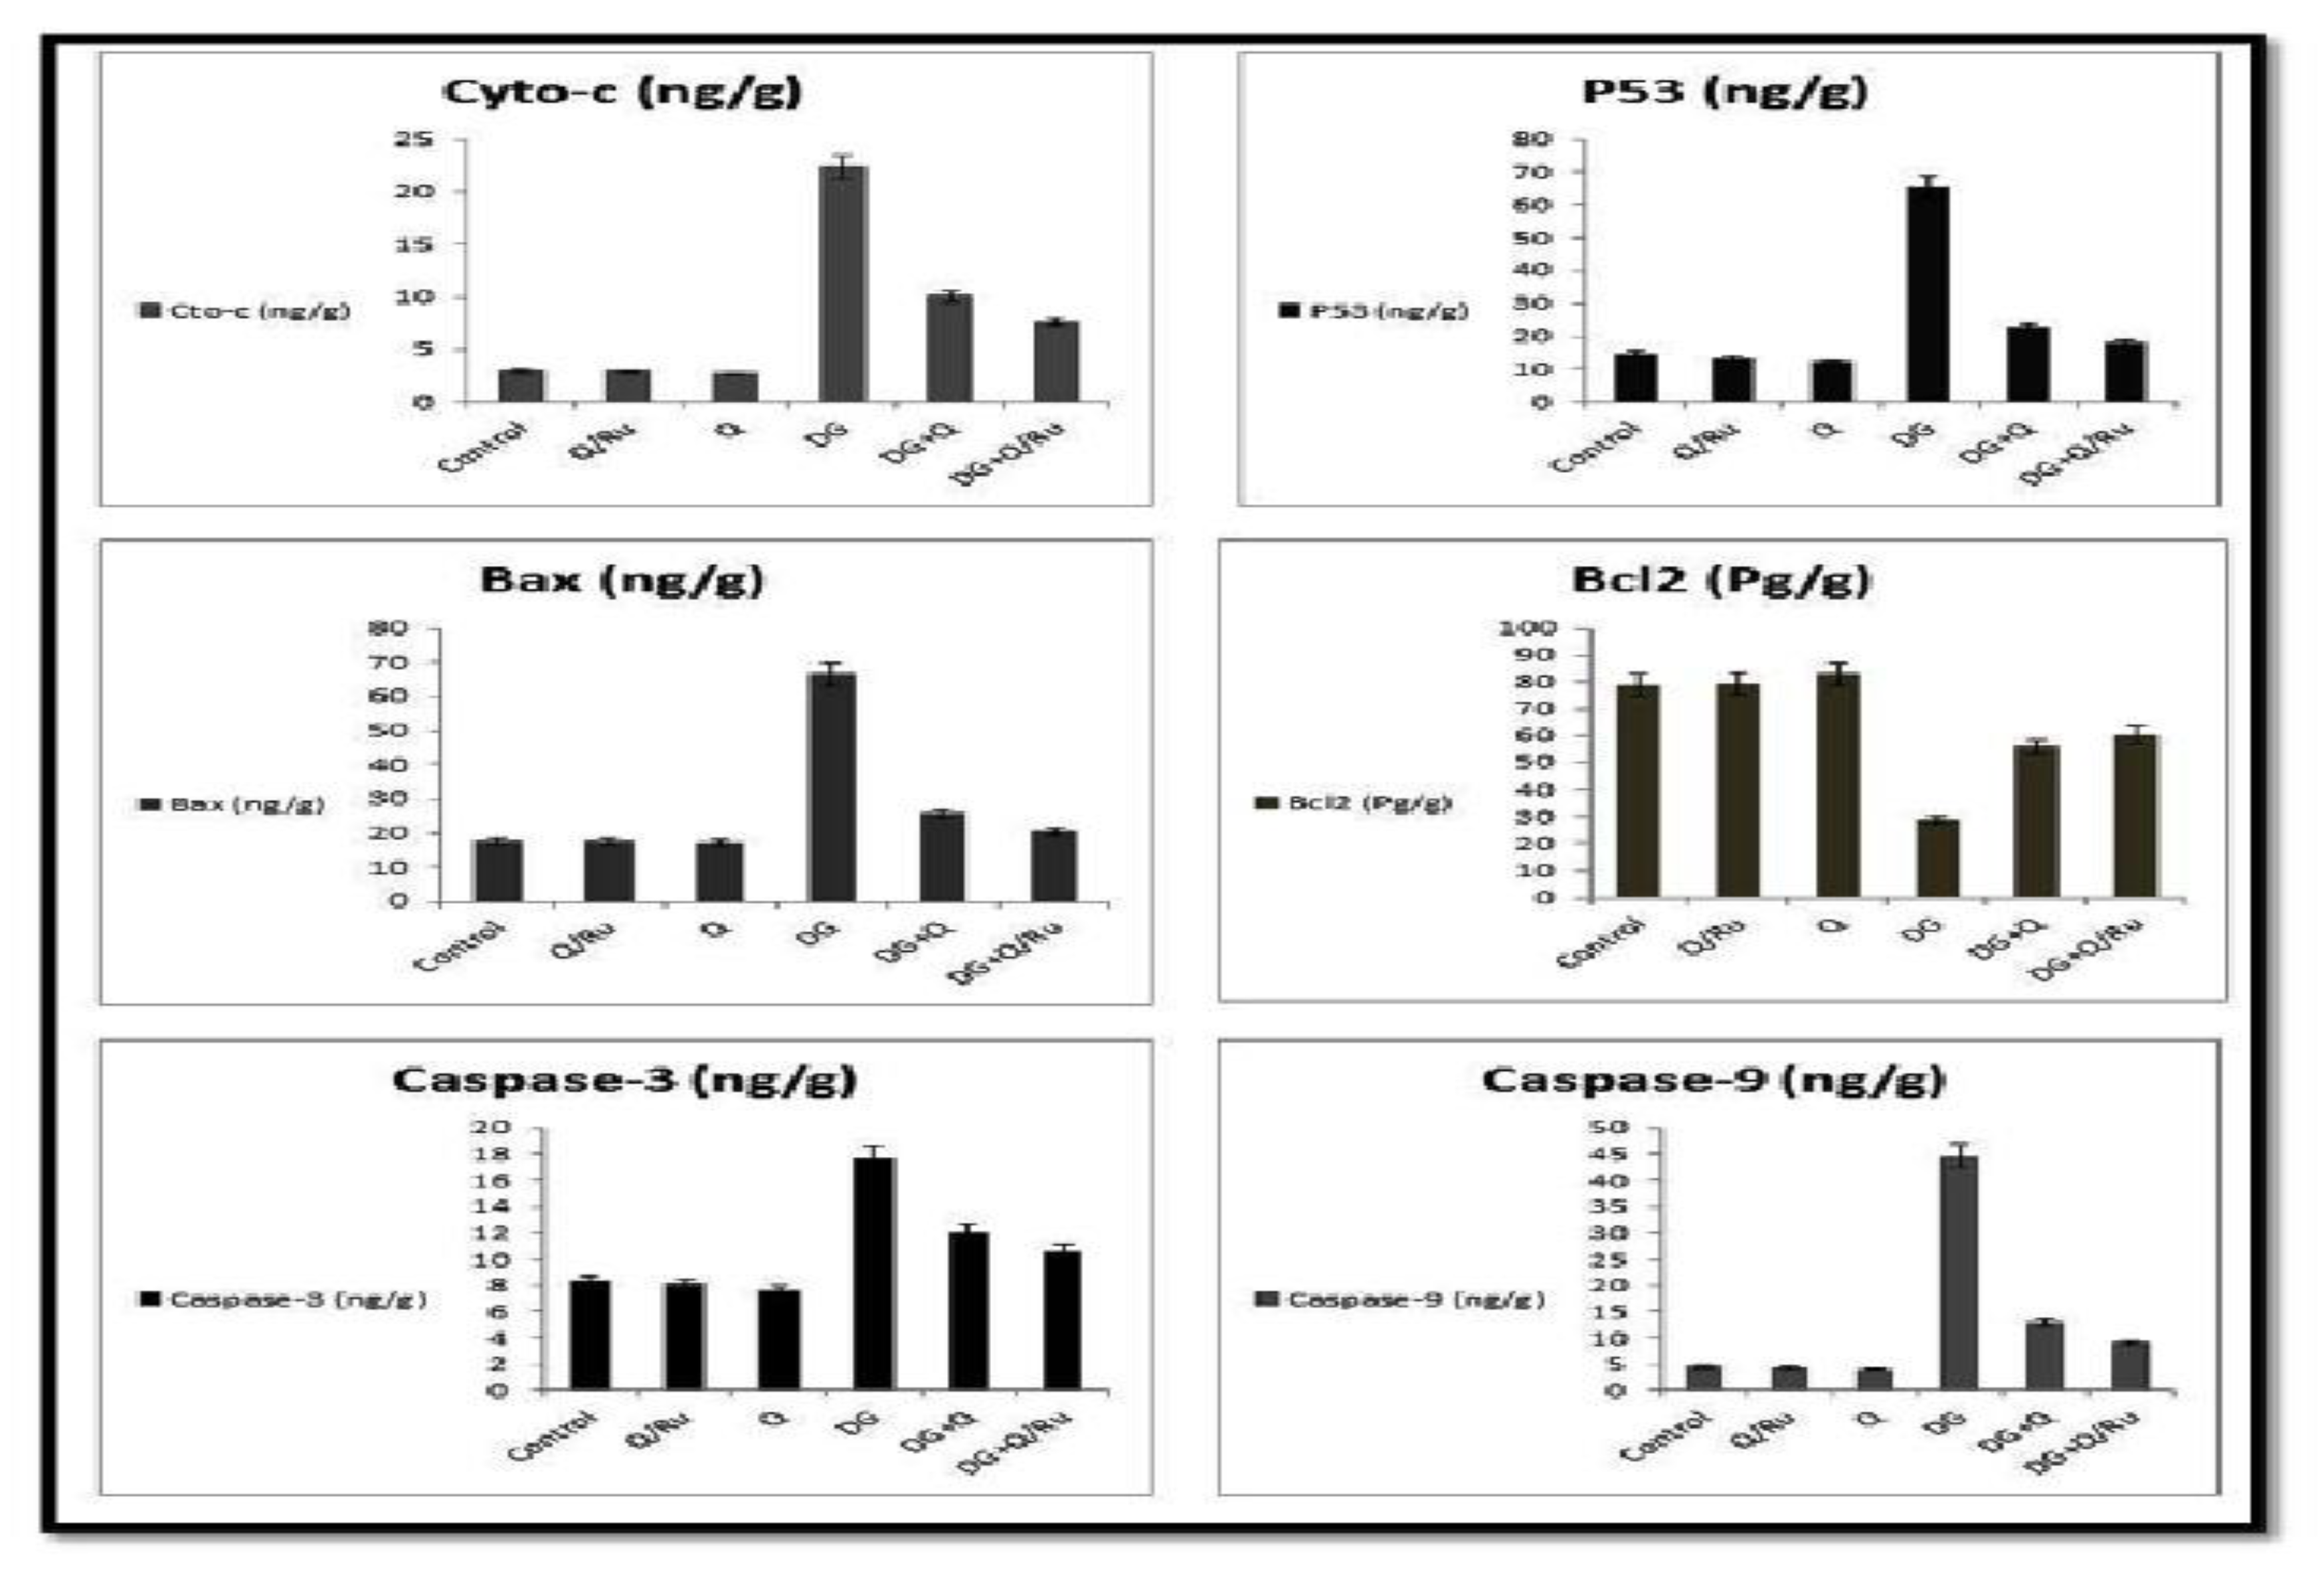
3.7.8. Gene Expression for cyto-c, Caspase-3, P53, Bax, BCl2, and Caspase-9 Expression in Testicular Tissues

Gene expression and statistical analysis were performed to assess the relative expression of these genes (Cyto-c, BCl2, P53, caspase-3, Bax and caspase-9 signaling pathways genes) in the brain tissue homogenates after different treatments. There was a significant up-regulation of cyto-c, P53, Bax, BCl2, caspase-3 and caspase-9 expression in brain tissue homogenates of DG treated group as compared to combined treated groups with DG and Q and/or RuIII/Q treated groups. qRT-PCR results were summarized in Figure 9.

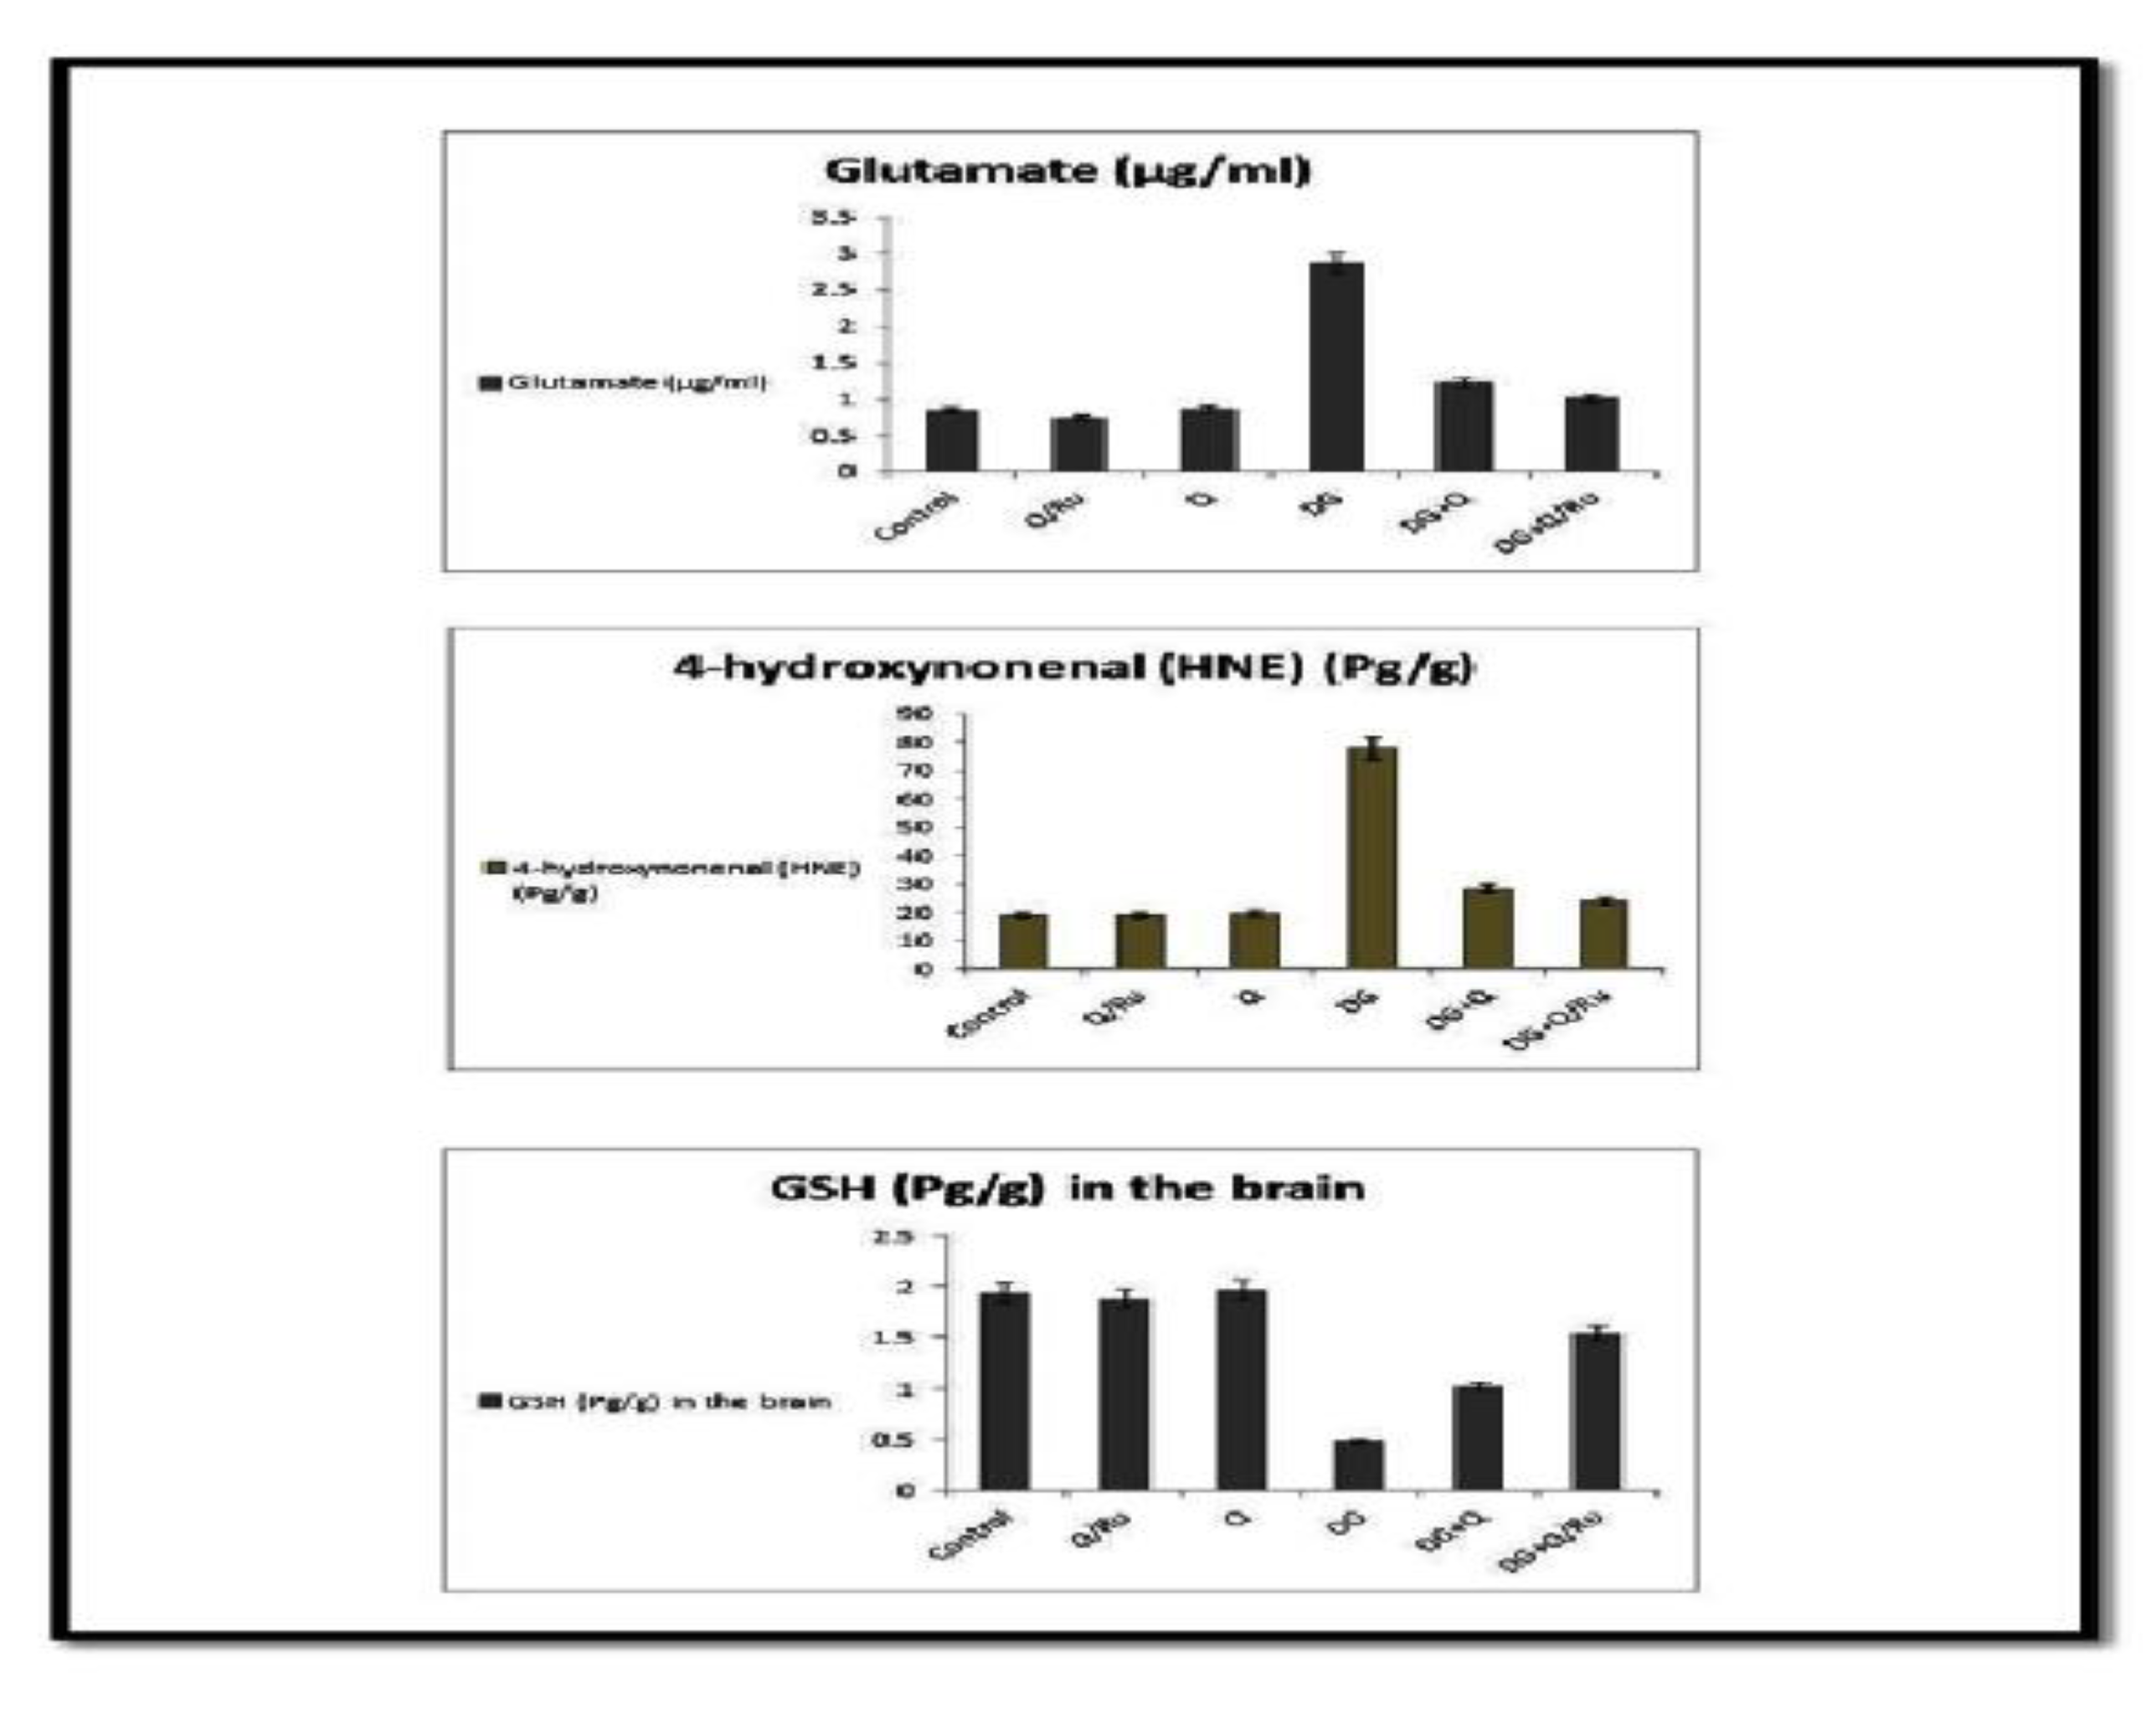
3.7.9. Effect on Glutamate, 4-hydroxynonenal (HNE), GSH, HCY, Amyloid Beta and GABA Levels

Levels of glutamate, 4-hydroxynonenal (HNE), HV + HCY, and amyloid beta were significantly increased in the blood of the DG-treated group and all parameters were significantly reduced in groups treated with a combination of DG and Q or RuIII/Q; significant reduction was recorded in DG combined with RuIII/Q (Figure S7). GSH and GABA levels were significantly decreased in the DG-treated group and increased in groups treated with a combination of DG with RuIII/Q (Figure 12).

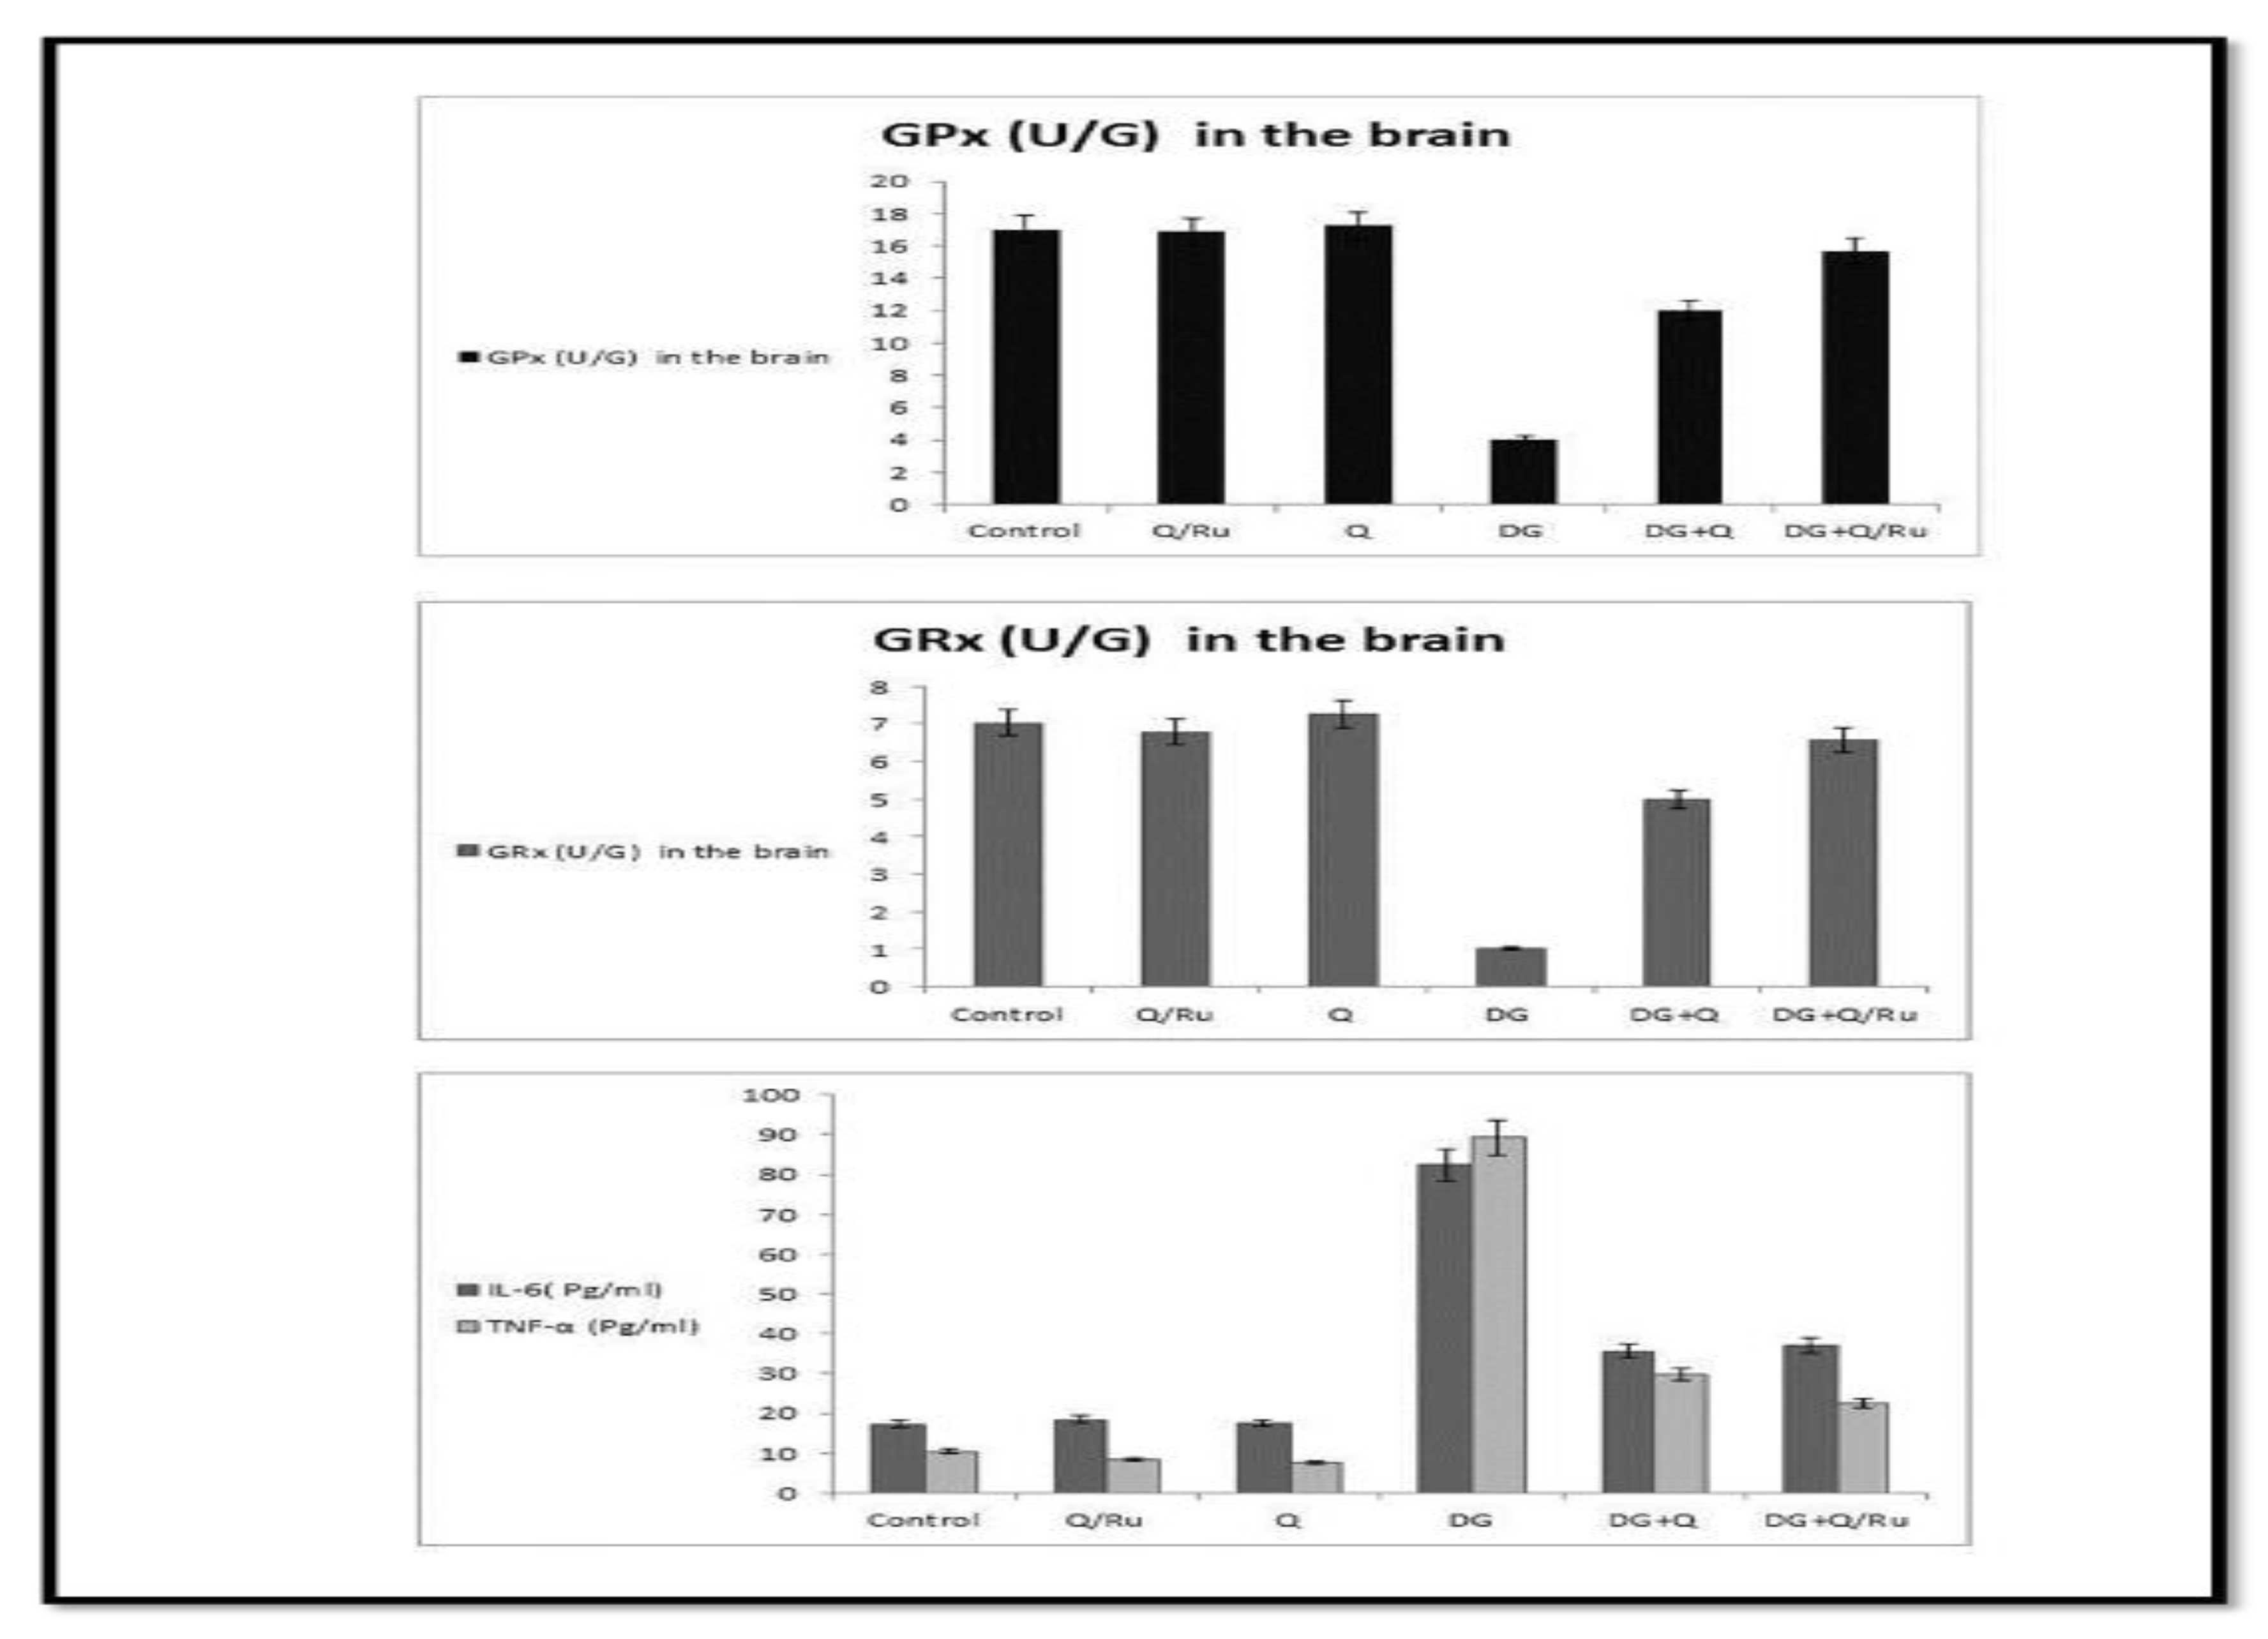
3.7.10. Effect on IL-6 and TNF-α

The levels of cytokines TNF-α and IL-6 in testicular tissues were detected at the end of the experiment (Figure 11). They significantly increased in the DG group compared with healthy animals. RuIII/Q and Q suppressed TNF-α and IL-6 levels, respectively. However, a combination of both with DG lowered TNF-α and IL-6 levels. However, more reduction was recorded in the DG combined with RuIII/Q-treated group.

3.7.11. Oxidative Stress Enzyme Markers

As shown in Table 4 and Figure 11, DG significantly decreased the levels of CAT, SOD, GPx, and GRx enzymes in both brain and testicular tissues, while affording a significant increase in MDA level in both tissues. Treatment with either Q or RuIII/Q complex either alone or in combination with DG induced significant elevation in CAT, SOD, GRx, and GPx levels as compared to the normal control group, whereas afforded a significant decrease in MDA levels compared to the control group. The best results were recorded in the last group of treatment with RuIII/Q.

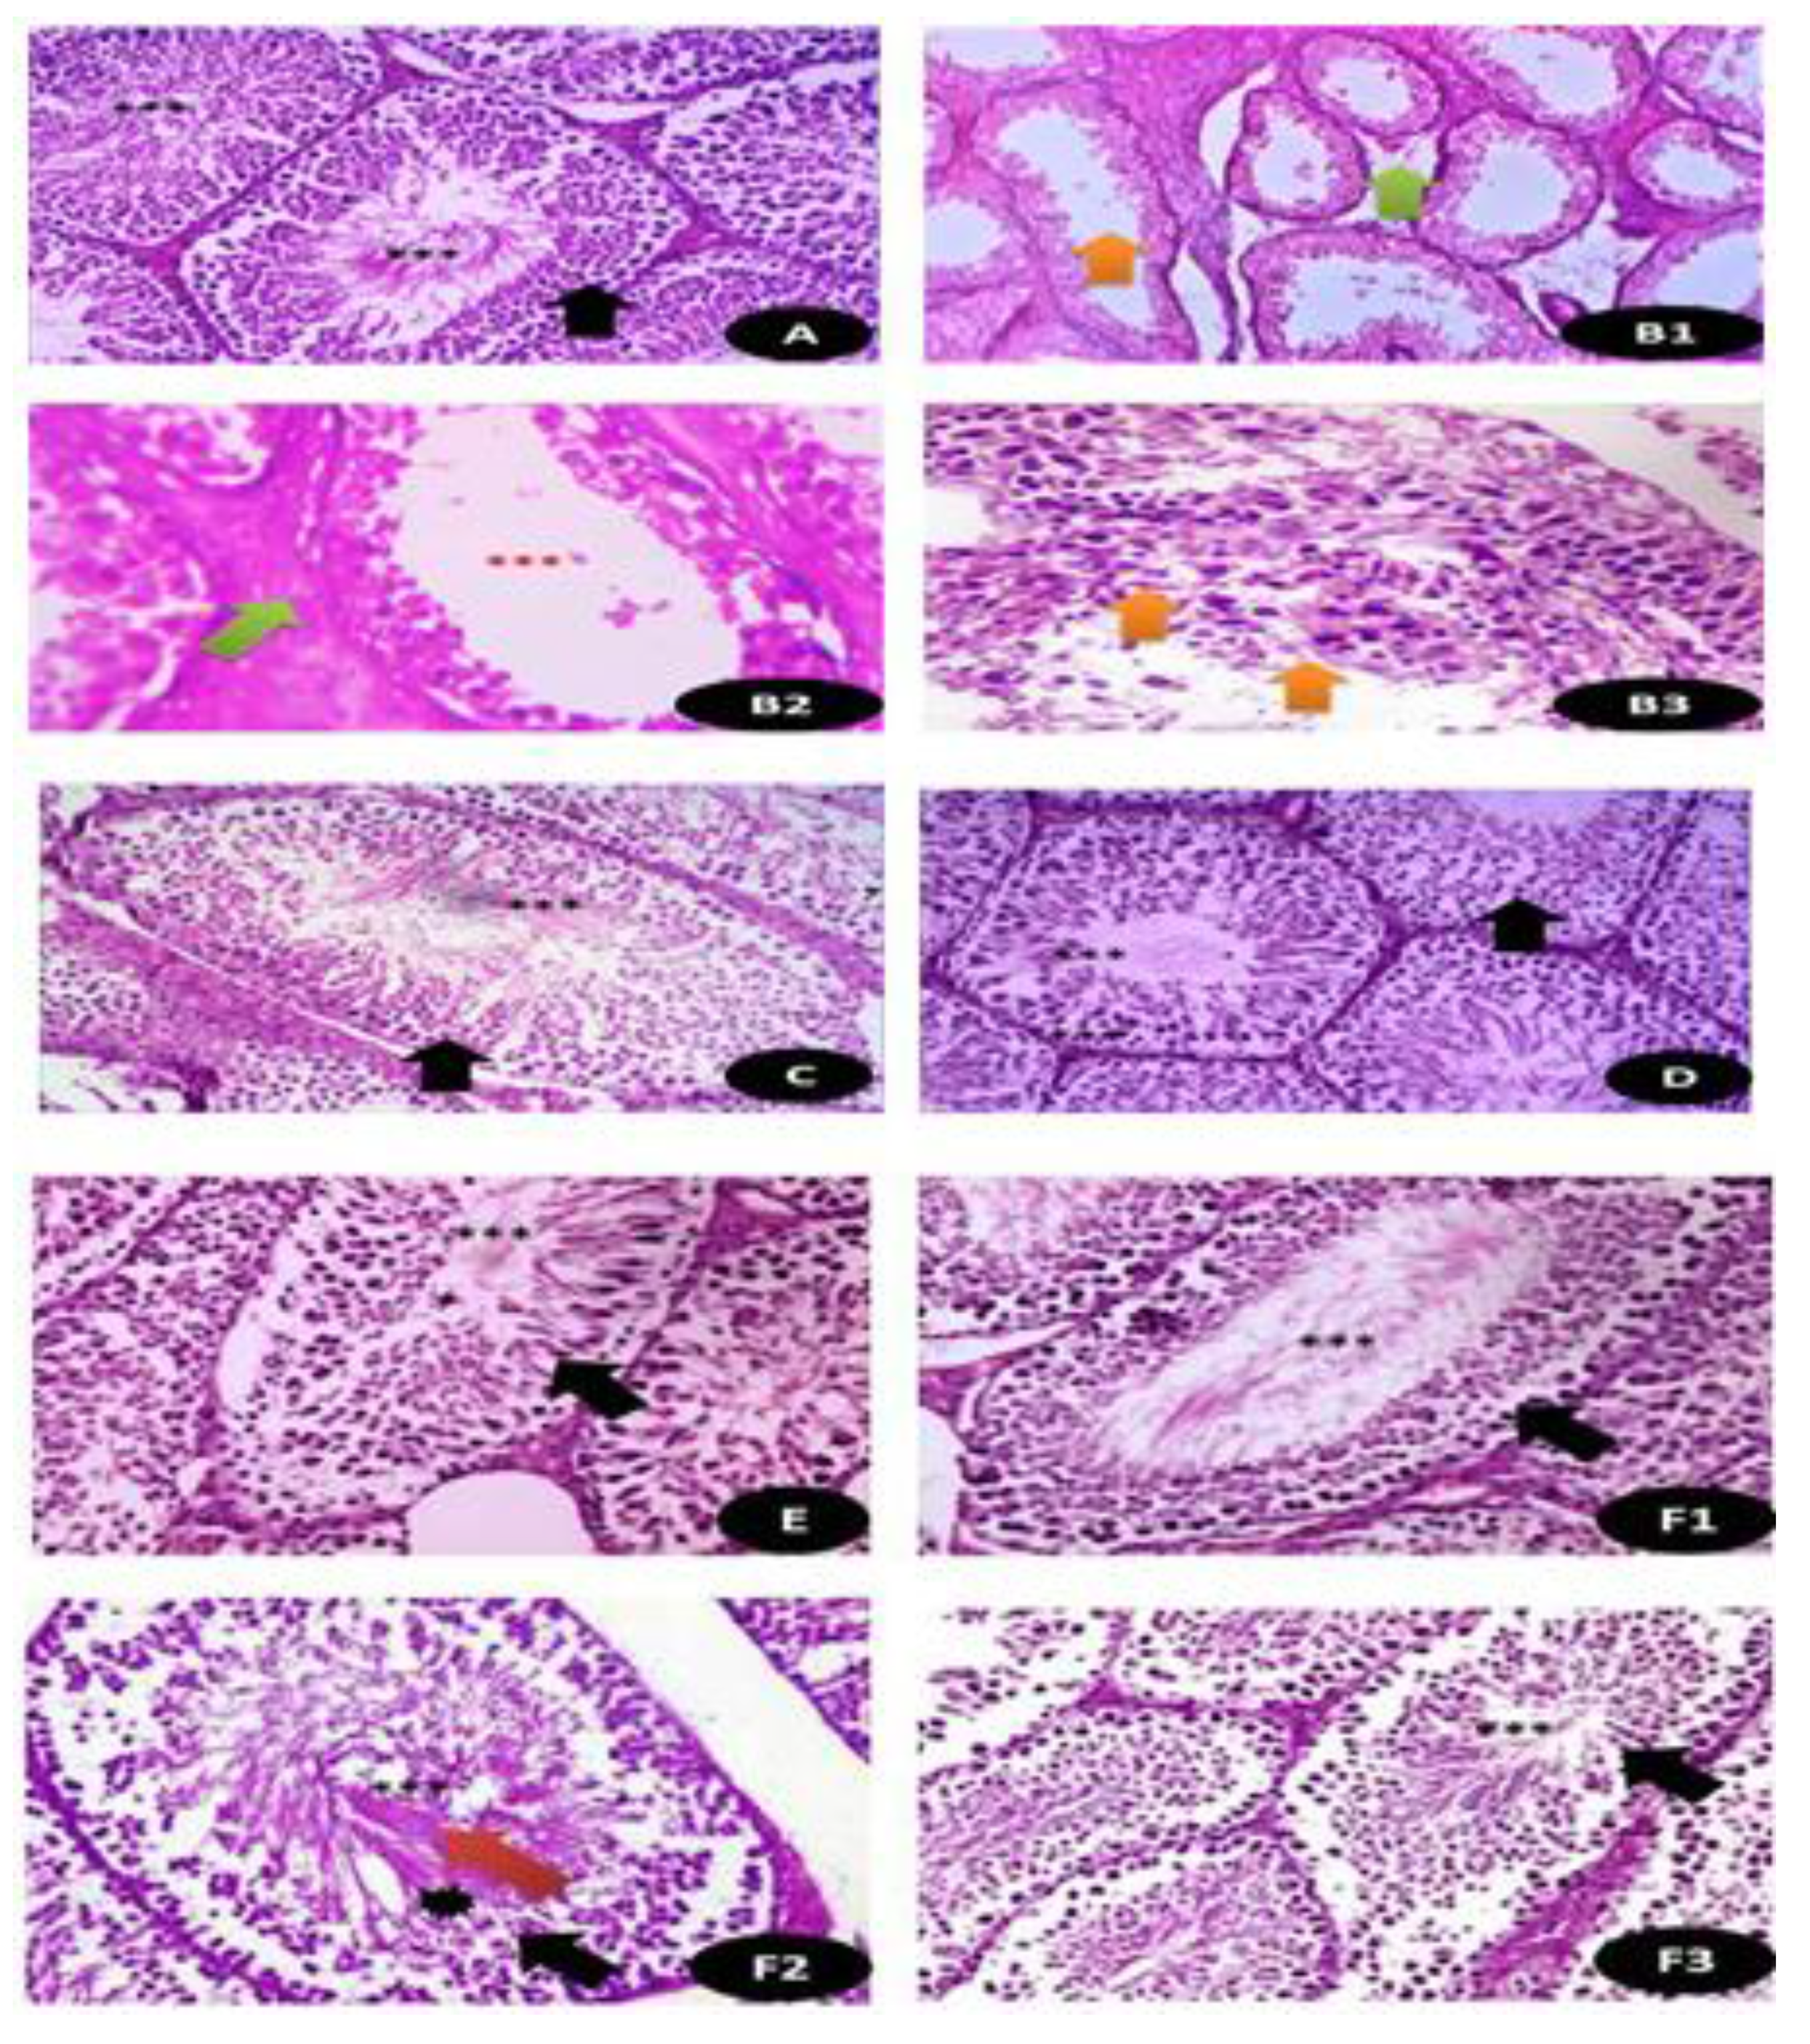
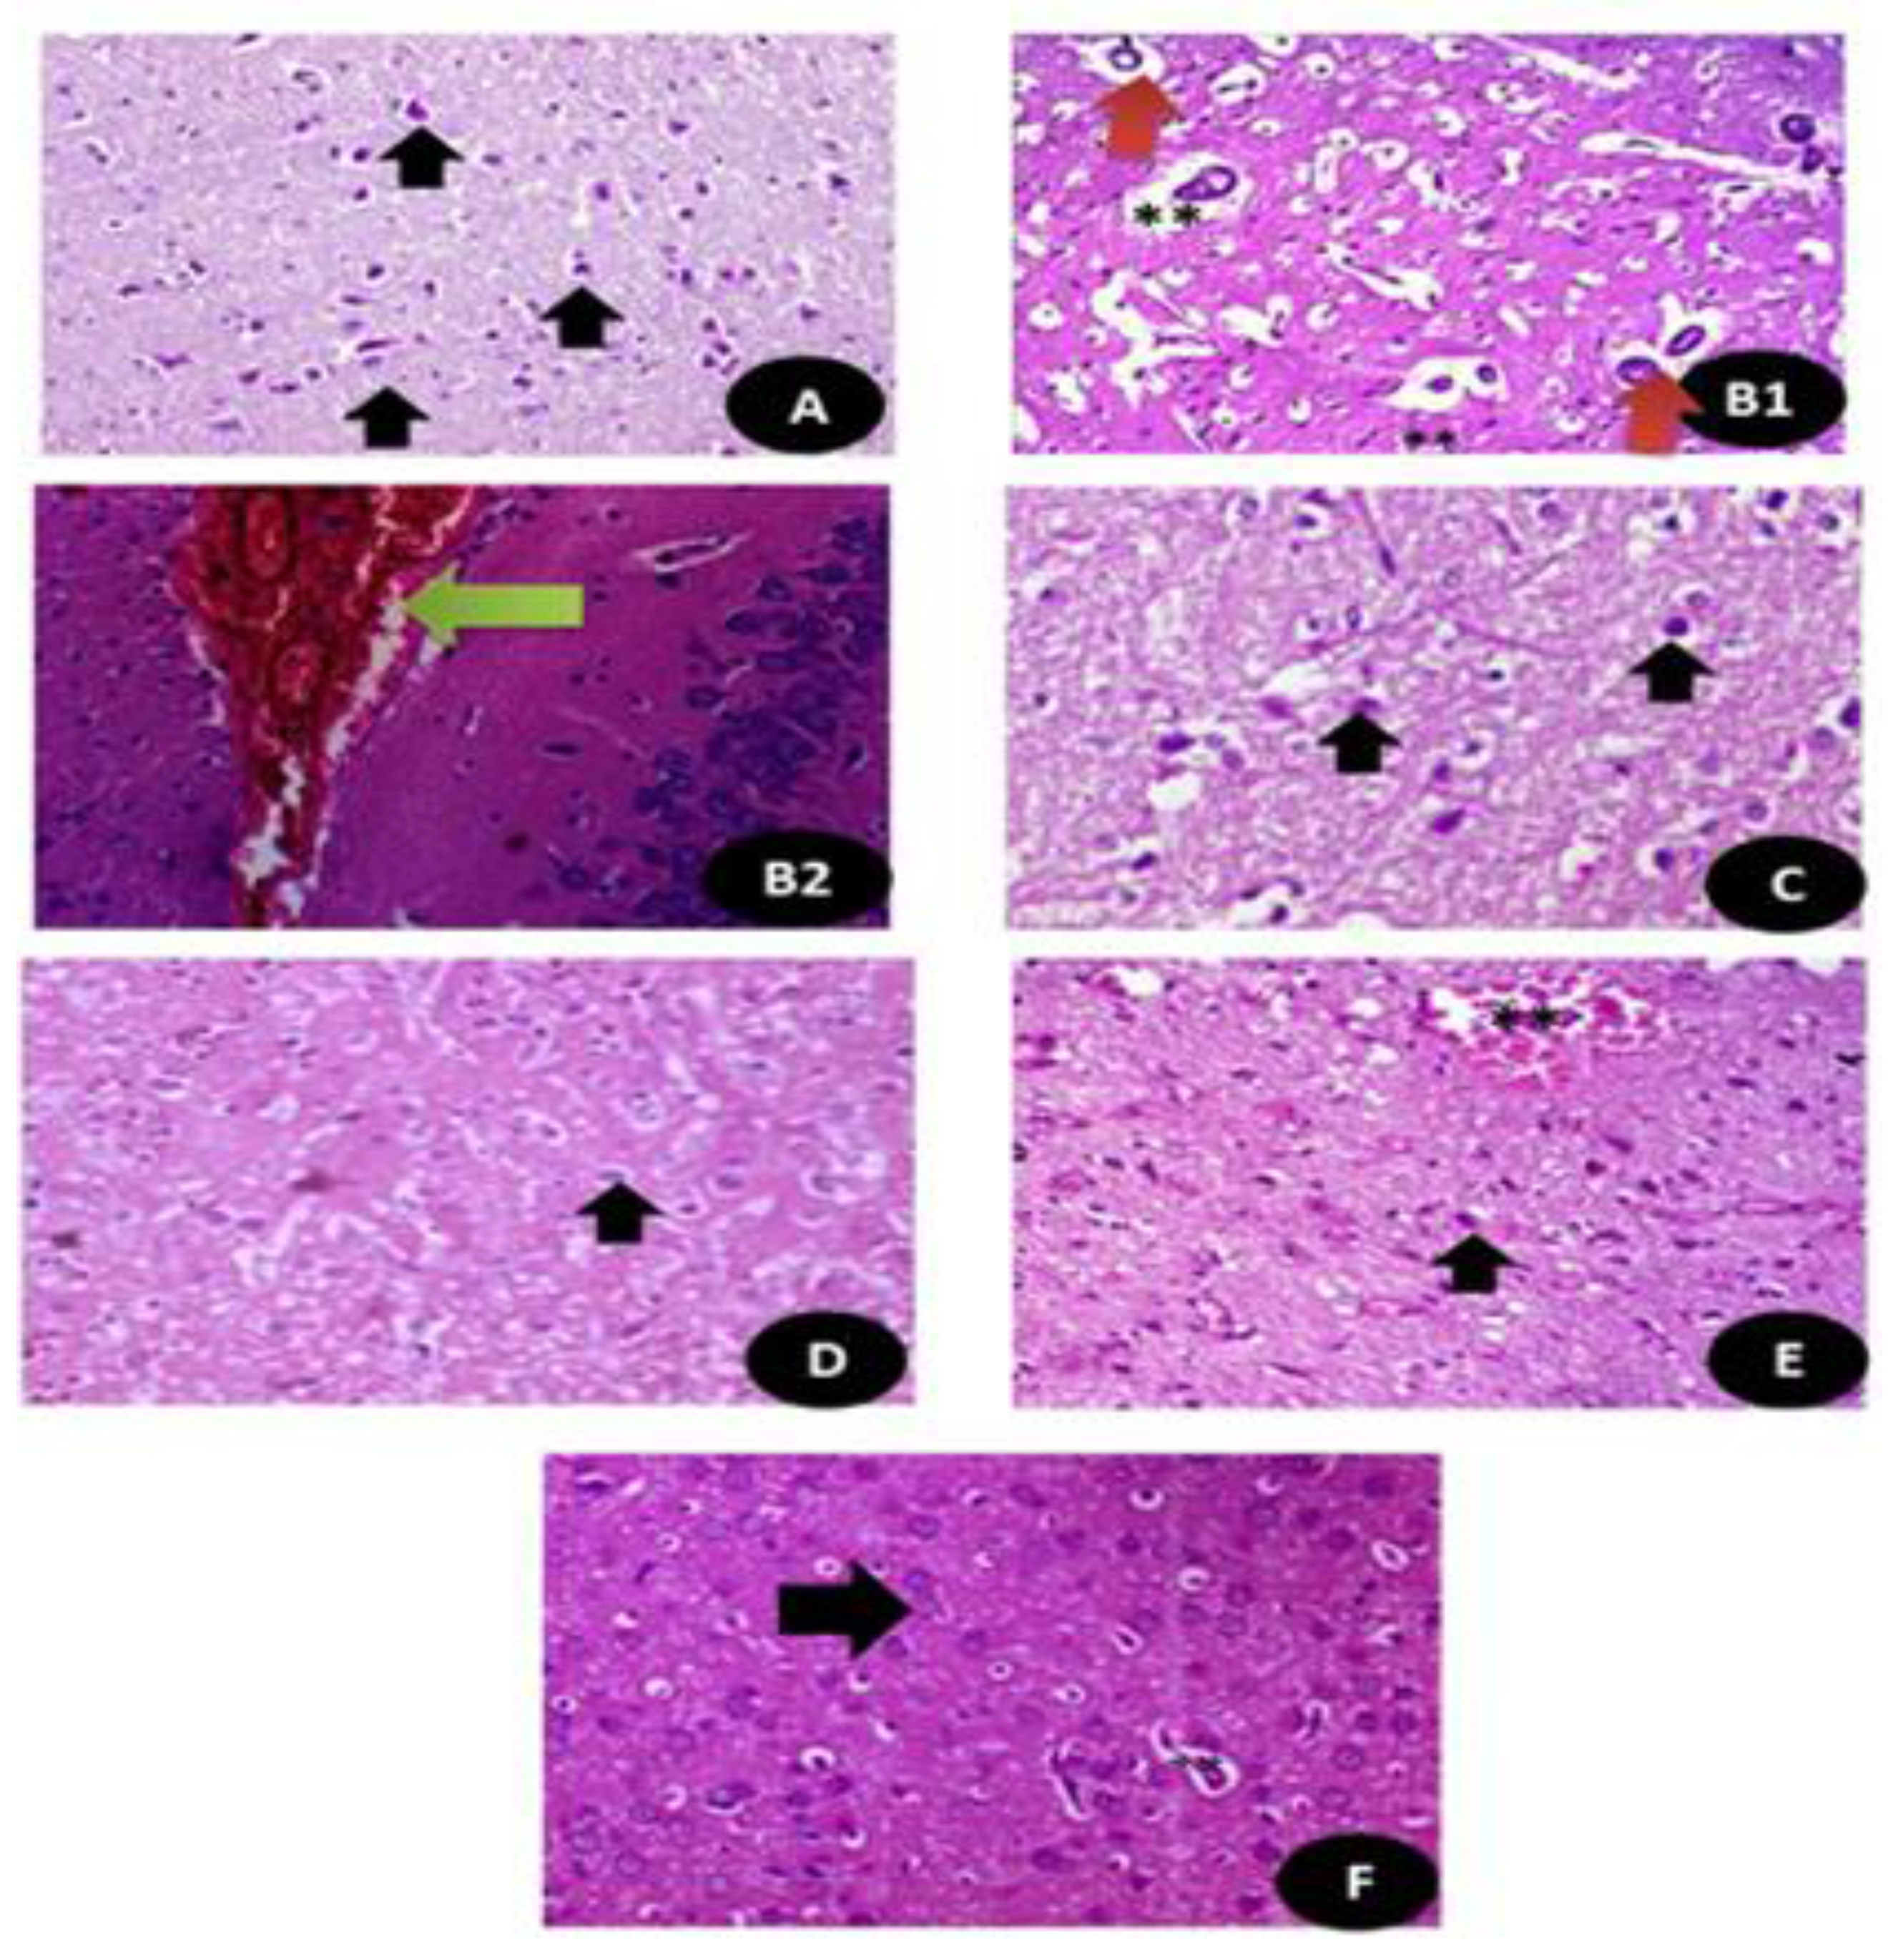
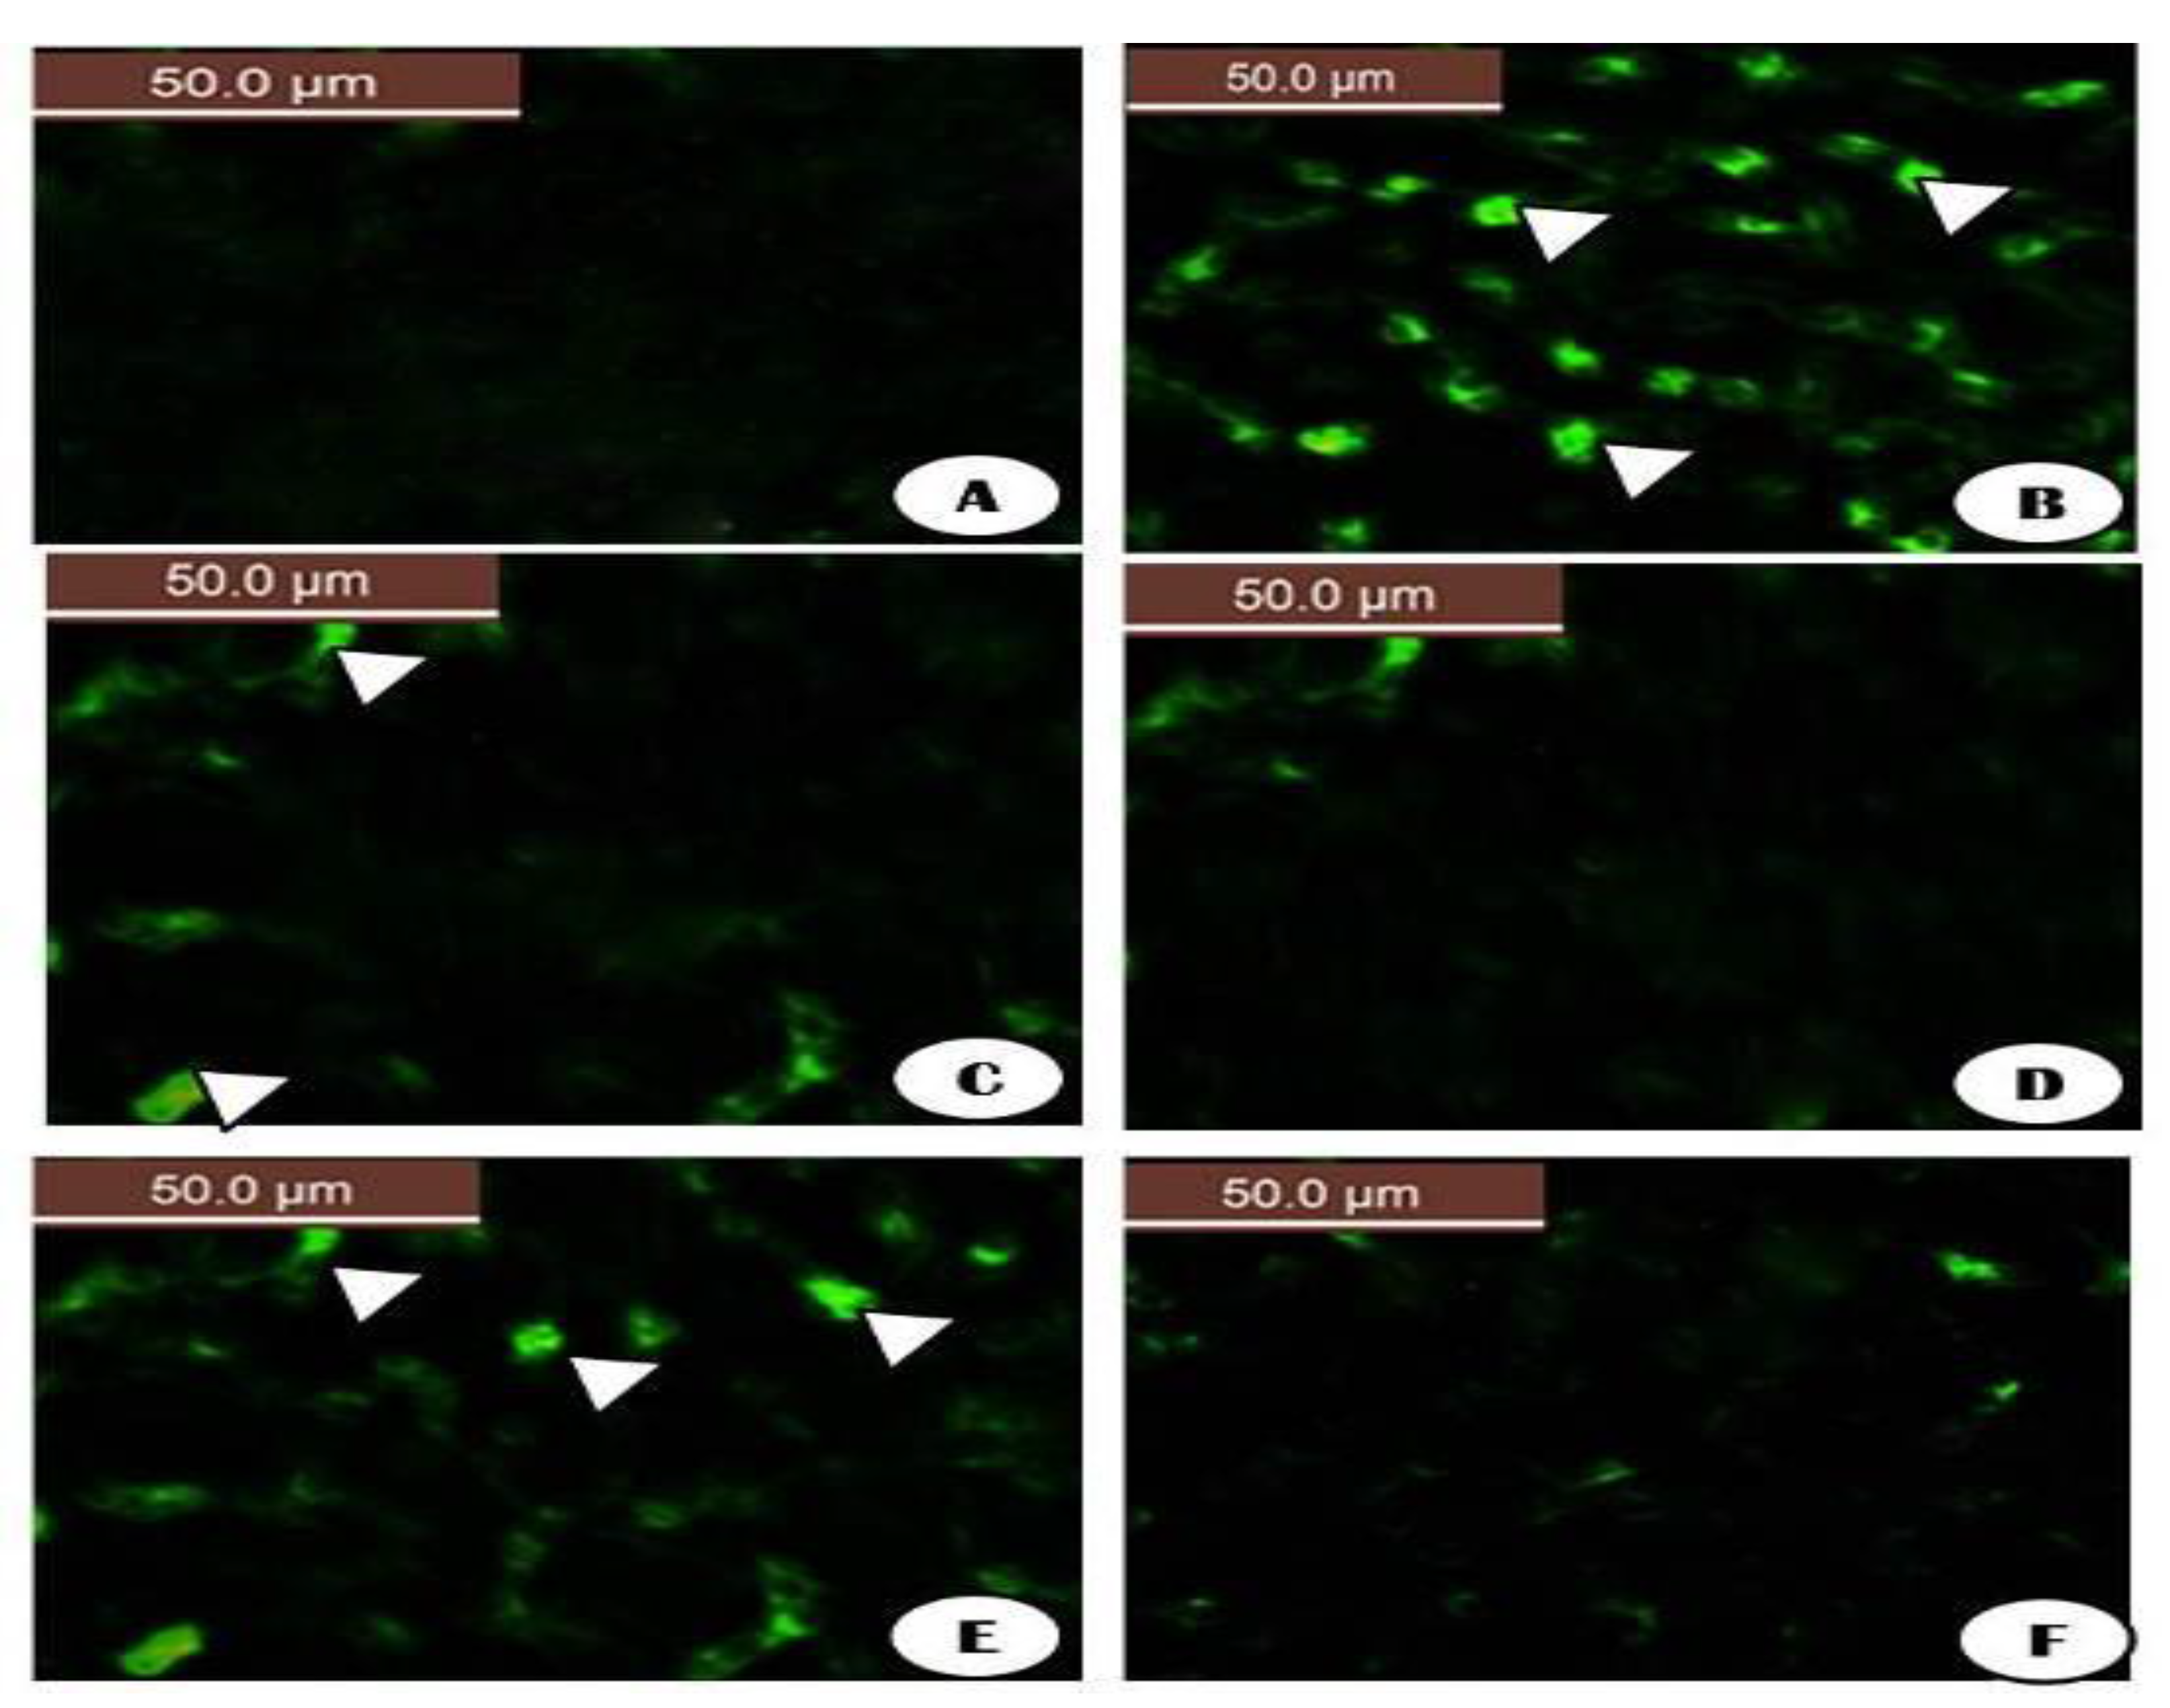
3.7.12. Histological Examination Testicular and Brain Tissues (Cerebral Cortex)

The histopathological examination of the testicular tissues is shown in Figure 13 and Table S2 clarifies the histological activity index (HAI) based on the level of the testicular microscopic lesions as the effect of DG and Q and/or RuIII/Q separately or in combination and it is appearing that RuIII/Q improved greatly the testicular tissues and restoration of most of testicular tissues after combination.
The histopathological sections of the brain tissues stained with H&E are shown in Figure 14 and Table S3. It clarifies the index (HAI) of the histological sections based on the brain tissues microscopic lesions degree as the effect of DG and Q and/or RuIII/Q separately or in combination and it is appearing that RuIII/Q improved greatly the neural tissues and restoration of most of testicular tissues after combination.

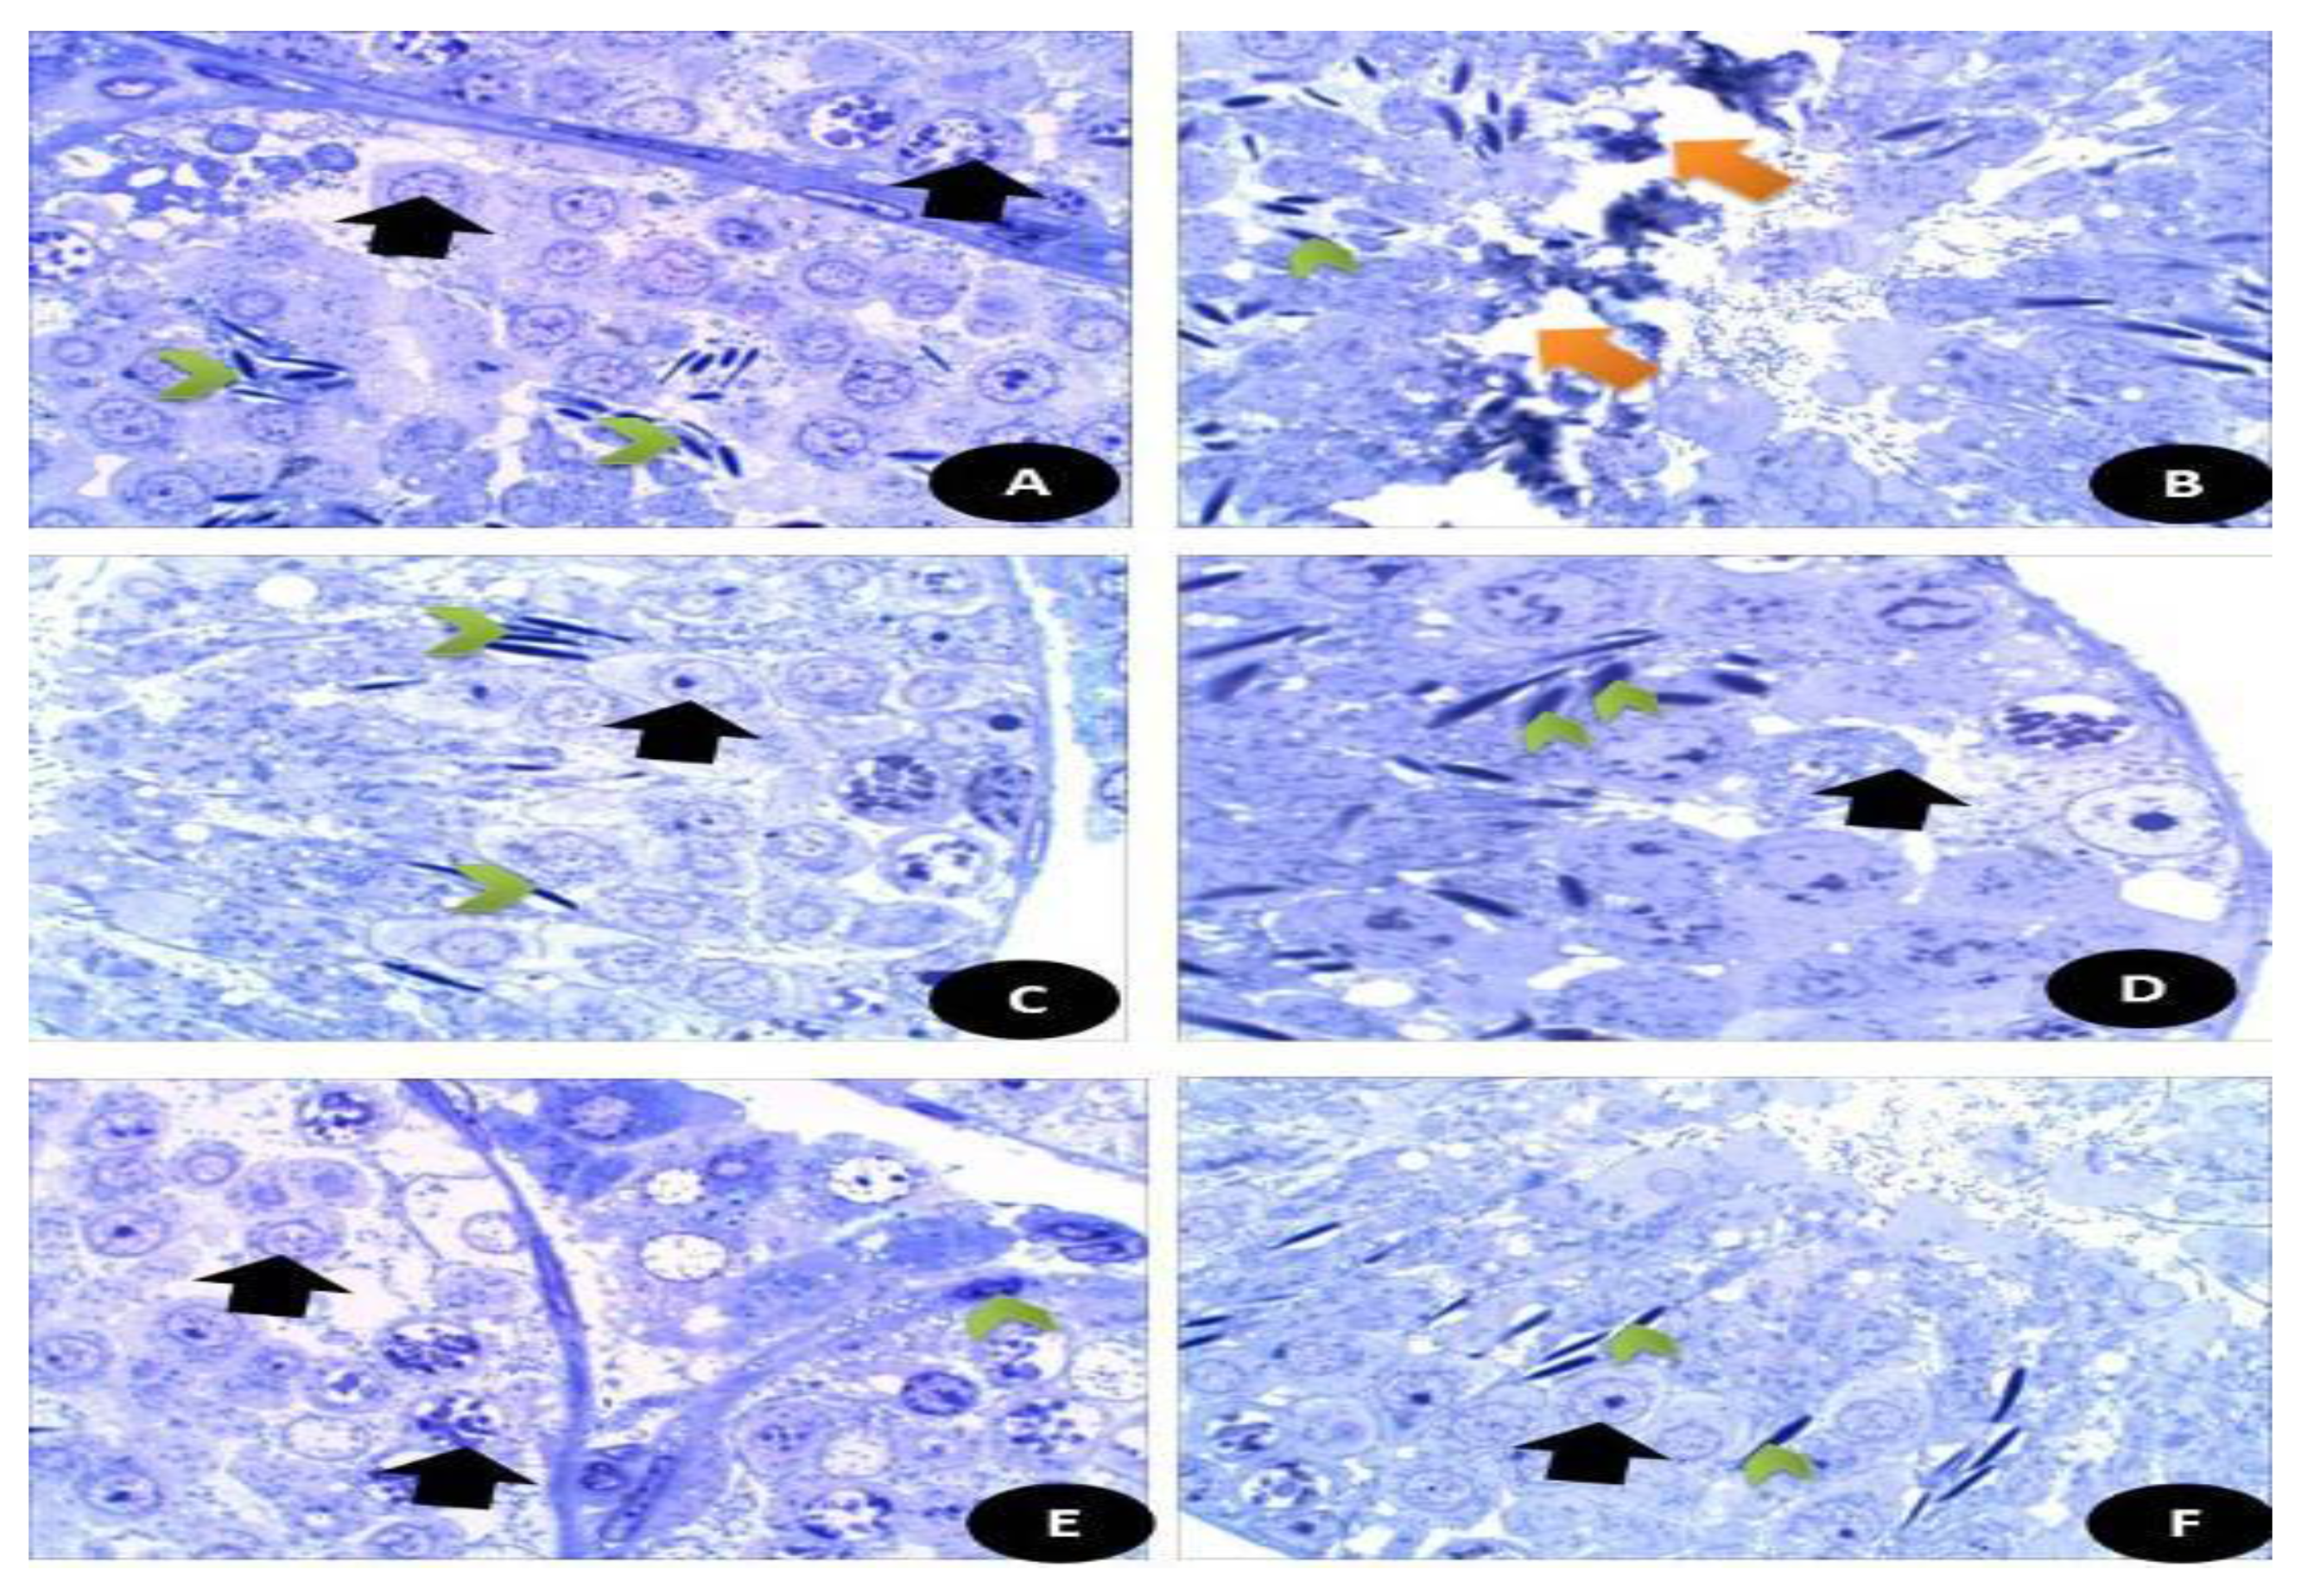
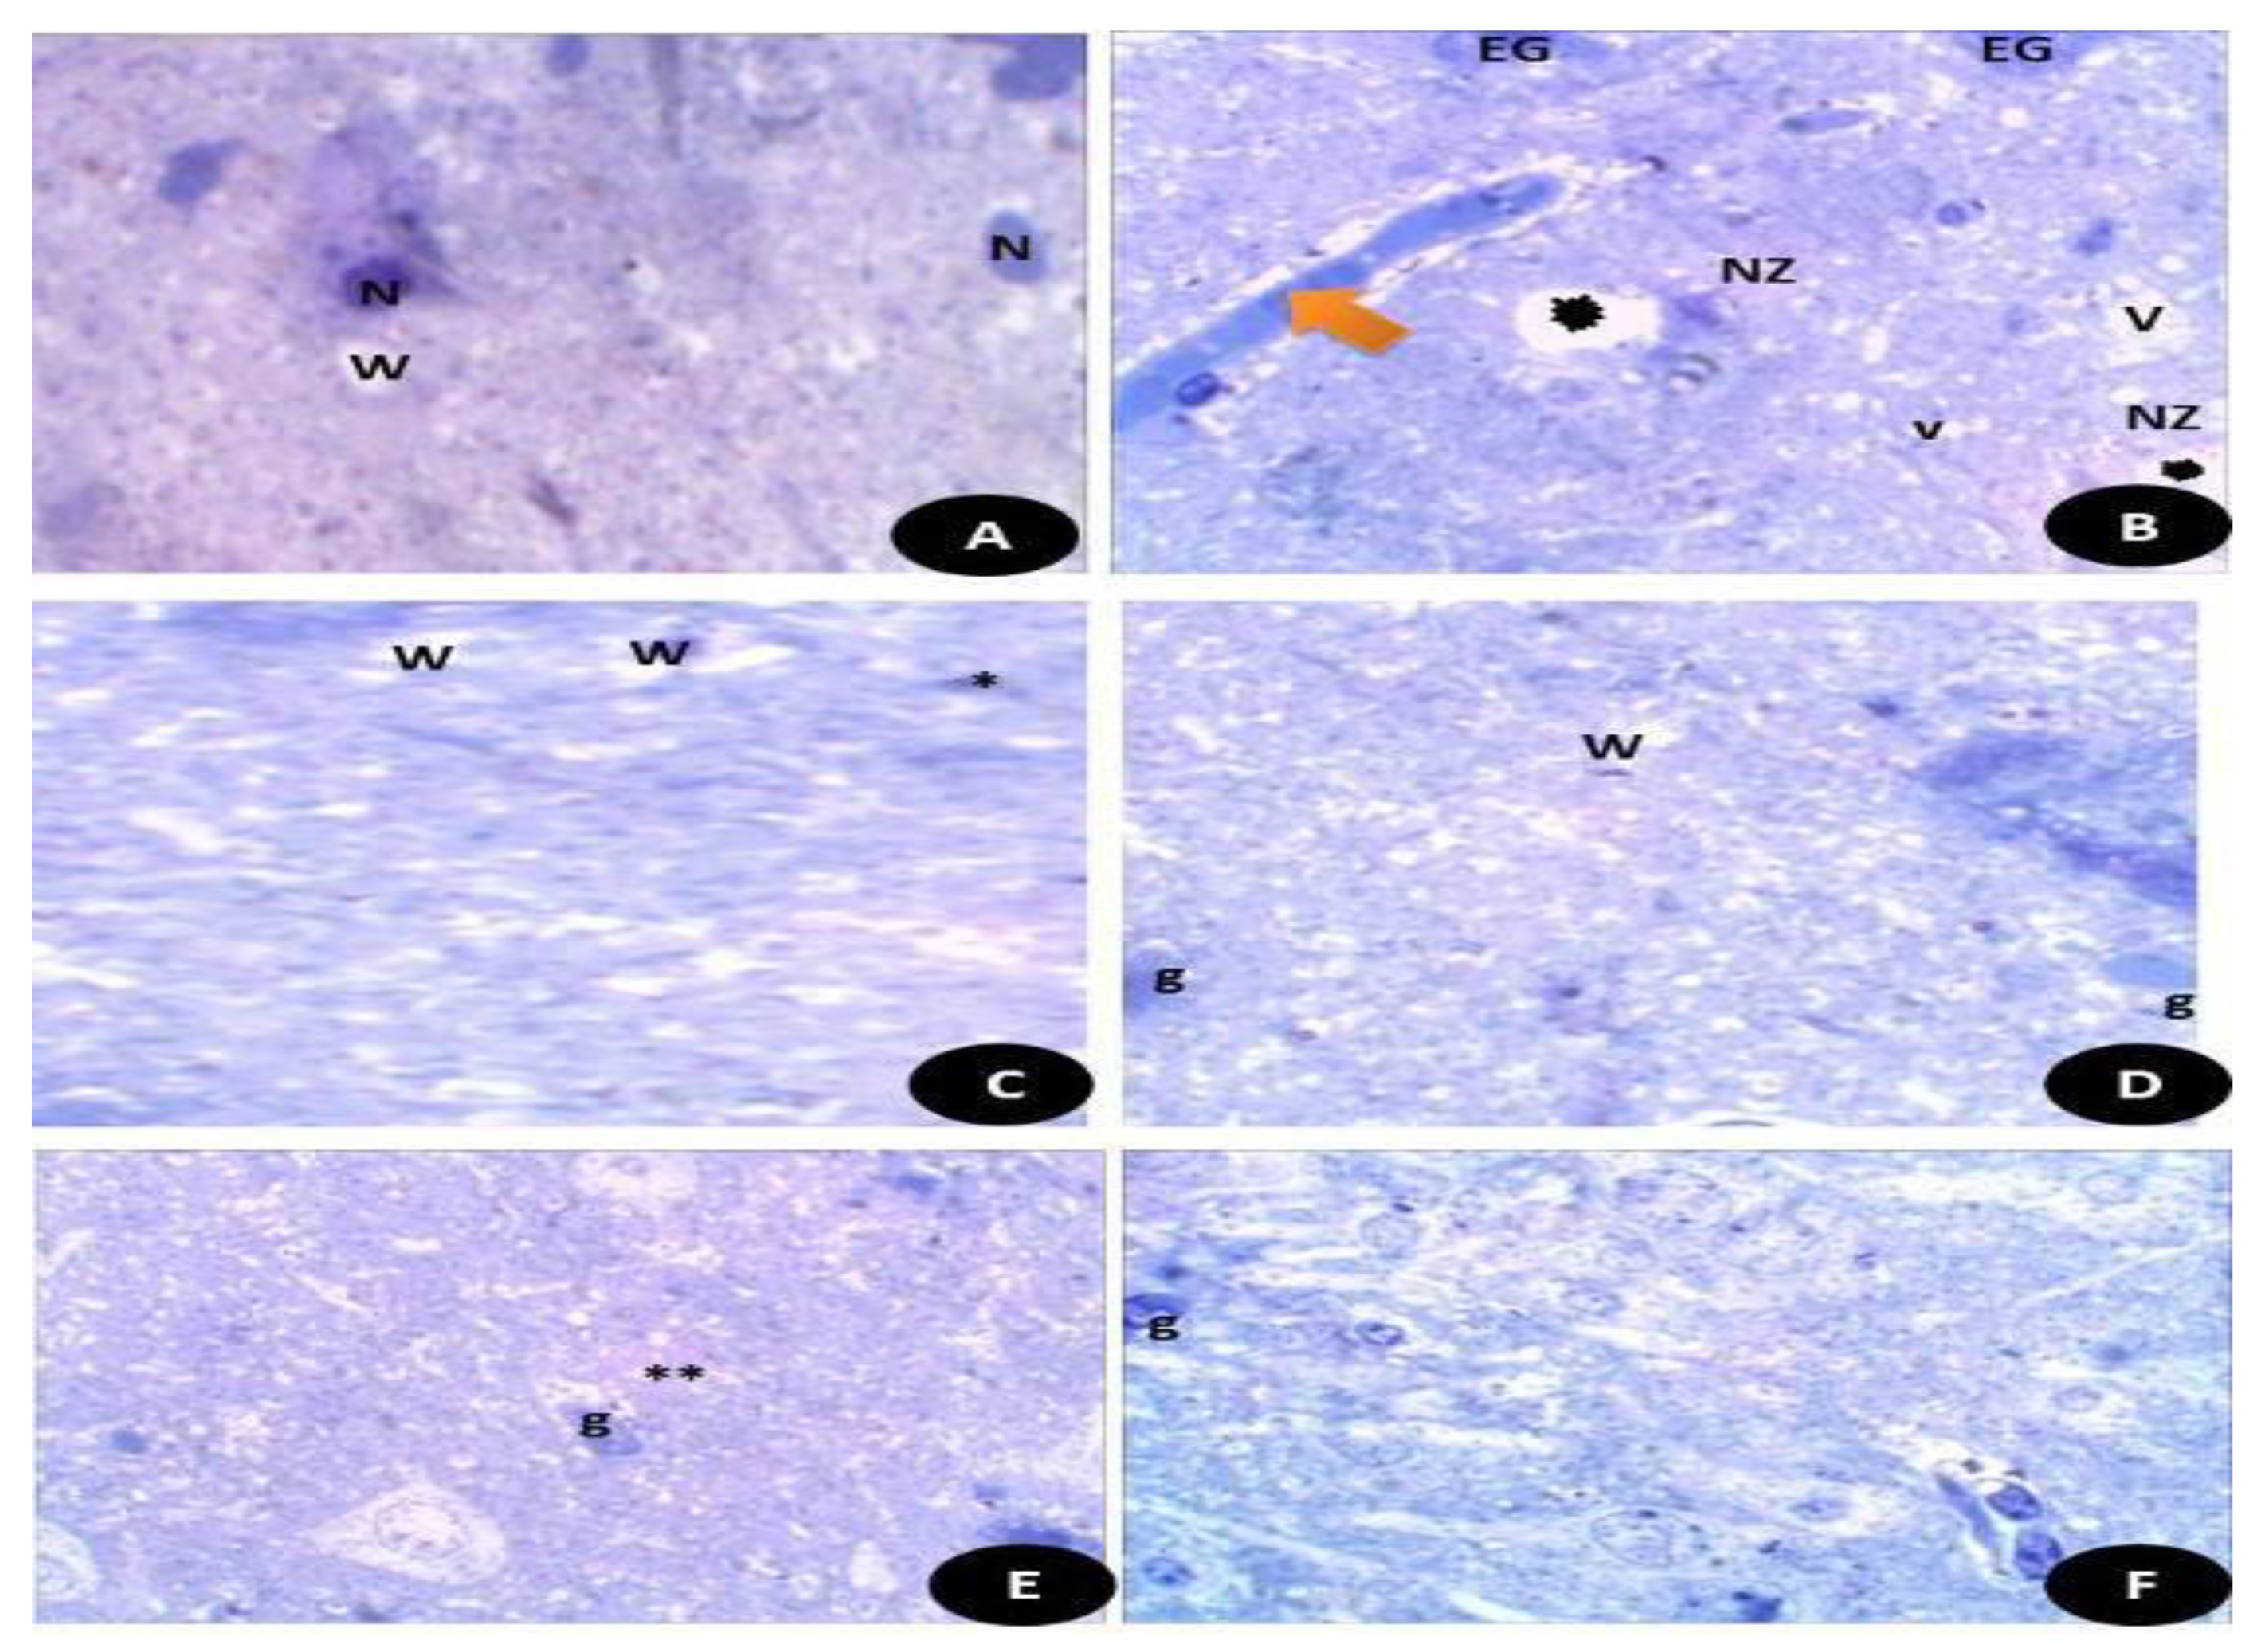
3.7.13. Semi Thin Sections of Testicular and Brain Tissues (Cerebral Cortex)

Semi thin sections of the testicular tissues (Figure 15) stained with toluidine blue stain. Figure 15A control, normal appearance of testis tissues with normal spermatogenic stages and cells with appearance of normal sperms. Figure 15B DG-treated rats highly showed degree of damage appeared by disintegration of testicular tissues with appearance of fewer sperm number. (C) Q treated group showed normal appearance of testicular section with complete stages of spermatogenesis with moderate number of sperms. (D) RuIII/Q treated group showing normal healthy appearance of testicular tissues with normal spermatogenic tissues, with high number of mature sperms. (E) DG + Q treated group showing partial restoration of testicular tissues with less spermatogenic arrest with moderate sized spermatogenic cells, and some appeared disintegrated parts with presence of myoid cells. (F) DG + RuIII/Q treated group showing high restoration of testicular tissues with complete spermatogenic cells and restoration of sperm numbers.
Semi thin sections of the brain tissues stained with toluidine blue stain. (Figure 15A) Control normal appearance of brain tissues with normal white matter (W) and neurons (N). (Figure 15B) DG- treated rats showed highly necrotic zone (NZ) and enlarged swollen glial fibers (EG) with vacuoles (V) and some detached areas. (Figure 15C) Q treated group showed normal appearance of brain tissues with normal white matters (W) and small glial fibers. (Figure 15D) RuIII/Q treated animals showed normal appearance of brain tissues with normal white matters (W) and glial fibers (E). DG + Q group showed that the brain tissues had reduced necrotic zone and normal moderate sized glial fibers (g). (Figure 15E) DG + RuIII/Q group showed the brain tissues with nearly normal appearance and mostly normal glial fibers (Figure 15F) and some swelled glial fibers with almost normal neural fibers.

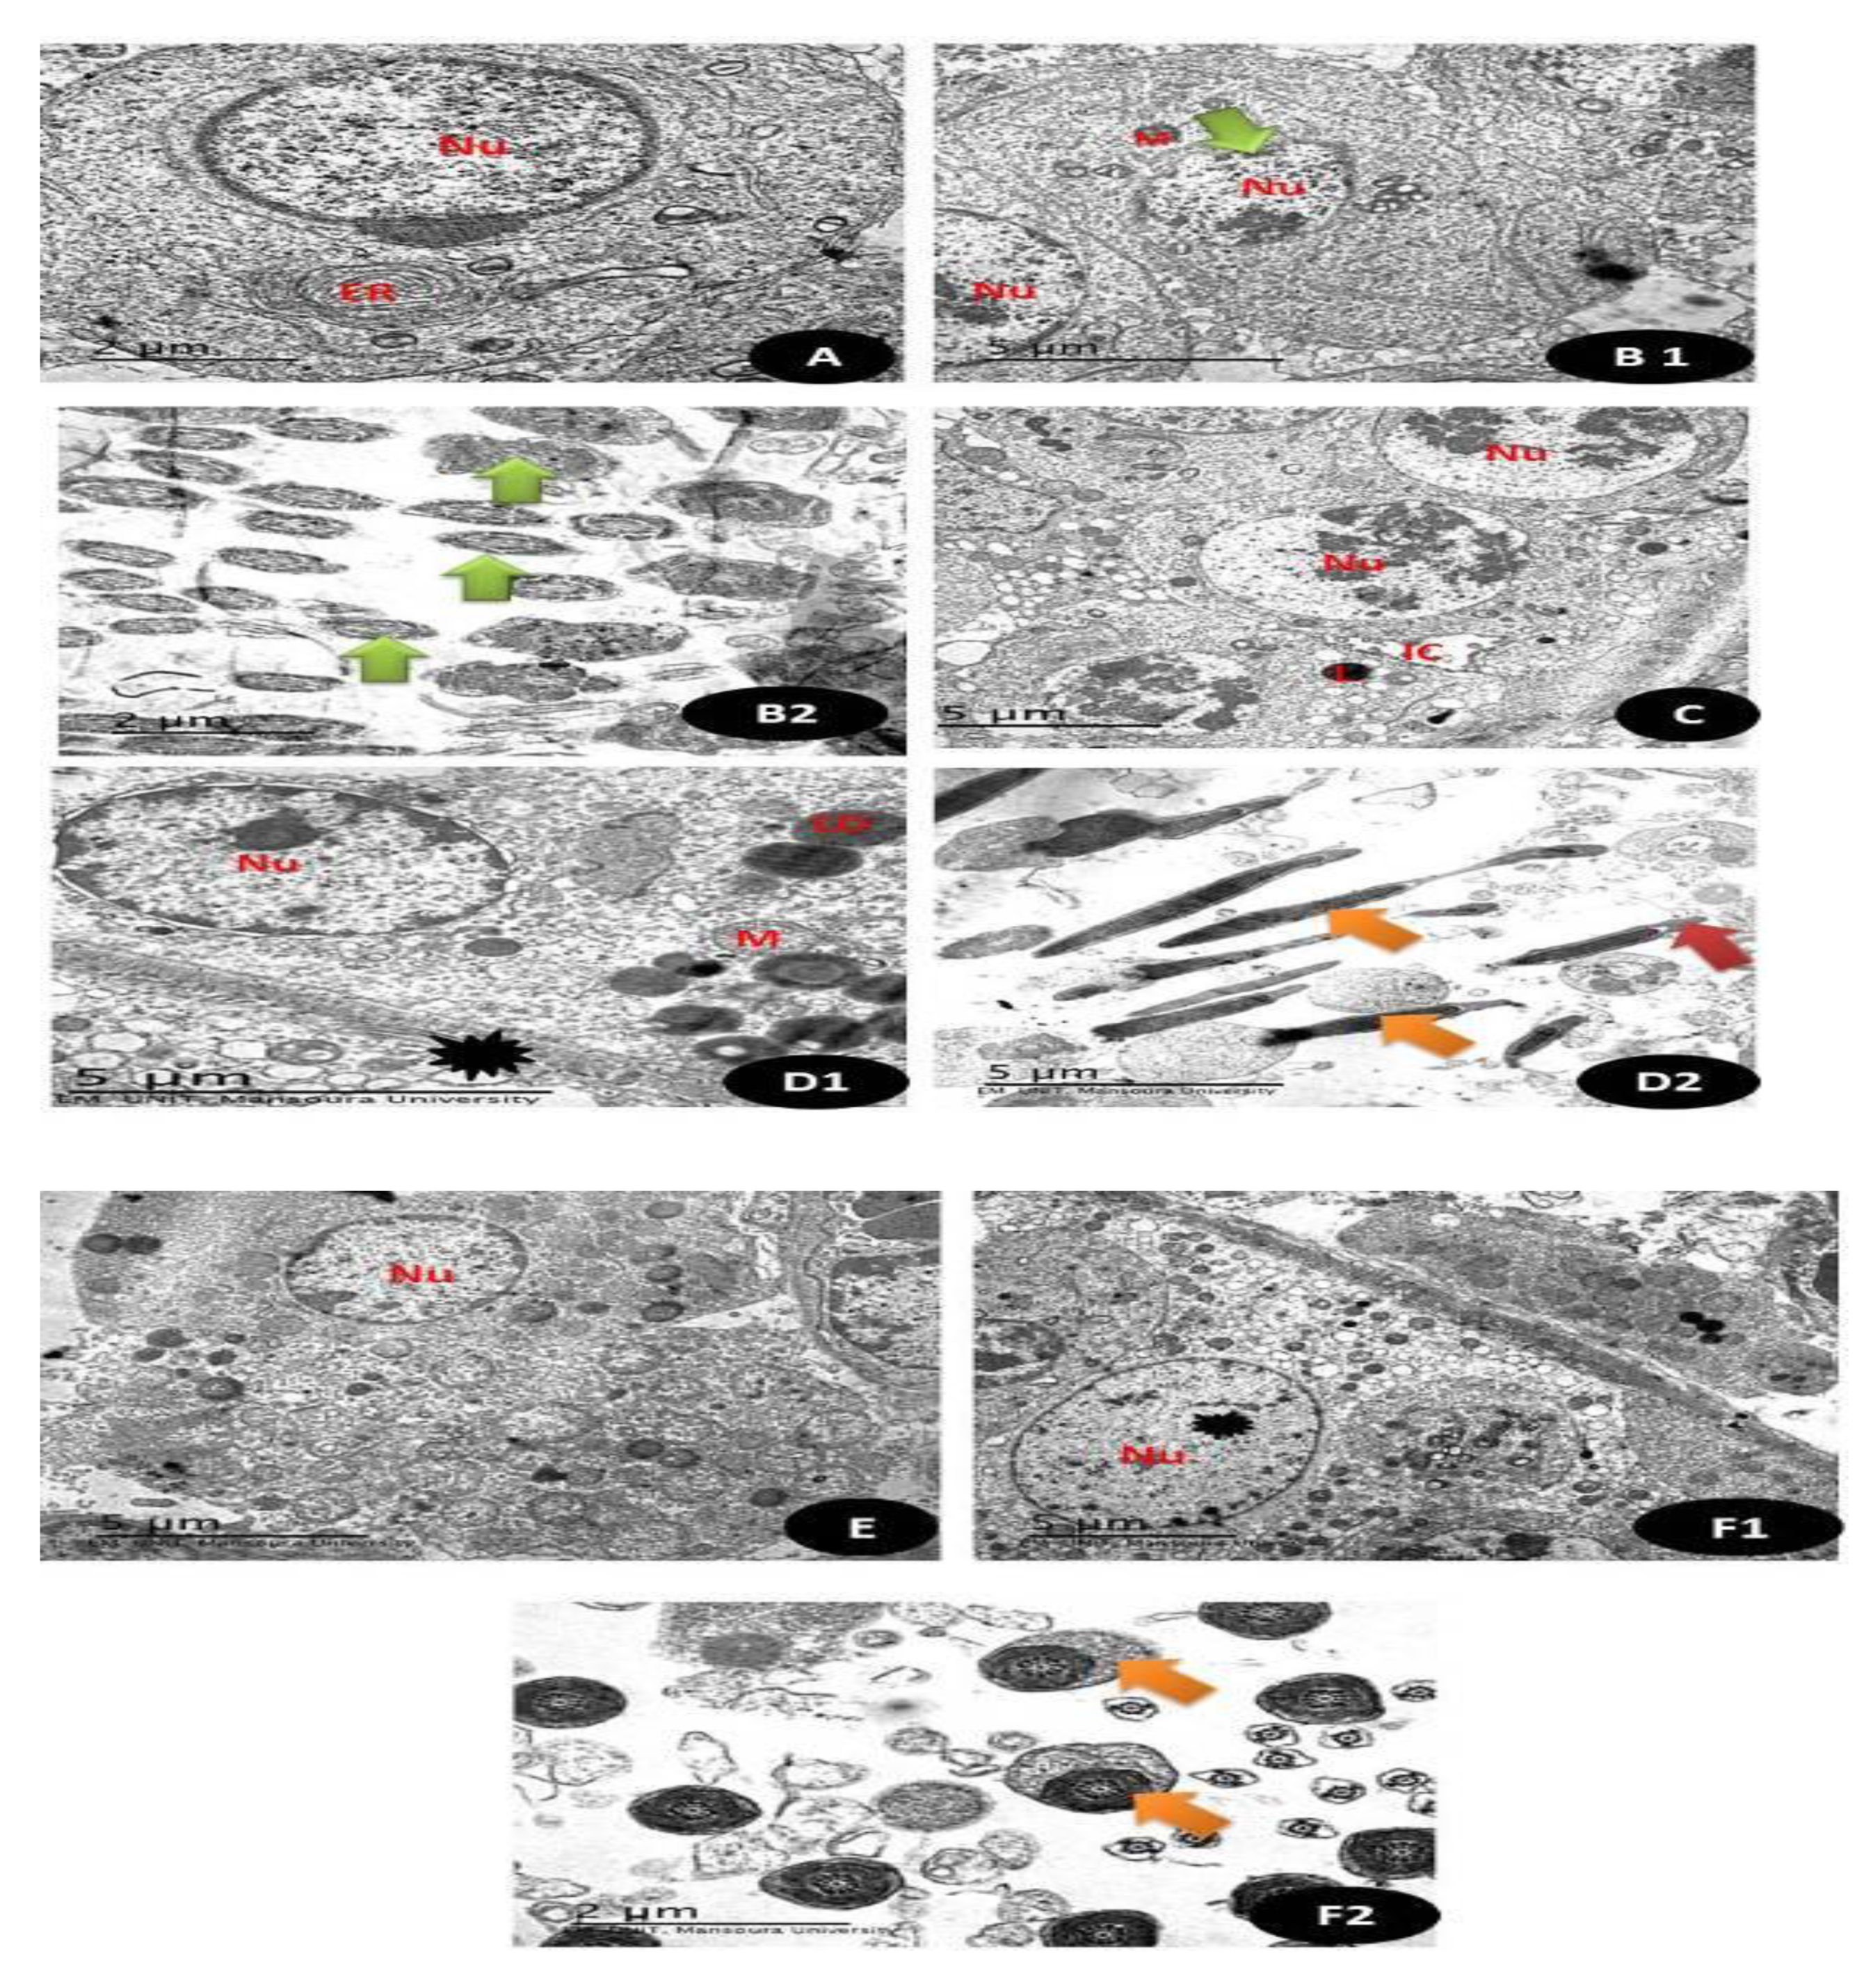
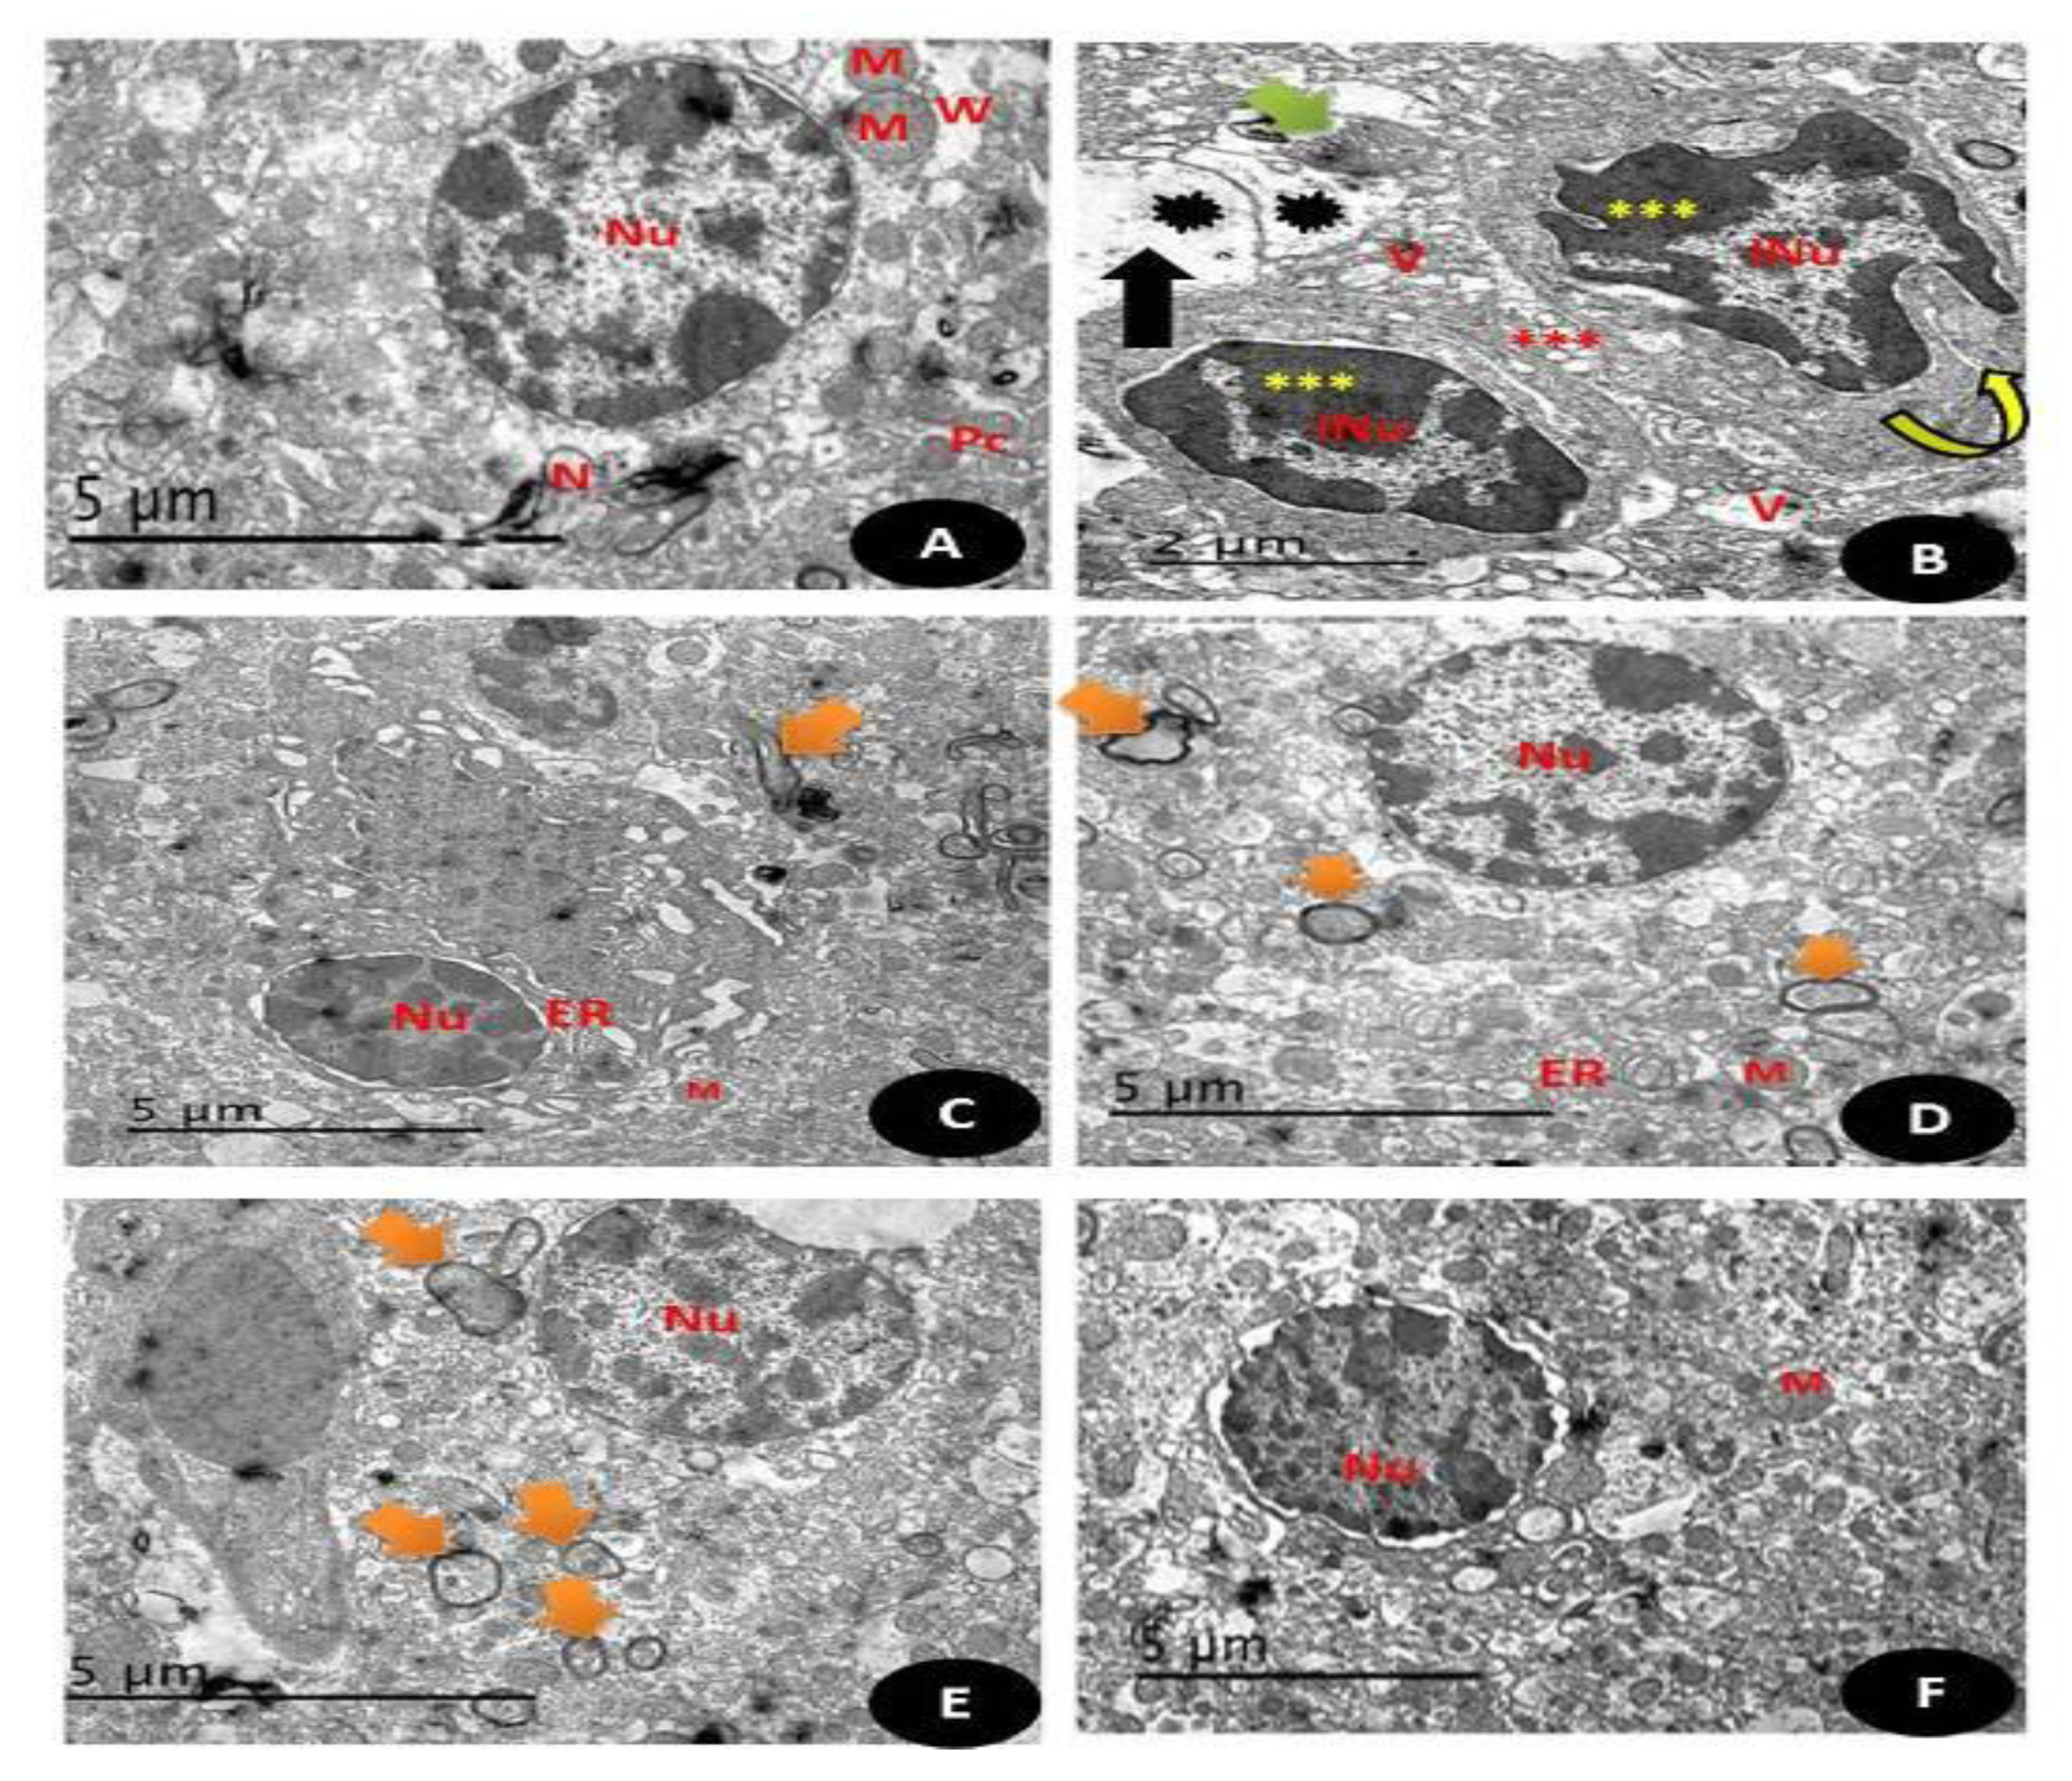
3.7.14. TEM Examination (Testicular and Brain Tissues)

TEM sections of testicular tissues in (Figure 16 and Figure 17A), Control group showing the normal appearance of spermatogonia (1ry and 2ry) with normal rounded nuclei (Nu) with normal Leydig cells (L) and normal myoid cells and normal endoplasmic reticulum (ER) are also noticed (5 µm). (Figure 16 and Figure 17(B1,B2)) TEM section of group treated with DG showing primary spermatocyte with irregular boundaries nucleus (Nu) with pyknotic nuclei with small sized mitochondria (M) and in (B2) there is distortion of the middle piece of the sperm with abnormal appearance (Green arrow) (5 µm). (Figure 16 and Figure 17C). TEM section of Q treated group showing normal appearance of the completed stages of spermatogenesis with the appearance of the normal euchromatin nucleus (Nu) with normal interstitial cells (IC) with Leydig cells (L) (5 µm). (Figure 16 and Figure 17(D1,D2)) RuIII/Q treated group showing normal appearance of seminiferous tubules with normal appearance of nucleus (Nu) and normal sized mitochondria (M) with normal sized lipid droplets (LD) and normal myoid cell (Black star), (D2) showed normal sperm sheath (Orange arrow) with intact acrosomal cap (Red arrow) (5 µm). (Figure 16 and Figure 17E). TEM sections of DG + Q treated group showing restoration of nuclear boundaries (Nu) with incomplete spermatogenic layers with restoration of sperms (5 µm). (Figure 16(F2) and Figure 17(F1)). TEM section of DG treated with novel complex of RuIII/Q showing restoration of normal composition of seminiferous tubules with the appearance of the normal rounded nucleus (Nu) (Black star) with normal appearance of myoid cells with complete stages of spermatogenic cells (5 µm), (F2) showing normal sized sperm middle piece with complete tubules (Orange arrow) (2 µm).

3.7.15. Comet Assay

The microscopic images of representative comets for the effect of DG, Q and RuIII/Q on the percentage of DNA using the comet assay. Comet images of cells derived from brain of rat of group (A) control group which showed intact nuclei and normal round cell. (B) DG showed more damaged DNA with appearance of comet hallow (White head arrow) (C) Q group showed intact DNA strands (D) RuIII/Q which showed more intact appearance DNA strands (E) DG + Q which showed amelioration of the cells as recorded less parameters in the tail length and % of damaged DNA and tail (White head arrow) (F) DG + RuIII/Q showed more percent of intact cells with undamaged DNA and less numbers of comet cell as shown in (Figures S8 and S9).

3.7.16. Mitochondrial Membrane Potential

The fluorescent detection of mitochondrial membrane potential revealed increased improvement on brain tissue (Figure 18 and Figure 19A,D,F). Treatment with either control, RuIII/Q, and DG combined with RuIII/Q showed non-accumulation of ROS in the mitochondria as they recorded the following data (0.78, 0.8, and 1.35) (50.0 µm). The DG-treated group showing high accumulation of reactive oxygen species in the mitochondria as ROS accumulation is a hallmark of oxidative cell death (50.0 µm). (Figure 18 and Figure 19E,F) treated groups with DG in combination with either Q and/or RuIII/Q showing high amelioration in mitochondrial potential with very low reactive oxygen species accumulation as they recorded the following data (3.5 and 2.5) (50.0 µm).

4. Discussion

Neurodegenerative diseases are the leading cause of disabilities in the elderly. Recent evidence suggests that oxidative stress plays a vital role in inducing aging and polyphenols act as antioxidant agents and reduce the risk of neurodegenerative diseases. Quercetin is the most important flavonoid and consumed as part of a regular diet. It has many biological properties related to its antioxidant activities.
Aging is a major factor in a number of chronic diseases, including Alzheimer’s disease (AD). For decades, it was known that central nervous system disorders involve extensive and progressive neuronal death leading to the induction of brain dysfunction [63].
Mitochondria are the major and vital intracellular sources of reactive oxygen species, which play essential roles in neurological disorders related to age. Biomolecules triggered as a result of excess ROS and increased oxidative stress disturb neuronal homeostasis, and eventually lead to neuro-cellular death [64].
Chronic administration of DG in rats is used to induce artificial senescence to model brain aging in animals and thereby evaluate the antiaging potential of pharmacological agents. Studies indicate that chronic administration of DG hastens cognitive impairment in animals. DG induces accumulative oxidative stress in the presence of galactose oxidase [63].
Every year approximately 9 million individuals are diagnosed with neurological diseases like dementia, which is an indicator of brain aging. Aging in the brain is markedly linked with the incidence of mitochondrial dysfunction, concurrent with decreased respiratory enzyme activity and ATP production; increased production of free radicals and DNA mutations; and impaired mitochondrial composition [65]. To understand the series of aging and reduce its deleterious effects on organs, an experimental model was used to mimic brain senescence using chronic administration of DG for studying anti-aging. therapeutic agents.
DG-induced brain aging not caused mitochondrial dysfunction, but also increased oxidative stress injuries, apoptosis, and inflammation and decreased neurotrophic factors [65].
These defects lead to a decline in cognitive and neural abilities. Various therapeutic approaches that act on mitochondria were assessed to measure their effectiveness in reversing brain aging. All findings were consistent with our results that DG induced severe oxidative injury by inducing structural alterations in brain and testicular tissues, as seen in histological and ultrastructural sections; decreasing antioxidant enzymes (SOD, CAT, GPx, and GRx); elevating MDA level, upregulating apoptotic factors; and increasing ROS accumulation in the mitochondria. Chronic administration of DG induced mimic case of aging, which is attributable to it being a reducing sugar [66]. When DG-rich food reaches the intestinal lumen, it is transported by Na-glucose transporter type 1 (SGLT-1) into the cellular lumen and then to the blood stream by glucose transporter type 2 (GLUT-2) [67]. Galactokinase and uridyl transferase metabolize DG into glucose, which either enters glycolysis or is stored as glycogen in hepatic and muscular tissues [68]. The uptake of DG through the blood brain barrier occurs through GLUT-1 [69]. The normal DG level in the blood is >10 mg/dL [70]. For a healthy person, the maximum recommended daily dose of DG is 50 g [71].
Treating rats with 100–500 mg/kg DG for approximately 2 months produces age-related disease. Increased lipid peroxide levels and AGE formation, histopathological alterations, and deterioration in neurocapacity were detected in DG-treated rats [6].
In this study, brain MDA levels increased in rats given DG. However, GPx and GRx levels and SOD activity decreased following DG treatment as reported [72]. Additionally, progressive accumulation of H2O2 led to decreased SOD activity. These findings indicate that DG induces significant oxidative stress in both testicular and brain tissues as indicated by elevated MDA levels and diminished activities of antioxidant enzymes.
Oversupply of DG can induce overproduction of reactive oxygen species, leading to severe mitochondrial dysfunction, inflammation, and oxidative injury in neuronal cells [73]; these findings are consistent with our results. Thus, chronic injection of DG is an established experimental method for studying aging, which caused an increase in aging markers, like “advanced glycation end products “and amyloid beta proteins. The previous finding revealed an increase in amyloid beta levels in the blood of DG-treated animals with the elevation of HCY, which are the main indicators of brain injury and Alzheimer’s disease. In this study, the RuIII/Q showed a potent beneficial biological effect against cancer cell activity, oxidative stress, inflammatory markers, and apoptotic series. The ruthenium complex displays low toxicity, is easily absorbed, and is rapidly excreted by the body and is one of the most promising antitumor drugs [74].
Thus, modulation of neurotransmitters may be a major factor in the impairment of cognitive functions of DG-treated rats [75]. In this study, treatment with our novel complex RuIII/Q increased low GABA levels and glutamate and 4-HNE activities in the brain of DG + RuIII/Q-treated rats. To date, no study investigating the effect of the RuIII/Q complex on GABA activity has been reported.
The mitochondrial apoptotic pathway plays a vital role in inducing brain aging in DG-treated rats [76]. In this study, elevated proapoptotic “Bax” and decreased antiapoptotic “Bcl-2” protein expression concurrent with elevated caspase-3 and -9 expression were detected in DG-treated rats. Both Q and/or RuIII/Q treatments decreased both caspase-3 and -9 and Bax expression and elevated Bcl-2 expression in DG- induced rats treated with either Q and/or RuIII/Q. These results indicated that both Q and/or RuIII/Q treatments exert an antiapoptotic effect on the brain of DG-treated rats. Q and/or RuIII/Q also ameliorated DG-induced histopathological changes in the brain and more amelioration was recorded in DG rats treated with RuIII/Q complex. Our results indicated that RuIII/Q may be effective in preventing the progressive development of oxidative stress, apoptosis, and histopathological deterioration in the brain of DG-treated group.
The successive release of cytochrome-c (cyt c) stimulates the apoptotic protease cascade and activates caspase-3 and thereby causing neuronal cell death [77], which is another hallmark of neuronal apoptosis, and thus, induces neuroapoptosis and neurodegeneration [78]. Our findings are consistent in that we observed elevation of cyto c in the DG-treated group and its decrease in the DG group treated with the RuIII/Q complex.
Accordingly, our results indicated that RuIII/Q novel complex treatment significantly downregulated elevated protein expression of caspase-3 and -9 and Bax, whereas it significantly upregulated the protein expression level of Bcl-2.
Moreover, we evaluated the mechanism by demonstrating that RuIII/Q prevented DG induced hepatotoxicity in vitro in HepG2 cell, DG-induced activation of the cellular apoptotic pathway was significantly reversed. Therefore, our findings indicate an additional neuroprotective mechanism of RuIII/Q against DG-induced apoptosis via suppression of the apoptotic pathway.
DG is recognized as an inducer of aging that can accelerate senescence in mice. Aging induced by DG causes cognitive deficits and histopathological lesions [79].
Studies have shown that flavonoids can prevent oxidative injury in cells incubated with H2O2. Perruchot et al. reported that flavonoids had positive effects on bovine mammary cells in vitro by regulating cell viability and antioxidant response and attenuated H2O2-induced ROS production [80].
Ma et al. [81] demonstrated that flavonoid alleviated oxidative stress caused by DG induced ROS production and lipid peroxidation and enhanced the activity of endogenous antioxidant enzymes in animals. In line with previous findings, our study revealed that RuIII/Q protected HepG2 cells against H2O2 induced oxidative stress and exerted potent anti-aging effects in the DG aging rat model. Thus, the protective effects of RuIII/Q against oxidative stress induced by H2O2 and DG may be related to the antioxidant potency of Q in addition to the novel anti-tumor activities of ruthenium metal.
During the past decades, remarkable efforts have been made to synthesize ruthenium-based anticancer drugs [82]. Q is a bioflavonoid, which is present in most fruits and vegetables, red wine, and green tea and has antioxidant activities. Q is considered a food supplement and has potent physiological health effects. Q has antioxidant, anticancer, and immunoprotective activities along with its great effects on lowering high cholesterol, diabetes, viral infections, cardiovascular diseases, and asthma [27].
Q possesses high and potent scavenging activity. Reactive oxygen species damage cellular components and DNA processing, which may lead to epigenetic modulations [27]. Our findings provide evidence of the higher potential of the RuIII/Q complex than Q alone in combating oxidative stress and elevating antioxidant capacities in testicular and brain tissues and increasing apoptotic activities in HepG2 cells and seen by the results of the MTT assay.
Q has the ability to fight against these harmful effects. Reactive oxygen species play a vital role in the development of Alzheimer’s disease. Q would be the best choice in regulating normal physiological functions [27]. The neuroprotective actions of Q are mainly due to the potential up and downregulation of cytokines through the nuclear factor (erythroid-derived like 2) (Nrf2) and protein kinase C signaling cascades and the PI3K pathway [27]. In experimental models, brain damage was induced by blocking GABA receptors and inhibiting chloride ion influx leading to the activation of neurons that may reflect negatively on brain tissues. In this study, DG decreased GABA concentration in the brain and RuIII/Q significantly ameliorated this effect, suggesting its antiaging effects.
Neuroinflammation plays a major role in neurodegenerative disorders, and thus, is an important target for therapeutic intervention [83]. Compounds that may antagonize the activation of microglia and decrease the release of cytokines would be more relevant. Our novel complex of RuIII/Q can decrease the subsequent release of cytokines and may have beneficial anti-inflammatory properties.
Quercetin has been shown to reduce lipopolysaccharide (LPS)-induced nitric oxide release from a mouse neuroglia cell line; a similar effect on HEPG2-induced cytokines was reported in the studied cell line. Additionally, Q also inhibits cytokine production by astrocytes [84]. Cellular or molecular mechanisms for the anti-inflammatory effects of Q are unknown, but a possible pathway may be related to the induction of PON2, which has anti-inflammatory activity in addition to its antioxidant activity.
The equilibrium of oxidative stress between the triggering and degradation of ROS in CNS is highly regulated [85]. Once the equilibrium is disturbed, oxidative stress is generated and accompanied with neuronal damage. H2O2 has been extensively used as an indicator of oxidative stress in in vitro models. Free radicals generated from H2O2 could react with intracellular enzymes and essential membrane lipids causing apoptosis and cellular death [86].
Cell viability is an indicator of the degree of cell injury. The results of the two indexes used in this study [86] revealed that Q could protect cell viability. Additionally, different concentrations presented different degrees of protection and the more Q was added, the higher the cell became viable, which proved that Q protects PC12 cells against oxidative injury. These finding are consistent with ours, which proved that the novel complex has more potent antioxidant activities than Q alone and lowers oxidative stress and cytotoxicity.
MDA, the production of lipid peroxide caused by free radicals, could reflect the degree of cellular injury. By contrast, SOD and GPx, which serve as the 1st and 2nd defense against apoptosis and cellular death [21], are released in cells to alleviate oxidative damage. As shown in the results, Q could elevate the sharply decreased levels of SOD and GPx by H2O2, and decrease ROS levels, which indicated that Q and our novel complex RuIII/Q can inhibit apoptosis and oxidative injury and that the protective effect was related to Q and its metal complexity.
Oxidative stress is associated with neuronal apoptosis [87]. This study reported a significant activation in mitochondrial apoptotic pathway, which confirmed the previous investigation. The combination of oxidative injury and mitochondrial membrane dysfunction allows the release of cyto c and activation of the cascade of proteins responsible for apoptosis. This is controlled by the upregulation of cyto c, caspase-3 and -9, and Bax and the downregulation of anti-apoptotic protein BCL2 in the brain of DG-treated rats. An increase in P53 levels in brain tissues of DG-treated rats, which could participate in the activation of both caspase-3 and -9, has also been reported. The increase in P53 is an indication of DNA damage and mediates caspase activation probably through the apoptosis induced factor (AIF). AIF is found in the mitochondrial interspace and released from the mitochondria in response to apoptotic signals, such as excess ROS generation [88]. Once AIF is released, it activates caspase-9 to translocate to the nucleus and induce DNA degradation [89]. Thus, RuIII/Q could act as an inhibitor of the caspase series and protect against release of AIF due to its antioxidant capacities.
Oxidative stress leads to either early or late phases of apoptosis, which are all characterized by the shedding of phosphatidylserine to the outer membrane of neural cells [89]. In this study, application of RuIII/Q ameliorated oxidative stress and significantly decreased early or late apoptosis in the brain of DG rats. This suggests that RuIII/Q could protect membranes of neural cells by preventing phospholipid peroxidation induced by O- radicals. Our data demonstrated that Q/Ru prevented increase of IL-6 and TNF-α more efficiently than Q alone, which might lead to a decrease in aging series in DG-treated rats. These observations agree with previous findings on the effect of Q, which effectively decreased inflammatory cytokines in rats with brain injury [27]. Cytotoxicity of the complex of Ru against HepG-2, A549, and HeLa cells were evaluated in vitro. The Ru(II) complex exhibited moderate activity on cell proliferation [74], contrary to our results the novel synthesized RuIII/Q complex induced high activity on cellular proliferation. Oxidative injury is an imbalance between the production of reactive oxygen species and antioxidant defense mechanisms of the biological system and all trials are undertaken to find potent antioxidant to repair this damage [90].
Reactive oxygen species, referred to as the generation of the free radicals, causes a redox imbalance by considerably damaging all cellular components, including DNA. Oxidative injury is involved in the incidence of most of human diseases, such as neurodegeneration and diabetes, and aging [91].
Reactive oxygen species mainly affect neurotransmitters present in the brain. Additionally, the brain represents an essential oxidative stress source, as metabolism in the brain acts as a “factory” of reactive oxygen species, which attack the neurons, and thus, to the incidence of neuronal damage and severe oxidative damage [92]. This finding confirmed the damaging series induced by DG in male rats and proved the ameliorative role of the novel complex (RuIII/Q) in alleviating the damaging effects of aging. Antioxidants are vital potent compounds that can capture free radicals either by inclusion of cellular antioxidant enzymes, such as Cu-ZnSOD and GPx, or non-enzymatically. Q is a potent flavonoid present in many foods and vegetables, including berries, peanuts, onion, apples, and broccoli. In food, quercetin is deglycosylated to quercetin aglycone before it is absorbed by the intestine [93]. Q is acts as an antioxidant in preventing oxidative injury and is a more active antioxidant compared with other antioxidants, because Q is an outcome of two antioxidant pharmacophores and the Q configuration is optimal for scavenging free radicals [25]. Additionally, Q protects against hepatic damage by inhibiting the overexpression of the NO synthase [94] in HepG2 cells.
Nrf2 plays important roles in the control of cellular oxidant balance and mitochondrial potential function, probably because Nrf2 is the master regulator of the antioxidant response [95]. Saw et al. [96] studied the effect of Q, which is abundant in berries, in cancer prevention. Results from the DPPH assay confirmed that Q has high free radical scavenging potential. Treatment with Q inhibited cellular growth and elevated Nrf2 expression. Additionally, analysis of Nrf2 levels on RT-PCR demonstrated that Nrf2 is transcriptionally active, thereby proving the effectiveness of the novel RuIII/Q complex as a potent anti-inflammatory agent, more than Q alone.
Ramyaa et al. [97] reported the cytoprotective effects of Q against ochratoxin-A, which induces oxidative damage. OTA-induced generation of reactive oxygen species and activation of NF-κB greatly affect HepG2 cells pretreated with Q with high calcium release.
Q-induced translocation of “Nrf-2” into the nucleus upon oxidative injury and its following expression and these finding are consistent with our results. Alzheimer’s disease is a chronic neurodegenerative disease that progresses with age.
Pathological studies on Alzheimer’s disease have revealed extracellular aggregation of senile plaques (SPs) and lesions in cholinergic neuron [98]. In the cholinergic system, numerous neurotransmitters function in learning and memory.
Additionally, “amyloid-β peptide” aggregation is considered the main cause of neurodegeneration and neurodiseases [99]. Other pathological mechanisms are demonstrated in relation to Alzheimer’s diseases, such as the impairment of neural circulation and angiopathy of cerebral amyloid. Thus, these pathological anomalies are considered to cause Alzheimer’s disease as vital and essential targeting drug towards neurological alterations [100]. Mounting evidence suggests that dietary and nutrient control can minimize the rising of neurological disease, especially Alzheimer’s disease, and these finding proved our results that indicated aggregation of Aβ in the DG-treated group with histopathological and ultrastructural alterations in the brain tissues and elevation of brain damage markers in DG-treated group and its reduction in DG combined treatment with RuIII/Q. There is a growing evidence which confirms that DG induces oxidative injury, especially in the mitochondria, of brain tissues [101]. When there is an increase in the concentration of DG, it is oxidized by galactose oxidase to form “H2O2”, leading to a decrease in (SOD) [102]. Increased “H2O2” reacts with a reduced form of “Fe” to form “OH”. H2O2 and OH are types of reactive O that cause lipid peroxidation in cell membranes and impair redox homeostasis, which eventually leads to the incidence of oxidative damage [102]. Thus, oxidative stress is induced by DG on testicular tissues, reduces sperm numbers and RuIII/Q alleviates this oxidative stress.
Additionally, DG reacts with some amines and forms an unstable compound known as “Schiff’s base products”, which undergoes several reactions to form a more stable compound known as “Amadori product”, which in turn converts irreversibly into advanced glycation end product (AGE) [102]. In this study, AGE was shown to cause severe damage induced by DG on several tissues. The results of our study indicated that RuIII/Q has a protective effect against DG neurotoxicity, testicular toxicity, and hepatotoxicity in male rats by alleviating lipid peroxidation, increasing the activity of antioxidant enzymes, and alleviating inflammatory responses.

5. Conclusions

In conclusion, results from this study provided clear evidence that support the potent ameliorative effects of RuIII/Q against neuroinflammation, testicular oxidative injury, and HepG2 cytotoxicity. The results demonstrate that DG induced severe neuroinflammation with appearance of irregular and discontinuous myelinated sheath and large area of hemorrhage, testicular damage with appearance of pyknotic nuclei and reduction in speramtogenc layers, more Geneotoxicity with large tail length in the commet assay and more viable HepG2.The novel RuIII/Q complex alleviated oxidative injury and cytotoxicity induced by DG. The modifications induced by DG-mediated neuroinflammation represent the imbalance that contributes to energy metabolism and immune response in neurodegenerative diseases. Mitochondrial membrane potential is an early marker of cellular apoptosis. The RuIII/Q complex exhibited multiple therapeutic benefits, such as reducing oxidative stress; reducing HepG2 cell viability; significantly inhibiting the expression of mTOR, PI3K, RALA, and c-MET signaling pathway genes; upregulating Nrf2, Cu-ZnSOD, CAT, and GPx expression in testicular tissue and brain homogenates; alleviating testicular and brain toxicity, as seen by the more intact appearance of DNA strands and suppressing neuroinflammation in the DG group. Treatment of the DG group with Q elicited restoration of damaged mylinated neurons in the brain tissues but with some swelling, induced less DNA damage with less tail length and restoration of large percent of spermatogenic layers with moderate expression of cellular apoptosis markers, whereas the treatment of DG group with RuIII/Q elicited more improvement in both brain and testicular tissues, more improvement and restoration of mylinated neurons, complete spermatogenic layers, undamaged DNA and more inhibition of markers of cellular apoptosis. These findings suggested potent therapeutic activities of RuIII/Q for treating oxidative injury-related diseases through the mitochondrial pathway and showed remarkable effectiveness in improving redox states of the brain and testis, inhibiting apoptosis, and down regulating cytokines in addition to its hepatic anticancer activities, without eliciting any side effects associated with standard therapies. Our data were proven by histological and electron microscopy examination of both brain and testicular tissues.

Supplementary Materials

The following are available online at https://www.mdpi.com/article/10.3390/cryst11040367/s1, Table S1: HepG2 cell viability after treatment with serial concentrations of RuIII/Q, Q, and D-galactose; Table S2: Histological activity index (HAI) was assessed based on the degree of microscopic lesions in testis tissues as the effect of DG and Q and/or RuIII/Q separately or in combination; Table S3: Histological activity index (HAI) was assessed based on the degree of microscopic lesions in brain tissues as the effect of DG and Q and/or RuIII/Q separately or in combination. Figure S4: HepG2 cell viability after treatment with serial concentrations of RuIII/Q, Q, and DG; Figure S5: Apoptotic effect (FITC-Annexin V) in control and treatment with RuIII/Q, Q and DG of HepG2 cells. Upper left quadrant shows necrosis (cell debris), upper right quadrant shows late apoptotic cells. Viable cells are detected in the lower left quadrant and early apoptosis is detected in the lower right quadrant. Mean ± S.D. for three independent tests. Figure S6: Representative flow cytometric histogram on percentage of P53 and Bax expression in HepG2 cells; Figure S7. Effect of DG, Q and RuIII/Q alone or either combined on HCY, Amyloid Beta and GABA levels; Figure S8: The microscopic images of representative comets for the effect of DG, Q and RuIII/Q on the percentage of DNA using the comet assay. Comet images of cells derived from the brain of rat of group (A) control group which showed intact nuclei and normal round cell. (B) DG showed more damaged DNA with appearance of comet hallow (White head arrow) (C) Q group showed intact DNA strands (D) RuIII/Q which showed more intact appearance DNA strands (E) DG + Q which showed amelioration of the cells as recorded less parameters in the tail length and % of damaged DNA and tail (White head arrow) (F) DG+RuIII/Q showed more percent of intact cells with undamaged DNA and less numbers of comet cell; and Figure S9: The effect of DG, Q and RuIII/Q on the percentage of DNA Damage by using the comet assay.

Author Contributions

Conceptualization, M.S.R.; R.Z.H.; A.M.A.A.; H.A.S.; T.A.A.; A.A.G.; H.A.S.; F.A.A.-S. and S.M.E.-M.; methodology, M.S.R.; T.A.A.; R.Z.H. and S.M.E.-M.; software, M.S.R.; R.Z.H. and S.M.E.-M.; validation, M.S.R.; R.Z.H.; A.M.A.A.; H.A.S.; A.A.G.; H.A.S.; F.A.A.-S. and S.M.E.-M.; formal analysis, M.S.R.; R.Z.H.; A.M.A.A.; H.A.S.; A.A.G.; H.A.S.; F.A.A.-S. and S.M.E.-M.; investigation, M.S.R.; R.Z.H. and S.M.E.-M.; resources, M.S.R.; R.Z.H.; A.M.A.A.; H.A.S.; A.A.G.; H.A.S.; F.A.A.-S. and S.M.E.-M.; data curation, M.S.R.; R.Z.H. and S.M.E.-M.; writing—original draft preparation, M.S.R.; R.Z.H.; A.M.A.A.; H.A.S.; T.A.A.; A.A.G.; H.A.S.; F.A.A.-S. and S.M.E.-M.; visualization, M.S.R.; R.Z.H.; T.A.A.; A.M.A.A.; H.A.S.; A.A.G.; H.A.S.; F.A.A.-S. and S.M.E.-M.; supervision, M.S.R.; R.Z.H. and S.M.E.-M.; project administration, M.S.R.; T.A.A.; R.Z.H.; A.M.A.A.; H.A.S.; A.A.G.; H.A.S.; F.A.A.-S. and S.M.E.-M.; funding acquisition, M.S.R.; R.Z.H.; A.M.A.A.; H.A.S.; A.A.G.; H.A.S.; F.A.A.-S. and S.M.E.-M. All authors have read and agreed to the published version of the manuscript.

Funding

This work was funded by the grant from Deanship of Scientific Research, Taif University, Saudi Arabia under Research Group project Grants No. 6144-440-1.

Institutional Review Board Statement

Experiments on animals were performed by following guidelines of the ethics committee of Zagazig University for Animal Use “ZU-IACUC” approval number: (ZU-IACUC/1/F/41I2018).

Informed Consent Statement

Not applicable.

Data Availability Statement

The data used to support the findings of this study are included within the article.

Acknowledgments

This work was supported by grants from Deanship of Scientific Research, Taif University, Saudi Arabia under Research Group project Grants No. 6144-440-1.

Conflicts of Interest

The authors declare no conflict of interest.

References

  1. Betteridge, D.J. What is oxidative stress? Metabolism 2000, 49, 3–8. [Google Scholar] [CrossRef]
  2. Schieber, M.; Chandel, N.S. ROS function in redox signaling and oxidative stress. Curr. Biol. 2014, 24, R453–R462. [Google Scholar] [CrossRef] [PubMed] [Green Version]
  3. Sies, H. Hydrogen peroxide as a central redox signaling molecule in physiological oxidative stress: Oxidative eustress. Redox Biol. 2017, 11, 613–619. [Google Scholar] [CrossRef] [PubMed]
  4. Jones, D.P. Redefining oxidative stress. Antioxid. Redox Signal. 2006, 8, 1865–1879. [Google Scholar] [CrossRef]
  5. Bin, G.; Qing, G.; Zhan, W.; Shao, J.-B.; Liu, K.; Du, Z.-D.; Gong, S.-S. D-Galactose-induced oxidative stress and mitochondrial dysfunction in the cochlear basilar membrane: An in vitro aging model. Biogerontology 2020, 21, 311–323. [Google Scholar]
  6. Al-Baqami, N.M.; Hamza, R.Z. Synergistic antioxidant capacities of vanillin and chitosan nanoparticles against reactive oxygen species, hepatotoxicity, and genotoxicity induced by aging in male Wistar rats. Hum. Exp. Toxicol. 2021, 40, 183–202. [Google Scholar] [CrossRef] [PubMed]
  7. Barnham, K.J.; Masters, C.L.; Bush, A.I. Neurodegenerative diseases and oxidative stress. Nat. Rev. Drug Discov. 2004, 3, 205–214. [Google Scholar] [CrossRef]
  8. Karasek, M. Melatonin, human aging, and age-related diseases. Exp. Gerontol. 2004, 3, 1723–1729. [Google Scholar] [CrossRef]
  9. Sampath, K.; Sathiyaraj, S.; Jayabalakrishnan, C. Evaluation of DNA-binding, DNA cleavage, antioxidant and cytotoxic activity of mononuclear ruthenium(II) carbonyl complex of benzaldehyde 4-phenyl-3-thiosemicarbazones. Spectrochim. Acta Part A Mol. Biomol. Spectrosc. 2013, 115, 287–296. [Google Scholar] [CrossRef]
  10. Carlotti, M.E.; Sapino, S.; Ugazio, E.; Caron, G. On the complexation of quercetin with methyl-b-cyclodextrin: Photostability and antioxidant studies. J. Incl. Phenom. Macrocycl. Chem. 2011, 70, 81–90. [Google Scholar] [CrossRef]
  11. Pinelo, M.; Manzocco, L.; Nunez, M.J.; Nicoli, C. Solvent effect on quercetin antioxidant capacity. Food Chem. 2004, 88, 201–207. [Google Scholar] [CrossRef]
  12. Calabrò, M.L.; Tommasini, S.; Donato, P.; Raneri, D.; Stancanelli, R.; Ficarra, P.; Ficarra, R.; Costa, C.; Catania, S.; Rustichelli, C.; et al. Effects of a- and b-cyclodextrin complexation on the physico-chemical properties and antioxidant activity of some 3-hydroxyflavones. J. Pharm. Biomed. Anal. 2004, 35, 365–377. [Google Scholar] [CrossRef]
  13. Rezende, B.A.; Cortes, S.F.; de Sousa, F.B.; Lula, I.S.; Schmitt, M.; Sinisterra, R.D.; Lemos, V.S. Complexation with b-cyclodextrin confers oral activity on the flavonoid dioclein. Int. J. Pharm. 2009, 367, 133–139. [Google Scholar] [CrossRef] [PubMed]
  14. Mielcarek, J. Photochemical stability of the inclusion complexes formed by modified 1,4-dihydropyridine derivatives with b-cyclodextrin. J. Pharm. Biomed. Anal. 1997, 15, 681–686. [Google Scholar] [CrossRef]
  15. Albini, A.; Fasani, E. Photochemistry of drugs: An overview and practical problems. In Drugs: Photochemistry and Photostability; Albini, A., Fasani, E., Eds.; The Royal Society of Chemistry: Cambridge, UK, 1998; pp. 1–74. [Google Scholar]
  16. Xie, X.; Shen, Q.; Cao, L.; Chen, Y.; Ma, L.; Xiao, Q.; Yu, C.; Fu, Z. Depression caused by long-term stress regulates premature aging and is possibly associated with disruption of circadian rhythms in mice. Physiol. Behav. 2019, 199, 100–110. [Google Scholar] [CrossRef]
  17. Azam, M.; Warad, I.; Al-Resayes, S.; Shakir, M.; Ullah, M.F.; Ahmad, A.; Sarkar, F.H. A novel Ru (II) complex derived from hydroxydiamine as a potential antitumor agent: Synthesis and Structural Characterization. Inorg. Chem. Commun. 2012, 20, 252–258. [Google Scholar] [CrossRef]
  18. Ahn, G.-O.; Botting, K.J.; Patterson, A.V.; Ware, D.C.; Tercel, M.; Wilson, W.R. Radiolytic and cellular reduction of a novel hypoxia-activated cobalt (III) prodrug of a chloromethylbenzindoline DNA minor groove alkylator. Biochem. Pharmacol. 2006, 71, 1683–1694. [Google Scholar] [CrossRef]
  19. Levina, A.; Mitra, A.; Lay, P.A. Recent developments in ruthenium anticancer drugs. Metallomics 2009, 1, 458–470. [Google Scholar] [CrossRef]
  20. Anthony, E.J.; Bolitho, E.M.; Bridgewater, H.E.; Carter, O.W.L.; Donnelly, J.M.; Imberti, C.; Lant, E.C.; Lermyte, F.; Needham, R.J.; Palau, M.; et al. Metallodrugs are unique: Opportunities and challenges of discovery and development. Chem. Sci. 2020, 11, 12888–12917. [Google Scholar] [CrossRef]
  21. Hamza, R.Z.; Diab, A.A. Testicular protective and antioxidant effects of selenium nanoparticles on Monosodium glutamate-induced testicular composition alterations in male mice. Toxicol. Rep. 2020, 7, 254–260. [Google Scholar] [CrossRef]
  22. Uttara, B.; Singh, A.V.; Zamboni, P.; Mahajan, R.T. Oxidative stress and neurodegenerative diseases: A review of upstream and downstream antioxidant therapeutic options. Curr. Neuropharmacol. 2009, 7, 65–74. [Google Scholar] [CrossRef] [Green Version]
  23. Gilgun-Sherki, Y.; Melamed, E.; Offen, D. Oxidative stress induced-neurodegenerative diseases: The need for antioxidants that penetrate the blood brain barrier. Neuropharmacology 2001, 40, 959–975. [Google Scholar] [CrossRef]
  24. Guo, Y.; Bruno, R.S. Endogenous and exogenous mediators of quercetin bioavailability. J. Nutr. Biochem. 2015, 26, 201–210. [Google Scholar] [CrossRef]
  25. Choi, Y.J.; Kang, J.S.; Park, J.H.Y.; Lee, Y.J.; Choi, J.S.; Kang, Y.H. Polyphenolic flavonoidsdiffer in their antiapoptotic efficacy in hydrogen peroxide-treated humanvascular endothelial cells. J. Nutr. 2003, 133, 985–991. [Google Scholar] [CrossRef] [Green Version]
  26. Hamza, R.Z.; AL-Thubiti, E.H.; Abd Al-Kader, S. The Antioxidant Activity of Quercetin and its Effect on Acrylamide Hepatotoxicity in Liver of Rats. Lat. Am. J. Pharm. 2019, 38, 2057–2062. [Google Scholar]
  27. Zaplatic, E.; Bule, M.; Shah, S.Z.A.; Uddin, M.S.; Niaz, K. Molecular mechanisms underlying protective role of quercetin in attenuating Alzheimer’s disease. Life Sci. 2019, 224, 109–119. [Google Scholar] [CrossRef] [PubMed]
  28. Zribi, N.; Chakroun, N.F.; Abdallah, F.B.; Elleuch, H.; Sellami, A.; Gargouri, J.; Rebai, T.; Fakhfakh, F.; Keskes, L.A. Effect of freezing–thawing process and quercetin on human sperm survival and DNA integrity. Cryobiology 2012, 65, 326–331. [Google Scholar] [CrossRef]
  29. Silva, E.C.; Cajueiro, J.F.; Silva, S.V. Effect of antioxidants resveratrol and quercetin on in vitro evaluation of frozen ram sperm. Theriogenology 2012, 77, 1722–1726. [Google Scholar] [CrossRef]
  30. Thuwanut, P.; Chatdarong, K.; Johannisson, A. Cryopreservation of epididymal cat spermatozoa: Effects of in vitro antioxidative enzymes supplementation and lipid peroxidation induction. Theriogenology 2010, 73, 1076–1087. [Google Scholar] [CrossRef]
  31. Dhanya, G.; Uma Maheswari, P.; MeeraSheriffa Begum, K.M. Synergic formulation of onion peel quercetin loaded chitosan-cellulose hydrogel with green zinc oxide nanoparticles towards controlled release, biocompatibility, antimicrobial and anticancer activity. Int. J. Biol. Macromol. 2019, 132, 784–794. [Google Scholar]
  32. Refat, M.S.; Hamza, R.Z.; Adam, A.M.A.; Saad, H.A.; Gobouri, A.A.; Al-Salmi, F.A.; Altalhi, T.; El-Megharbel, S.M. Synthesis of N,N′-bis(1,5-dimethyl-2-phenyl-1,2-dihydro-3-oxopyrazol-4-yl) sebacamide that ameliorate osteoarthritis symptoms and improve bone marrow matrix structure and cartilage alterations induced by monoiodoacetate in the rat model: “Suggested potent anti-inflammatory agent against COVID-19”. Hum. Exp. Toxicol. 2021, 40, 325–341. [Google Scholar] [PubMed]
  33. Zhang, Z.F.; Fan, S.H.; Zheng, Y.L. Purple sweet potato color attenuates oxidative stress and inflammatory response induced by D-galactose in mouse liver. Food Chem. Toxicol. 2009, 47, 496–501. [Google Scholar] [CrossRef]
  34. Kalantari, H.; Foruozandeh, H.; Khodayar, M.J.; Siahpoosh, A.; Saki, N.; Kheradmand, P. Antioxidant and hepatoprotective effects of Capparis spinosa L. fractions and Quercetin on tert-butyl hydroperoxide- induced acute liver damage in mice. J. Tradit. Complementary Med. 2018, 8, 120–127. [Google Scholar] [CrossRef]
  35. Ohkawa, H.; Ohishi, N.; Yagi, K. Assay for lipid peroxides in animal tissues by thiobarbituric acid reaction. Anal. Biochem. 1979, 95, 351. [Google Scholar] [CrossRef]
  36. Marklund, S.; Marklund, G. Involvement of the superoxide anion radical in the autoxidation of pyrogallol and a convenient assay for superoxide dismutase. Europ. J. Biochem. 1974, 47, 469–474. [Google Scholar] [CrossRef] [PubMed]
  37. Aebi, H. Catalase in vitro. Meth. Enzymol. 1984, 105, 121–126. [Google Scholar]
  38. Couri, D.; Abdel-Rahman, M.S. Effect of chlorine dioxide and metabolites on glutathione-dependent system in rat, mouse and chicken blood. J. Environ. Pathol. Toxicol. 1980, 3, 451–460. [Google Scholar]
  39. Hafeman, D.G.; Sunde, R.A.; Hoekstra, W.G. Effect of dietary selenium on erythrocyte and liver glutathione peroxidase in the rat. J. Nutrit. 1974, 104, 580–587. [Google Scholar] [CrossRef] [PubMed]
  40. Wright, H.L.; Moots, R.J.; Bucknall, R.C.; Edwards, S.W. Review Neutrophil function in inflammation and inflammatory diseases. Rheumatology 2010, 49, 1618–1631. [Google Scholar] [CrossRef] [Green Version]
  41. Gabe, M. Techniques Histologiques [Histological Techniques]; Masson Publisher: Paris, France, 1968. [Google Scholar]
  42. Weakley, B.; Beginner, S. Handbook in Biological Transmission Electron Microscopy, 2nd ed.; Churchill Livingstone: London, UK, 1981. [Google Scholar]
  43. Collins, A.R.; Dunsinka, M. Oxidation of cellular DNA measured with the comet assay. In Methods in Molecular Biology: Oxidative Stress Biomarkers and Antioxidant Protocols; Armstrong, D., Ed.; Humana Press: Totowa, NJ, USA, 2002; pp. 147–159. [Google Scholar]
  44. Donato, M.T.; Tolosa, L.; Gómez-Lechón, M.J. Culture and functional characterization of human hepatoma HepG2 cells. In Protocols in In Vitro Hepatocyte Research. Methods in Molecular Biology (Methods and Protocols); Humana Press: New York, NY, USA, 2015; pp. 77–93. [Google Scholar]
  45. Riss, T.L.; Moravec, R.A.; Niles, A.L.; Duellman, S.; Benink, H.A.; Worzella, T.J.; Lisa, M. Cell viability assays. In Assay Guidance Manual; Eli Lilly & Company and the National Center for Advancing Translational Sciences: Bethesda, MD, USA, 2016. [Google Scholar]
  46. Malek, S.N.A.; Shin, S.K.; Wahab, N.A.; Yaacob, H. Cytotoxic components of Pereskia bleo (Kunth) DC.(Cactaceae) leaves. Molecules 2009, 14, 1713–1724. [Google Scholar] [CrossRef]
  47. Lugli, E.; Roederer, M.; Cossarizza, A. Data analysis in flow cytometry: The future just started. Cytom. Part A 2010, 77, 705–713. [Google Scholar] [CrossRef] [Green Version]
  48. Cottet-Rousselle, C.; Ronot, X.; Leverve, X.; Mayol, J.F. Cytometric assessment of mitochondria using fluorescent probes. Cytom. Part A 2011, 79, 405–425. [Google Scholar] [CrossRef]
  49. Han, Y.; Lo, Y.H. Imaging Cells in Flow Cytometer Using Spatial-Temporal Transformation. Sci. Rep. 2015, 5, 13267. [Google Scholar] [CrossRef] [Green Version]
  50. Yoshino, N.; Ami, Y.; Terao, K.; Tashiro, F.; Honda, M. Upgrading of flow cytometric analysis for absolute counts, cytokines and other antigenic molecules of cynomolgus monkeys (Macaca fascicularis) by using anti-human cross-reactive antibodies. Exp. Anim. 2000, 49, 97–110. [Google Scholar] [CrossRef] [Green Version]
  51. Van Engeland, M.; Nieland, L.J.W.; Ramaekers, F.C.S.; Schutte, B.; Reutelingsperger, C.P.M. Annexin V-affinity assay: A review on an apoptosis detection system based on phosphatidylserine exposure. Cytometry 1998, 31, 1–9. [Google Scholar] [CrossRef]
  52. Elmore, S. Apoptosis: A Review of Programmed Cell Death. Toxicol. Pathol. 2007, 35, 495–516. [Google Scholar] [CrossRef]
  53. Rieger, A.M.; Nelson, K.L.; Konowalchuk, J.D.; Barreda, D.R. Modified Annexin V/Propidium Iodide Apoptosis Assay for Accurate Assessment of Cell Death. J. Vis. Exp. 2011, JoVE, 2597. [Google Scholar] [CrossRef] [PubMed]
  54. IBM. IBM SPSS Statistics for Windows, Version 27; IBM Corp.: Armonk, NY, USA, 2020; Available online: http://www-01.ibm.com/support/docview.wss?uid=swg27049428 (accessed on 12 August 2020).
  55. Dean, A.; Sullivan, K.; Soe, M. OpenEpi: Open-Source Epidemiologic Statistics for Public Health. 2013. Available online: https://www.OpenEpi.com (accessed on 6 April 2013).
  56. Petrie, A.; Sabin, C. Medical Statistics at a Glance, 3rd ed.; Wiley-Blackwell: Hoboken, NJ, USA, 2009; Volume 23. [Google Scholar] [CrossRef]
  57. Geary, W.J. The Use of Conductivity Measurements in Organic Solvents for the Characterisation of Coordination Compounds. Coord. Chem. Rev. 1971, 7, 81–122. [Google Scholar] [CrossRef]
  58. Nakamoto, K. Infrared and Raman Spectra of Inorganic and Coordination Compounds, 4th ed.; Wiley: New York, NY, USA, 1986. [Google Scholar]
  59. Deacon, G.B.; Philips, R.J. Relationships between the carbon-oxygen stretching frequencies of carboxylato complexes and the type of carboxylate coordination. Coord. Chem. Rev. 1980, 33, 227–250. [Google Scholar] [CrossRef]
  60. Sertçelik, M.; Özbek, F.E.; Taslimi, P.; Durman, M.; Özdemir, M.; Yalçın, B.; Necefoğlu, H.; Hökelek, T. Synthesis, spectroscopic characterization, crystal structure, density functional theory studies and biological properties of coordination complex Ni(II) 2-fluorobenzoate with 3-hydroxypyridine. Appl. Organomet. Chem. 2020, 34, 9. [Google Scholar] [CrossRef]
  61. Figgis, B.N. Introduction to Ligand Fields; Interscience Publishers: Geneva, Switzerland, 1966. [Google Scholar]
  62. Ullah, R.; Jo, M.H.; Riaz, M.; Alam, S.I.; Saeed, K.; Ali, W.; Rehman, I.U.; Ikram, M.; Kim, M.O. Glycine, the smallest amino acid, confers neuroprotection against D-galactose-induced neurodegeneration and memory impairment by regulating c-Jun N-terminal kinase in the mouse brain. J. Neuroinflamm. 2020, 17, 303. [Google Scholar] [CrossRef] [PubMed]
  63. Ali, T.; Badshah, H.; Kim, T.H.; Kim, M.O. Melatonin attenuates D-galactose induced memory impairment, neuroinflammation and neurodegeneration via RAGE/NF-K B/JNK signaling pathway in aging mouse model. J. Pineal Res. 2015, 58, 71–85. [Google Scholar] [CrossRef]
  64. Thazin, S.; Wasana, P.; Nipon, C.; Siriporn, C.C. Role of D-galactose-induced brain aging and its potential used for therapeutic interventions. Exp. Gerontol. 2018, 101, 13–36. [Google Scholar]
  65. Acosta, P.B.; Gross, K.C. Hidden sources of galactose in the environment. Eur. J. Pediatr. 1995, 154, S87–S92. [Google Scholar] [CrossRef]
  66. Boespflug, E.L.; Eliassen, J.C.; Dudley, J.A.; Shidler, M.D.; Kalt, W.; Summer, S.S.; Stein, A.L.; Stover, A.N.; Krikorian, R. Enhanced neural activation with blueberry supplementation in mild cognitive impairment. Nutr. Neurosci. 2017, 21, 297–305. [Google Scholar] [CrossRef]
  67. Coelho, A.I.; Berry, G.T.; Rubio-Gozalbo, M.E. Galactose metabolism and health. Curr. Opin. Clin. Nutr. Metab. Care 2015, 18, 422–427. [Google Scholar] [CrossRef] [PubMed]
  68. Cura, A.J.; Carruthers, A. Role of monosaccharide transport proteins in carbohydrate assimilation, distribution, metabolism, and homeostasis. Compr. Physiol. 2012, 2, 863–914. [Google Scholar] [PubMed] [Green Version]
  69. Berry, G.T. Classic galactosemia and clinical variant galactosemia. In GeneReviews®; Pagon, R.A., Adam, M.P., Ardinger, H.H., Wallace, S.E., Amemiya, A., Bean, L.J.H., Bird, T.D., Ledbetter, N., Mefford, H.C., Smith, R.J.H., et al., Eds.; University of Washington: Seattle, WA, USA, 1993. [Google Scholar]
  70. Morava, E. Galactose supplementation in phosphoglucomutase-1 deficiency; review and outlook for a novel treatable CDG. Mol. Genet. Metab. 2014, 112, 275–279. [Google Scholar] [CrossRef] [PubMed] [Green Version]
  71. Aydın, A.F.; Çoban, J.; Doğan-Ekici, I.; Betül-Kalaz, E.; Doğru-Abbasoğlu, S.; Uysal, M. Carnosine and taurine treatments diminished brain oxidative stress and apoptosis in D-galactose aging model. Metab. Brain Dis. 2016, 31, 337–345. [Google Scholar] [CrossRef]
  72. Rehman, S.U.; Shah, S.A.; Ali, T.; Chung, J.I.; Kim, M.O. Anthocyanins Reversed D-Galactose-Induced Oxidative Stress and Neuroinflammation Mediated Cognitive Impairment in Adult Rats. Mol. Neurobiol. 2017, 54, 255–271. [Google Scholar] [CrossRef]
  73. Jiang, Q.; Isquith, J.; Zipeto, M.A.; Diep, R.H.; Pham, J.; Santos, N.D.; Reynoso, E.; Chau, J.; Leu, H.; Lazzari, E.; et al. Hyper-Editing of Cell-Cycle Regulatory and Tumor Suppressor RNA Promotes Malignant Progenitor Propagation. Cancer Cell 2019, 35, 1–14. [Google Scholar] [CrossRef] [Green Version]
  74. Zhang, W.-W.; Sun, Q.-X.; Liu, Y.-H.; Gao, W.; Li, Y.-H.; Lu, K.; Wang, Z. Chronic administration of Liu Wei Dihuang protects rat’s brain against D-galactose-induced impairment of cholinergic system. Acta Physiol. Sin. 2011, 63, 245–255. [Google Scholar]
  75. Wu, W.; Wang, X.; Xiang, Q.; Meng, X.; Peng, Y.; Du, N.; Liu, Z.; Sun, Q.; Wang, C.; Liu, X. Astaxanthin alleviates brain aging in rats by attenuating oxidative stress and increasing BDNF levels. Food Funct. 2014, 5, 158–166. [Google Scholar] [CrossRef]
  76. Li, P.; Nijhawan, D.; Budihardjo, I.; Srinivasula, S.M.; Ahmad, M.; Alnemri, E.S.; Wang, X. Cytochrome c and dATP-dependent formation of Apaf-1/caspase-9 complex initiates an apoptotic protease cascade. Cell 1997, 91, 479–489. [Google Scholar] [CrossRef] [Green Version]
  77. Rehman, S.U.; Ahmad, A.; Yoon, G.-H.; Khan, M.; Abid, M.N.; Kim, M.O. Inhibition of c-Jun N-Terminal Kinase Protects Against Brain Damage and Improves Learning and Memory After Traumatic Brain Injury in Adult Mice. Cereb. Cortex 2018, 28, 2854–2872. [Google Scholar] [CrossRef] [PubMed]
  78. Wang, L.; Chen, Q.; Zhuang, S.; Wen, Y.; Cheng, W.; Zeng, Z.; Jiang, T.; Tang, C. Effect of Anoectochilus roxburghii flavonoids extract on H2O2—Induced oxidative stress in LO2 cells and D-gal induced aging mice model. J. Ethnopharmacol. 2020, 254, 112670. [Google Scholar] [CrossRef]
  79. Perruchot, M.; Gondret, F.; Robert, F.; Dupuis, E.; Quesnel, H.; Dessauge, F. Effect of the flavonoid baicalin on the proliferative capacity of bovine mammary cells and their ability to regulate oxidative stress. PeerJ 2019, 7, e6565. [Google Scholar] [CrossRef] [PubMed]
  80. Ma, J.; Wang, H.; Liu, B.; Shan, Y.; Zhou, H.; Qi, X.; Wu, W.; Jia, L. Combination of chick embryo and nutrient mixture prevent D-galactose-induced cognitive deficits, immune impairment and oxidative stress in aging rat model. Sci. Rep. 2019, 9, 4092. [Google Scholar] [CrossRef] [PubMed] [Green Version]
  81. Mede, T.; Jäger, M.; Schubert, U.S. “Chemistry-on-the-complex”: Functional Ru IIpolypyridyl-type sensitizers as divergent building blocks. Chem. Soc. Rev. 2018, 47, 7577–7627. [Google Scholar] [CrossRef] [PubMed]
  82. Lucio, G.C.; Garrick, J.M.; Roquè, P.J.; Pellacani, C. Mechanisms of Neuroprotection by Quercetin: Counteracting Oxidative Stress and More. Oxidative Med. Cell. Longev. 2016, 2016, 2986796. [Google Scholar]
  83. Sharma, V.; Mishra, M.; Ghosh, S.; Tewari, R.; Basu, A.; Seth, P.; Sen, E. Modulation of interleukin-1 mediated inflammatory response in human astrocytes by flavonoids: Implications in neuroprotection. Brain Res. Bull. 2007, 73, 55–63. [Google Scholar] [CrossRef] [PubMed]
  84. Klein, J.A.; Ackerman, S.L. Oxidative stress, cell cycle, and neurodegeneration. J. Clin. Investig. 2003, 111, 785–793. [Google Scholar] [CrossRef] [PubMed] [Green Version]
  85. Chen, L.; Sun, L.; Liu, Z.; Wang, H.; Xu, C. Protection afforded by quercetin against H2O2-induced apoptosis on PC12 cells via activating PI3K/Akt signal pathway. J. Recept. Signal Transduct. 2016, 36, 1–5. [Google Scholar] [CrossRef] [PubMed]
  86. Shin, E.J.; Jeong, J.H.; Bing, G.; Park, E.S.; Chae, J.S.; Yen, T.P.H.; Kim, W.K.; Wie, M.B.; Jung, B.D.; Kim, H.J.; et al. Kainate-induced mitochondrial oxidative stress contributes to hippocampal degeneration in senescence-accelerated mice. Cell Signal 2008, 20, 645–658. [Google Scholar] [CrossRef]
  87. Fu, Y.; Tang, M.; Bai, L.; Fan, Y. The role of apoptosis inducing factor in the apoptosis of retinal pigment epithelium cells induced by oxidative stress. Cell. Mol. Biol. 2016, 62, 36–41. [Google Scholar]
  88. Moreira, A.C.; Branco, A.F.; Sampaio, S.F.; Cunha-Oliveira, T.; Martins, T.R.; Holy, J.; Oliveira, P.J.; Sardão, V.A. Mitochondrial apoptosis-inducing factor is involved in doxorubicin induced toxicity on H9c2 cardiomyoblasts. Biochim. Biophys. Acta 2014, 1842, 2468–2478. [Google Scholar] [CrossRef] [Green Version]
  89. Hamza, R.Z.; EL-Megharbel, S.M.; Altalhi, T.; Gobouri, A.A.; Alrogi, A.A. Hypolipidemic and hepatoprotective synergistic effects of selenium nanoparticles and vitamin. E against acrylamide-induced hepatic alterations in male albino mice. Appl Organometal Chem. 2020, 34, e5458. [Google Scholar] [CrossRef]
  90. Refat, M.S.; Hamza, R.Z.; Adam, A.M.A.; Saad, H.A.; Gobouri, A.A.; Al-Harbi, F.S.; Al-Salmi, F.A.; Altalhi, T.; El-Meharbel, S.M. Quercetin/Zinc complex and stem cells: A new drug therapy to ameliorate glycometabolic control and pulmonary dysfunction in diabetes mellitus: Structural characterization and genetic studies. PLoS ONE 2021, 16, e0246265. [Google Scholar] [CrossRef]
  91. Hamza, R.Z.; Al-Baqami, N.M. Testicular protective effects of ellagic acid on monosodium glutamate-induced testicular structural alterations in male rats. Ultrastruct. Pathol. 2019, 43, 170–183. [Google Scholar] [CrossRef] [PubMed]
  92. Hamza, R.A.; Al-Eisa, R.A.; El-Shenawy, N.S. Efficacy of Mesenchymal Stem Cell and Vitamin D in the Treatment of Diabetes Mellitus Induced in a Rat Model: Pancreatic Tissues. Coatings 2021, 11, 317. [Google Scholar] [CrossRef]
  93. Pavanato, A.; Tuñón, M.J.; Sánchez-Campos, S.; Marroni, C.A.; Llesuy, S.; González-Gallego, J.; Marroni, N. Effects of quercetin onliver damage in rats with carbon tetrachloride-induced cirrhosis. Dig. Dis. Sci. 2003, 48, 824–829. [Google Scholar] [CrossRef]
  94. Ma, Q. Role of nrf2 in oxidative stress and toxicity. Annu. Rev. Pharmacol. Toxicol. 2013, 53, 401–426. [Google Scholar] [CrossRef] [Green Version]
  95. Saw, C.L.; Guo, Y.; Yang, A.Y.; Paredes-Gonzalez, X.; Ramirez, C.; Pung, D.; Kong, A.-N.T. The berry constituents quercetin, kaempferol, and pterostilbene synergistically attenuate reactive oxygen species: Involvement of the Nrf2-ARE signaling pathway. Food Chem. Toxicol. 2014, 72, 303–311. [Google Scholar] [CrossRef]
  96. Ramyaa, P.; Krishnaswamy, R.; Padma, V.V. Quercetin modulates OTA-induced oxidative stress and redox signalling in HepG2 cells—up regulation of Nrf2 expression and down regulation of NF-kappaB and COX-2. Biochim. Biophys. Acta 2014, 1840, 681–692. [Google Scholar] [CrossRef]
  97. Uddin, M.S.; al Mamun, A.; Takeda, S.; Sarwar, M.S.; Begum, M.M. Analyzing the chance of dementia amid geriatric people: A cross-sectional pilot study in Bangladesh. Psychogeriatrics 2019, 19, 87–94. [Google Scholar] [CrossRef]
  98. Van Dyck, C.H. Anti-amyloid-β monoclonal antibodies for Alzheimer’s disease: Pitfalls and promise. Biol. Psychiatry 2018, 83, 311–319. [Google Scholar] [CrossRef] [Green Version]
  99. Ghanemi, A. Alzheimer’s disease therapies: Selected advances and future perspectives. Alex. J. Med. 2015, 51, 1–3. [Google Scholar] [CrossRef] [Green Version]
  100. Banji, O.J.; Banji, D.; Ch, K. Curcumin and hesperidin improve cognition by suppressing mitochondrial dysfunction and apoptosis induced by D-galactose in rat brain. Food Chem. Toxicol. 2014, 74, 51–59. [Google Scholar] [CrossRef]
  101. Hsieh, H.M.; Wu, W.M.; Hu, M.L. Soy isoflavones attenuate oxidative stress and improve parameters related to aging and Alzheimer’s disease in C57BL/6J mice treated with D-galactose. Food Chem. Toxicol. 2009, 47, 625–632. [Google Scholar] [CrossRef]
  102. Golubev, A.; Hanson, A.D.; Gladyshev, V.N. Non-enzymatic molecular damage as a prototypic driver of aging. J. Biol. Chem. 2017, 292, 6029–6038. [Google Scholar] [CrossRef] [Green Version]
Figure 1. Suggested composition of RuIII/Q synthesized complex.
Crystals 11 00367 g001
Figure 2. Infrared spectra of (A) quercetin and (B) RuIII/Q complex.
Crystals 11 00367 g002
Figure 3. TGA and DrTGA curves of RuIII/Q complex.
Crystals 11 00367 g003
Figure 4. TEM image of RuIII/Q complex.
Crystals 11 00367 g004
Figure 5. In vitro drug release of the prepared RuIII/Q complex, in slightly basic phosphate buffer saline at 37 °C. Data are represented as mean ± SD (n = 3).
Crystals 11 00367 g005
Figure 6. The IC50 of RuIII/Q, Q, and DG in HepG2 cells aging.
Crystals 11 00367 g006
Figure 7. Representative flow cytometric histogram of cell cycle phases in HepG2 cells.
Crystals 11 00367 g007
Figure 8. Statistical analysis of genes expression of (mTOR, RALA, PI3K and c-MET) in control and treatment with Q, RuIII/Q, and DG of HepG2 cells using qRT-PCR.
Crystals 11 00367 g008
Figure 9. Effect of DG, Q and RuIII/Q alone or either combined on the quantitative expression of cyto-c, P53, Bax, BCl2, caspase-3 and caspase-9 in the brain tissue homogenates.
Crystals 11 00367 g009
Figure 10. Effect of DG, Q and RuIII/Q alone or either combined on glutamate, 4-hydroxynonenal and glutathione (GSH) levels.
Crystals 11 00367 g010
Figure 11. Effect of DG, Q and RuIII/Q alone or either combined on GPx, GRx, IL-6 and TNF-α levels.
Crystals 11 00367 g011
Figure 12. Semi-thin sections of the testicular tissues stained with toluidine blue stain. (A) Control normal appearance of testis tissues with normal spermatogenic stages and cells (Black arrow) with appearance of normal sperms (Green head arrow) (×400). (B) DG-treated rats showed highly degree of damage appeared by disintegration of testicular tissues (Orange arrow) with appearance of fewer sperm number (Green head arrow) (×400). (C) Q treated group showed normal appearance of testicular section with complete stages of spermatogenesis (Black arrow) with moderate number of sperms (Green head arrow) (×400). (D) RuIII/Q treated group showing normal healthy appearance of testicular tissues with normal spermatogenic tissues (Black arrow), with high number of mature sperms (×400). (E) DG + Q treated group showing partial restoration of testicular tissues with less spermatogenic arrest with moderate sized spermatogenic cells (Black arrow) and some appeared disintegrated parts with presence of myoid cells (green head arrow) (×400). (F) DG + RuIII/Q treated group showing high restoration of testicular tissues with complete spermatogenic cells (Black arrow) and restoration of sperm numbers (Green head arrow).
Crystals 11 00367 g012
Figure 13. Histopathological examination of the testicular tissues in (A) control groups of rat showing normal seminiferous tubules with mature complete spermatogenic cells (Black arrow) with plenty of sperms (***) (×400); (B1,B2,B3) cross section of rat testis treated with DG showing thinning of the basement membrane with severe edema (Green arrow) with few sperms (Orange arrow) and in B3, there was disintegration of spermatogenic cells with disappearance of sperms (Orange arrow) (×400); (C) Q treated group showing normal seminiferous tubules with organized germinal epithelium (Black arrow) with aggregations of sperms (***) (×400); (D) RuIII/Q treated group showing normal appearance of germinal cells (Black arrow) as well as seminiferous tubules lined by several layers of spermatogenic layers (Black arrow) up to sperm formation (***) surrounded by thin basement membrane (×400); (E) DG and Q treated animals showing restoration of normal composition of seminiferous tubules with mild sperm numbers (×400). (F1,F2,F3) DG and RuIII/Q treated animals showing great restoration of testicular normal appearance with moderate to high sperm numbers (***) with normal spermatogenic cells (Red arrow) and normal spermatogenic cells (Black star) (×400).
Crystals 11 00367 g013
Figure 14. Histopathologicalsections of the brain stained with hematoxylin and eosin (A) control groups showing normal neurons and glial cells (Black arrow) (×400); (B1,B2) DG treated group showing large area of hemorrhage with high congested area (Green arrow) and appearance of disorganized pyramidal cells (Red arrow) with small dark nuclei with granular cells showing apoptotic nuclei. (**) (×400); (C,D) Q and RuIII/Q treated groups showing normal appearance of brain tissues normal white matter, normal neurons and glial cells (Black arrow) (×400). (E) DG + Q treated group showing reduction in the area of congestion (**) with restoration of the normal neurons with mild swelling (Black arrow) (×400). (F) DG + RuIII/Q treated group showing restoration of normal neurons and fibers (Black arrow) with still some swelling in the glial cells (**) but without congestion or necrotic areas in cells the neural (×400).
Crystals 11 00367 g014
Figure 15. Semi thin sections of the brain tissues stained with toluidine blue stain. (A) Control, normal appearance of brain tissues with normal white matter (W) and neurons (N). (B) DG- treated rats showed highly necrotic zone (NZ) and enlarged swollen glial fibers (EG) with vacuoles (V) and some detached areas (Black star). (C) Q treated group showed normal appearance of brain tissues with normal white matters (W) and small glial fibers (*). (D) RuIII/Q treated animals showed normal appearance of brain tissues with normal white matters (W) and glial fibers (E). DG + Q group showed that the brain tissues had reduced necrotic zone (**) and normal moderate sized glial fibers (g). (F) DG + RuIII/Q group showed the brain tissues with nearly normal appearance and mostly normal glial fibers and some swelled glial fibers with almost normal neural fibers.
Crystals 11 00367 g015
Figure 16. Transmission electron microscope of testis section showing in (A) Control group: normal appearance of spermatogonia (1ry and 2ry) with normal rounded nuclei (Nu) with normalLeydig cells (L) and normal myoid cells and normal endoplasmic reticulum (ER) are also noticed. (5 µm). (B1,B2) TEM section of group treated with DG showing primary spermatocyte with irregular boundaries nucleus (Nu) with pyknotic nuclei with small sized mitochondria (M) and in (B2) there is distortion of the middle piece of the sperm with abnormal appearance (Green arrow) (5 µm). (C) TEM section of Q treated group showing normal appearance of completed stages of spermatogenesis with appearance of normal euchromatin nucleus (Nu) with normal interstitial cells (IC) with Leydig cells (L) (5 µm). (D1,D2) RuIII/Q treated group showing normal appearance of seminiferous tubules with normal appearance of nucleus (Nu) and normal sized mitochondria (M) with normal sized lipid droplets (LD) and normal myoid cell (Black star), (D2) showed normal sperm sheath (Orange arrow) with intact acrosomal cap (Red arrow) (5 µm). (E) TEM sections of DG + Q treated group showing restoration of nuclear boundaries (Nu) with incomplete spermatogenic layers with restoration of sperms (5 µm). (F1,F2) TEM section of DG treated with novel complex of RuIII/Q showing restoration of normal composition of seminiferous tubules with appearance of normal rounded nucleus (Nu) (Black star) with normal appearance of myoid cells with complete stages of spermatogenic cells (5 µm), (F2) showing normal sized sperm middle piece with complete tubules (Orange arrow) (2 µm).
Crystals 11 00367 g016
Figure 17. Electron micrographs of a section in the cerebral cortex of: (A) control group: normal appearance of white matter of the brain (W) and normal nucleus (Nu) with homogenous distribution of the chromatin, normal size for mitochondria (M), well defined neurons (N) and appearance of well-defined composition of Purkinje cells with well cytological compositions (PC)(Scale bar = 5 µm). (B) (DG) group: showing cytoplasm of nerve cell with irregular nuclei (N) with irregular condensed chromatin with irregular and discontinuous myelin sheath (curved arrow), condensed mitochondria with partial loss of their cristae (Green arrow) with enlarged spaced endoplasmic reticulum (rER) with markedly enlarged processes of astrocytes (Red ***) with karyolysed nuclei and apoptotic appearance with irregular boundaries and convolution of the nuclear envelop with disintegration of unclear chromatin (Yellow ***) with some unmylaniated neurons (Black arrow) (Scale bar = 5 µm). (C) (Q) group showing normal appearance of brain tissues with mylinated neurons (Orange arrows), with normal regular boundaries nucleus (Nu) with normal endoplasmic reticulum (ER) and moderate sized mitochondria (M) (Scale bar = 5 µm). (D) (RuIII/Q) group showing normal appearance of brain tissues with mylinated neurons (Orange arrows), with normal regular boundaries nucleus (Nu) with normal endoplasmic reticulum (ER) and moderate sized mitochondria (M) (Scale bar = 5µm). (E) (DG + Q) treated group showing restoration regular boundaries of the nucleus (Nu) with restoration of most of the mylinated neurons (Orange arrow) with still some swelling areas (Scale bar = 5 µm). (F) (DG + RuIII/Q) treated group showing high restoration of the normal appearance of neural cells that Q alone, with complete round regular nuclear boundaries (Nu), with normal sized mitochondria (M) and normal sized neurons (Scale bar = 5 µm).
Crystals 11 00367 g017
Figure 18. The fluorescent detection of mitochondrial membrane potential showed high improvement on the brain tissues treated groups (A,C,D,F) treated groups either control, RuIII/Q and DG combined with RuIII/Q showing non-accumulation of ROS in mitochondrial (50.0 µm). (B) DG treated group showing high accumulation of reactive oxygen species in the mitochondria as known that ROS accumulation is a hallmark of oxidative cell death (50.0 µm). (E,F) treated groups with DG in combination with either Q and/or RuIII/Q showing high amelioration in mitochondrial potential with very low reactive oxygen species accumulation (50.0 µm).
Crystals 11 00367 g018
Figure 19. Mitochondrial membrane potential in different treated group with DG, Q and/or RuIII/Q.
Crystals 11 00367 g019
Table 1. Primers used for qRT-PCR. Sequences given in the 5′-3′ direction.
GeneForwardReverse
P535′-GTATTTGGATGACAGAAACACT-3′5′-GTTACACATGTAGTTGTAGTGG-3′
Bax5′-GAACTGGACAGTAACATGGAG-3′5′-TTTGCTGGCAAAGTAGAAAAG-3′
Bcl-25′-ATTGTGGCCTTCTTTGAGTT-3′5′-GTTCAGGTACTCAGTCATCC-3′
mTOR5′-TGAATTCAGCCAAGTTTAAGAG-3′5′-TTCAATGCTGCATTTGTGTC-3′
RALA5′-ATGAATTGGAACTGCAATGAAA-3′5′-TCAGGACCATGATAAATGTAGG-3′
PI3K5′-TCAGAGTTACTGTTTCAGAACA-3′5′-GTAACATTCGAAGATCAAGACC-3′
c-MET5′-CTGGTGTTGTCTCAATATCAAC-3′5′-ATATCAGAGTCCCCACTAGTTA-3′
Nrf25′-CAC ATT CCC AAA CAA GAT GC-3′5′-TCT TTT TCC AGCGAG GAG AT-3′
Table 2. Statistical analysis of genes expression of (mTOR, RALA, PI3K and c-MET) in control and treatment with Q, RuIII/Q, and DG of HepG2 cells using qRT-PCR.
mTORRALAPI3Kc-MET
Group 20.82 ± 0.060.88 ± 0.040.80 ± 0.042.31 ± 0.10
Group 30.54 ± 0.080.53 ± 0.020.55 ± 0.040.80 ± 0.04
Group 40.22 ± 0.040.15 ± 0.040.20 ± 0.050.30 ± 0.10
Group 50.52 ± 0.040.62 ± 0.120.60 ± 0.021.20 ± 0.02
Group 60.38 ± 0.060.40 ± 0.160.55 ± 0.020.79 ± 0.16
Post Hoc Power Analysis
Groups 2 vs. 3100%100%100%100%
Groups 2 vs. 4100%100%100%100%
Groups 2 vs. 5100%100%100%100%
Groups 2 vs. 6100%100%100%100%
Groups 3 vs. 4100%100%100%100%
Groups 3 vs. 513.7%81.7%99.1%100%
Groups 3 vs. 6100%87.8%1.1%3.6%
Groups 4 vs. 5100%100%100%100%
Groups 4 vs. 6100%100%100%100%
Groups 5 vs. 6100%98.9%100%100%
Data are presented as mean ± SD. Groups: Group 1: control group, Group 2: D-galactose, Group 3: Q, Group 4: RUIII/Q, Group 5: DG + Q, Group 6: DG + RuIII/Q.
Table 3. Oxidative stress biomarkers in testicular tissue homogenates.
CAT (U/g)SOD (U/g)GRx (U/g)MDA (U/g)GPx (U/g)
Group 15.0 ± 1.2010.4 ± 1.697.7 ±1.014.4 ±0.5214.5 ±1.69
Group 21.2 ± 0.024.0 ± 0.572.0 ± 0.6834.0 ± 4.363.6 ± 0.87
Group 34.7 ± 0.8510.0 ± 1.657.3 ± 1.024.0 ± 0.7814.0 ± 3.02
Group 45.3 ± 0.6311.4 ± 2.018.3 ± 1.063.7 ± 0.6515.4 ± 2.54
Group 53.3 ± 0.457.3 ± 0.985.4 ± 0.6918.4 ± 2.369.3 ± 1.02
Group 64.8 ± 0.879.3 ± 1.547.0 ± 1.5711.0 ± 1.9812.4 ± 1.98
Post Hoc Power Analysis
Groups 1 vs. 2100%100%100%100%100%
Groups 1 vs. 312.1%9.5%18.9%37.9%7.9%
Groups 1 vs. 413.5%31.5%35.5%90.3%20.7%
Groups 1 vs. 599.9%100%100%100%100%
Groups 1 vs. 67.3%46.230.6%100%87.8%
Groups 2 vs. 3100%100%100%100%100%
Groups 2 vs. 4100%100%100%100%100%
Groups 2 vs. 5100%100%100%100%100%
Groups 2 vs. 6100%100%100%100%100%
Groups 3 vs. 459.4%55.0%75.0%20.7%27.9%
Groups 3 vs. 599.9%99.9%100%100%100%
Groups 3 vs. 64.6%22.4%8.9%100%40.4%
Groups 4 vs. 5100%100%100%100%100%
Groups 4 vs. 643.8%89.5%75.7%100%95.0%
Groups 5 vs. 6100%98.9%95.1%100%100%
Data are presented as mean ± SD. Groups: Group 1: control group, Group 2: D-galactose, Group 3: Q, Group 4: RUIII/Q, Group 5: DG + Q, Group 6: DG + RuIII/Q.
Table 4. Oxidative stress biomarkers in the brain tissue homogenates.
CAT (U/g)SOD (U/g)GRx (U/g)MDA (U/g)GPx (U/g)
Group 14.7 ± 0.4712.6 ± 1.586.4 ± 1.697.3 ± 1.2517.0 ± 2.58
Group 21.2 ± 0.024.4 ± 1.351.4 ± 0.5350.3 ± 3.524.5 ± 0.69
Group 34.5 ± 0.8512.6 ± 2.366.0 ± 1.667.0 ± 1.5216.1 ± 2.01
Group 45.1 ± 0.6313.3 ± 2.986.4 ± 1.367.0 ± 1.0217.0 ± 2.65
Group 53.5 ± 0.457.7 ± 1.254.4 ± 0.6924.4 ± 2.659.3 ± 1.24
Group 64.01 ± 0.8710.7 ± 2.696.0 ± 0.6914.0 ± 2.2513.6 ± 2.58
Post hoc power analysis
Groups 1 vs. 2100%100%100%100%100%
Groups 1 vs. 312.2%1.1%9.5%8.4%18.6%
Groups 1 vs. 450.4%12.3%1.1%10.7%1.1%
Groups 1 vs. 5100%100%98.9%100%100%
Groups 1 vs. 677.1%65.5%13.3%100%95.0%
Groups 2 vs. 3100%100%100%100%100%
Groups 2 vs. 4100%100%100%100%100%
Groups 2 vs. 5100%100%100%100%100%
Groups 2 vs. 6100%100%100%100%100%
Groups 3 vs. 459.4%10.6%10.7%1.1%18.1%
Groups 3 vs. 598.1%100%93.2%100%100%
Groups 3 vs. 635.7%53.8%1.1%100%84.2%
Groups 4 vs. 5100%100%99.9%100%100%
Groups 4 vs. 697.8%71.2%17.3%100%94.5%
Groups 5 vs. 650.7%97.5%100%100%100%
Data are presented in mean ± SD. Groups: Group 1: control group, Group 2: D-galactose, Group 3: Q, Group 4: RUIII/Q, Group 5: DG + Q, Group 6: DG + RuIII/Q.
Publisher’s Note: MDPI stays neutral with regard to jurisdictional claims in published maps and institutional affiliations.

